Cleveland, ND Map & Demographics
Cleveland Map
Cleveland Overview
$30,423
PER CAPITA INCOME
$49,444
AVG FAMILY INCOME
$49,028
AVG HOUSEHOLD INCOME
17.8%
WAGE / INCOME GAP [ % ]
82.2¢/ $1
WAGE / INCOME GAP [ $ ]
0.29
INEQUALITY / GINI INDEX
119
TOTAL POPULATION
99
MALE POPULATION
20
FEMALE POPULATION
495.00
MALES / 100 FEMALES
20.20
FEMALES / 100 MALES
26.6
MEDIAN AGE
5.5
AVG FAMILY SIZE
3.4
AVG HOUSEHOLD SIZE
105
LABOR FORCE [ PEOPLE ]
90.5%
PERCENT IN LABOR FORCE
1.9%
UNEMPLOYMENT RATE
Cleveland Zip Codes
Cleveland Area Codes
Income in Cleveland
Income Overview in Cleveland
Per Capita Income in Cleveland is $30,423, while median incomes of families and households are $49,444 and $49,028 respectively.
| Characteristic | Number | Measure |
| Per Capita Income | 119 | $30,423 |
| Median Family Income | 18 | $49,444 |
| Mean Family Income | 18 | $72,011 |
| Median Household Income | 35 | $49,028 |
| Mean Household Income | 35 | $63,346 |
| Income Deficit | 18 | $0 |
| Wage / Income Gap (%) | 119 | 17.77% |
| Wage / Income Gap ($) | 119 | 82.23¢ per $1 |
| Gini / Inequality Index | 119 | 0.29 |
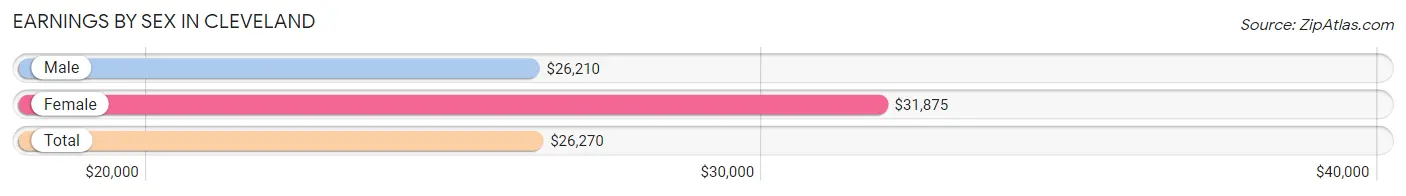
Earnings by Sex in Cleveland
Average Earnings in Cleveland are $26,270, $26,210 for men and $31,875 for women, a difference of 17.8%.
| Sex | Number | Average Earnings |
| Male | 93 (86.1%) | $26,210 |
| Female | 15 (13.9%) | $31,875 |
| Total | 108 (100.0%) | $26,270 |
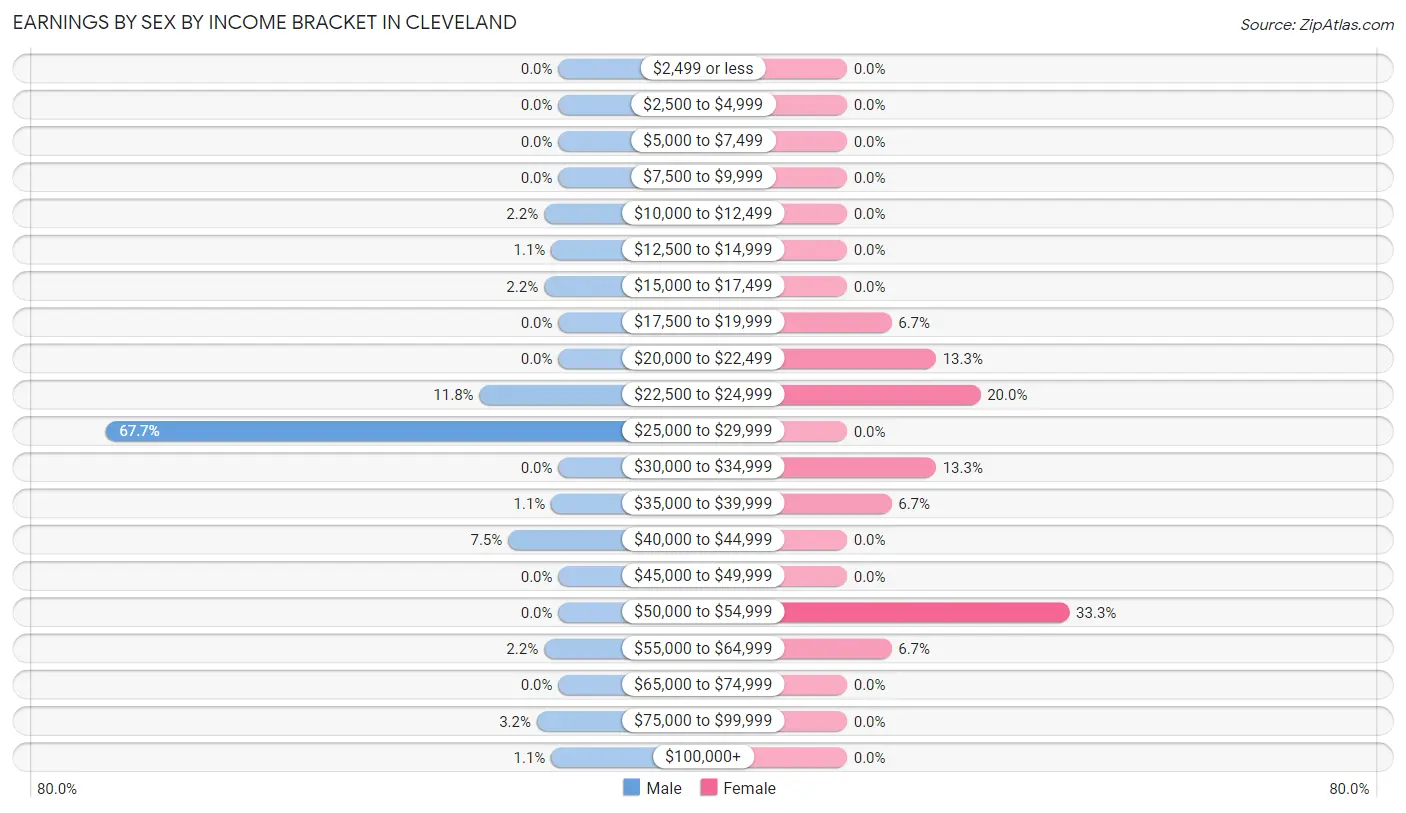
Earnings by Sex by Income Bracket in Cleveland
The most common earnings brackets in Cleveland are $25,000 to $29,999 for men (63 | 67.7%) and $50,000 to $54,999 for women (5 | 33.3%).
| Income | Male | Female |
| $2,499 or less | 0 (0.0%) | 0 (0.0%) |
| $2,500 to $4,999 | 0 (0.0%) | 0 (0.0%) |
| $5,000 to $7,499 | 0 (0.0%) | 0 (0.0%) |
| $7,500 to $9,999 | 0 (0.0%) | 0 (0.0%) |
| $10,000 to $12,499 | 2 (2.1%) | 0 (0.0%) |
| $12,500 to $14,999 | 1 (1.1%) | 0 (0.0%) |
| $15,000 to $17,499 | 2 (2.1%) | 0 (0.0%) |
| $17,500 to $19,999 | 0 (0.0%) | 1 (6.7%) |
| $20,000 to $22,499 | 0 (0.0%) | 2 (13.3%) |
| $22,500 to $24,999 | 11 (11.8%) | 3 (20.0%) |
| $25,000 to $29,999 | 63 (67.7%) | 0 (0.0%) |
| $30,000 to $34,999 | 0 (0.0%) | 2 (13.3%) |
| $35,000 to $39,999 | 1 (1.1%) | 1 (6.7%) |
| $40,000 to $44,999 | 7 (7.5%) | 0 (0.0%) |
| $45,000 to $49,999 | 0 (0.0%) | 0 (0.0%) |
| $50,000 to $54,999 | 0 (0.0%) | 5 (33.3%) |
| $55,000 to $64,999 | 2 (2.1%) | 1 (6.7%) |
| $65,000 to $74,999 | 0 (0.0%) | 0 (0.0%) |
| $75,000 to $99,999 | 3 (3.2%) | 0 (0.0%) |
| $100,000+ | 1 (1.1%) | 0 (0.0%) |
| Total | 93 (100.0%) | 15 (100.0%) |
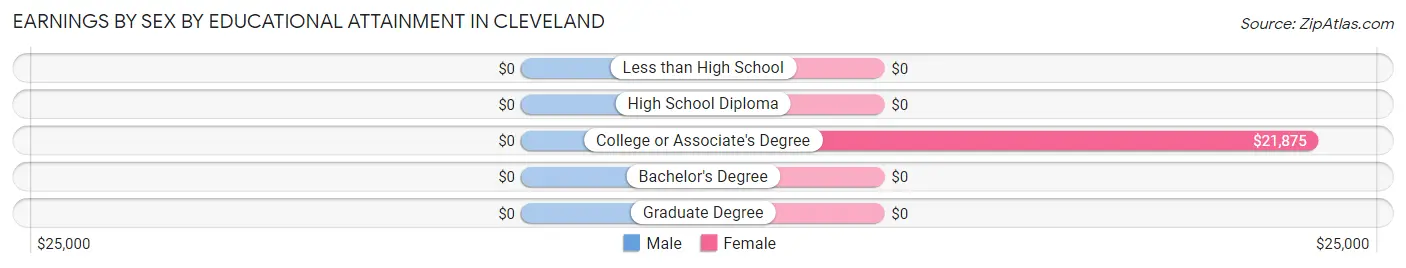
Earnings by Sex by Educational Attainment in Cleveland
| Educational Attainment | Male Income | Female Income |
| Less than High School | - | - |
| High School Diploma | - | - |
| College or Associate's Degree | - | - |
| Bachelor's Degree | - | - |
| Graduate Degree | - | - |
| Total | $26,111 | $0 |
Family Income in Cleveland
Family Income Brackets in Cleveland
According to the Cleveland family income data, there are 10 families falling into the $35,000 to $49,999 income range, which is the most common income bracket and makes up 55.6% of all families.
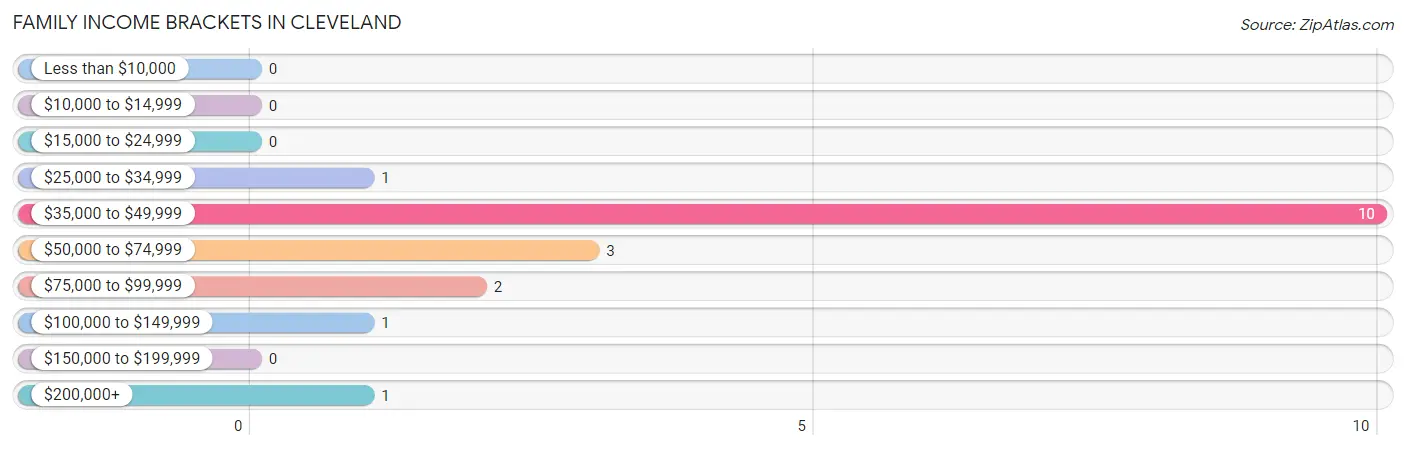
| Income Bracket | # Families | % Families |
| Less than $10,000 | 0 | 0.0% |
| $10,000 to $14,999 | 0 | 0.0% |
| $15,000 to $24,999 | 0 | 0.0% |
| $25,000 to $34,999 | 1 | 5.6% |
| $35,000 to $49,999 | 10 | 55.6% |
| $50,000 to $74,999 | 3 | 16.7% |
| $75,000 to $99,999 | 2 | 11.1% |
| $100,000 to $149,999 | 1 | 5.6% |
| $150,000 to $199,999 | 0 | 0.0% |
| $200,000+ | 1 | 5.6% |
Family Income by Famaliy Size in Cleveland
2-person families (14 | 77.8%) account for the highest median family income in Cleveland with $48,889 per family, while 2-person families (14 | 77.8%) have the highest median income of $24,444 per family member.
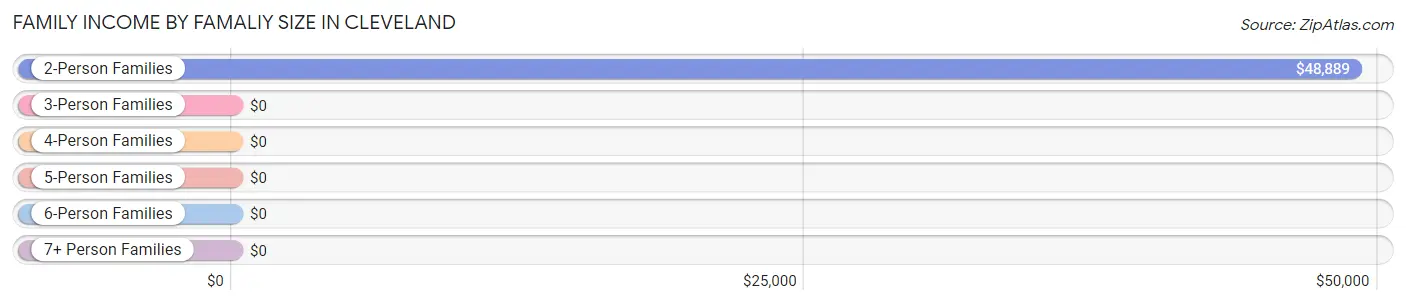
| Income Bracket | # Families | Median Income |
| 2-Person Families | 14 (77.8%) | $48,889 |
| 3-Person Families | 2 (11.1%) | $0 |
| 4-Person Families | 1 (5.6%) | $0 |
| 5-Person Families | 1 (5.6%) | $0 |
| 6-Person Families | 0 (0.0%) | $0 |
| 7+ Person Families | 0 (0.0%) | $0 |
| Total | 18 (100.0%) | $49,444 |
Family Income by Number of Earners in Cleveland
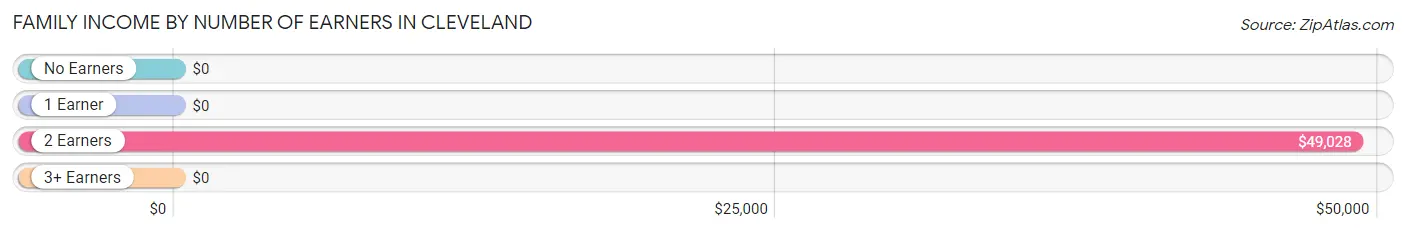
| Number of Earners | # Families | Median Income |
| No Earners | 3 (16.7%) | $0 |
| 1 Earner | 0 (0.0%) | $0 |
| 2 Earners | 13 (72.2%) | $49,028 |
| 3+ Earners | 2 (11.1%) | $0 |
| Total | 18 (100.0%) | $49,444 |
Household Income in Cleveland
Household Income Brackets in Cleveland
With 17 households falling in the category, the $35,000 to $49,999 income range is the most frequent in Cleveland, accounting for 48.6% of all households.
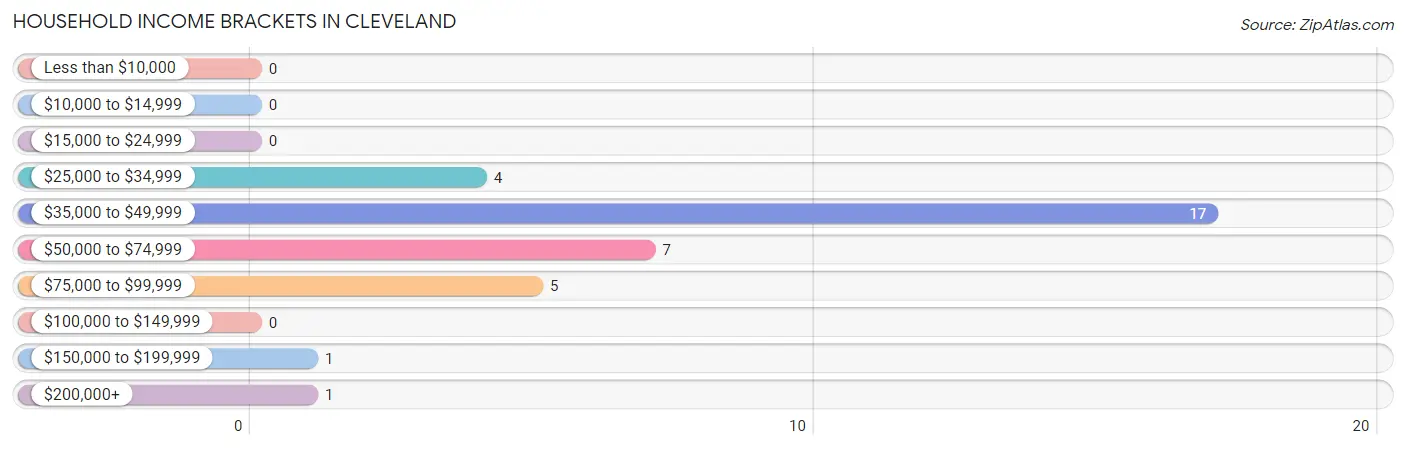
| Income Bracket | # Households | % Households |
| Less than $10,000 | 0 | 0.0% |
| $10,000 to $14,999 | 0 | 0.0% |
| $15,000 to $24,999 | 0 | 0.0% |
| $25,000 to $34,999 | 4 | 11.4% |
| $35,000 to $49,999 | 17 | 48.6% |
| $50,000 to $74,999 | 7 | 20.0% |
| $75,000 to $99,999 | 5 | 14.3% |
| $100,000 to $149,999 | 0 | 0.0% |
| $150,000 to $199,999 | 1 | 2.9% |
| $200,000+ | 1 | 2.9% |
Household Income by Householder Age in Cleveland
The median household income in Cleveland is $49,028, with the highest median household income of $54,688 found in the 45 to 64 years age bracket for the primary householder. A total of 13 households (37.1%) fall into this category. Meanwhile, the 15 to 24 years age bracket for the primary householder has the lowest median household income of $0, with 9 households (25.7%) in this group.
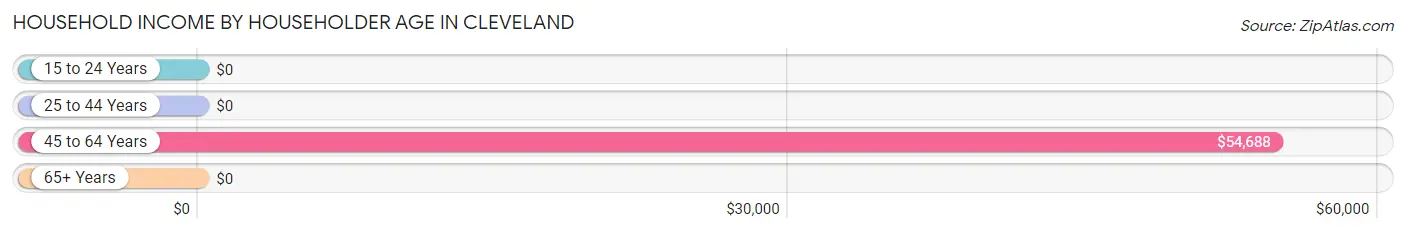
| Income Bracket | # Households | Median Income |
| 15 to 24 Years | 9 (25.7%) | $0 |
| 25 to 44 Years | 10 (28.6%) | $0 |
| 45 to 64 Years | 13 (37.1%) | $54,688 |
| 65+ Years | 3 (8.6%) | $0 |
| Total | 35 (100.0%) | $49,028 |
Poverty in Cleveland
Income Below Poverty by Sex and Age in Cleveland
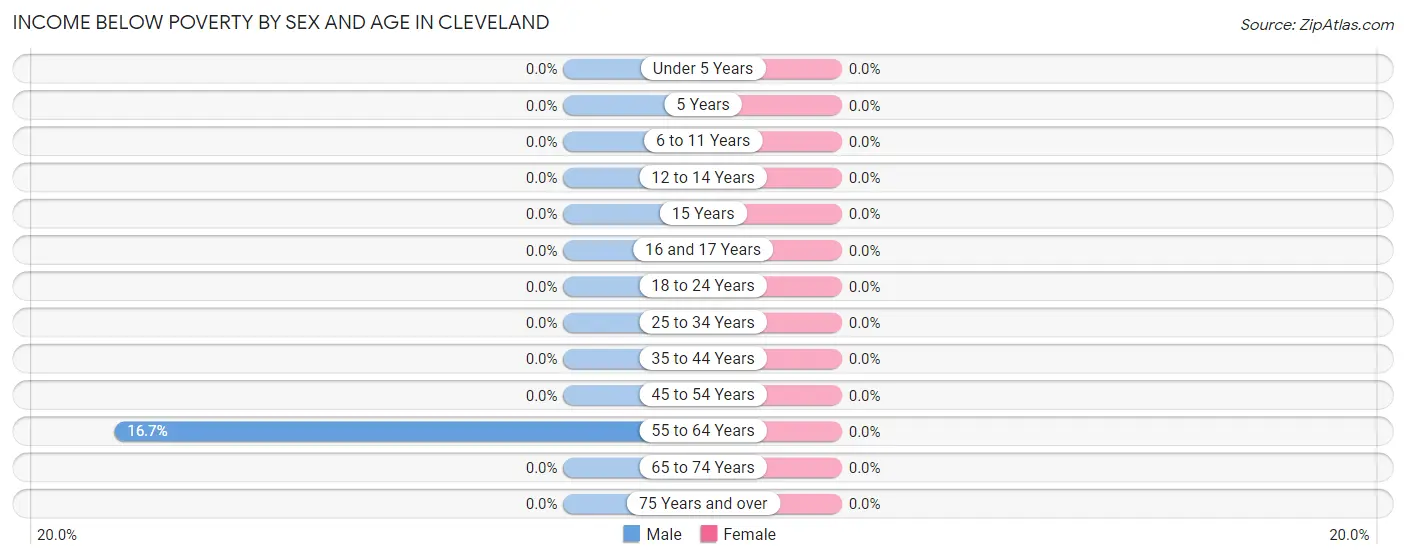
| Age Bracket | Male | Female |
| Under 5 Years | 0 (0.0%) | 0 (0.0%) |
| 5 Years | 0 (0.0%) | 0 (0.0%) |
| 6 to 11 Years | 0 (0.0%) | 0 (0.0%) |
| 12 to 14 Years | 0 (0.0%) | 0 (0.0%) |
| 15 Years | 0 (0.0%) | 0 (0.0%) |
| 16 and 17 Years | 0 (0.0%) | 0 (0.0%) |
| 18 to 24 Years | 0 (0.0%) | 0 (0.0%) |
| 25 to 34 Years | 0 (0.0%) | 0 (0.0%) |
| 35 to 44 Years | 0 (0.0%) | 0 (0.0%) |
| 45 to 54 Years | 0 (0.0%) | 0 (0.0%) |
| 55 to 64 Years | 1 (16.7%) | 0 (0.0%) |
| 65 to 74 Years | 0 (0.0%) | 0 (0.0%) |
| 75 Years and over | 0 (0.0%) | 0 (0.0%) |
| Total | 1 (1.0%) | 0 (0.0%) |
Income Above Poverty by Sex and Age in Cleveland
According to the poverty statistics in Cleveland, males aged 15 years and females aged 12 to 14 years are the age groups that are most secure financially, with 100.0% of males and 100.0% of females in these age groups living above the poverty line.
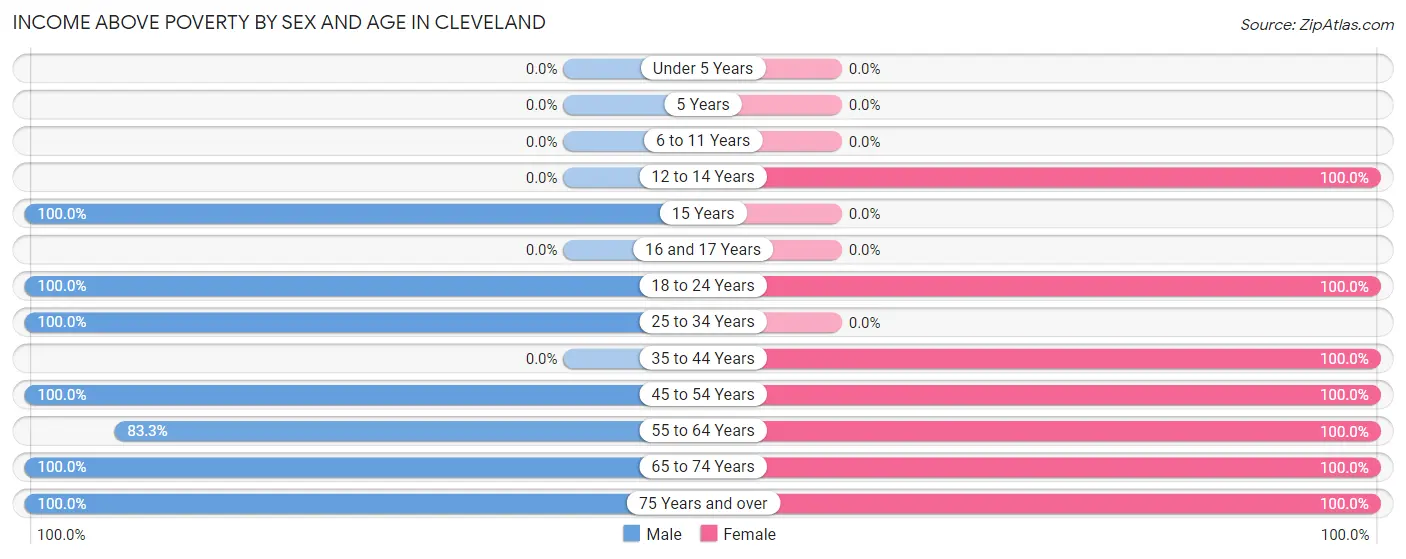
| Age Bracket | Male | Female |
| Under 5 Years | 0 (0.0%) | 0 (0.0%) |
| 5 Years | 0 (0.0%) | 0 (0.0%) |
| 6 to 11 Years | 0 (0.0%) | 0 (0.0%) |
| 12 to 14 Years | 0 (0.0%) | 1 (100.0%) |
| 15 Years | 2 (100.0%) | 0 (0.0%) |
| 16 and 17 Years | 0 (0.0%) | 0 (0.0%) |
| 18 to 24 Years | 13 (100.0%) | 4 (100.0%) |
| 25 to 34 Years | 73 (100.0%) | 0 (0.0%) |
| 35 to 44 Years | 0 (0.0%) | 1 (100.0%) |
| 45 to 54 Years | 2 (100.0%) | 4 (100.0%) |
| 55 to 64 Years | 5 (83.3%) | 6 (100.0%) |
| 65 to 74 Years | 1 (100.0%) | 3 (100.0%) |
| 75 Years and over | 2 (100.0%) | 1 (100.0%) |
| Total | 98 (99.0%) | 20 (100.0%) |
Income Below Poverty Among Married-Couple Families in Cleveland
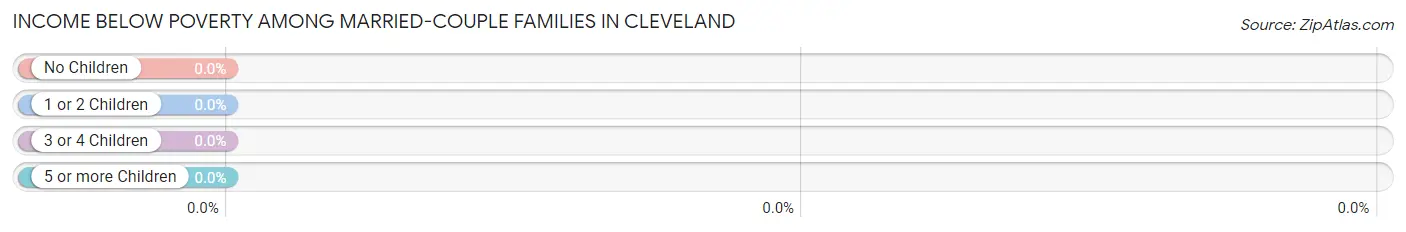
| Children | Above Poverty | Below Poverty |
| No Children | 6 (100.0%) | 0 (0.0%) |
| 1 or 2 Children | 2 (100.0%) | 0 (0.0%) |
| 3 or 4 Children | 0 (0.0%) | 0 (0.0%) |
| 5 or more Children | 0 (0.0%) | 0 (0.0%) |
| Total | 8 (100.0%) | 0 (0.0%) |
Income Below Poverty Among Single-Parent Households in Cleveland
| Children | Single Father | Single Mother |
| No Children | 0 (0.0%) | 0 (0.0%) |
| 1 or 2 Children | 0 (0.0%) | 0 (0.0%) |
| 3 or 4 Children | 0 (0.0%) | 0 (0.0%) |
| 5 or more Children | 0 (0.0%) | 0 (0.0%) |
| Total | 0 (0.0%) | 0 (0.0%) |
Income Below Poverty Among Married-Couple vs Single-Parent Households in Cleveland
| Children | Married-Couple Families | Single-Parent Households |
| No Children | 0 (0.0%) | 0 (0.0%) |
| 1 or 2 Children | 0 (0.0%) | 0 (0.0%) |
| 3 or 4 Children | 0 (0.0%) | 0 (0.0%) |
| 5 or more Children | 0 (0.0%) | 0 (0.0%) |
| Total | 0 (0.0%) | 0 (0.0%) |
Race in Cleveland
The most populous races in Cleveland are , and White / Caucasian (119 | 100.0%).
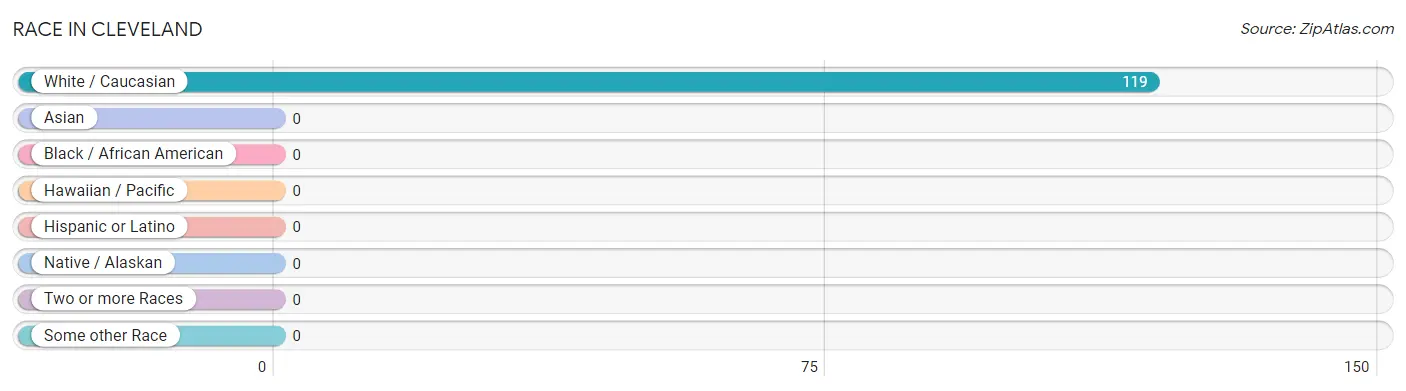
| Race | # Population | % Population |
| Asian | 0 | 0.0% |
| Black / African American | 0 | 0.0% |
| Hawaiian / Pacific | 0 | 0.0% |
| Hispanic or Latino | 0 | 0.0% |
| Native / Alaskan | 0 | 0.0% |
| White / Caucasian | 119 | 100.0% |
| Two or more Races | 0 | 0.0% |
| Some other Race | 0 | 0.0% |
| Total | 119 | 100.0% |
Ancestry in Cleveland
The most populous ancestries reported in Cleveland are German (108 | 90.8%), Norwegian (11 | 9.2%), Russian (9 | 7.6%), French (3 | 2.5%), and Italian (3 | 2.5%), together accounting for 112.6% of all Cleveland residents.
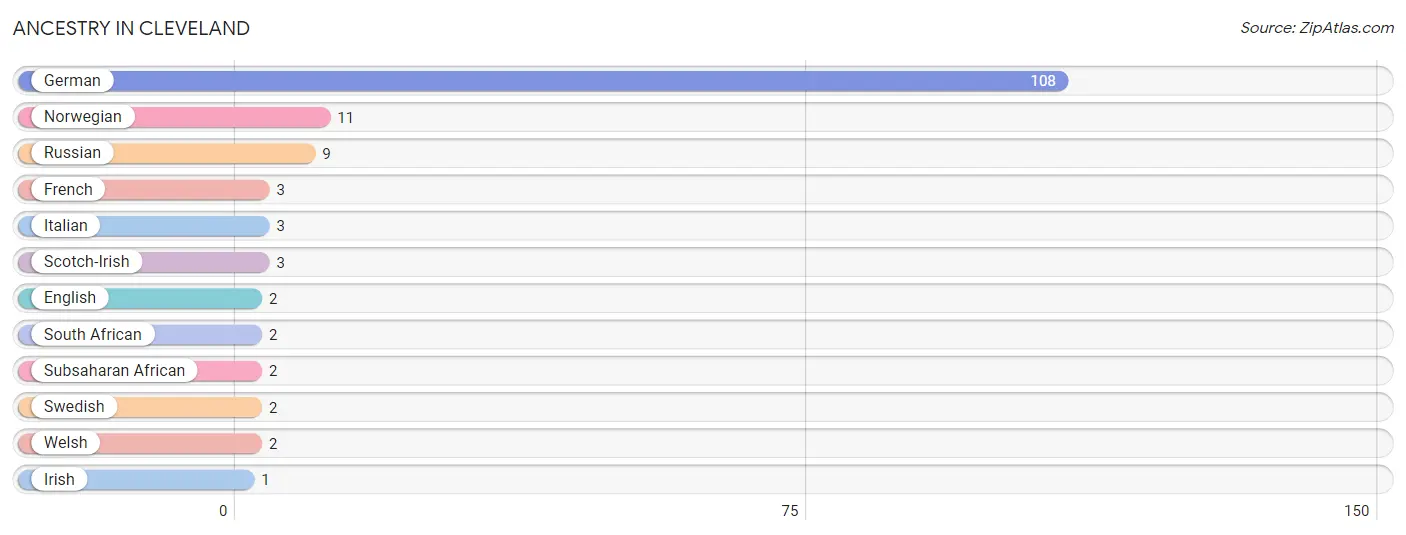
| Ancestry | # Population | % Population |
| English | 2 | 1.7% |
| French | 3 | 2.5% |
| German | 108 | 90.8% |
| Irish | 1 | 0.8% |
| Italian | 3 | 2.5% |
| Norwegian | 11 | 9.2% |
| Russian | 9 | 7.6% |
| Scotch-Irish | 3 | 2.5% |
| South African | 2 | 1.7% |
| Subsaharan African | 2 | 1.7% |
| Swedish | 2 | 1.7% |
| Welsh | 2 | 1.7% | View All 12 Rows |
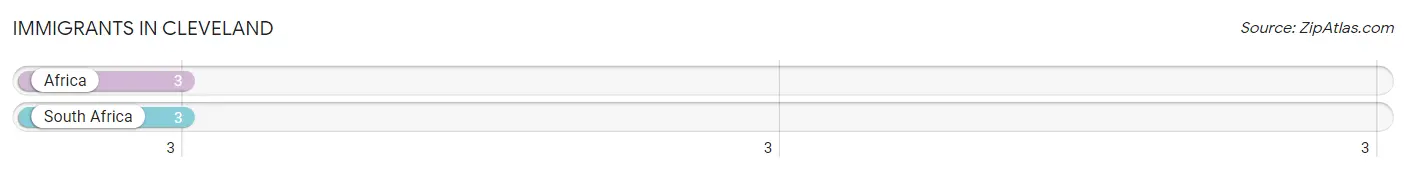
Immigrants in Cleveland
The most numerous immigrant groups reported in Cleveland came from Africa (3 | 2.5%), and South Africa (3 | 2.5%), together accounting for 5.0% of all Cleveland residents.
| Immigration Origin | # Population | % Population |
| Africa | 3 | 2.5% |
| South Africa | 3 | 2.5% | View All 2 Rows |
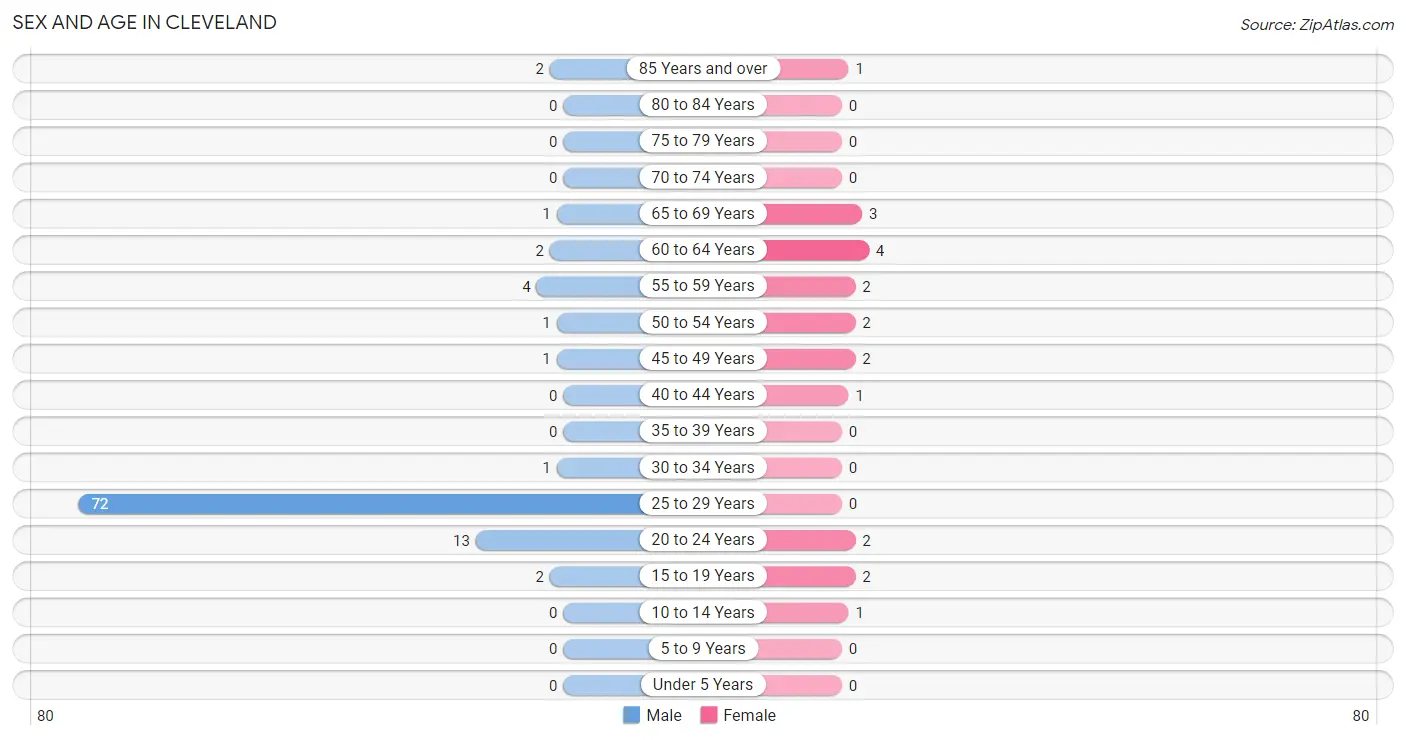
Sex and Age in Cleveland
Sex and Age in Cleveland
The most populous age groups in Cleveland are 25 to 29 Years (72 | 72.7%) for men and 60 to 64 Years (4 | 20.0%) for women.
| Age Bracket | Male | Female |
| Under 5 Years | 0 (0.0%) | 0 (0.0%) |
| 5 to 9 Years | 0 (0.0%) | 0 (0.0%) |
| 10 to 14 Years | 0 (0.0%) | 1 (5.0%) |
| 15 to 19 Years | 2 (2.0%) | 2 (10.0%) |
| 20 to 24 Years | 13 (13.1%) | 2 (10.0%) |
| 25 to 29 Years | 72 (72.7%) | 0 (0.0%) |
| 30 to 34 Years | 1 (1.0%) | 0 (0.0%) |
| 35 to 39 Years | 0 (0.0%) | 0 (0.0%) |
| 40 to 44 Years | 0 (0.0%) | 1 (5.0%) |
| 45 to 49 Years | 1 (1.0%) | 2 (10.0%) |
| 50 to 54 Years | 1 (1.0%) | 2 (10.0%) |
| 55 to 59 Years | 4 (4.0%) | 2 (10.0%) |
| 60 to 64 Years | 2 (2.0%) | 4 (20.0%) |
| 65 to 69 Years | 1 (1.0%) | 3 (15.0%) |
| 70 to 74 Years | 0 (0.0%) | 0 (0.0%) |
| 75 to 79 Years | 0 (0.0%) | 0 (0.0%) |
| 80 to 84 Years | 0 (0.0%) | 0 (0.0%) |
| 85 Years and over | 2 (2.0%) | 1 (5.0%) |
| Total | 99 (100.0%) | 20 (100.0%) |
Families and Households in Cleveland
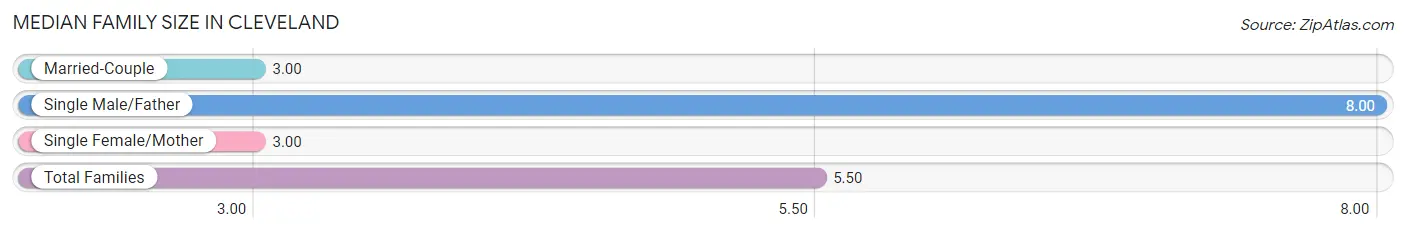
Median Family Size in Cleveland
The median family size in Cleveland is 5.50 persons per family, with single male/father families (9 | 50.0%) accounting for the largest median family size of 8 persons per family. On the other hand, married-couple families (8 | 44.4%) represent the smallest median family size with 3.00 persons per family.
| Family Type | # Families | Family Size |
| Married-Couple | 8 (44.4%) | 3.00 |
| Single Male/Father | 9 (50.0%) | 8.00 |
| Single Female/Mother | 1 (5.6%) | 3.00 |
| Total Families | 18 (100.0%) | 5.50 |
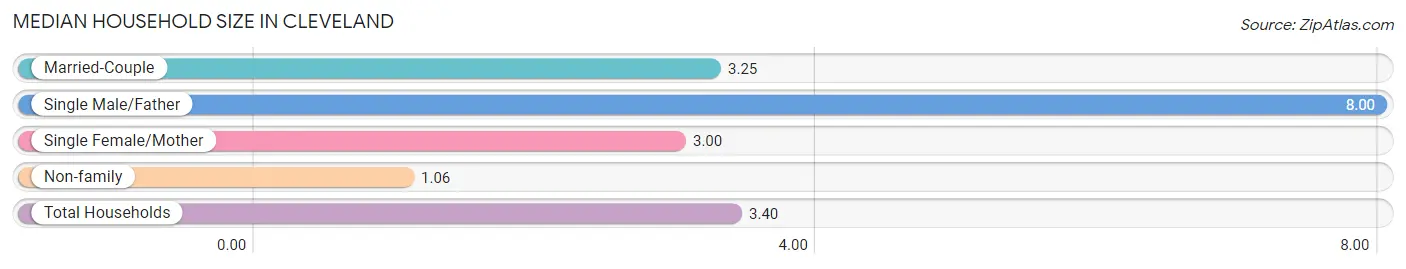
Median Household Size in Cleveland
The median household size in Cleveland is 3.40 persons per household, with single male/father households (9 | 25.7%) accounting for the largest median household size of 8 persons per household. non-family households (17 | 48.6%) represent the smallest median household size with 1.06 persons per household.
| Household Type | # Households | Household Size |
| Married-Couple | 8 (22.9%) | 3.25 |
| Single Male/Father | 9 (25.7%) | 8.00 |
| Single Female/Mother | 1 (2.9%) | 3.00 |
| Non-family | 17 (48.6%) | 1.06 |
| Total Households | 35 (100.0%) | 3.40 |
Household Size by Marriage Status in Cleveland
Out of a total of 35 households in Cleveland, 18 (51.4%) are family households, while 17 (48.6%) are nonfamily households. The most numerous type of family households are 2-person households, comprising 14, and the most common type of nonfamily households are 1-person households, comprising 16.
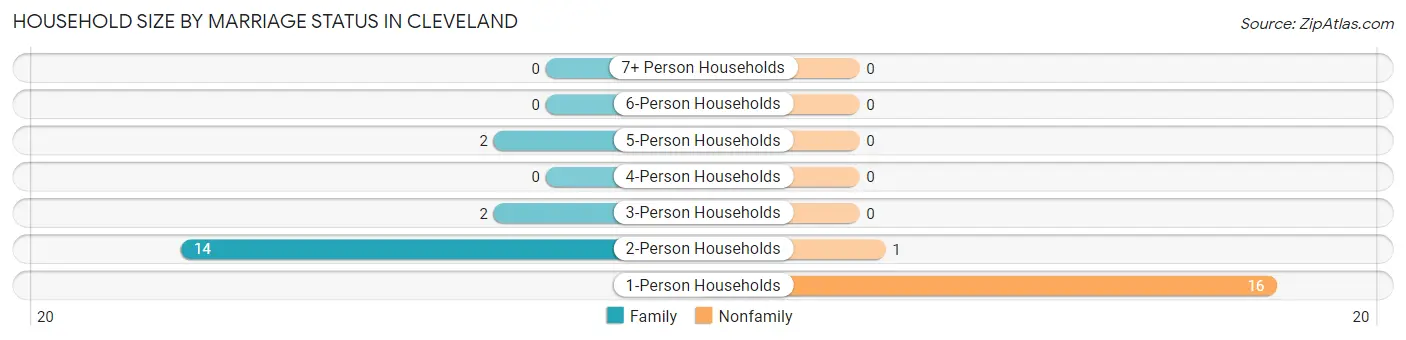
| Household Size | Family Households | Nonfamily Households |
| 1-Person Households | - | 16 (45.7%) |
| 2-Person Households | 14 (40.0%) | 1 (2.9%) |
| 3-Person Households | 2 (5.7%) | 0 (0.0%) |
| 4-Person Households | 0 (0.0%) | 0 (0.0%) |
| 5-Person Households | 2 (5.7%) | 0 (0.0%) |
| 6-Person Households | 0 (0.0%) | 0 (0.0%) |
| 7+ Person Households | 0 (0.0%) | 0 (0.0%) |
| Total | 18 (51.4%) | 17 (48.6%) |
Female Fertility in Cleveland
Fertility by Age in Cleveland
| Age Bracket | Women with Births | Births / 1,000 Women |
| 15 to 19 years | 0 (0.0%) | 0.0 |
| 20 to 34 years | 0 (0.0%) | 0.0 |
| 35 to 50 years | 0 (0.0%) | 0.0 |
| Total | 0 (0.0%) | 0.0 |
Fertility by Age by Marriage Status in Cleveland
| Age Bracket | Married | Unmarried |
| 15 to 19 years | 0 (0.0%) | 0 (0.0%) |
| 20 to 34 years | 0 (0.0%) | 0 (0.0%) |
| 35 to 50 years | 0 (0.0%) | 0 (0.0%) |
| Total | 0 (0.0%) | 0 (0.0%) |
Fertility by Education in Cleveland
| Educational Attainment | Women with Births | Births / 1,000 Women |
| Less than High School | 0 (0.0%) | 0.0 |
| High School Diploma | 0 (0.0%) | 0.0 |
| College or Associate's Degree | 0 (0.0%) | 0.0 |
| Bachelor's Degree | 0 (0.0%) | 0.0 |
| Graduate Degree | 0 (0.0%) | 0.0 |
| Total | 0 (0.0%) | 0.0 |
Fertility by Education by Marriage Status in Cleveland
| Educational Attainment | Married | Unmarried |
| Less than High School | 0 (0.0%) | 0 (0.0%) |
| High School Diploma | 0 (0.0%) | 0 (0.0%) |
| College or Associate's Degree | 0 (0.0%) | 0 (0.0%) |
| Bachelor's Degree | 0 (0.0%) | 0 (0.0%) |
| Graduate Degree | 0 (0.0%) | 0 (0.0%) |
| Total | 0 (0.0%) | 0 (0.0%) |
Employment Characteristics in Cleveland
Employment by Class of Employer in Cleveland
Among the 103 employed individuals in Cleveland, private company employees (97 | 94.2%), not-for-profit organizations (3 | 2.9%), and self-employed (not incorporated) (2 | 1.9%) make up the most common classes of employment.
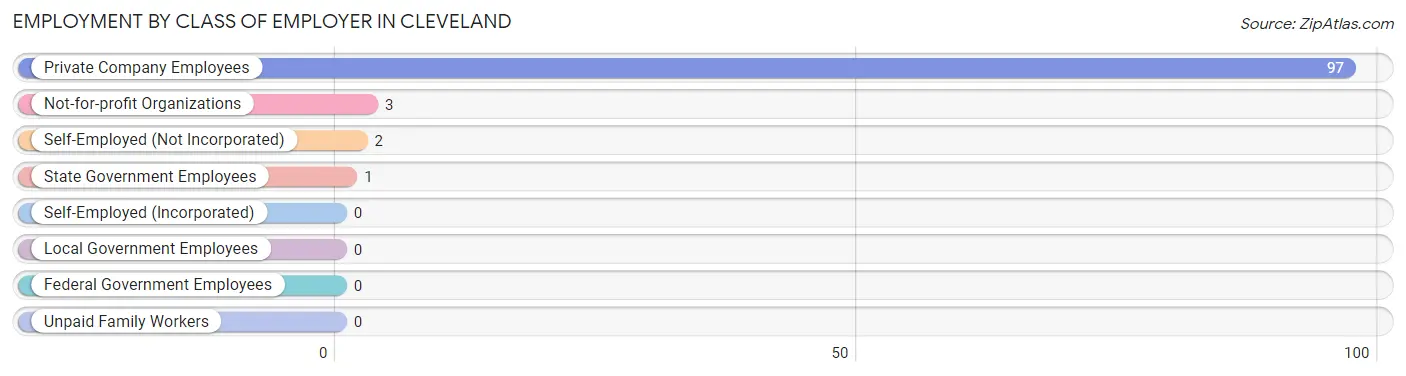
| Employer Class | # Employees | % Employees |
| Private Company Employees | 97 | 94.2% |
| Self-Employed (Incorporated) | 0 | 0.0% |
| Self-Employed (Not Incorporated) | 2 | 1.9% |
| Not-for-profit Organizations | 3 | 2.9% |
| Local Government Employees | 0 | 0.0% |
| State Government Employees | 1 | 1.0% |
| Federal Government Employees | 0 | 0.0% |
| Unpaid Family Workers | 0 | 0.0% |
| Total | 103 | 100.0% |
Employment Status by Age in Cleveland
According to the labor force statistics for Cleveland, out of the total population over 16 years of age (116), 90.5% or 105 individuals are in the labor force, with 1.9% or 2 of them unemployed. The age group with the highest labor force participation rate is 20 to 24 years, with 100.0% or 15 individuals in the labor force. Within the labor force, the 20 to 24 years age range has the highest percentage of unemployed individuals, with 13.3% or 2 of them being unemployed.
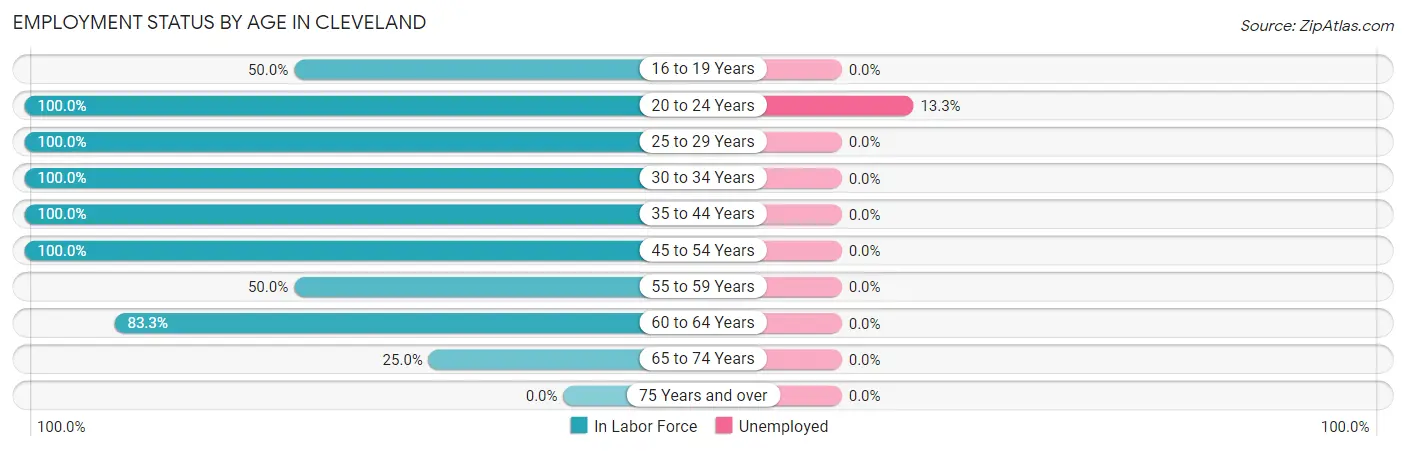
| Age Bracket | In Labor Force | Unemployed |
| 16 to 19 Years | 1 (50.0%) | 0 (0.0%) |
| 20 to 24 Years | 15 (100.0%) | 2 (13.3%) |
| 25 to 29 Years | 72 (100.0%) | 0 (0.0%) |
| 30 to 34 Years | 1 (100.0%) | 0 (0.0%) |
| 35 to 44 Years | 1 (100.0%) | 0 (0.0%) |
| 45 to 54 Years | 6 (100.0%) | 0 (0.0%) |
| 55 to 59 Years | 3 (50.0%) | 0 (0.0%) |
| 60 to 64 Years | 5 (83.3%) | 0 (0.0%) |
| 65 to 74 Years | 1 (25.0%) | 0 (0.0%) |
| 75 Years and over | 0 (0.0%) | 0 (0.0%) |
| Total | 105 (90.5%) | 2 (1.9%) |
Employment Status by Educational Attainment in Cleveland
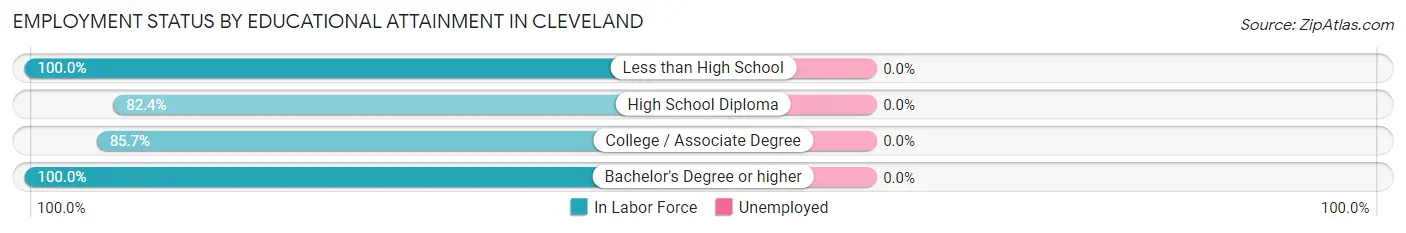
| Educational Attainment | In Labor Force | Unemployed |
| Less than High School | 1 (100.0%) | 0 (0.0%) |
| High School Diploma | 14 (82.4%) | 0 (0.0%) |
| College / Associate Degree | 6 (85.7%) | 0 (0.0%) |
| Bachelor's Degree or higher | 67 (100.0%) | 0 (0.0%) |
| Total | 88 (95.7%) | 0 (0.0%) |
Employment Occupations by Sex in Cleveland
Management, Business, Science and Arts Occupations
The most common Management, Business, Science and Arts occupations in Cleveland are Management (3 | 2.9%), and Health Diagnosing & Treating (1 | 1.0%).
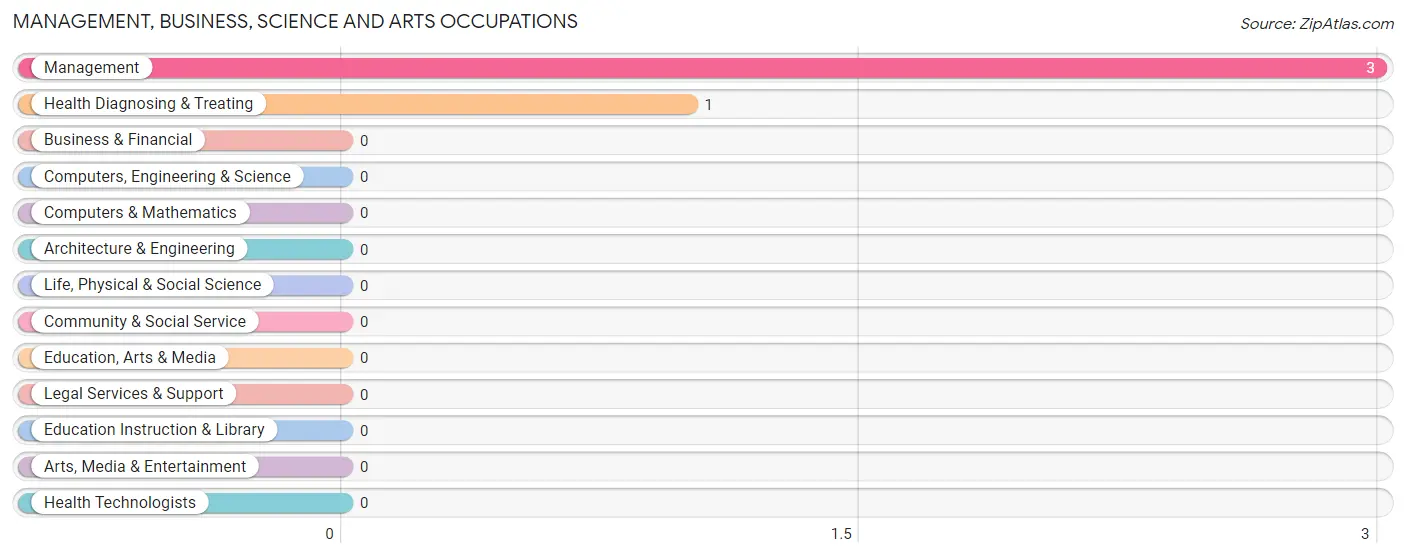
Management, Business, Science and Arts Occupations by Sex
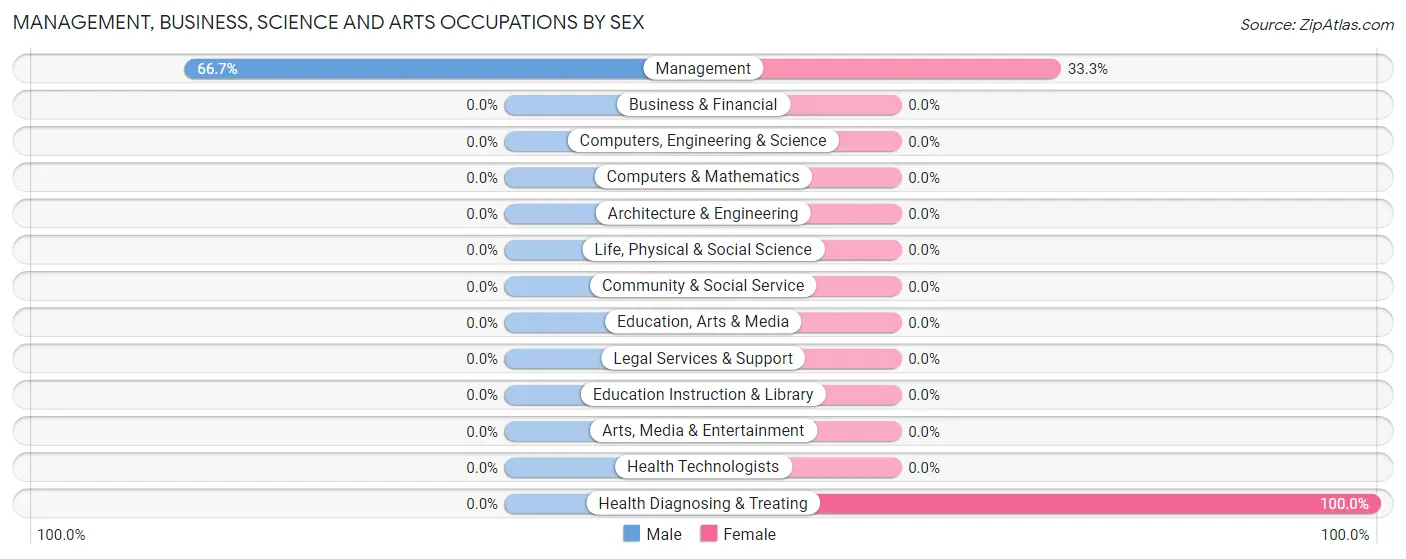
| Occupation | Male | Female |
| Management | 2 (66.7%) | 1 (33.3%) |
| Business & Financial | 0 (0.0%) | 0 (0.0%) |
| Computers, Engineering & Science | 0 (0.0%) | 0 (0.0%) |
| Computers & Mathematics | 0 (0.0%) | 0 (0.0%) |
| Architecture & Engineering | 0 (0.0%) | 0 (0.0%) |
| Life, Physical & Social Science | 0 (0.0%) | 0 (0.0%) |
| Community & Social Service | 0 (0.0%) | 0 (0.0%) |
| Education, Arts & Media | 0 (0.0%) | 0 (0.0%) |
| Legal Services & Support | 0 (0.0%) | 0 (0.0%) |
| Education Instruction & Library | 0 (0.0%) | 0 (0.0%) |
| Arts, Media & Entertainment | 0 (0.0%) | 0 (0.0%) |
| Health Diagnosing & Treating | 0 (0.0%) | 1 (100.0%) |
| Health Technologists | 0 (0.0%) | 0 (0.0%) |
| Total (Category) | 2 (50.0%) | 2 (50.0%) |
| Total (Overall) | 88 (85.4%) | 15 (14.6%) |
Services Occupations
The most common Services occupations in Cleveland are Personal Care & Service (2 | 1.9%), and Cleaning & Maintenance (1 | 1.0%).
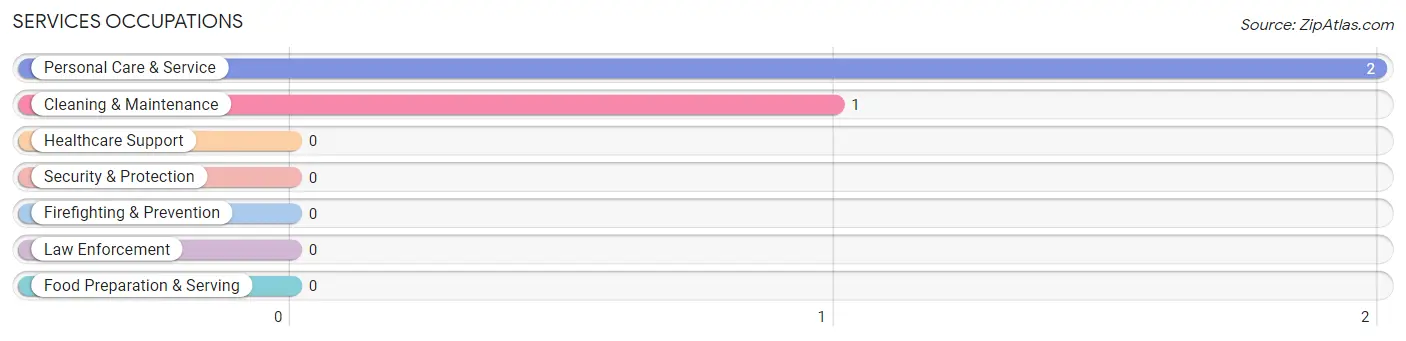
Services Occupations by Sex
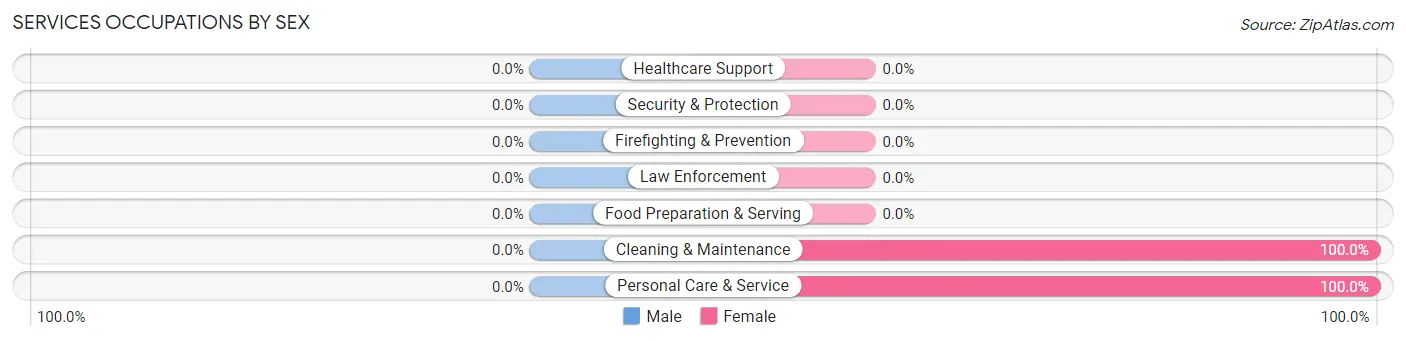
| Occupation | Male | Female |
| Healthcare Support | 0 (0.0%) | 0 (0.0%) |
| Security & Protection | 0 (0.0%) | 0 (0.0%) |
| Firefighting & Prevention | 0 (0.0%) | 0 (0.0%) |
| Law Enforcement | 0 (0.0%) | 0 (0.0%) |
| Food Preparation & Serving | 0 (0.0%) | 0 (0.0%) |
| Cleaning & Maintenance | 0 (0.0%) | 1 (100.0%) |
| Personal Care & Service | 0 (0.0%) | 2 (100.0%) |
| Total (Category) | 0 (0.0%) | 3 (100.0%) |
| Total (Overall) | 88 (85.4%) | 15 (14.6%) |
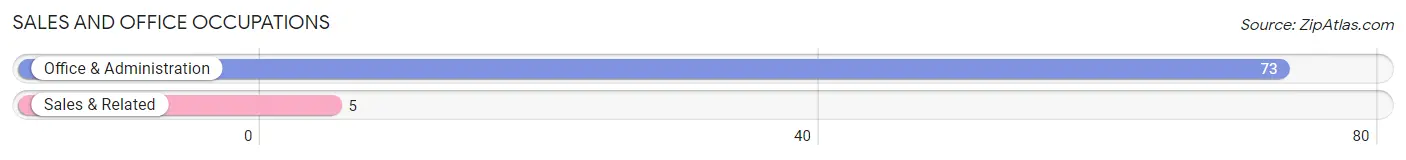
Sales and Office Occupations
The most common Sales and Office occupations in Cleveland are Office & Administration (73 | 70.9%), and Sales & Related (5 | 4.9%).
Sales and Office Occupations by Sex
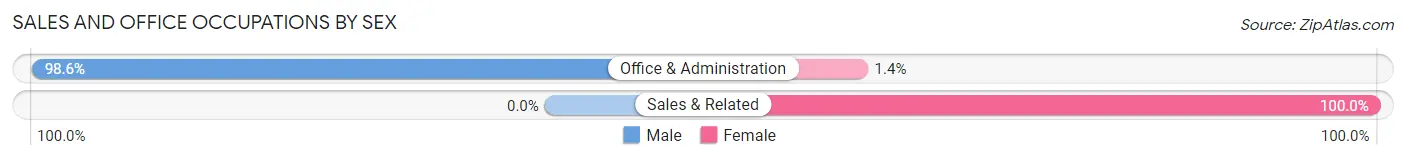
| Occupation | Male | Female |
| Sales & Related | 0 (0.0%) | 5 (100.0%) |
| Office & Administration | 72 (98.6%) | 1 (1.4%) |
| Total (Category) | 72 (92.3%) | 6 (7.7%) |
| Total (Overall) | 88 (85.4%) | 15 (14.6%) |
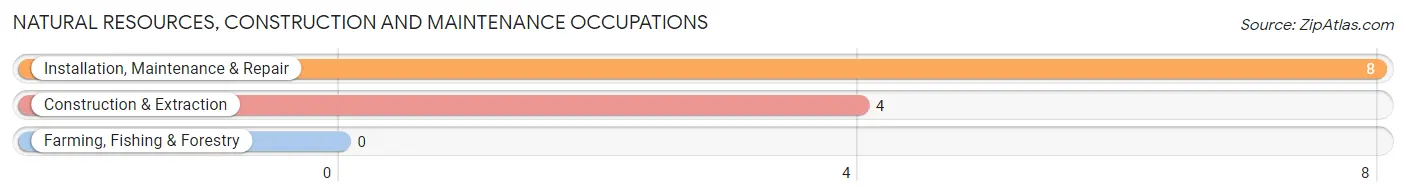
Natural Resources, Construction and Maintenance Occupations
The most common Natural Resources, Construction and Maintenance occupations in Cleveland are Installation, Maintenance & Repair (8 | 7.8%), and Construction & Extraction (4 | 3.9%).
Natural Resources, Construction and Maintenance Occupations by Sex
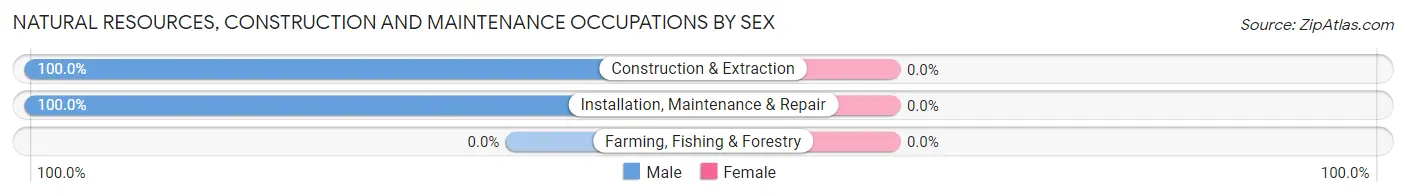
| Occupation | Male | Female |
| Farming, Fishing & Forestry | 0 (0.0%) | 0 (0.0%) |
| Construction & Extraction | 4 (100.0%) | 0 (0.0%) |
| Installation, Maintenance & Repair | 8 (100.0%) | 0 (0.0%) |
| Total (Category) | 12 (100.0%) | 0 (0.0%) |
| Total (Overall) | 88 (85.4%) | 15 (14.6%) |
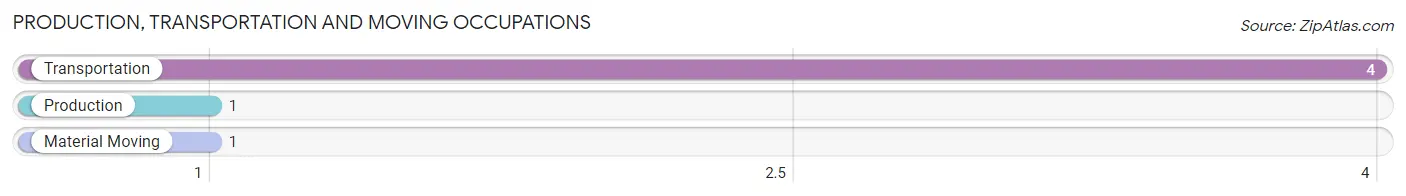
Production, Transportation and Moving Occupations
The most common Production, Transportation and Moving occupations in Cleveland are Transportation (4 | 3.9%), Production (1 | 1.0%), and Material Moving (1 | 1.0%).
Production, Transportation and Moving Occupations by Sex
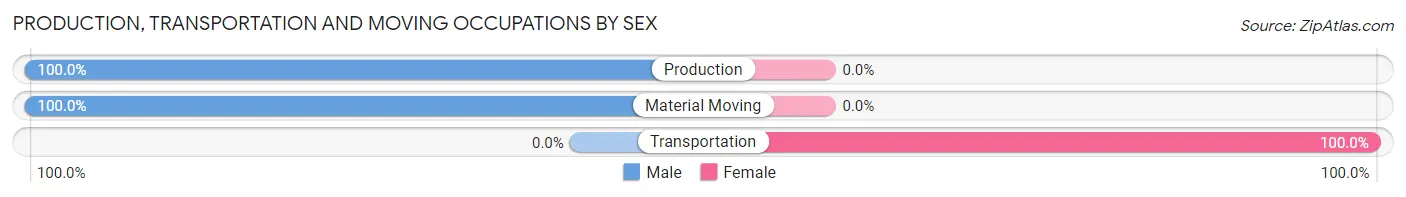
| Occupation | Male | Female |
| Production | 1 (100.0%) | 0 (0.0%) |
| Transportation | 0 (0.0%) | 4 (100.0%) |
| Material Moving | 1 (100.0%) | 0 (0.0%) |
| Total (Category) | 2 (33.3%) | 4 (66.7%) |
| Total (Overall) | 88 (85.4%) | 15 (14.6%) |
Employment Industries by Sex in Cleveland
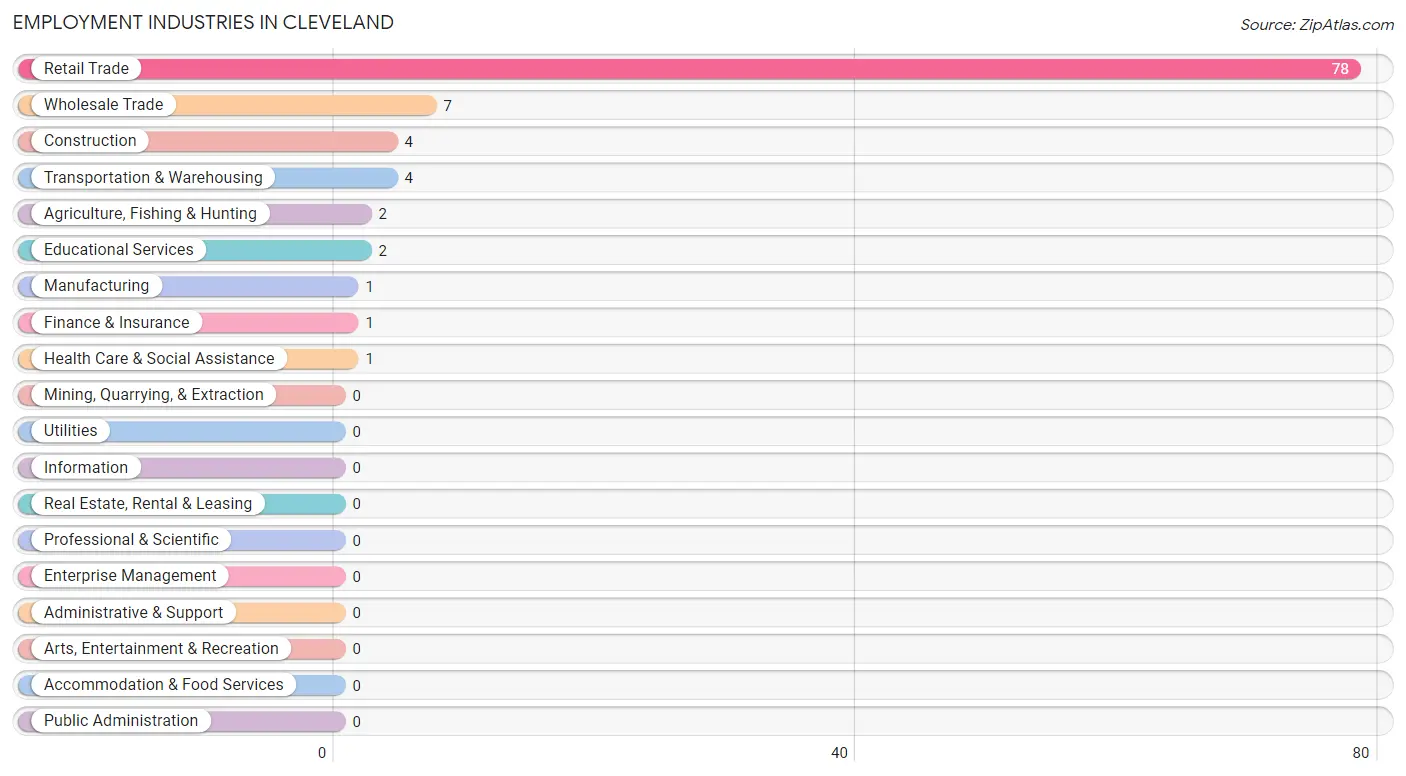
Employment Industries in Cleveland
The major employment industries in Cleveland include Retail Trade (78 | 75.7%), Wholesale Trade (7 | 6.8%), Construction (4 | 3.9%), Transportation & Warehousing (4 | 3.9%), and Agriculture, Fishing & Hunting (2 | 1.9%).
Employment Industries by Sex in Cleveland
The Cleveland industries that see more men than women are Agriculture, Fishing & Hunting (100.0%), Construction (100.0%), and Manufacturing (100.0%), whereas the industries that tend to have a higher number of women are Transportation & Warehousing (100.0%), Finance & Insurance (100.0%), and Educational Services (100.0%).

| Industry | Male | Female |
| Agriculture, Fishing & Hunting | 2 (100.0%) | 0 (0.0%) |
| Mining, Quarrying, & Extraction | 0 (0.0%) | 0 (0.0%) |
| Construction | 4 (100.0%) | 0 (0.0%) |
| Manufacturing | 1 (100.0%) | 0 (0.0%) |
| Wholesale Trade | 7 (100.0%) | 0 (0.0%) |
| Retail Trade | 73 (93.6%) | 5 (6.4%) |
| Transportation & Warehousing | 0 (0.0%) | 4 (100.0%) |
| Utilities | 0 (0.0%) | 0 (0.0%) |
| Information | 0 (0.0%) | 0 (0.0%) |
| Finance & Insurance | 0 (0.0%) | 1 (100.0%) |
| Real Estate, Rental & Leasing | 0 (0.0%) | 0 (0.0%) |
| Professional & Scientific | 0 (0.0%) | 0 (0.0%) |
| Enterprise Management | 0 (0.0%) | 0 (0.0%) |
| Administrative & Support | 0 (0.0%) | 0 (0.0%) |
| Educational Services | 0 (0.0%) | 2 (100.0%) |
| Health Care & Social Assistance | 0 (0.0%) | 1 (100.0%) |
| Arts, Entertainment & Recreation | 0 (0.0%) | 0 (0.0%) |
| Accommodation & Food Services | 0 (0.0%) | 0 (0.0%) |
| Public Administration | 0 (0.0%) | 0 (0.0%) |
| Total | 88 (85.4%) | 15 (14.6%) |
Education in Cleveland
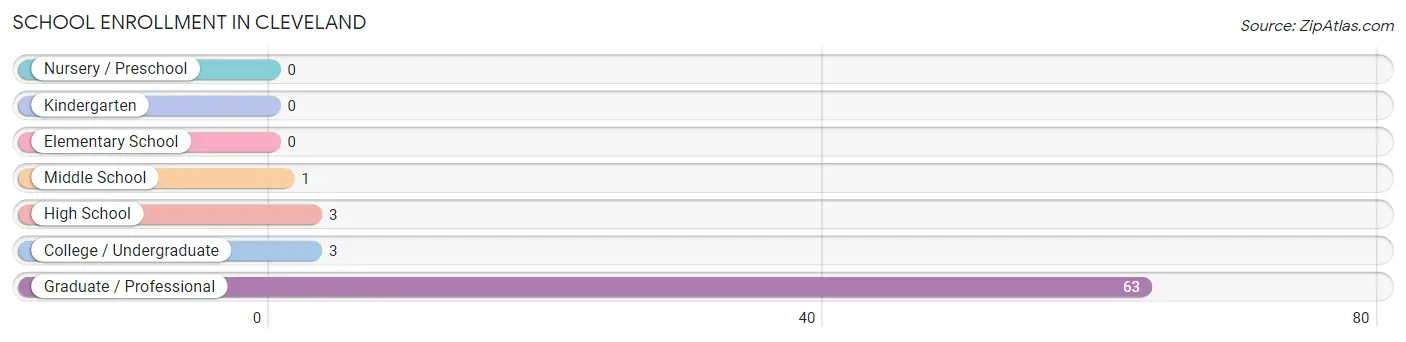
School Enrollment in Cleveland
The most common levels of schooling among the 70 students in Cleveland are graduate / professional (63 | 90.0%), high school (3 | 4.3%), and college / undergraduate (3 | 4.3%).
| School Level | # Students | % Students |
| Nursery / Preschool | 0 | 0.0% |
| Kindergarten | 0 | 0.0% |
| Elementary School | 0 | 0.0% |
| Middle School | 1 | 1.4% |
| High School | 3 | 4.3% |
| College / Undergraduate | 3 | 4.3% |
| Graduate / Professional | 63 | 90.0% |
| Total | 70 | 100.0% |
School Enrollment by Age by Funding Source in Cleveland
Out of a total of 70 students who are enrolled in schools in Cleveland, 65 (92.9%) attend a private institution, while the remaining 5 (7.1%) are enrolled in public schools. The age group of 20 to 24 year olds has the highest likelihood of being enrolled in private schools, with 2 (100.0% in the age bracket) enrolled. Conversely, the age group of 10 to 14 year olds has the lowest likelihood of being enrolled in a private school, with 1 (100.0% in the age bracket) attending a public institution.
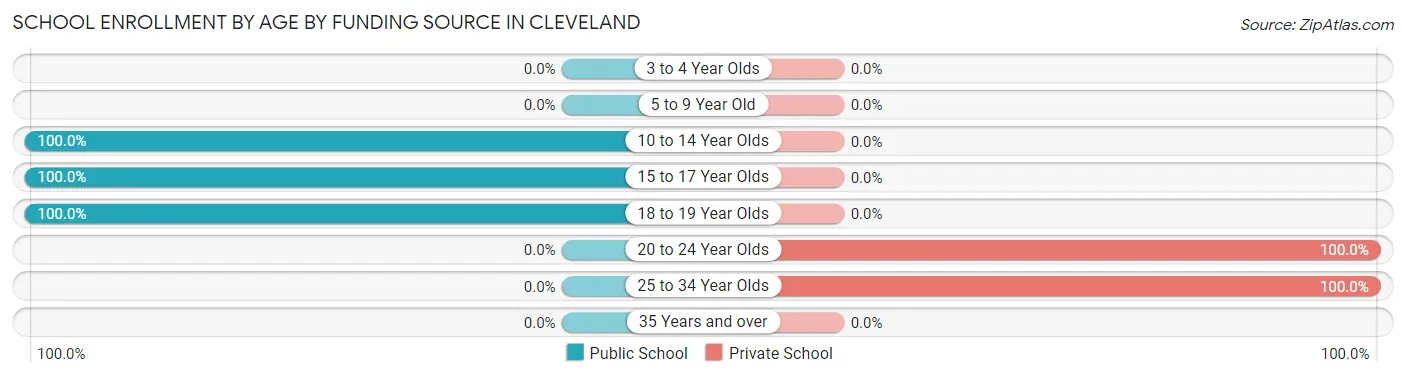
| Age Bracket | Public School | Private School |
| 3 to 4 Year Olds | 0 (0.0%) | 0 (0.0%) |
| 5 to 9 Year Old | 0 (0.0%) | 0 (0.0%) |
| 10 to 14 Year Olds | 1 (100.0%) | 0 (0.0%) |
| 15 to 17 Year Olds | 2 (100.0%) | 0 (0.0%) |
| 18 to 19 Year Olds | 2 (100.0%) | 0 (0.0%) |
| 20 to 24 Year Olds | 0 (0.0%) | 2 (100.0%) |
| 25 to 34 Year Olds | 0 (0.0%) | 63 (100.0%) |
| 35 Years and over | 0 (0.0%) | 0 (0.0%) |
| Total | 5 (7.1%) | 65 (92.9%) |
Educational Attainment by Field of Study in Cleveland
Business (64 | 95.5%), science & technology (2 | 3.0%), and bio, nature & agricultural (1 | 1.5%) are the most common fields of study among 67 individuals in Cleveland who have obtained a bachelor's degree or higher.
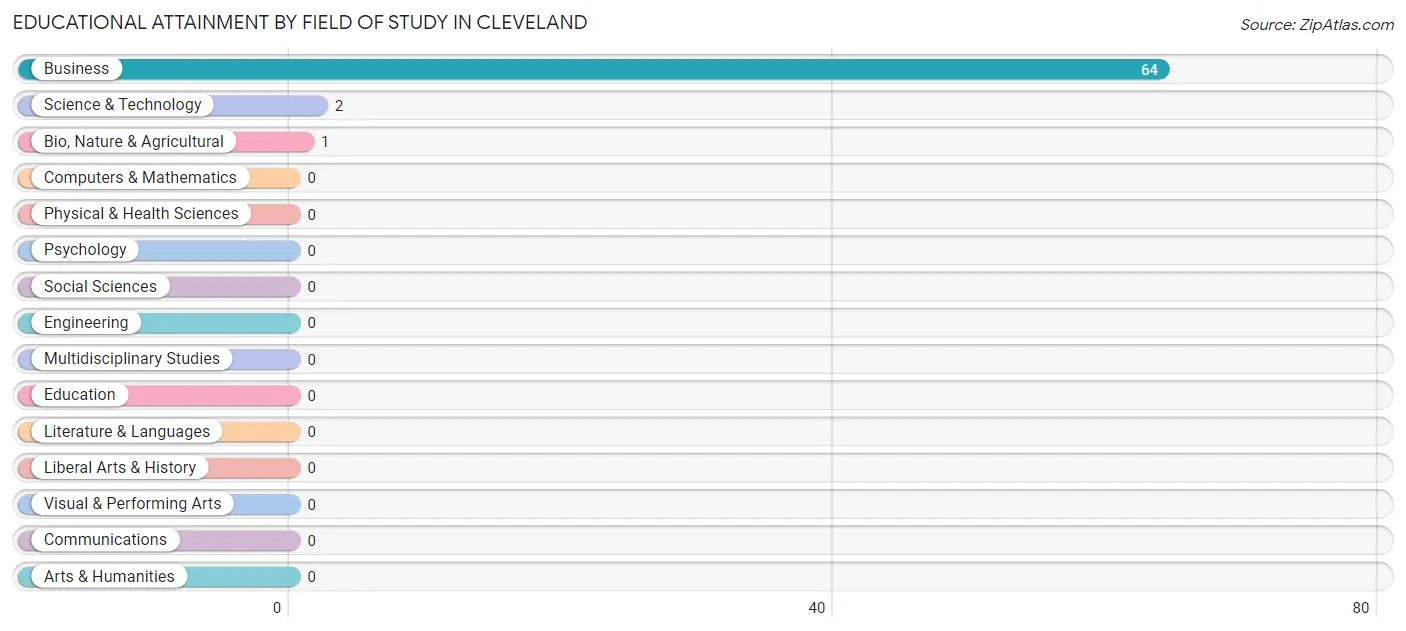
| Field of Study | # Graduates | % Graduates |
| Computers & Mathematics | 0 | 0.0% |
| Bio, Nature & Agricultural | 1 | 1.5% |
| Physical & Health Sciences | 0 | 0.0% |
| Psychology | 0 | 0.0% |
| Social Sciences | 0 | 0.0% |
| Engineering | 0 | 0.0% |
| Multidisciplinary Studies | 0 | 0.0% |
| Science & Technology | 2 | 3.0% |
| Business | 64 | 95.5% |
| Education | 0 | 0.0% |
| Literature & Languages | 0 | 0.0% |
| Liberal Arts & History | 0 | 0.0% |
| Visual & Performing Arts | 0 | 0.0% |
| Communications | 0 | 0.0% |
| Arts & Humanities | 0 | 0.0% |
| Total | 67 | 100.0% |
Transportation & Commute in Cleveland
Vehicle Availability by Sex in Cleveland
The most prevalent vehicle ownership categories in Cleveland are males with 1 vehicle (73, accounting for 83.0%) and females with 1 vehicle (4, making up 486.7%).
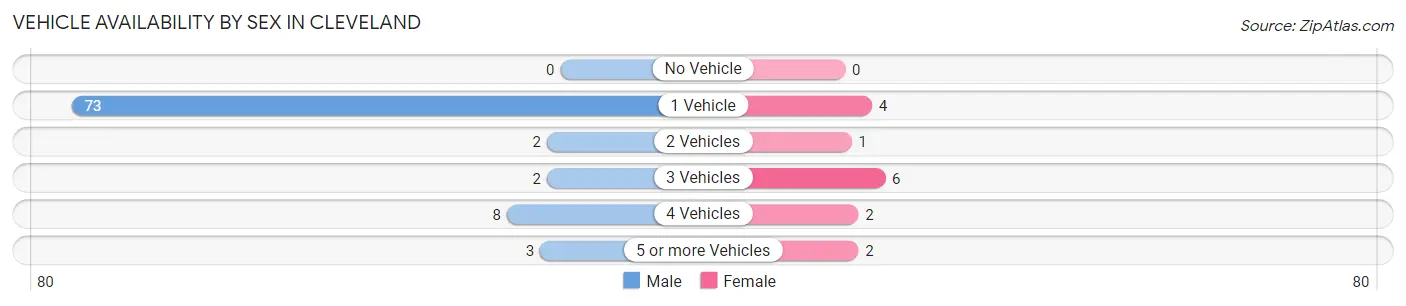
| Vehicles Available | Male | Female |
| No Vehicle | 0 (0.0%) | 0 (0.0%) |
| 1 Vehicle | 73 (83.0%) | 4 (26.7%) |
| 2 Vehicles | 2 (2.3%) | 1 (6.7%) |
| 3 Vehicles | 2 (2.3%) | 6 (40.0%) |
| 4 Vehicles | 8 (9.1%) | 2 (13.3%) |
| 5 or more Vehicles | 3 (3.4%) | 2 (13.3%) |
| Total | 88 (100.0%) | 15 (100.0%) |
Commute Time in Cleveland
The most frequently occuring commute durations in Cleveland are 20 to 24 minutes (87 commuters, 84.5%), 15 to 19 minutes (7 commuters, 6.8%), and 30 to 34 minutes (4 commuters, 3.9%).
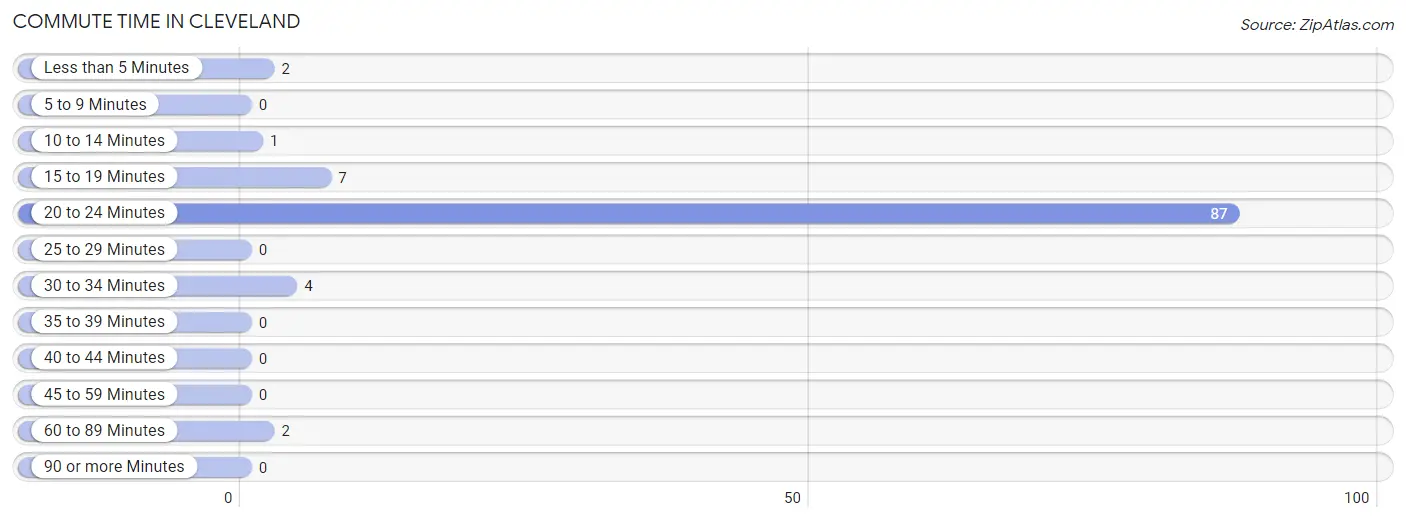
| Commute Time | # Commuters | % Commuters |
| Less than 5 Minutes | 2 | 1.9% |
| 5 to 9 Minutes | 0 | 0.0% |
| 10 to 14 Minutes | 1 | 1.0% |
| 15 to 19 Minutes | 7 | 6.8% |
| 20 to 24 Minutes | 87 | 84.5% |
| 25 to 29 Minutes | 0 | 0.0% |
| 30 to 34 Minutes | 4 | 3.9% |
| 35 to 39 Minutes | 0 | 0.0% |
| 40 to 44 Minutes | 0 | 0.0% |
| 45 to 59 Minutes | 0 | 0.0% |
| 60 to 89 Minutes | 2 | 1.9% |
| 90 or more Minutes | 0 | 0.0% |
Commute Time by Sex in Cleveland
The most common commute times in Cleveland are 20 to 24 minutes (76 commuters, 86.4%) for males and 20 to 24 minutes (11 commuters, 73.3%) for females.
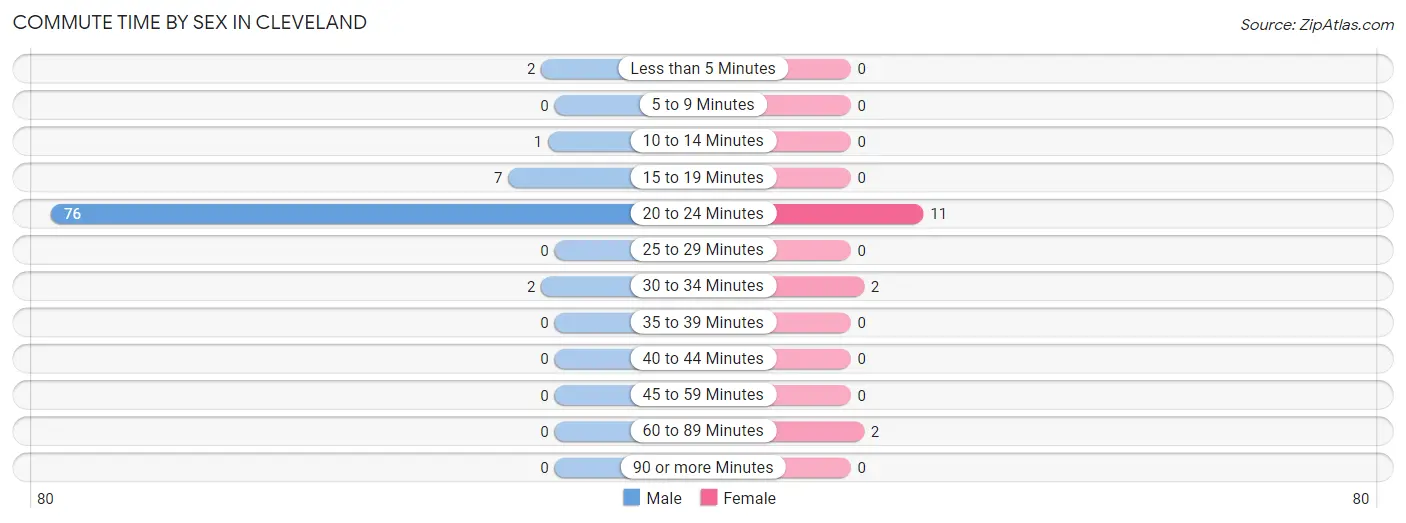
| Commute Time | Male | Female |
| Less than 5 Minutes | 2 (2.3%) | 0 (0.0%) |
| 5 to 9 Minutes | 0 (0.0%) | 0 (0.0%) |
| 10 to 14 Minutes | 1 (1.1%) | 0 (0.0%) |
| 15 to 19 Minutes | 7 (8.0%) | 0 (0.0%) |
| 20 to 24 Minutes | 76 (86.4%) | 11 (73.3%) |
| 25 to 29 Minutes | 0 (0.0%) | 0 (0.0%) |
| 30 to 34 Minutes | 2 (2.3%) | 2 (13.3%) |
| 35 to 39 Minutes | 0 (0.0%) | 0 (0.0%) |
| 40 to 44 Minutes | 0 (0.0%) | 0 (0.0%) |
| 45 to 59 Minutes | 0 (0.0%) | 0 (0.0%) |
| 60 to 89 Minutes | 0 (0.0%) | 2 (13.3%) |
| 90 or more Minutes | 0 (0.0%) | 0 (0.0%) |
Time of Departure to Work by Sex in Cleveland
The most frequent times of departure to work in Cleveland are 12:00 PM to 3:59 PM (73, 83.0%) for males and 12:00 PM to 3:59 PM (4, 26.7%) for females.
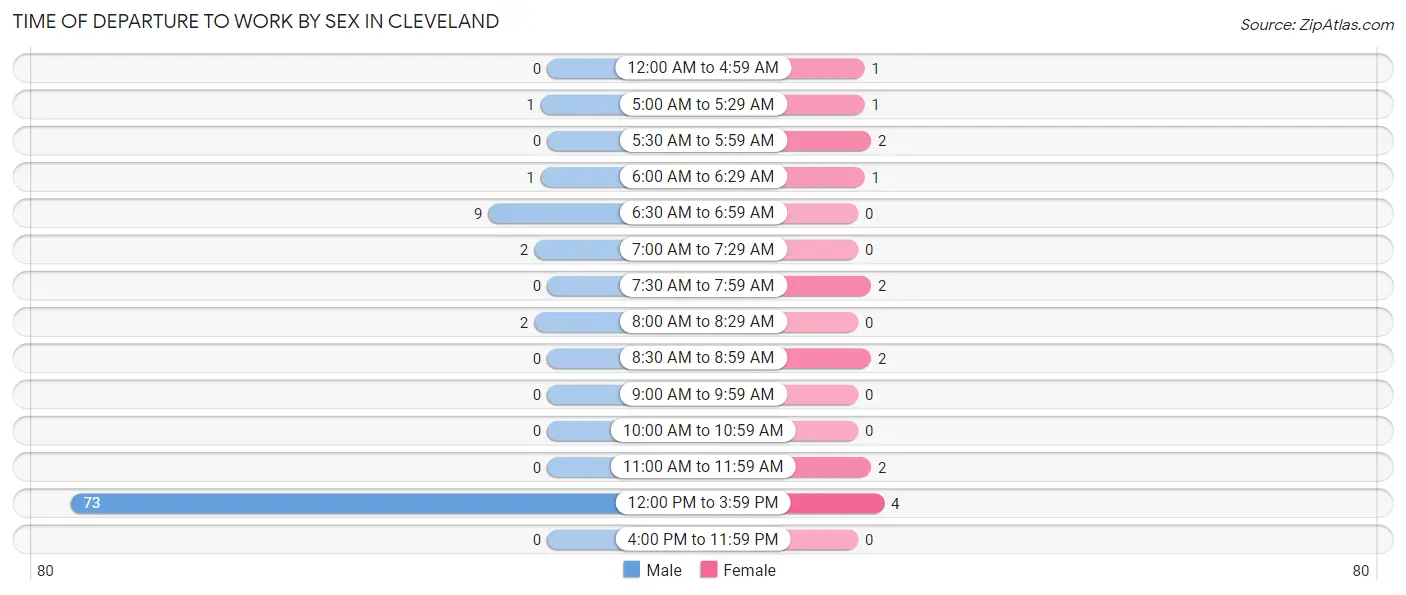
| Time of Departure | Male | Female |
| 12:00 AM to 4:59 AM | 0 (0.0%) | 1 (6.7%) |
| 5:00 AM to 5:29 AM | 1 (1.1%) | 1 (6.7%) |
| 5:30 AM to 5:59 AM | 0 (0.0%) | 2 (13.3%) |
| 6:00 AM to 6:29 AM | 1 (1.1%) | 1 (6.7%) |
| 6:30 AM to 6:59 AM | 9 (10.2%) | 0 (0.0%) |
| 7:00 AM to 7:29 AM | 2 (2.3%) | 0 (0.0%) |
| 7:30 AM to 7:59 AM | 0 (0.0%) | 2 (13.3%) |
| 8:00 AM to 8:29 AM | 2 (2.3%) | 0 (0.0%) |
| 8:30 AM to 8:59 AM | 0 (0.0%) | 2 (13.3%) |
| 9:00 AM to 9:59 AM | 0 (0.0%) | 0 (0.0%) |
| 10:00 AM to 10:59 AM | 0 (0.0%) | 0 (0.0%) |
| 11:00 AM to 11:59 AM | 0 (0.0%) | 2 (13.3%) |
| 12:00 PM to 3:59 PM | 73 (83.0%) | 4 (26.7%) |
| 4:00 PM to 11:59 PM | 0 (0.0%) | 0 (0.0%) |
| Total | 88 (100.0%) | 15 (100.0%) |
Housing Occupancy in Cleveland
Occupancy by Ownership in Cleveland
Of the total 35 dwellings in Cleveland, owner-occupied units account for 25 (71.4%), while renter-occupied units make up 10 (28.6%).
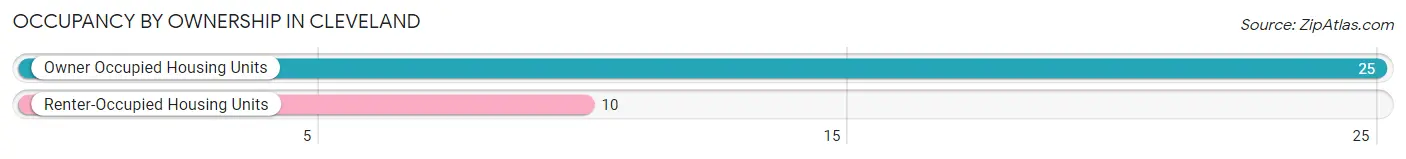
| Occupancy | # Housing Units | % Housing Units |
| Owner Occupied Housing Units | 25 | 71.4% |
| Renter-Occupied Housing Units | 10 | 28.6% |
| Total Occupied Housing Units | 35 | 100.0% |
Occupancy by Household Size in Cleveland
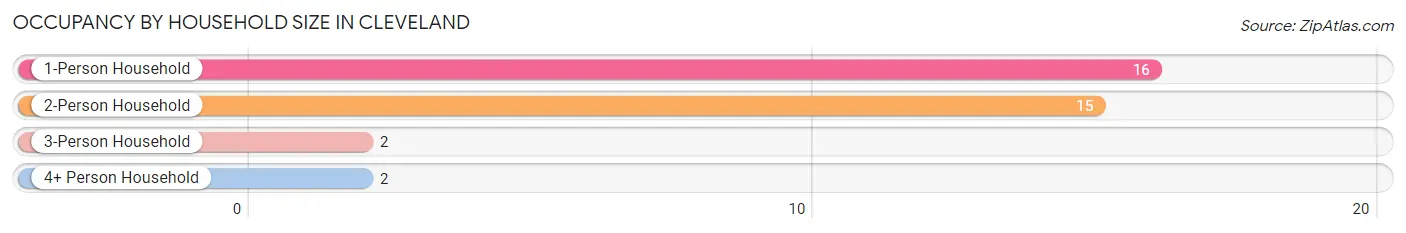
| Household Size | # Housing Units | % Housing Units |
| 1-Person Household | 16 | 45.7% |
| 2-Person Household | 15 | 42.9% |
| 3-Person Household | 2 | 5.7% |
| 4+ Person Household | 2 | 5.7% |
| Total Housing Units | 35 | 100.0% |
Occupancy by Ownership by Household Size in Cleveland
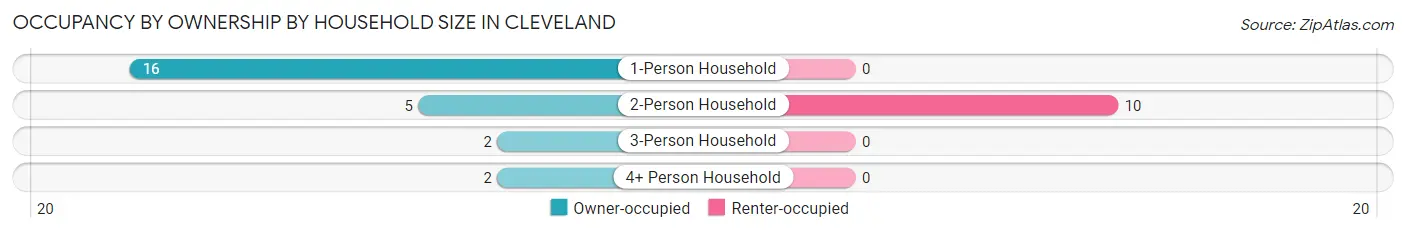
| Household Size | Owner-occupied | Renter-occupied |
| 1-Person Household | 16 (100.0%) | 0 (0.0%) |
| 2-Person Household | 5 (33.3%) | 10 (66.7%) |
| 3-Person Household | 2 (100.0%) | 0 (0.0%) |
| 4+ Person Household | 2 (100.0%) | 0 (0.0%) |
| Total Housing Units | 25 (71.4%) | 10 (28.6%) |
Occupancy by Educational Attainment in Cleveland
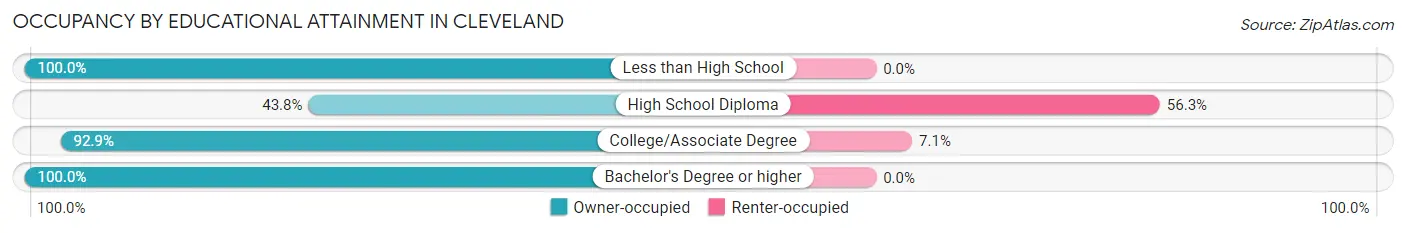
| Household Size | Owner-occupied | Renter-occupied |
| Less than High School | 1 (100.0%) | 0 (0.0%) |
| High School Diploma | 7 (43.8%) | 9 (56.2%) |
| College/Associate Degree | 13 (92.9%) | 1 (7.1%) |
| Bachelor's Degree or higher | 4 (100.0%) | 0 (0.0%) |
Occupancy by Age of Householder in Cleveland
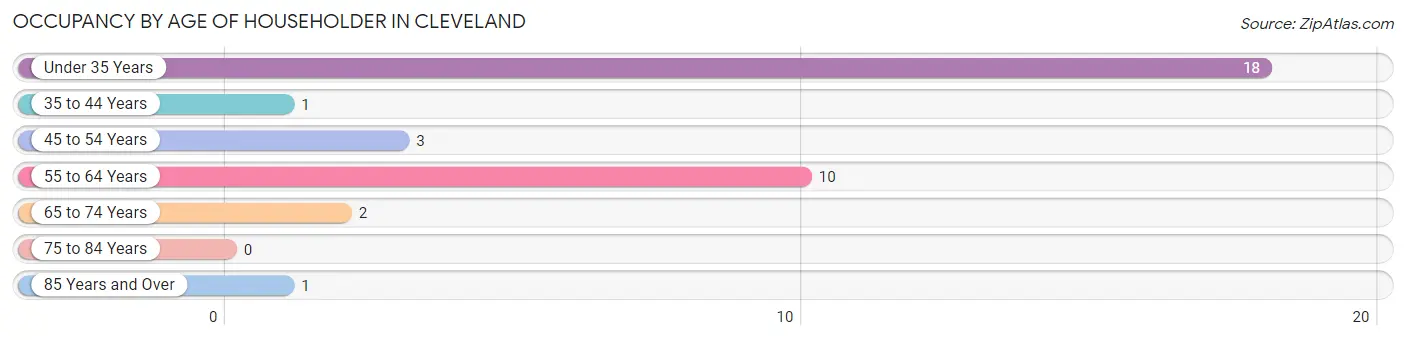
| Age Bracket | # Households | % Households |
| Under 35 Years | 18 | 51.4% |
| 35 to 44 Years | 1 | 2.9% |
| 45 to 54 Years | 3 | 8.6% |
| 55 to 64 Years | 10 | 28.6% |
| 65 to 74 Years | 2 | 5.7% |
| 75 to 84 Years | 0 | 0.0% |
| 85 Years and Over | 1 | 2.9% |
| Total | 35 | 100.0% |
Housing Finances in Cleveland
Median Income by Occupancy in Cleveland
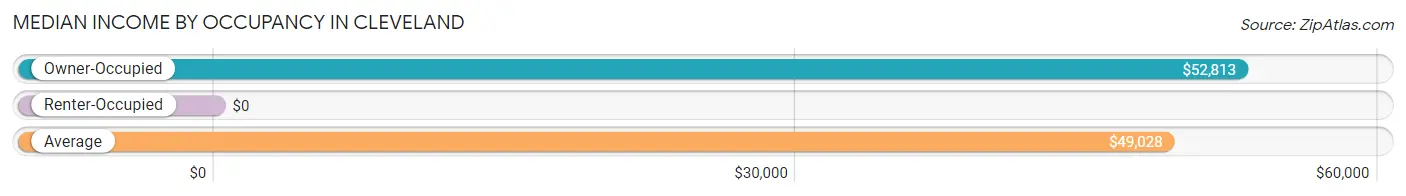
| Occupancy Type | # Households | Median Income |
| Owner-Occupied | 25 (71.4%) | $52,813 |
| Renter-Occupied | 10 (28.6%) | $0 |
| Average | 35 (100.0%) | $49,028 |
Occupancy by Householder Income Bracket in Cleveland
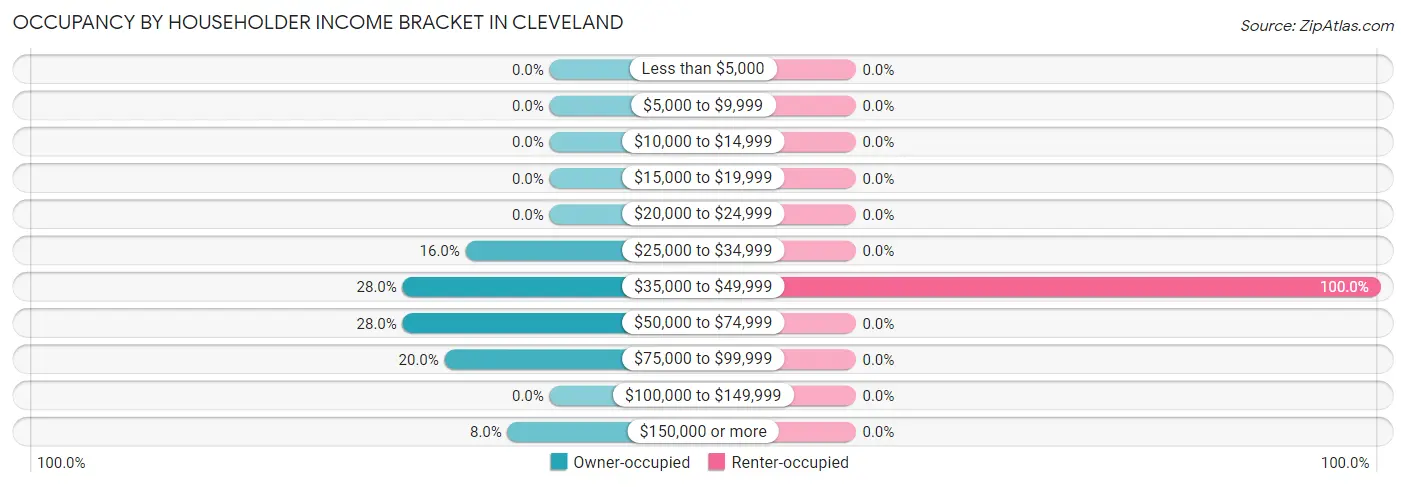
| Income Bracket | Owner-occupied | Renter-occupied |
| Less than $5,000 | 0 (0.0%) | 0 (0.0%) |
| $5,000 to $9,999 | 0 (0.0%) | 0 (0.0%) |
| $10,000 to $14,999 | 0 (0.0%) | 0 (0.0%) |
| $15,000 to $19,999 | 0 (0.0%) | 0 (0.0%) |
| $20,000 to $24,999 | 0 (0.0%) | 0 (0.0%) |
| $25,000 to $34,999 | 4 (16.0%) | 0 (0.0%) |
| $35,000 to $49,999 | 7 (28.0%) | 10 (100.0%) |
| $50,000 to $74,999 | 7 (28.0%) | 0 (0.0%) |
| $75,000 to $99,999 | 5 (20.0%) | 0 (0.0%) |
| $100,000 to $149,999 | 0 (0.0%) | 0 (0.0%) |
| $150,000 or more | 2 (8.0%) | 0 (0.0%) |
| Total | 25 (100.0%) | 10 (100.0%) |
Monthly Housing Cost Tiers in Cleveland
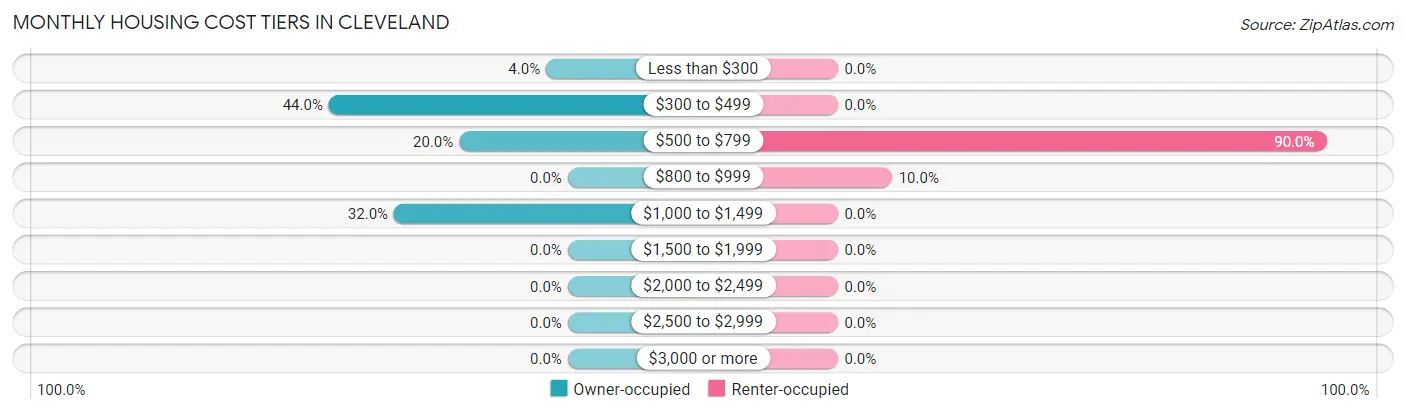
| Monthly Cost | Owner-occupied | Renter-occupied |
| Less than $300 | 1 (4.0%) | 0 (0.0%) |
| $300 to $499 | 11 (44.0%) | 0 (0.0%) |
| $500 to $799 | 5 (20.0%) | 9 (90.0%) |
| $800 to $999 | 0 (0.0%) | 1 (10.0%) |
| $1,000 to $1,499 | 8 (32.0%) | 0 (0.0%) |
| $1,500 to $1,999 | 0 (0.0%) | 0 (0.0%) |
| $2,000 to $2,499 | 0 (0.0%) | 0 (0.0%) |
| $2,500 to $2,999 | 0 (0.0%) | 0 (0.0%) |
| $3,000 or more | 0 (0.0%) | 0 (0.0%) |
| Total | 25 (100.0%) | 10 (100.0%) |
Physical Housing Characteristics in Cleveland
Housing Structures in Cleveland
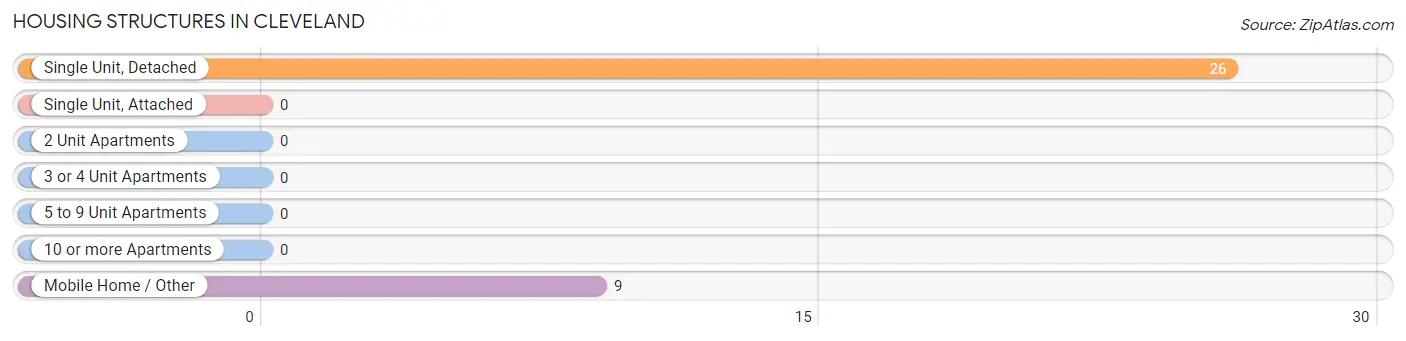
| Structure Type | # Housing Units | % Housing Units |
| Single Unit, Detached | 26 | 74.3% |
| Single Unit, Attached | 0 | 0.0% |
| 2 Unit Apartments | 0 | 0.0% |
| 3 or 4 Unit Apartments | 0 | 0.0% |
| 5 to 9 Unit Apartments | 0 | 0.0% |
| 10 or more Apartments | 0 | 0.0% |
| Mobile Home / Other | 9 | 25.7% |
| Total | 35 | 100.0% |
Housing Structures by Occupancy in Cleveland
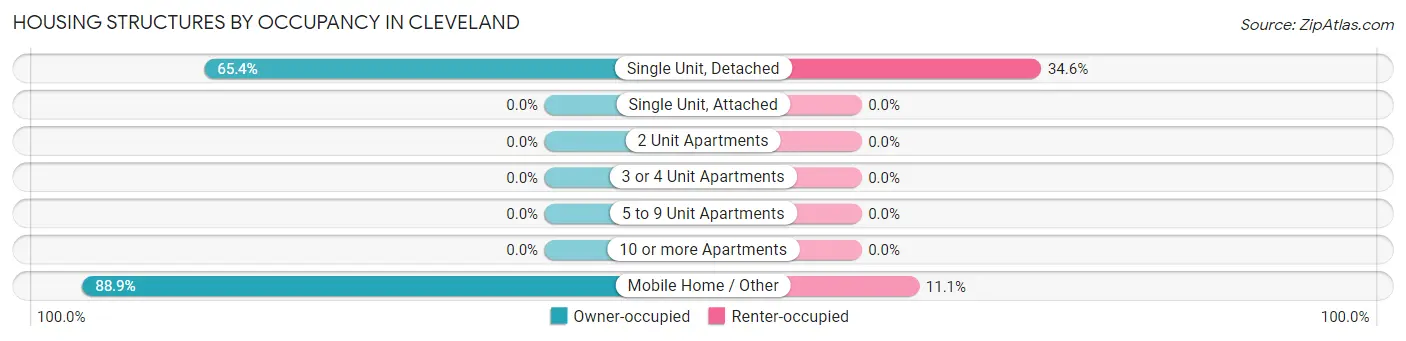
| Structure Type | Owner-occupied | Renter-occupied |
| Single Unit, Detached | 17 (65.4%) | 9 (34.6%) |
| Single Unit, Attached | 0 (0.0%) | 0 (0.0%) |
| 2 Unit Apartments | 0 (0.0%) | 0 (0.0%) |
| 3 or 4 Unit Apartments | 0 (0.0%) | 0 (0.0%) |
| 5 to 9 Unit Apartments | 0 (0.0%) | 0 (0.0%) |
| 10 or more Apartments | 0 (0.0%) | 0 (0.0%) |
| Mobile Home / Other | 8 (88.9%) | 1 (11.1%) |
| Total | 25 (71.4%) | 10 (28.6%) |
Housing Structures by Number of Rooms in Cleveland
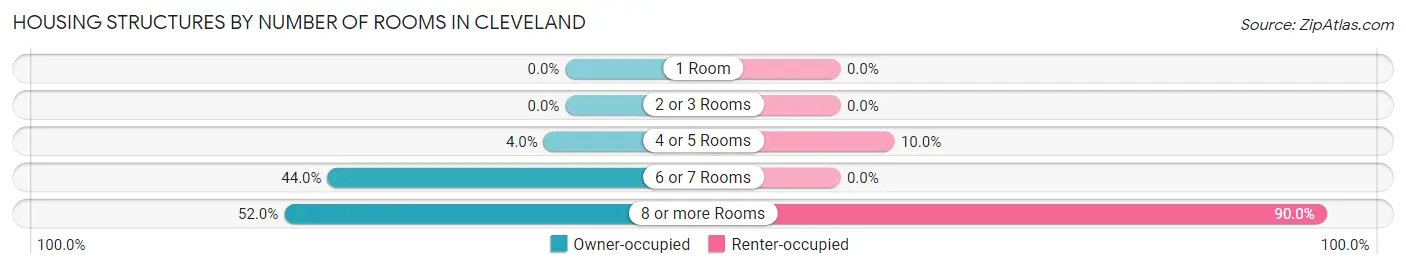
| Number of Rooms | Owner-occupied | Renter-occupied |
| 1 Room | 0 (0.0%) | 0 (0.0%) |
| 2 or 3 Rooms | 0 (0.0%) | 0 (0.0%) |
| 4 or 5 Rooms | 1 (4.0%) | 1 (10.0%) |
| 6 or 7 Rooms | 11 (44.0%) | 0 (0.0%) |
| 8 or more Rooms | 13 (52.0%) | 9 (90.0%) |
| Total | 25 (100.0%) | 10 (100.0%) |
Housing Structure by Heating Type in Cleveland
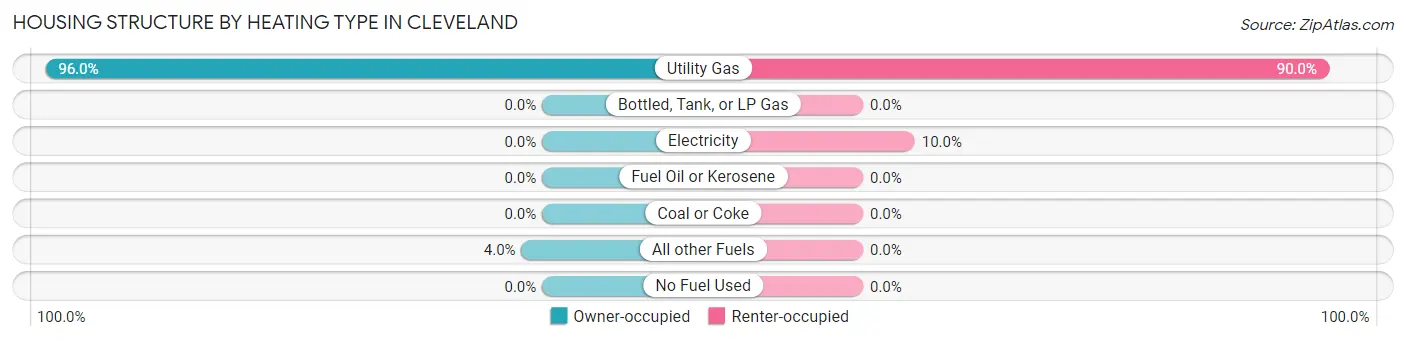
| Heating Type | Owner-occupied | Renter-occupied |
| Utility Gas | 24 (96.0%) | 9 (90.0%) |
| Bottled, Tank, or LP Gas | 0 (0.0%) | 0 (0.0%) |
| Electricity | 0 (0.0%) | 1 (10.0%) |
| Fuel Oil or Kerosene | 0 (0.0%) | 0 (0.0%) |
| Coal or Coke | 0 (0.0%) | 0 (0.0%) |
| All other Fuels | 1 (4.0%) | 0 (0.0%) |
| No Fuel Used | 0 (0.0%) | 0 (0.0%) |
| Total | 25 (100.0%) | 10 (100.0%) |
Household Vehicle Usage in Cleveland
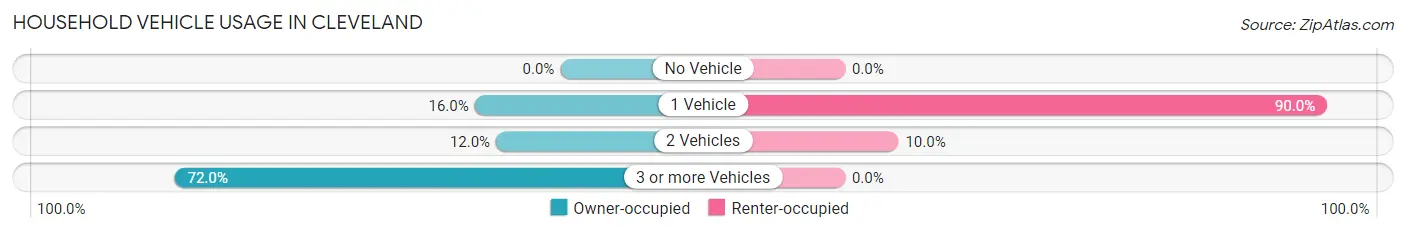
| Vehicles per Household | Owner-occupied | Renter-occupied |
| No Vehicle | 0 (0.0%) | 0 (0.0%) |
| 1 Vehicle | 4 (16.0%) | 9 (90.0%) |
| 2 Vehicles | 3 (12.0%) | 1 (10.0%) |
| 3 or more Vehicles | 18 (72.0%) | 0 (0.0%) |
| Total | 25 (100.0%) | 10 (100.0%) |
Real Estate & Mortgages in Cleveland
Real Estate and Mortgage Overview in Cleveland
| Characteristic | Without Mortgage | With Mortgage |
| Housing Units | 15 | 10 |
| Median Property Value | $71,700 | $214,300 |
| Median Household Income | $68,125 | $1 |
| Monthly Housing Costs | $450 | $0 |
| Real Estate Taxes | - | - |
Property Value by Mortgage Status in Cleveland
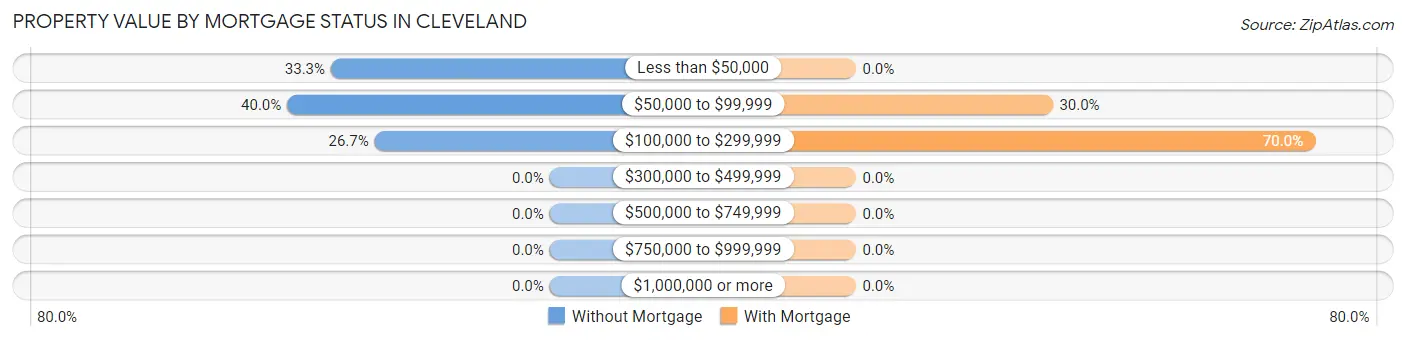
| Property Value | Without Mortgage | With Mortgage |
| Less than $50,000 | 5 (33.3%) | 0 (0.0%) |
| $50,000 to $99,999 | 6 (40.0%) | 3 (30.0%) |
| $100,000 to $299,999 | 4 (26.7%) | 7 (70.0%) |
| $300,000 to $499,999 | 0 (0.0%) | 0 (0.0%) |
| $500,000 to $749,999 | 0 (0.0%) | 0 (0.0%) |
| $750,000 to $999,999 | 0 (0.0%) | 0 (0.0%) |
| $1,000,000 or more | 0 (0.0%) | 0 (0.0%) |
| Total | 15 (100.0%) | 10 (100.0%) |
Household Income by Mortgage Status in Cleveland
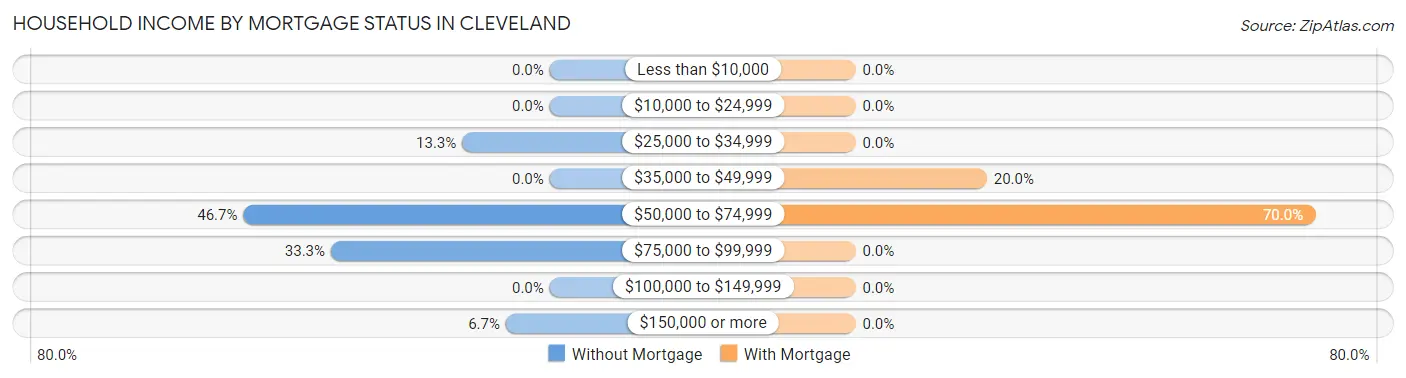
| Household Income | Without Mortgage | With Mortgage |
| Less than $10,000 | 0 (0.0%) | 0 (0.0%) |
| $10,000 to $24,999 | 0 (0.0%) | 0 (0.0%) |
| $25,000 to $34,999 | 2 (13.3%) | 0 (0.0%) |
| $35,000 to $49,999 | 0 (0.0%) | 2 (20.0%) |
| $50,000 to $74,999 | 7 (46.7%) | 7 (70.0%) |
| $75,000 to $99,999 | 5 (33.3%) | 0 (0.0%) |
| $100,000 to $149,999 | 0 (0.0%) | 0 (0.0%) |
| $150,000 or more | 1 (6.7%) | 0 (0.0%) |
| Total | 15 (100.0%) | 10 (100.0%) |
Property Value to Household Income Ratio in Cleveland
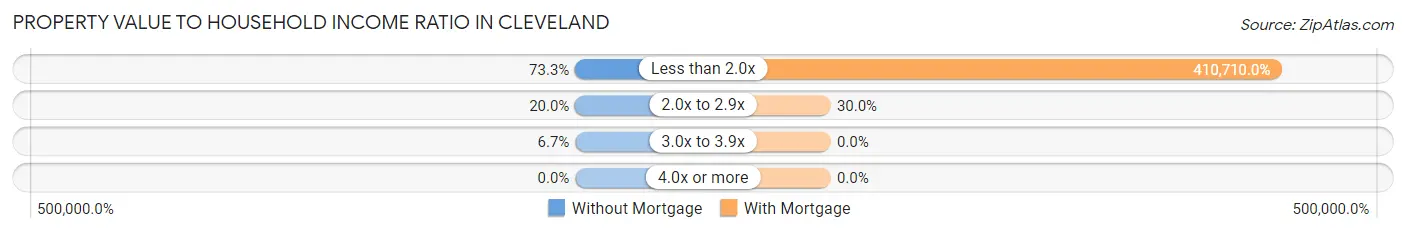
| Value-to-Income Ratio | Without Mortgage | With Mortgage |
| Less than 2.0x | 11 (73.3%) | 41,071 (410,710.0%) |
| 2.0x to 2.9x | 3 (20.0%) | 3 (30.0%) |
| 3.0x to 3.9x | 1 (6.7%) | 0 (0.0%) |
| 4.0x or more | 0 (0.0%) | 0 (0.0%) |
| Total | 15 (100.0%) | 10 (100.0%) |
Real Estate Taxes by Mortgage Status in Cleveland
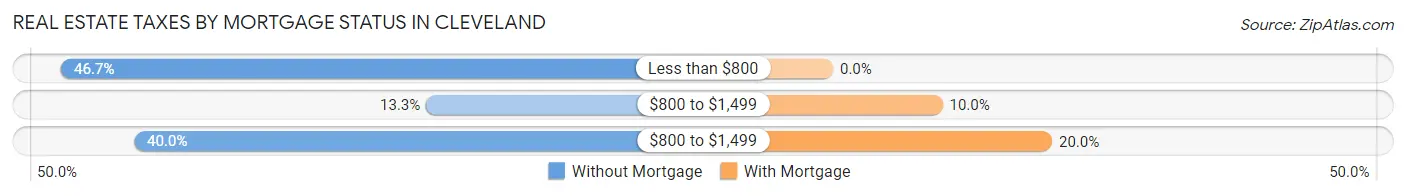
| Property Taxes | Without Mortgage | With Mortgage |
| Less than $800 | 7 (46.7%) | 0 (0.0%) |
| $800 to $1,499 | 2 (13.3%) | 1 (10.0%) |
| $800 to $1,499 | 6 (40.0%) | 2 (20.0%) |
| Total | 15 (100.0%) | 10 (100.0%) |
Health & Disability in Cleveland
Health Insurance Coverage by Age in Cleveland
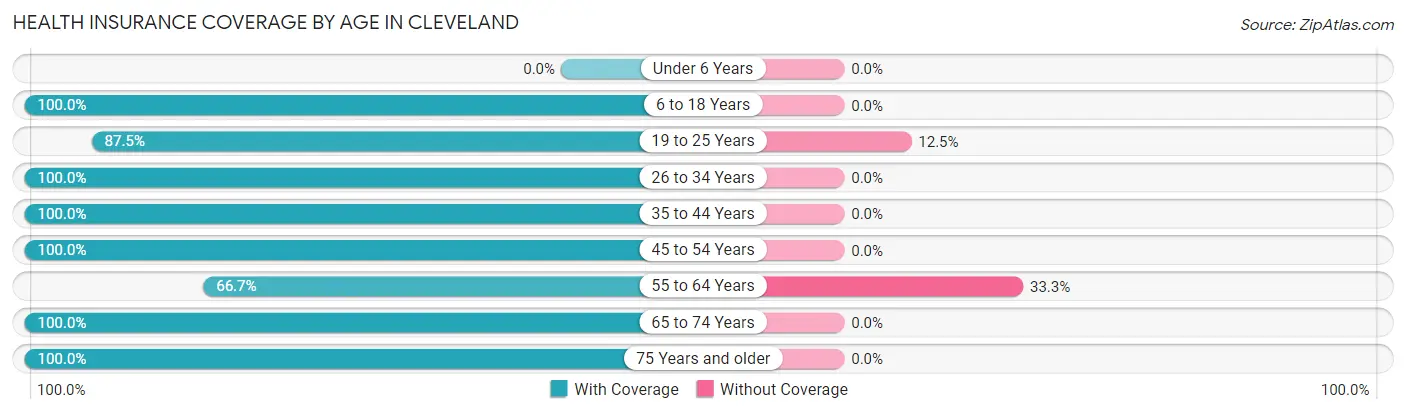
| Age Bracket | With Coverage | Without Coverage |
| Under 6 Years | 0 (0.0%) | 0 (0.0%) |
| 6 to 18 Years | 4 (100.0%) | 0 (0.0%) |
| 19 to 25 Years | 14 (87.5%) | 2 (12.5%) |
| 26 to 34 Years | 73 (100.0%) | 0 (0.0%) |
| 35 to 44 Years | 1 (100.0%) | 0 (0.0%) |
| 45 to 54 Years | 6 (100.0%) | 0 (0.0%) |
| 55 to 64 Years | 8 (66.7%) | 4 (33.3%) |
| 65 to 74 Years | 4 (100.0%) | 0 (0.0%) |
| 75 Years and older | 3 (100.0%) | 0 (0.0%) |
| Total | 113 (95.0%) | 6 (5.0%) |
Health Insurance Coverage by Citizenship Status in Cleveland
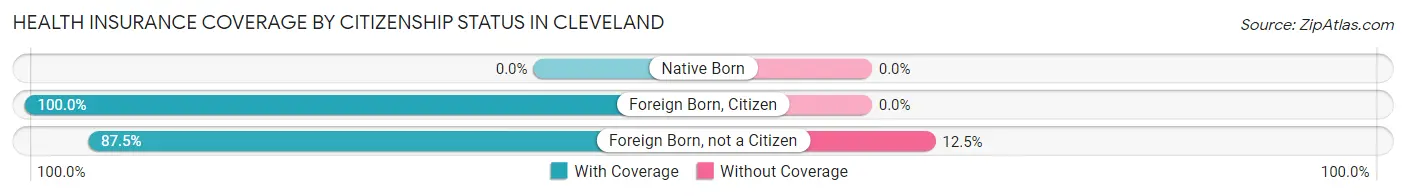
| Citizenship Status | With Coverage | Without Coverage |
| Native Born | 0 (0.0%) | 0 (0.0%) |
| Foreign Born, Citizen | 4 (100.0%) | 0 (0.0%) |
| Foreign Born, not a Citizen | 14 (87.5%) | 2 (12.5%) |
Health Insurance Coverage by Household Income in Cleveland
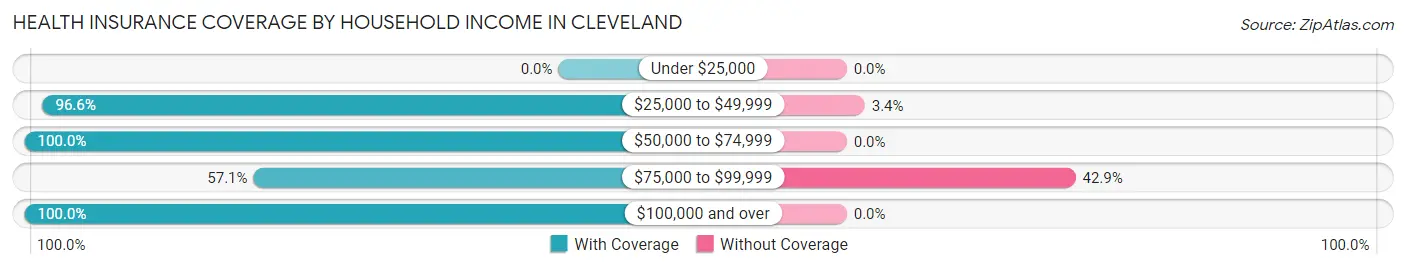
| Household Income | With Coverage | Without Coverage |
| Under $25,000 | 0 (0.0%) | 0 (0.0%) |
| $25,000 to $49,999 | 86 (96.6%) | 3 (3.4%) |
| $50,000 to $74,999 | 15 (100.0%) | 0 (0.0%) |
| $75,000 to $99,999 | 4 (57.1%) | 3 (42.9%) |
| $100,000 and over | 8 (100.0%) | 0 (0.0%) |
Public vs Private Health Insurance Coverage by Age in Cleveland
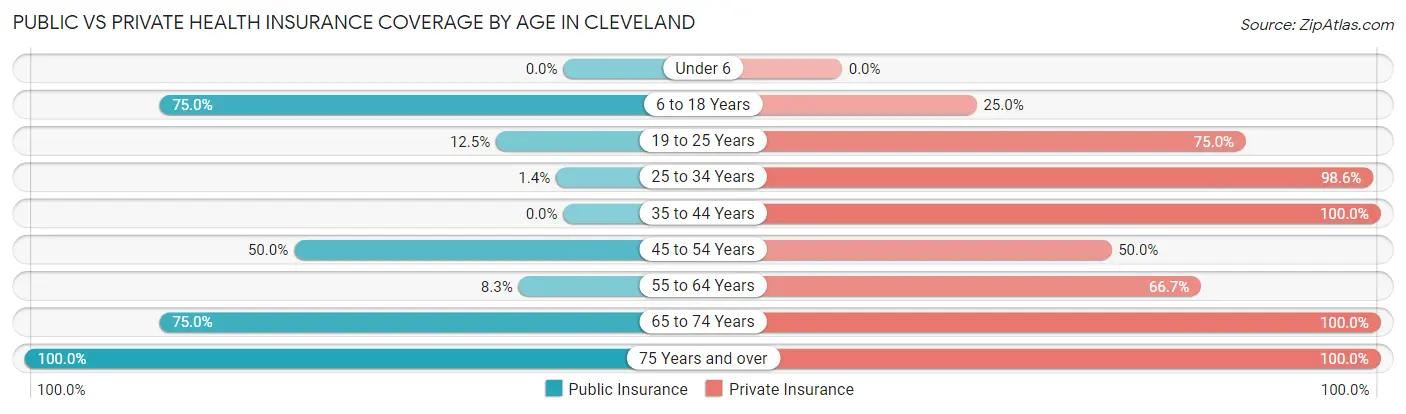
| Age Bracket | Public Insurance | Private Insurance |
| Under 6 | 0 (0.0%) | 0 (0.0%) |
| 6 to 18 Years | 3 (75.0%) | 1 (25.0%) |
| 19 to 25 Years | 2 (12.5%) | 12 (75.0%) |
| 25 to 34 Years | 1 (1.4%) | 72 (98.6%) |
| 35 to 44 Years | 0 (0.0%) | 1 (100.0%) |
| 45 to 54 Years | 3 (50.0%) | 3 (50.0%) |
| 55 to 64 Years | 1 (8.3%) | 8 (66.7%) |
| 65 to 74 Years | 3 (75.0%) | 4 (100.0%) |
| 75 Years and over | 3 (100.0%) | 3 (100.0%) |
| Total | 16 (13.5%) | 104 (87.4%) |
Disability Status by Sex by Age in Cleveland
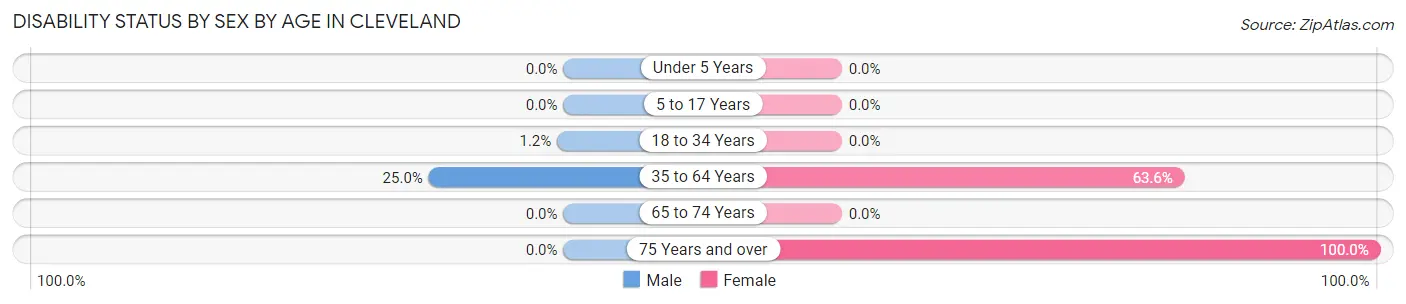
| Age Bracket | Male | Female |
| Under 5 Years | 0 (0.0%) | 0 (0.0%) |
| 5 to 17 Years | 0 (0.0%) | 0 (0.0%) |
| 18 to 34 Years | 1 (1.2%) | 0 (0.0%) |
| 35 to 64 Years | 2 (25.0%) | 7 (63.6%) |
| 65 to 74 Years | 0 (0.0%) | 0 (0.0%) |
| 75 Years and over | 0 (0.0%) | 1 (100.0%) |
Disability Class by Sex by Age in Cleveland
Disability Class: Hearing Difficulty
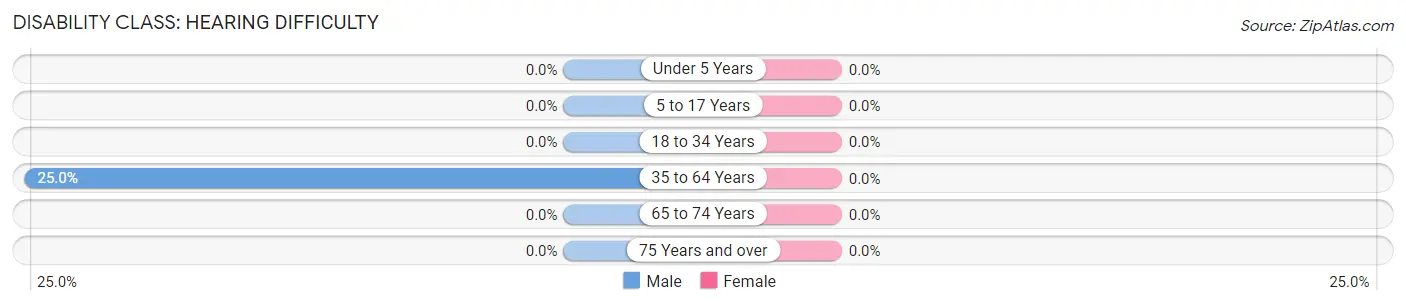
| Age Bracket | Male | Female |
| Under 5 Years | 0 (0.0%) | 0 (0.0%) |
| 5 to 17 Years | 0 (0.0%) | 0 (0.0%) |
| 18 to 34 Years | 0 (0.0%) | 0 (0.0%) |
| 35 to 64 Years | 2 (25.0%) | 0 (0.0%) |
| 65 to 74 Years | 0 (0.0%) | 0 (0.0%) |
| 75 Years and over | 0 (0.0%) | 0 (0.0%) |
Disability Class: Vision Difficulty
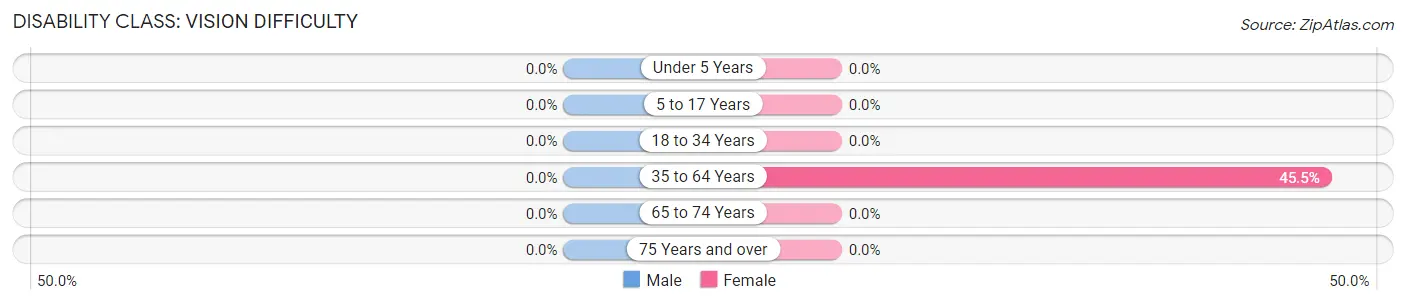
| Age Bracket | Male | Female |
| Under 5 Years | 0 (0.0%) | 0 (0.0%) |
| 5 to 17 Years | 0 (0.0%) | 0 (0.0%) |
| 18 to 34 Years | 0 (0.0%) | 0 (0.0%) |
| 35 to 64 Years | 0 (0.0%) | 5 (45.5%) |
| 65 to 74 Years | 0 (0.0%) | 0 (0.0%) |
| 75 Years and over | 0 (0.0%) | 0 (0.0%) |
Disability Class: Cognitive Difficulty
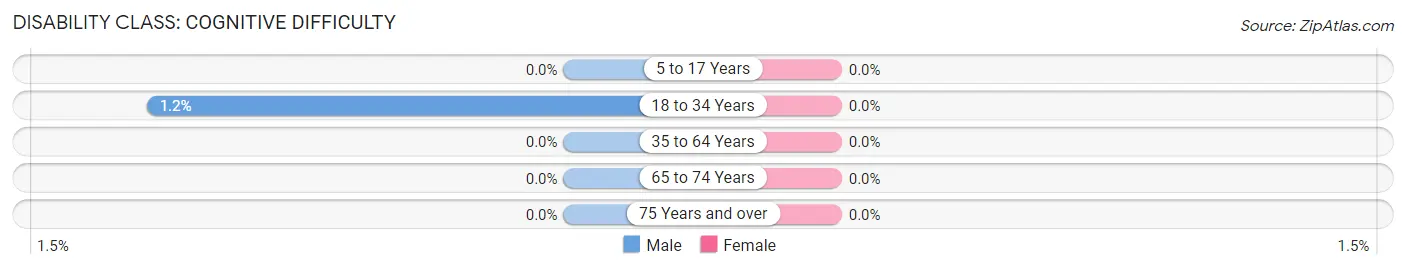
| Age Bracket | Male | Female |
| 5 to 17 Years | 0 (0.0%) | 0 (0.0%) |
| 18 to 34 Years | 1 (1.2%) | 0 (0.0%) |
| 35 to 64 Years | 0 (0.0%) | 0 (0.0%) |
| 65 to 74 Years | 0 (0.0%) | 0 (0.0%) |
| 75 Years and over | 0 (0.0%) | 0 (0.0%) |
Disability Class: Ambulatory Difficulty
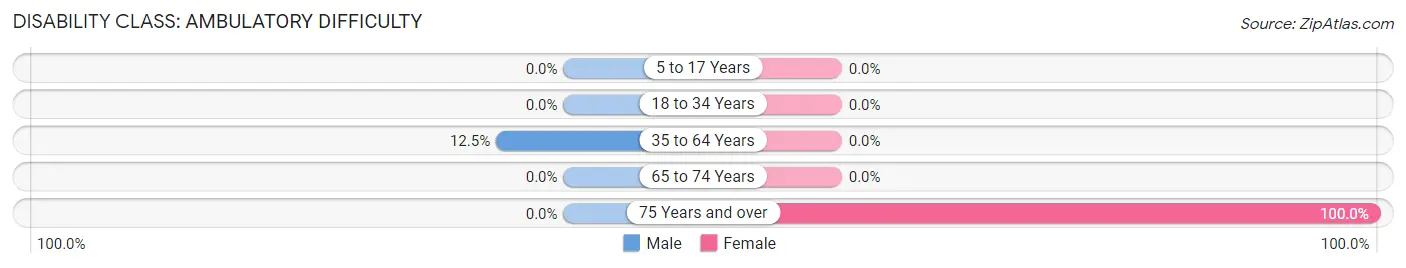
| Age Bracket | Male | Female |
| 5 to 17 Years | 0 (0.0%) | 0 (0.0%) |
| 18 to 34 Years | 0 (0.0%) | 0 (0.0%) |
| 35 to 64 Years | 1 (12.5%) | 0 (0.0%) |
| 65 to 74 Years | 0 (0.0%) | 0 (0.0%) |
| 75 Years and over | 0 (0.0%) | 1 (100.0%) |
Disability Class: Self-Care Difficulty
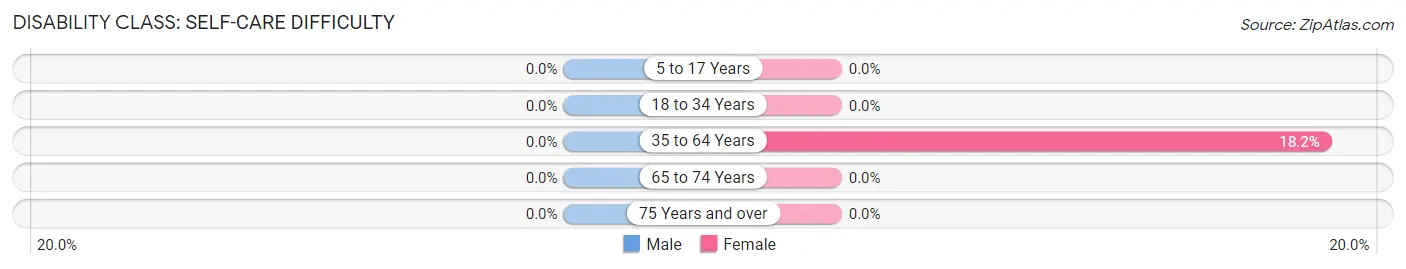
| Age Bracket | Male | Female |
| 5 to 17 Years | 0 (0.0%) | 0 (0.0%) |
| 18 to 34 Years | 0 (0.0%) | 0 (0.0%) |
| 35 to 64 Years | 0 (0.0%) | 2 (18.2%) |
| 65 to 74 Years | 0 (0.0%) | 0 (0.0%) |
| 75 Years and over | 0 (0.0%) | 0 (0.0%) |
Technology Access in Cleveland
Computing Device Access in Cleveland
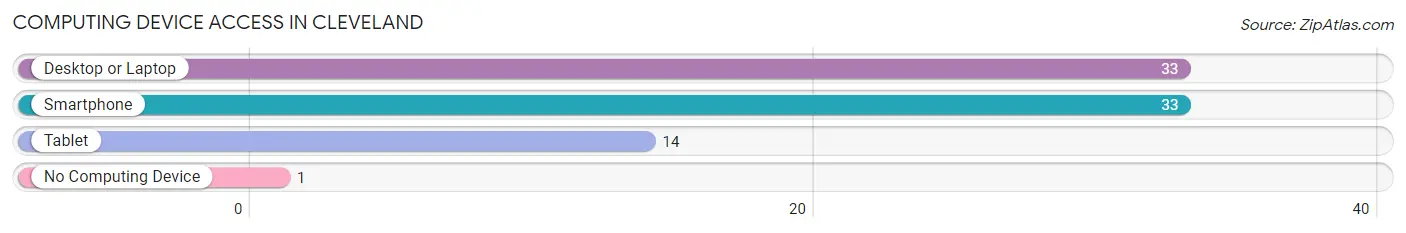
| Device Type | # Households | % Households |
| Desktop or Laptop | 33 | 94.3% |
| Smartphone | 33 | 94.3% |
| Tablet | 14 | 40.0% |
| No Computing Device | 1 | 2.9% |
| Total | 35 | 100.0% |
Internet Access in Cleveland

| Internet Type | # Households | % Households |
| Dial-Up Internet | 0 | 0.0% |
| Broadband Home | 33 | 94.3% |
| Cellular Data Only | 0 | 0.0% |
| Satellite Internet | 1 | 2.9% |
| No Internet | 1 | 2.9% |
| Total | 35 | 100.0% |
Cleveland Summary
Cleveland is a small city located in the state of North Dakota. It is situated in the southeastern corner of the state, near the border with Minnesota. The city has a population of approximately 1,000 people, and is the county seat of Stutsman County.
Geography
Cleveland is located in the Red River Valley, a flat, fertile region of the Great Plains. The city is situated on the banks of the James River, which flows through the city and is a major source of water for the area. The city is surrounded by rolling hills and prairies, and is located near the Sheyenne River. The climate in Cleveland is continental, with cold winters and hot summers.
Economy
Cleveland’s economy is largely based on agriculture. The city is home to several large farms, and the surrounding area is known for its production of wheat, corn, and other grains. The city is also home to several manufacturing companies, including a furniture factory and a plastics plant. The city is also home to several small businesses, including restaurants, retail stores, and service providers.
Demographics
As of the 2010 census, the population of Cleveland was 1,000 people. The racial makeup of the city was 97.2% White, 0.7% African American, 0.3% Native American, 0.2% Asian, 0.1% Pacific Islander, and 1.5% from two or more races. The median household income in Cleveland was $41,250, and the median family income was $50,000.
History
Cleveland was founded in 1883, and was named after President Grover Cleveland. The city was originally a farming community, and the surrounding area was known for its production of wheat and other grains. In the early 1900s, the city began to grow and develop, and several businesses were established in the area. The city was incorporated in 1910, and the population began to grow steadily. In the 1950s, the city began to experience a decline in population, but in recent years the population has begun to increase again.
Cleveland is a small city with a rich history and a bright future. The city is home to a diverse population, and the economy is largely based on agriculture and manufacturing. The city is surrounded by rolling hills and prairies, and is located near the James River. The city is a great place to live, work, and raise a family, and is a great example of the beauty and culture of North Dakota.
Common Questions
What is Per Capita Income in Cleveland?
Per Capita income in Cleveland is $30,423.
What is the Median Family Income in Cleveland?
Median Family Income in Cleveland is $49,444.
What is the Median Household income in Cleveland?
Median Household Income in Cleveland is $49,028.
What is Income or Wage Gap in Cleveland?
Income or Wage Gap in Cleveland is 17.8%.
Women in Cleveland earn 82.2 cents for every dollar earned by a man.
What is Inequality or Gini Index in Cleveland?
Inequality or Gini Index in Cleveland is 0.29.
What is the Total Population of Cleveland?
Total Population of Cleveland is 119.
What is the Total Male Population of Cleveland?
Total Male Population of Cleveland is 99.
What is the Total Female Population of Cleveland?
Total Female Population of Cleveland is 20.
What is the Ratio of Males per 100 Females in Cleveland?
There are 495.00 Males per 100 Females in Cleveland.
What is the Ratio of Females per 100 Males in Cleveland?
There are 20.20 Females per 100 Males in Cleveland.
What is the Median Population Age in Cleveland?
Median Population Age in Cleveland is 26.6 Years.
What is the Average Family Size in Cleveland
Average Family Size in Cleveland is 5.5 People.
What is the Average Household Size in Cleveland
Average Household Size in Cleveland is 3.4 People.
How Large is the Labor Force in Cleveland?
There are 105 People in the Labor Forcein in Cleveland.
What is the Percentage of People in the Labor Force in Cleveland?
90.5% of People are in the Labor Force in Cleveland.
What is the Unemployment Rate in Cleveland?
Unemployment Rate in Cleveland is 1.9%.