Selma, IN Map & Demographics
Selma Map
Selma Overview
$24,315
PER CAPITA INCOME
$73,462
AVG FAMILY INCOME
$54,167
AVG HOUSEHOLD INCOME
72.5%
WAGE / INCOME GAP [ % ]
27.5¢/ $1
WAGE / INCOME GAP [ $ ]
$10,621
FAMILY INCOME DEFICIT
0.36
INEQUALITY / GINI INDEX
859
TOTAL POPULATION
432
MALE POPULATION
427
FEMALE POPULATION
101.17
MALES / 100 FEMALES
98.84
FEMALES / 100 MALES
34.1
MEDIAN AGE
3.0
AVG FAMILY SIZE
2.6
AVG HOUSEHOLD SIZE
459
LABOR FORCE [ PEOPLE ]
68.3%
PERCENT IN LABOR FORCE
9.2%
UNEMPLOYMENT RATE
Selma Zip Codes
Selma Area Codes
Income in Selma
Income Overview in Selma
Per Capita Income in Selma is $24,315, while median incomes of families and households are $73,462 and $54,167 respectively.
| Characteristic | Number | Measure |
| Per Capita Income | 859 | $24,315 |
| Median Family Income | 248 | $73,462 |
| Mean Family Income | 248 | $72,194 |
| Median Household Income | 322 | $54,167 |
| Mean Household Income | 322 | $64,637 |
| Income Deficit | 248 | $10,621 |
| Wage / Income Gap (%) | 859 | 72.48% |
| Wage / Income Gap ($) | 859 | 27.52¢ per $1 |
| Gini / Inequality Index | 859 | 0.36 |
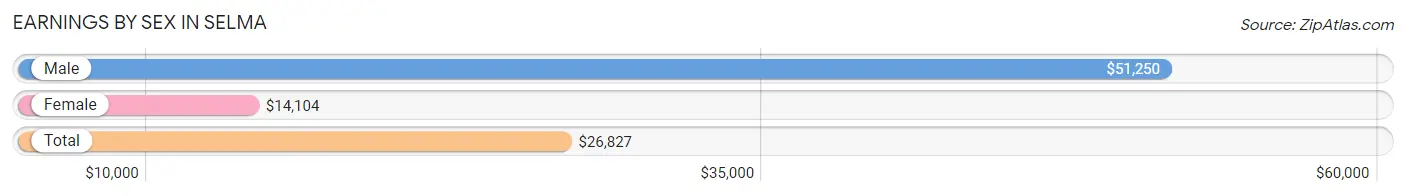
Earnings by Sex in Selma
Average Earnings in Selma are $26,827, $51,250 for men and $14,104 for women, a difference of 72.5%.
| Sex | Number | Average Earnings |
| Male | 250 (54.0%) | $51,250 |
| Female | 213 (46.0%) | $14,104 |
| Total | 463 (100.0%) | $26,827 |
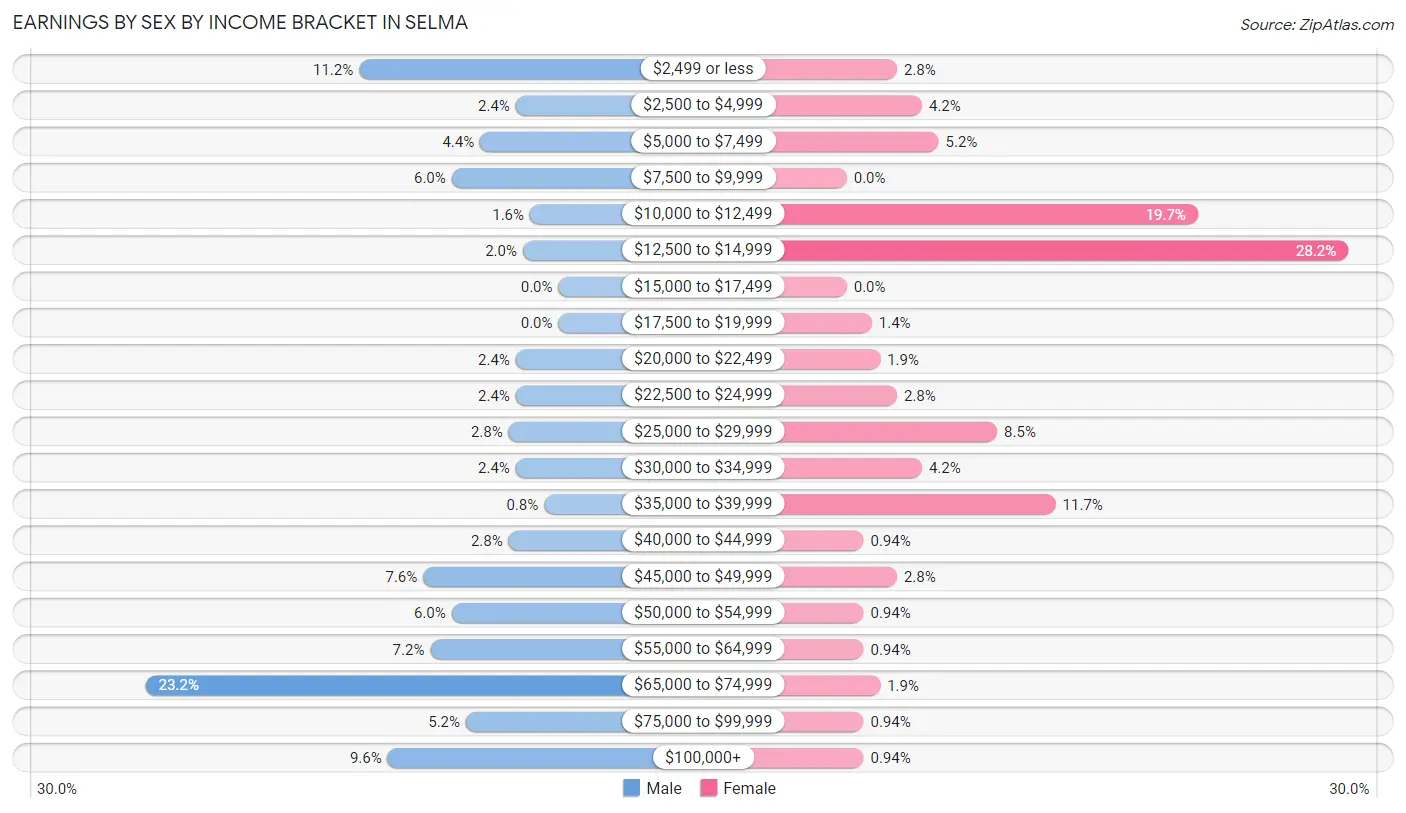
Earnings by Sex by Income Bracket in Selma
The most common earnings brackets in Selma are $65,000 to $74,999 for men (58 | 23.2%) and $12,500 to $14,999 for women (60 | 28.2%).
| Income | Male | Female |
| $2,499 or less | 28 (11.2%) | 6 (2.8%) |
| $2,500 to $4,999 | 6 (2.4%) | 9 (4.2%) |
| $5,000 to $7,499 | 11 (4.4%) | 11 (5.2%) |
| $7,500 to $9,999 | 15 (6.0%) | 0 (0.0%) |
| $10,000 to $12,499 | 4 (1.6%) | 42 (19.7%) |
| $12,500 to $14,999 | 5 (2.0%) | 60 (28.2%) |
| $15,000 to $17,499 | 0 (0.0%) | 0 (0.0%) |
| $17,500 to $19,999 | 0 (0.0%) | 3 (1.4%) |
| $20,000 to $22,499 | 6 (2.4%) | 4 (1.9%) |
| $22,500 to $24,999 | 6 (2.4%) | 6 (2.8%) |
| $25,000 to $29,999 | 7 (2.8%) | 18 (8.5%) |
| $30,000 to $34,999 | 6 (2.4%) | 9 (4.2%) |
| $35,000 to $39,999 | 2 (0.8%) | 25 (11.7%) |
| $40,000 to $44,999 | 7 (2.8%) | 2 (0.9%) |
| $45,000 to $49,999 | 19 (7.6%) | 6 (2.8%) |
| $50,000 to $54,999 | 15 (6.0%) | 2 (0.9%) |
| $55,000 to $64,999 | 18 (7.2%) | 2 (0.9%) |
| $65,000 to $74,999 | 58 (23.2%) | 4 (1.9%) |
| $75,000 to $99,999 | 13 (5.2%) | 2 (0.9%) |
| $100,000+ | 24 (9.6%) | 2 (0.9%) |
| Total | 250 (100.0%) | 213 (100.0%) |
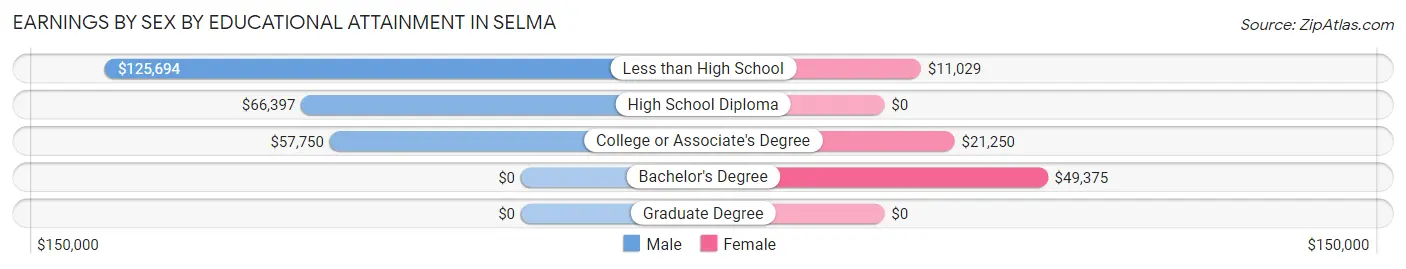
Earnings by Sex by Educational Attainment in Selma
Average earnings in Selma are $65,809 for men and $14,432 for women, a difference of 78.1%. Men with an educational attainment of less than high school enjoy the highest average annual earnings of $125,694, while those with college or associate's degree education earn the least with $57,750. Women with an educational attainment of bachelor's degree earn the most with the average annual earnings of $49,375, while those with less than high school education have the smallest earnings of $11,029.
| Educational Attainment | Male Income | Female Income |
| Less than High School | $125,694 | $11,029 |
| High School Diploma | $66,397 | $0 |
| College or Associate's Degree | $57,750 | $21,250 |
| Bachelor's Degree | - | - |
| Graduate Degree | - | - |
| Total | $65,809 | $14,432 |
Family Income in Selma
Family Income Brackets in Selma
According to the Selma family income data, there are 59 families falling into the $75,000 to $99,999 income range, which is the most common income bracket and makes up 23.8% of all families.
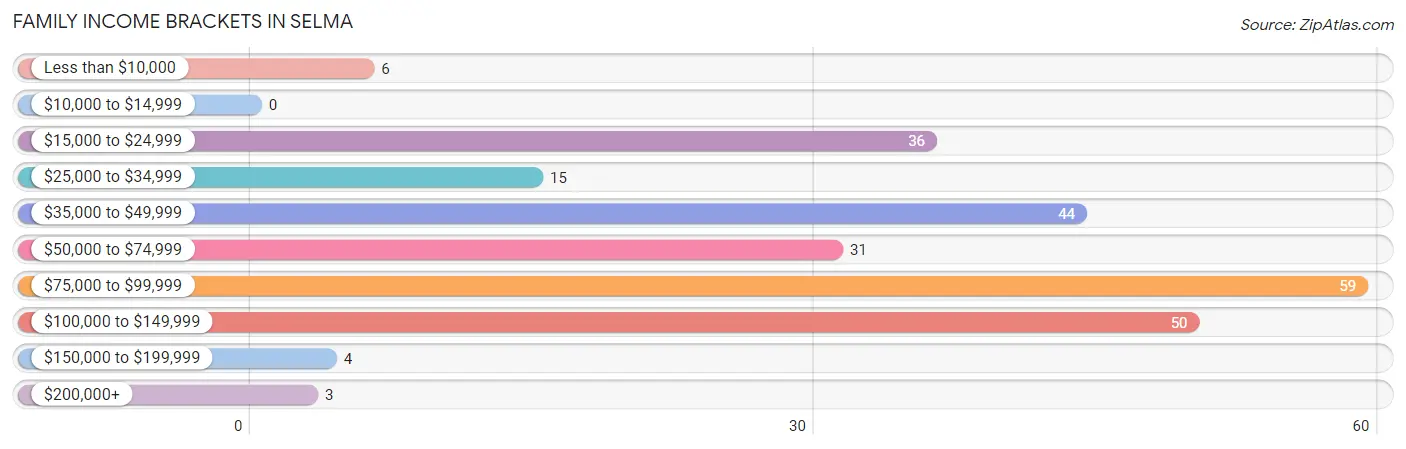
| Income Bracket | # Families | % Families |
| Less than $10,000 | 6 | 2.4% |
| $10,000 to $14,999 | 0 | 0.0% |
| $15,000 to $24,999 | 36 | 14.5% |
| $25,000 to $34,999 | 15 | 6.0% |
| $35,000 to $49,999 | 44 | 17.7% |
| $50,000 to $74,999 | 31 | 12.5% |
| $75,000 to $99,999 | 59 | 23.8% |
| $100,000 to $149,999 | 50 | 20.2% |
| $150,000 to $199,999 | 4 | 1.6% |
| $200,000+ | 3 | 1.2% |
Family Income by Famaliy Size in Selma
4-person families (40 | 16.1%) account for the highest median family income in Selma with $130,000 per family, while 2-person families (107 | 43.1%) have the highest median income of $32,812 per family member.
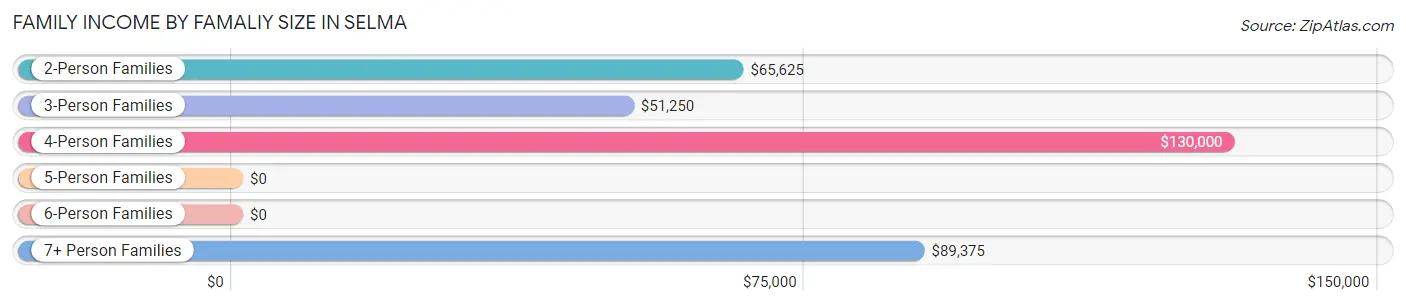
| Income Bracket | # Families | Median Income |
| 2-Person Families | 107 (43.1%) | $65,625 |
| 3-Person Families | 57 (23.0%) | $51,250 |
| 4-Person Families | 40 (16.1%) | $130,000 |
| 5-Person Families | 26 (10.5%) | $0 |
| 6-Person Families | 8 (3.2%) | $0 |
| 7+ Person Families | 10 (4.0%) | $89,375 |
| Total | 248 (100.0%) | $73,462 |
Family Income by Number of Earners in Selma
The median family income in Selma is $73,462, with families comprising 3+ earners (22) having the highest median family income of $131,944, while families with 1 earner (56) have the lowest median family income of $39,722, accounting for 8.9% and 22.6% of families, respectively.
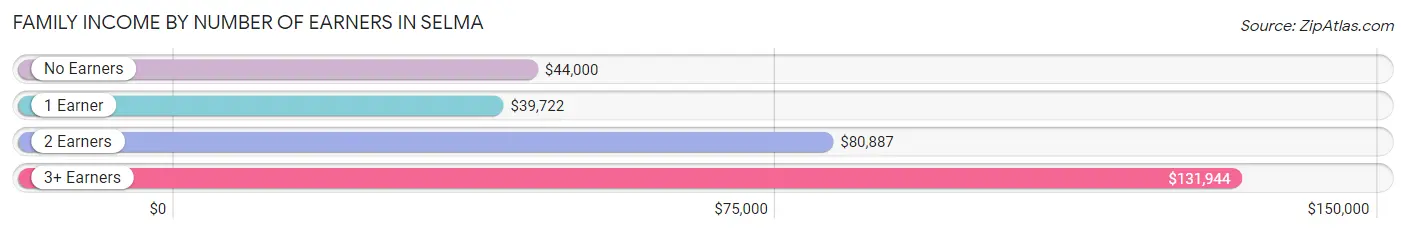
| Number of Earners | # Families | Median Income |
| No Earners | 32 (12.9%) | $44,000 |
| 1 Earner | 56 (22.6%) | $39,722 |
| 2 Earners | 138 (55.6%) | $80,887 |
| 3+ Earners | 22 (8.9%) | $131,944 |
| Total | 248 (100.0%) | $73,462 |
Household Income in Selma
Household Income Brackets in Selma
With 59 households falling in the category, the $75,000 to $99,999 income range is the most frequent in Selma, accounting for 18.3% of all households. In contrast, only 3 households (0.9%) fall into the $200,000+ income bracket, making it the least populous group.
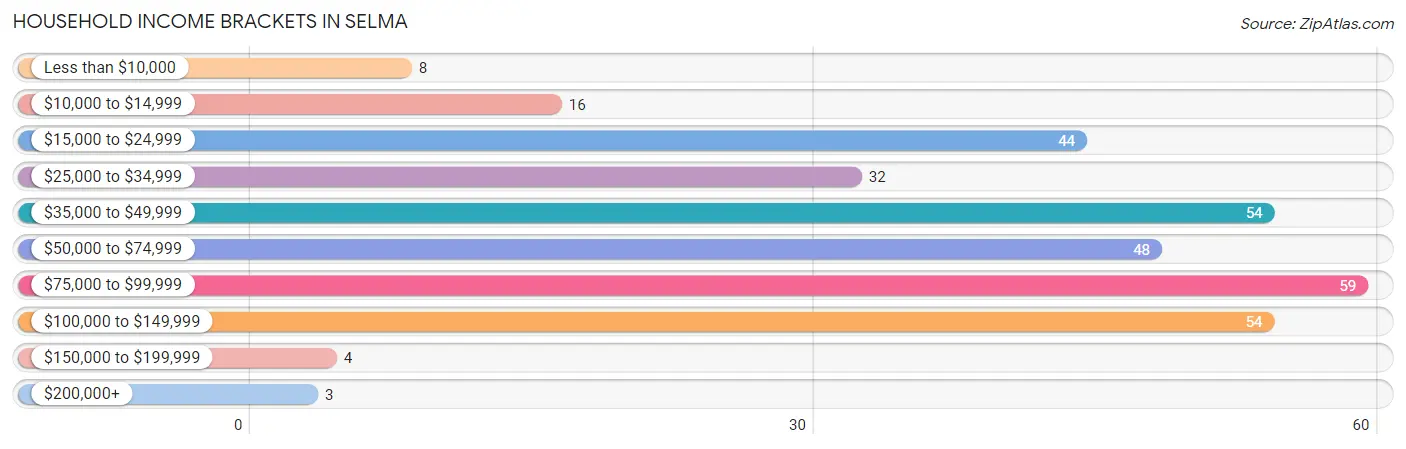
| Income Bracket | # Households | % Households |
| Less than $10,000 | 8 | 2.5% |
| $10,000 to $14,999 | 16 | 5.0% |
| $15,000 to $24,999 | 44 | 13.7% |
| $25,000 to $34,999 | 32 | 9.9% |
| $35,000 to $49,999 | 54 | 16.8% |
| $50,000 to $74,999 | 48 | 14.9% |
| $75,000 to $99,999 | 59 | 18.3% |
| $100,000 to $149,999 | 54 | 16.8% |
| $150,000 to $199,999 | 4 | 1.2% |
| $200,000+ | 3 | 0.9% |
Household Income by Householder Age in Selma
The median household income in Selma is $54,167, with the highest median household income of $73,594 found in the 25 to 44 years age bracket for the primary householder. A total of 87 households (27.0%) fall into this category. Meanwhile, the 15 to 24 years age bracket for the primary householder has the lowest median household income of $0, with 13 households (4.0%) in this group.
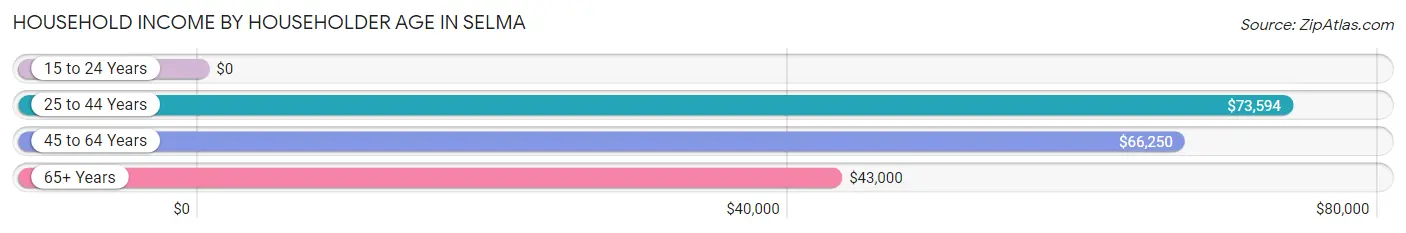
| Income Bracket | # Households | Median Income |
| 15 to 24 Years | 13 (4.0%) | $0 |
| 25 to 44 Years | 87 (27.0%) | $73,594 |
| 45 to 64 Years | 152 (47.2%) | $66,250 |
| 65+ Years | 70 (21.7%) | $43,000 |
| Total | 322 (100.0%) | $54,167 |
Poverty in Selma
Income Below Poverty by Sex and Age in Selma
With 20.8% poverty level for males and 20.8% for females among the residents of Selma, 15 year old males and 12 to 14 year old females are the most vulnerable to poverty, with 6 males (75.0%) and 10 females (71.4%) in their respective age groups living below the poverty level.
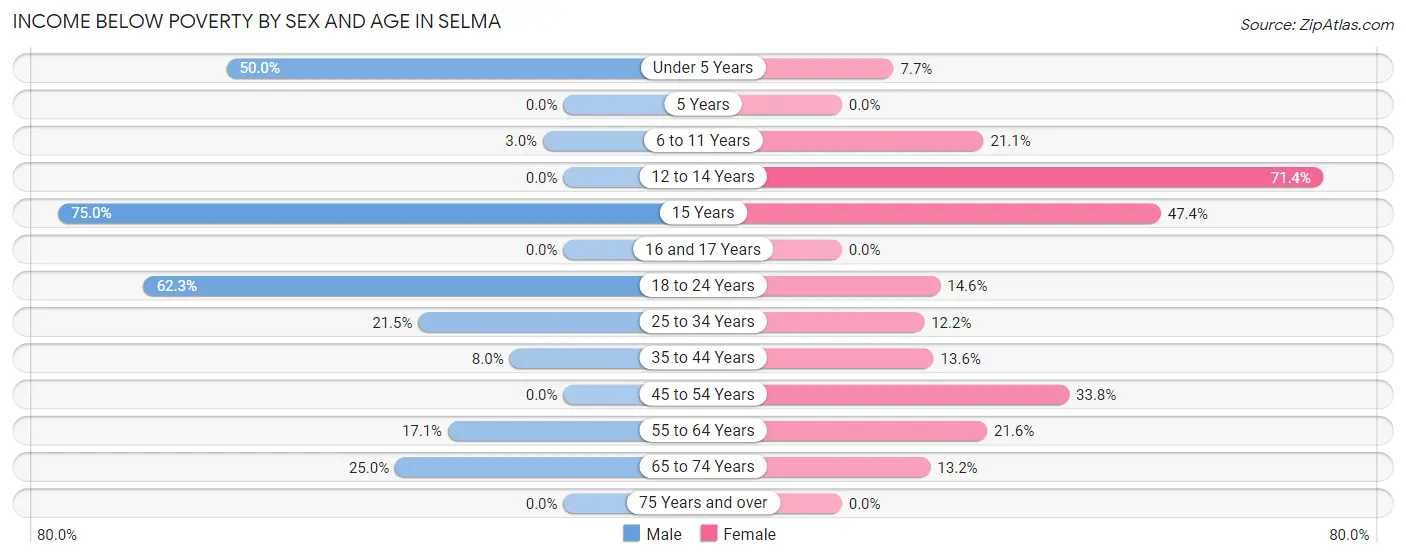
| Age Bracket | Male | Female |
| Under 5 Years | 16 (50.0%) | 1 (7.7%) |
| 5 Years | 0 (0.0%) | 0 (0.0%) |
| 6 to 11 Years | 1 (3.0%) | 8 (21.0%) |
| 12 to 14 Years | 0 (0.0%) | 10 (71.4%) |
| 15 Years | 6 (75.0%) | 9 (47.4%) |
| 16 and 17 Years | 0 (0.0%) | 0 (0.0%) |
| 18 to 24 Years | 38 (62.3%) | 6 (14.6%) |
| 25 to 34 Years | 14 (21.5%) | 6 (12.2%) |
| 35 to 44 Years | 2 (8.0%) | 6 (13.6%) |
| 45 to 54 Years | 0 (0.0%) | 27 (33.8%) |
| 55 to 64 Years | 6 (17.1%) | 11 (21.6%) |
| 65 to 74 Years | 7 (25.0%) | 5 (13.2%) |
| 75 Years and over | 0 (0.0%) | 0 (0.0%) |
| Total | 90 (20.8%) | 89 (20.8%) |
Income Above Poverty by Sex and Age in Selma
According to the poverty statistics in Selma, males aged 5 years and females aged 5 years are the age groups that are most secure financially, with 100.0% of males and 100.0% of females in these age groups living above the poverty line.
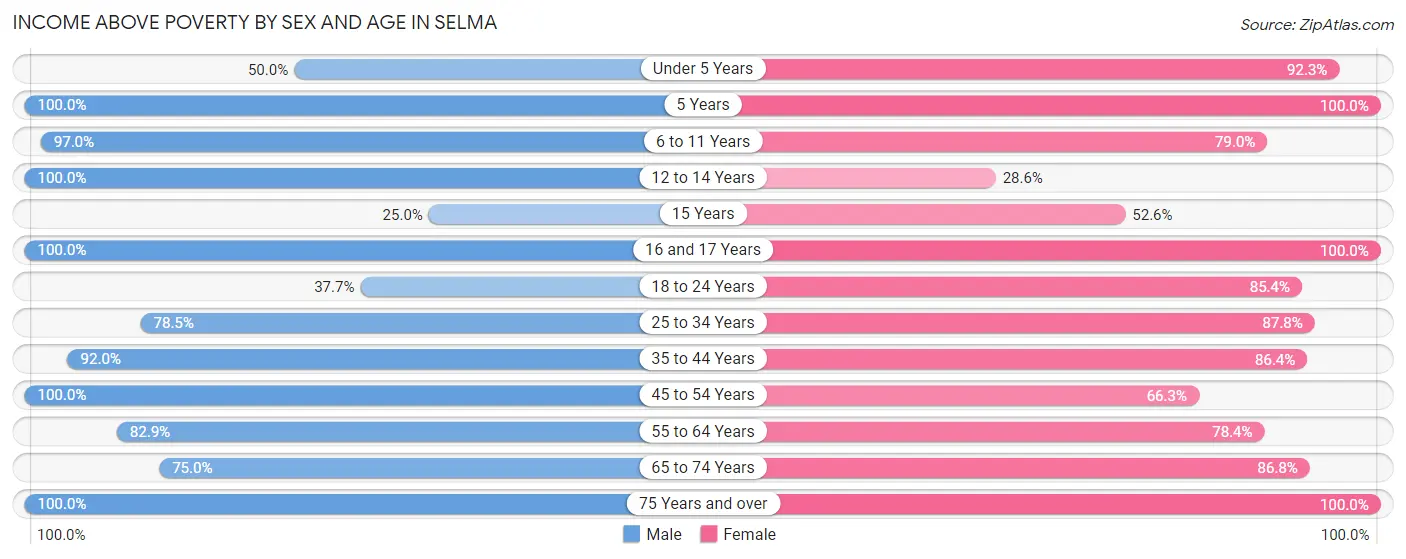
| Age Bracket | Male | Female |
| Under 5 Years | 16 (50.0%) | 12 (92.3%) |
| 5 Years | 17 (100.0%) | 8 (100.0%) |
| 6 to 11 Years | 32 (97.0%) | 30 (78.9%) |
| 12 to 14 Years | 5 (100.0%) | 4 (28.6%) |
| 15 Years | 2 (25.0%) | 10 (52.6%) |
| 16 and 17 Years | 20 (100.0%) | 11 (100.0%) |
| 18 to 24 Years | 23 (37.7%) | 35 (85.4%) |
| 25 to 34 Years | 51 (78.5%) | 43 (87.8%) |
| 35 to 44 Years | 23 (92.0%) | 38 (86.4%) |
| 45 to 54 Years | 74 (100.0%) | 53 (66.2%) |
| 55 to 64 Years | 29 (82.9%) | 40 (78.4%) |
| 65 to 74 Years | 21 (75.0%) | 33 (86.8%) |
| 75 Years and over | 29 (100.0%) | 21 (100.0%) |
| Total | 342 (79.2%) | 338 (79.2%) |
Income Below Poverty Among Married-Couple Families in Selma
The poverty statistics for married-couple families in Selma show that 6.1% or 11 of the total 180 families live below the poverty line. Families with 5 or more children have the highest poverty rate of 16.7%, comprising of 1 families. On the other hand, families with no children have the lowest poverty rate of 0.0%, which includes 0 families.
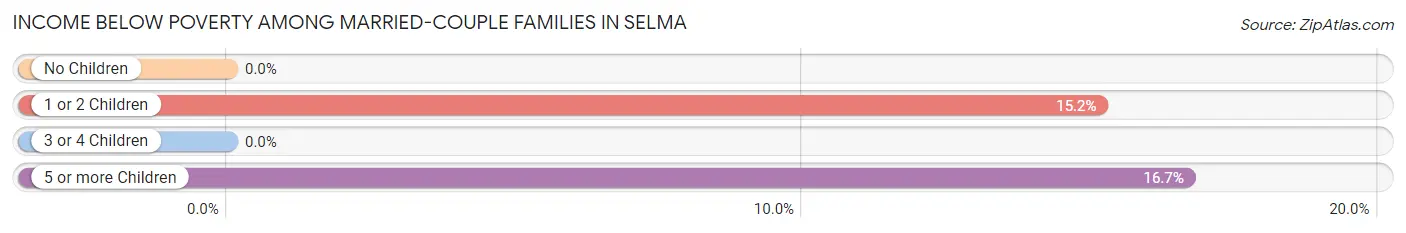
| Children | Above Poverty | Below Poverty |
| No Children | 94 (100.0%) | 0 (0.0%) |
| 1 or 2 Children | 56 (84.9%) | 10 (15.1%) |
| 3 or 4 Children | 14 (100.0%) | 0 (0.0%) |
| 5 or more Children | 5 (83.3%) | 1 (16.7%) |
| Total | 169 (93.9%) | 11 (6.1%) |
Income Below Poverty Among Single-Parent Households in Selma
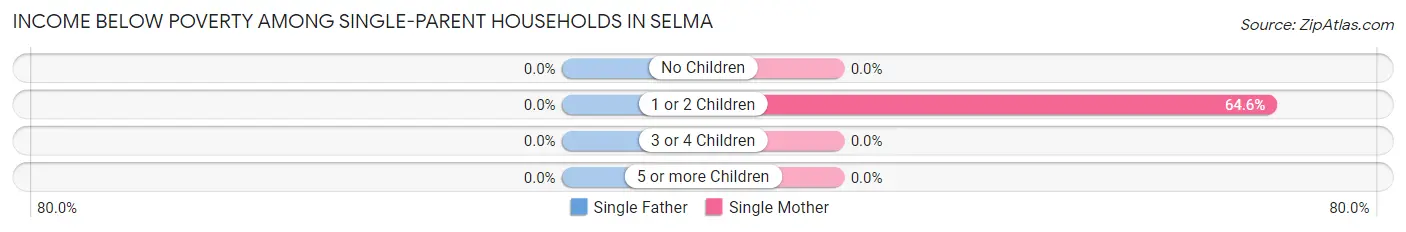
| Children | Single Father | Single Mother |
| No Children | 0 (0.0%) | 0 (0.0%) |
| 1 or 2 Children | 0 (0.0%) | 31 (64.6%) |
| 3 or 4 Children | 0 (0.0%) | 0 (0.0%) |
| 5 or more Children | 0 (0.0%) | 0 (0.0%) |
| Total | 0 (0.0%) | 31 (51.7%) |
Income Below Poverty Among Married-Couple vs Single-Parent Households in Selma
The poverty data for Selma shows that 11 of the married-couple family households (6.1%) and 31 of the single-parent households (45.6%) are living below the poverty level. Within the married-couple family households, those with 5 or more children have the highest poverty rate, with 1 households (16.7%) falling below the poverty line. Among the single-parent households, those with 1 or 2 children have the highest poverty rate, with 31 household (64.6%) living below poverty.
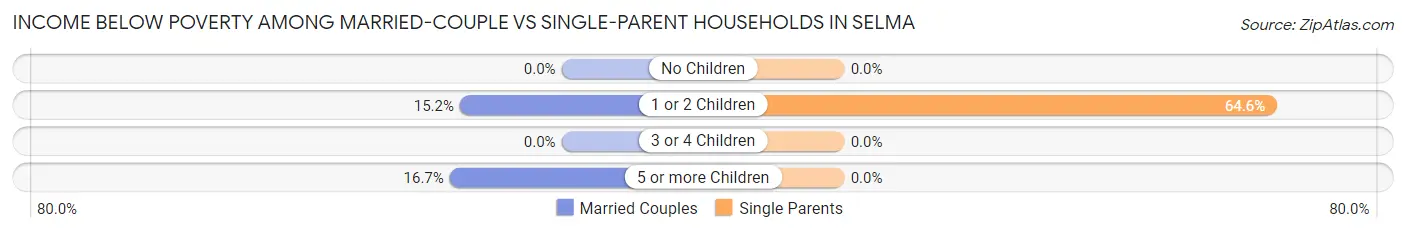
| Children | Married-Couple Families | Single-Parent Households |
| No Children | 0 (0.0%) | 0 (0.0%) |
| 1 or 2 Children | 10 (15.1%) | 31 (64.6%) |
| 3 or 4 Children | 0 (0.0%) | 0 (0.0%) |
| 5 or more Children | 1 (16.7%) | 0 (0.0%) |
| Total | 11 (6.1%) | 31 (45.6%) |
Race in Selma
The most populous races in Selma are White / Caucasian (809 | 94.2%), Two or more Races (45 | 5.2%), and Hispanic or Latino (7 | 0.8%).
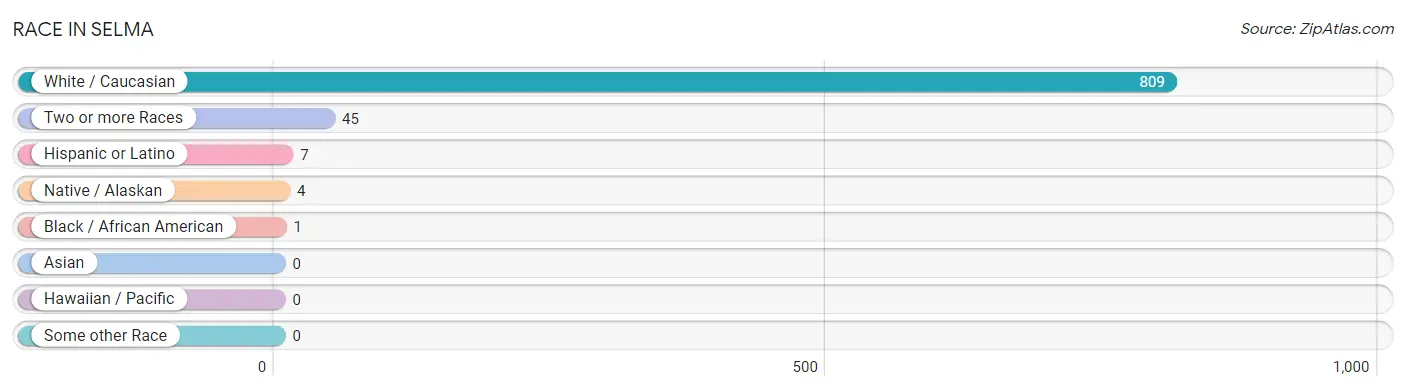
| Race | # Population | % Population |
| Asian | 0 | 0.0% |
| Black / African American | 1 | 0.1% |
| Hawaiian / Pacific | 0 | 0.0% |
| Hispanic or Latino | 7 | 0.8% |
| Native / Alaskan | 4 | 0.5% |
| White / Caucasian | 809 | 94.2% |
| Two or more Races | 45 | 5.2% |
| Some other Race | 0 | 0.0% |
| Total | 859 | 100.0% |
Ancestry in Selma
The most populous ancestries reported in Selma are German (141 | 16.4%), English (80 | 9.3%), American (71 | 8.3%), Irish (64 | 7.4%), and Subsaharan African (26 | 3.0%), together accounting for 44.5% of all Selma residents.
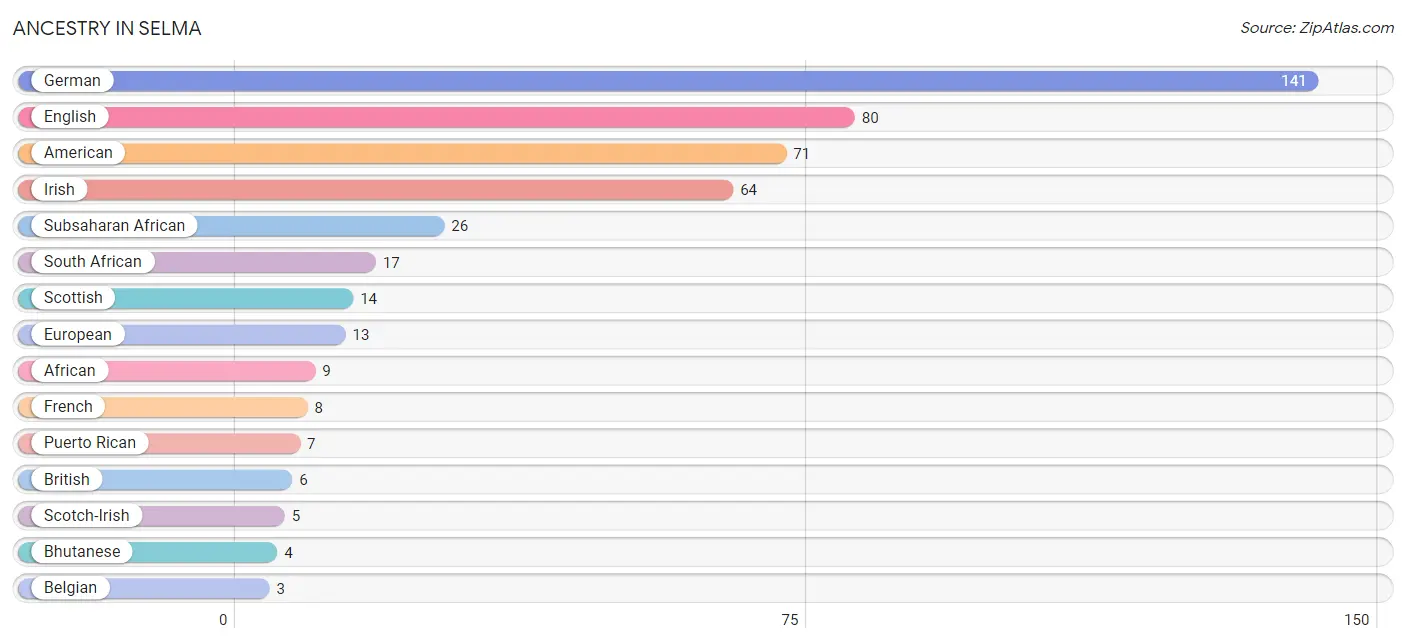
| Ancestry | # Population | % Population |
| African | 9 | 1.1% |
| American | 71 | 8.3% |
| Belgian | 3 | 0.4% |
| Bhutanese | 4 | 0.5% |
| British | 6 | 0.7% |
| Cherokee | 2 | 0.2% |
| Dutch | 2 | 0.2% |
| English | 80 | 9.3% |
| European | 13 | 1.5% |
| French | 8 | 0.9% |
| French Canadian | 2 | 0.2% |
| German | 141 | 16.4% |
| Irish | 64 | 7.4% |
| Korean | 2 | 0.2% |
| Polish | 1 | 0.1% |
| Puerto Rican | 7 | 0.8% |
| Scandinavian | 2 | 0.2% |
| Scotch-Irish | 5 | 0.6% |
| Scottish | 14 | 1.6% |
| Sioux | 2 | 0.2% |
| South African | 17 | 2.0% |
| Subsaharan African | 26 | 3.0% |
| Welsh | 3 | 0.4% | View All 23 Rows |
Immigrants in Selma
The most numerous immigrant groups reported in Selma came from Africa (4 | 0.5%), South Africa (4 | 0.5%), England (3 | 0.4%), Europe (3 | 0.4%), and Northern Europe (3 | 0.4%), together accounting for 2.0% of all Selma residents.
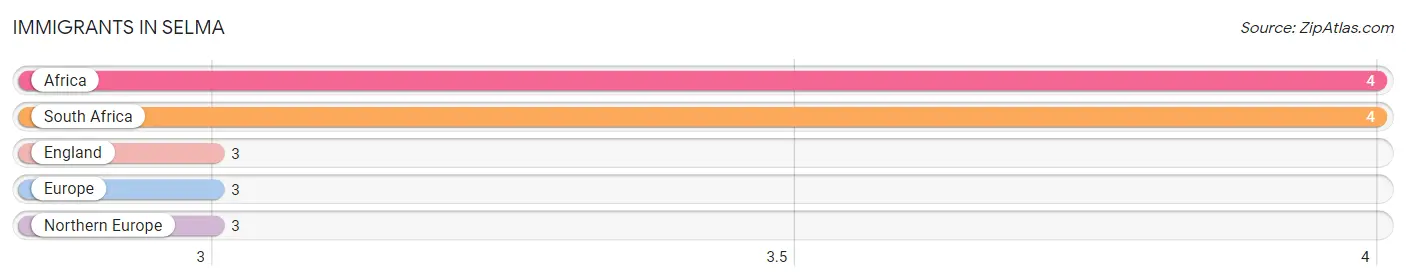
| Immigration Origin | # Population | % Population |
| Africa | 4 | 0.5% |
| England | 3 | 0.4% |
| Europe | 3 | 0.4% |
| Northern Europe | 3 | 0.4% |
| South Africa | 4 | 0.5% | View All 5 Rows |
Sex and Age in Selma
Sex and Age in Selma
The most populous age groups in Selma are 20 to 24 Years (54 | 12.5%) for men and 15 to 19 Years (52 | 12.2%) for women.
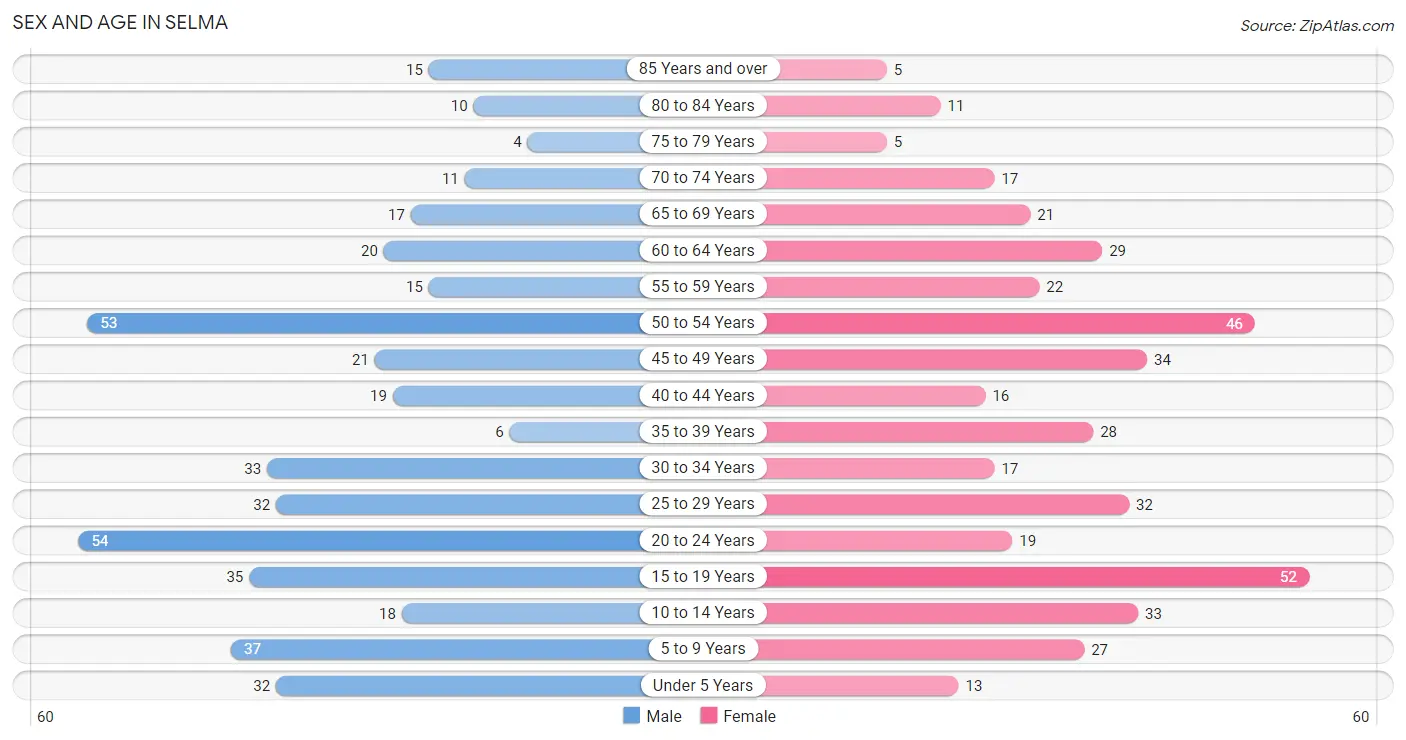
| Age Bracket | Male | Female |
| Under 5 Years | 32 (7.4%) | 13 (3.0%) |
| 5 to 9 Years | 37 (8.6%) | 27 (6.3%) |
| 10 to 14 Years | 18 (4.2%) | 33 (7.7%) |
| 15 to 19 Years | 35 (8.1%) | 52 (12.2%) |
| 20 to 24 Years | 54 (12.5%) | 19 (4.4%) |
| 25 to 29 Years | 32 (7.4%) | 32 (7.5%) |
| 30 to 34 Years | 33 (7.6%) | 17 (4.0%) |
| 35 to 39 Years | 6 (1.4%) | 28 (6.6%) |
| 40 to 44 Years | 19 (4.4%) | 16 (3.7%) |
| 45 to 49 Years | 21 (4.9%) | 34 (8.0%) |
| 50 to 54 Years | 53 (12.3%) | 46 (10.8%) |
| 55 to 59 Years | 15 (3.5%) | 22 (5.1%) |
| 60 to 64 Years | 20 (4.6%) | 29 (6.8%) |
| 65 to 69 Years | 17 (3.9%) | 21 (4.9%) |
| 70 to 74 Years | 11 (2.5%) | 17 (4.0%) |
| 75 to 79 Years | 4 (0.9%) | 5 (1.2%) |
| 80 to 84 Years | 10 (2.3%) | 11 (2.6%) |
| 85 Years and over | 15 (3.5%) | 5 (1.2%) |
| Total | 432 (100.0%) | 427 (100.0%) |
Families and Households in Selma
Median Family Size in Selma
The median family size in Selma is 2.98 persons per family, with married-couple families (180 | 72.6%) accounting for the largest median family size of 3.08 persons per family. On the other hand, single male/father families (8 | 3.2%) represent the smallest median family size with 2.00 persons per family.
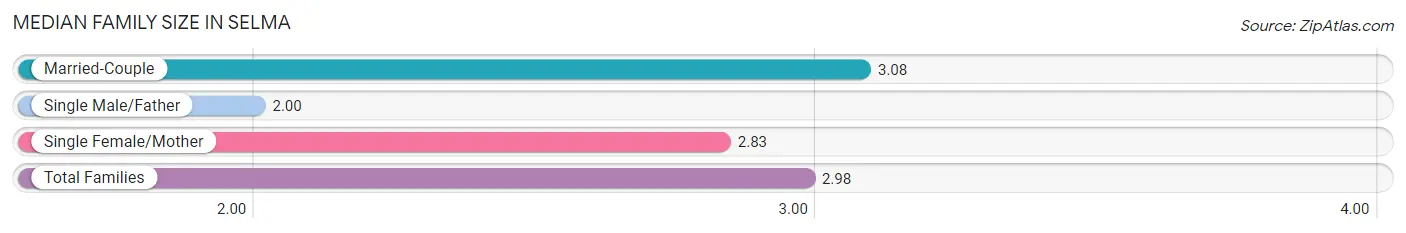
| Family Type | # Families | Family Size |
| Married-Couple | 180 (72.6%) | 3.08 |
| Single Male/Father | 8 (3.2%) | 2.00 |
| Single Female/Mother | 60 (24.2%) | 2.83 |
| Total Families | 248 (100.0%) | 2.98 |
Median Household Size in Selma
The median household size in Selma is 2.63 persons per household, with married-couple households (180 | 55.9%) accounting for the largest median household size of 3.08 persons per household. non-family households (74 | 23.0%) represent the smallest median household size with 1.43 persons per household.
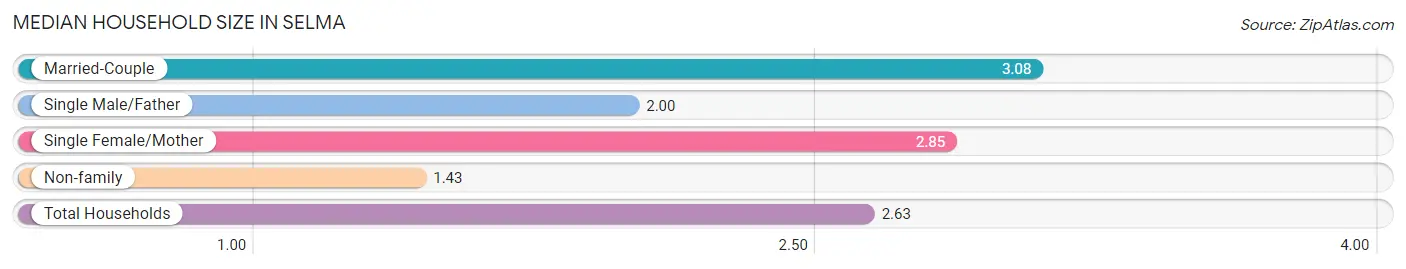
| Household Type | # Households | Household Size |
| Married-Couple | 180 (55.9%) | 3.08 |
| Single Male/Father | 8 (2.5%) | 2.00 |
| Single Female/Mother | 60 (18.6%) | 2.85 |
| Non-family | 74 (23.0%) | 1.43 |
| Total Households | 322 (100.0%) | 2.63 |
Household Size by Marriage Status in Selma
Out of a total of 322 households in Selma, 248 (77.0%) are family households, while 74 (23.0%) are nonfamily households. The most numerous type of family households are 2-person households, comprising 107, and the most common type of nonfamily households are 1-person households, comprising 45.
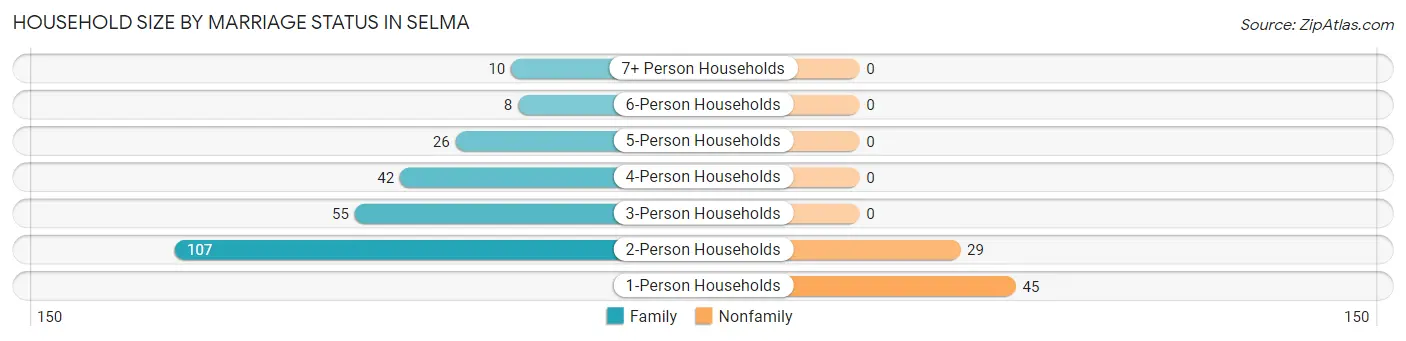
| Household Size | Family Households | Nonfamily Households |
| 1-Person Households | - | 45 (14.0%) |
| 2-Person Households | 107 (33.2%) | 29 (9.0%) |
| 3-Person Households | 55 (17.1%) | 0 (0.0%) |
| 4-Person Households | 42 (13.0%) | 0 (0.0%) |
| 5-Person Households | 26 (8.1%) | 0 (0.0%) |
| 6-Person Households | 8 (2.5%) | 0 (0.0%) |
| 7+ Person Households | 10 (3.1%) | 0 (0.0%) |
| Total | 248 (77.0%) | 74 (23.0%) |
Female Fertility in Selma
Fertility by Age in Selma
Average fertility rate in Selma is 22.0 births per 1,000 women. Women in the age bracket of 20 to 34 years have the highest fertility rate with 74.0 births per 1,000 women. Women in the age bracket of 20 to 34 years acount for 100.0% of all women with births.
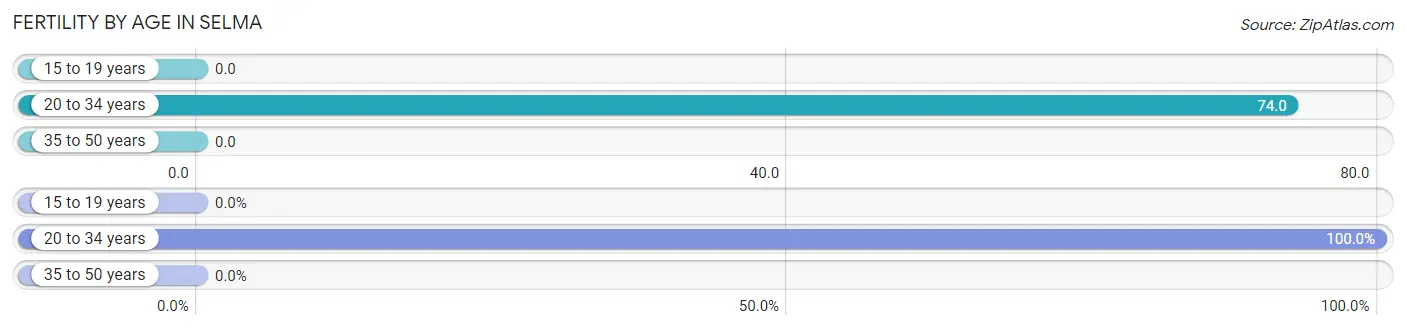
| Age Bracket | Women with Births | Births / 1,000 Women |
| 15 to 19 years | 0 (0.0%) | 0.0 |
| 20 to 34 years | 5 (100.0%) | 74.0 |
| 35 to 50 years | 0 (0.0%) | 0.0 |
| Total | 5 (100.0%) | 22.0 |
Fertility by Age by Marriage Status in Selma
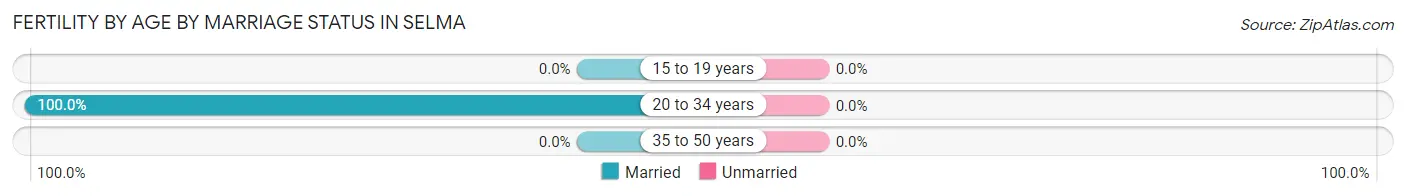
| Age Bracket | Married | Unmarried |
| 15 to 19 years | 0 (0.0%) | 0 (0.0%) |
| 20 to 34 years | 5 (100.0%) | 0 (0.0%) |
| 35 to 50 years | 0 (0.0%) | 0 (0.0%) |
| Total | 5 (100.0%) | 0 (0.0%) |
Fertility by Education in Selma
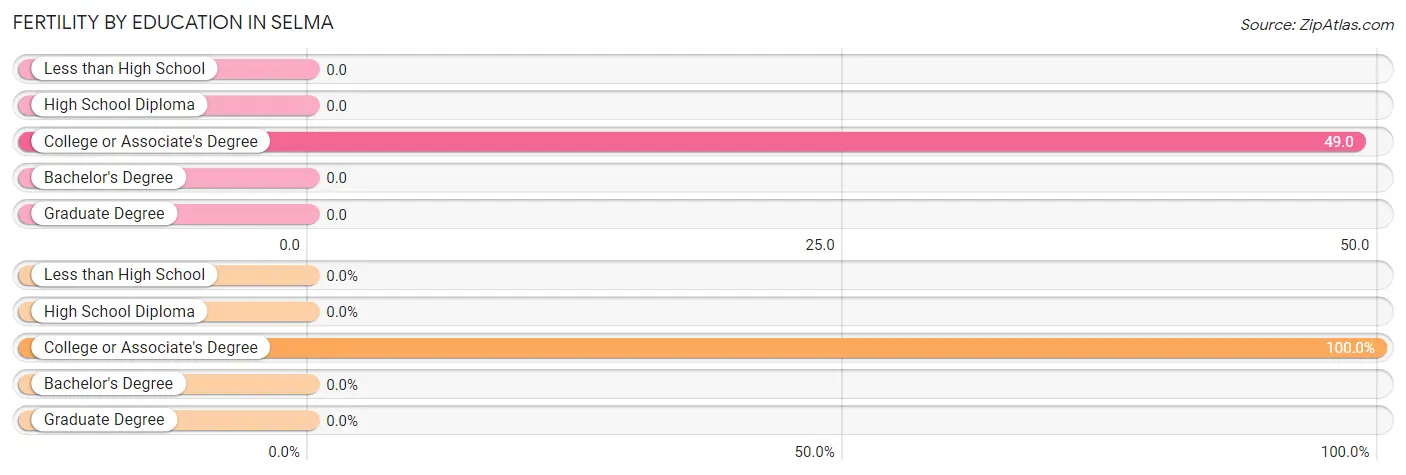
| Educational Attainment | Women with Births | Births / 1,000 Women |
| Less than High School | 0 (0.0%) | 0.0 |
| High School Diploma | 0 (0.0%) | 0.0 |
| College or Associate's Degree | 5 (100.0%) | 49.0 |
| Bachelor's Degree | 0 (0.0%) | 0.0 |
| Graduate Degree | 0 (0.0%) | 0.0 |
| Total | 5 (100.0%) | 22.0 |
Fertility by Education by Marriage Status in Selma
| Educational Attainment | Married | Unmarried |
| Less than High School | 0 (0.0%) | 0 (0.0%) |
| High School Diploma | 0 (0.0%) | 0 (0.0%) |
| College or Associate's Degree | 5 (100.0%) | 0 (0.0%) |
| Bachelor's Degree | 0 (0.0%) | 0 (0.0%) |
| Graduate Degree | 0 (0.0%) | 0 (0.0%) |
| Total | 5 (100.0%) | 0 (0.0%) |
Employment Characteristics in Selma
Employment by Class of Employer in Selma
Among the 416 employed individuals in Selma, private company employees (306 | 73.6%), state government employees (37 | 8.9%), and not-for-profit organizations (34 | 8.2%) make up the most common classes of employment.
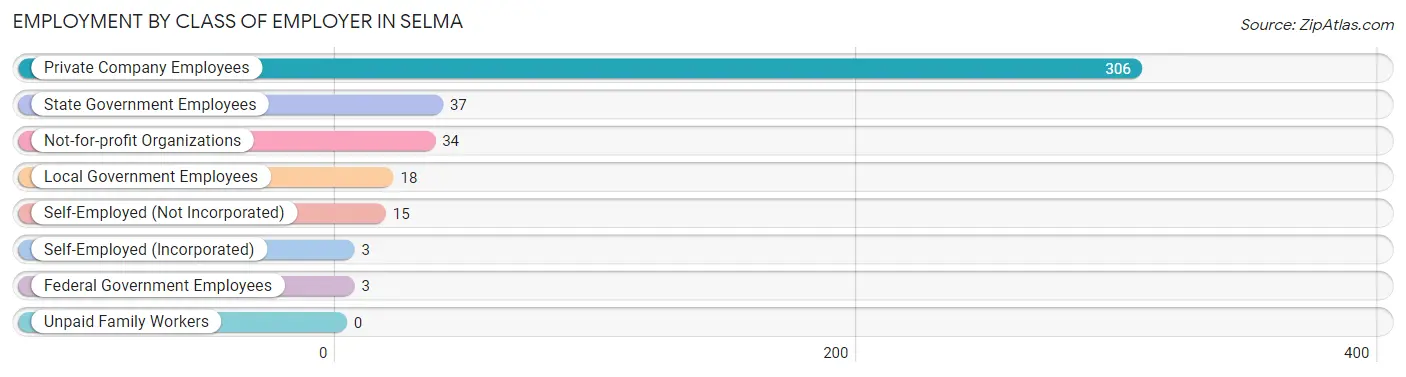
| Employer Class | # Employees | % Employees |
| Private Company Employees | 306 | 73.6% |
| Self-Employed (Incorporated) | 3 | 0.7% |
| Self-Employed (Not Incorporated) | 15 | 3.6% |
| Not-for-profit Organizations | 34 | 8.2% |
| Local Government Employees | 18 | 4.3% |
| State Government Employees | 37 | 8.9% |
| Federal Government Employees | 3 | 0.7% |
| Unpaid Family Workers | 0 | 0.0% |
| Total | 416 | 100.0% |
Employment Status by Age in Selma
According to the labor force statistics for Selma, out of the total population over 16 years of age (672), 68.3% or 459 individuals are in the labor force, with 9.2% or 42 of them unemployed. The age group with the highest labor force participation rate is 30 to 34 years, with 96.0% or 48 individuals in the labor force. Within the labor force, the 25 to 29 years age range has the highest percentage of unemployed individuals, with 28.6% or 16 of them being unemployed.
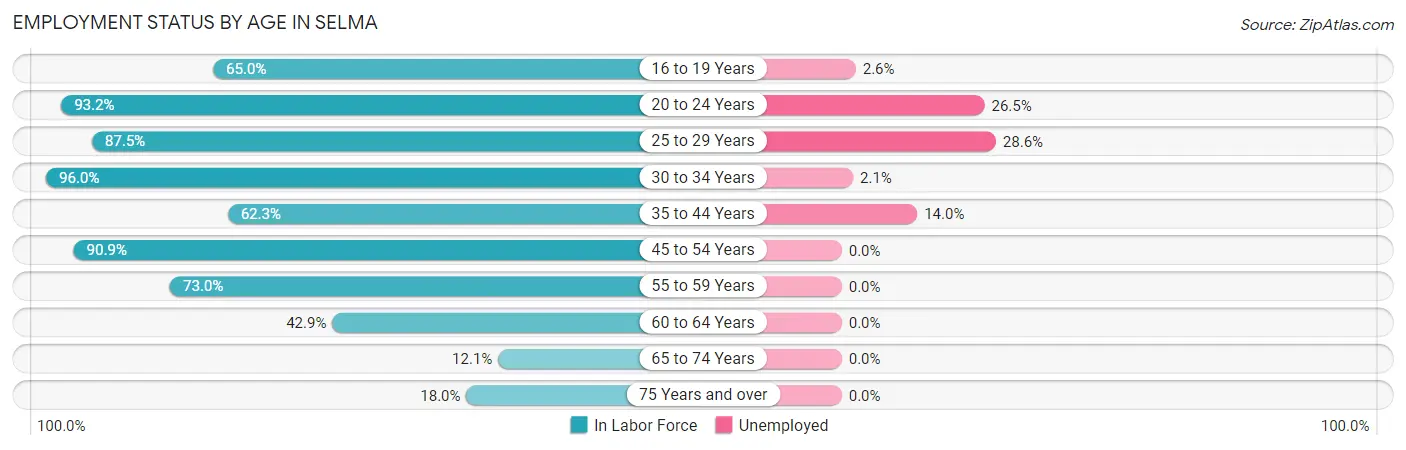
| Age Bracket | In Labor Force | Unemployed |
| 16 to 19 Years | 39 (65.0%) | 1 (2.6%) |
| 20 to 24 Years | 68 (93.2%) | 18 (26.5%) |
| 25 to 29 Years | 56 (87.5%) | 16 (28.6%) |
| 30 to 34 Years | 48 (96.0%) | 1 (2.1%) |
| 35 to 44 Years | 43 (62.3%) | 6 (14.0%) |
| 45 to 54 Years | 140 (90.9%) | 0 (0.0%) |
| 55 to 59 Years | 27 (73.0%) | 0 (0.0%) |
| 60 to 64 Years | 21 (42.9%) | 0 (0.0%) |
| 65 to 74 Years | 8 (12.1%) | 0 (0.0%) |
| 75 Years and over | 9 (18.0%) | 0 (0.0%) |
| Total | 459 (68.3%) | 42 (9.2%) |
Employment Status by Educational Attainment in Selma
According to labor force statistics for Selma, 79.2% of individuals (335) out of the total population between 25 and 64 years of age (423) are in the labor force, with 6.9% or 23 of them being unemployed. The group with the highest labor force participation rate are those with the educational attainment of less than high school, with 89.1% or 49 individuals in the labor force. Within the labor force, individuals with less than high school education have the highest percentage of unemployment, with 30.6% or 15 of them being unemployed.
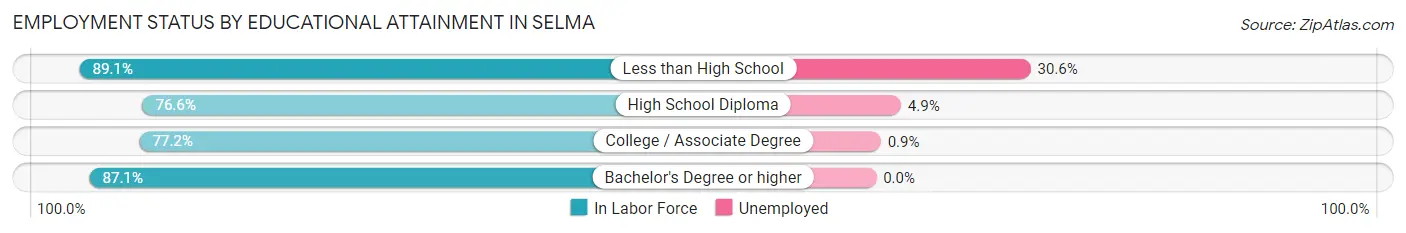
| Educational Attainment | In Labor Force | Unemployed |
| Less than High School | 49 (89.1%) | 17 (30.6%) |
| High School Diploma | 144 (76.6%) | 9 (4.9%) |
| College / Associate Degree | 115 (77.2%) | 1 (0.9%) |
| Bachelor's Degree or higher | 27 (87.1%) | 0 (0.0%) |
| Total | 335 (79.2%) | 29 (6.9%) |
Employment Occupations by Sex in Selma
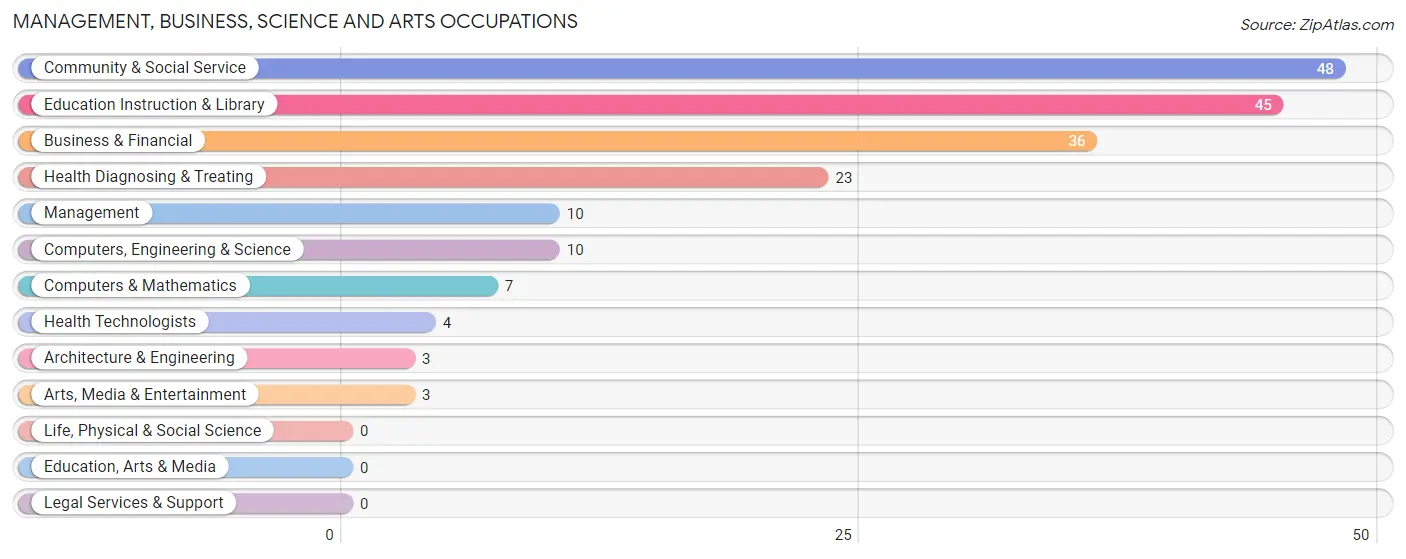
Management, Business, Science and Arts Occupations
The most common Management, Business, Science and Arts occupations in Selma are Community & Social Service (48 | 11.5%), Education Instruction & Library (45 | 10.8%), Business & Financial (36 | 8.6%), Health Diagnosing & Treating (23 | 5.5%), and Management (10 | 2.4%).
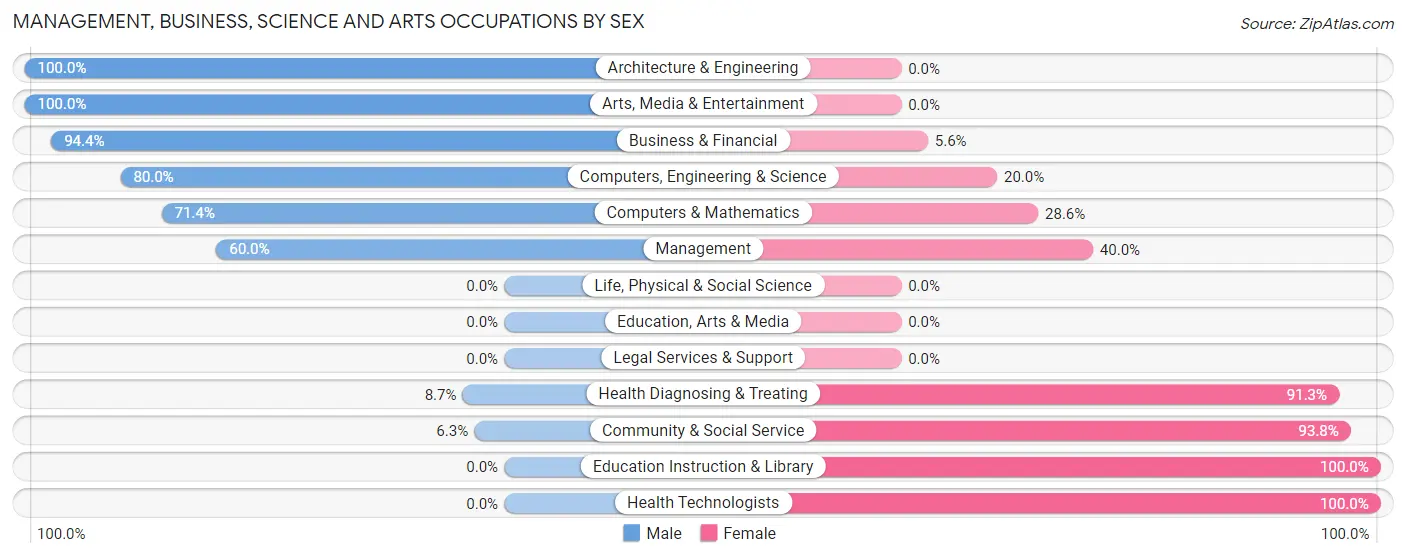
Management, Business, Science and Arts Occupations by Sex
Within the Management, Business, Science and Arts occupations in Selma, the most male-oriented occupations are Architecture & Engineering (100.0%), Arts, Media & Entertainment (100.0%), and Business & Financial (94.4%), while the most female-oriented occupations are Education Instruction & Library (100.0%), Health Technologists (100.0%), and Community & Social Service (93.8%).
| Occupation | Male | Female |
| Management | 6 (60.0%) | 4 (40.0%) |
| Business & Financial | 34 (94.4%) | 2 (5.6%) |
| Computers, Engineering & Science | 8 (80.0%) | 2 (20.0%) |
| Computers & Mathematics | 5 (71.4%) | 2 (28.6%) |
| Architecture & Engineering | 3 (100.0%) | 0 (0.0%) |
| Life, Physical & Social Science | 0 (0.0%) | 0 (0.0%) |
| Community & Social Service | 3 (6.2%) | 45 (93.8%) |
| Education, Arts & Media | 0 (0.0%) | 0 (0.0%) |
| Legal Services & Support | 0 (0.0%) | 0 (0.0%) |
| Education Instruction & Library | 0 (0.0%) | 45 (100.0%) |
| Arts, Media & Entertainment | 3 (100.0%) | 0 (0.0%) |
| Health Diagnosing & Treating | 2 (8.7%) | 21 (91.3%) |
| Health Technologists | 0 (0.0%) | 4 (100.0%) |
| Total (Category) | 53 (41.7%) | 74 (58.3%) |
| Total (Overall) | 215 (51.6%) | 202 (48.4%) |
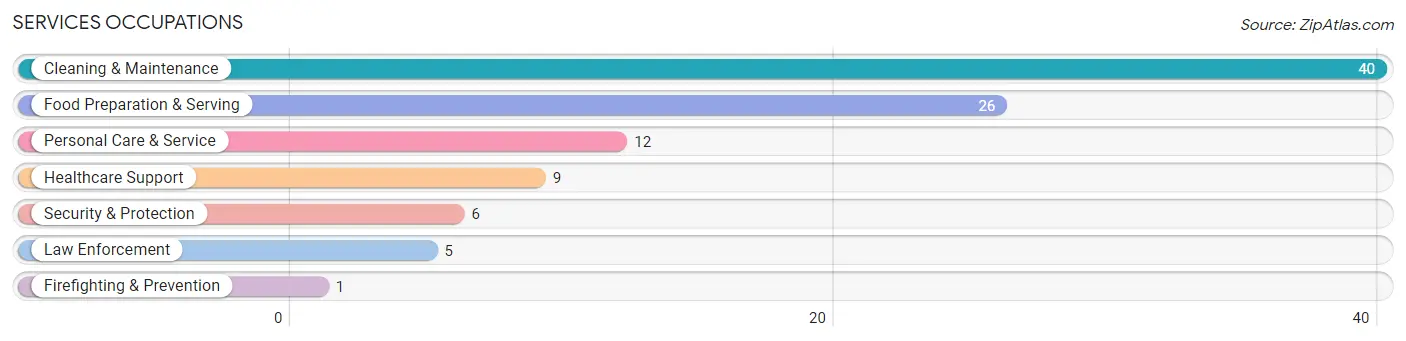
Services Occupations
The most common Services occupations in Selma are Cleaning & Maintenance (40 | 9.6%), Food Preparation & Serving (26 | 6.2%), Personal Care & Service (12 | 2.9%), Healthcare Support (9 | 2.2%), and Security & Protection (6 | 1.4%).
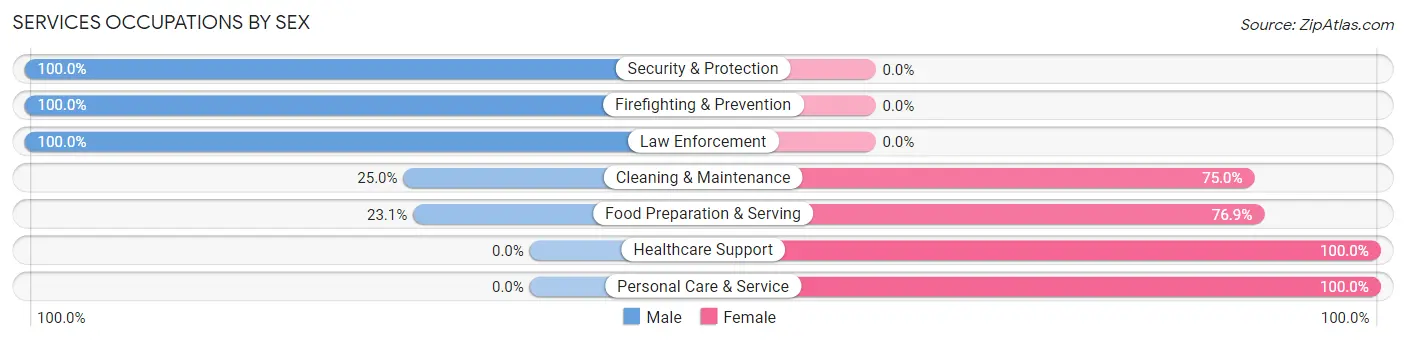
Services Occupations by Sex
Within the Services occupations in Selma, the most male-oriented occupations are Security & Protection (100.0%), Firefighting & Prevention (100.0%), and Law Enforcement (100.0%), while the most female-oriented occupations are Healthcare Support (100.0%), Personal Care & Service (100.0%), and Food Preparation & Serving (76.9%).
| Occupation | Male | Female |
| Healthcare Support | 0 (0.0%) | 9 (100.0%) |
| Security & Protection | 6 (100.0%) | 0 (0.0%) |
| Firefighting & Prevention | 1 (100.0%) | 0 (0.0%) |
| Law Enforcement | 5 (100.0%) | 0 (0.0%) |
| Food Preparation & Serving | 6 (23.1%) | 20 (76.9%) |
| Cleaning & Maintenance | 10 (25.0%) | 30 (75.0%) |
| Personal Care & Service | 0 (0.0%) | 12 (100.0%) |
| Total (Category) | 22 (23.7%) | 71 (76.3%) |
| Total (Overall) | 215 (51.6%) | 202 (48.4%) |
Sales and Office Occupations
The most common Sales and Office occupations in Selma are Sales & Related (44 | 10.5%), and Office & Administration (24 | 5.8%).
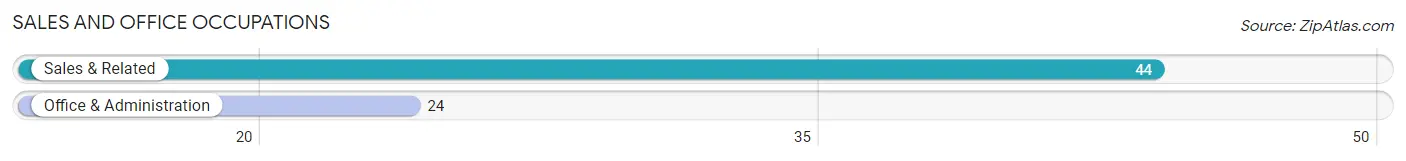
Sales and Office Occupations by Sex
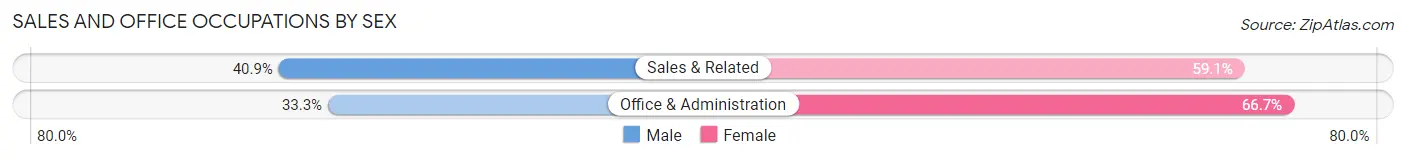
| Occupation | Male | Female |
| Sales & Related | 18 (40.9%) | 26 (59.1%) |
| Office & Administration | 8 (33.3%) | 16 (66.7%) |
| Total (Category) | 26 (38.2%) | 42 (61.8%) |
| Total (Overall) | 215 (51.6%) | 202 (48.4%) |
Natural Resources, Construction and Maintenance Occupations
The most common Natural Resources, Construction and Maintenance occupations in Selma are Construction & Extraction (28 | 6.7%), and Installation, Maintenance & Repair (28 | 6.7%).
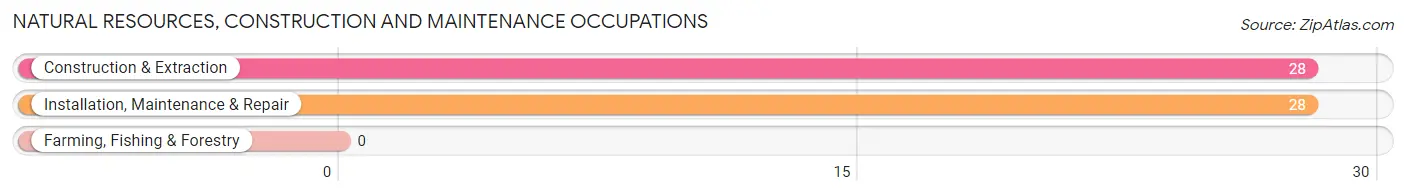
Natural Resources, Construction and Maintenance Occupations by Sex
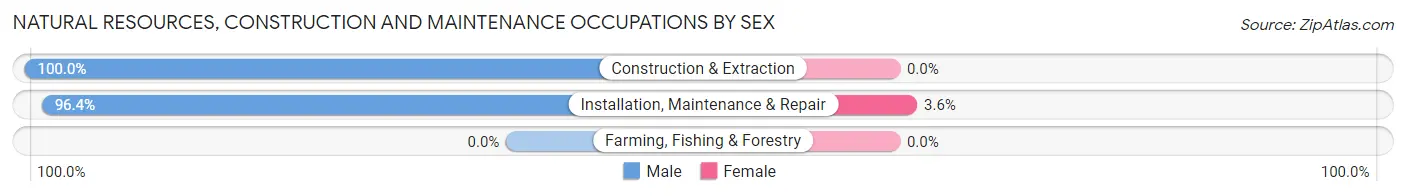
| Occupation | Male | Female |
| Farming, Fishing & Forestry | 0 (0.0%) | 0 (0.0%) |
| Construction & Extraction | 28 (100.0%) | 0 (0.0%) |
| Installation, Maintenance & Repair | 27 (96.4%) | 1 (3.6%) |
| Total (Category) | 55 (98.2%) | 1 (1.8%) |
| Total (Overall) | 215 (51.6%) | 202 (48.4%) |
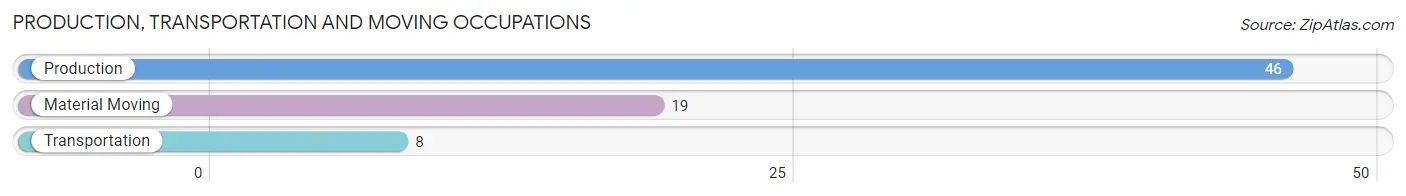
Production, Transportation and Moving Occupations
The most common Production, Transportation and Moving occupations in Selma are Production (46 | 11.0%), Material Moving (19 | 4.6%), and Transportation (8 | 1.9%).
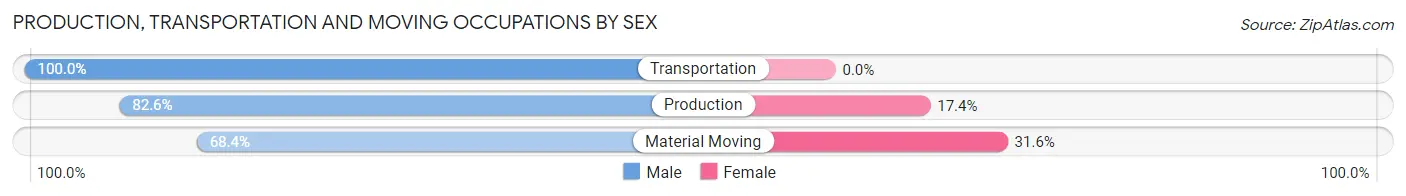
Production, Transportation and Moving Occupations by Sex
| Occupation | Male | Female |
| Production | 38 (82.6%) | 8 (17.4%) |
| Transportation | 8 (100.0%) | 0 (0.0%) |
| Material Moving | 13 (68.4%) | 6 (31.6%) |
| Total (Category) | 59 (80.8%) | 14 (19.2%) |
| Total (Overall) | 215 (51.6%) | 202 (48.4%) |
Employment Industries by Sex in Selma
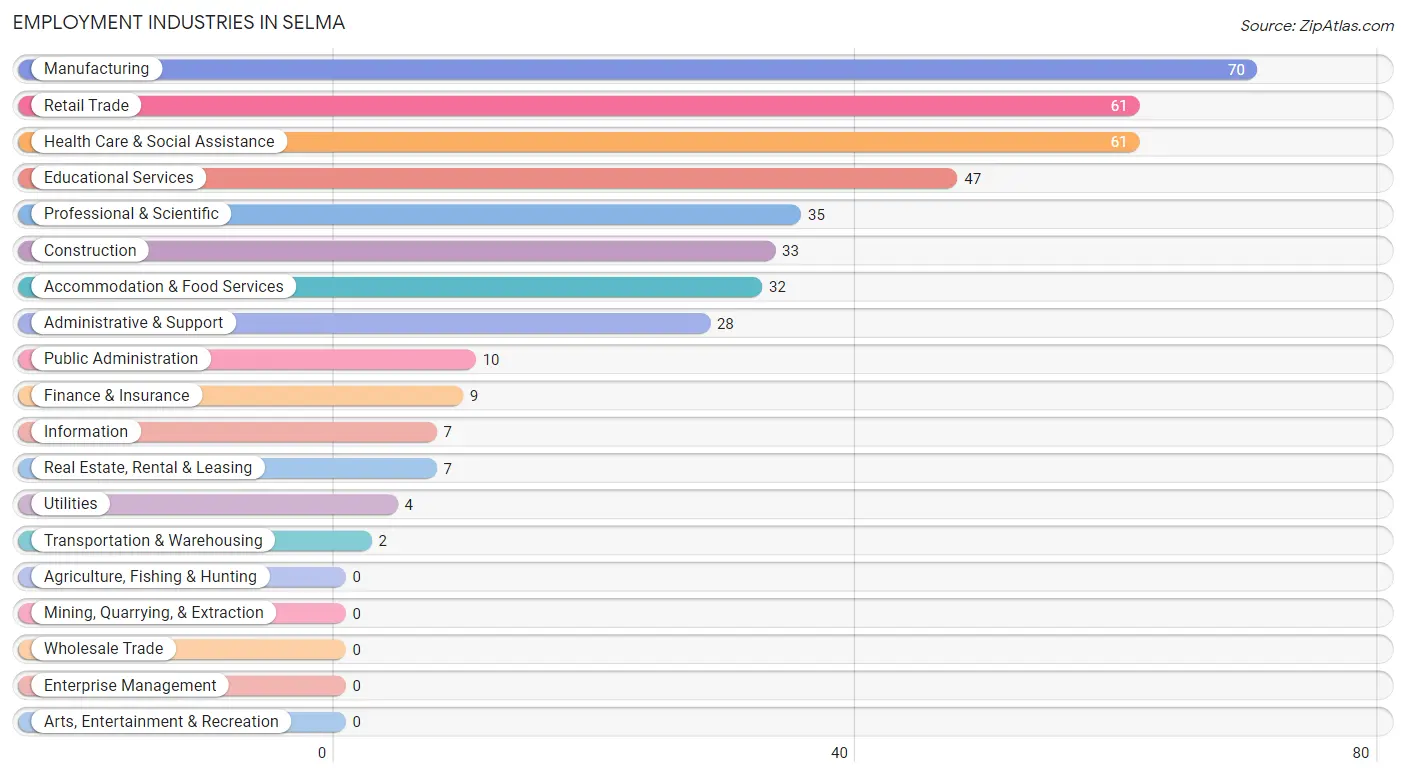
Employment Industries in Selma
The major employment industries in Selma include Manufacturing (70 | 16.8%), Retail Trade (61 | 14.6%), Health Care & Social Assistance (61 | 14.6%), Educational Services (47 | 11.3%), and Professional & Scientific (35 | 8.4%).
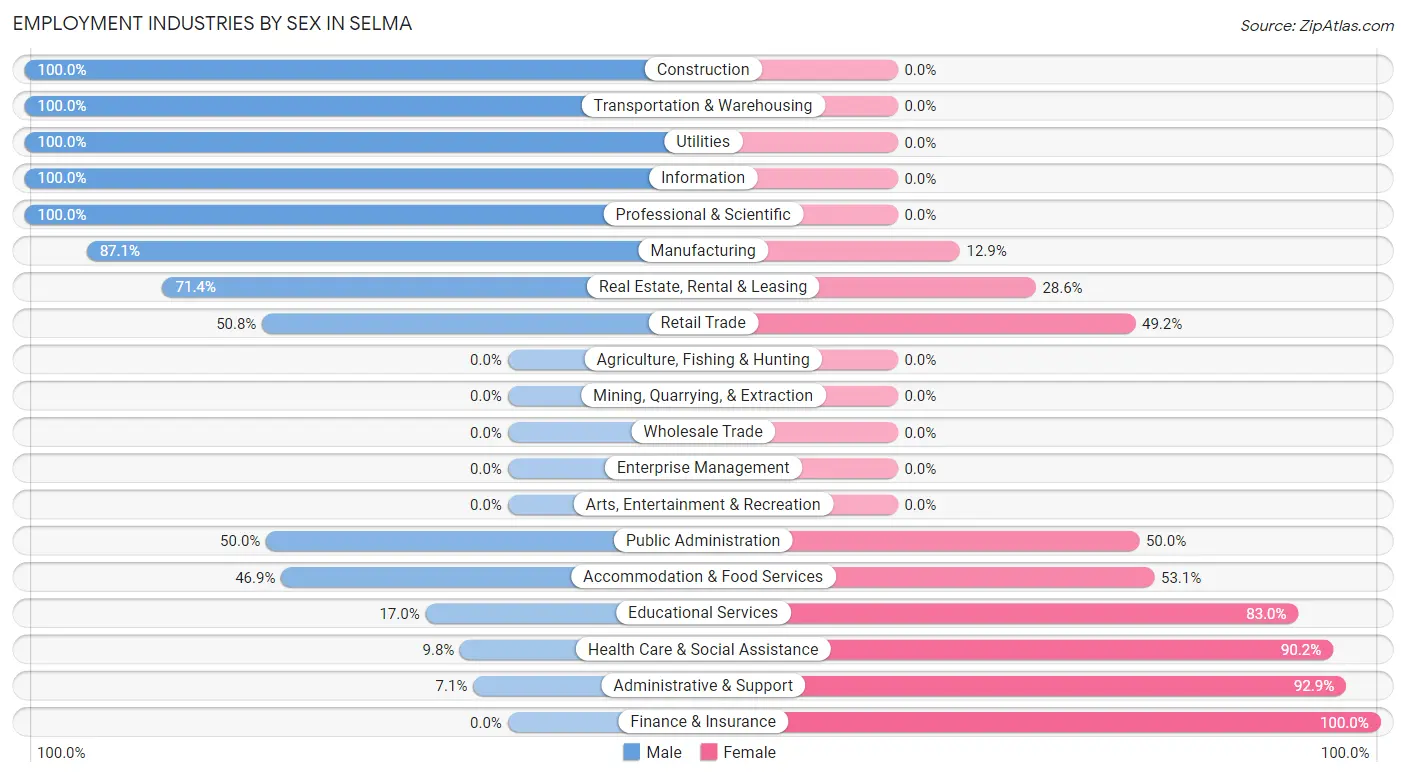
Employment Industries by Sex in Selma
The Selma industries that see more men than women are Construction (100.0%), Transportation & Warehousing (100.0%), and Utilities (100.0%), whereas the industries that tend to have a higher number of women are Finance & Insurance (100.0%), Administrative & Support (92.9%), and Health Care & Social Assistance (90.2%).
| Industry | Male | Female |
| Agriculture, Fishing & Hunting | 0 (0.0%) | 0 (0.0%) |
| Mining, Quarrying, & Extraction | 0 (0.0%) | 0 (0.0%) |
| Construction | 33 (100.0%) | 0 (0.0%) |
| Manufacturing | 61 (87.1%) | 9 (12.9%) |
| Wholesale Trade | 0 (0.0%) | 0 (0.0%) |
| Retail Trade | 31 (50.8%) | 30 (49.2%) |
| Transportation & Warehousing | 2 (100.0%) | 0 (0.0%) |
| Utilities | 4 (100.0%) | 0 (0.0%) |
| Information | 7 (100.0%) | 0 (0.0%) |
| Finance & Insurance | 0 (0.0%) | 9 (100.0%) |
| Real Estate, Rental & Leasing | 5 (71.4%) | 2 (28.6%) |
| Professional & Scientific | 35 (100.0%) | 0 (0.0%) |
| Enterprise Management | 0 (0.0%) | 0 (0.0%) |
| Administrative & Support | 2 (7.1%) | 26 (92.9%) |
| Educational Services | 8 (17.0%) | 39 (83.0%) |
| Health Care & Social Assistance | 6 (9.8%) | 55 (90.2%) |
| Arts, Entertainment & Recreation | 0 (0.0%) | 0 (0.0%) |
| Accommodation & Food Services | 15 (46.9%) | 17 (53.1%) |
| Public Administration | 5 (50.0%) | 5 (50.0%) |
| Total | 215 (51.6%) | 202 (48.4%) |
Education in Selma
School Enrollment in Selma
The most common levels of schooling among the 221 students in Selma are high school (54 | 24.4%), middle school (46 | 20.8%), and elementary school (40 | 18.1%).
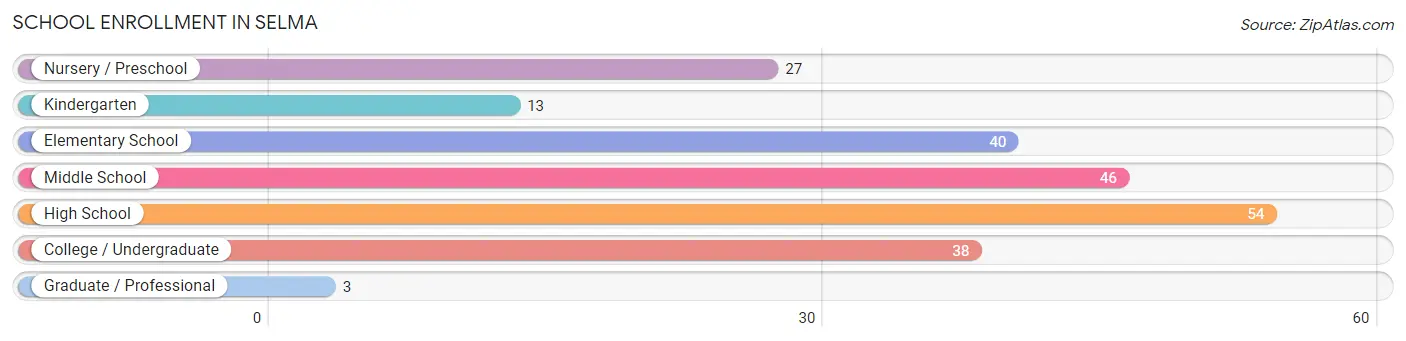
| School Level | # Students | % Students |
| Nursery / Preschool | 27 | 12.2% |
| Kindergarten | 13 | 5.9% |
| Elementary School | 40 | 18.1% |
| Middle School | 46 | 20.8% |
| High School | 54 | 24.4% |
| College / Undergraduate | 38 | 17.2% |
| Graduate / Professional | 3 | 1.4% |
| Total | 221 | 100.0% |
School Enrollment by Age by Funding Source in Selma
Out of a total of 221 students who are enrolled in schools in Selma, 19 (8.6%) attend a private institution, while the remaining 202 (91.4%) are enrolled in public schools. The age group of 3 to 4 year olds has the highest likelihood of being enrolled in private schools, with 10 (76.9% in the age bracket) enrolled. Conversely, the age group of 15 to 17 year olds has the lowest likelihood of being enrolled in a private school, with 47 (100.0% in the age bracket) attending a public institution.
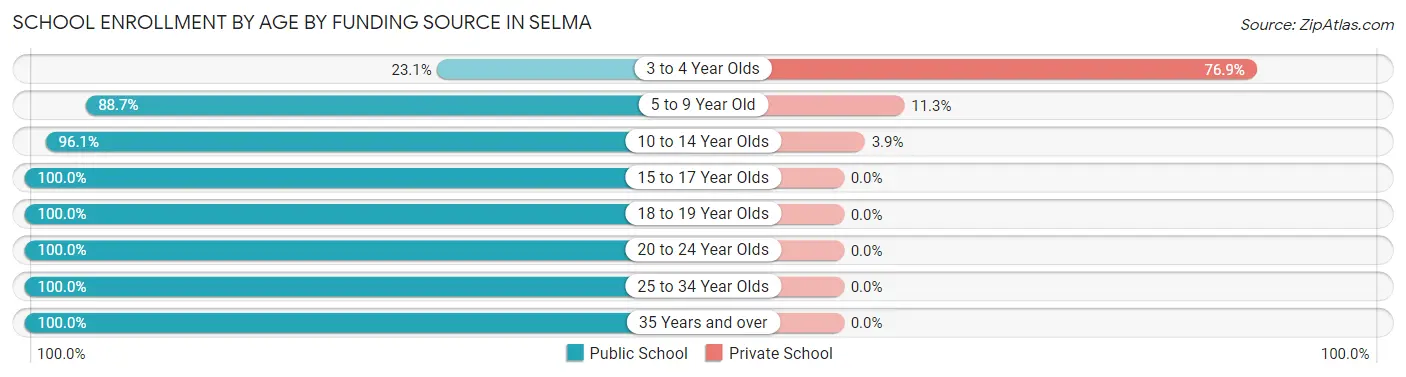
| Age Bracket | Public School | Private School |
| 3 to 4 Year Olds | 3 (23.1%) | 10 (76.9%) |
| 5 to 9 Year Old | 55 (88.7%) | 7 (11.3%) |
| 10 to 14 Year Olds | 49 (96.1%) | 2 (3.9%) |
| 15 to 17 Year Olds | 47 (100.0%) | 0 (0.0%) |
| 18 to 19 Year Olds | 18 (100.0%) | 0 (0.0%) |
| 20 to 24 Year Olds | 6 (100.0%) | 0 (0.0%) |
| 25 to 34 Year Olds | 20 (100.0%) | 0 (0.0%) |
| 35 Years and over | 4 (100.0%) | 0 (0.0%) |
| Total | 202 (91.4%) | 19 (8.6%) |
Educational Attainment by Field of Study in Selma
Education (15 | 32.6%), arts & humanities (10 | 21.7%), business (8 | 17.4%), science & technology (5 | 10.9%), and visual & performing arts (3 | 6.5%) are the most common fields of study among 46 individuals in Selma who have obtained a bachelor's degree or higher.
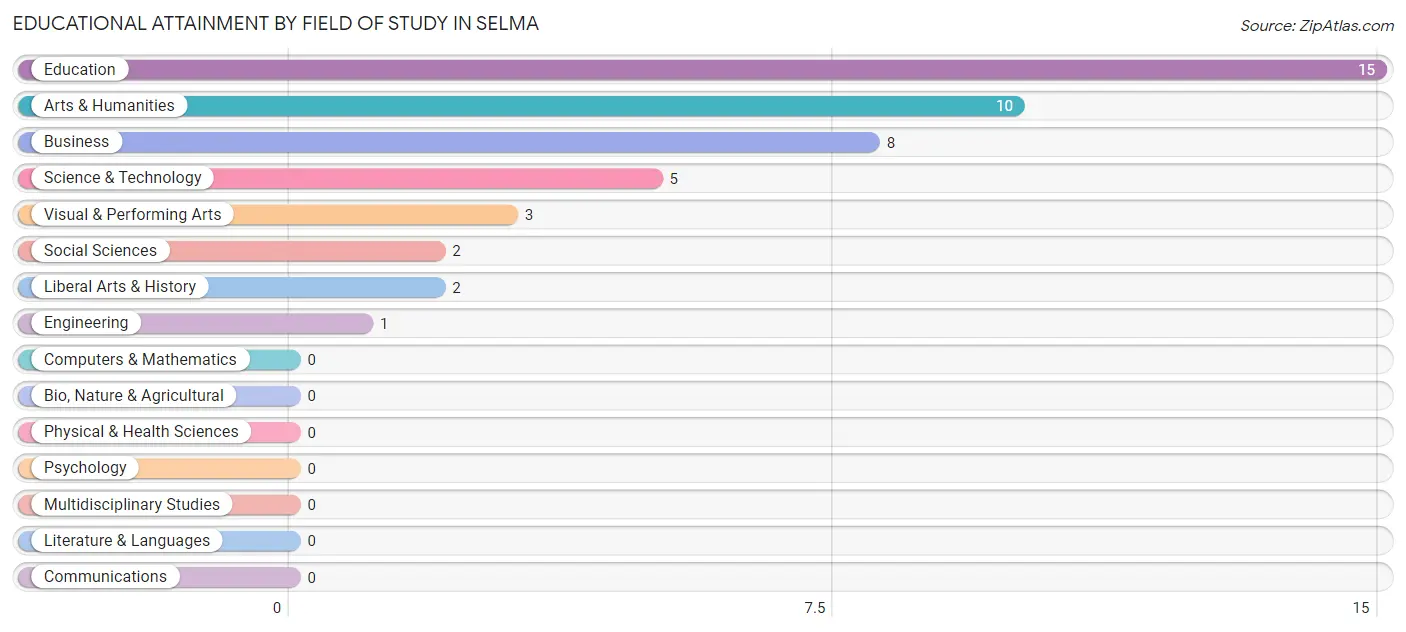
| Field of Study | # Graduates | % Graduates |
| Computers & Mathematics | 0 | 0.0% |
| Bio, Nature & Agricultural | 0 | 0.0% |
| Physical & Health Sciences | 0 | 0.0% |
| Psychology | 0 | 0.0% |
| Social Sciences | 2 | 4.3% |
| Engineering | 1 | 2.2% |
| Multidisciplinary Studies | 0 | 0.0% |
| Science & Technology | 5 | 10.9% |
| Business | 8 | 17.4% |
| Education | 15 | 32.6% |
| Literature & Languages | 0 | 0.0% |
| Liberal Arts & History | 2 | 4.3% |
| Visual & Performing Arts | 3 | 6.5% |
| Communications | 0 | 0.0% |
| Arts & Humanities | 10 | 21.7% |
| Total | 46 | 100.0% |
Transportation & Commute in Selma
Vehicle Availability by Sex in Selma
The most prevalent vehicle ownership categories in Selma are males with 2 vehicles (85, accounting for 39.7%) and females with 2 vehicles (100, making up 42.7%).
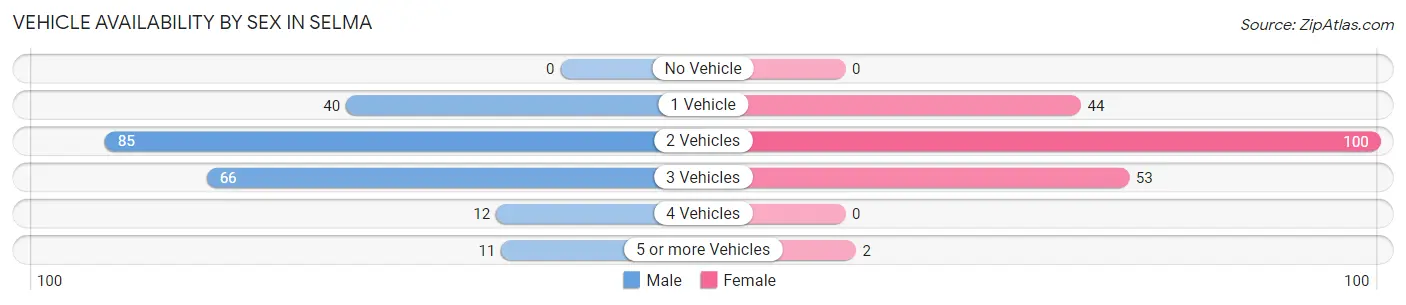
| Vehicles Available | Male | Female |
| No Vehicle | 0 (0.0%) | 0 (0.0%) |
| 1 Vehicle | 40 (18.7%) | 44 (22.1%) |
| 2 Vehicles | 85 (39.7%) | 100 (50.2%) |
| 3 Vehicles | 66 (30.8%) | 53 (26.6%) |
| 4 Vehicles | 12 (5.6%) | 0 (0.0%) |
| 5 or more Vehicles | 11 (5.1%) | 2 (1.0%) |
| Total | 214 (100.0%) | 199 (100.0%) |
Commute Time in Selma
The most frequently occuring commute durations in Selma are 15 to 19 minutes (149 commuters, 36.3%), 20 to 24 minutes (62 commuters, 15.1%), and 45 to 59 minutes (47 commuters, 11.5%).
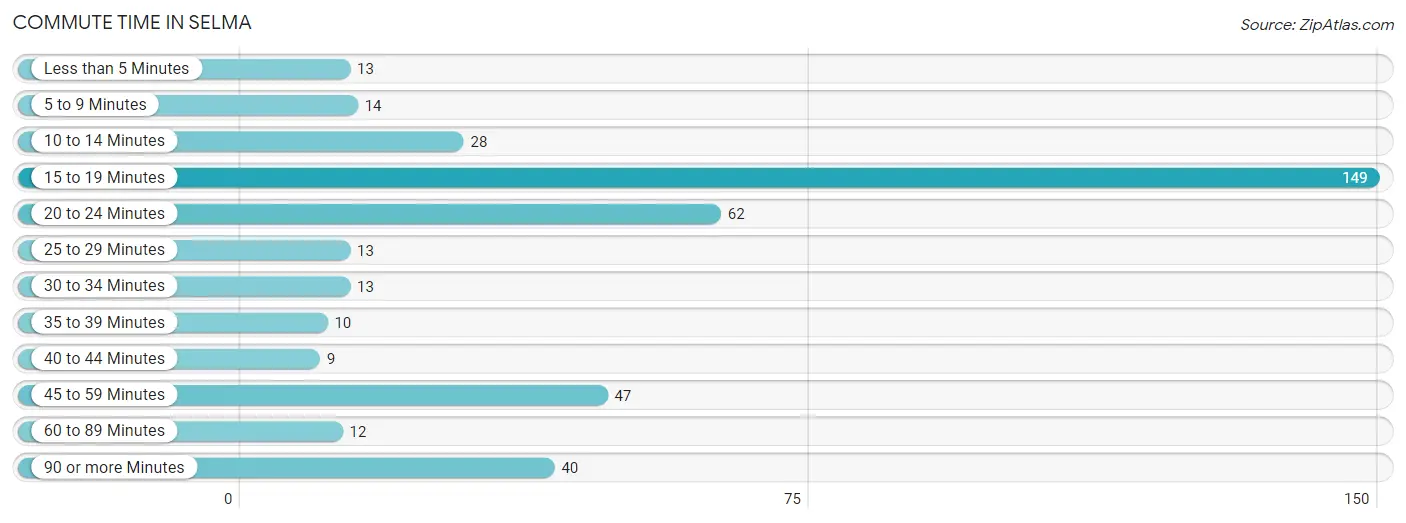
| Commute Time | # Commuters | % Commuters |
| Less than 5 Minutes | 13 | 3.2% |
| 5 to 9 Minutes | 14 | 3.4% |
| 10 to 14 Minutes | 28 | 6.8% |
| 15 to 19 Minutes | 149 | 36.3% |
| 20 to 24 Minutes | 62 | 15.1% |
| 25 to 29 Minutes | 13 | 3.2% |
| 30 to 34 Minutes | 13 | 3.2% |
| 35 to 39 Minutes | 10 | 2.4% |
| 40 to 44 Minutes | 9 | 2.2% |
| 45 to 59 Minutes | 47 | 11.5% |
| 60 to 89 Minutes | 12 | 2.9% |
| 90 or more Minutes | 40 | 9.8% |
Commute Time by Sex in Selma
The most common commute times in Selma are 15 to 19 minutes (71 commuters, 33.0%) for males and 15 to 19 minutes (78 commuters, 40.0%) for females.
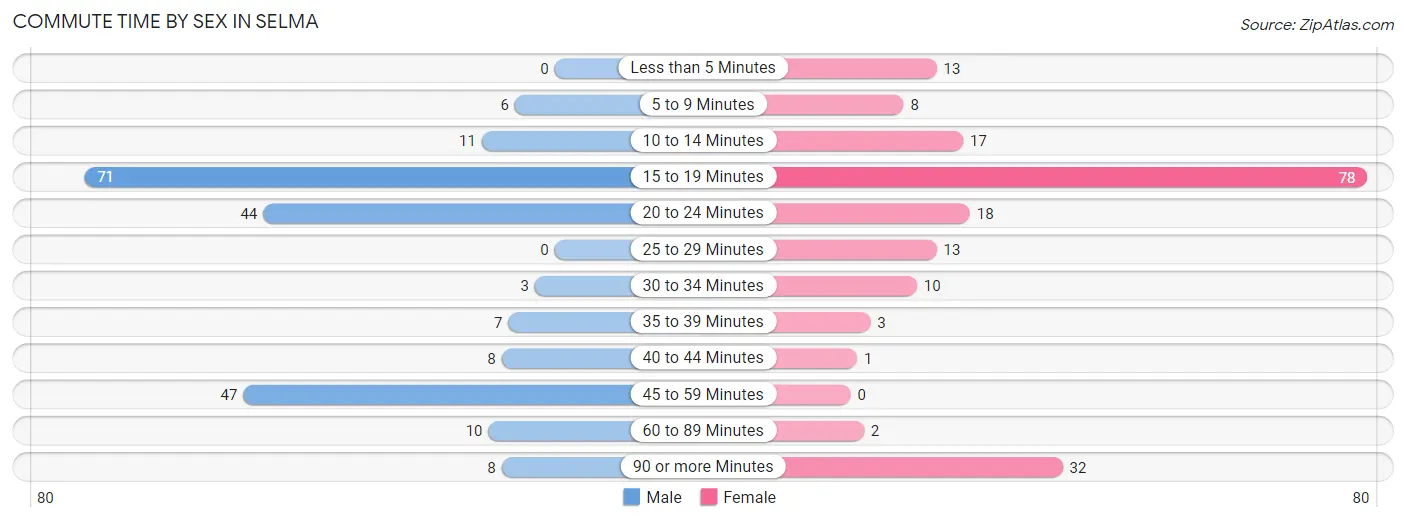
| Commute Time | Male | Female |
| Less than 5 Minutes | 0 (0.0%) | 13 (6.7%) |
| 5 to 9 Minutes | 6 (2.8%) | 8 (4.1%) |
| 10 to 14 Minutes | 11 (5.1%) | 17 (8.7%) |
| 15 to 19 Minutes | 71 (33.0%) | 78 (40.0%) |
| 20 to 24 Minutes | 44 (20.5%) | 18 (9.2%) |
| 25 to 29 Minutes | 0 (0.0%) | 13 (6.7%) |
| 30 to 34 Minutes | 3 (1.4%) | 10 (5.1%) |
| 35 to 39 Minutes | 7 (3.3%) | 3 (1.5%) |
| 40 to 44 Minutes | 8 (3.7%) | 1 (0.5%) |
| 45 to 59 Minutes | 47 (21.9%) | 0 (0.0%) |
| 60 to 89 Minutes | 10 (4.6%) | 2 (1.0%) |
| 90 or more Minutes | 8 (3.7%) | 32 (16.4%) |
Time of Departure to Work by Sex in Selma
The most frequent times of departure to work in Selma are 7:00 AM to 7:29 AM (35, 16.3%) for males and 4:00 PM to 11:59 PM (76, 39.0%) for females.
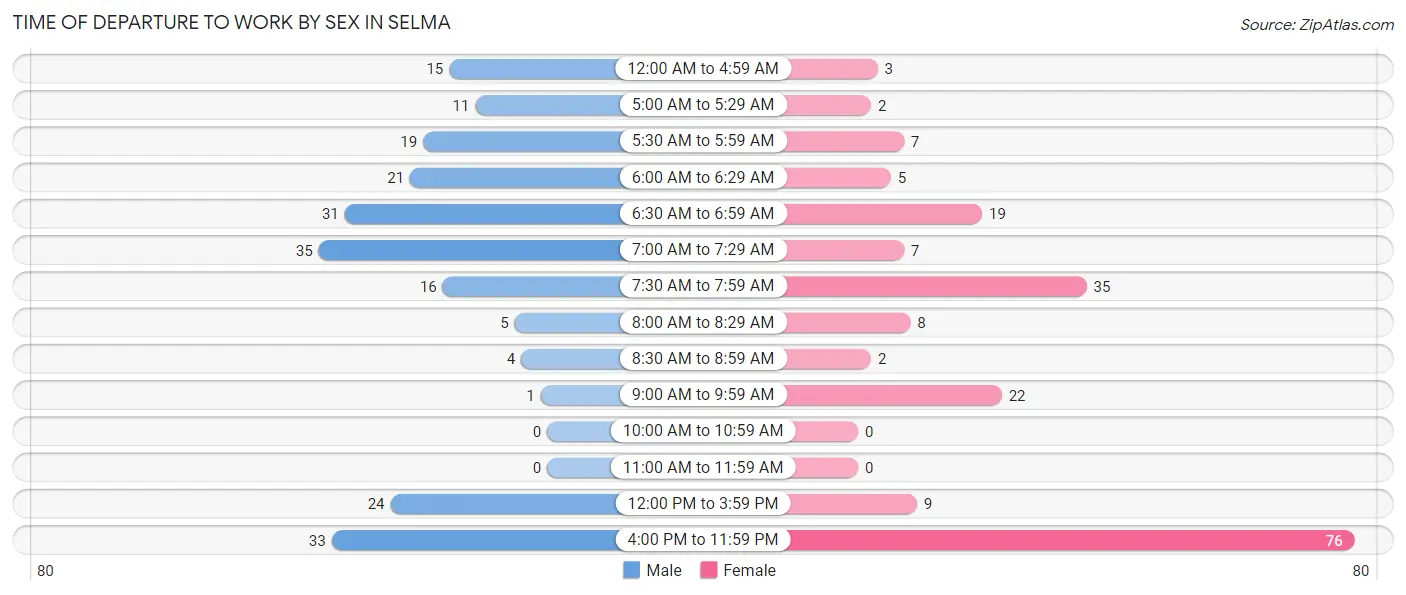
| Time of Departure | Male | Female |
| 12:00 AM to 4:59 AM | 15 (7.0%) | 3 (1.5%) |
| 5:00 AM to 5:29 AM | 11 (5.1%) | 2 (1.0%) |
| 5:30 AM to 5:59 AM | 19 (8.8%) | 7 (3.6%) |
| 6:00 AM to 6:29 AM | 21 (9.8%) | 5 (2.6%) |
| 6:30 AM to 6:59 AM | 31 (14.4%) | 19 (9.7%) |
| 7:00 AM to 7:29 AM | 35 (16.3%) | 7 (3.6%) |
| 7:30 AM to 7:59 AM | 16 (7.4%) | 35 (17.9%) |
| 8:00 AM to 8:29 AM | 5 (2.3%) | 8 (4.1%) |
| 8:30 AM to 8:59 AM | 4 (1.9%) | 2 (1.0%) |
| 9:00 AM to 9:59 AM | 1 (0.5%) | 22 (11.3%) |
| 10:00 AM to 10:59 AM | 0 (0.0%) | 0 (0.0%) |
| 11:00 AM to 11:59 AM | 0 (0.0%) | 0 (0.0%) |
| 12:00 PM to 3:59 PM | 24 (11.2%) | 9 (4.6%) |
| 4:00 PM to 11:59 PM | 33 (15.3%) | 76 (39.0%) |
| Total | 215 (100.0%) | 195 (100.0%) |
Housing Occupancy in Selma
Occupancy by Ownership in Selma
Of the total 322 dwellings in Selma, owner-occupied units account for 229 (71.1%), while renter-occupied units make up 93 (28.9%).
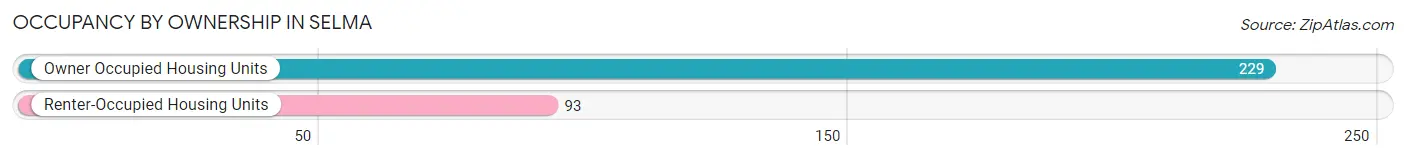
| Occupancy | # Housing Units | % Housing Units |
| Owner Occupied Housing Units | 229 | 71.1% |
| Renter-Occupied Housing Units | 93 | 28.9% |
| Total Occupied Housing Units | 322 | 100.0% |
Occupancy by Household Size in Selma
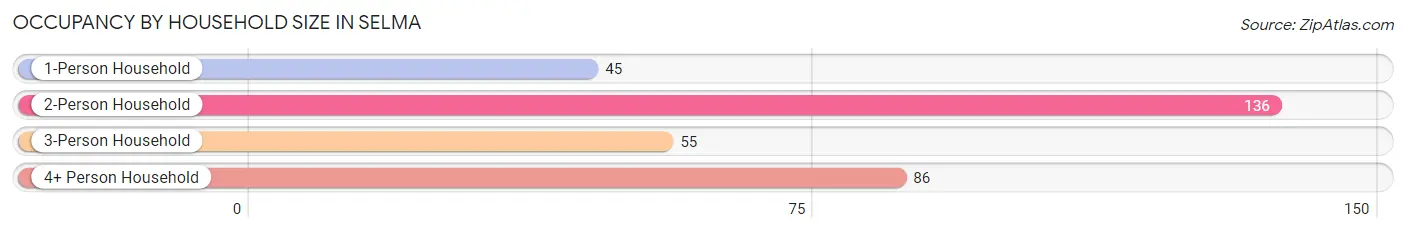
| Household Size | # Housing Units | % Housing Units |
| 1-Person Household | 45 | 14.0% |
| 2-Person Household | 136 | 42.2% |
| 3-Person Household | 55 | 17.1% |
| 4+ Person Household | 86 | 26.7% |
| Total Housing Units | 322 | 100.0% |
Occupancy by Ownership by Household Size in Selma
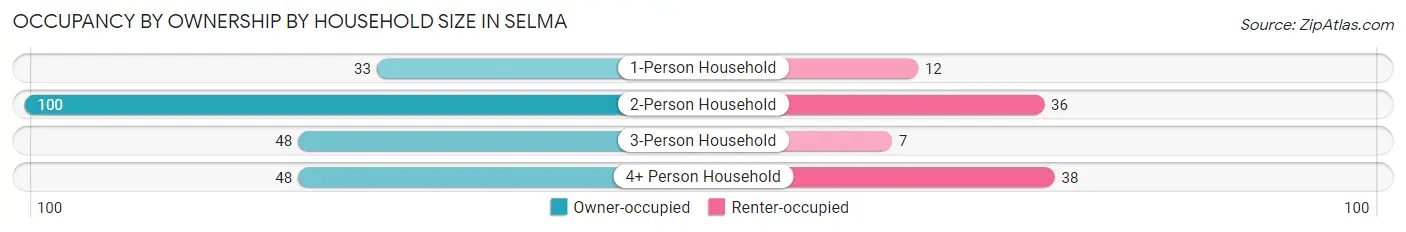
| Household Size | Owner-occupied | Renter-occupied |
| 1-Person Household | 33 (73.3%) | 12 (26.7%) |
| 2-Person Household | 100 (73.5%) | 36 (26.5%) |
| 3-Person Household | 48 (87.3%) | 7 (12.7%) |
| 4+ Person Household | 48 (55.8%) | 38 (44.2%) |
| Total Housing Units | 229 (71.1%) | 93 (28.9%) |
Occupancy by Educational Attainment in Selma
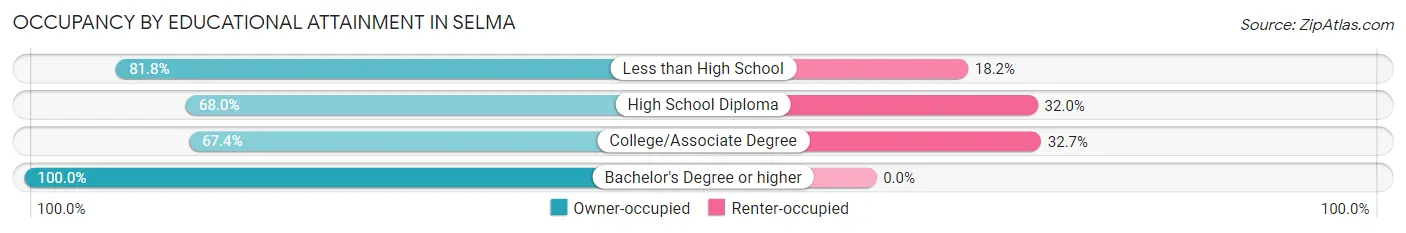
| Household Size | Owner-occupied | Renter-occupied |
| Less than High School | 18 (81.8%) | 4 (18.2%) |
| High School Diploma | 121 (68.0%) | 57 (32.0%) |
| College/Associate Degree | 66 (67.3%) | 32 (32.7%) |
| Bachelor's Degree or higher | 24 (100.0%) | 0 (0.0%) |
Occupancy by Age of Householder in Selma
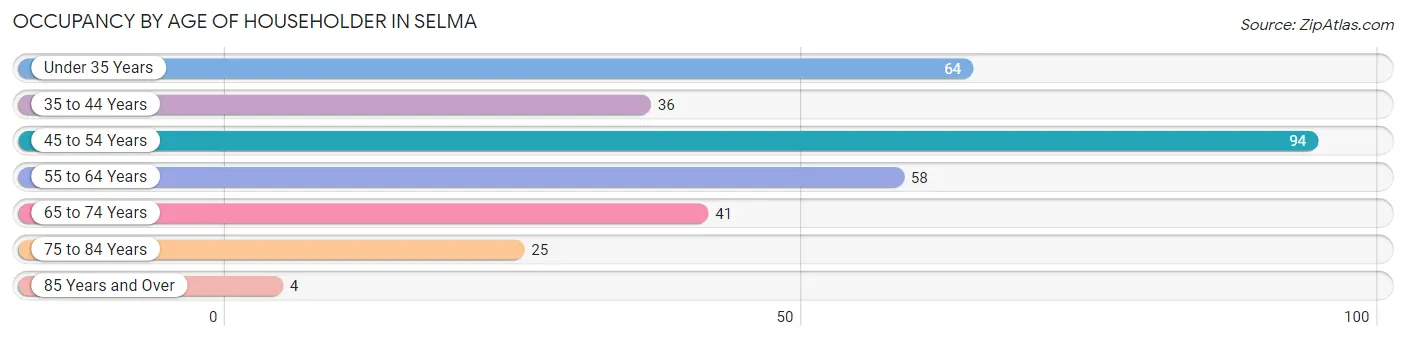
| Age Bracket | # Households | % Households |
| Under 35 Years | 64 | 19.9% |
| 35 to 44 Years | 36 | 11.2% |
| 45 to 54 Years | 94 | 29.2% |
| 55 to 64 Years | 58 | 18.0% |
| 65 to 74 Years | 41 | 12.7% |
| 75 to 84 Years | 25 | 7.8% |
| 85 Years and Over | 4 | 1.2% |
| Total | 322 | 100.0% |
Housing Finances in Selma
Median Income by Occupancy in Selma
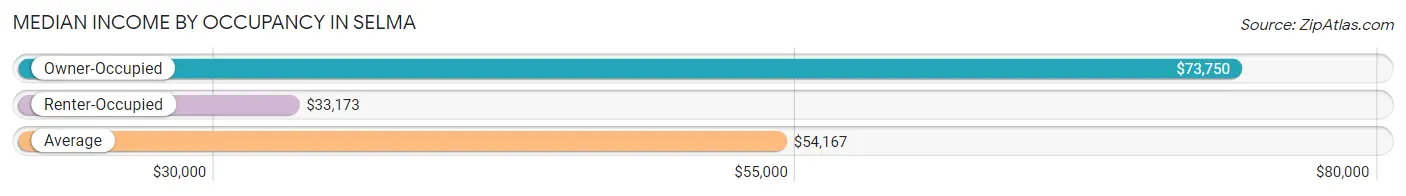
| Occupancy Type | # Households | Median Income |
| Owner-Occupied | 229 (71.1%) | $73,750 |
| Renter-Occupied | 93 (28.9%) | $33,173 |
| Average | 322 (100.0%) | $54,167 |
Occupancy by Householder Income Bracket in Selma
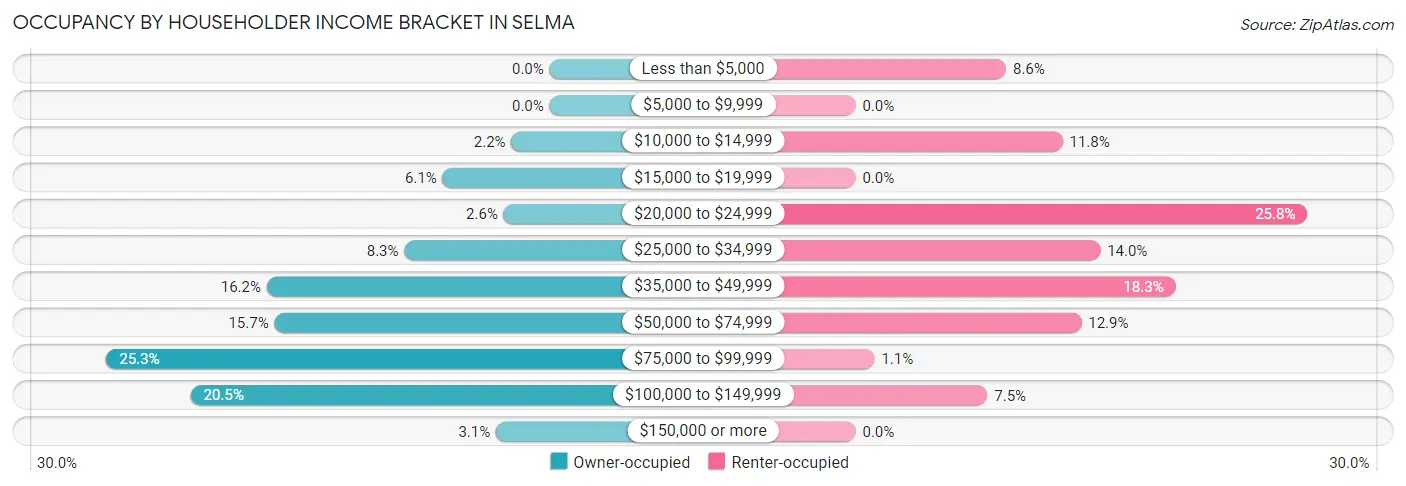
| Income Bracket | Owner-occupied | Renter-occupied |
| Less than $5,000 | 0 (0.0%) | 8 (8.6%) |
| $5,000 to $9,999 | 0 (0.0%) | 0 (0.0%) |
| $10,000 to $14,999 | 5 (2.2%) | 11 (11.8%) |
| $15,000 to $19,999 | 14 (6.1%) | 0 (0.0%) |
| $20,000 to $24,999 | 6 (2.6%) | 24 (25.8%) |
| $25,000 to $34,999 | 19 (8.3%) | 13 (14.0%) |
| $35,000 to $49,999 | 37 (16.2%) | 17 (18.3%) |
| $50,000 to $74,999 | 36 (15.7%) | 12 (12.9%) |
| $75,000 to $99,999 | 58 (25.3%) | 1 (1.1%) |
| $100,000 to $149,999 | 47 (20.5%) | 7 (7.5%) |
| $150,000 or more | 7 (3.1%) | 0 (0.0%) |
| Total | 229 (100.0%) | 93 (100.0%) |
Monthly Housing Cost Tiers in Selma
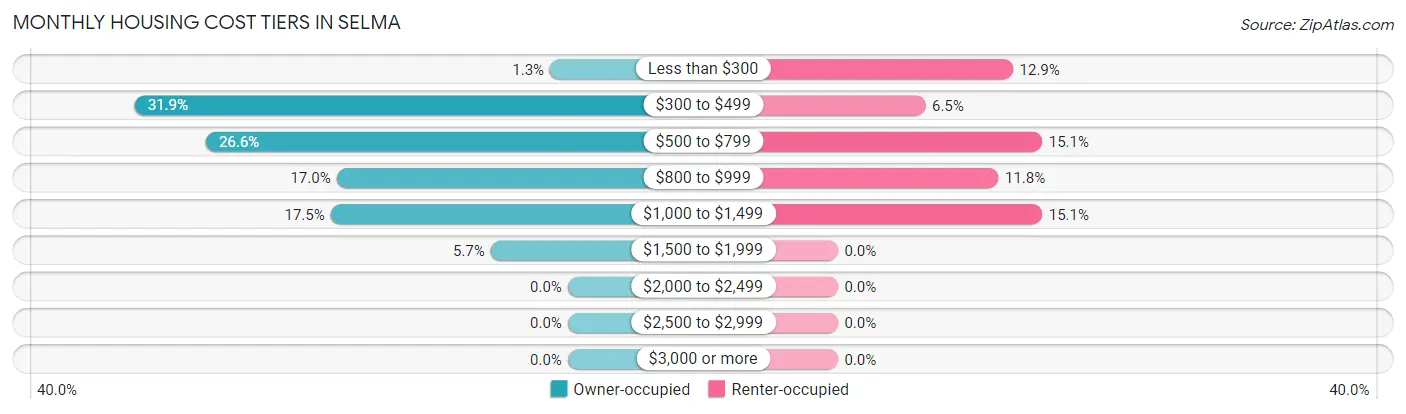
| Monthly Cost | Owner-occupied | Renter-occupied |
| Less than $300 | 3 (1.3%) | 12 (12.9%) |
| $300 to $499 | 73 (31.9%) | 6 (6.5%) |
| $500 to $799 | 61 (26.6%) | 14 (15.0%) |
| $800 to $999 | 39 (17.0%) | 11 (11.8%) |
| $1,000 to $1,499 | 40 (17.5%) | 14 (15.0%) |
| $1,500 to $1,999 | 13 (5.7%) | 0 (0.0%) |
| $2,000 to $2,499 | 0 (0.0%) | 0 (0.0%) |
| $2,500 to $2,999 | 0 (0.0%) | 0 (0.0%) |
| $3,000 or more | 0 (0.0%) | 0 (0.0%) |
| Total | 229 (100.0%) | 93 (100.0%) |
Physical Housing Characteristics in Selma
Housing Structures in Selma
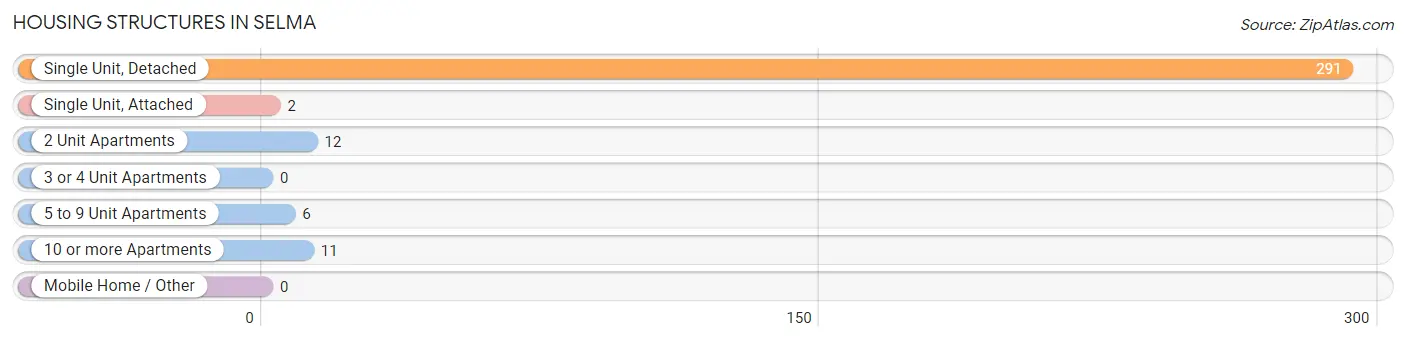
| Structure Type | # Housing Units | % Housing Units |
| Single Unit, Detached | 291 | 90.4% |
| Single Unit, Attached | 2 | 0.6% |
| 2 Unit Apartments | 12 | 3.7% |
| 3 or 4 Unit Apartments | 0 | 0.0% |
| 5 to 9 Unit Apartments | 6 | 1.9% |
| 10 or more Apartments | 11 | 3.4% |
| Mobile Home / Other | 0 | 0.0% |
| Total | 322 | 100.0% |
Housing Structures by Occupancy in Selma
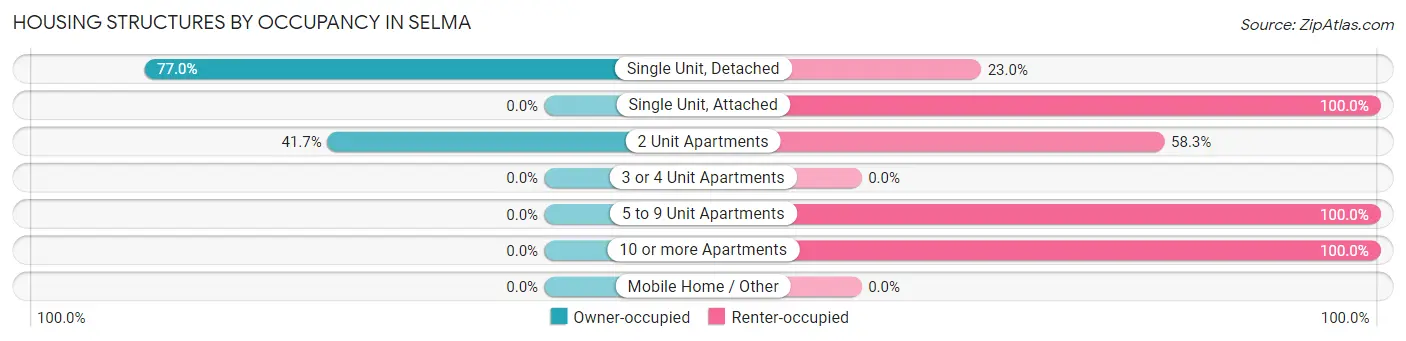
| Structure Type | Owner-occupied | Renter-occupied |
| Single Unit, Detached | 224 (77.0%) | 67 (23.0%) |
| Single Unit, Attached | 0 (0.0%) | 2 (100.0%) |
| 2 Unit Apartments | 5 (41.7%) | 7 (58.3%) |
| 3 or 4 Unit Apartments | 0 (0.0%) | 0 (0.0%) |
| 5 to 9 Unit Apartments | 0 (0.0%) | 6 (100.0%) |
| 10 or more Apartments | 0 (0.0%) | 11 (100.0%) |
| Mobile Home / Other | 0 (0.0%) | 0 (0.0%) |
| Total | 229 (71.1%) | 93 (28.9%) |
Housing Structures by Number of Rooms in Selma
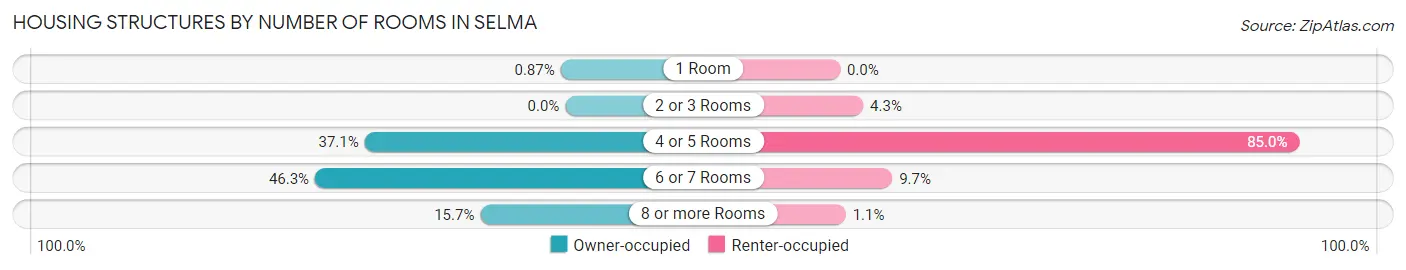
| Number of Rooms | Owner-occupied | Renter-occupied |
| 1 Room | 2 (0.9%) | 0 (0.0%) |
| 2 or 3 Rooms | 0 (0.0%) | 4 (4.3%) |
| 4 or 5 Rooms | 85 (37.1%) | 79 (85.0%) |
| 6 or 7 Rooms | 106 (46.3%) | 9 (9.7%) |
| 8 or more Rooms | 36 (15.7%) | 1 (1.1%) |
| Total | 229 (100.0%) | 93 (100.0%) |
Housing Structure by Heating Type in Selma
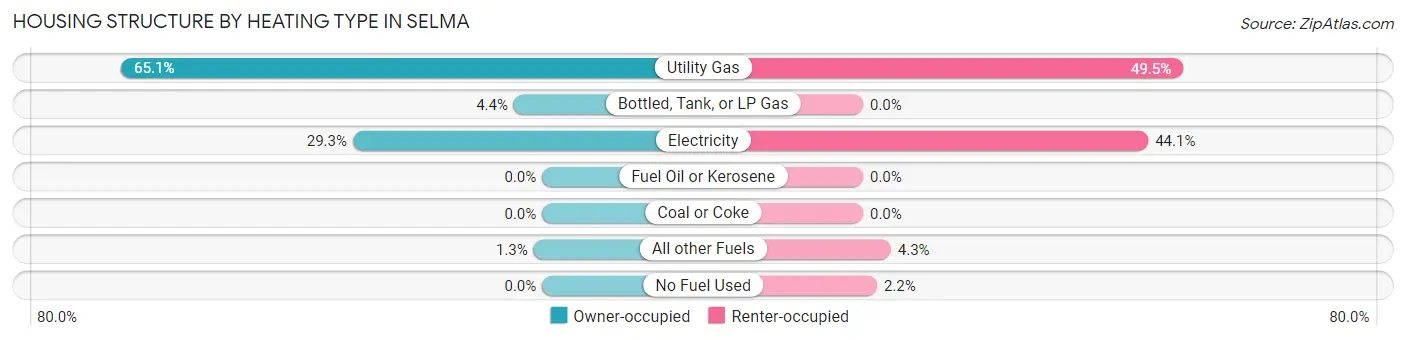
| Heating Type | Owner-occupied | Renter-occupied |
| Utility Gas | 149 (65.1%) | 46 (49.5%) |
| Bottled, Tank, or LP Gas | 10 (4.4%) | 0 (0.0%) |
| Electricity | 67 (29.3%) | 41 (44.1%) |
| Fuel Oil or Kerosene | 0 (0.0%) | 0 (0.0%) |
| Coal or Coke | 0 (0.0%) | 0 (0.0%) |
| All other Fuels | 3 (1.3%) | 4 (4.3%) |
| No Fuel Used | 0 (0.0%) | 2 (2.1%) |
| Total | 229 (100.0%) | 93 (100.0%) |
Household Vehicle Usage in Selma
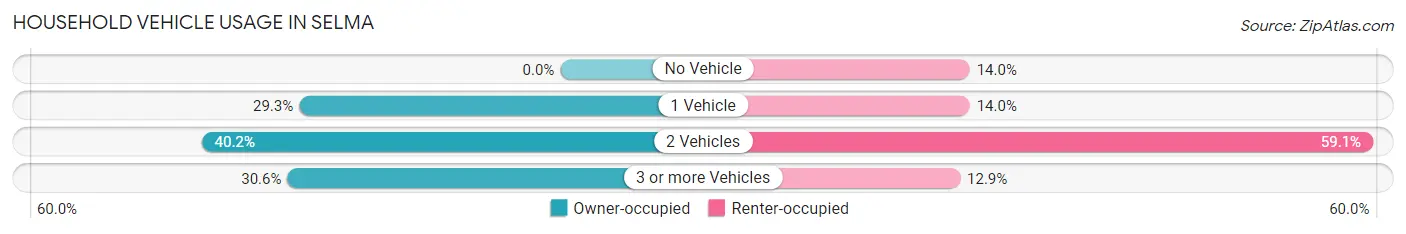
| Vehicles per Household | Owner-occupied | Renter-occupied |
| No Vehicle | 0 (0.0%) | 13 (14.0%) |
| 1 Vehicle | 67 (29.3%) | 13 (14.0%) |
| 2 Vehicles | 92 (40.2%) | 55 (59.1%) |
| 3 or more Vehicles | 70 (30.6%) | 12 (12.9%) |
| Total | 229 (100.0%) | 93 (100.0%) |
Real Estate & Mortgages in Selma
Real Estate and Mortgage Overview in Selma
| Characteristic | Without Mortgage | With Mortgage |
| Housing Units | 112 | 117 |
| Median Property Value | $94,500 | $108,600 |
| Median Household Income | $53,750 | $7 |
| Monthly Housing Costs | $464 | $0 |
| Real Estate Taxes | - | - |
Property Value by Mortgage Status in Selma
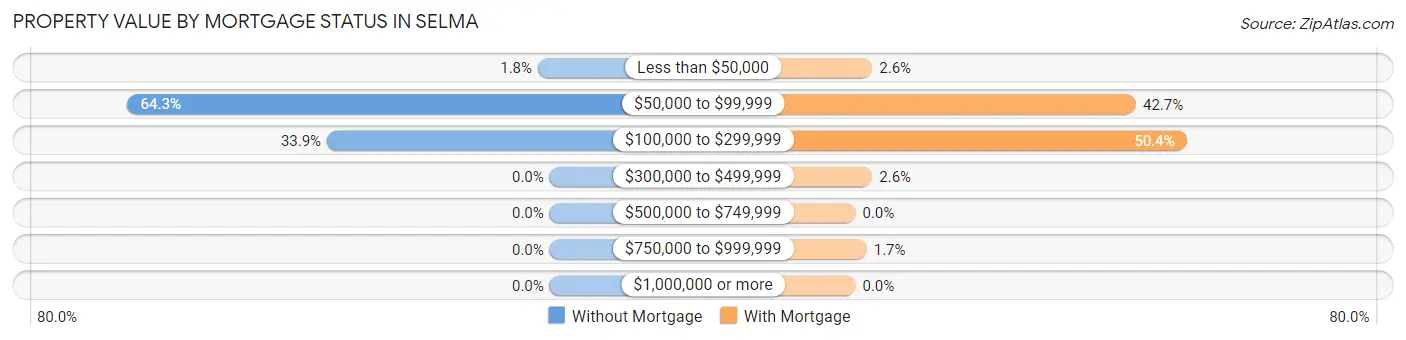
| Property Value | Without Mortgage | With Mortgage |
| Less than $50,000 | 2 (1.8%) | 3 (2.6%) |
| $50,000 to $99,999 | 72 (64.3%) | 50 (42.7%) |
| $100,000 to $299,999 | 38 (33.9%) | 59 (50.4%) |
| $300,000 to $499,999 | 0 (0.0%) | 3 (2.6%) |
| $500,000 to $749,999 | 0 (0.0%) | 0 (0.0%) |
| $750,000 to $999,999 | 0 (0.0%) | 2 (1.7%) |
| $1,000,000 or more | 0 (0.0%) | 0 (0.0%) |
| Total | 112 (100.0%) | 117 (100.0%) |
Household Income by Mortgage Status in Selma
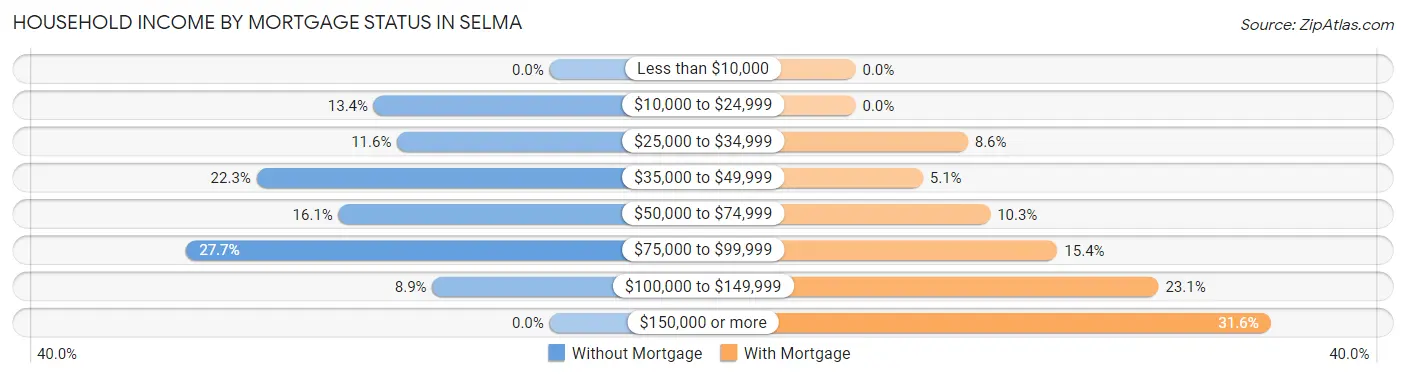
| Household Income | Without Mortgage | With Mortgage |
| Less than $10,000 | 0 (0.0%) | 0 (0.0%) |
| $10,000 to $24,999 | 15 (13.4%) | 0 (0.0%) |
| $25,000 to $34,999 | 13 (11.6%) | 10 (8.6%) |
| $35,000 to $49,999 | 25 (22.3%) | 6 (5.1%) |
| $50,000 to $74,999 | 18 (16.1%) | 12 (10.3%) |
| $75,000 to $99,999 | 31 (27.7%) | 18 (15.4%) |
| $100,000 to $149,999 | 10 (8.9%) | 27 (23.1%) |
| $150,000 or more | 0 (0.0%) | 37 (31.6%) |
| Total | 112 (100.0%) | 117 (100.0%) |
Property Value to Household Income Ratio in Selma
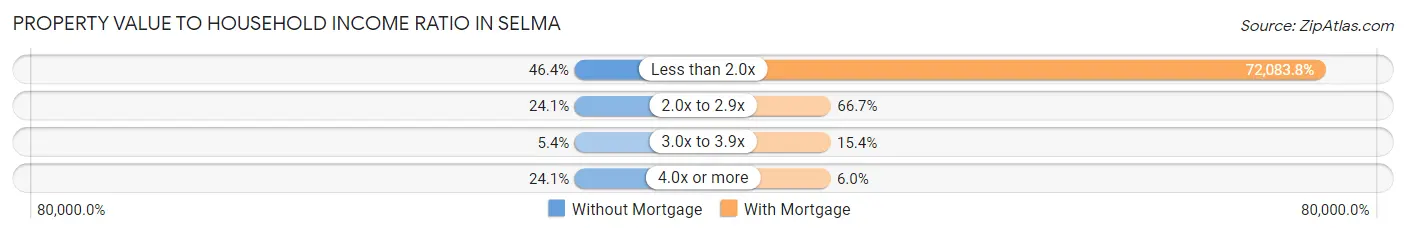
| Value-to-Income Ratio | Without Mortgage | With Mortgage |
| Less than 2.0x | 52 (46.4%) | 84,338 (72,083.8%) |
| 2.0x to 2.9x | 27 (24.1%) | 78 (66.7%) |
| 3.0x to 3.9x | 6 (5.4%) | 18 (15.4%) |
| 4.0x or more | 27 (24.1%) | 7 (6.0%) |
| Total | 112 (100.0%) | 117 (100.0%) |
Real Estate Taxes by Mortgage Status in Selma
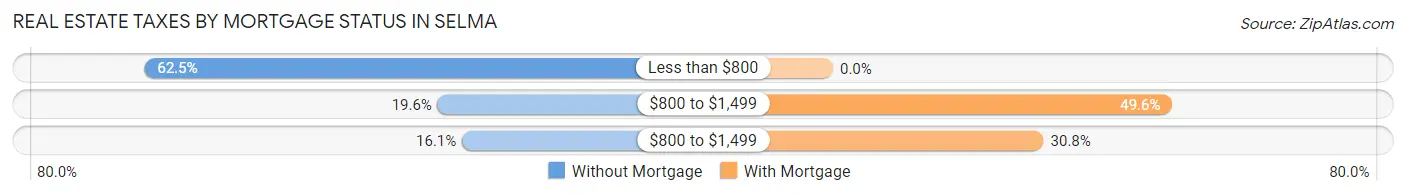
| Property Taxes | Without Mortgage | With Mortgage |
| Less than $800 | 70 (62.5%) | 0 (0.0%) |
| $800 to $1,499 | 22 (19.6%) | 58 (49.6%) |
| $800 to $1,499 | 18 (16.1%) | 36 (30.8%) |
| Total | 112 (100.0%) | 117 (100.0%) |
Health & Disability in Selma
Health Insurance Coverage by Age in Selma
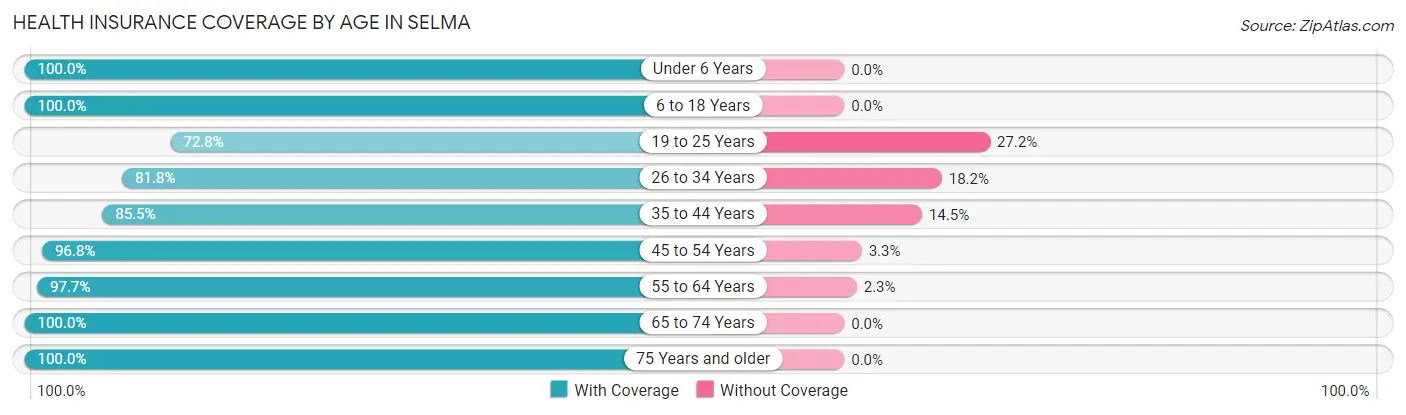
| Age Bracket | With Coverage | Without Coverage |
| Under 6 Years | 70 (100.0%) | 0 (0.0%) |
| 6 to 18 Years | 162 (100.0%) | 0 (0.0%) |
| 19 to 25 Years | 75 (72.8%) | 28 (27.2%) |
| 26 to 34 Years | 81 (81.8%) | 18 (18.2%) |
| 35 to 44 Years | 59 (85.5%) | 10 (14.5%) |
| 45 to 54 Years | 149 (96.8%) | 5 (3.3%) |
| 55 to 64 Years | 84 (97.7%) | 2 (2.3%) |
| 65 to 74 Years | 66 (100.0%) | 0 (0.0%) |
| 75 Years and older | 50 (100.0%) | 0 (0.0%) |
| Total | 796 (92.7%) | 63 (7.3%) |
Health Insurance Coverage by Citizenship Status in Selma
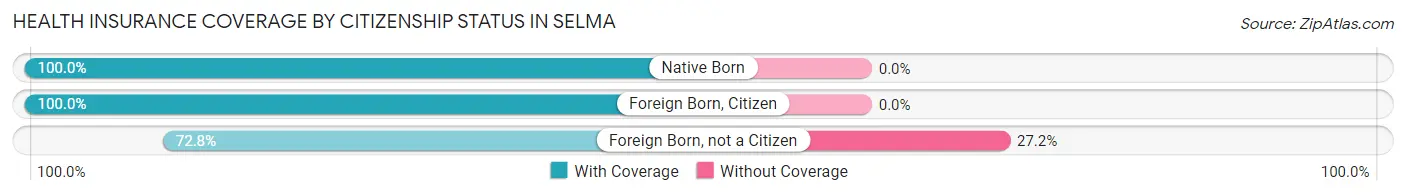
| Citizenship Status | With Coverage | Without Coverage |
| Native Born | 70 (100.0%) | 0 (0.0%) |
| Foreign Born, Citizen | 162 (100.0%) | 0 (0.0%) |
| Foreign Born, not a Citizen | 75 (72.8%) | 28 (27.2%) |
Health Insurance Coverage by Household Income in Selma
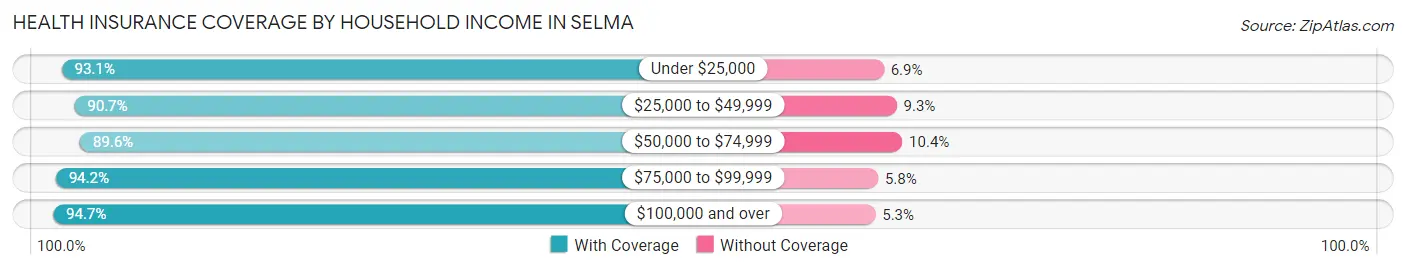
| Household Income | With Coverage | Without Coverage |
| Under $25,000 | 148 (93.1%) | 11 (6.9%) |
| $25,000 to $49,999 | 175 (90.7%) | 18 (9.3%) |
| $50,000 to $74,999 | 121 (89.6%) | 14 (10.4%) |
| $75,000 to $99,999 | 145 (94.2%) | 9 (5.8%) |
| $100,000 and over | 195 (94.7%) | 11 (5.3%) |
Public vs Private Health Insurance Coverage by Age in Selma
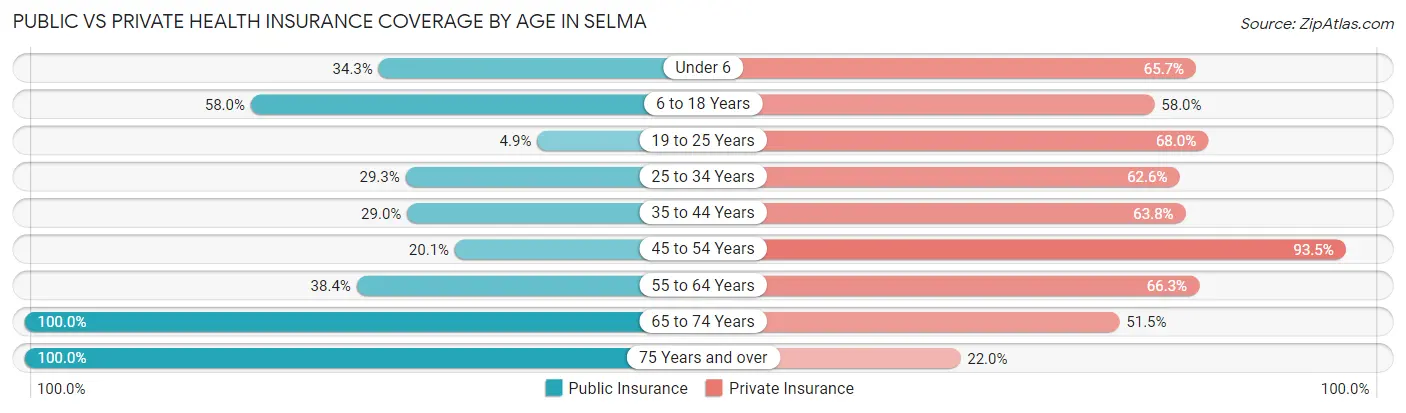
| Age Bracket | Public Insurance | Private Insurance |
| Under 6 | 24 (34.3%) | 46 (65.7%) |
| 6 to 18 Years | 94 (58.0%) | 94 (58.0%) |
| 19 to 25 Years | 5 (4.9%) | 70 (68.0%) |
| 25 to 34 Years | 29 (29.3%) | 62 (62.6%) |
| 35 to 44 Years | 20 (29.0%) | 44 (63.8%) |
| 45 to 54 Years | 31 (20.1%) | 144 (93.5%) |
| 55 to 64 Years | 33 (38.4%) | 57 (66.3%) |
| 65 to 74 Years | 66 (100.0%) | 34 (51.5%) |
| 75 Years and over | 50 (100.0%) | 11 (22.0%) |
| Total | 352 (41.0%) | 562 (65.4%) |
Disability Status by Sex by Age in Selma
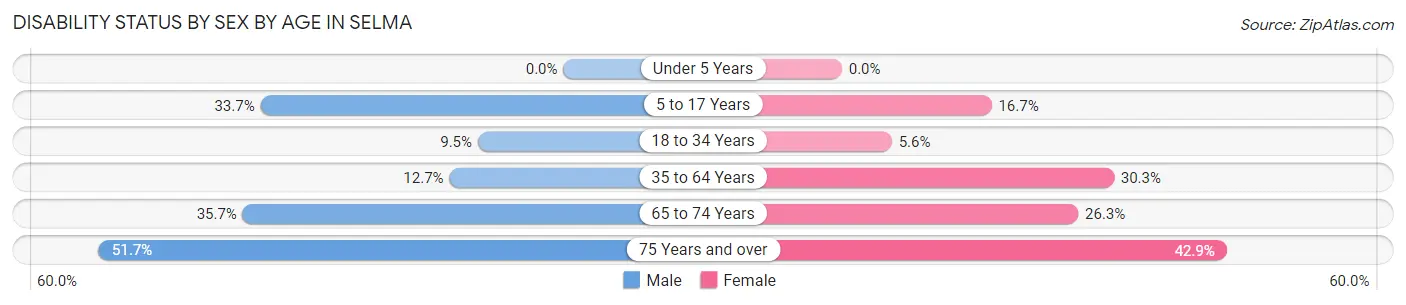
| Age Bracket | Male | Female |
| Under 5 Years | 0 (0.0%) | 0 (0.0%) |
| 5 to 17 Years | 28 (33.7%) | 15 (16.7%) |
| 18 to 34 Years | 12 (9.5%) | 5 (5.6%) |
| 35 to 64 Years | 17 (12.7%) | 53 (30.3%) |
| 65 to 74 Years | 10 (35.7%) | 10 (26.3%) |
| 75 Years and over | 15 (51.7%) | 9 (42.9%) |
Disability Class by Sex by Age in Selma
Disability Class: Hearing Difficulty
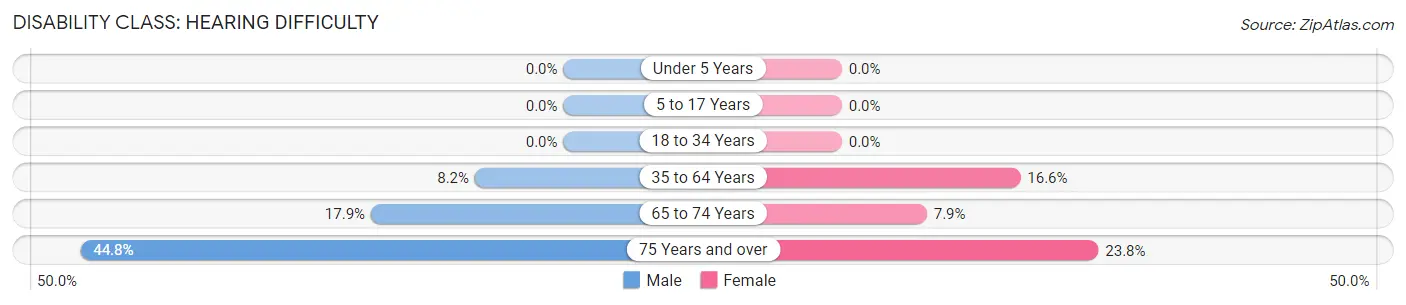
| Age Bracket | Male | Female |
| Under 5 Years | 0 (0.0%) | 0 (0.0%) |
| 5 to 17 Years | 0 (0.0%) | 0 (0.0%) |
| 18 to 34 Years | 0 (0.0%) | 0 (0.0%) |
| 35 to 64 Years | 11 (8.2%) | 29 (16.6%) |
| 65 to 74 Years | 5 (17.9%) | 3 (7.9%) |
| 75 Years and over | 13 (44.8%) | 5 (23.8%) |
Disability Class: Vision Difficulty
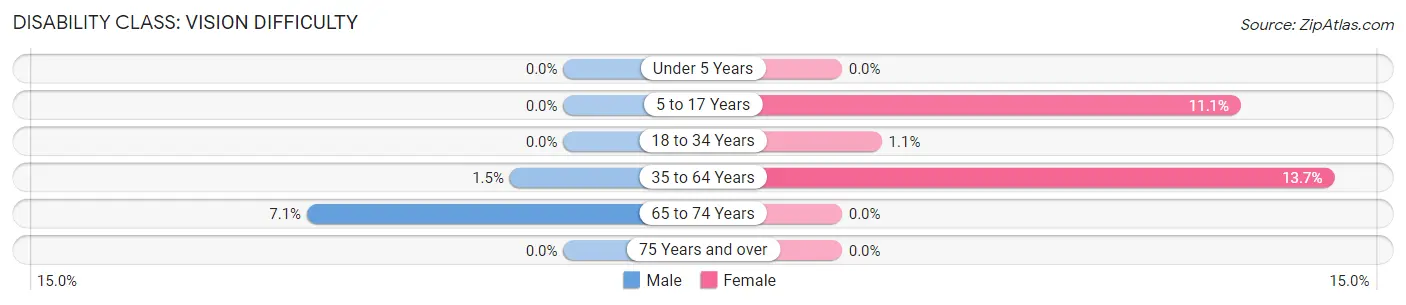
| Age Bracket | Male | Female |
| Under 5 Years | 0 (0.0%) | 0 (0.0%) |
| 5 to 17 Years | 0 (0.0%) | 10 (11.1%) |
| 18 to 34 Years | 0 (0.0%) | 1 (1.1%) |
| 35 to 64 Years | 2 (1.5%) | 24 (13.7%) |
| 65 to 74 Years | 2 (7.1%) | 0 (0.0%) |
| 75 Years and over | 0 (0.0%) | 0 (0.0%) |
Disability Class: Cognitive Difficulty
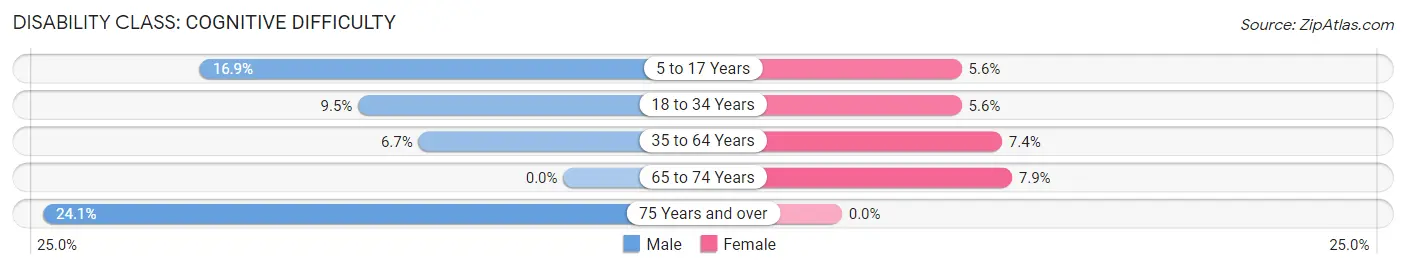
| Age Bracket | Male | Female |
| 5 to 17 Years | 14 (16.9%) | 5 (5.6%) |
| 18 to 34 Years | 12 (9.5%) | 5 (5.6%) |
| 35 to 64 Years | 9 (6.7%) | 13 (7.4%) |
| 65 to 74 Years | 0 (0.0%) | 3 (7.9%) |
| 75 Years and over | 7 (24.1%) | 0 (0.0%) |
Disability Class: Ambulatory Difficulty
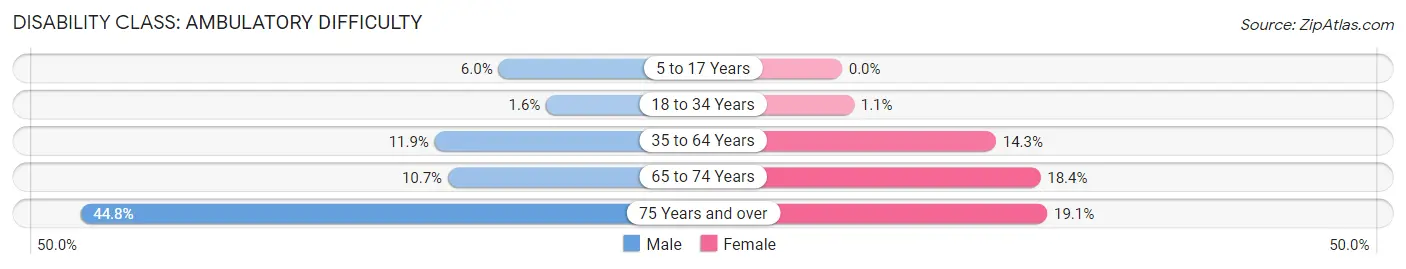
| Age Bracket | Male | Female |
| 5 to 17 Years | 5 (6.0%) | 0 (0.0%) |
| 18 to 34 Years | 2 (1.6%) | 1 (1.1%) |
| 35 to 64 Years | 16 (11.9%) | 25 (14.3%) |
| 65 to 74 Years | 3 (10.7%) | 7 (18.4%) |
| 75 Years and over | 13 (44.8%) | 4 (19.1%) |
Disability Class: Self-Care Difficulty
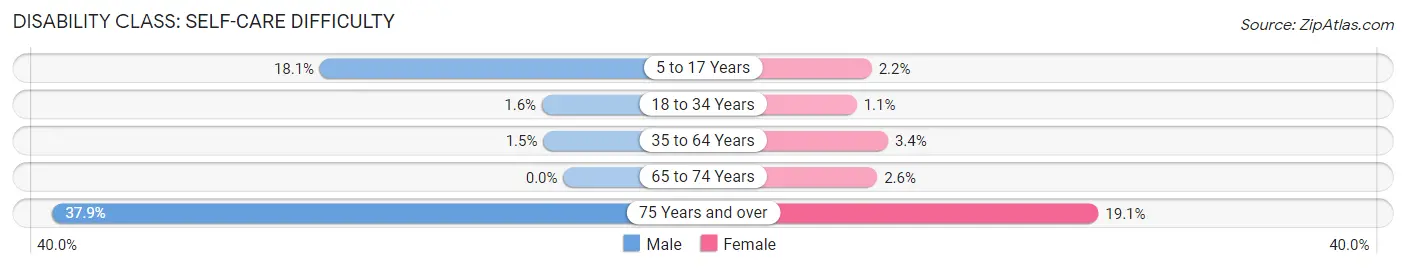
| Age Bracket | Male | Female |
| 5 to 17 Years | 15 (18.1%) | 2 (2.2%) |
| 18 to 34 Years | 2 (1.6%) | 1 (1.1%) |
| 35 to 64 Years | 2 (1.5%) | 6 (3.4%) |
| 65 to 74 Years | 0 (0.0%) | 1 (2.6%) |
| 75 Years and over | 11 (37.9%) | 4 (19.1%) |
Technology Access in Selma
Computing Device Access in Selma
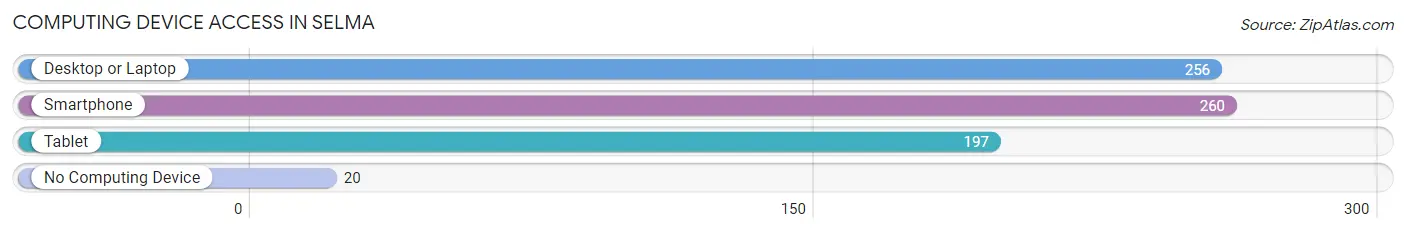
| Device Type | # Households | % Households |
| Desktop or Laptop | 256 | 79.5% |
| Smartphone | 260 | 80.7% |
| Tablet | 197 | 61.2% |
| No Computing Device | 20 | 6.2% |
| Total | 322 | 100.0% |
Internet Access in Selma
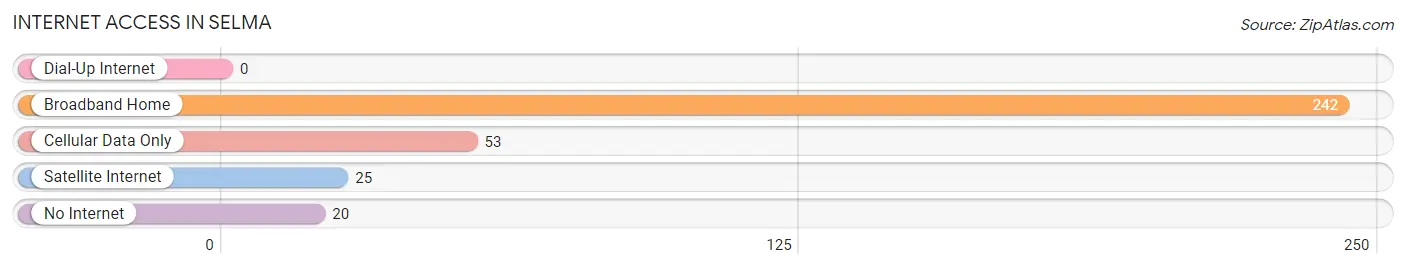
| Internet Type | # Households | % Households |
| Dial-Up Internet | 0 | 0.0% |
| Broadband Home | 242 | 75.2% |
| Cellular Data Only | 53 | 16.5% |
| Satellite Internet | 25 | 7.8% |
| No Internet | 20 | 6.2% |
| Total | 322 | 100.0% |
Selma Summary
Selma, Indiana is a small town located in Delaware County, Indiana. It is situated in the east-central part of the state, about 20 miles northeast of Muncie. The town was founded in 1837 and has a population of approximately 1,000 people.
Geography
Selma is located in the east-central part of Indiana, about 20 miles northeast of Muncie. The town is situated in the White River Valley, which is part of the Wabash River watershed. The town is surrounded by rolling hills and farmland, and is located near the White River. The town is also located near the intersection of State Road 28 and State Road 32.
Economy
Selma’s economy is largely based on agriculture and manufacturing. The town is home to several small businesses, including a grocery store, a hardware store, and a few restaurants. The town also has a few small manufacturing plants, including a plastics factory and a metal fabrication plant.
Demographics
As of the 2010 census, Selma had a population of 1,000 people. The racial makeup of the town was 97.2% White, 0.7% African American, 0.3% Native American, 0.2% Asian, 0.1% Pacific Islander, 0.2% from other races, and 1.3% from two or more races. Hispanic or Latino of any race were 1.3% of the population.
The median income for a household in Selma was $37,500, and the median income for a family was $45,000. The per capita income for the town was $18,000. About 11.2% of families and 14.2% of the population were below the poverty line, including 18.2% of those under age 18 and 8.3% of those age 65 or over.
History
Selma was founded in 1837 by a group of settlers from Ohio. The town was named after Selma, Ohio, the hometown of one of the settlers. The town was originally a farming community, and the first post office was established in 1838.
In the late 19th century, Selma began to grow and develop. The town was incorporated in 1891, and the first bank was established in 1895. The town also had a newspaper, a hotel, and a few stores.
In the early 20th century, Selma continued to grow and develop. The town was connected to the outside world by the railroad in 1910, and the first telephone service was established in 1912. The town also had a movie theater, a library, and a few churches.
Selma experienced a period of decline in the mid-20th century, as many of the town’s businesses closed and the population decreased. However, the town has seen a resurgence in recent years, with new businesses opening and the population increasing.
Today, Selma is a small but vibrant town. The town is home to a variety of businesses, including a grocery store, a hardware store, and a few restaurants. The town also has a few small manufacturing plants, and is home to a number of churches and other organizations. Selma is a great place to live, work, and raise a family.
Common Questions
What is Per Capita Income in Selma?
Per Capita income in Selma is $24,315.
What is the Median Family Income in Selma?
Median Family Income in Selma is $73,462.
What is the Median Household income in Selma?
Median Household Income in Selma is $54,167.
What is Income or Wage Gap in Selma?
Income or Wage Gap in Selma is 72.5%.
Women in Selma earn 27.5 cents for every dollar earned by a man.
What is Family Income Deficit in Selma?
Family Income Deficit in Selma is $10,621.
Families that are below poverty line in Selma earn $10,621 less on average than the poverty threshold level.
What is Inequality or Gini Index in Selma?
Inequality or Gini Index in Selma is 0.36.
What is the Total Population of Selma?
Total Population of Selma is 859.
What is the Total Male Population of Selma?
Total Male Population of Selma is 432.
What is the Total Female Population of Selma?
Total Female Population of Selma is 427.
What is the Ratio of Males per 100 Females in Selma?
There are 101.17 Males per 100 Females in Selma.
What is the Ratio of Females per 100 Males in Selma?
There are 98.84 Females per 100 Males in Selma.
What is the Median Population Age in Selma?
Median Population Age in Selma is 34.1 Years.
What is the Average Family Size in Selma
Average Family Size in Selma is 3.0 People.
What is the Average Household Size in Selma
Average Household Size in Selma is 2.6 People.
How Large is the Labor Force in Selma?
There are 459 People in the Labor Forcein in Selma.
What is the Percentage of People in the Labor Force in Selma?
68.3% of People are in the Labor Force in Selma.
What is the Unemployment Rate in Selma?
Unemployment Rate in Selma is 9.2%.