Marvell, AR Map & Demographics
Marvell Map
Marvell Overview
$27,318
PER CAPITA INCOME
$75,353
AVG FAMILY INCOME
$51,293
AVG HOUSEHOLD INCOME
59.1%
WAGE / INCOME GAP [ % ]
40.9¢/ $1
WAGE / INCOME GAP [ $ ]
$18,046
FAMILY INCOME DEFICIT
0.47
INEQUALITY / GINI INDEX
1,100
TOTAL POPULATION
400
MALE POPULATION
700
FEMALE POPULATION
57.14
MALES / 100 FEMALES
175.00
FEMALES / 100 MALES
42.5
MEDIAN AGE
3.4
AVG FAMILY SIZE
2.6
AVG HOUSEHOLD SIZE
471
LABOR FORCE [ PEOPLE ]
57.5%
PERCENT IN LABOR FORCE
17.2%
UNEMPLOYMENT RATE
Marvell Zip Codes
Marvell Area Codes
Income in Marvell
Income Overview in Marvell
Per Capita Income in Marvell is $27,318, while median incomes of families and households are $75,353 and $51,293 respectively.
| Characteristic | Number | Measure |
| Per Capita Income | 1,100 | $27,318 |
| Median Family Income | 277 | $75,353 |
| Mean Family Income | 277 | $82,332 |
| Median Household Income | 426 | $51,293 |
| Mean Household Income | 426 | $67,882 |
| Income Deficit | 277 | $18,046 |
| Wage / Income Gap (%) | 1,100 | 59.07% |
| Wage / Income Gap ($) | 1,100 | 40.93¢ per $1 |
| Gini / Inequality Index | 1,100 | 0.47 |
Earnings by Sex in Marvell
Average Earnings in Marvell are $34,018, $52,396 for men and $21,447 for women, a difference of 59.1%.

| Sex | Number | Average Earnings |
| Male | 207 (41.3%) | $52,396 |
| Female | 294 (58.7%) | $21,447 |
| Total | 501 (100.0%) | $34,018 |
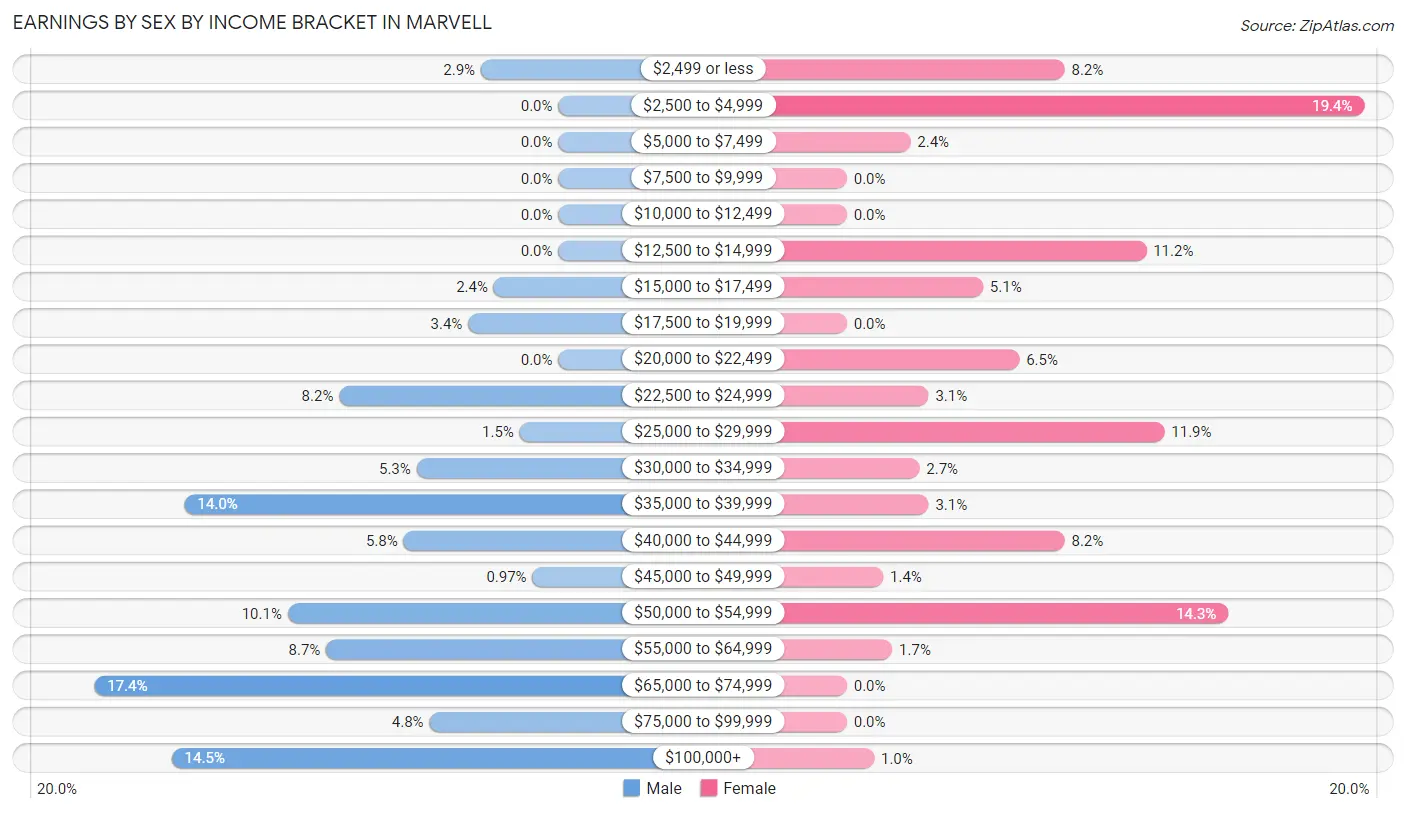
Earnings by Sex by Income Bracket in Marvell
The most common earnings brackets in Marvell are $65,000 to $74,999 for men (36 | 17.4%) and $2,500 to $4,999 for women (57 | 19.4%).
| Income | Male | Female |
| $2,499 or less | 6 (2.9%) | 24 (8.2%) |
| $2,500 to $4,999 | 0 (0.0%) | 57 (19.4%) |
| $5,000 to $7,499 | 0 (0.0%) | 7 (2.4%) |
| $7,500 to $9,999 | 0 (0.0%) | 0 (0.0%) |
| $10,000 to $12,499 | 0 (0.0%) | 0 (0.0%) |
| $12,500 to $14,999 | 0 (0.0%) | 33 (11.2%) |
| $15,000 to $17,499 | 5 (2.4%) | 15 (5.1%) |
| $17,500 to $19,999 | 7 (3.4%) | 0 (0.0%) |
| $20,000 to $22,499 | 0 (0.0%) | 19 (6.5%) |
| $22,500 to $24,999 | 17 (8.2%) | 9 (3.1%) |
| $25,000 to $29,999 | 3 (1.5%) | 35 (11.9%) |
| $30,000 to $34,999 | 11 (5.3%) | 8 (2.7%) |
| $35,000 to $39,999 | 29 (14.0%) | 9 (3.1%) |
| $40,000 to $44,999 | 12 (5.8%) | 24 (8.2%) |
| $45,000 to $49,999 | 2 (1.0%) | 4 (1.4%) |
| $50,000 to $54,999 | 21 (10.1%) | 42 (14.3%) |
| $55,000 to $64,999 | 18 (8.7%) | 5 (1.7%) |
| $65,000 to $74,999 | 36 (17.4%) | 0 (0.0%) |
| $75,000 to $99,999 | 10 (4.8%) | 0 (0.0%) |
| $100,000+ | 30 (14.5%) | 3 (1.0%) |
| Total | 207 (100.0%) | 294 (100.0%) |
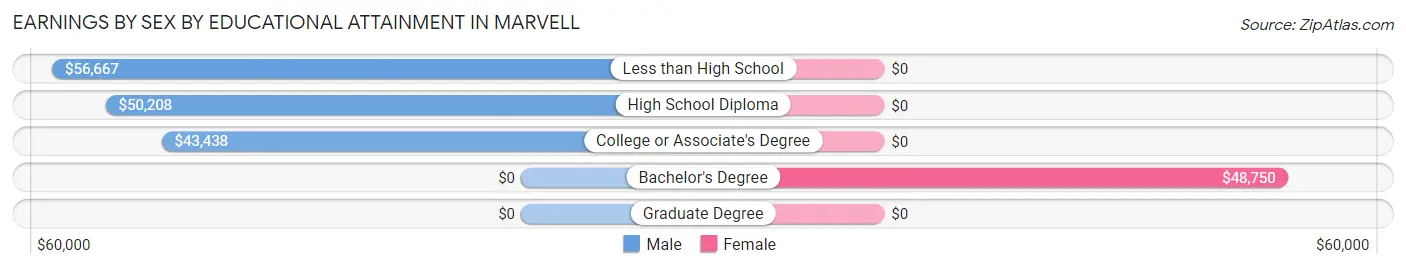
Earnings by Sex by Educational Attainment in Marvell
Average earnings in Marvell are $51,563 for men and $30,625 for women, a difference of 40.6%. Men with an educational attainment of less than high school enjoy the highest average annual earnings of $56,667, while those with college or associate's degree education earn the least with $43,438. Women with an educational attainment of bachelor's degree earn the most with the average annual earnings of $48,750, while those with bachelor's degree education have the smallest earnings of $48,750.
| Educational Attainment | Male Income | Female Income |
| Less than High School | $56,667 | $0 |
| High School Diploma | $50,208 | $0 |
| College or Associate's Degree | $43,438 | $0 |
| Bachelor's Degree | - | - |
| Graduate Degree | - | - |
| Total | $51,563 | $30,625 |
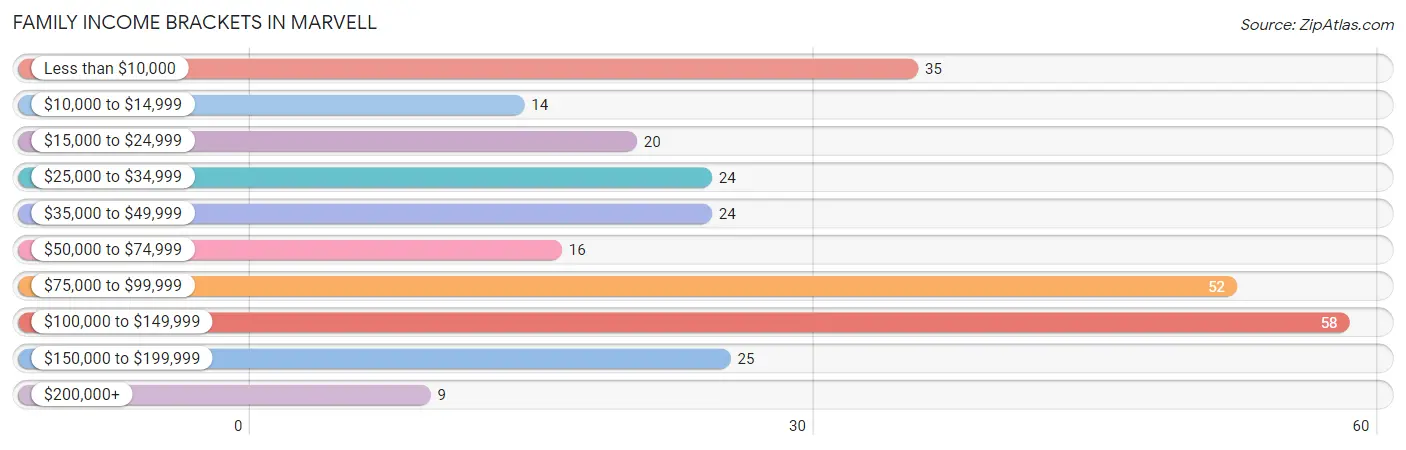
Family Income in Marvell
Family Income Brackets in Marvell
According to the Marvell family income data, there are 58 families falling into the $100,000 to $149,999 income range, which is the most common income bracket and makes up 20.9% of all families. Conversely, the $200,000+ income bracket is the least frequent group with only 9 families (3.3%) belonging to this category.
| Income Bracket | # Families | % Families |
| Less than $10,000 | 35 | 12.6% |
| $10,000 to $14,999 | 14 | 5.1% |
| $15,000 to $24,999 | 20 | 7.2% |
| $25,000 to $34,999 | 24 | 8.7% |
| $35,000 to $49,999 | 24 | 8.7% |
| $50,000 to $74,999 | 16 | 5.8% |
| $75,000 to $99,999 | 52 | 18.8% |
| $100,000 to $149,999 | 58 | 20.9% |
| $150,000 to $199,999 | 25 | 9.0% |
| $200,000+ | 9 | 3.2% |
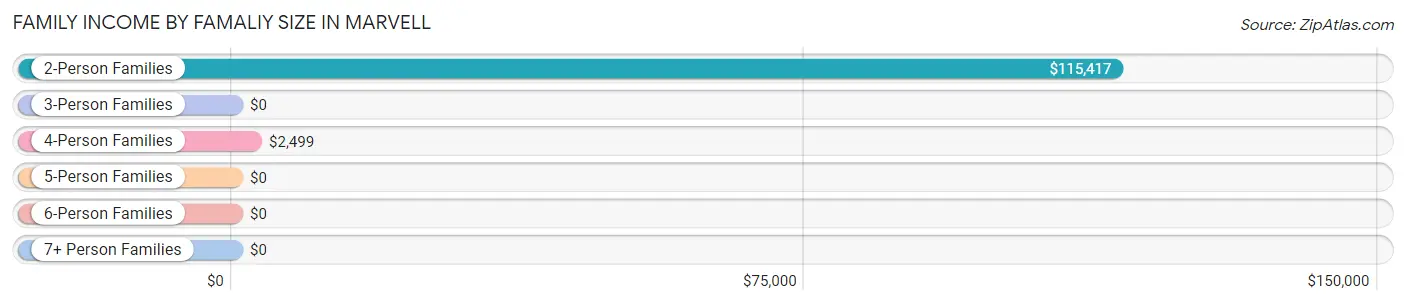
Family Income by Famaliy Size in Marvell
2-person families (146 | 52.7%) account for the highest median family income in Marvell with $115,417 per family, while 2-person families (146 | 52.7%) have the highest median income of $57,708 per family member.
| Income Bracket | # Families | Median Income |
| 2-Person Families | 146 (52.7%) | $115,417 |
| 3-Person Families | 40 (14.4%) | $0 |
| 4-Person Families | 39 (14.1%) | $2,499 |
| 5-Person Families | 1 (0.4%) | $0 |
| 6-Person Families | 39 (14.1%) | $0 |
| 7+ Person Families | 12 (4.3%) | $0 |
| Total | 277 (100.0%) | $75,353 |
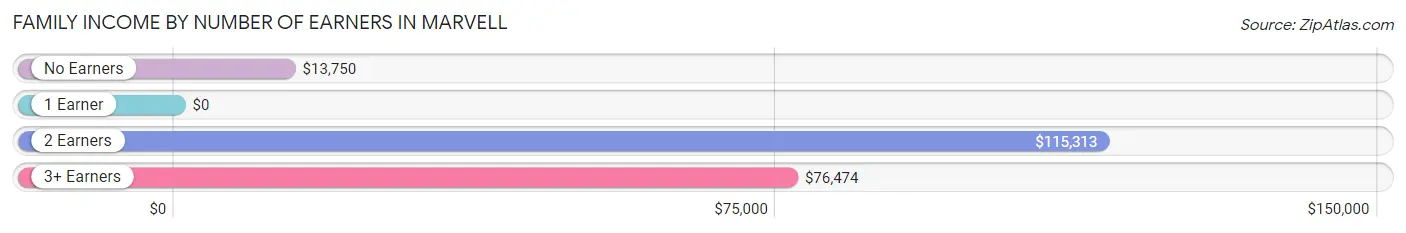
Family Income by Number of Earners in Marvell
| Number of Earners | # Families | Median Income |
| No Earners | 54 (19.5%) | $13,750 |
| 1 Earner | 80 (28.9%) | $0 |
| 2 Earners | 97 (35.0%) | $115,313 |
| 3+ Earners | 46 (16.6%) | $76,474 |
| Total | 277 (100.0%) | $75,353 |
Household Income in Marvell
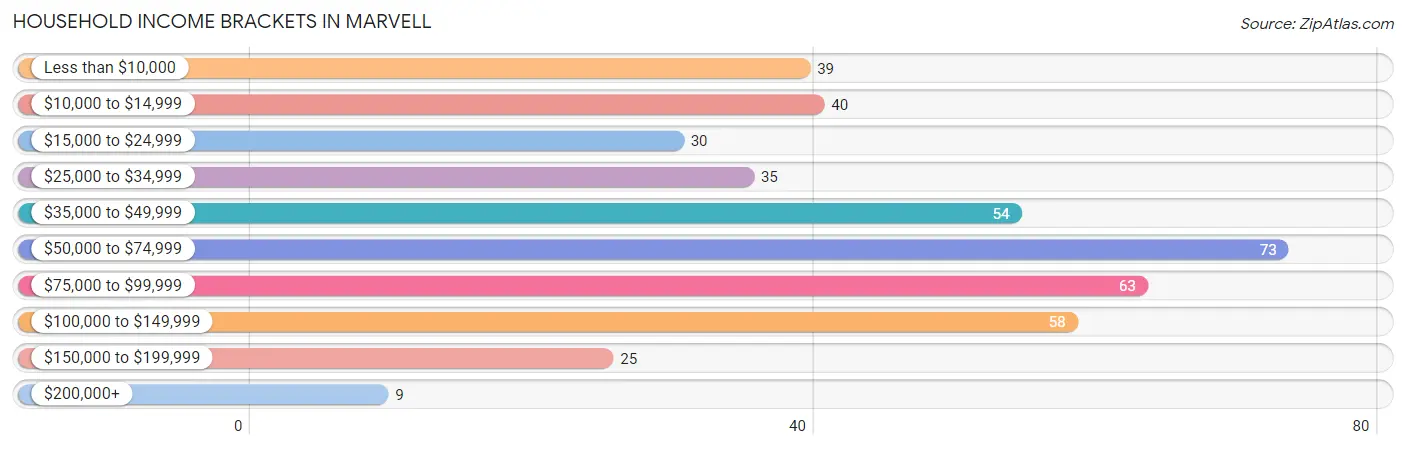
Household Income Brackets in Marvell
With 73 households falling in the category, the $50,000 to $74,999 income range is the most frequent in Marvell, accounting for 17.1% of all households. In contrast, only 9 households (2.1%) fall into the $200,000+ income bracket, making it the least populous group.
| Income Bracket | # Households | % Households |
| Less than $10,000 | 39 | 9.2% |
| $10,000 to $14,999 | 40 | 9.4% |
| $15,000 to $24,999 | 30 | 7.0% |
| $25,000 to $34,999 | 35 | 8.2% |
| $35,000 to $49,999 | 54 | 12.7% |
| $50,000 to $74,999 | 73 | 17.1% |
| $75,000 to $99,999 | 63 | 14.8% |
| $100,000 to $149,999 | 58 | 13.6% |
| $150,000 to $199,999 | 25 | 5.9% |
| $200,000+ | 9 | 2.1% |
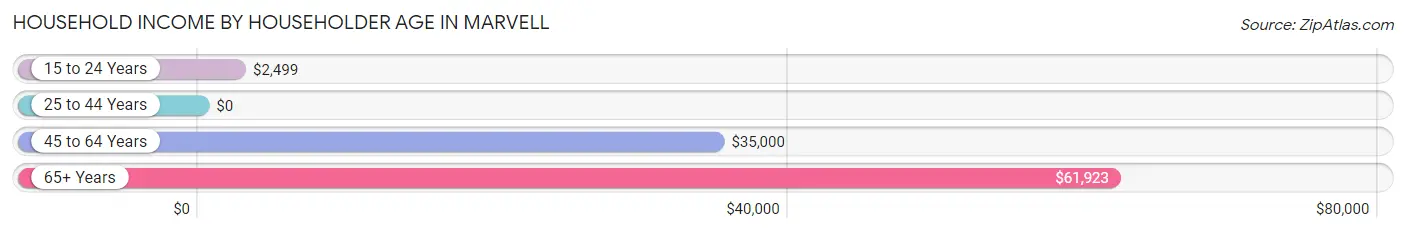
Household Income by Householder Age in Marvell
The median household income in Marvell is $51,293, with the highest median household income of $61,923 found in the 65+ years age bracket for the primary householder. A total of 196 households (46.0%) fall into this category. Meanwhile, the 25 to 44 years age bracket for the primary householder has the lowest median household income of $0, with 104 households (24.4%) in this group.
| Income Bracket | # Households | Median Income |
| 15 to 24 Years | 12 (2.8%) | $2,499 |
| 25 to 44 Years | 104 (24.4%) | $0 |
| 45 to 64 Years | 114 (26.8%) | $35,000 |
| 65+ Years | 196 (46.0%) | $61,923 |
| Total | 426 (100.0%) | $51,293 |
Poverty in Marvell
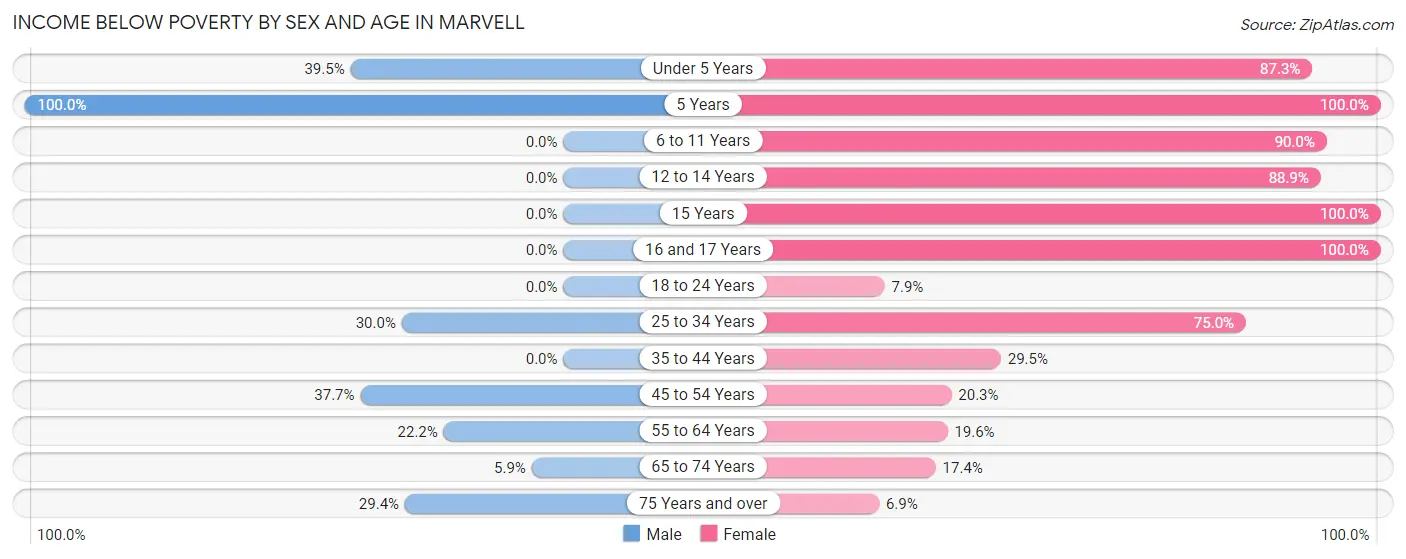
Income Below Poverty by Sex and Age in Marvell
With 21.7% poverty level for males and 38.3% for females among the residents of Marvell, 5 year old males and 5 year old females are the most vulnerable to poverty, with 7 males (100.0%) and 10 females (100.0%) in their respective age groups living below the poverty level.
| Age Bracket | Male | Female |
| Under 5 Years | 32 (39.5%) | 55 (87.3%) |
| 5 Years | 7 (100.0%) | 10 (100.0%) |
| 6 to 11 Years | 0 (0.0%) | 36 (90.0%) |
| 12 to 14 Years | 0 (0.0%) | 24 (88.9%) |
| 15 Years | 0 (0.0%) | 23 (100.0%) |
| 16 and 17 Years | 0 (0.0%) | 23 (100.0%) |
| 18 to 24 Years | 0 (0.0%) | 10 (7.9%) |
| 25 to 34 Years | 3 (30.0%) | 9 (75.0%) |
| 35 to 44 Years | 0 (0.0%) | 31 (29.5%) |
| 45 to 54 Years | 26 (37.7%) | 12 (20.3%) |
| 55 to 64 Years | 8 (22.2%) | 10 (19.6%) |
| 65 to 74 Years | 6 (5.9%) | 23 (17.4%) |
| 75 Years and over | 5 (29.4%) | 2 (6.9%) |
| Total | 87 (21.7%) | 268 (38.3%) |
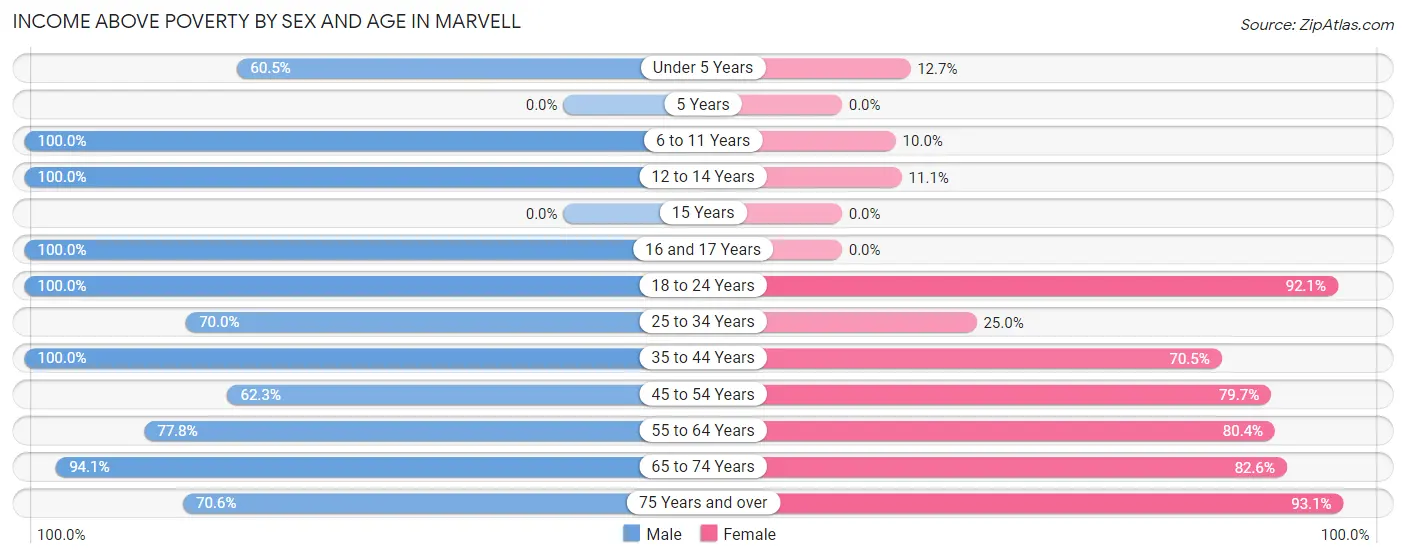
Income Above Poverty by Sex and Age in Marvell
According to the poverty statistics in Marvell, males aged 6 to 11 years and females aged 75 years and over are the age groups that are most secure financially, with 100.0% of males and 93.1% of females in these age groups living above the poverty line.
| Age Bracket | Male | Female |
| Under 5 Years | 49 (60.5%) | 8 (12.7%) |
| 5 Years | 0 (0.0%) | 0 (0.0%) |
| 6 to 11 Years | 25 (100.0%) | 4 (10.0%) |
| 12 to 14 Years | 5 (100.0%) | 3 (11.1%) |
| 15 Years | 0 (0.0%) | 0 (0.0%) |
| 16 and 17 Years | 2 (100.0%) | 0 (0.0%) |
| 18 to 24 Years | 11 (100.0%) | 116 (92.1%) |
| 25 to 34 Years | 7 (70.0%) | 3 (25.0%) |
| 35 to 44 Years | 35 (100.0%) | 74 (70.5%) |
| 45 to 54 Years | 43 (62.3%) | 47 (79.7%) |
| 55 to 64 Years | 28 (77.8%) | 41 (80.4%) |
| 65 to 74 Years | 96 (94.1%) | 109 (82.6%) |
| 75 Years and over | 12 (70.6%) | 27 (93.1%) |
| Total | 313 (78.2%) | 432 (61.7%) |
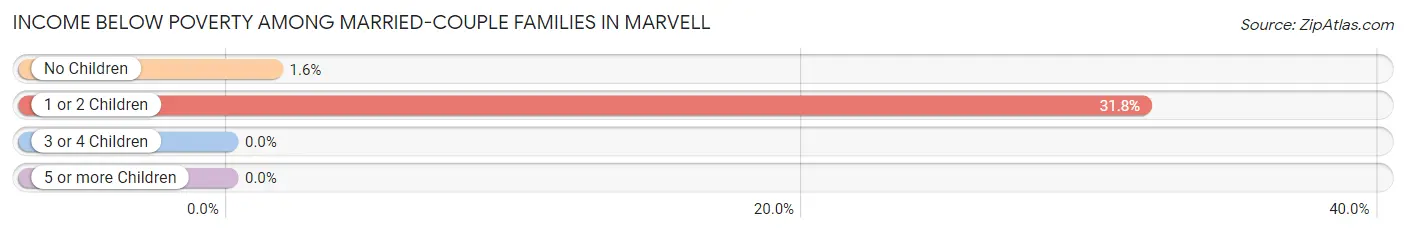
Income Below Poverty Among Married-Couple Families in Marvell
The poverty statistics for married-couple families in Marvell show that 6.0% or 9 of the total 151 families live below the poverty line. Families with 1 or 2 children have the highest poverty rate of 31.8%, comprising of 7 families. On the other hand, families with no children have the lowest poverty rate of 1.5%, which includes 2 families.
| Children | Above Poverty | Below Poverty |
| No Children | 127 (98.5%) | 2 (1.5%) |
| 1 or 2 Children | 15 (68.2%) | 7 (31.8%) |
| 3 or 4 Children | 0 (0.0%) | 0 (0.0%) |
| 5 or more Children | 0 (0.0%) | 0 (0.0%) |
| Total | 142 (94.0%) | 9 (6.0%) |
Income Below Poverty Among Single-Parent Households in Marvell
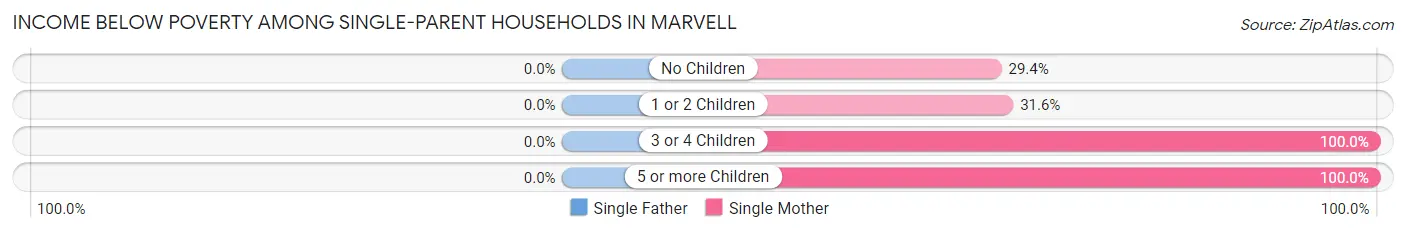
| Children | Single Father | Single Mother |
| No Children | 0 (0.0%) | 10 (29.4%) |
| 1 or 2 Children | 0 (0.0%) | 18 (31.6%) |
| 3 or 4 Children | 0 (0.0%) | 23 (100.0%) |
| 5 or more Children | 0 (0.0%) | 12 (100.0%) |
| Total | 0 (0.0%) | 63 (50.0%) |
Income Below Poverty Among Married-Couple vs Single-Parent Households in Marvell
The poverty data for Marvell shows that 9 of the married-couple family households (6.0%) and 63 of the single-parent households (50.0%) are living below the poverty level. Within the married-couple family households, those with 1 or 2 children have the highest poverty rate, with 7 households (31.8%) falling below the poverty line. Among the single-parent households, those with 3 or 4 children have the highest poverty rate, with 23 household (100.0%) living below poverty.
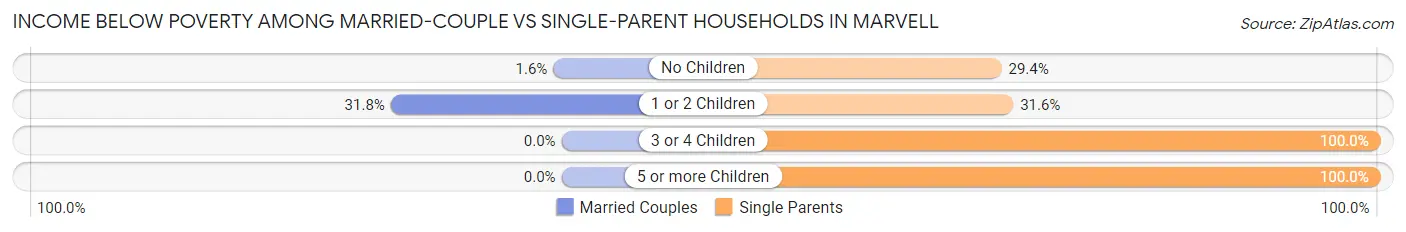
| Children | Married-Couple Families | Single-Parent Households |
| No Children | 2 (1.5%) | 10 (29.4%) |
| 1 or 2 Children | 7 (31.8%) | 18 (31.6%) |
| 3 or 4 Children | 0 (0.0%) | 23 (100.0%) |
| 5 or more Children | 0 (0.0%) | 12 (100.0%) |
| Total | 9 (6.0%) | 63 (50.0%) |
Race in Marvell
The most populous races in Marvell are Black / African American (648 | 58.9%), White / Caucasian (409 | 37.2%), and Two or more Races (36 | 3.3%).
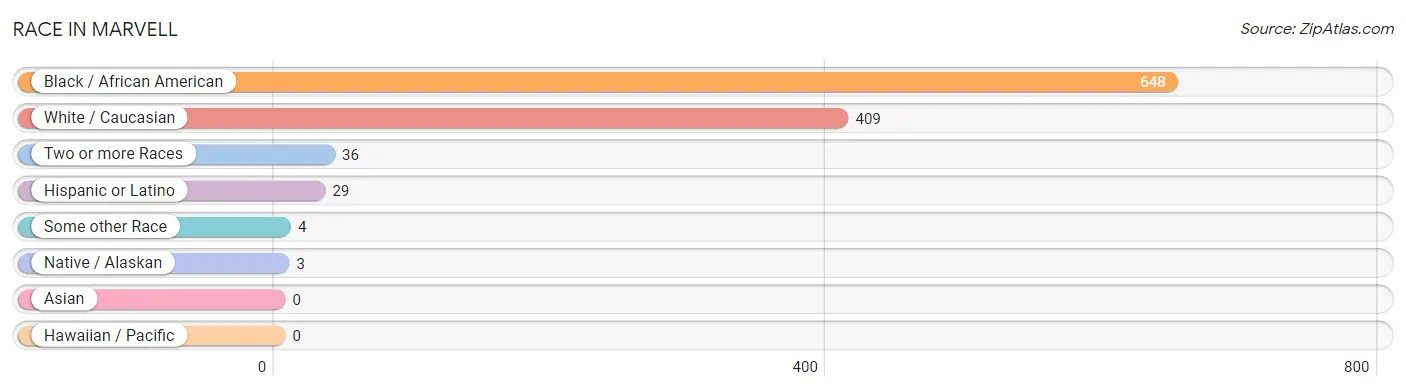
| Race | # Population | % Population |
| Asian | 0 | 0.0% |
| Black / African American | 648 | 58.9% |
| Hawaiian / Pacific | 0 | 0.0% |
| Hispanic or Latino | 29 | 2.6% |
| Native / Alaskan | 3 | 0.3% |
| White / Caucasian | 409 | 37.2% |
| Two or more Races | 36 | 3.3% |
| Some other Race | 4 | 0.4% |
| Total | 1,100 | 100.0% |
Ancestry in Marvell
The most populous ancestries reported in Marvell are American (136 | 12.4%), English (32 | 2.9%), German (32 | 2.9%), Irish (32 | 2.9%), and Mexican (29 | 2.6%), together accounting for 23.7% of all Marvell residents.
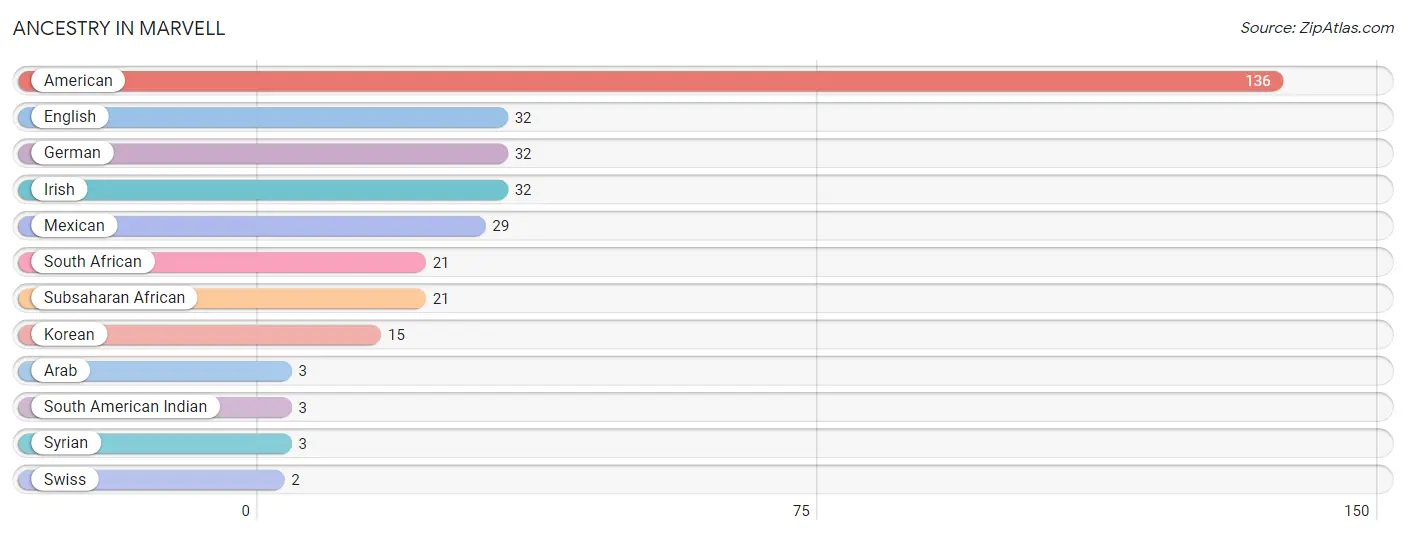
| Ancestry | # Population | % Population |
| American | 136 | 12.4% |
| Arab | 3 | 0.3% |
| English | 32 | 2.9% |
| German | 32 | 2.9% |
| Irish | 32 | 2.9% |
| Korean | 15 | 1.4% |
| Mexican | 29 | 2.6% |
| South African | 21 | 1.9% |
| South American Indian | 3 | 0.3% |
| Subsaharan African | 21 | 1.9% |
| Swiss | 2 | 0.2% |
| Syrian | 3 | 0.3% | View All 12 Rows |
Immigrants in Marvell
The most numerous immigrant groups reported in Marvell came from Africa (21 | 1.9%), South Africa (21 | 1.9%), Central America (8 | 0.7%), Latin America (8 | 0.7%), and Mexico (8 | 0.7%), together accounting for 6.0% of all Marvell residents.
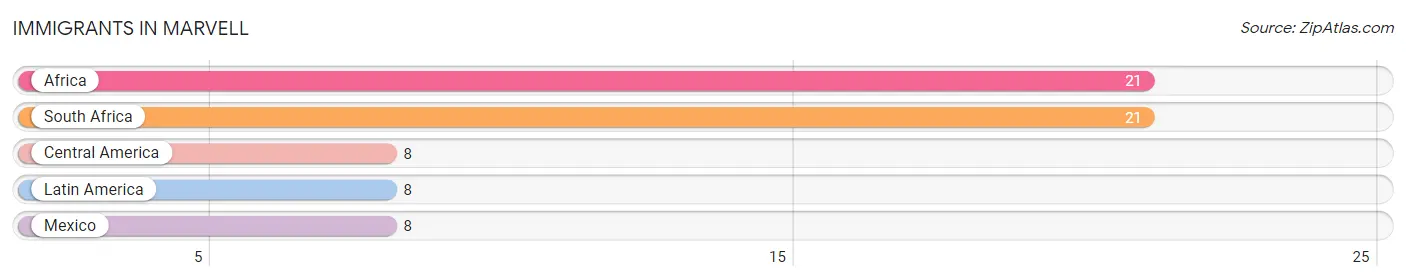
| Immigration Origin | # Population | % Population |
| Africa | 21 | 1.9% |
| Central America | 8 | 0.7% |
| Latin America | 8 | 0.7% |
| Mexico | 8 | 0.7% |
| South Africa | 21 | 1.9% | View All 5 Rows |
Sex and Age in Marvell
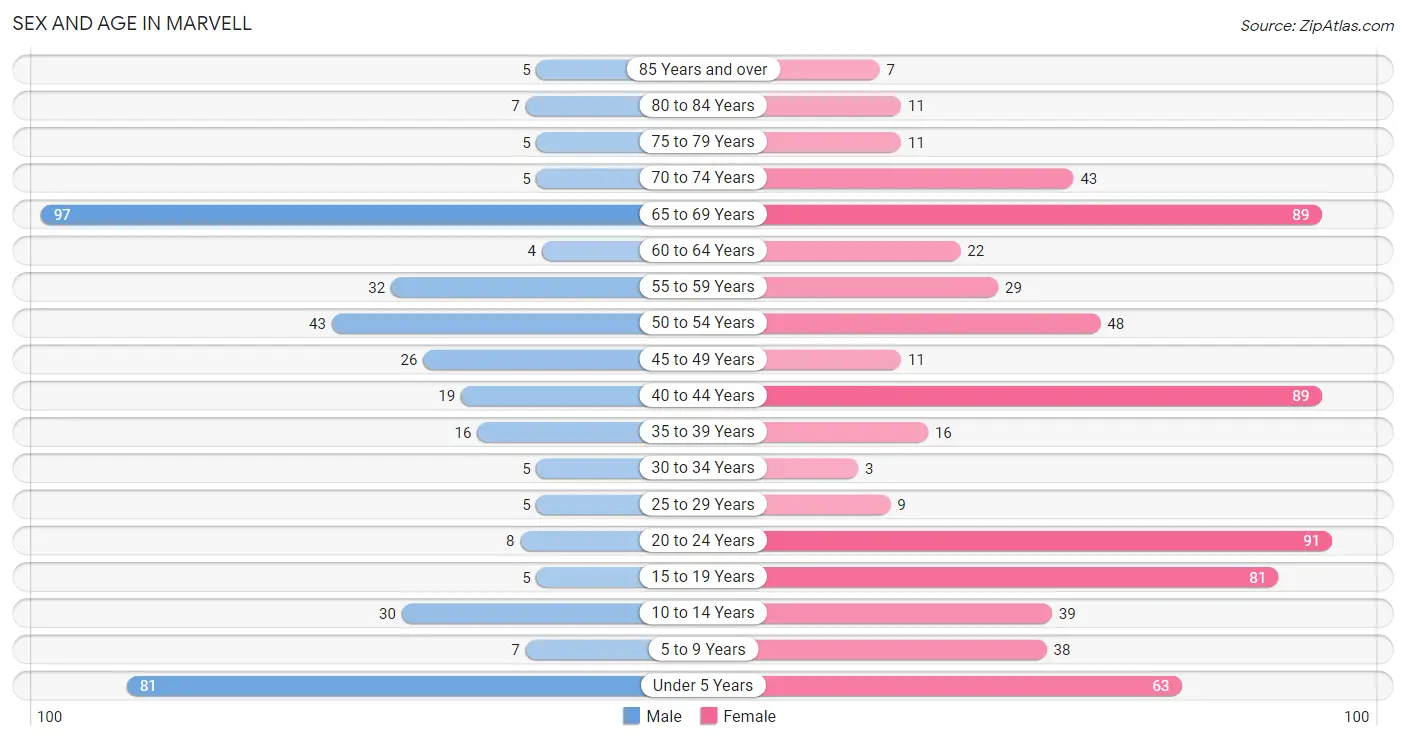
Sex and Age in Marvell
The most populous age groups in Marvell are 65 to 69 Years (97 | 24.2%) for men and 20 to 24 Years (91 | 13.0%) for women.
| Age Bracket | Male | Female |
| Under 5 Years | 81 (20.3%) | 63 (9.0%) |
| 5 to 9 Years | 7 (1.8%) | 38 (5.4%) |
| 10 to 14 Years | 30 (7.5%) | 39 (5.6%) |
| 15 to 19 Years | 5 (1.3%) | 81 (11.6%) |
| 20 to 24 Years | 8 (2.0%) | 91 (13.0%) |
| 25 to 29 Years | 5 (1.3%) | 9 (1.3%) |
| 30 to 34 Years | 5 (1.3%) | 3 (0.4%) |
| 35 to 39 Years | 16 (4.0%) | 16 (2.3%) |
| 40 to 44 Years | 19 (4.8%) | 89 (12.7%) |
| 45 to 49 Years | 26 (6.5%) | 11 (1.6%) |
| 50 to 54 Years | 43 (10.7%) | 48 (6.9%) |
| 55 to 59 Years | 32 (8.0%) | 29 (4.1%) |
| 60 to 64 Years | 4 (1.0%) | 22 (3.1%) |
| 65 to 69 Years | 97 (24.2%) | 89 (12.7%) |
| 70 to 74 Years | 5 (1.3%) | 43 (6.1%) |
| 75 to 79 Years | 5 (1.3%) | 11 (1.6%) |
| 80 to 84 Years | 7 (1.8%) | 11 (1.6%) |
| 85 Years and over | 5 (1.3%) | 7 (1.0%) |
| Total | 400 (100.0%) | 700 (100.0%) |
Families and Households in Marvell
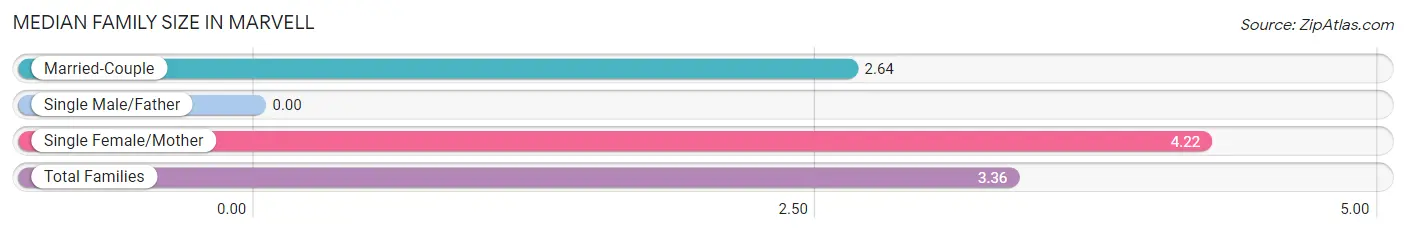
Median Family Size in Marvell
| Family Type | # Families | Family Size |
| Married-Couple | 151 (54.5%) | 2.64 |
| Single Male/Father | 0 (0.0%) | - |
| Single Female/Mother | 126 (45.5%) | 4.22 |
| Total Families | 277 (100.0%) | 3.36 |
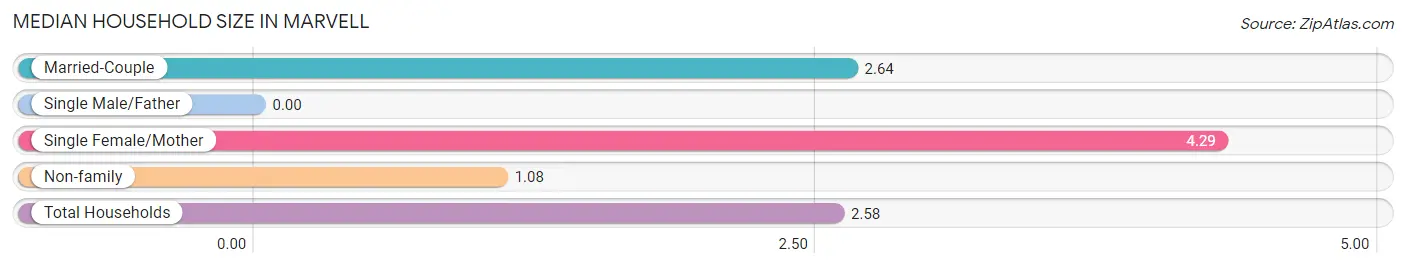
Median Household Size in Marvell
| Household Type | # Households | Household Size |
| Married-Couple | 151 (35.4%) | 2.64 |
| Single Male/Father | 0 (0.0%) | - |
| Single Female/Mother | 126 (29.6%) | 4.29 |
| Non-family | 149 (35.0%) | 1.08 |
| Total Households | 426 (100.0%) | 2.58 |
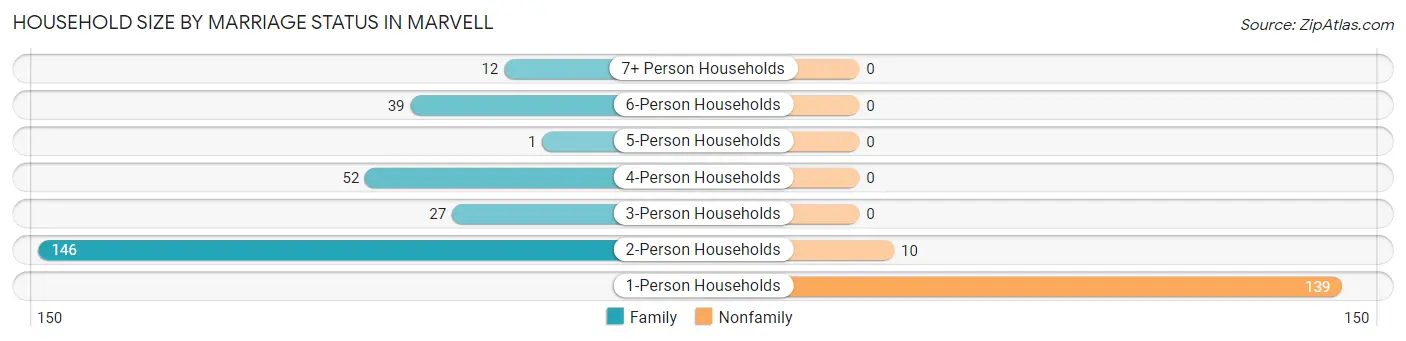
Household Size by Marriage Status in Marvell
Out of a total of 426 households in Marvell, 277 (65.0%) are family households, while 149 (35.0%) are nonfamily households. The most numerous type of family households are 2-person households, comprising 146, and the most common type of nonfamily households are 1-person households, comprising 139.
| Household Size | Family Households | Nonfamily Households |
| 1-Person Households | - | 139 (32.6%) |
| 2-Person Households | 146 (34.3%) | 10 (2.4%) |
| 3-Person Households | 27 (6.3%) | 0 (0.0%) |
| 4-Person Households | 52 (12.2%) | 0 (0.0%) |
| 5-Person Households | 1 (0.2%) | 0 (0.0%) |
| 6-Person Households | 39 (9.1%) | 0 (0.0%) |
| 7+ Person Households | 12 (2.8%) | 0 (0.0%) |
| Total | 277 (65.0%) | 149 (35.0%) |
Female Fertility in Marvell
Fertility by Age in Marvell
Average fertility rate in Marvell is 127.0 births per 1,000 women. Women in the age bracket of 15 to 19 years have the highest fertility rate with 198.0 births per 1,000 women. Women in the age bracket of 15 to 19 years acount for 42.1% of all women with births.
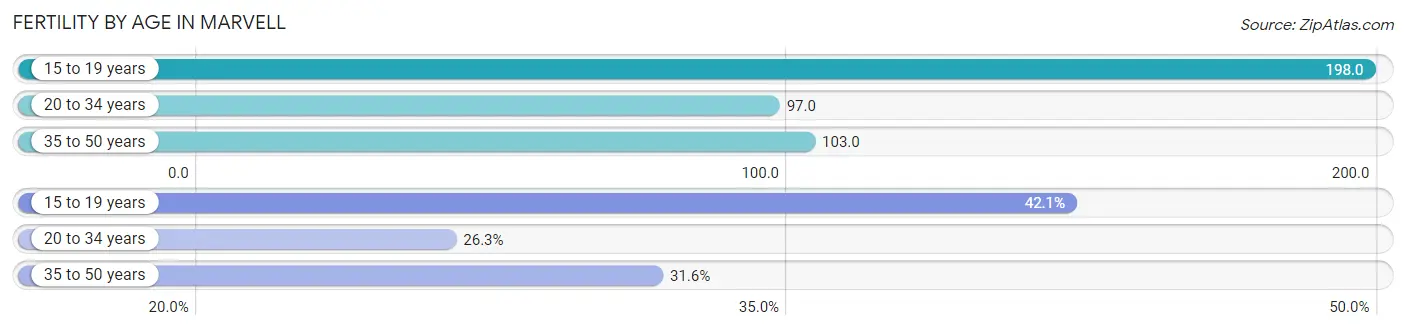
| Age Bracket | Women with Births | Births / 1,000 Women |
| 15 to 19 years | 16 (42.1%) | 198.0 |
| 20 to 34 years | 10 (26.3%) | 97.0 |
| 35 to 50 years | 12 (31.6%) | 103.0 |
| Total | 38 (100.0%) | 127.0 |
Fertility by Age by Marriage Status in Marvell
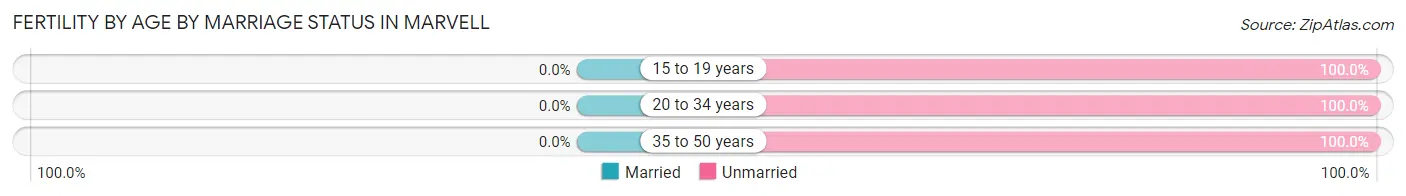
| Age Bracket | Married | Unmarried |
| 15 to 19 years | 0 (0.0%) | 16 (100.0%) |
| 20 to 34 years | 0 (0.0%) | 10 (100.0%) |
| 35 to 50 years | 0 (0.0%) | 12 (100.0%) |
| Total | 0 (0.0%) | 38 (100.0%) |
Fertility by Education in Marvell
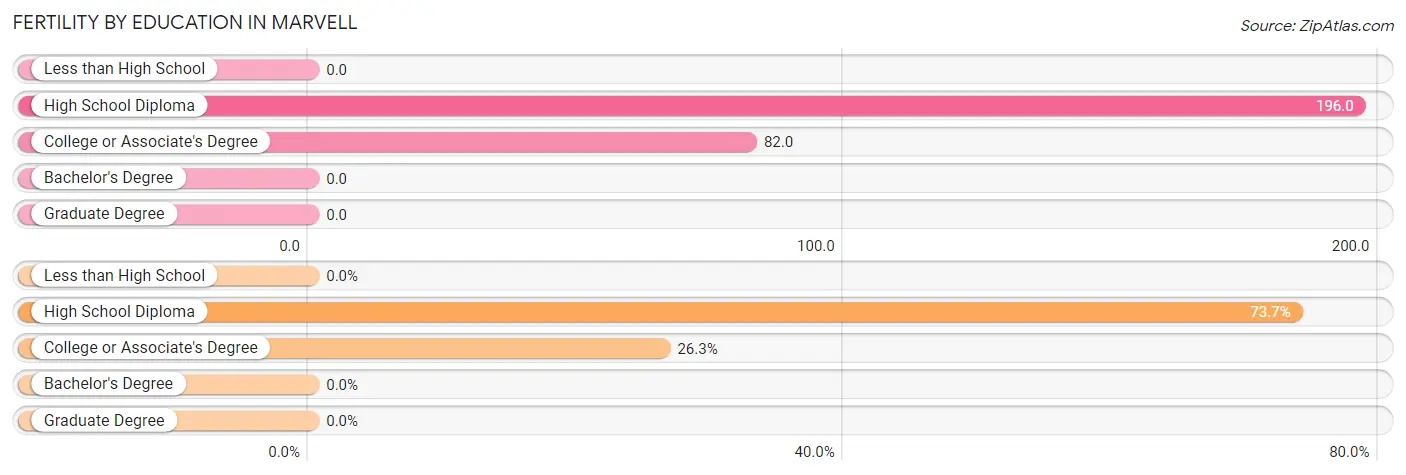
| Educational Attainment | Women with Births | Births / 1,000 Women |
| Less than High School | 0 (0.0%) | 0.0 |
| High School Diploma | 28 (73.7%) | 196.0 |
| College or Associate's Degree | 10 (26.3%) | 82.0 |
| Bachelor's Degree | 0 (0.0%) | 0.0 |
| Graduate Degree | 0 (0.0%) | 0.0 |
| Total | 38 (100.0%) | 127.0 |
Fertility by Education by Marriage Status in Marvell
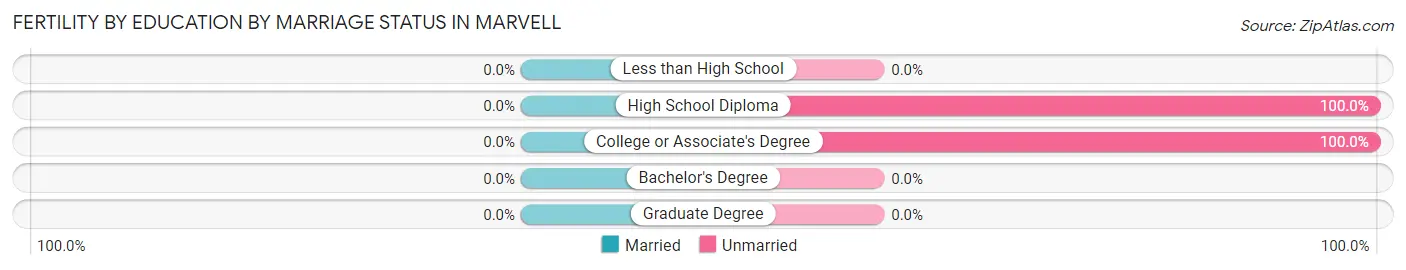
| Educational Attainment | Married | Unmarried |
| Less than High School | 0 (0.0%) | 0 (0.0%) |
| High School Diploma | 0 (0.0%) | 28 (100.0%) |
| College or Associate's Degree | 0 (0.0%) | 10 (100.0%) |
| Bachelor's Degree | 0 (0.0%) | 0 (0.0%) |
| Graduate Degree | 0 (0.0%) | 0 (0.0%) |
| Total | 0 (0.0%) | 38 (100.0%) |
Employment Characteristics in Marvell
Employment by Class of Employer in Marvell
Among the 384 employed individuals in Marvell, private company employees (274 | 71.4%), state government employees (36 | 9.4%), and local government employees (27 | 7.0%) make up the most common classes of employment.
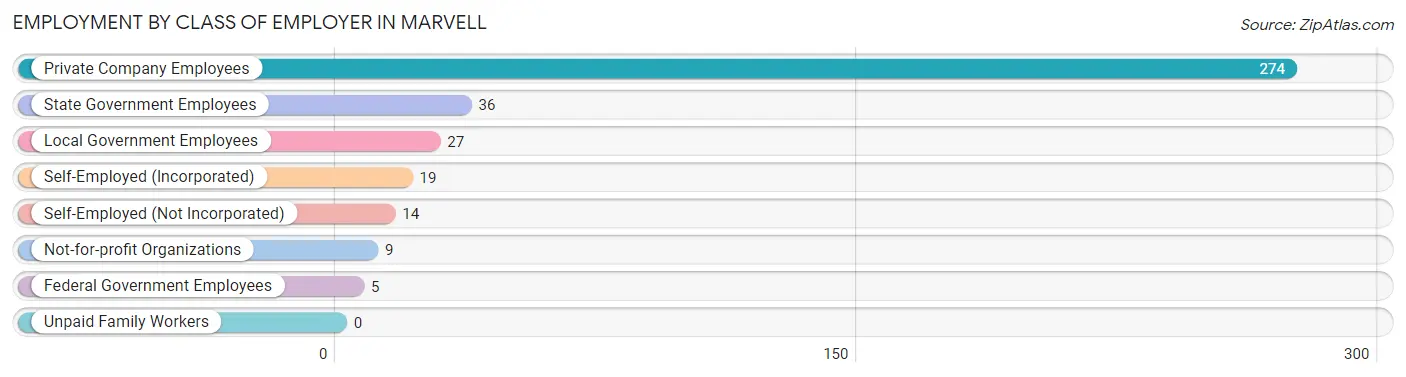
| Employer Class | # Employees | % Employees |
| Private Company Employees | 274 | 71.4% |
| Self-Employed (Incorporated) | 19 | 5.0% |
| Self-Employed (Not Incorporated) | 14 | 3.6% |
| Not-for-profit Organizations | 9 | 2.3% |
| Local Government Employees | 27 | 7.0% |
| State Government Employees | 36 | 9.4% |
| Federal Government Employees | 5 | 1.3% |
| Unpaid Family Workers | 0 | 0.0% |
| Total | 384 | 100.0% |
Employment Status by Age in Marvell
According to the labor force statistics for Marvell, out of the total population over 16 years of age (819), 57.5% or 471 individuals are in the labor force, with 17.2% or 81 of them unemployed. The age group with the highest labor force participation rate is 30 to 34 years, with 100.0% or 8 individuals in the labor force. Within the labor force, the 20 to 24 years age range has the highest percentage of unemployed individuals, with 78.3% or 65 of them being unemployed.
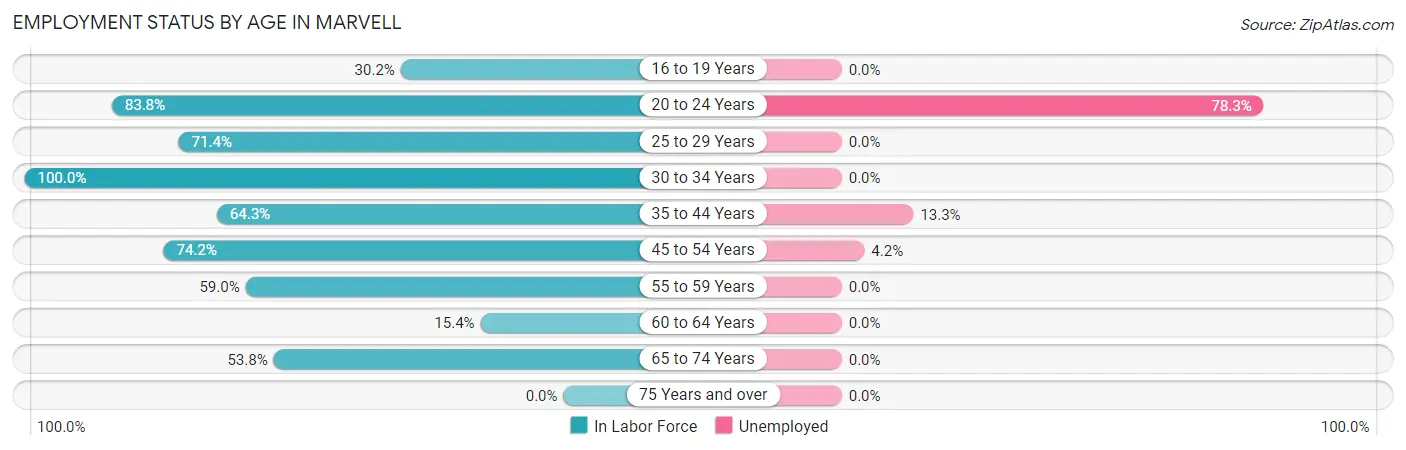
| Age Bracket | In Labor Force | Unemployed |
| 16 to 19 Years | 19 (30.2%) | 0 (0.0%) |
| 20 to 24 Years | 83 (83.8%) | 65 (78.3%) |
| 25 to 29 Years | 10 (71.4%) | 0 (0.0%) |
| 30 to 34 Years | 8 (100.0%) | 0 (0.0%) |
| 35 to 44 Years | 90 (64.3%) | 12 (13.3%) |
| 45 to 54 Years | 95 (74.2%) | 4 (4.2%) |
| 55 to 59 Years | 36 (59.0%) | 0 (0.0%) |
| 60 to 64 Years | 4 (15.4%) | 0 (0.0%) |
| 65 to 74 Years | 126 (53.8%) | 0 (0.0%) |
| 75 Years and over | 0 (0.0%) | 0 (0.0%) |
| Total | 471 (57.5%) | 81 (17.2%) |
Employment Status by Educational Attainment in Marvell
According to labor force statistics for Marvell, 64.5% of individuals (243) out of the total population between 25 and 64 years of age (377) are in the labor force, with 6.6% or 16 of them being unemployed. The group with the highest labor force participation rate are those with the educational attainment of bachelor's degree or higher, with 96.2% or 25 individuals in the labor force. Within the labor force, individuals with high school diploma education have the highest percentage of unemployment, with 20.8% or 16 of them being unemployed.
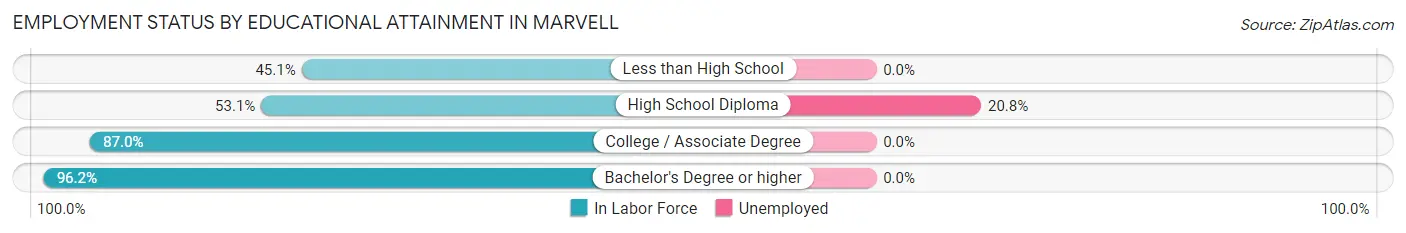
| Educational Attainment | In Labor Force | Unemployed |
| Less than High School | 41 (45.1%) | 0 (0.0%) |
| High School Diploma | 77 (53.1%) | 30 (20.8%) |
| College / Associate Degree | 100 (87.0%) | 0 (0.0%) |
| Bachelor's Degree or higher | 25 (96.2%) | 0 (0.0%) |
| Total | 243 (64.5%) | 25 (6.6%) |
Employment Occupations by Sex in Marvell
Management, Business, Science and Arts Occupations
The most common Management, Business, Science and Arts occupations in Marvell are Community & Social Service (42 | 10.8%), Management (27 | 6.9%), Education Instruction & Library (27 | 6.9%), Education, Arts & Media (12 | 3.1%), and Health Diagnosing & Treating (7 | 1.8%).
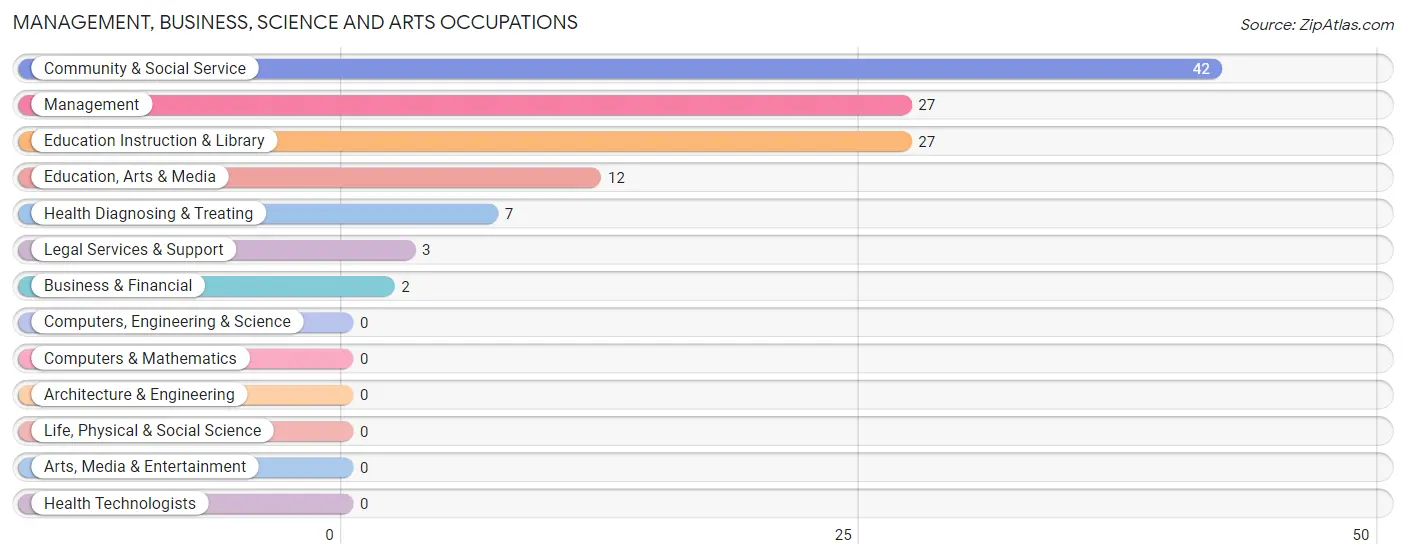
Management, Business, Science and Arts Occupations by Sex
Within the Management, Business, Science and Arts occupations in Marvell, the most male-oriented occupations are Business & Financial (100.0%), Legal Services & Support (100.0%), and Management (48.1%), while the most female-oriented occupations are Health Diagnosing & Treating (100.0%), Education Instruction & Library (85.2%), and Community & Social Service (71.4%).
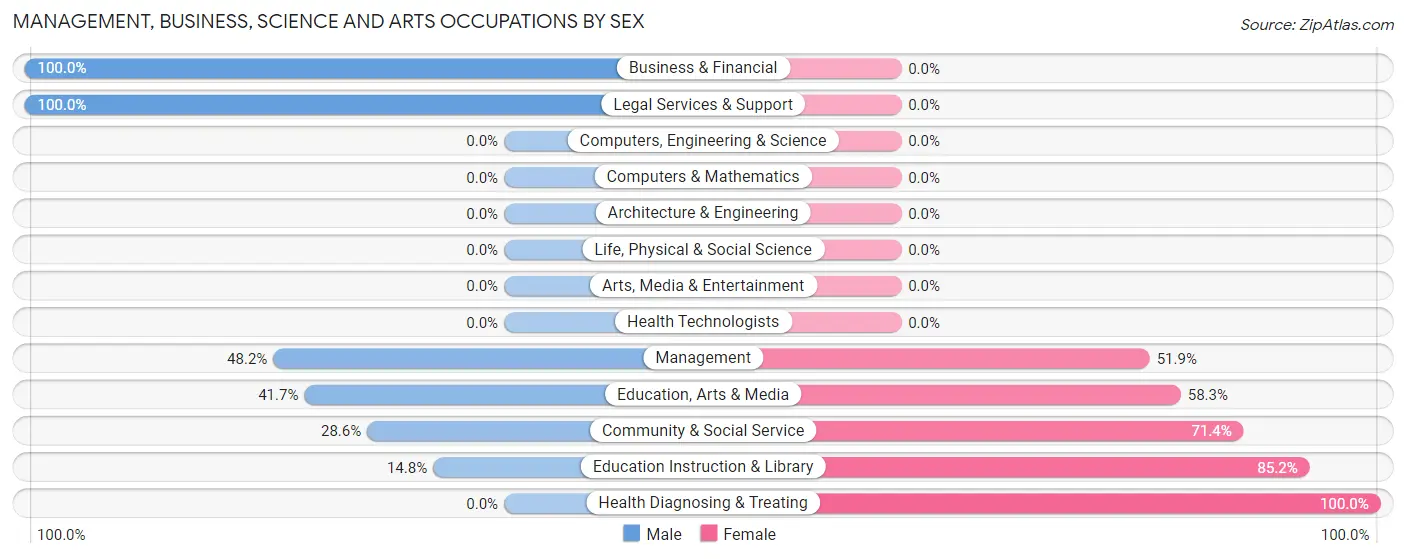
| Occupation | Male | Female |
| Management | 13 (48.1%) | 14 (51.8%) |
| Business & Financial | 2 (100.0%) | 0 (0.0%) |
| Computers, Engineering & Science | 0 (0.0%) | 0 (0.0%) |
| Computers & Mathematics | 0 (0.0%) | 0 (0.0%) |
| Architecture & Engineering | 0 (0.0%) | 0 (0.0%) |
| Life, Physical & Social Science | 0 (0.0%) | 0 (0.0%) |
| Community & Social Service | 12 (28.6%) | 30 (71.4%) |
| Education, Arts & Media | 5 (41.7%) | 7 (58.3%) |
| Legal Services & Support | 3 (100.0%) | 0 (0.0%) |
| Education Instruction & Library | 4 (14.8%) | 23 (85.2%) |
| Arts, Media & Entertainment | 0 (0.0%) | 0 (0.0%) |
| Health Diagnosing & Treating | 0 (0.0%) | 7 (100.0%) |
| Health Technologists | 0 (0.0%) | 0 (0.0%) |
| Total (Category) | 27 (34.6%) | 51 (65.4%) |
| Total (Overall) | 193 (49.5%) | 197 (50.5%) |
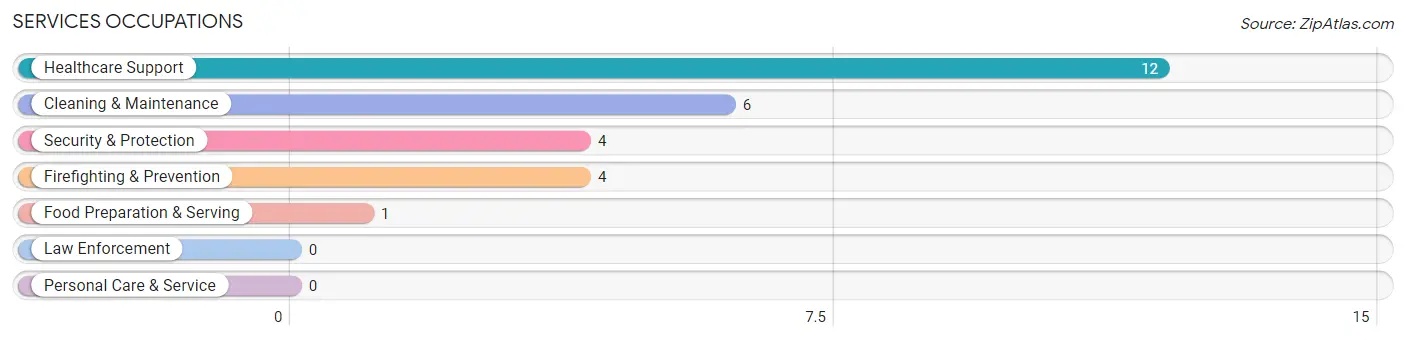
Services Occupations
The most common Services occupations in Marvell are Healthcare Support (12 | 3.1%), Cleaning & Maintenance (6 | 1.5%), Security & Protection (4 | 1.0%), Firefighting & Prevention (4 | 1.0%), and Food Preparation & Serving (1 | 0.3%).
Services Occupations by Sex
Within the Services occupations in Marvell, the most male-oriented occupations are Security & Protection (100.0%), Firefighting & Prevention (100.0%), and Cleaning & Maintenance (100.0%), while the most female-oriented occupations are Healthcare Support (100.0%), and Food Preparation & Serving (100.0%).
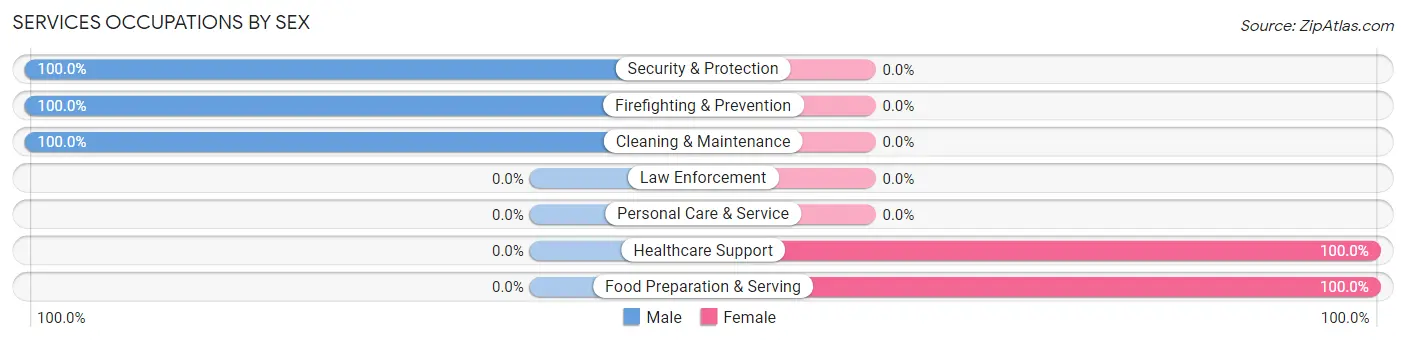
| Occupation | Male | Female |
| Healthcare Support | 0 (0.0%) | 12 (100.0%) |
| Security & Protection | 4 (100.0%) | 0 (0.0%) |
| Firefighting & Prevention | 4 (100.0%) | 0 (0.0%) |
| Law Enforcement | 0 (0.0%) | 0 (0.0%) |
| Food Preparation & Serving | 0 (0.0%) | 1 (100.0%) |
| Cleaning & Maintenance | 6 (100.0%) | 0 (0.0%) |
| Personal Care & Service | 0 (0.0%) | 0 (0.0%) |
| Total (Category) | 10 (43.5%) | 13 (56.5%) |
| Total (Overall) | 193 (49.5%) | 197 (50.5%) |
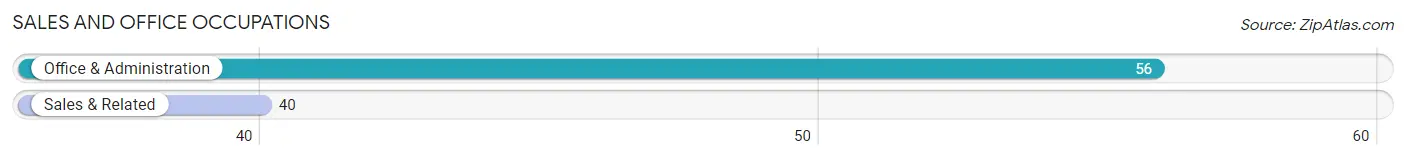
Sales and Office Occupations
The most common Sales and Office occupations in Marvell are Office & Administration (56 | 14.4%), and Sales & Related (40 | 10.3%).
Sales and Office Occupations by Sex
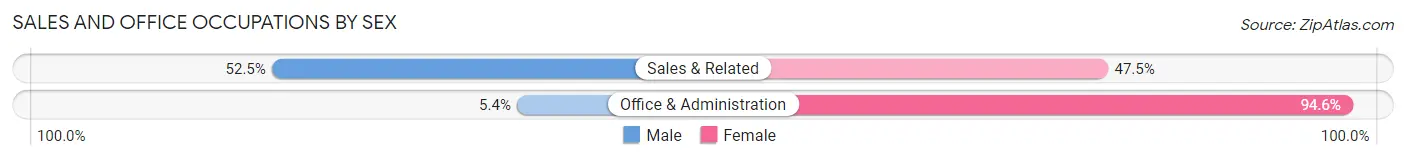
| Occupation | Male | Female |
| Sales & Related | 21 (52.5%) | 19 (47.5%) |
| Office & Administration | 3 (5.4%) | 53 (94.6%) |
| Total (Category) | 24 (25.0%) | 72 (75.0%) |
| Total (Overall) | 193 (49.5%) | 197 (50.5%) |
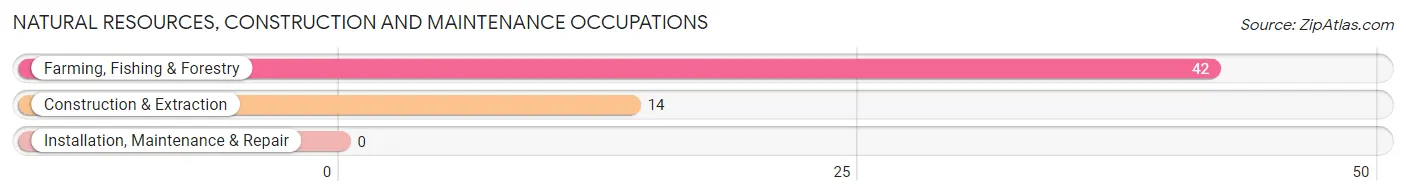
Natural Resources, Construction and Maintenance Occupations
The most common Natural Resources, Construction and Maintenance occupations in Marvell are Farming, Fishing & Forestry (42 | 10.8%), and Construction & Extraction (14 | 3.6%).
Natural Resources, Construction and Maintenance Occupations by Sex
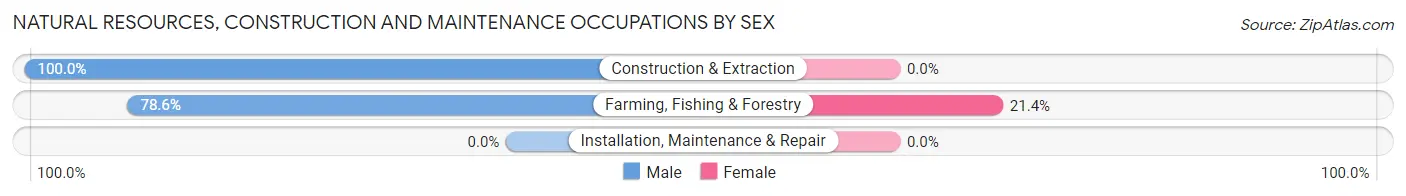
| Occupation | Male | Female |
| Farming, Fishing & Forestry | 33 (78.6%) | 9 (21.4%) |
| Construction & Extraction | 14 (100.0%) | 0 (0.0%) |
| Installation, Maintenance & Repair | 0 (0.0%) | 0 (0.0%) |
| Total (Category) | 47 (83.9%) | 9 (16.1%) |
| Total (Overall) | 193 (49.5%) | 197 (50.5%) |
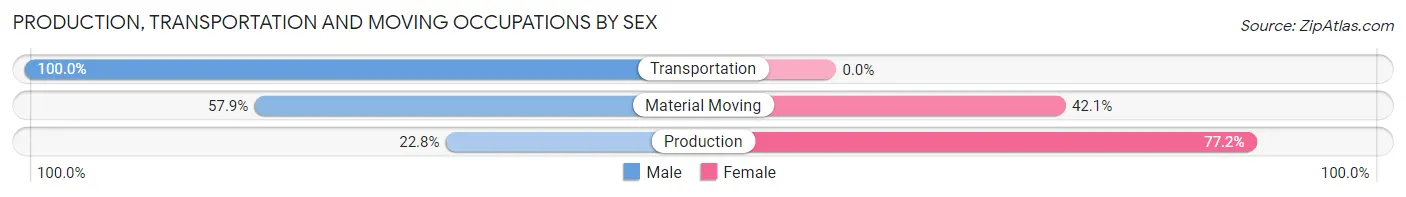
Production, Transportation and Moving Occupations
The most common Production, Transportation and Moving occupations in Marvell are Transportation (61 | 15.6%), Production (57 | 14.6%), and Material Moving (19 | 4.9%).
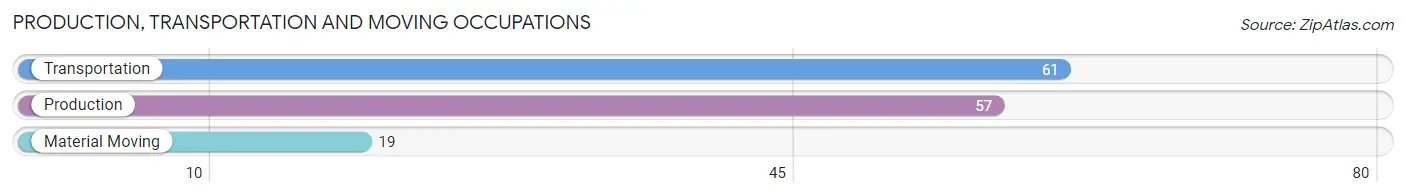
Production, Transportation and Moving Occupations by Sex
| Occupation | Male | Female |
| Production | 13 (22.8%) | 44 (77.2%) |
| Transportation | 61 (100.0%) | 0 (0.0%) |
| Material Moving | 11 (57.9%) | 8 (42.1%) |
| Total (Category) | 85 (62.0%) | 52 (38.0%) |
| Total (Overall) | 193 (49.5%) | 197 (50.5%) |
Employment Industries by Sex in Marvell
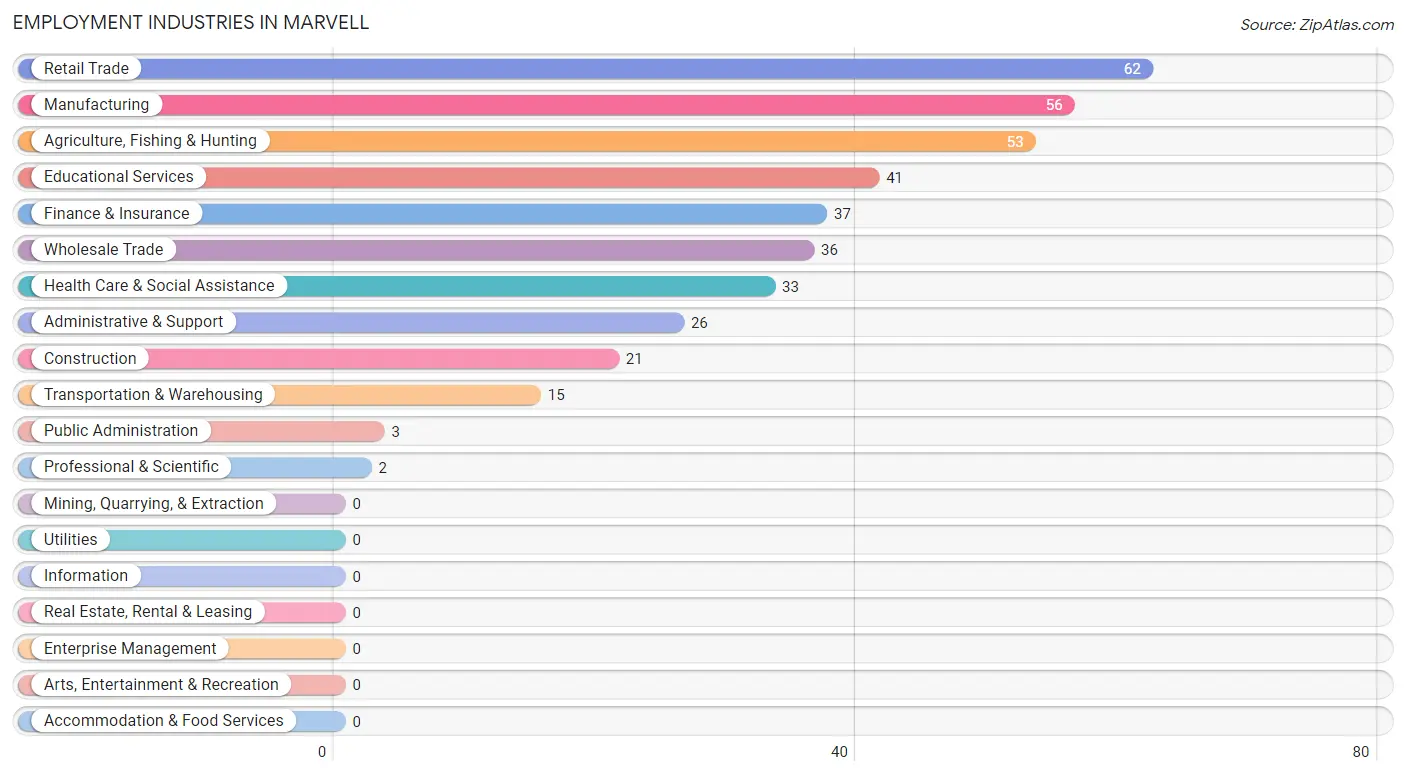
Employment Industries in Marvell
The major employment industries in Marvell include Retail Trade (62 | 15.9%), Manufacturing (56 | 14.4%), Agriculture, Fishing & Hunting (53 | 13.6%), Educational Services (41 | 10.5%), and Finance & Insurance (37 | 9.5%).
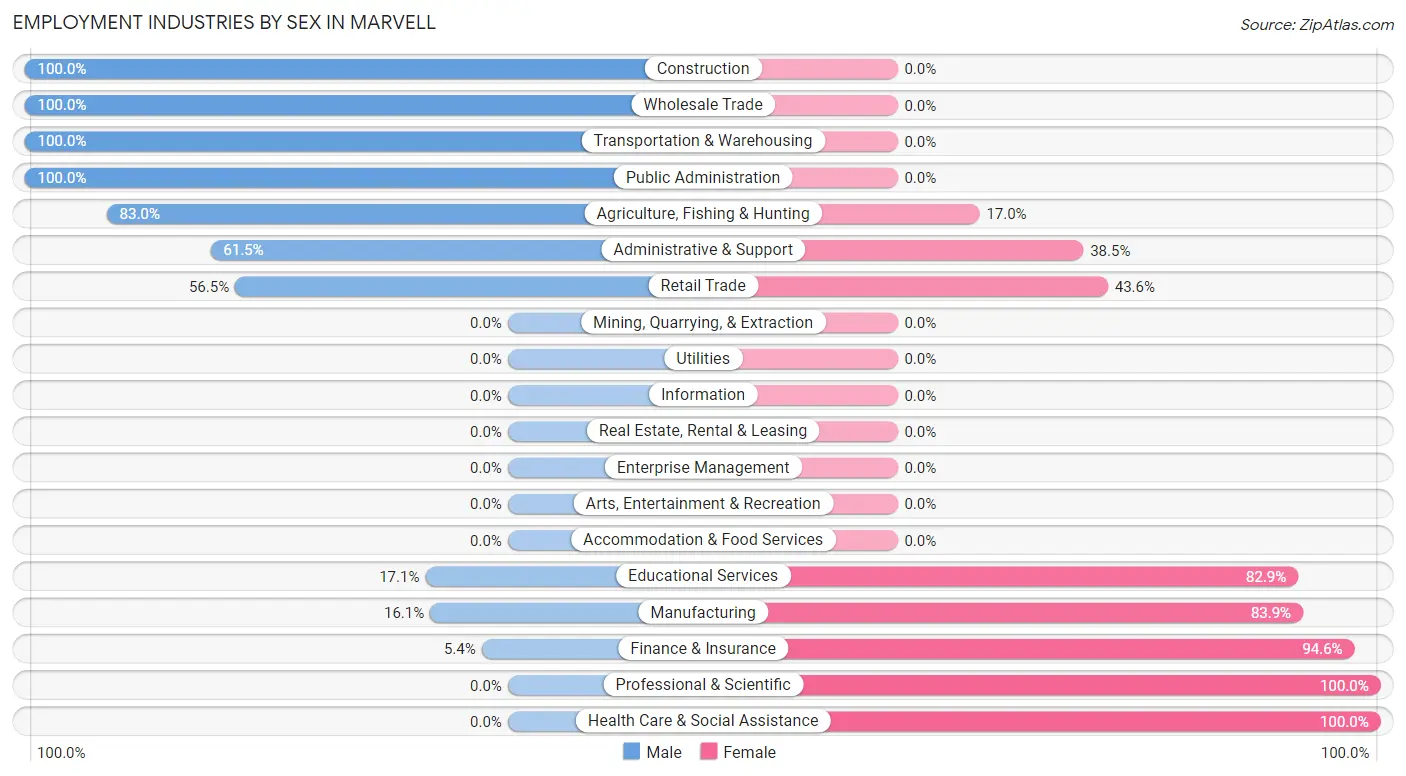
Employment Industries by Sex in Marvell
The Marvell industries that see more men than women are Construction (100.0%), Wholesale Trade (100.0%), and Transportation & Warehousing (100.0%), whereas the industries that tend to have a higher number of women are Professional & Scientific (100.0%), Health Care & Social Assistance (100.0%), and Finance & Insurance (94.6%).
| Industry | Male | Female |
| Agriculture, Fishing & Hunting | 44 (83.0%) | 9 (17.0%) |
| Mining, Quarrying, & Extraction | 0 (0.0%) | 0 (0.0%) |
| Construction | 21 (100.0%) | 0 (0.0%) |
| Manufacturing | 9 (16.1%) | 47 (83.9%) |
| Wholesale Trade | 36 (100.0%) | 0 (0.0%) |
| Retail Trade | 35 (56.5%) | 27 (43.5%) |
| Transportation & Warehousing | 15 (100.0%) | 0 (0.0%) |
| Utilities | 0 (0.0%) | 0 (0.0%) |
| Information | 0 (0.0%) | 0 (0.0%) |
| Finance & Insurance | 2 (5.4%) | 35 (94.6%) |
| Real Estate, Rental & Leasing | 0 (0.0%) | 0 (0.0%) |
| Professional & Scientific | 0 (0.0%) | 2 (100.0%) |
| Enterprise Management | 0 (0.0%) | 0 (0.0%) |
| Administrative & Support | 16 (61.5%) | 10 (38.5%) |
| Educational Services | 7 (17.1%) | 34 (82.9%) |
| Health Care & Social Assistance | 0 (0.0%) | 33 (100.0%) |
| Arts, Entertainment & Recreation | 0 (0.0%) | 0 (0.0%) |
| Accommodation & Food Services | 0 (0.0%) | 0 (0.0%) |
| Public Administration | 3 (100.0%) | 0 (0.0%) |
| Total | 193 (49.5%) | 197 (50.5%) |
Education in Marvell
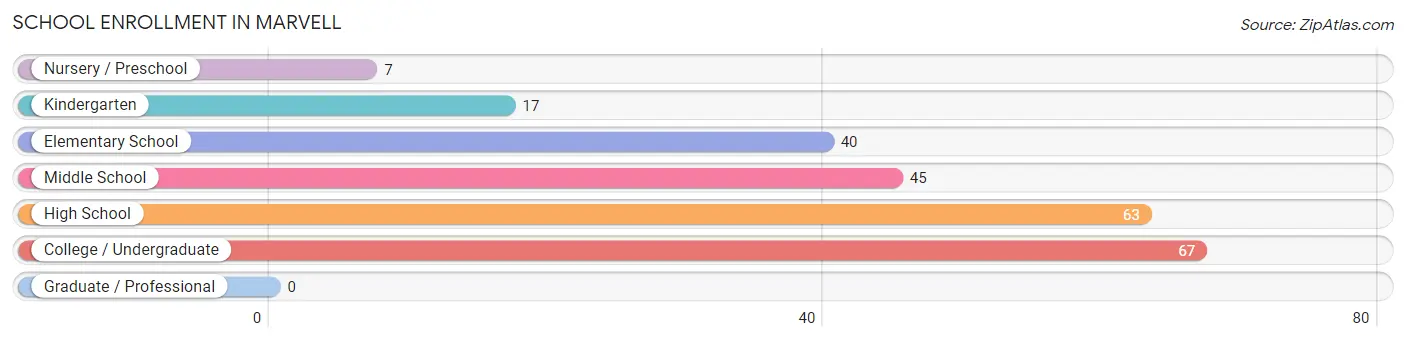
School Enrollment in Marvell
The most common levels of schooling among the 239 students in Marvell are college / undergraduate (67 | 28.0%), high school (63 | 26.4%), and middle school (45 | 18.8%).
| School Level | # Students | % Students |
| Nursery / Preschool | 7 | 2.9% |
| Kindergarten | 17 | 7.1% |
| Elementary School | 40 | 16.7% |
| Middle School | 45 | 18.8% |
| High School | 63 | 26.4% |
| College / Undergraduate | 67 | 28.0% |
| Graduate / Professional | 0 | 0.0% |
| Total | 239 | 100.0% |
School Enrollment by Age by Funding Source in Marvell
Out of a total of 239 students who are enrolled in schools in Marvell, 11 (4.6%) attend a private institution, while the remaining 228 (95.4%) are enrolled in public schools. The age group of 5 to 9 year old has the highest likelihood of being enrolled in private schools, with 4 (8.9% in the age bracket) enrolled. Conversely, the age group of 3 to 4 year olds has the lowest likelihood of being enrolled in a private school, with 7 (100.0% in the age bracket) attending a public institution.
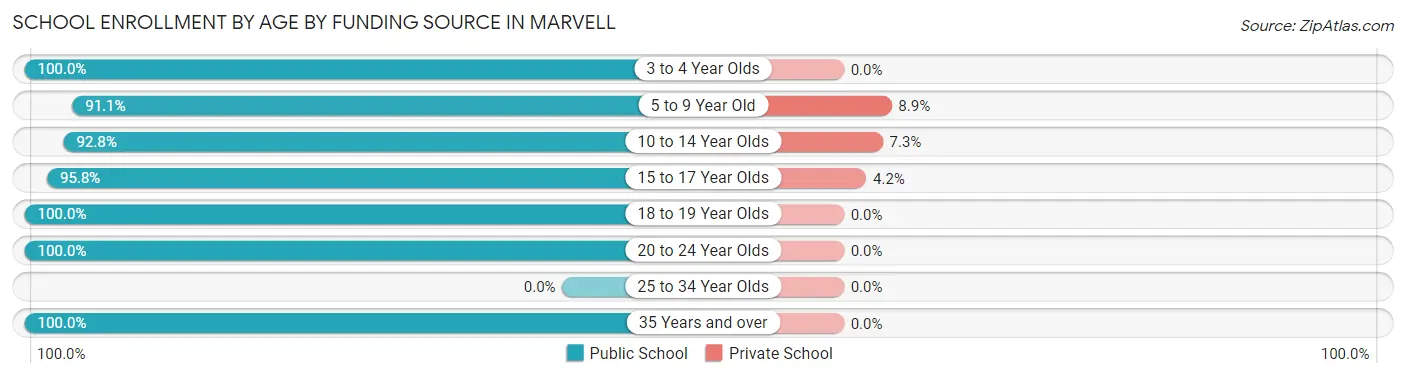
| Age Bracket | Public School | Private School |
| 3 to 4 Year Olds | 7 (100.0%) | 0 (0.0%) |
| 5 to 9 Year Old | 41 (91.1%) | 4 (8.9%) |
| 10 to 14 Year Olds | 64 (92.7%) | 5 (7.2%) |
| 15 to 17 Year Olds | 46 (95.8%) | 2 (4.2%) |
| 18 to 19 Year Olds | 3 (100.0%) | 0 (0.0%) |
| 20 to 24 Year Olds | 62 (100.0%) | 0 (0.0%) |
| 25 to 34 Year Olds | 0 (0.0%) | 0 (0.0%) |
| 35 Years and over | 5 (100.0%) | 0 (0.0%) |
| Total | 228 (95.4%) | 11 (4.6%) |
Educational Attainment by Field of Study in Marvell
Education (31 | 30.7%), engineering (24 | 23.8%), business (12 | 11.9%), physical & health sciences (9 | 8.9%), and bio, nature & agricultural (8 | 7.9%) are the most common fields of study among 101 individuals in Marvell who have obtained a bachelor's degree or higher.
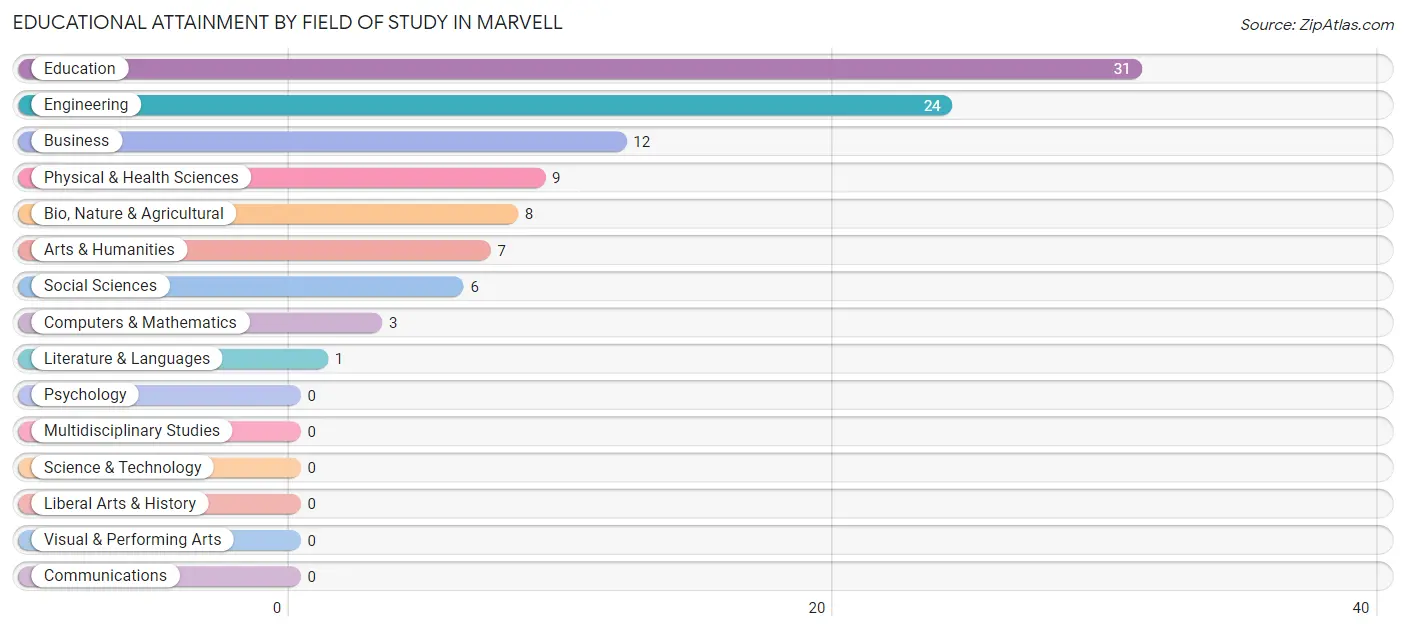
| Field of Study | # Graduates | % Graduates |
| Computers & Mathematics | 3 | 3.0% |
| Bio, Nature & Agricultural | 8 | 7.9% |
| Physical & Health Sciences | 9 | 8.9% |
| Psychology | 0 | 0.0% |
| Social Sciences | 6 | 5.9% |
| Engineering | 24 | 23.8% |
| Multidisciplinary Studies | 0 | 0.0% |
| Science & Technology | 0 | 0.0% |
| Business | 12 | 11.9% |
| Education | 31 | 30.7% |
| Literature & Languages | 1 | 1.0% |
| Liberal Arts & History | 0 | 0.0% |
| Visual & Performing Arts | 0 | 0.0% |
| Communications | 0 | 0.0% |
| Arts & Humanities | 7 | 6.9% |
| Total | 101 | 100.0% |
Transportation & Commute in Marvell
Vehicle Availability by Sex in Marvell
The most prevalent vehicle ownership categories in Marvell are males with 2 vehicles (104, accounting for 53.9%) and females with 2 vehicles (82, making up 54.4%).
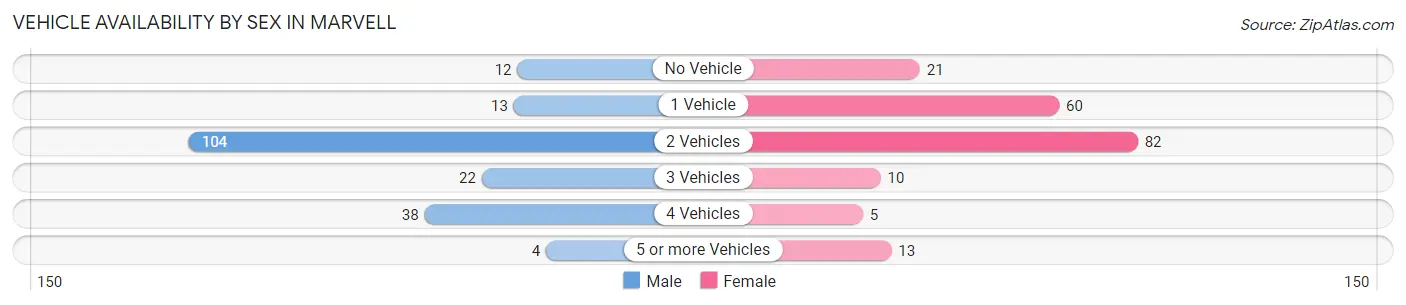
| Vehicles Available | Male | Female |
| No Vehicle | 12 (6.2%) | 21 (11.0%) |
| 1 Vehicle | 13 (6.7%) | 60 (31.4%) |
| 2 Vehicles | 104 (53.9%) | 82 (42.9%) |
| 3 Vehicles | 22 (11.4%) | 10 (5.2%) |
| 4 Vehicles | 38 (19.7%) | 5 (2.6%) |
| 5 or more Vehicles | 4 (2.1%) | 13 (6.8%) |
| Total | 193 (100.0%) | 191 (100.0%) |
Commute Time in Marvell
The most frequently occuring commute durations in Marvell are 5 to 9 minutes (103 commuters, 26.8%), 45 to 59 minutes (61 commuters, 15.9%), and 10 to 14 minutes (59 commuters, 15.4%).
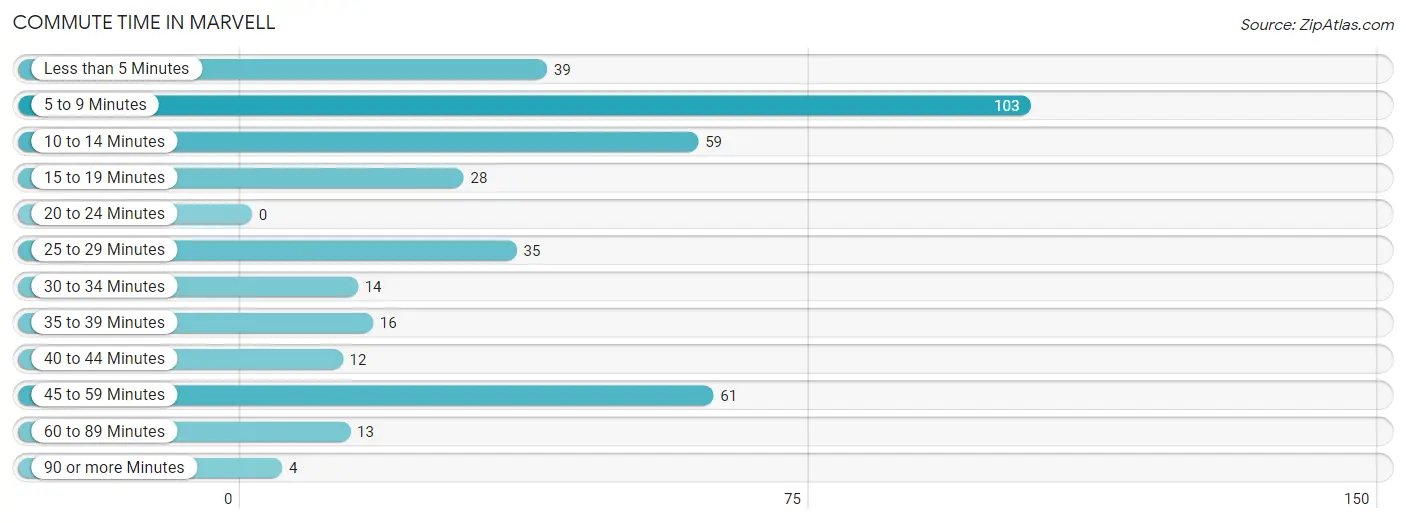
| Commute Time | # Commuters | % Commuters |
| Less than 5 Minutes | 39 | 10.2% |
| 5 to 9 Minutes | 103 | 26.8% |
| 10 to 14 Minutes | 59 | 15.4% |
| 15 to 19 Minutes | 28 | 7.3% |
| 20 to 24 Minutes | 0 | 0.0% |
| 25 to 29 Minutes | 35 | 9.1% |
| 30 to 34 Minutes | 14 | 3.6% |
| 35 to 39 Minutes | 16 | 4.2% |
| 40 to 44 Minutes | 12 | 3.1% |
| 45 to 59 Minutes | 61 | 15.9% |
| 60 to 89 Minutes | 13 | 3.4% |
| 90 or more Minutes | 4 | 1.0% |
Commute Time by Sex in Marvell
The most common commute times in Marvell are 10 to 14 minutes (59 commuters, 30.6%) for males and 5 to 9 minutes (59 commuters, 30.9%) for females.
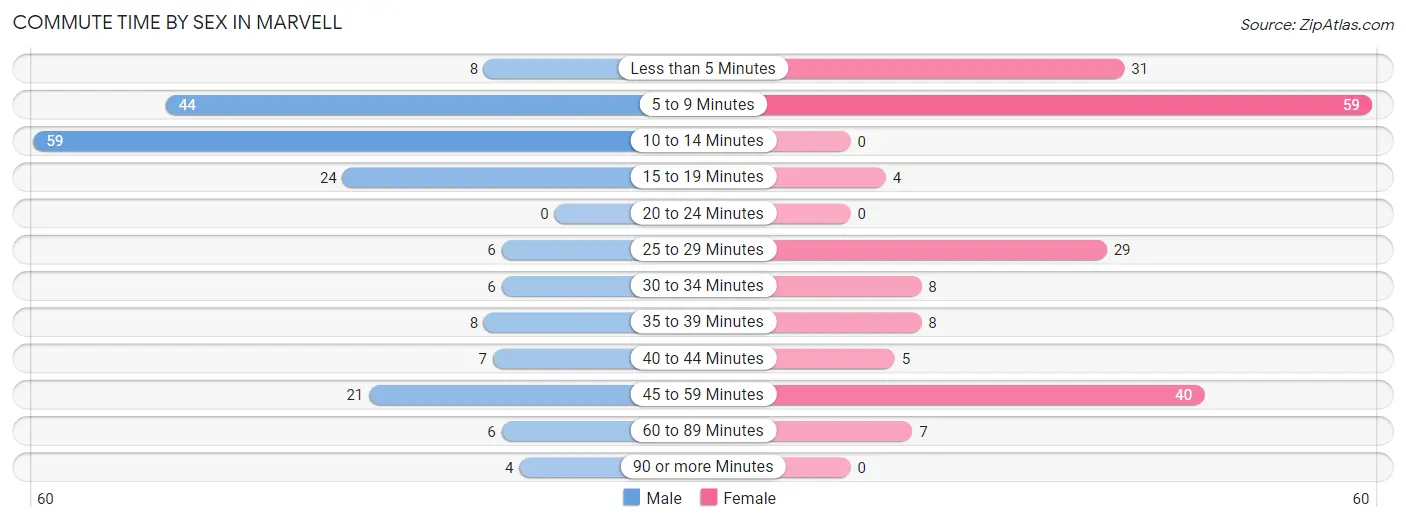
| Commute Time | Male | Female |
| Less than 5 Minutes | 8 (4.2%) | 31 (16.2%) |
| 5 to 9 Minutes | 44 (22.8%) | 59 (30.9%) |
| 10 to 14 Minutes | 59 (30.6%) | 0 (0.0%) |
| 15 to 19 Minutes | 24 (12.4%) | 4 (2.1%) |
| 20 to 24 Minutes | 0 (0.0%) | 0 (0.0%) |
| 25 to 29 Minutes | 6 (3.1%) | 29 (15.2%) |
| 30 to 34 Minutes | 6 (3.1%) | 8 (4.2%) |
| 35 to 39 Minutes | 8 (4.2%) | 8 (4.2%) |
| 40 to 44 Minutes | 7 (3.6%) | 5 (2.6%) |
| 45 to 59 Minutes | 21 (10.9%) | 40 (20.9%) |
| 60 to 89 Minutes | 6 (3.1%) | 7 (3.7%) |
| 90 or more Minutes | 4 (2.1%) | 0 (0.0%) |
Time of Departure to Work by Sex in Marvell
The most frequent times of departure to work in Marvell are 8:00 AM to 8:29 AM (67, 34.7%) for males and 8:00 AM to 8:29 AM (42, 22.0%) for females.
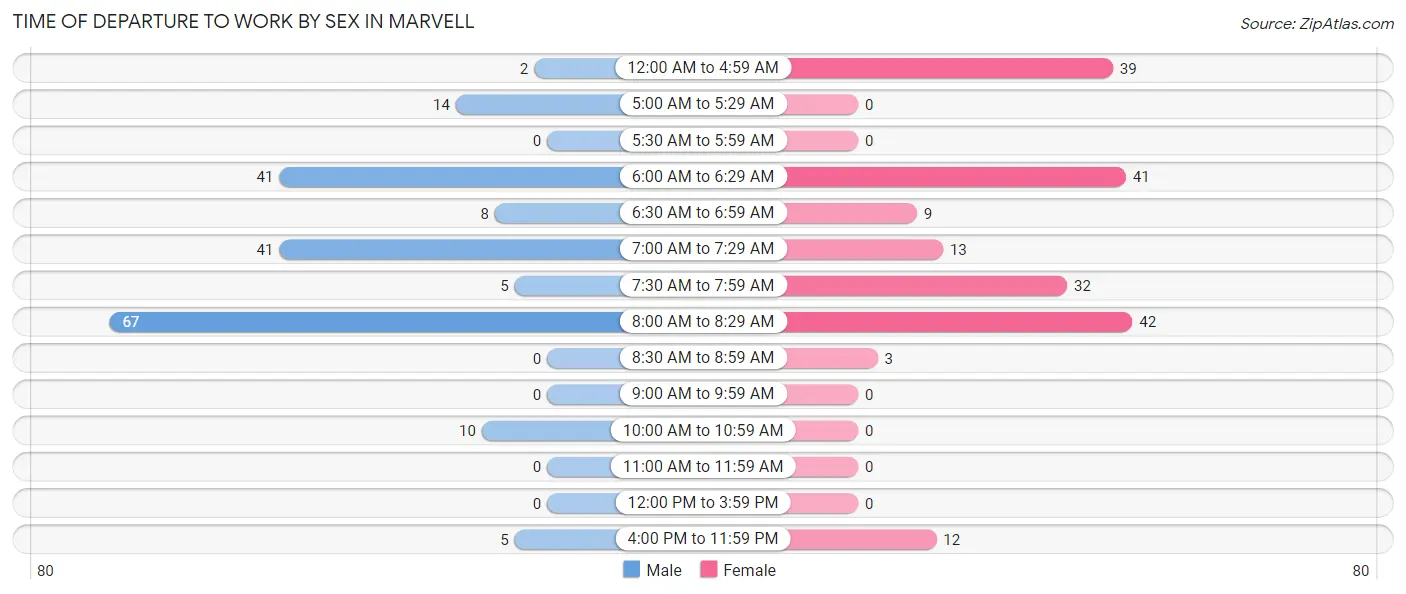
| Time of Departure | Male | Female |
| 12:00 AM to 4:59 AM | 2 (1.0%) | 39 (20.4%) |
| 5:00 AM to 5:29 AM | 14 (7.2%) | 0 (0.0%) |
| 5:30 AM to 5:59 AM | 0 (0.0%) | 0 (0.0%) |
| 6:00 AM to 6:29 AM | 41 (21.2%) | 41 (21.5%) |
| 6:30 AM to 6:59 AM | 8 (4.2%) | 9 (4.7%) |
| 7:00 AM to 7:29 AM | 41 (21.2%) | 13 (6.8%) |
| 7:30 AM to 7:59 AM | 5 (2.6%) | 32 (16.8%) |
| 8:00 AM to 8:29 AM | 67 (34.7%) | 42 (22.0%) |
| 8:30 AM to 8:59 AM | 0 (0.0%) | 3 (1.6%) |
| 9:00 AM to 9:59 AM | 0 (0.0%) | 0 (0.0%) |
| 10:00 AM to 10:59 AM | 10 (5.2%) | 0 (0.0%) |
| 11:00 AM to 11:59 AM | 0 (0.0%) | 0 (0.0%) |
| 12:00 PM to 3:59 PM | 0 (0.0%) | 0 (0.0%) |
| 4:00 PM to 11:59 PM | 5 (2.6%) | 12 (6.3%) |
| Total | 193 (100.0%) | 191 (100.0%) |
Housing Occupancy in Marvell
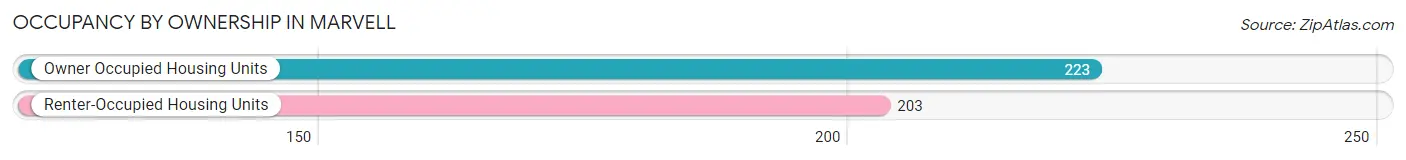
Occupancy by Ownership in Marvell
Of the total 426 dwellings in Marvell, owner-occupied units account for 223 (52.3%), while renter-occupied units make up 203 (47.6%).
| Occupancy | # Housing Units | % Housing Units |
| Owner Occupied Housing Units | 223 | 52.3% |
| Renter-Occupied Housing Units | 203 | 47.6% |
| Total Occupied Housing Units | 426 | 100.0% |
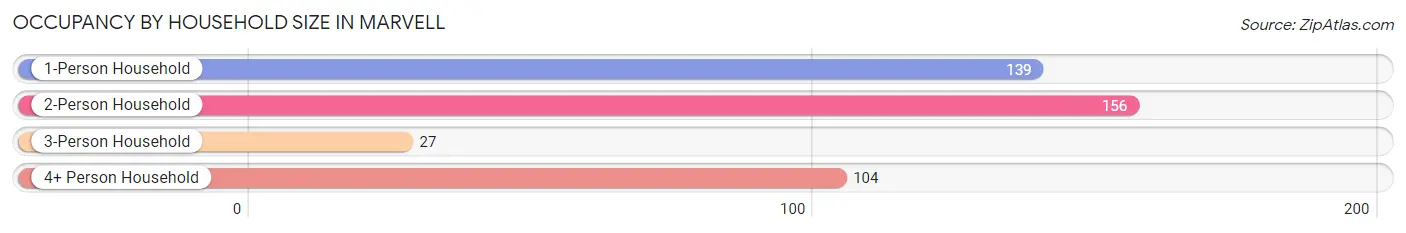
Occupancy by Household Size in Marvell
| Household Size | # Housing Units | % Housing Units |
| 1-Person Household | 139 | 32.6% |
| 2-Person Household | 156 | 36.6% |
| 3-Person Household | 27 | 6.3% |
| 4+ Person Household | 104 | 24.4% |
| Total Housing Units | 426 | 100.0% |
Occupancy by Ownership by Household Size in Marvell
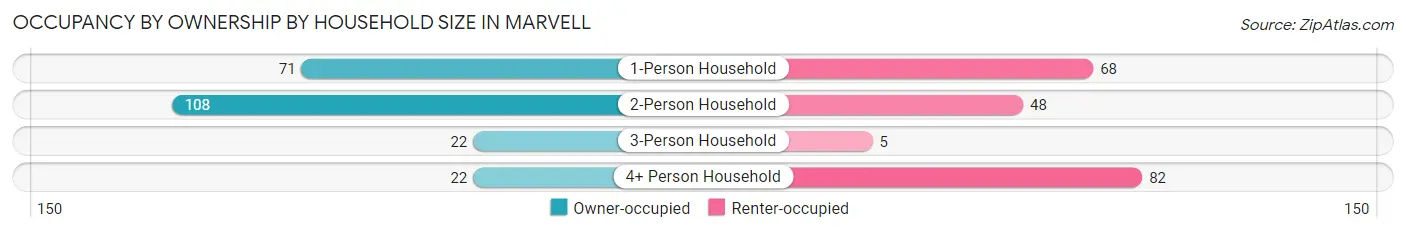
| Household Size | Owner-occupied | Renter-occupied |
| 1-Person Household | 71 (51.1%) | 68 (48.9%) |
| 2-Person Household | 108 (69.2%) | 48 (30.8%) |
| 3-Person Household | 22 (81.5%) | 5 (18.5%) |
| 4+ Person Household | 22 (21.1%) | 82 (78.8%) |
| Total Housing Units | 223 (52.3%) | 203 (47.6%) |
Occupancy by Educational Attainment in Marvell
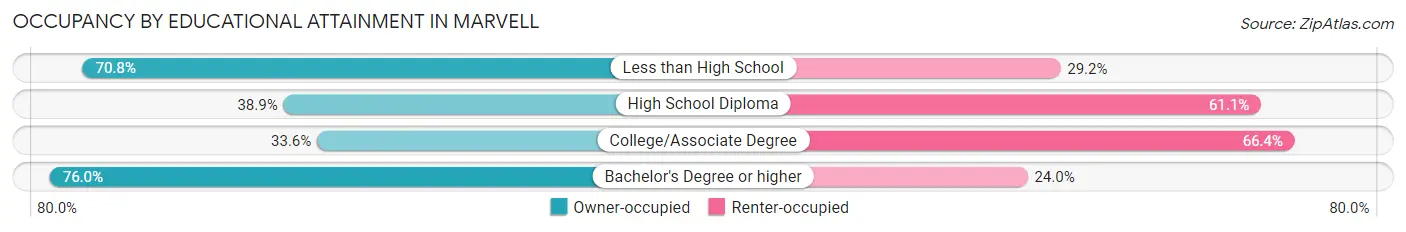
| Household Size | Owner-occupied | Renter-occupied |
| Less than High School | 80 (70.8%) | 33 (29.2%) |
| High School Diploma | 44 (38.9%) | 69 (61.1%) |
| College/Associate Degree | 42 (33.6%) | 83 (66.4%) |
| Bachelor's Degree or higher | 57 (76.0%) | 18 (24.0%) |
Occupancy by Age of Householder in Marvell
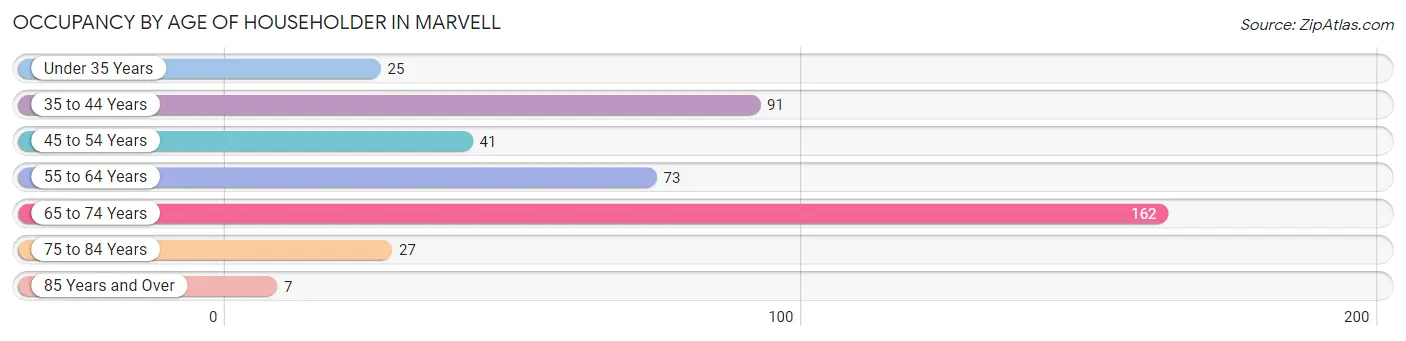
| Age Bracket | # Households | % Households |
| Under 35 Years | 25 | 5.9% |
| 35 to 44 Years | 91 | 21.4% |
| 45 to 54 Years | 41 | 9.6% |
| 55 to 64 Years | 73 | 17.1% |
| 65 to 74 Years | 162 | 38.0% |
| 75 to 84 Years | 27 | 6.3% |
| 85 Years and Over | 7 | 1.6% |
| Total | 426 | 100.0% |
Housing Finances in Marvell
Median Income by Occupancy in Marvell
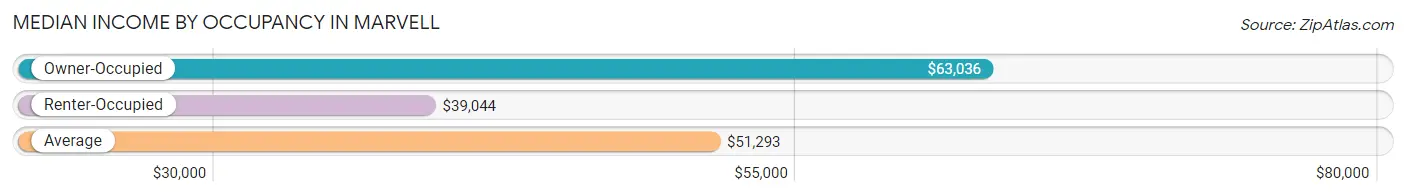
| Occupancy Type | # Households | Median Income |
| Owner-Occupied | 223 (52.3%) | $63,036 |
| Renter-Occupied | 203 (47.6%) | $39,044 |
| Average | 426 (100.0%) | $51,293 |
Occupancy by Householder Income Bracket in Marvell
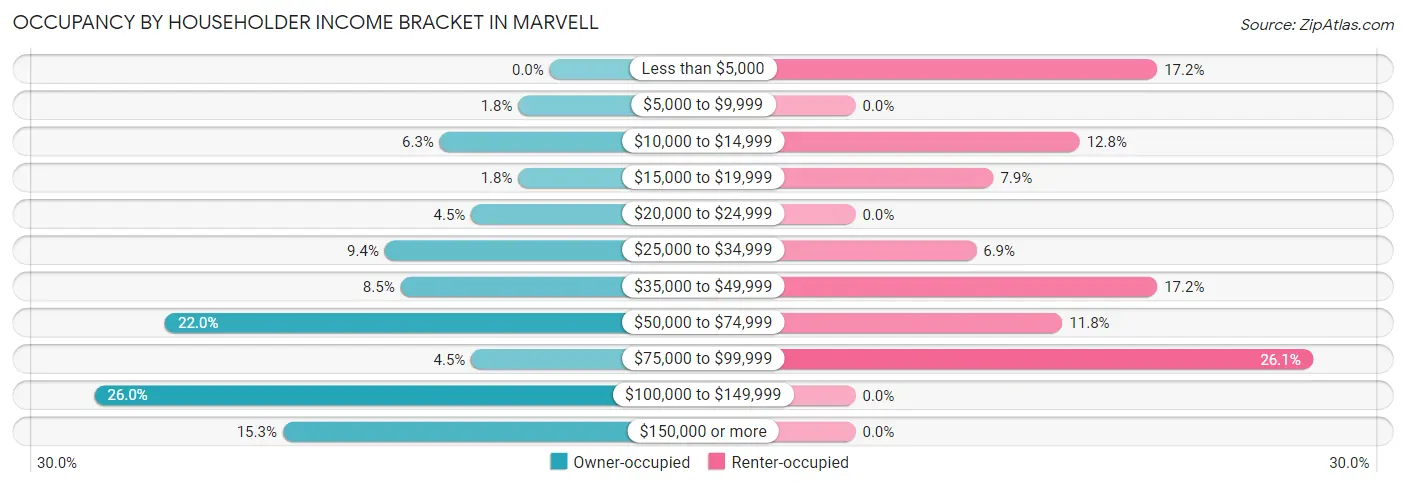
| Income Bracket | Owner-occupied | Renter-occupied |
| Less than $5,000 | 0 (0.0%) | 35 (17.2%) |
| $5,000 to $9,999 | 4 (1.8%) | 0 (0.0%) |
| $10,000 to $14,999 | 14 (6.3%) | 26 (12.8%) |
| $15,000 to $19,999 | 4 (1.8%) | 16 (7.9%) |
| $20,000 to $24,999 | 10 (4.5%) | 0 (0.0%) |
| $25,000 to $34,999 | 21 (9.4%) | 14 (6.9%) |
| $35,000 to $49,999 | 19 (8.5%) | 35 (17.2%) |
| $50,000 to $74,999 | 49 (22.0%) | 24 (11.8%) |
| $75,000 to $99,999 | 10 (4.5%) | 53 (26.1%) |
| $100,000 to $149,999 | 58 (26.0%) | 0 (0.0%) |
| $150,000 or more | 34 (15.2%) | 0 (0.0%) |
| Total | 223 (100.0%) | 203 (100.0%) |
Monthly Housing Cost Tiers in Marvell
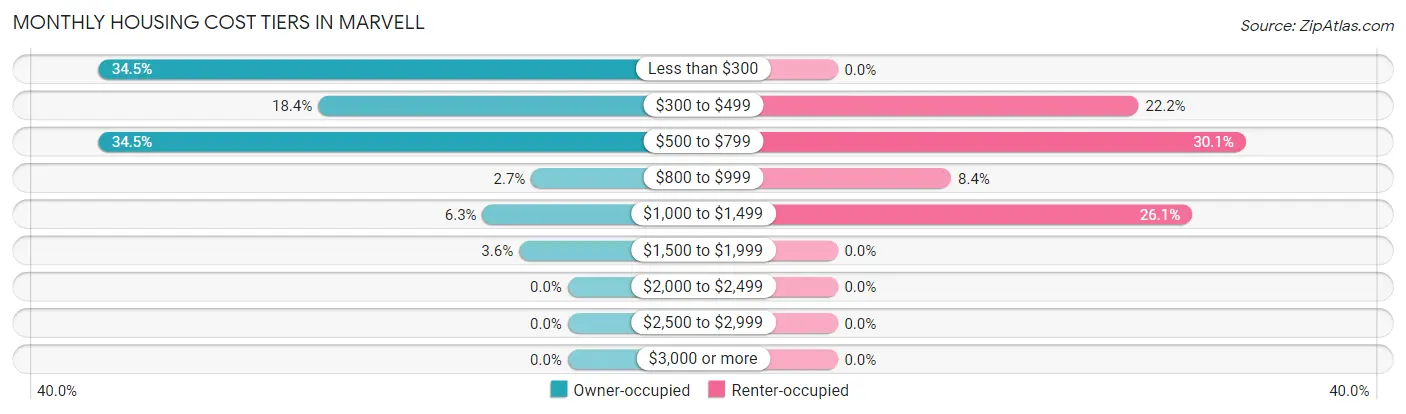
| Monthly Cost | Owner-occupied | Renter-occupied |
| Less than $300 | 77 (34.5%) | 0 (0.0%) |
| $300 to $499 | 41 (18.4%) | 45 (22.2%) |
| $500 to $799 | 77 (34.5%) | 61 (30.0%) |
| $800 to $999 | 6 (2.7%) | 17 (8.4%) |
| $1,000 to $1,499 | 14 (6.3%) | 53 (26.1%) |
| $1,500 to $1,999 | 8 (3.6%) | 0 (0.0%) |
| $2,000 to $2,499 | 0 (0.0%) | 0 (0.0%) |
| $2,500 to $2,999 | 0 (0.0%) | 0 (0.0%) |
| $3,000 or more | 0 (0.0%) | 0 (0.0%) |
| Total | 223 (100.0%) | 203 (100.0%) |
Physical Housing Characteristics in Marvell
Housing Structures in Marvell
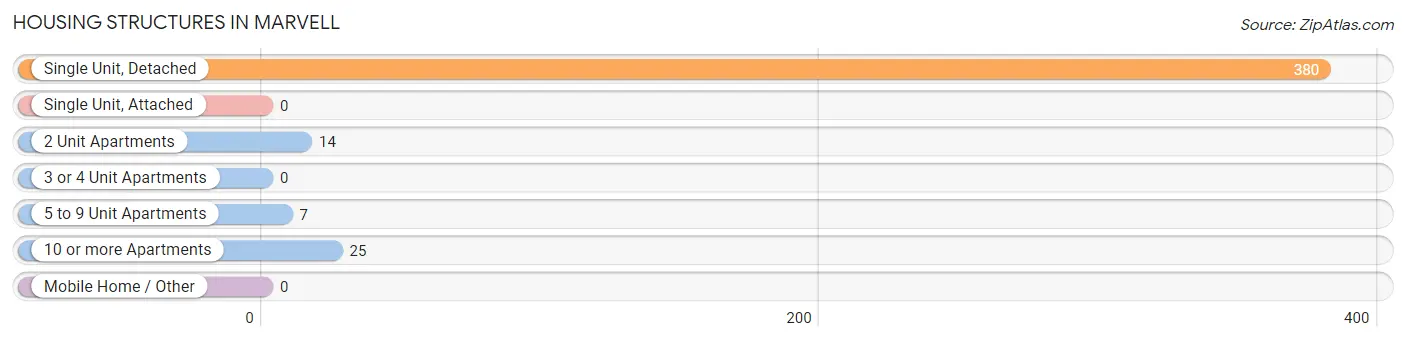
| Structure Type | # Housing Units | % Housing Units |
| Single Unit, Detached | 380 | 89.2% |
| Single Unit, Attached | 0 | 0.0% |
| 2 Unit Apartments | 14 | 3.3% |
| 3 or 4 Unit Apartments | 0 | 0.0% |
| 5 to 9 Unit Apartments | 7 | 1.6% |
| 10 or more Apartments | 25 | 5.9% |
| Mobile Home / Other | 0 | 0.0% |
| Total | 426 | 100.0% |
Housing Structures by Occupancy in Marvell
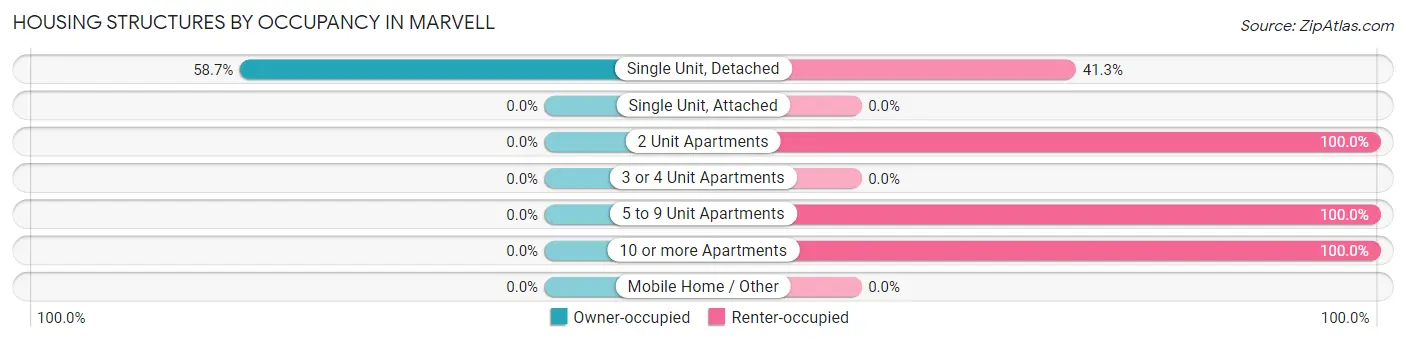
| Structure Type | Owner-occupied | Renter-occupied |
| Single Unit, Detached | 223 (58.7%) | 157 (41.3%) |
| Single Unit, Attached | 0 (0.0%) | 0 (0.0%) |
| 2 Unit Apartments | 0 (0.0%) | 14 (100.0%) |
| 3 or 4 Unit Apartments | 0 (0.0%) | 0 (0.0%) |
| 5 to 9 Unit Apartments | 0 (0.0%) | 7 (100.0%) |
| 10 or more Apartments | 0 (0.0%) | 25 (100.0%) |
| Mobile Home / Other | 0 (0.0%) | 0 (0.0%) |
| Total | 223 (52.3%) | 203 (47.6%) |
Housing Structures by Number of Rooms in Marvell
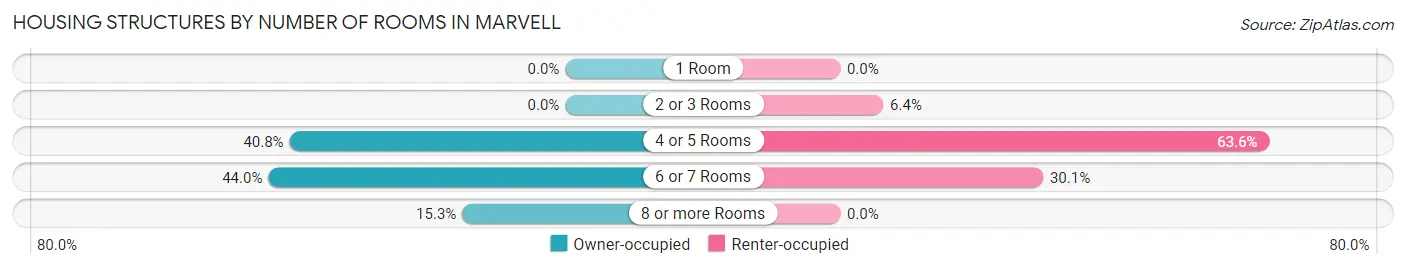
| Number of Rooms | Owner-occupied | Renter-occupied |
| 1 Room | 0 (0.0%) | 0 (0.0%) |
| 2 or 3 Rooms | 0 (0.0%) | 13 (6.4%) |
| 4 or 5 Rooms | 91 (40.8%) | 129 (63.5%) |
| 6 or 7 Rooms | 98 (44.0%) | 61 (30.0%) |
| 8 or more Rooms | 34 (15.2%) | 0 (0.0%) |
| Total | 223 (100.0%) | 203 (100.0%) |
Housing Structure by Heating Type in Marvell
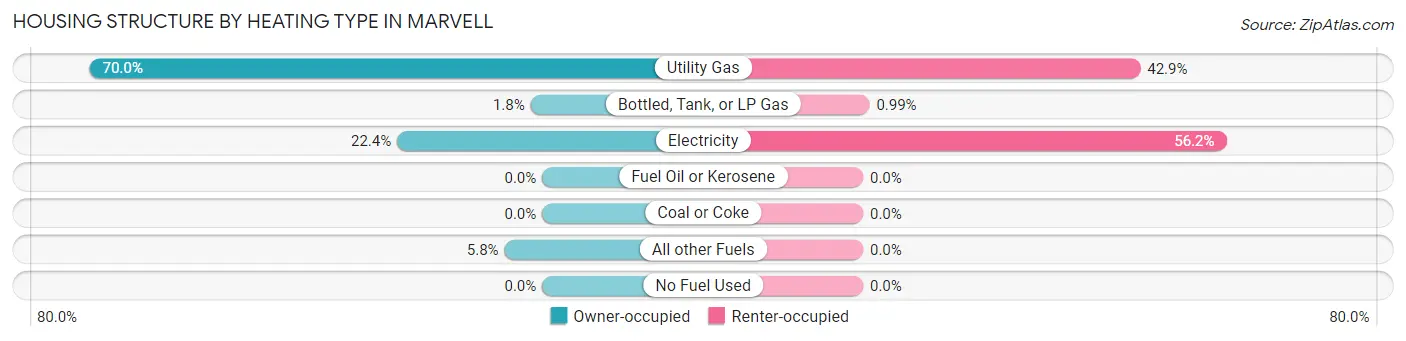
| Heating Type | Owner-occupied | Renter-occupied |
| Utility Gas | 156 (70.0%) | 87 (42.9%) |
| Bottled, Tank, or LP Gas | 4 (1.8%) | 2 (1.0%) |
| Electricity | 50 (22.4%) | 114 (56.2%) |
| Fuel Oil or Kerosene | 0 (0.0%) | 0 (0.0%) |
| Coal or Coke | 0 (0.0%) | 0 (0.0%) |
| All other Fuels | 13 (5.8%) | 0 (0.0%) |
| No Fuel Used | 0 (0.0%) | 0 (0.0%) |
| Total | 223 (100.0%) | 203 (100.0%) |
Household Vehicle Usage in Marvell
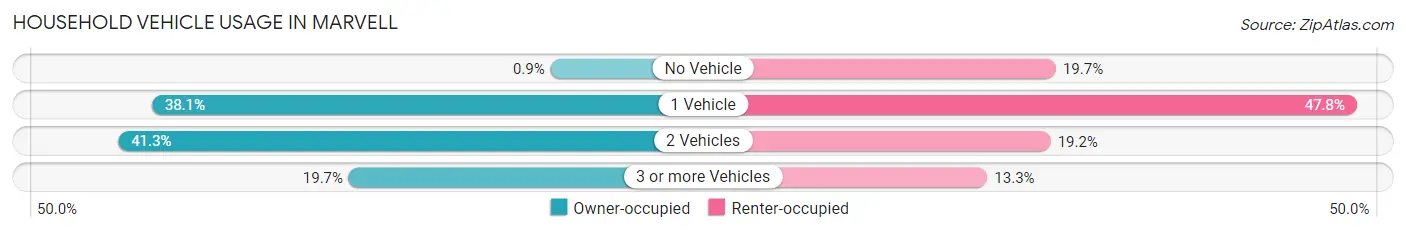
| Vehicles per Household | Owner-occupied | Renter-occupied |
| No Vehicle | 2 (0.9%) | 40 (19.7%) |
| 1 Vehicle | 85 (38.1%) | 97 (47.8%) |
| 2 Vehicles | 92 (41.3%) | 39 (19.2%) |
| 3 or more Vehicles | 44 (19.7%) | 27 (13.3%) |
| Total | 223 (100.0%) | 203 (100.0%) |
Real Estate & Mortgages in Marvell
Real Estate and Mortgage Overview in Marvell
| Characteristic | Without Mortgage | With Mortgage |
| Housing Units | 165 | 58 |
| Median Property Value | - | - |
| Median Household Income | $105,625 | $0 |
| Monthly Housing Costs | $336 | $0 |
| Real Estate Taxes | $450 | $25 |
Property Value by Mortgage Status in Marvell
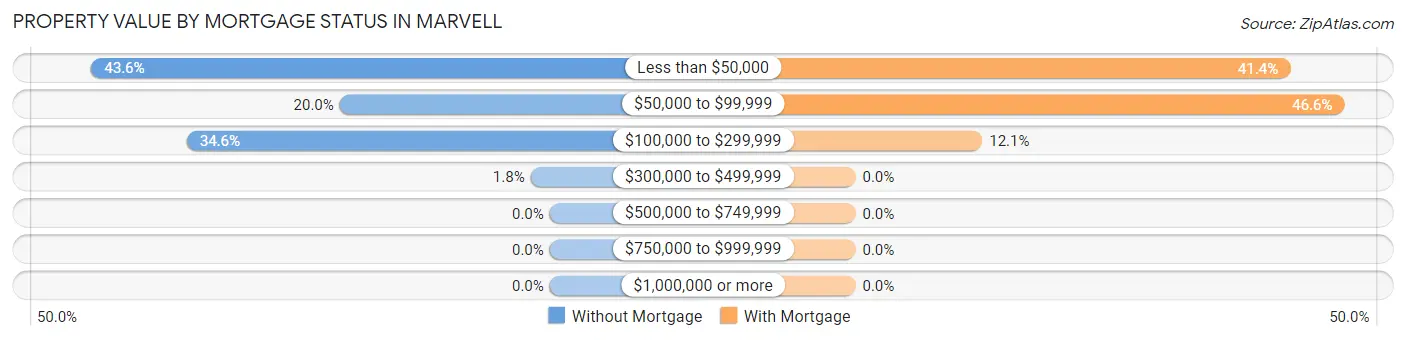
| Property Value | Without Mortgage | With Mortgage |
| Less than $50,000 | 72 (43.6%) | 24 (41.4%) |
| $50,000 to $99,999 | 33 (20.0%) | 27 (46.6%) |
| $100,000 to $299,999 | 57 (34.5%) | 7 (12.1%) |
| $300,000 to $499,999 | 3 (1.8%) | 0 (0.0%) |
| $500,000 to $749,999 | 0 (0.0%) | 0 (0.0%) |
| $750,000 to $999,999 | 0 (0.0%) | 0 (0.0%) |
| $1,000,000 or more | 0 (0.0%) | 0 (0.0%) |
| Total | 165 (100.0%) | 58 (100.0%) |
Household Income by Mortgage Status in Marvell
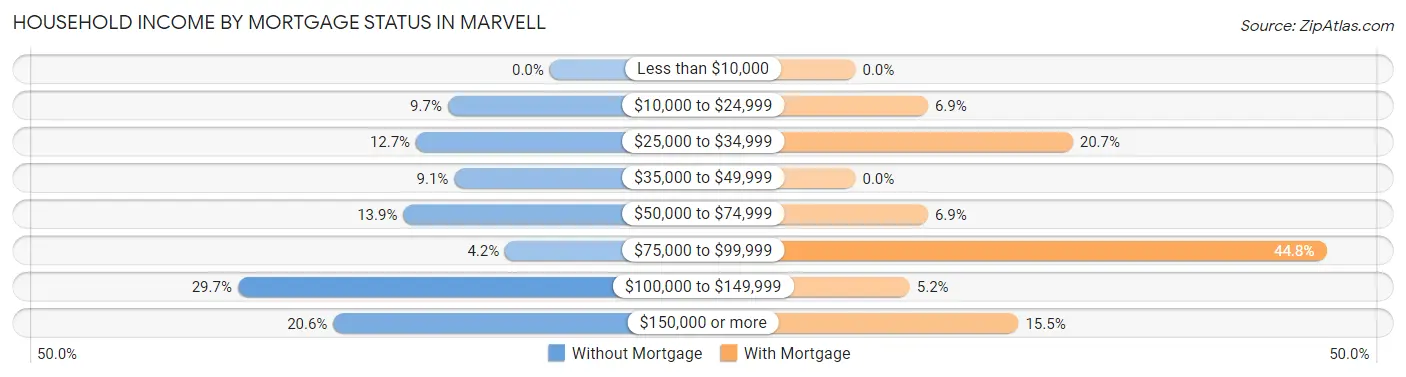
| Household Income | Without Mortgage | With Mortgage |
| Less than $10,000 | 0 (0.0%) | 0 (0.0%) |
| $10,000 to $24,999 | 16 (9.7%) | 4 (6.9%) |
| $25,000 to $34,999 | 21 (12.7%) | 12 (20.7%) |
| $35,000 to $49,999 | 15 (9.1%) | 0 (0.0%) |
| $50,000 to $74,999 | 23 (13.9%) | 4 (6.9%) |
| $75,000 to $99,999 | 7 (4.2%) | 26 (44.8%) |
| $100,000 to $149,999 | 49 (29.7%) | 3 (5.2%) |
| $150,000 or more | 34 (20.6%) | 9 (15.5%) |
| Total | 165 (100.0%) | 58 (100.0%) |
Property Value to Household Income Ratio in Marvell
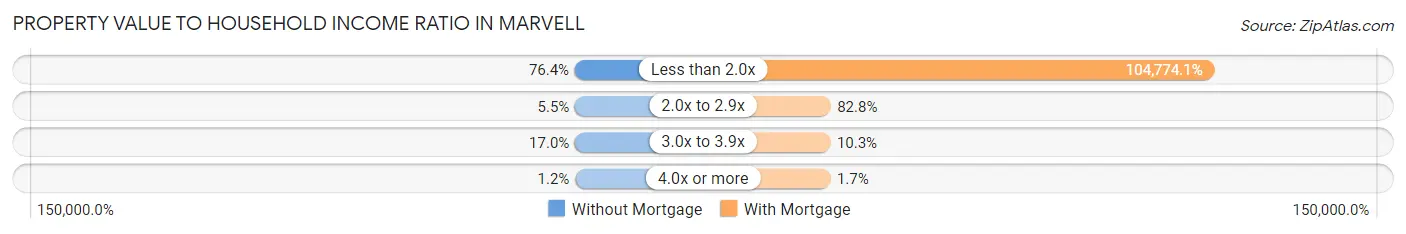
| Value-to-Income Ratio | Without Mortgage | With Mortgage |
| Less than 2.0x | 126 (76.4%) | 60,769 (104,774.1%) |
| 2.0x to 2.9x | 9 (5.4%) | 48 (82.8%) |
| 3.0x to 3.9x | 28 (17.0%) | 6 (10.3%) |
| 4.0x or more | 2 (1.2%) | 1 (1.7%) |
| Total | 165 (100.0%) | 58 (100.0%) |
Real Estate Taxes by Mortgage Status in Marvell
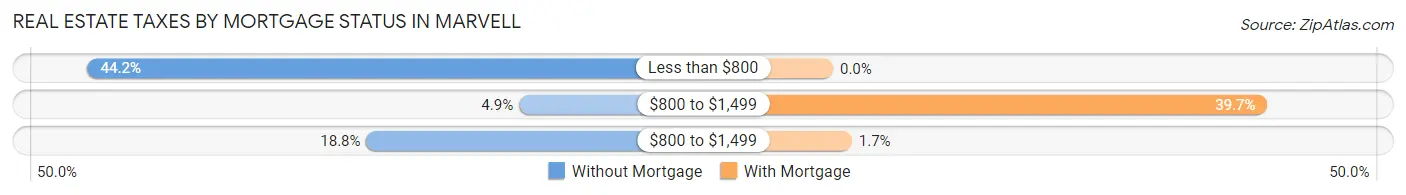
| Property Taxes | Without Mortgage | With Mortgage |
| Less than $800 | 73 (44.2%) | 0 (0.0%) |
| $800 to $1,499 | 8 (4.9%) | 23 (39.7%) |
| $800 to $1,499 | 31 (18.8%) | 1 (1.7%) |
| Total | 165 (100.0%) | 58 (100.0%) |
Health & Disability in Marvell
Health Insurance Coverage by Age in Marvell
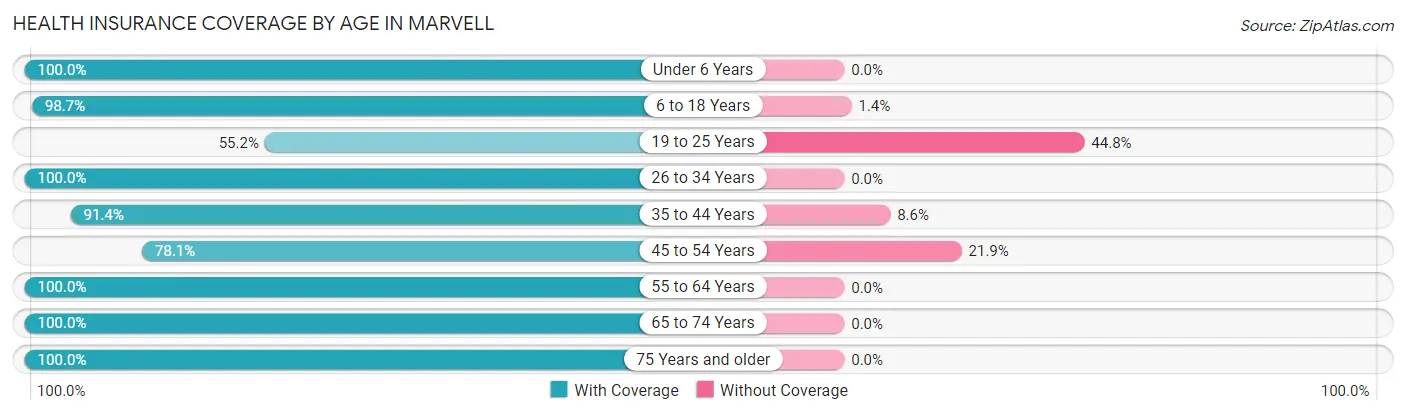
| Age Bracket | With Coverage | Without Coverage |
| Under 6 Years | 161 (100.0%) | 0 (0.0%) |
| 6 to 18 Years | 146 (98.7%) | 2 (1.3%) |
| 19 to 25 Years | 74 (55.2%) | 60 (44.8%) |
| 26 to 34 Years | 22 (100.0%) | 0 (0.0%) |
| 35 to 44 Years | 128 (91.4%) | 12 (8.6%) |
| 45 to 54 Years | 100 (78.1%) | 28 (21.9%) |
| 55 to 64 Years | 87 (100.0%) | 0 (0.0%) |
| 65 to 74 Years | 234 (100.0%) | 0 (0.0%) |
| 75 Years and older | 46 (100.0%) | 0 (0.0%) |
| Total | 998 (90.7%) | 102 (9.3%) |
Health Insurance Coverage by Citizenship Status in Marvell
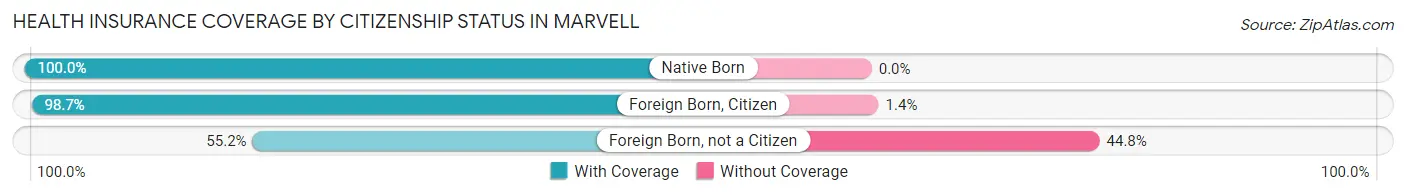
| Citizenship Status | With Coverage | Without Coverage |
| Native Born | 161 (100.0%) | 0 (0.0%) |
| Foreign Born, Citizen | 146 (98.7%) | 2 (1.3%) |
| Foreign Born, not a Citizen | 74 (55.2%) | 60 (44.8%) |
Health Insurance Coverage by Household Income in Marvell
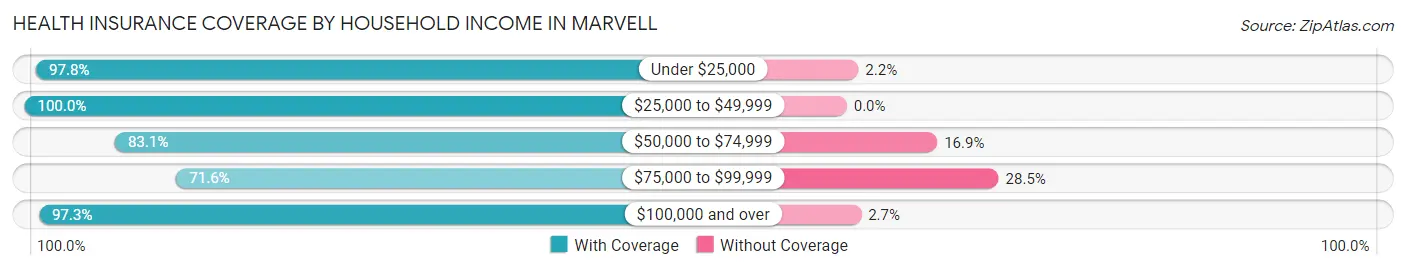
| Household Income | With Coverage | Without Coverage |
| Under $25,000 | 316 (97.8%) | 7 (2.2%) |
| $25,000 to $49,999 | 192 (100.0%) | 0 (0.0%) |
| $50,000 to $74,999 | 103 (83.1%) | 21 (16.9%) |
| $75,000 to $99,999 | 171 (71.6%) | 68 (28.4%) |
| $100,000 and over | 216 (97.3%) | 6 (2.7%) |
Public vs Private Health Insurance Coverage by Age in Marvell
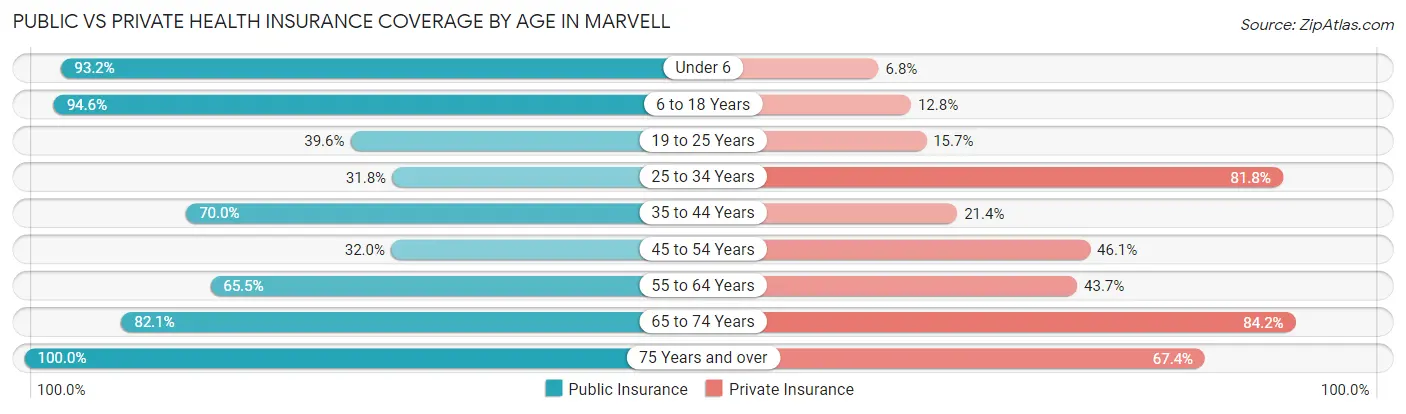
| Age Bracket | Public Insurance | Private Insurance |
| Under 6 | 150 (93.2%) | 11 (6.8%) |
| 6 to 18 Years | 140 (94.6%) | 19 (12.8%) |
| 19 to 25 Years | 53 (39.6%) | 21 (15.7%) |
| 25 to 34 Years | 7 (31.8%) | 18 (81.8%) |
| 35 to 44 Years | 98 (70.0%) | 30 (21.4%) |
| 45 to 54 Years | 41 (32.0%) | 59 (46.1%) |
| 55 to 64 Years | 57 (65.5%) | 38 (43.7%) |
| 65 to 74 Years | 192 (82.1%) | 197 (84.2%) |
| 75 Years and over | 46 (100.0%) | 31 (67.4%) |
| Total | 784 (71.3%) | 424 (38.6%) |
Disability Status by Sex by Age in Marvell
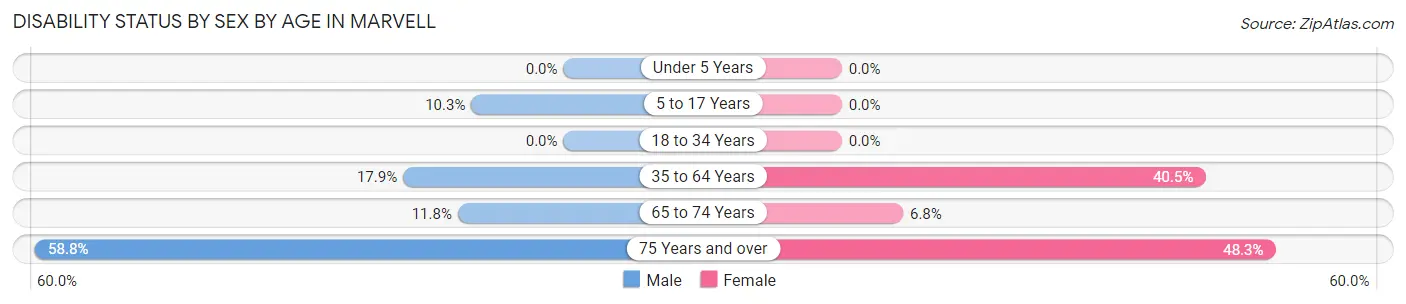
| Age Bracket | Male | Female |
| Under 5 Years | 0 (0.0%) | 0 (0.0%) |
| 5 to 17 Years | 4 (10.3%) | 0 (0.0%) |
| 18 to 34 Years | 0 (0.0%) | 0 (0.0%) |
| 35 to 64 Years | 25 (17.9%) | 87 (40.5%) |
| 65 to 74 Years | 12 (11.8%) | 9 (6.8%) |
| 75 Years and over | 10 (58.8%) | 14 (48.3%) |
Disability Class by Sex by Age in Marvell
Disability Class: Hearing Difficulty
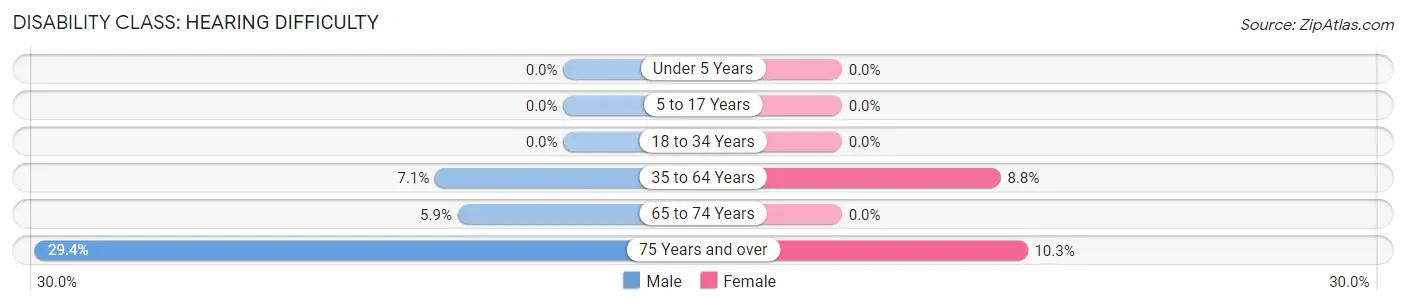
| Age Bracket | Male | Female |
| Under 5 Years | 0 (0.0%) | 0 (0.0%) |
| 5 to 17 Years | 0 (0.0%) | 0 (0.0%) |
| 18 to 34 Years | 0 (0.0%) | 0 (0.0%) |
| 35 to 64 Years | 10 (7.1%) | 19 (8.8%) |
| 65 to 74 Years | 6 (5.9%) | 0 (0.0%) |
| 75 Years and over | 5 (29.4%) | 3 (10.3%) |
Disability Class: Vision Difficulty
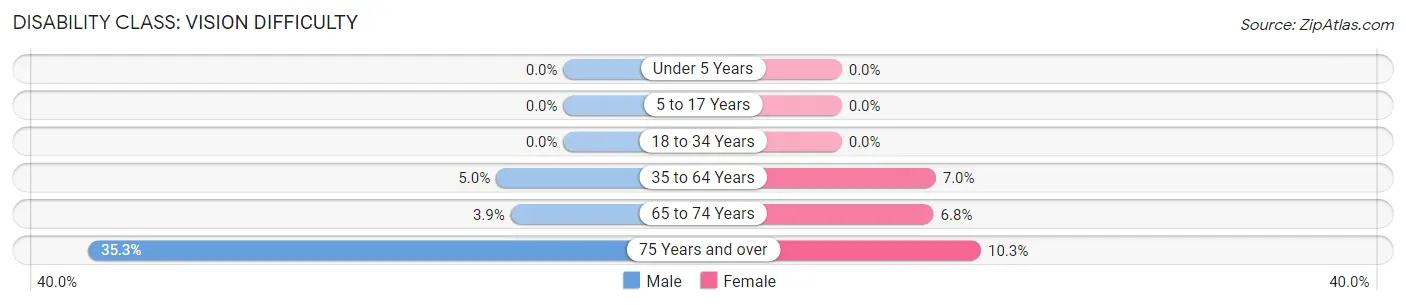
| Age Bracket | Male | Female |
| Under 5 Years | 0 (0.0%) | 0 (0.0%) |
| 5 to 17 Years | 0 (0.0%) | 0 (0.0%) |
| 18 to 34 Years | 0 (0.0%) | 0 (0.0%) |
| 35 to 64 Years | 7 (5.0%) | 15 (7.0%) |
| 65 to 74 Years | 4 (3.9%) | 9 (6.8%) |
| 75 Years and over | 6 (35.3%) | 3 (10.3%) |
Disability Class: Cognitive Difficulty
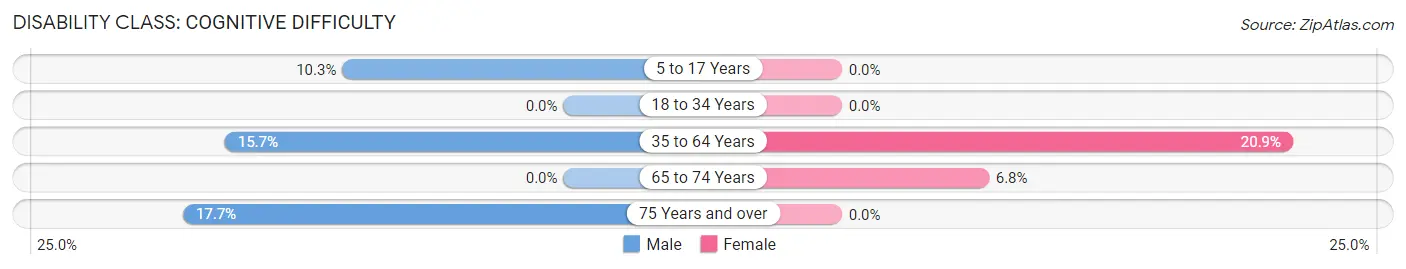
| Age Bracket | Male | Female |
| 5 to 17 Years | 4 (10.3%) | 0 (0.0%) |
| 18 to 34 Years | 0 (0.0%) | 0 (0.0%) |
| 35 to 64 Years | 22 (15.7%) | 45 (20.9%) |
| 65 to 74 Years | 0 (0.0%) | 9 (6.8%) |
| 75 Years and over | 3 (17.6%) | 0 (0.0%) |
Disability Class: Ambulatory Difficulty
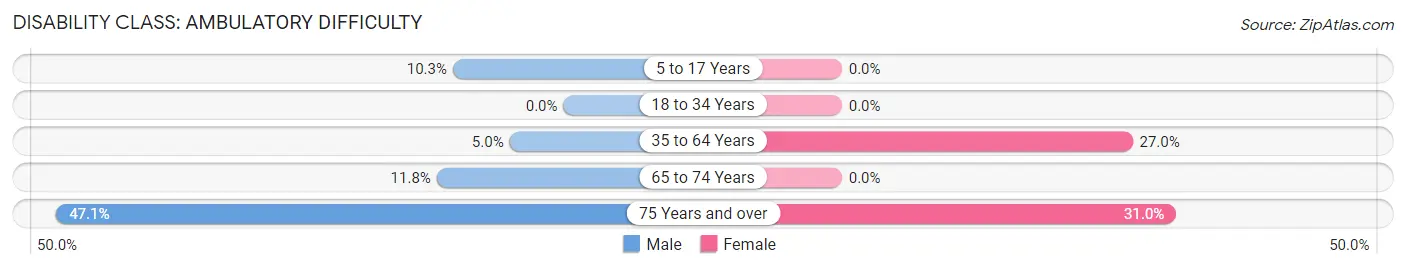
| Age Bracket | Male | Female |
| 5 to 17 Years | 4 (10.3%) | 0 (0.0%) |
| 18 to 34 Years | 0 (0.0%) | 0 (0.0%) |
| 35 to 64 Years | 7 (5.0%) | 58 (27.0%) |
| 65 to 74 Years | 12 (11.8%) | 0 (0.0%) |
| 75 Years and over | 8 (47.1%) | 9 (31.0%) |
Disability Class: Self-Care Difficulty
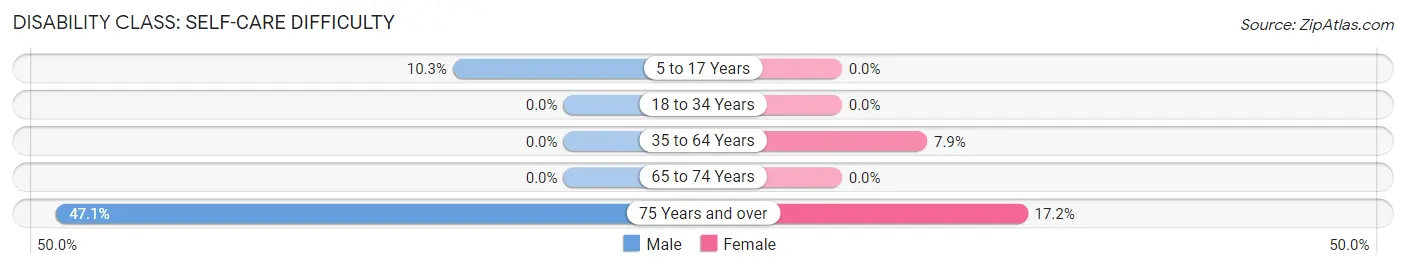
| Age Bracket | Male | Female |
| 5 to 17 Years | 4 (10.3%) | 0 (0.0%) |
| 18 to 34 Years | 0 (0.0%) | 0 (0.0%) |
| 35 to 64 Years | 0 (0.0%) | 17 (7.9%) |
| 65 to 74 Years | 0 (0.0%) | 0 (0.0%) |
| 75 Years and over | 8 (47.1%) | 5 (17.2%) |
Technology Access in Marvell
Computing Device Access in Marvell
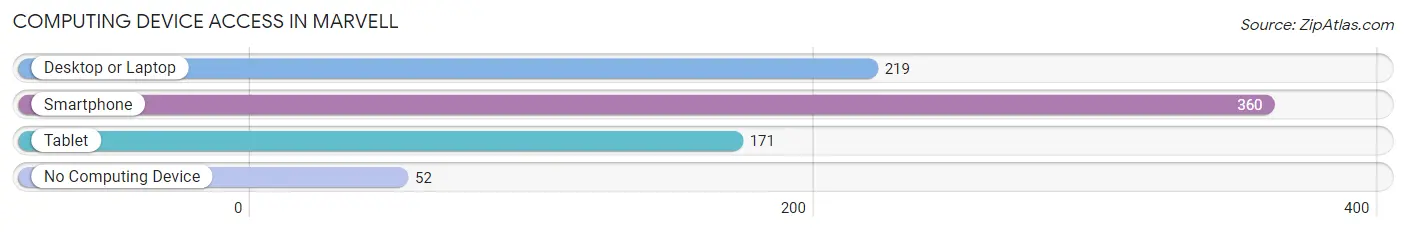
| Device Type | # Households | % Households |
| Desktop or Laptop | 219 | 51.4% |
| Smartphone | 360 | 84.5% |
| Tablet | 171 | 40.1% |
| No Computing Device | 52 | 12.2% |
| Total | 426 | 100.0% |
Internet Access in Marvell
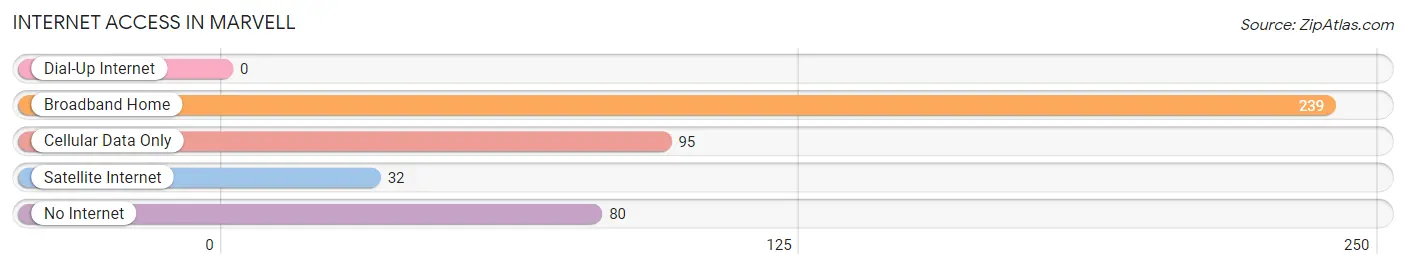
| Internet Type | # Households | % Households |
| Dial-Up Internet | 0 | 0.0% |
| Broadband Home | 239 | 56.1% |
| Cellular Data Only | 95 | 22.3% |
| Satellite Internet | 32 | 7.5% |
| No Internet | 80 | 18.8% |
| Total | 426 | 100.0% |
Marvell Summary
Marvell, Arkansas is a small city located in Phillips County, Arkansas. It is situated on the banks of the Mississippi River, approximately 40 miles south of Memphis, Tennessee. The city has a population of approximately 2,500 people and is the county seat of Phillips County.
Marvell is located in the Arkansas Delta, a region of the state known for its rich agricultural heritage. The city is situated on the banks of the Mississippi River, and is surrounded by a number of small towns and rural communities. The city is home to a number of historic sites, including the Marvell-Elaine Historic District, which is listed on the National Register of Historic Places.
Marvell has a humid subtropical climate, with hot, humid summers and mild winters. The average annual temperature is around 64 degrees Fahrenheit, with an average high of around 90 degrees in the summer and an average low of around 40 degrees in the winter. The city receives an average of 48 inches of precipitation per year, with most of it falling in the spring and summer months.
The economy of Marvell is largely based on agriculture. The city is home to a number of farms, which produce a variety of crops, including cotton, soybeans, corn, and rice. The city is also home to a number of manufacturing and industrial businesses, including a paper mill, a lumber mill, and a number of food processing plants.
Marvell has a diverse population, with a majority of the population being African American. The city also has a significant Hispanic population, as well as a small number of Asian and Native American residents. The median household income in Marvell is around $30,000, and the median home value is around $80,000.
Marvell is served by the Marvell School District, which includes two elementary schools, one middle school, and one high school. The city is also home to a number of churches, including the First Baptist Church of Marvell, the Marvell United Methodist Church, and the Marvell Presbyterian Church.
Marvell is a small city with a rich history and a diverse population. The city is home to a number of historic sites, and is surrounded by a number of small towns and rural communities. The city has a strong agricultural heritage, and is home to a number of manufacturing and industrial businesses. The city has a diverse population, with a majority of the population being African American. The city is served by the Marvell School District, and is home to a number of churches.
Common Questions
What is Per Capita Income in Marvell?
Per Capita income in Marvell is $27,318.
What is the Median Family Income in Marvell?
Median Family Income in Marvell is $75,353.
What is the Median Household income in Marvell?
Median Household Income in Marvell is $51,293.
What is Income or Wage Gap in Marvell?
Income or Wage Gap in Marvell is 59.1%.
Women in Marvell earn 40.9 cents for every dollar earned by a man.
What is Family Income Deficit in Marvell?
Family Income Deficit in Marvell is $18,046.
Families that are below poverty line in Marvell earn $18,046 less on average than the poverty threshold level.
What is Inequality or Gini Index in Marvell?
Inequality or Gini Index in Marvell is 0.47.
What is the Total Population of Marvell?
Total Population of Marvell is 1,100.
What is the Total Male Population of Marvell?
Total Male Population of Marvell is 400.
What is the Total Female Population of Marvell?
Total Female Population of Marvell is 700.
What is the Ratio of Males per 100 Females in Marvell?
There are 57.14 Males per 100 Females in Marvell.
What is the Ratio of Females per 100 Males in Marvell?
There are 175.00 Females per 100 Males in Marvell.
What is the Median Population Age in Marvell?
Median Population Age in Marvell is 42.5 Years.
What is the Average Family Size in Marvell
Average Family Size in Marvell is 3.4 People.
What is the Average Household Size in Marvell
Average Household Size in Marvell is 2.6 People.
How Large is the Labor Force in Marvell?
There are 471 People in the Labor Forcein in Marvell.
What is the Percentage of People in the Labor Force in Marvell?
57.5% of People are in the Labor Force in Marvell.
What is the Unemployment Rate in Marvell?
Unemployment Rate in Marvell is 17.2%.