Regan, ND Map & Demographics
Regan Map
Regan Overview
$23,788
PER CAPITA INCOME
$70,500
AVG HOUSEHOLD INCOME
0.23
INEQUALITY / GINI INDEX
88
TOTAL POPULATION
23
MALE POPULATION
65
FEMALE POPULATION
35.38
MALES / 100 FEMALES
282.61
FEMALES / 100 MALES
22.3
MEDIAN AGE
6.9
AVG FAMILY SIZE
4.0
AVG HOUSEHOLD SIZE
45
LABOR FORCE [ PEOPLE ]
84.9%
PERCENT IN LABOR FORCE
Regan Zip Codes
Regan Area Codes
Income in Regan
Income Overview in Regan
| Characteristic | Number | Measure |
| Per Capita Income | 88 | $23,788 |
| Median Family Income | 11 | $0 |
| Mean Family Income | 11 | $0 |
| Median Household Income | 22 | $70,500 |
| Mean Household Income | 22 | $67,141 |
| Income Deficit | 11 | $0 |
| Wage / Income Gap (%) | 88 | 0.00% |
| Wage / Income Gap ($) | 88 | 100.00¢ per $1 |
| Gini / Inequality Index | 88 | 0.23 |
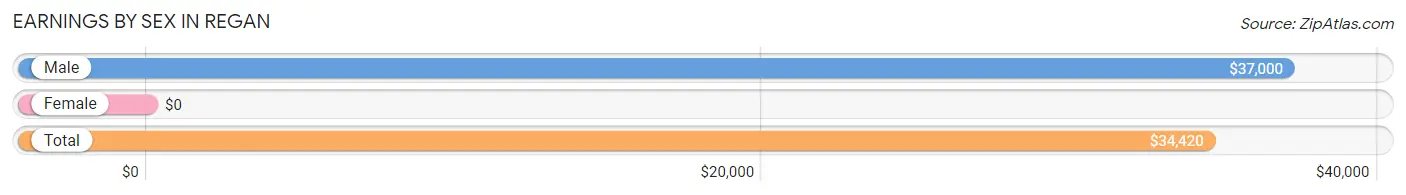
Earnings by Sex in Regan
| Sex | Number | Average Earnings |
| Male | 18 (38.3%) | $37,000 |
| Female | 29 (61.7%) | $0 |
| Total | 47 (100.0%) | $34,420 |
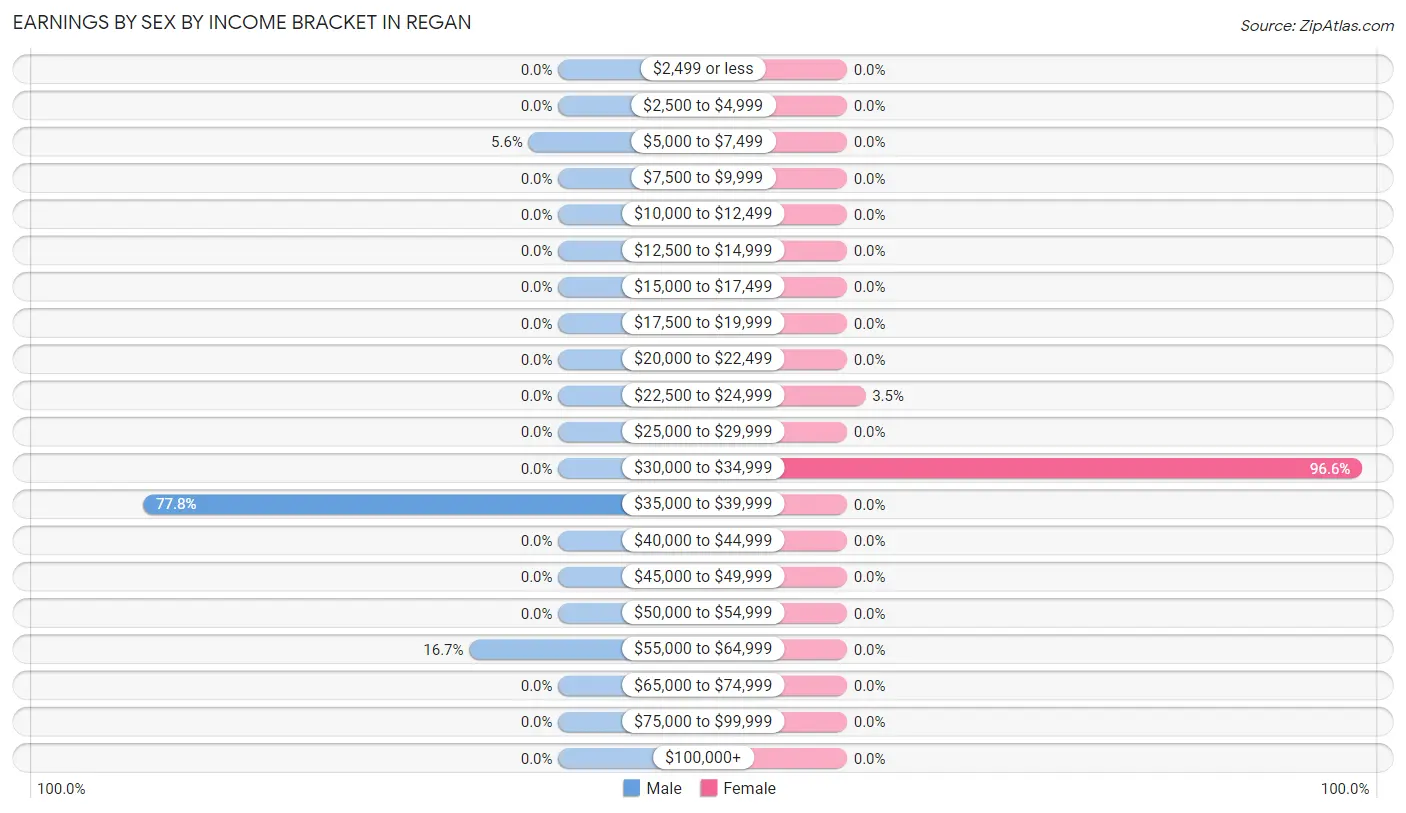
Earnings by Sex by Income Bracket in Regan
The most common earnings brackets in Regan are $35,000 to $39,999 for men (14 | 77.8%) and $30,000 to $34,999 for women (28 | 96.6%).
| Income | Male | Female |
| $2,499 or less | 0 (0.0%) | 0 (0.0%) |
| $2,500 to $4,999 | 0 (0.0%) | 0 (0.0%) |
| $5,000 to $7,499 | 1 (5.6%) | 0 (0.0%) |
| $7,500 to $9,999 | 0 (0.0%) | 0 (0.0%) |
| $10,000 to $12,499 | 0 (0.0%) | 0 (0.0%) |
| $12,500 to $14,999 | 0 (0.0%) | 0 (0.0%) |
| $15,000 to $17,499 | 0 (0.0%) | 0 (0.0%) |
| $17,500 to $19,999 | 0 (0.0%) | 0 (0.0%) |
| $20,000 to $22,499 | 0 (0.0%) | 0 (0.0%) |
| $22,500 to $24,999 | 0 (0.0%) | 1 (3.5%) |
| $25,000 to $29,999 | 0 (0.0%) | 0 (0.0%) |
| $30,000 to $34,999 | 0 (0.0%) | 28 (96.6%) |
| $35,000 to $39,999 | 14 (77.8%) | 0 (0.0%) |
| $40,000 to $44,999 | 0 (0.0%) | 0 (0.0%) |
| $45,000 to $49,999 | 0 (0.0%) | 0 (0.0%) |
| $50,000 to $54,999 | 0 (0.0%) | 0 (0.0%) |
| $55,000 to $64,999 | 3 (16.7%) | 0 (0.0%) |
| $65,000 to $74,999 | 0 (0.0%) | 0 (0.0%) |
| $75,000 to $99,999 | 0 (0.0%) | 0 (0.0%) |
| $100,000+ | 0 (0.0%) | 0 (0.0%) |
| Total | 18 (100.0%) | 29 (100.0%) |
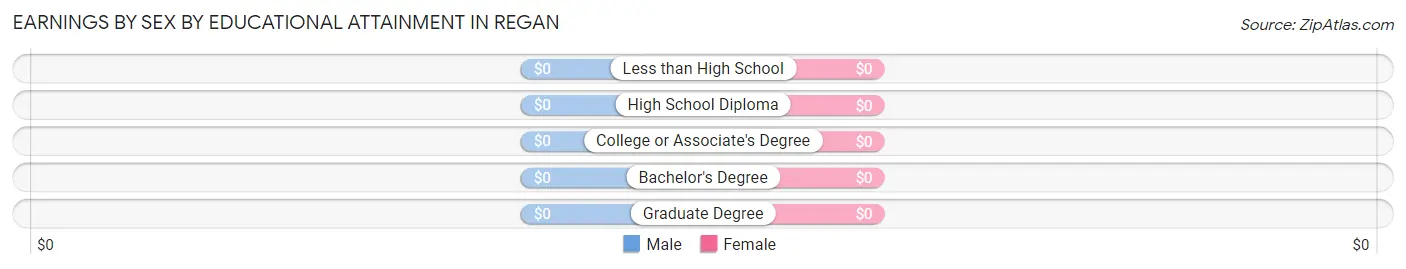
Earnings by Sex by Educational Attainment in Regan
| Educational Attainment | Male Income | Female Income |
| Less than High School | - | - |
| High School Diploma | - | - |
| College or Associate's Degree | - | - |
| Bachelor's Degree | - | - |
| Graduate Degree | - | - |
| Total | $39,063 | $0 |
Family Income in Regan
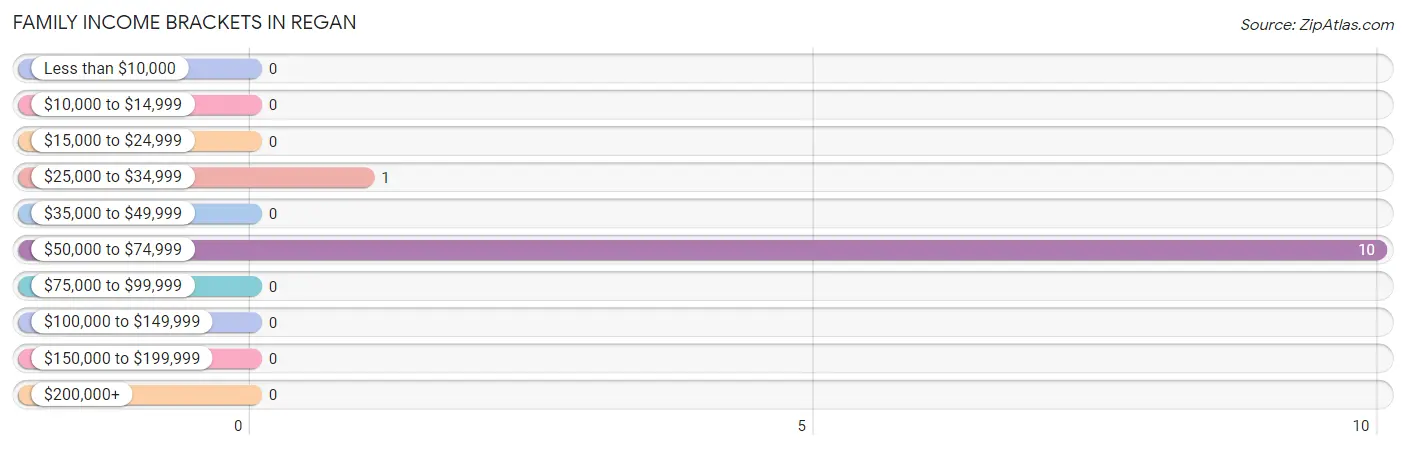
Family Income Brackets in Regan
According to the Regan family income data, there are 10 families falling into the $50,000 to $74,999 income range, which is the most common income bracket and makes up 90.9% of all families.
| Income Bracket | # Families | % Families |
| Less than $10,000 | 0 | 0.0% |
| $10,000 to $14,999 | 0 | 0.0% |
| $15,000 to $24,999 | 0 | 0.0% |
| $25,000 to $34,999 | 1 | 9.1% |
| $35,000 to $49,999 | 0 | 0.0% |
| $50,000 to $74,999 | 10 | 90.9% |
| $75,000 to $99,999 | 0 | 0.0% |
| $100,000 to $149,999 | 0 | 0.0% |
| $150,000 to $199,999 | 0 | 0.0% |
| $200,000+ | 0 | 0.0% |
Family Income by Famaliy Size in Regan
| Income Bracket | # Families | Median Income |
| 2-Person Families | 1 (9.1%) | $0 |
| 3-Person Families | 10 (90.9%) | $0 |
| 4-Person Families | 0 (0.0%) | $0 |
| 5-Person Families | 0 (0.0%) | $0 |
| 6-Person Families | 0 (0.0%) | $0 |
| 7+ Person Families | 0 (0.0%) | $0 |
| Total | 11 (100.0%) | $0 |
Family Income by Number of Earners in Regan
| Number of Earners | # Families | Median Income |
| No Earners | 1 (9.1%) | $0 |
| 1 Earner | 0 (0.0%) | $0 |
| 2 Earners | 10 (90.9%) | $0 |
| 3+ Earners | 0 (0.0%) | $0 |
| Total | 11 (100.0%) | $0 |
Household Income in Regan
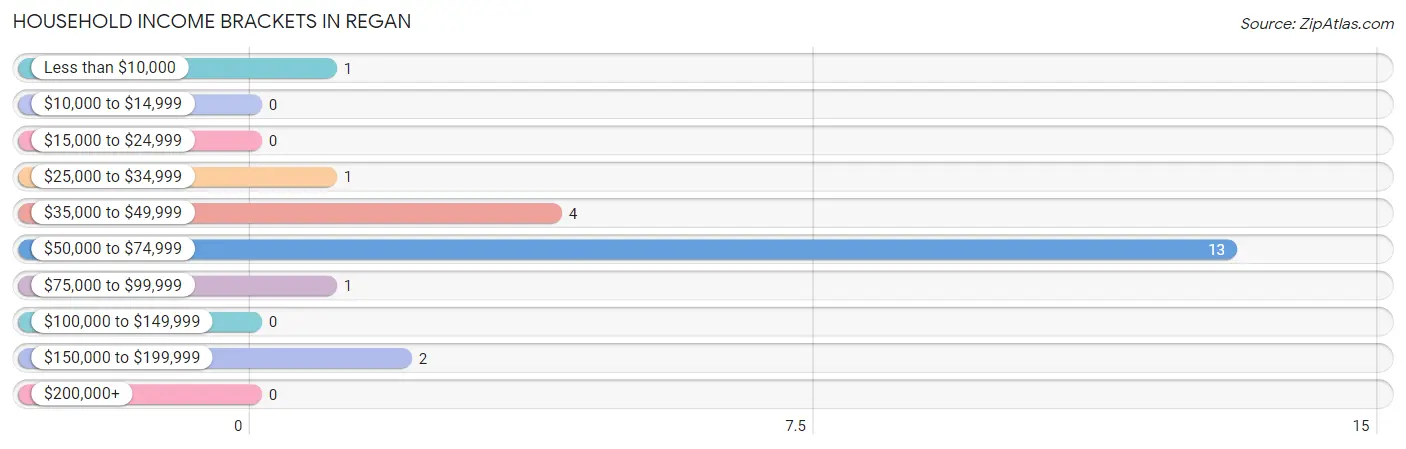
Household Income Brackets in Regan
With 13 households falling in the category, the $50,000 to $74,999 income range is the most frequent in Regan, accounting for 59.1% of all households.
| Income Bracket | # Households | % Households |
| Less than $10,000 | 1 | 4.5% |
| $10,000 to $14,999 | 0 | 0.0% |
| $15,000 to $24,999 | 0 | 0.0% |
| $25,000 to $34,999 | 1 | 4.5% |
| $35,000 to $49,999 | 4 | 18.2% |
| $50,000 to $74,999 | 13 | 59.1% |
| $75,000 to $99,999 | 1 | 4.5% |
| $100,000 to $149,999 | 0 | 0.0% |
| $150,000 to $199,999 | 2 | 9.1% |
| $200,000+ | 0 | 0.0% |
Household Income by Householder Age in Regan
| Income Bracket | # Households | Median Income |
| 15 to 24 Years | 11 (50.0%) | $0 |
| 25 to 44 Years | 1 (4.5%) | $0 |
| 45 to 64 Years | 6 (27.3%) | $0 |
| 65+ Years | 4 (18.2%) | $0 |
| Total | 22 (100.0%) | $70,500 |
Poverty in Regan
Income Below Poverty by Sex and Age in Regan
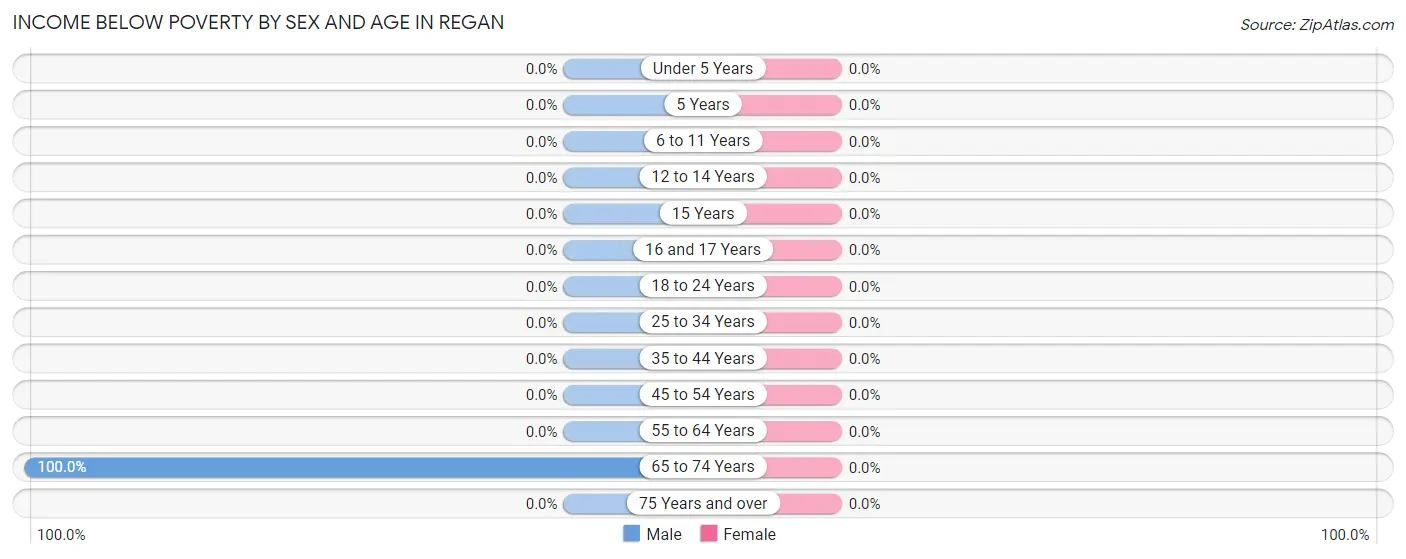
| Age Bracket | Male | Female |
| Under 5 Years | 0 (0.0%) | 0 (0.0%) |
| 5 Years | 0 (0.0%) | 0 (0.0%) |
| 6 to 11 Years | 0 (0.0%) | 0 (0.0%) |
| 12 to 14 Years | 0 (0.0%) | 0 (0.0%) |
| 15 Years | 0 (0.0%) | 0 (0.0%) |
| 16 and 17 Years | 0 (0.0%) | 0 (0.0%) |
| 18 to 24 Years | 0 (0.0%) | 0 (0.0%) |
| 25 to 34 Years | 0 (0.0%) | 0 (0.0%) |
| 35 to 44 Years | 0 (0.0%) | 0 (0.0%) |
| 45 to 54 Years | 0 (0.0%) | 0 (0.0%) |
| 55 to 64 Years | 0 (0.0%) | 0 (0.0%) |
| 65 to 74 Years | 1 (100.0%) | 0 (0.0%) |
| 75 Years and over | 0 (0.0%) | 0 (0.0%) |
| Total | 1 (4.3%) | 0 (0.0%) |
Income Above Poverty by Sex and Age in Regan
According to the poverty statistics in Regan, males aged 18 to 24 years and females aged under 5 years are the age groups that are most secure financially, with 100.0% of males and 100.0% of females in these age groups living above the poverty line.
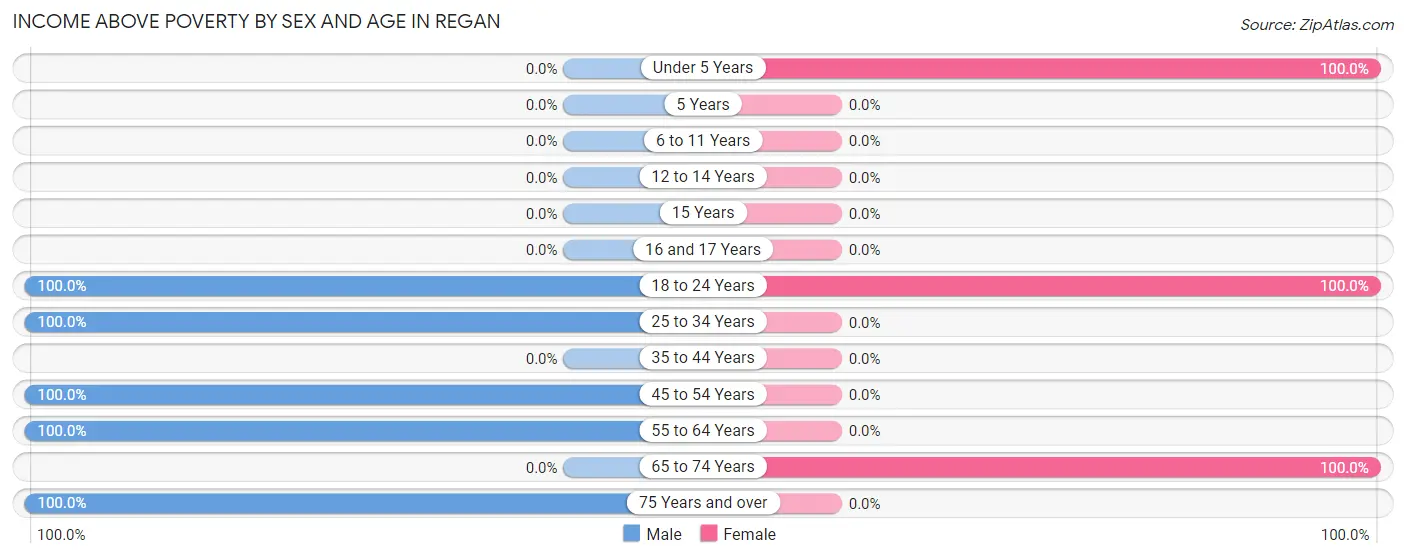
| Age Bracket | Male | Female |
| Under 5 Years | 0 (0.0%) | 35 (100.0%) |
| 5 Years | 0 (0.0%) | 0 (0.0%) |
| 6 to 11 Years | 0 (0.0%) | 0 (0.0%) |
| 12 to 14 Years | 0 (0.0%) | 0 (0.0%) |
| 15 Years | 0 (0.0%) | 0 (0.0%) |
| 16 and 17 Years | 0 (0.0%) | 0 (0.0%) |
| 18 to 24 Years | 11 (100.0%) | 29 (100.0%) |
| 25 to 34 Years | 1 (100.0%) | 0 (0.0%) |
| 35 to 44 Years | 0 (0.0%) | 0 (0.0%) |
| 45 to 54 Years | 4 (100.0%) | 0 (0.0%) |
| 55 to 64 Years | 2 (100.0%) | 0 (0.0%) |
| 65 to 74 Years | 0 (0.0%) | 1 (100.0%) |
| 75 Years and over | 4 (100.0%) | 0 (0.0%) |
| Total | 22 (95.7%) | 65 (100.0%) |
Income Below Poverty Among Married-Couple Families in Regan
| Children | Above Poverty | Below Poverty |
| No Children | 1 (100.0%) | 0 (0.0%) |
| 1 or 2 Children | 10 (100.0%) | 0 (0.0%) |
| 3 or 4 Children | 0 (0.0%) | 0 (0.0%) |
| 5 or more Children | 0 (0.0%) | 0 (0.0%) |
| Total | 11 (100.0%) | 0 (0.0%) |
Income Below Poverty Among Single-Parent Households in Regan
| Children | Single Father | Single Mother |
| No Children | 0 (0.0%) | 0 (0.0%) |
| 1 or 2 Children | 0 (0.0%) | 0 (0.0%) |
| 3 or 4 Children | 0 (0.0%) | 0 (0.0%) |
| 5 or more Children | 0 (0.0%) | 0 (0.0%) |
| Total | 0 (0.0%) | 0 (0.0%) |
Income Below Poverty Among Married-Couple vs Single-Parent Households in Regan
| Children | Married-Couple Families | Single-Parent Households |
| No Children | 0 (0.0%) | 0 (0.0%) |
| 1 or 2 Children | 0 (0.0%) | 0 (0.0%) |
| 3 or 4 Children | 0 (0.0%) | 0 (0.0%) |
| 5 or more Children | 0 (0.0%) | 0 (0.0%) |
| Total | 0 (0.0%) | 0 (0.0%) |
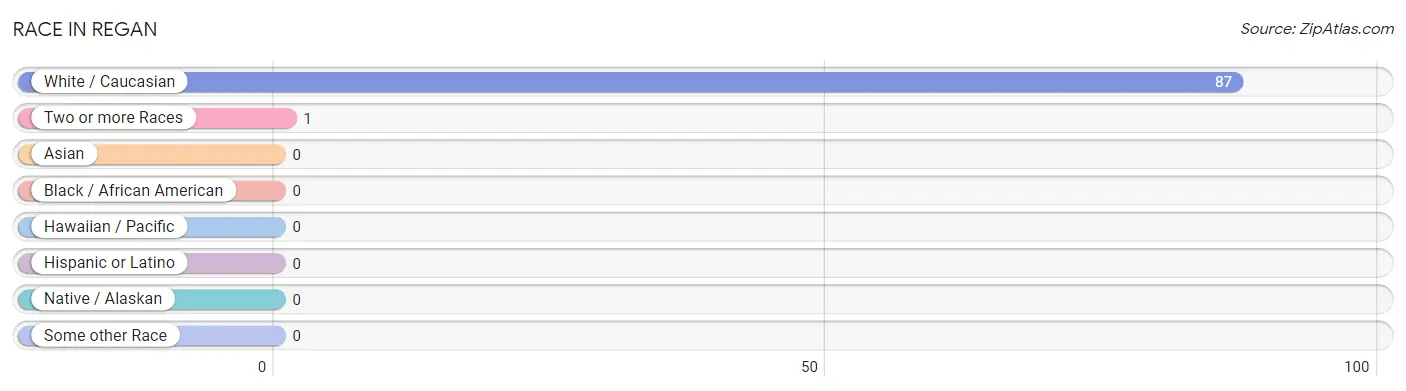
Race in Regan
The most populous races in Regan are White / Caucasian (87 | 98.9%), and Two or more Races (1 | 1.1%).
| Race | # Population | % Population |
| Asian | 0 | 0.0% |
| Black / African American | 0 | 0.0% |
| Hawaiian / Pacific | 0 | 0.0% |
| Hispanic or Latino | 0 | 0.0% |
| Native / Alaskan | 0 | 0.0% |
| White / Caucasian | 87 | 98.9% |
| Two or more Races | 1 | 1.1% |
| Some other Race | 0 | 0.0% |
| Total | 88 | 100.0% |
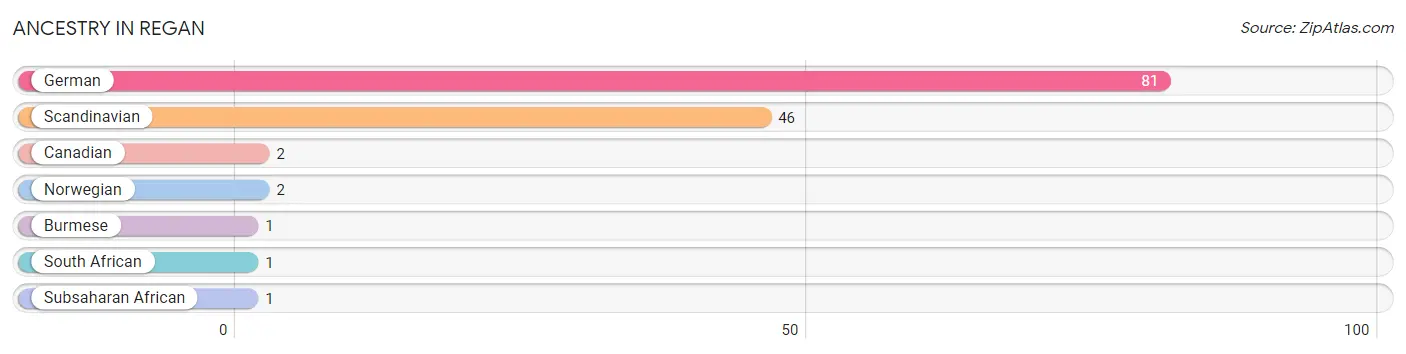
Ancestry in Regan
The most populous ancestries reported in Regan are German (81 | 92.0%), Scandinavian (46 | 52.3%), Canadian (2 | 2.3%), Norwegian (2 | 2.3%), and Burmese (1 | 1.1%), together accounting for 150.0% of all Regan residents.
| Ancestry | # Population | % Population |
| Burmese | 1 | 1.1% |
| Canadian | 2 | 2.3% |
| German | 81 | 92.0% |
| Norwegian | 2 | 2.3% |
| Scandinavian | 46 | 52.3% |
| South African | 1 | 1.1% |
| Subsaharan African | 1 | 1.1% | View All 7 Rows |
Immigrants in Regan
The most numerous immigrant groups reported in Regan came from Africa (1 | 1.1%), and South Africa (1 | 1.1%), together accounting for 2.3% of all Regan residents.
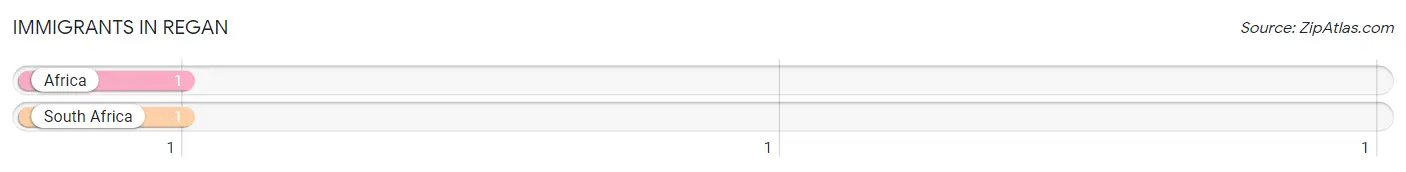
| Immigration Origin | # Population | % Population |
| Africa | 1 | 1.1% |
| South Africa | 1 | 1.1% | View All 2 Rows |
Sex and Age in Regan
Sex and Age in Regan
The most populous age groups in Regan are 20 to 24 Years (11 | 47.8%) for men and Under 5 Years (35 | 53.8%) for women.
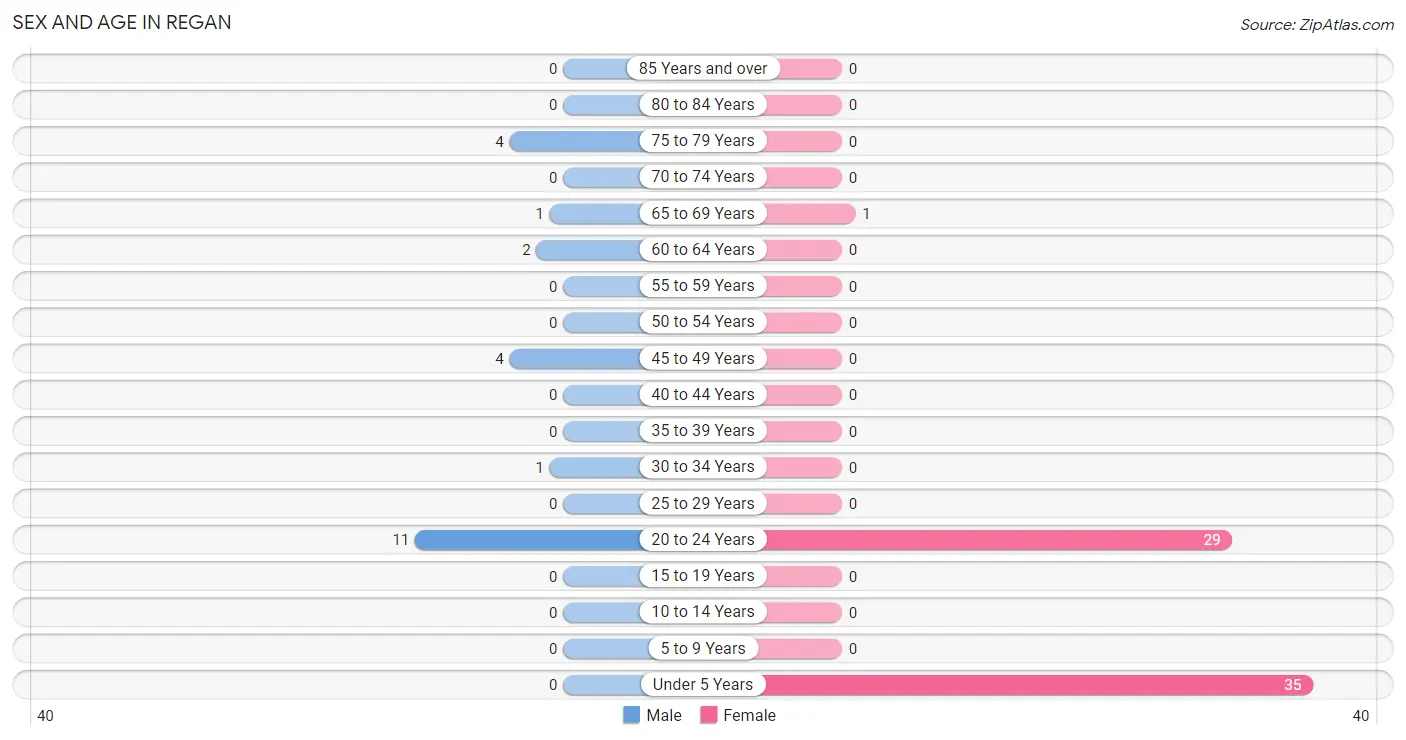
| Age Bracket | Male | Female |
| Under 5 Years | 0 (0.0%) | 35 (53.8%) |
| 5 to 9 Years | 0 (0.0%) | 0 (0.0%) |
| 10 to 14 Years | 0 (0.0%) | 0 (0.0%) |
| 15 to 19 Years | 0 (0.0%) | 0 (0.0%) |
| 20 to 24 Years | 11 (47.8%) | 29 (44.6%) |
| 25 to 29 Years | 0 (0.0%) | 0 (0.0%) |
| 30 to 34 Years | 1 (4.3%) | 0 (0.0%) |
| 35 to 39 Years | 0 (0.0%) | 0 (0.0%) |
| 40 to 44 Years | 0 (0.0%) | 0 (0.0%) |
| 45 to 49 Years | 4 (17.4%) | 0 (0.0%) |
| 50 to 54 Years | 0 (0.0%) | 0 (0.0%) |
| 55 to 59 Years | 0 (0.0%) | 0 (0.0%) |
| 60 to 64 Years | 2 (8.7%) | 0 (0.0%) |
| 65 to 69 Years | 1 (4.3%) | 1 (1.5%) |
| 70 to 74 Years | 0 (0.0%) | 0 (0.0%) |
| 75 to 79 Years | 4 (17.4%) | 0 (0.0%) |
| 80 to 84 Years | 0 (0.0%) | 0 (0.0%) |
| 85 Years and over | 0 (0.0%) | 0 (0.0%) |
| Total | 23 (100.0%) | 65 (100.0%) |
Families and Households in Regan
Median Family Size in Regan
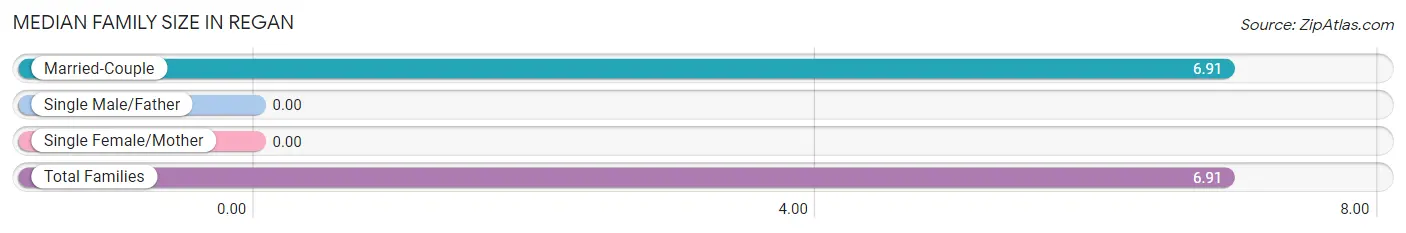
| Family Type | # Families | Family Size |
| Married-Couple | 11 (100.0%) | 6.91 |
| Single Male/Father | 0 (0.0%) | - |
| Single Female/Mother | 0 (0.0%) | - |
| Total Families | 11 (100.0%) | 6.91 |
Median Household Size in Regan
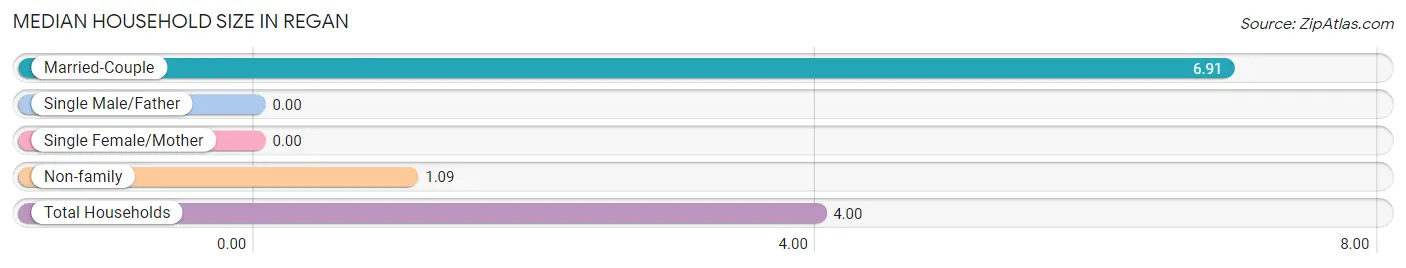
| Household Type | # Households | Household Size |
| Married-Couple | 11 (50.0%) | 6.91 |
| Single Male/Father | 0 (0.0%) | - |
| Single Female/Mother | 0 (0.0%) | - |
| Non-family | 11 (50.0%) | 1.09 |
| Total Households | 22 (100.0%) | 4.00 |
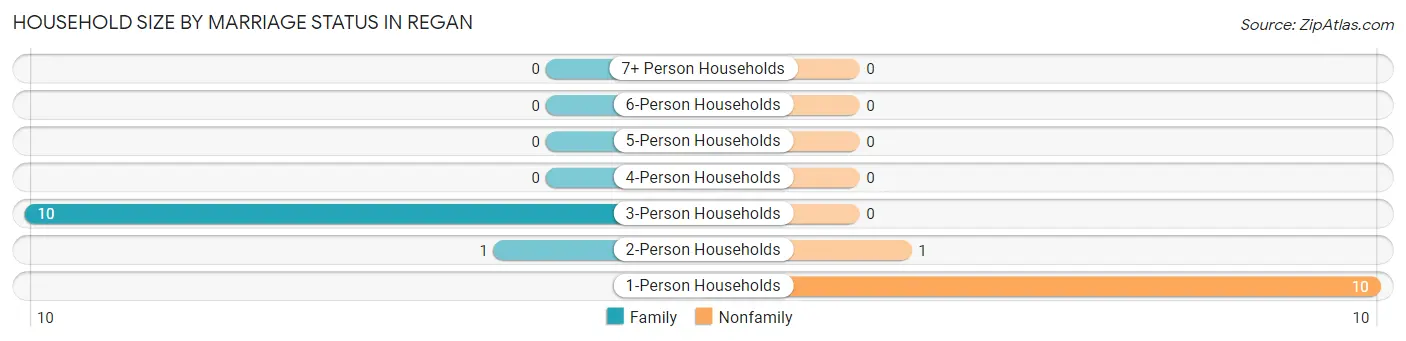
Household Size by Marriage Status in Regan
Out of a total of 22 households in Regan, 11 (50.0%) are family households, while 11 (50.0%) are nonfamily households. The most numerous type of family households are 3-person households, comprising 10, and the most common type of nonfamily households are 1-person households, comprising 10.
| Household Size | Family Households | Nonfamily Households |
| 1-Person Households | - | 10 (45.5%) |
| 2-Person Households | 1 (4.5%) | 1 (4.5%) |
| 3-Person Households | 10 (45.5%) | 0 (0.0%) |
| 4-Person Households | 0 (0.0%) | 0 (0.0%) |
| 5-Person Households | 0 (0.0%) | 0 (0.0%) |
| 6-Person Households | 0 (0.0%) | 0 (0.0%) |
| 7+ Person Households | 0 (0.0%) | 0 (0.0%) |
| Total | 11 (50.0%) | 11 (50.0%) |
Female Fertility in Regan
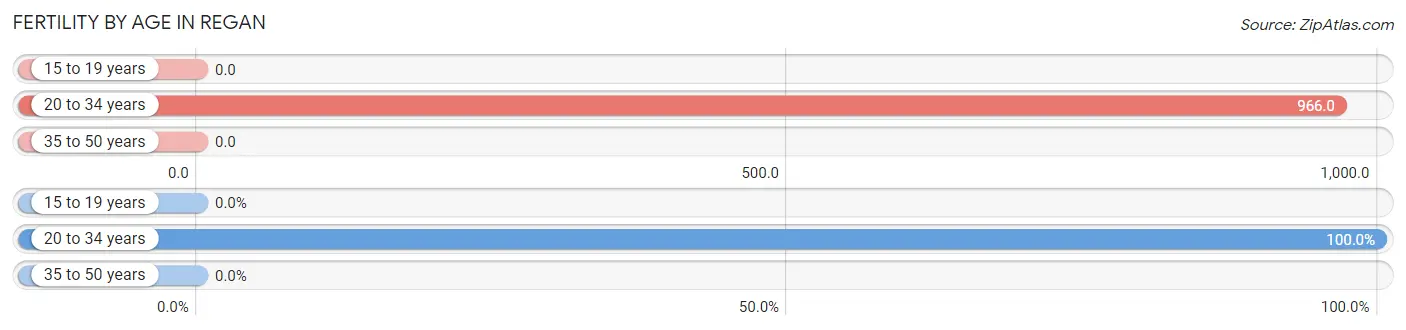
Fertility by Age in Regan
Average fertility rate in Regan is 966.0 births per 1,000 women. Women in the age bracket of 20 to 34 years have the highest fertility rate with 966.0 births per 1,000 women. Women in the age bracket of 20 to 34 years acount for 100.0% of all women with births.
| Age Bracket | Women with Births | Births / 1,000 Women |
| 15 to 19 years | 0 (0.0%) | 0.0 |
| 20 to 34 years | 28 (100.0%) | 966.0 |
| 35 to 50 years | 0 (0.0%) | 0.0 |
| Total | 28 (100.0%) | 966.0 |
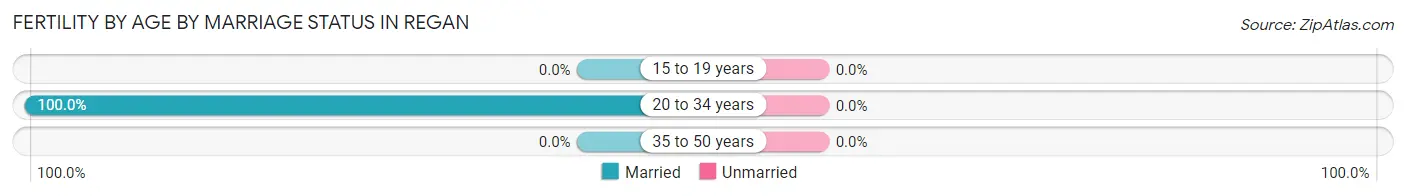
Fertility by Age by Marriage Status in Regan
| Age Bracket | Married | Unmarried |
| 15 to 19 years | 0 (0.0%) | 0 (0.0%) |
| 20 to 34 years | 28 (100.0%) | 0 (0.0%) |
| 35 to 50 years | 0 (0.0%) | 0 (0.0%) |
| Total | 28 (100.0%) | 0 (0.0%) |
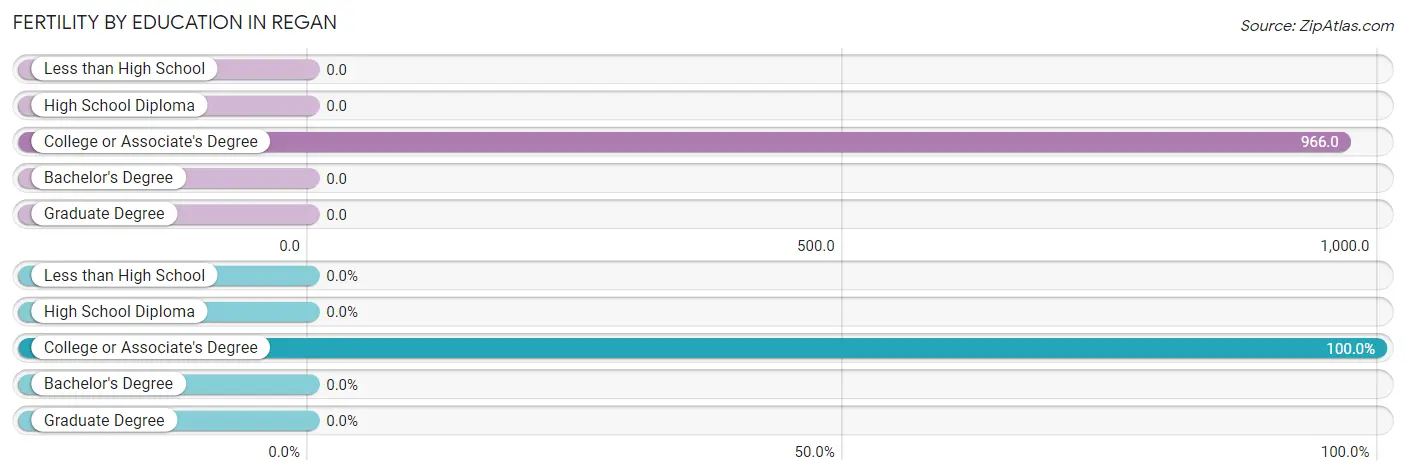
Fertility by Education in Regan
| Educational Attainment | Women with Births | Births / 1,000 Women |
| Less than High School | 0 (0.0%) | 0.0 |
| High School Diploma | 0 (0.0%) | 0.0 |
| College or Associate's Degree | 28 (100.0%) | 966.0 |
| Bachelor's Degree | 0 (0.0%) | 0.0 |
| Graduate Degree | 0 (0.0%) | 0.0 |
| Total | 28 (100.0%) | 966.0 |
Fertility by Education by Marriage Status in Regan
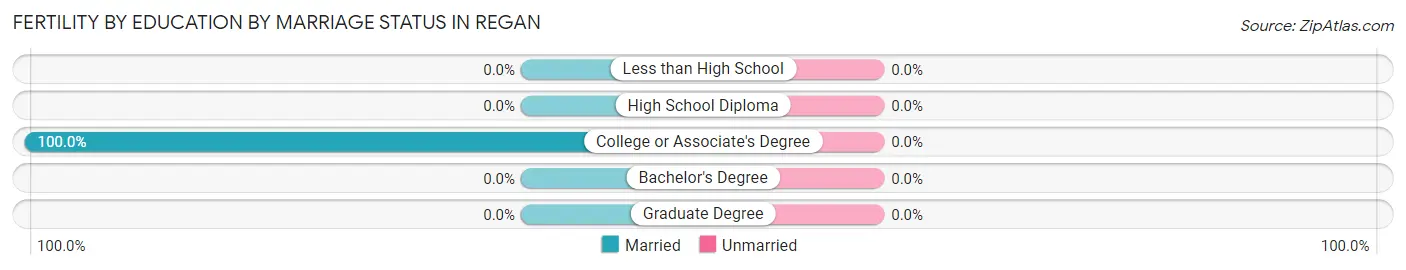
| Educational Attainment | Married | Unmarried |
| Less than High School | 0 (0.0%) | 0 (0.0%) |
| High School Diploma | 0 (0.0%) | 0 (0.0%) |
| College or Associate's Degree | 28 (100.0%) | 0 (0.0%) |
| Bachelor's Degree | 0 (0.0%) | 0 (0.0%) |
| Graduate Degree | 0 (0.0%) | 0 (0.0%) |
| Total | 28 (100.0%) | 0 (0.0%) |
Employment Characteristics in Regan
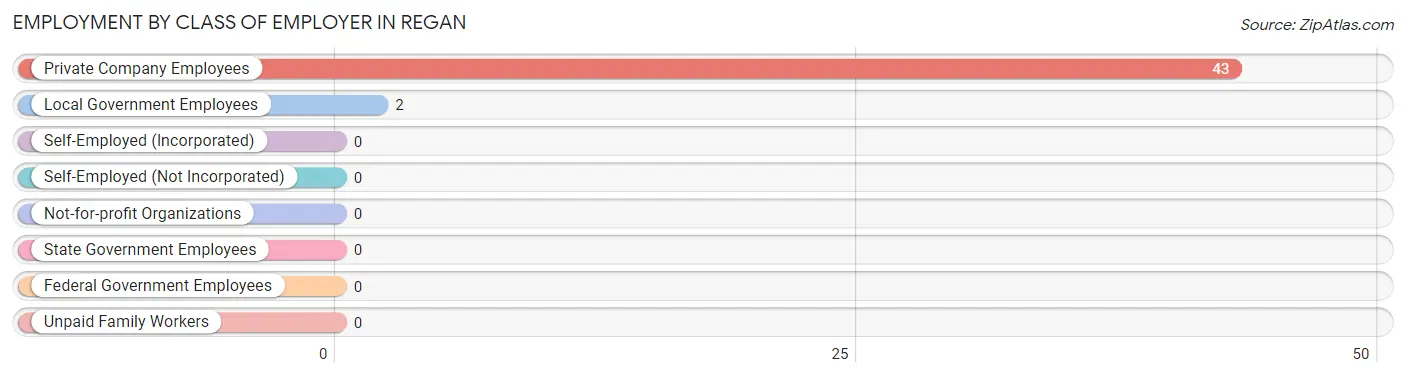
Employment by Class of Employer in Regan
Among the 45 employed individuals in Regan, private company employees (43 | 95.6%), and local government employees (2 | 4.4%) make up the most common classes of employment.
| Employer Class | # Employees | % Employees |
| Private Company Employees | 43 | 95.6% |
| Self-Employed (Incorporated) | 0 | 0.0% |
| Self-Employed (Not Incorporated) | 0 | 0.0% |
| Not-for-profit Organizations | 0 | 0.0% |
| Local Government Employees | 2 | 4.4% |
| State Government Employees | 0 | 0.0% |
| Federal Government Employees | 0 | 0.0% |
| Unpaid Family Workers | 0 | 0.0% |
| Total | 45 | 100.0% |
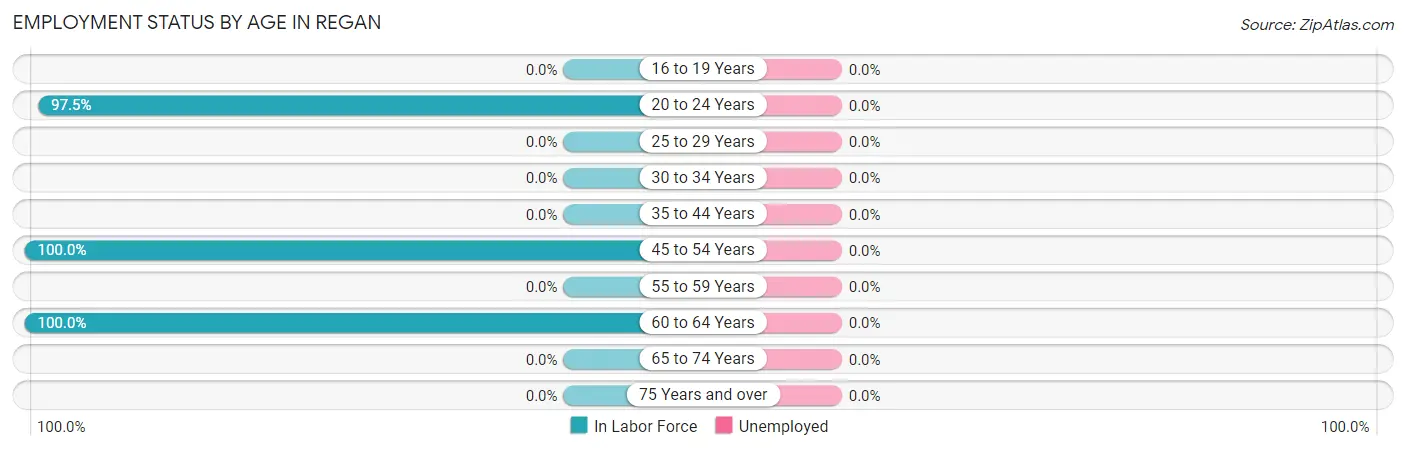
Employment Status by Age in Regan
| Age Bracket | In Labor Force | Unemployed |
| 16 to 19 Years | 0 (0.0%) | 0 (0.0%) |
| 20 to 24 Years | 39 (97.5%) | 0 (0.0%) |
| 25 to 29 Years | 0 (0.0%) | 0 (0.0%) |
| 30 to 34 Years | 0 (0.0%) | 0 (0.0%) |
| 35 to 44 Years | 0 (0.0%) | 0 (0.0%) |
| 45 to 54 Years | 4 (100.0%) | 0 (0.0%) |
| 55 to 59 Years | 0 (0.0%) | 0 (0.0%) |
| 60 to 64 Years | 2 (100.0%) | 0 (0.0%) |
| 65 to 74 Years | 0 (0.0%) | 0 (0.0%) |
| 75 Years and over | 0 (0.0%) | 0 (0.0%) |
| Total | 45 (84.9%) | 0 (0.0%) |
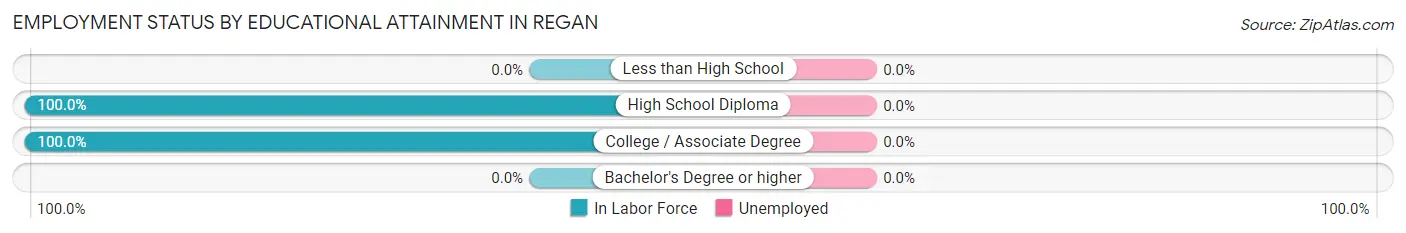
Employment Status by Educational Attainment in Regan
| Educational Attainment | In Labor Force | Unemployed |
| Less than High School | 0 (0.0%) | 0 (0.0%) |
| High School Diploma | 2 (100.0%) | 0 (0.0%) |
| College / Associate Degree | 4 (100.0%) | 0 (0.0%) |
| Bachelor's Degree or higher | 0 (0.0%) | 0 (0.0%) |
| Total | 6 (85.7%) | 0 (0.0%) |
Employment Occupations by Sex in Regan
Management, Business, Science and Arts Occupations
Management, Business, Science and Arts Occupations by Sex
| Occupation | Male | Female |
| Management | 0 (0.0%) | 0 (0.0%) |
| Business & Financial | 0 (0.0%) | 0 (0.0%) |
| Computers, Engineering & Science | 0 (0.0%) | 0 (0.0%) |
| Computers & Mathematics | 0 (0.0%) | 0 (0.0%) |
| Architecture & Engineering | 0 (0.0%) | 0 (0.0%) |
| Life, Physical & Social Science | 0 (0.0%) | 0 (0.0%) |
| Community & Social Service | 0 (0.0%) | 0 (0.0%) |
| Education, Arts & Media | 0 (0.0%) | 0 (0.0%) |
| Legal Services & Support | 0 (0.0%) | 0 (0.0%) |
| Education Instruction & Library | 0 (0.0%) | 0 (0.0%) |
| Arts, Media & Entertainment | 0 (0.0%) | 0 (0.0%) |
| Health Diagnosing & Treating | 0 (0.0%) | 0 (0.0%) |
| Health Technologists | 0 (0.0%) | 0 (0.0%) |
| Total (Category) | 0 (0.0%) | 0 (0.0%) |
| Total (Overall) | 16 (35.6%) | 29 (64.4%) |
Services Occupations
The most common Services occupations in Regan are Food Preparation & Serving (4 | 8.9%), and Healthcare Support (1 | 2.2%).
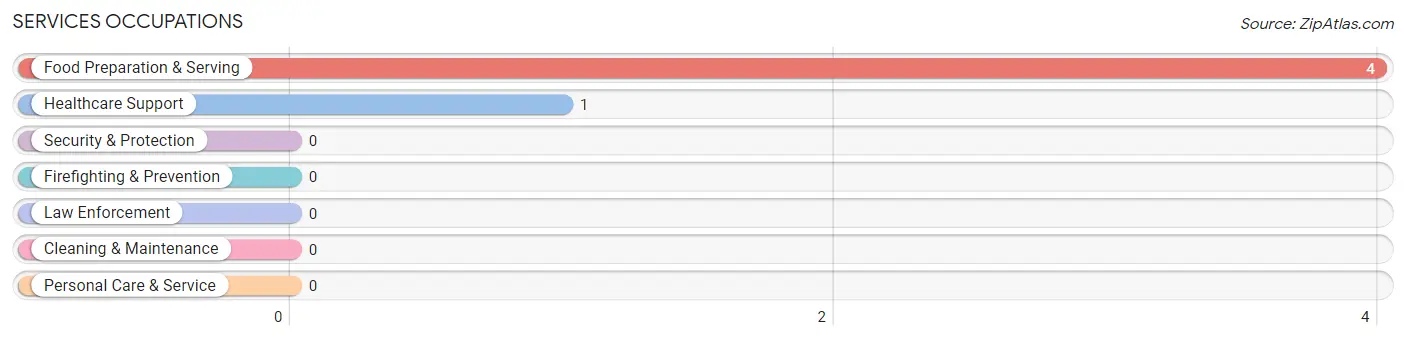
Services Occupations by Sex
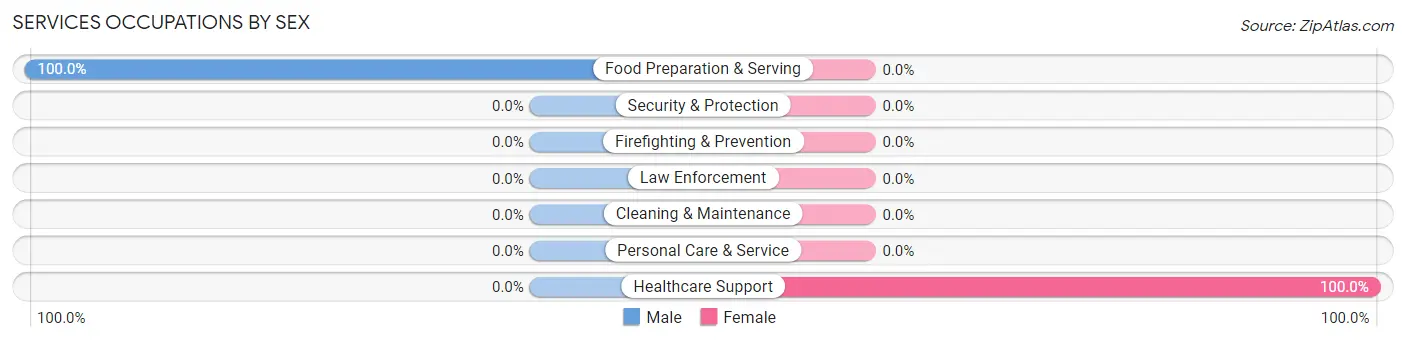
| Occupation | Male | Female |
| Healthcare Support | 0 (0.0%) | 1 (100.0%) |
| Security & Protection | 0 (0.0%) | 0 (0.0%) |
| Firefighting & Prevention | 0 (0.0%) | 0 (0.0%) |
| Law Enforcement | 0 (0.0%) | 0 (0.0%) |
| Food Preparation & Serving | 4 (100.0%) | 0 (0.0%) |
| Cleaning & Maintenance | 0 (0.0%) | 0 (0.0%) |
| Personal Care & Service | 0 (0.0%) | 0 (0.0%) |
| Total (Category) | 4 (80.0%) | 1 (20.0%) |
| Total (Overall) | 16 (35.6%) | 29 (64.4%) |
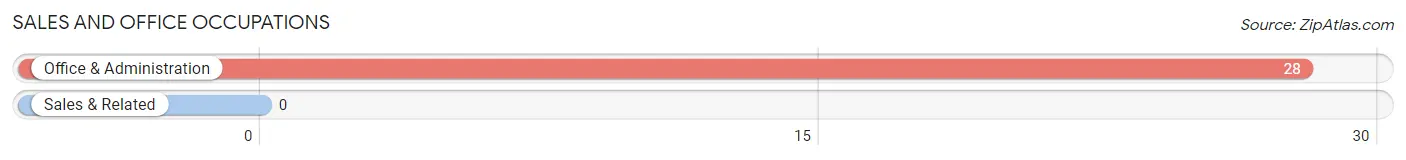
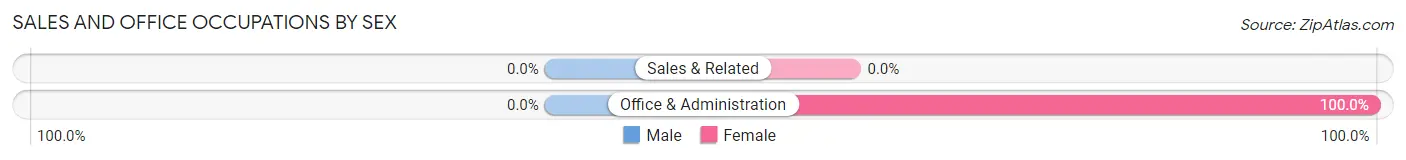
Sales and Office Occupations
The most common Sales and Office occupations in Regan are , and Office & Administration (28 | 62.2%).
Sales and Office Occupations by Sex
| Occupation | Male | Female |
| Sales & Related | 0 (0.0%) | 0 (0.0%) |
| Office & Administration | 0 (0.0%) | 28 (100.0%) |
| Total (Category) | 0 (0.0%) | 28 (100.0%) |
| Total (Overall) | 16 (35.6%) | 29 (64.4%) |
Natural Resources, Construction and Maintenance Occupations
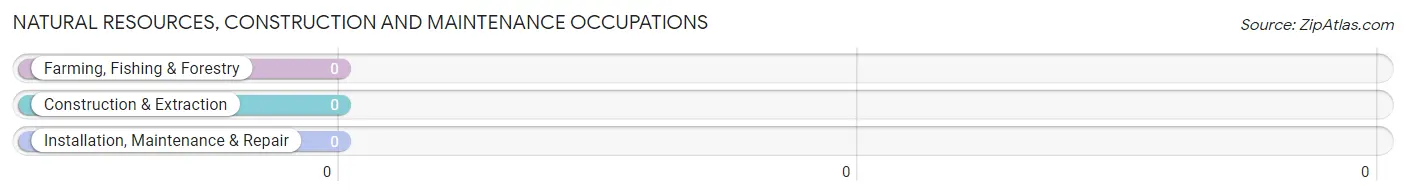
Natural Resources, Construction and Maintenance Occupations by Sex
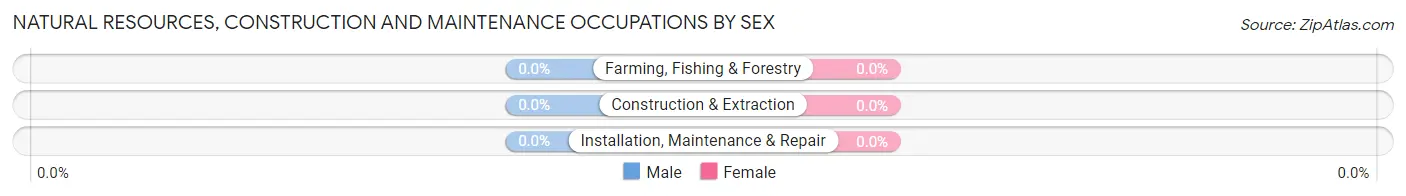
| Occupation | Male | Female |
| Farming, Fishing & Forestry | 0 (0.0%) | 0 (0.0%) |
| Construction & Extraction | 0 (0.0%) | 0 (0.0%) |
| Installation, Maintenance & Repair | 0 (0.0%) | 0 (0.0%) |
| Total (Category) | 0 (0.0%) | 0 (0.0%) |
| Total (Overall) | 16 (35.6%) | 29 (64.4%) |
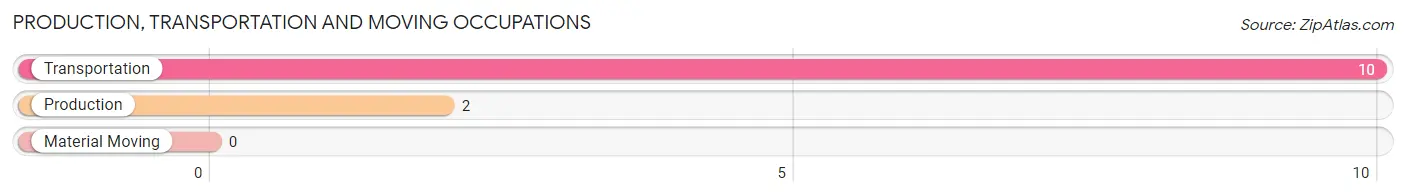
Production, Transportation and Moving Occupations
The most common Production, Transportation and Moving occupations in Regan are Transportation (10 | 22.2%), and Production (2 | 4.4%).
Production, Transportation and Moving Occupations by Sex
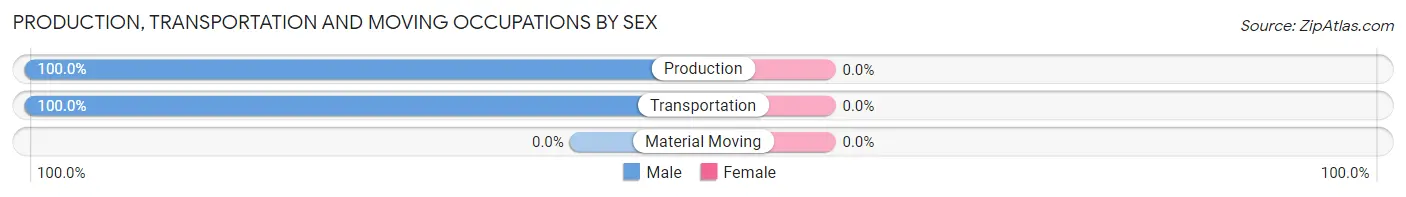
| Occupation | Male | Female |
| Production | 2 (100.0%) | 0 (0.0%) |
| Transportation | 10 (100.0%) | 0 (0.0%) |
| Material Moving | 0 (0.0%) | 0 (0.0%) |
| Total (Category) | 12 (100.0%) | 0 (0.0%) |
| Total (Overall) | 16 (35.6%) | 29 (64.4%) |
Employment Industries by Sex in Regan
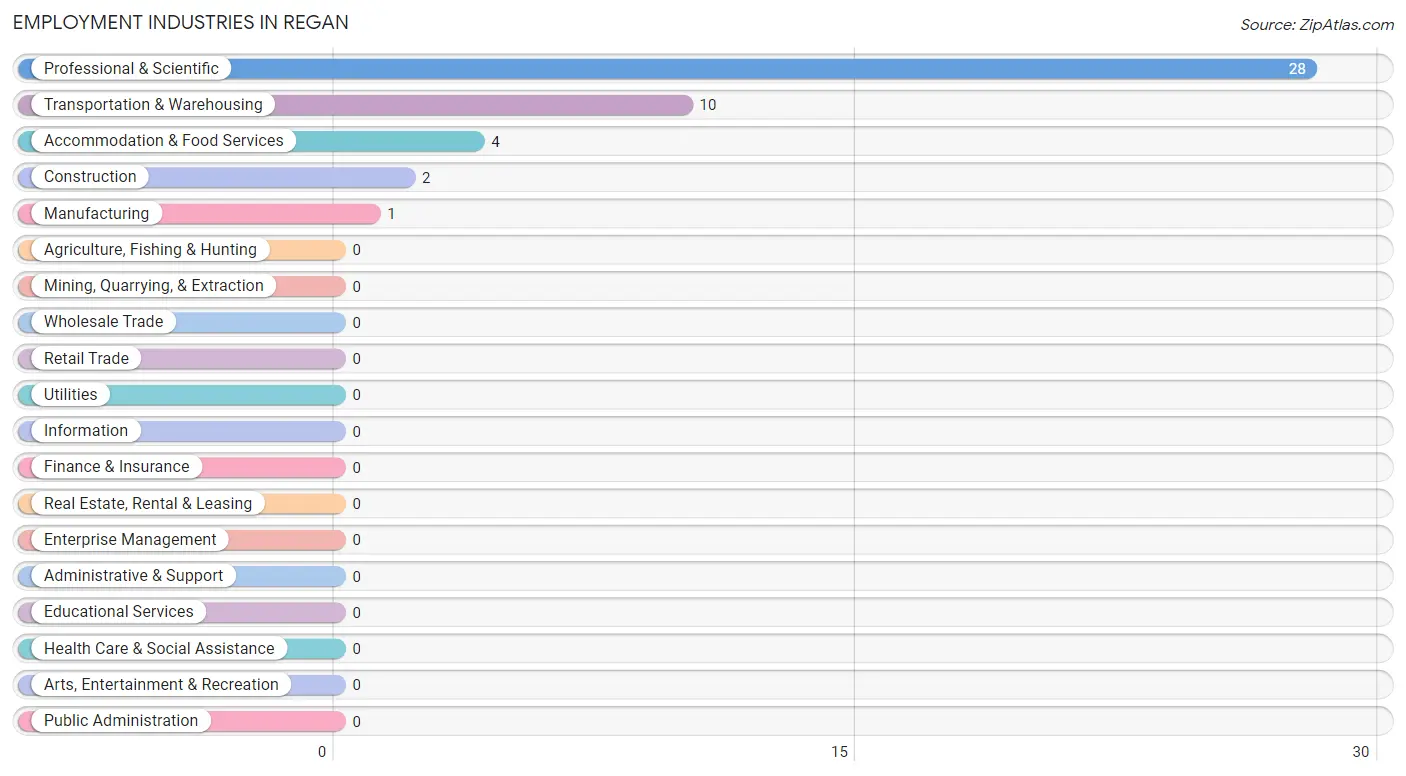
Employment Industries in Regan
The major employment industries in Regan include Professional & Scientific (28 | 62.2%), Transportation & Warehousing (10 | 22.2%), Accommodation & Food Services (4 | 8.9%), Construction (2 | 4.4%), and Manufacturing (1 | 2.2%).
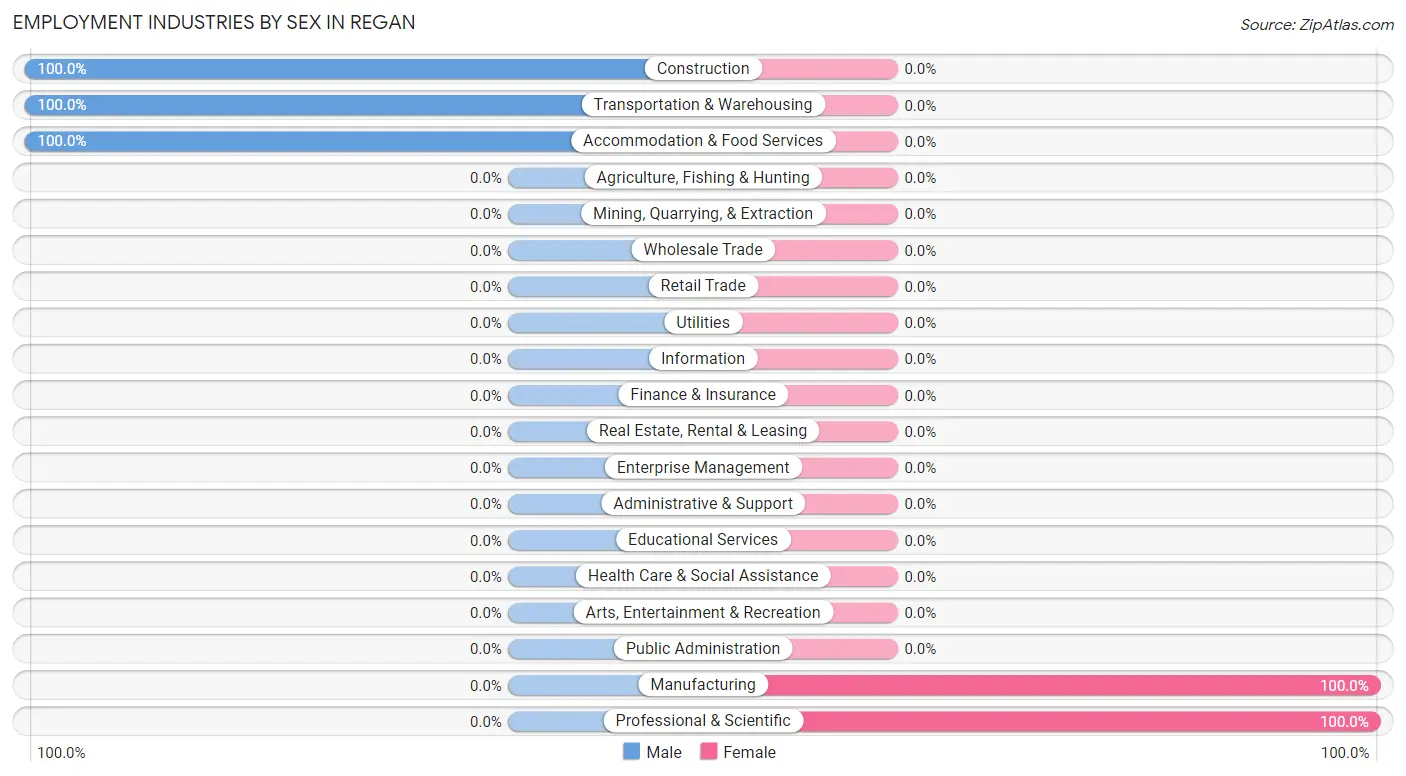
Employment Industries by Sex in Regan
The Regan industries that see more men than women are Construction (100.0%), Transportation & Warehousing (100.0%), and Accommodation & Food Services (100.0%), whereas the industries that tend to have a higher number of women are Manufacturing (100.0%), and Professional & Scientific (100.0%).
| Industry | Male | Female |
| Agriculture, Fishing & Hunting | 0 (0.0%) | 0 (0.0%) |
| Mining, Quarrying, & Extraction | 0 (0.0%) | 0 (0.0%) |
| Construction | 2 (100.0%) | 0 (0.0%) |
| Manufacturing | 0 (0.0%) | 1 (100.0%) |
| Wholesale Trade | 0 (0.0%) | 0 (0.0%) |
| Retail Trade | 0 (0.0%) | 0 (0.0%) |
| Transportation & Warehousing | 10 (100.0%) | 0 (0.0%) |
| Utilities | 0 (0.0%) | 0 (0.0%) |
| Information | 0 (0.0%) | 0 (0.0%) |
| Finance & Insurance | 0 (0.0%) | 0 (0.0%) |
| Real Estate, Rental & Leasing | 0 (0.0%) | 0 (0.0%) |
| Professional & Scientific | 0 (0.0%) | 28 (100.0%) |
| Enterprise Management | 0 (0.0%) | 0 (0.0%) |
| Administrative & Support | 0 (0.0%) | 0 (0.0%) |
| Educational Services | 0 (0.0%) | 0 (0.0%) |
| Health Care & Social Assistance | 0 (0.0%) | 0 (0.0%) |
| Arts, Entertainment & Recreation | 0 (0.0%) | 0 (0.0%) |
| Accommodation & Food Services | 4 (100.0%) | 0 (0.0%) |
| Public Administration | 0 (0.0%) | 0 (0.0%) |
| Total | 16 (35.6%) | 29 (64.4%) |
Education in Regan
School Enrollment in Regan
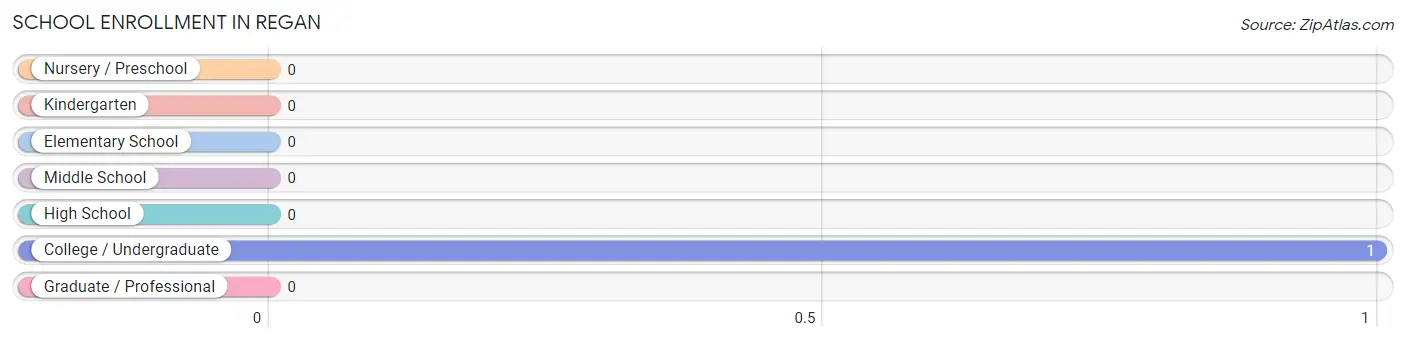
| School Level | # Students | % Students |
| Nursery / Preschool | 0 | 0.0% |
| Kindergarten | 0 | 0.0% |
| Elementary School | 0 | 0.0% |
| Middle School | 0 | 0.0% |
| High School | 0 | 0.0% |
| College / Undergraduate | 1 | 100.0% |
| Graduate / Professional | 0 | 0.0% |
| Total | 1 | 100.0% |
School Enrollment by Age by Funding Source in Regan
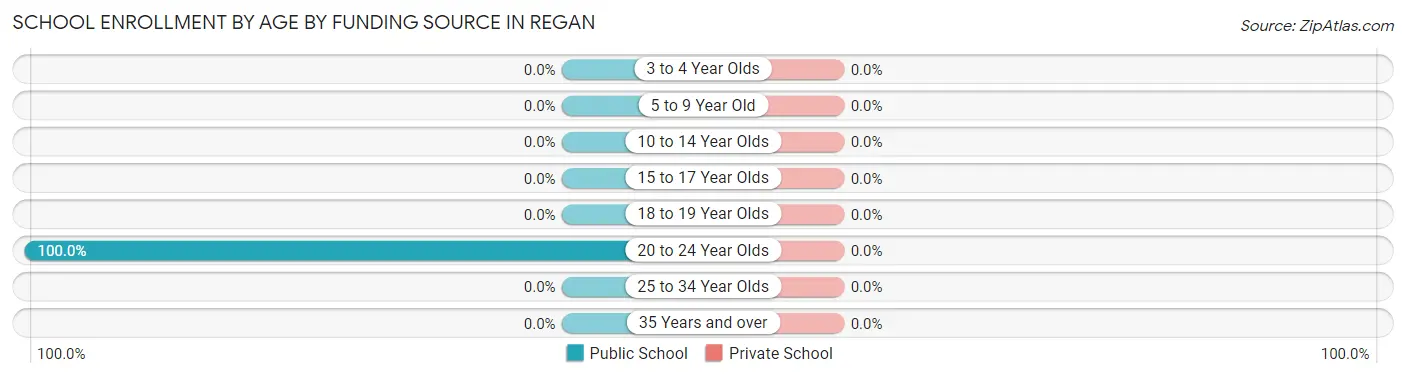
| Age Bracket | Public School | Private School |
| 3 to 4 Year Olds | 0 (0.0%) | 0 (0.0%) |
| 5 to 9 Year Old | 0 (0.0%) | 0 (0.0%) |
| 10 to 14 Year Olds | 0 (0.0%) | 0 (0.0%) |
| 15 to 17 Year Olds | 0 (0.0%) | 0 (0.0%) |
| 18 to 19 Year Olds | 0 (0.0%) | 0 (0.0%) |
| 20 to 24 Year Olds | 1 (100.0%) | 0 (0.0%) |
| 25 to 34 Year Olds | 0 (0.0%) | 0 (0.0%) |
| 35 Years and over | 0 (0.0%) | 0 (0.0%) |
| Total | 1 (100.0%) | 0 (0.0%) |
Educational Attainment by Field of Study in Regan
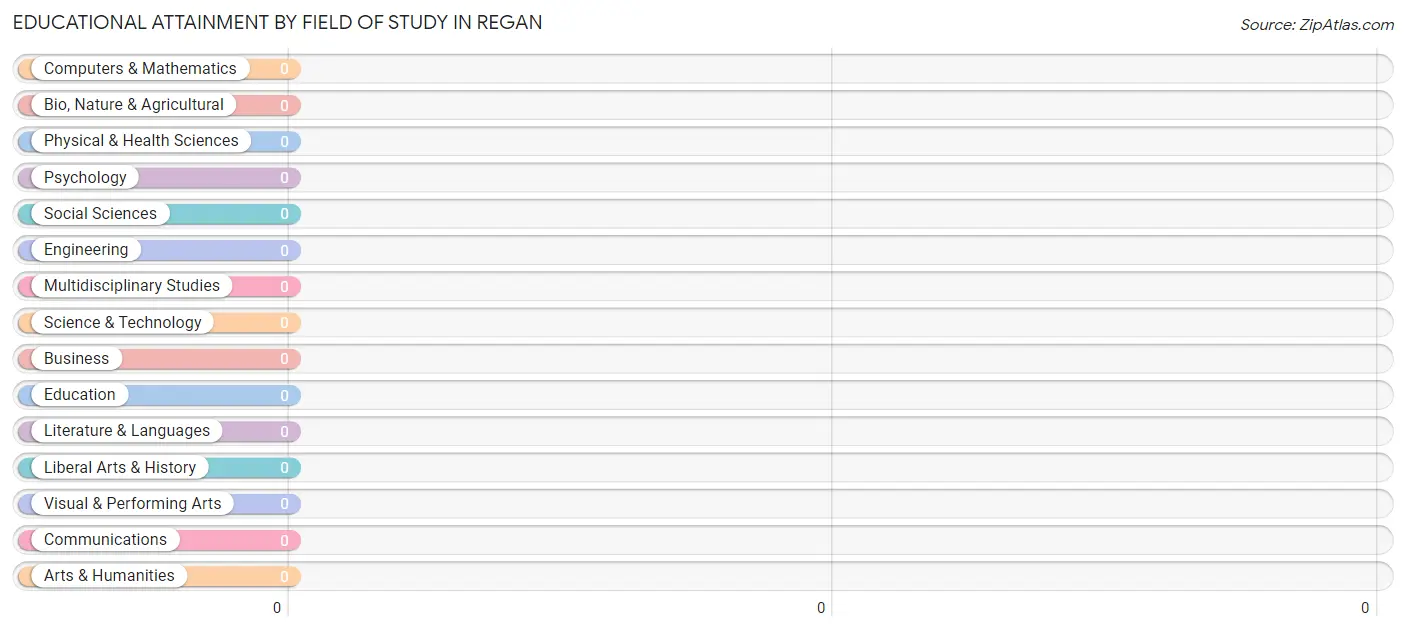
| Field of Study | # Graduates | % Graduates |
| Computers & Mathematics | 0 | 0.0% |
| Bio, Nature & Agricultural | 0 | 0.0% |
| Physical & Health Sciences | 0 | 0.0% |
| Psychology | 0 | 0.0% |
| Social Sciences | 0 | 0.0% |
| Engineering | 0 | 0.0% |
| Multidisciplinary Studies | 0 | 0.0% |
| Science & Technology | 0 | 0.0% |
| Business | 0 | 0.0% |
| Education | 0 | 0.0% |
| Literature & Languages | 0 | 0.0% |
| Liberal Arts & History | 0 | 0.0% |
| Visual & Performing Arts | 0 | 0.0% |
| Communications | 0 | 0.0% |
| Arts & Humanities | 0 | 0.0% |
| Total | 0 | 0.0% |
Transportation & Commute in Regan
Vehicle Availability by Sex in Regan
The most prevalent vehicle ownership categories in Regan are males with 4 vehicles (10, accounting for 62.5%) and females with 4 vehicles (28, making up 34.5%).
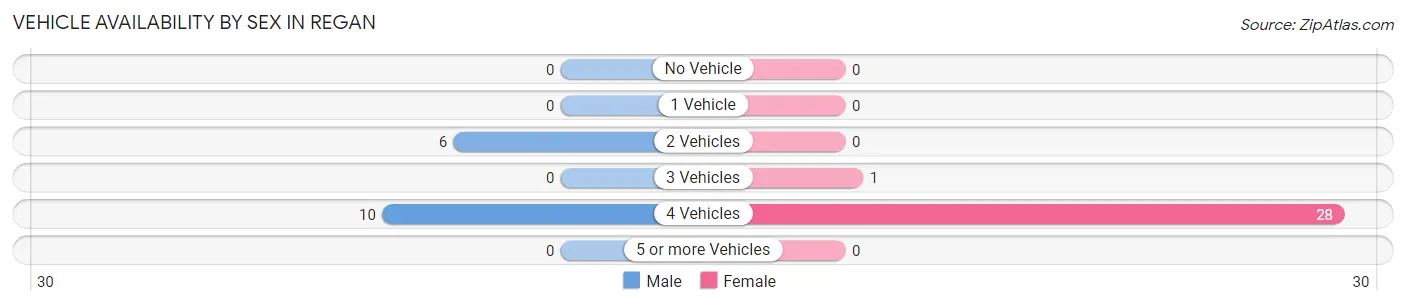
| Vehicles Available | Male | Female |
| No Vehicle | 0 (0.0%) | 0 (0.0%) |
| 1 Vehicle | 0 (0.0%) | 0 (0.0%) |
| 2 Vehicles | 6 (37.5%) | 0 (0.0%) |
| 3 Vehicles | 0 (0.0%) | 1 (3.5%) |
| 4 Vehicles | 10 (62.5%) | 28 (96.6%) |
| 5 or more Vehicles | 0 (0.0%) | 0 (0.0%) |
| Total | 16 (100.0%) | 29 (100.0%) |
Commute Time in Regan
The most frequently occuring commute durations in Regan are 35 to 39 minutes (28 commuters, 62.2%), 40 to 44 minutes (12 commuters, 26.7%), and 45 to 59 minutes (5 commuters, 11.1%).
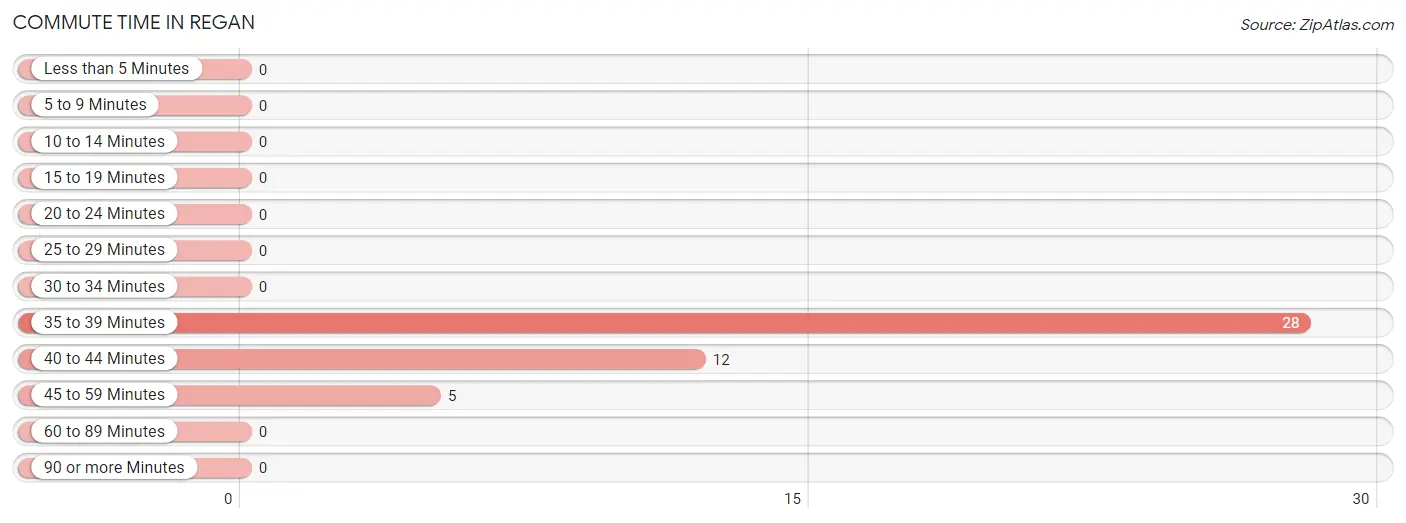
| Commute Time | # Commuters | % Commuters |
| Less than 5 Minutes | 0 | 0.0% |
| 5 to 9 Minutes | 0 | 0.0% |
| 10 to 14 Minutes | 0 | 0.0% |
| 15 to 19 Minutes | 0 | 0.0% |
| 20 to 24 Minutes | 0 | 0.0% |
| 25 to 29 Minutes | 0 | 0.0% |
| 30 to 34 Minutes | 0 | 0.0% |
| 35 to 39 Minutes | 28 | 62.2% |
| 40 to 44 Minutes | 12 | 26.7% |
| 45 to 59 Minutes | 5 | 11.1% |
| 60 to 89 Minutes | 0 | 0.0% |
| 90 or more Minutes | 0 | 0.0% |
Commute Time by Sex in Regan
The most common commute times in Regan are 40 to 44 minutes (12 commuters, 75.0%) for males and 35 to 39 minutes (28 commuters, 96.6%) for females.
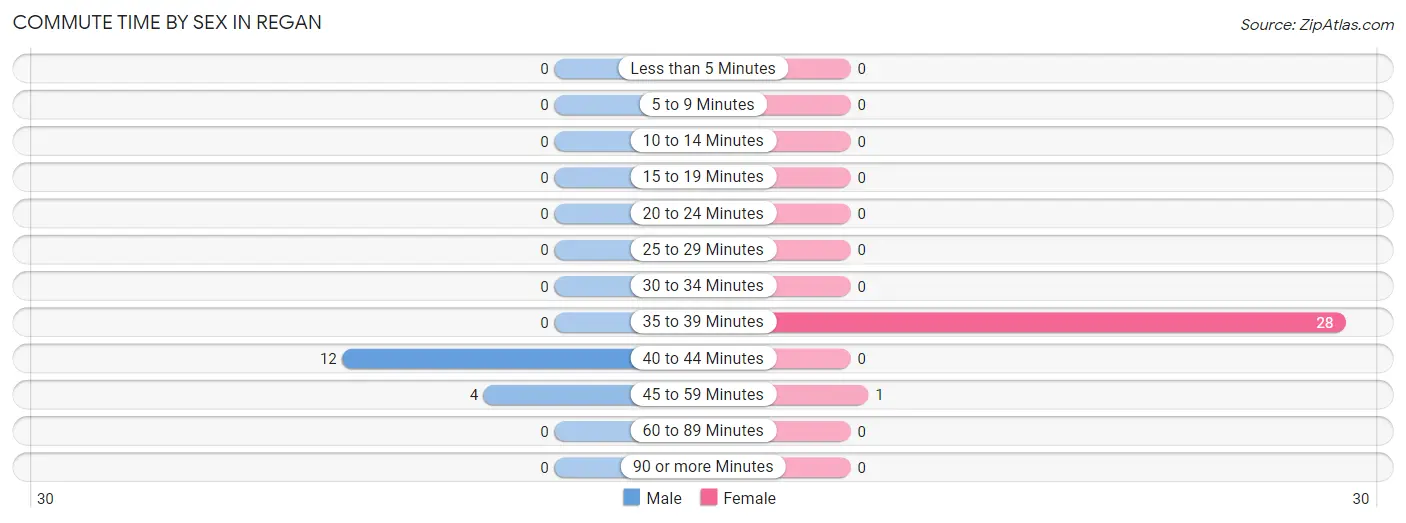
| Commute Time | Male | Female |
| Less than 5 Minutes | 0 (0.0%) | 0 (0.0%) |
| 5 to 9 Minutes | 0 (0.0%) | 0 (0.0%) |
| 10 to 14 Minutes | 0 (0.0%) | 0 (0.0%) |
| 15 to 19 Minutes | 0 (0.0%) | 0 (0.0%) |
| 20 to 24 Minutes | 0 (0.0%) | 0 (0.0%) |
| 25 to 29 Minutes | 0 (0.0%) | 0 (0.0%) |
| 30 to 34 Minutes | 0 (0.0%) | 0 (0.0%) |
| 35 to 39 Minutes | 0 (0.0%) | 28 (96.6%) |
| 40 to 44 Minutes | 12 (75.0%) | 0 (0.0%) |
| 45 to 59 Minutes | 4 (25.0%) | 1 (3.5%) |
| 60 to 89 Minutes | 0 (0.0%) | 0 (0.0%) |
| 90 or more Minutes | 0 (0.0%) | 0 (0.0%) |
Time of Departure to Work by Sex in Regan
The most frequent times of departure to work in Regan are 7:00 AM to 7:29 AM (10, 62.5%) for males and 8:30 AM to 8:59 AM (28, 96.6%) for females.
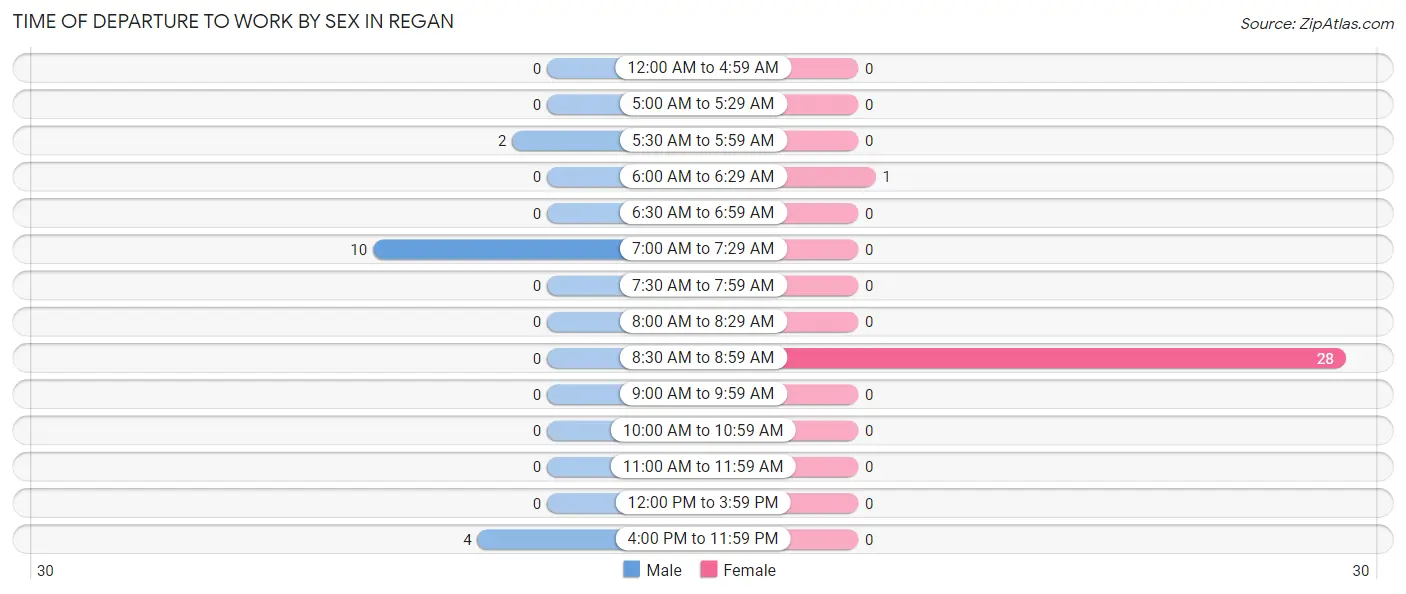
| Time of Departure | Male | Female |
| 12:00 AM to 4:59 AM | 0 (0.0%) | 0 (0.0%) |
| 5:00 AM to 5:29 AM | 0 (0.0%) | 0 (0.0%) |
| 5:30 AM to 5:59 AM | 2 (12.5%) | 0 (0.0%) |
| 6:00 AM to 6:29 AM | 0 (0.0%) | 1 (3.5%) |
| 6:30 AM to 6:59 AM | 0 (0.0%) | 0 (0.0%) |
| 7:00 AM to 7:29 AM | 10 (62.5%) | 0 (0.0%) |
| 7:30 AM to 7:59 AM | 0 (0.0%) | 0 (0.0%) |
| 8:00 AM to 8:29 AM | 0 (0.0%) | 0 (0.0%) |
| 8:30 AM to 8:59 AM | 0 (0.0%) | 28 (96.6%) |
| 9:00 AM to 9:59 AM | 0 (0.0%) | 0 (0.0%) |
| 10:00 AM to 10:59 AM | 0 (0.0%) | 0 (0.0%) |
| 11:00 AM to 11:59 AM | 0 (0.0%) | 0 (0.0%) |
| 12:00 PM to 3:59 PM | 0 (0.0%) | 0 (0.0%) |
| 4:00 PM to 11:59 PM | 4 (25.0%) | 0 (0.0%) |
| Total | 16 (100.0%) | 29 (100.0%) |
Housing Occupancy in Regan
Occupancy by Ownership in Regan
Of the total 22 dwellings in Regan, owner-occupied units account for 16 (72.7%), while renter-occupied units make up 6 (27.3%).
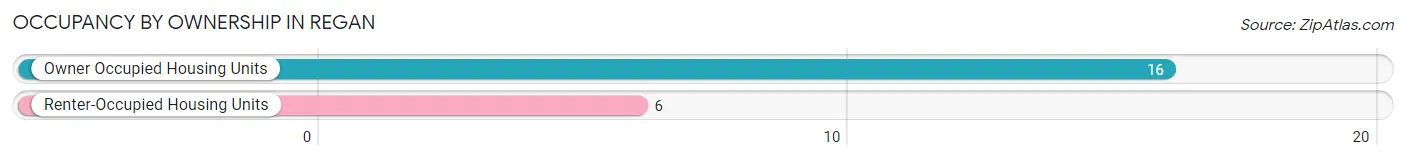
| Occupancy | # Housing Units | % Housing Units |
| Owner Occupied Housing Units | 16 | 72.7% |
| Renter-Occupied Housing Units | 6 | 27.3% |
| Total Occupied Housing Units | 22 | 100.0% |
Occupancy by Household Size in Regan

| Household Size | # Housing Units | % Housing Units |
| 1-Person Household | 10 | 45.5% |
| 2-Person Household | 2 | 9.1% |
| 3-Person Household | 10 | 45.5% |
| 4+ Person Household | 0 | 0.0% |
| Total Housing Units | 22 | 100.0% |
Occupancy by Ownership by Household Size in Regan
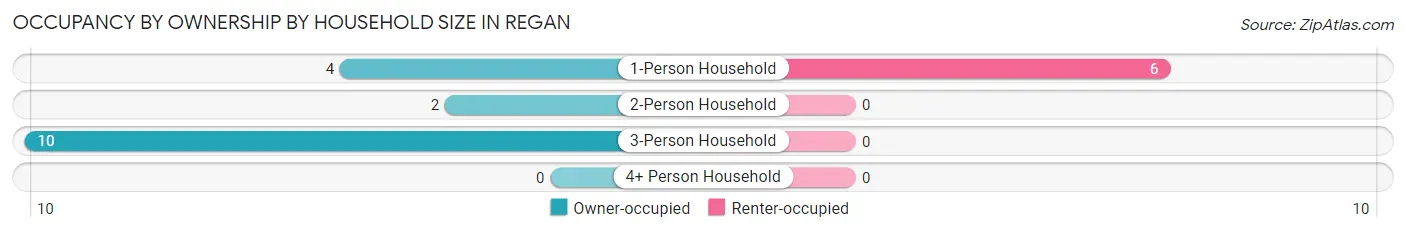
| Household Size | Owner-occupied | Renter-occupied |
| 1-Person Household | 4 (40.0%) | 6 (60.0%) |
| 2-Person Household | 2 (100.0%) | 0 (0.0%) |
| 3-Person Household | 10 (100.0%) | 0 (0.0%) |
| 4+ Person Household | 0 (0.0%) | 0 (0.0%) |
| Total Housing Units | 16 (72.7%) | 6 (27.3%) |
Occupancy by Educational Attainment in Regan
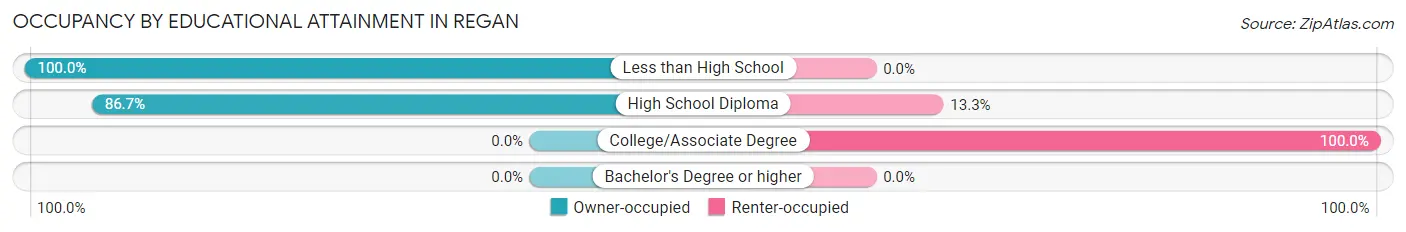
| Household Size | Owner-occupied | Renter-occupied |
| Less than High School | 3 (100.0%) | 0 (0.0%) |
| High School Diploma | 13 (86.7%) | 2 (13.3%) |
| College/Associate Degree | 0 (0.0%) | 4 (100.0%) |
| Bachelor's Degree or higher | 0 (0.0%) | 0 (0.0%) |
Occupancy by Age of Householder in Regan
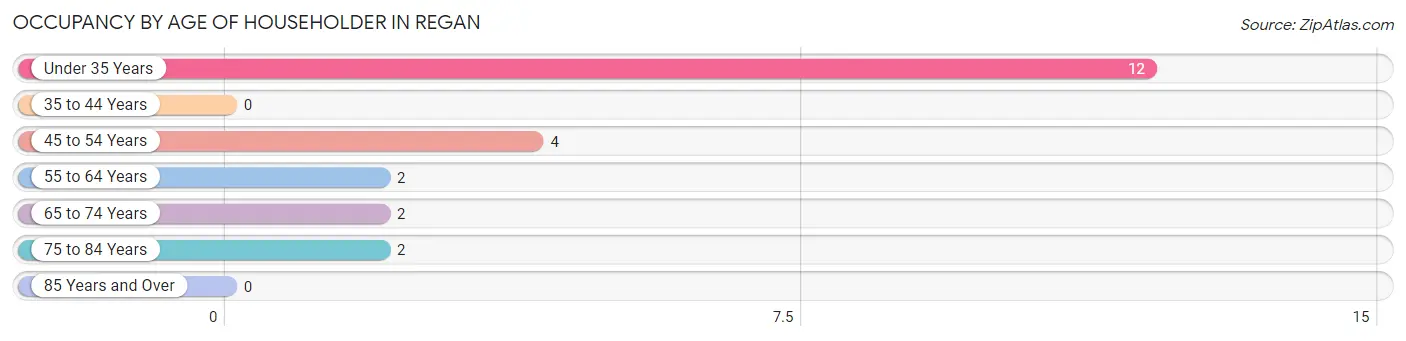
| Age Bracket | # Households | % Households |
| Under 35 Years | 12 | 54.5% |
| 35 to 44 Years | 0 | 0.0% |
| 45 to 54 Years | 4 | 18.2% |
| 55 to 64 Years | 2 | 9.1% |
| 65 to 74 Years | 2 | 9.1% |
| 75 to 84 Years | 2 | 9.1% |
| 85 Years and Over | 0 | 0.0% |
| Total | 22 | 100.0% |
Housing Finances in Regan
Median Income by Occupancy in Regan
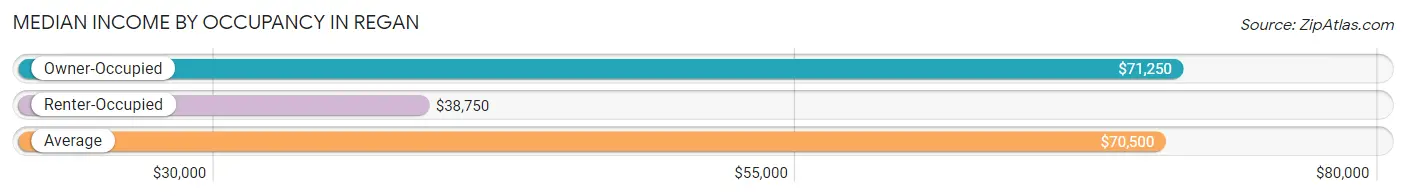
| Occupancy Type | # Households | Median Income |
| Owner-Occupied | 16 (72.7%) | $71,250 |
| Renter-Occupied | 6 (27.3%) | $38,750 |
| Average | 22 (100.0%) | $70,500 |
Occupancy by Householder Income Bracket in Regan
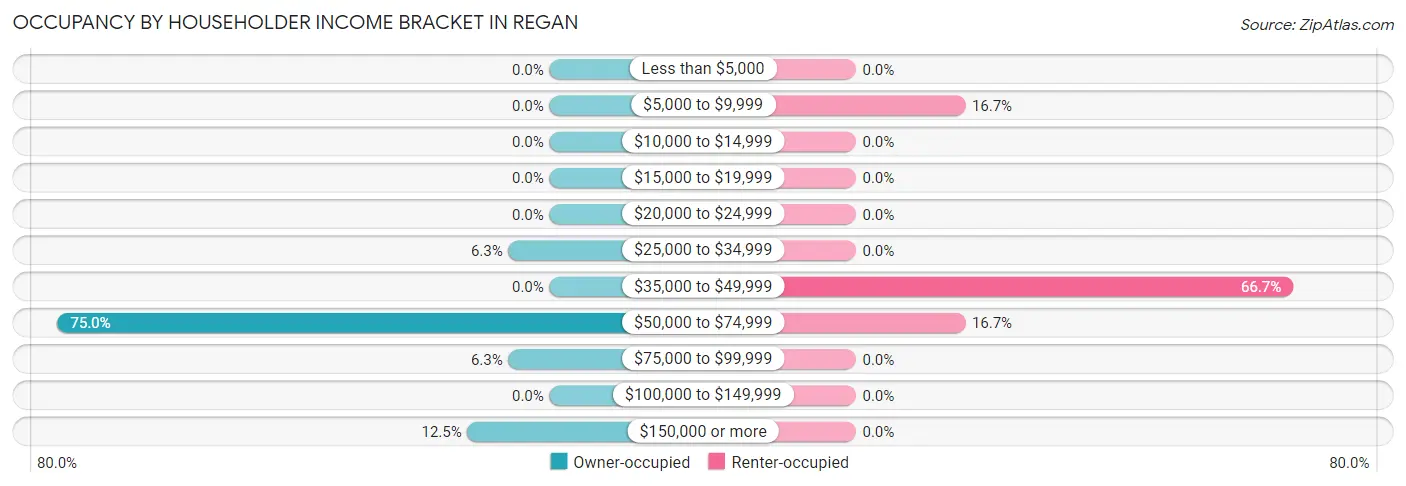
| Income Bracket | Owner-occupied | Renter-occupied |
| Less than $5,000 | 0 (0.0%) | 0 (0.0%) |
| $5,000 to $9,999 | 0 (0.0%) | 1 (16.7%) |
| $10,000 to $14,999 | 0 (0.0%) | 0 (0.0%) |
| $15,000 to $19,999 | 0 (0.0%) | 0 (0.0%) |
| $20,000 to $24,999 | 0 (0.0%) | 0 (0.0%) |
| $25,000 to $34,999 | 1 (6.2%) | 0 (0.0%) |
| $35,000 to $49,999 | 0 (0.0%) | 4 (66.7%) |
| $50,000 to $74,999 | 12 (75.0%) | 1 (16.7%) |
| $75,000 to $99,999 | 1 (6.2%) | 0 (0.0%) |
| $100,000 to $149,999 | 0 (0.0%) | 0 (0.0%) |
| $150,000 or more | 2 (12.5%) | 0 (0.0%) |
| Total | 16 (100.0%) | 6 (100.0%) |
Monthly Housing Cost Tiers in Regan
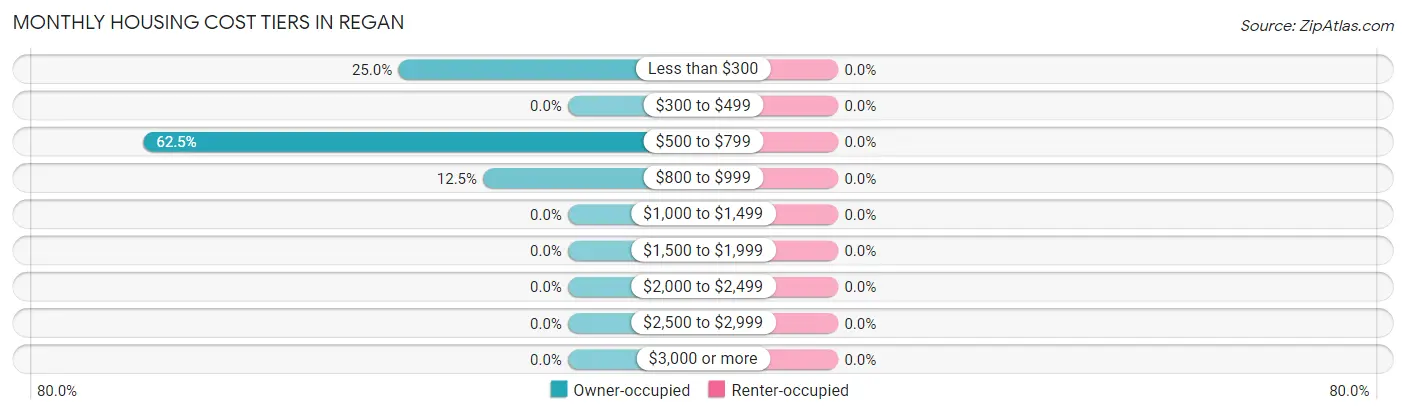
| Monthly Cost | Owner-occupied | Renter-occupied |
| Less than $300 | 4 (25.0%) | 0 (0.0%) |
| $300 to $499 | 0 (0.0%) | 0 (0.0%) |
| $500 to $799 | 10 (62.5%) | 0 (0.0%) |
| $800 to $999 | 2 (12.5%) | 0 (0.0%) |
| $1,000 to $1,499 | 0 (0.0%) | 0 (0.0%) |
| $1,500 to $1,999 | 0 (0.0%) | 0 (0.0%) |
| $2,000 to $2,499 | 0 (0.0%) | 0 (0.0%) |
| $2,500 to $2,999 | 0 (0.0%) | 0 (0.0%) |
| $3,000 or more | 0 (0.0%) | 0 (0.0%) |
| Total | 16 (100.0%) | 6 (100.0%) |
Physical Housing Characteristics in Regan
Housing Structures in Regan
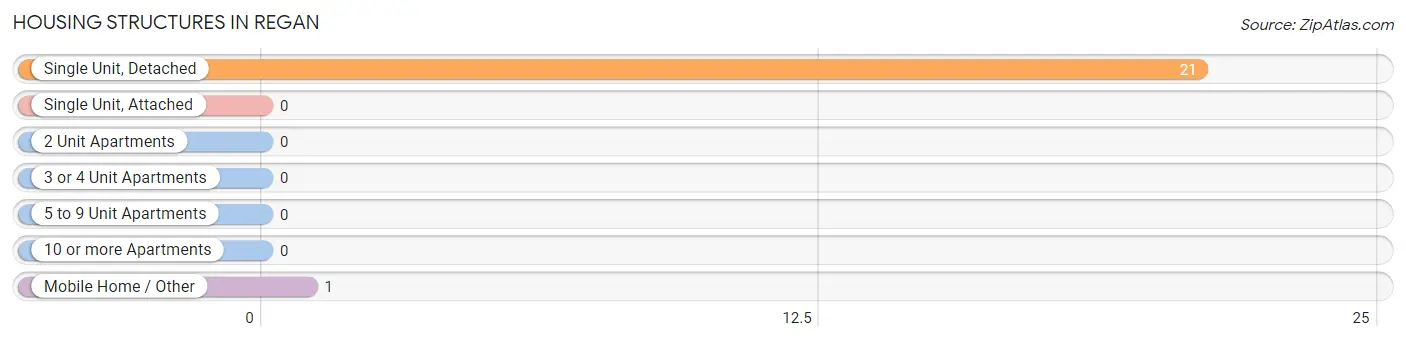
| Structure Type | # Housing Units | % Housing Units |
| Single Unit, Detached | 21 | 95.5% |
| Single Unit, Attached | 0 | 0.0% |
| 2 Unit Apartments | 0 | 0.0% |
| 3 or 4 Unit Apartments | 0 | 0.0% |
| 5 to 9 Unit Apartments | 0 | 0.0% |
| 10 or more Apartments | 0 | 0.0% |
| Mobile Home / Other | 1 | 4.5% |
| Total | 22 | 100.0% |
Housing Structures by Occupancy in Regan
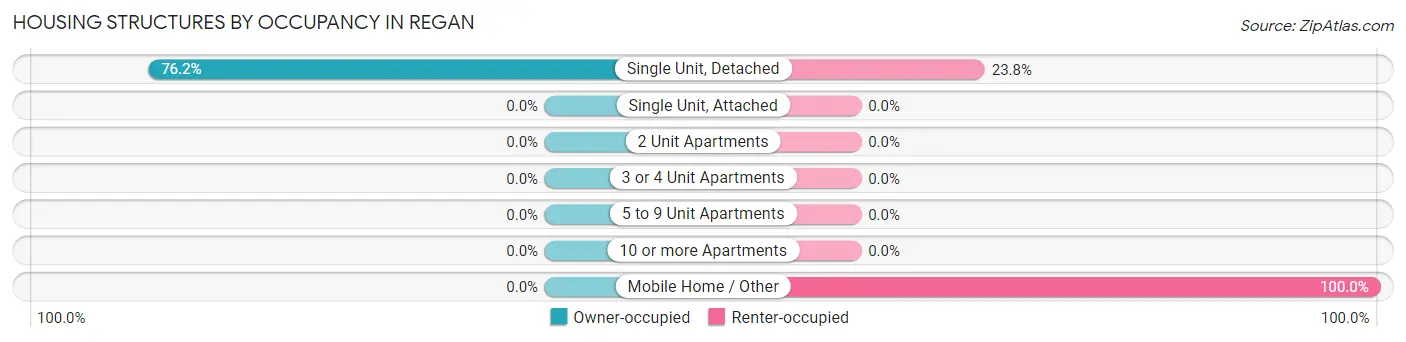
| Structure Type | Owner-occupied | Renter-occupied |
| Single Unit, Detached | 16 (76.2%) | 5 (23.8%) |
| Single Unit, Attached | 0 (0.0%) | 0 (0.0%) |
| 2 Unit Apartments | 0 (0.0%) | 0 (0.0%) |
| 3 or 4 Unit Apartments | 0 (0.0%) | 0 (0.0%) |
| 5 to 9 Unit Apartments | 0 (0.0%) | 0 (0.0%) |
| 10 or more Apartments | 0 (0.0%) | 0 (0.0%) |
| Mobile Home / Other | 0 (0.0%) | 1 (100.0%) |
| Total | 16 (72.7%) | 6 (27.3%) |
Housing Structures by Number of Rooms in Regan
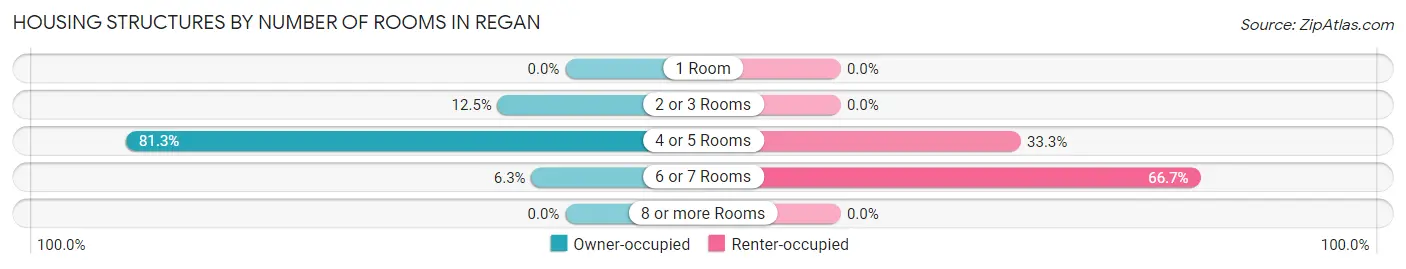
| Number of Rooms | Owner-occupied | Renter-occupied |
| 1 Room | 0 (0.0%) | 0 (0.0%) |
| 2 or 3 Rooms | 2 (12.5%) | 0 (0.0%) |
| 4 or 5 Rooms | 13 (81.2%) | 2 (33.3%) |
| 6 or 7 Rooms | 1 (6.2%) | 4 (66.7%) |
| 8 or more Rooms | 0 (0.0%) | 0 (0.0%) |
| Total | 16 (100.0%) | 6 (100.0%) |
Housing Structure by Heating Type in Regan
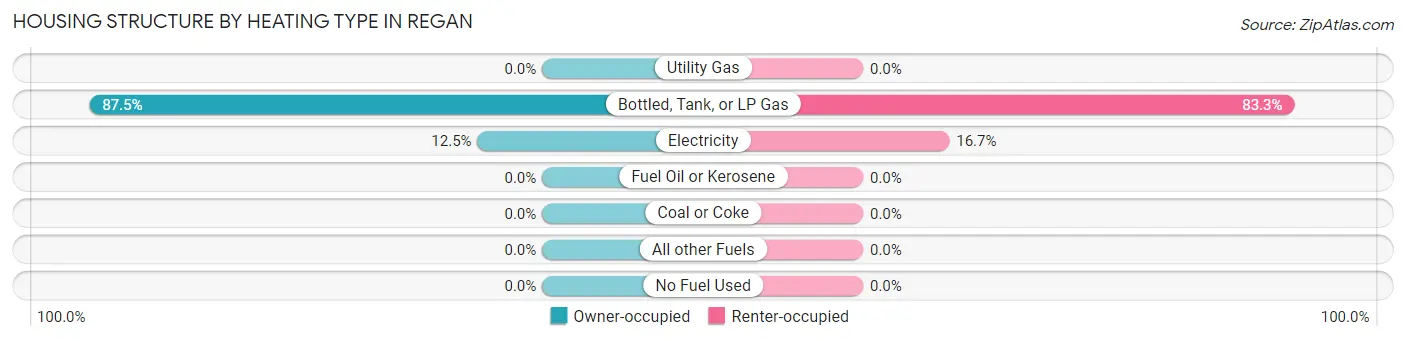
| Heating Type | Owner-occupied | Renter-occupied |
| Utility Gas | 0 (0.0%) | 0 (0.0%) |
| Bottled, Tank, or LP Gas | 14 (87.5%) | 5 (83.3%) |
| Electricity | 2 (12.5%) | 1 (16.7%) |
| Fuel Oil or Kerosene | 0 (0.0%) | 0 (0.0%) |
| Coal or Coke | 0 (0.0%) | 0 (0.0%) |
| All other Fuels | 0 (0.0%) | 0 (0.0%) |
| No Fuel Used | 0 (0.0%) | 0 (0.0%) |
| Total | 16 (100.0%) | 6 (100.0%) |
Household Vehicle Usage in Regan
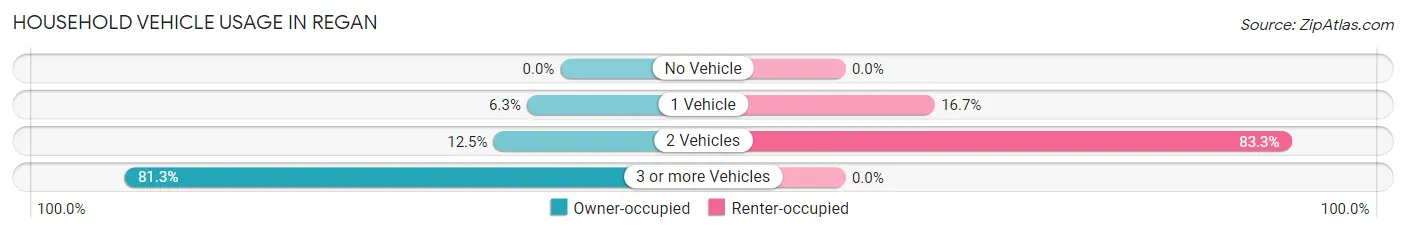
| Vehicles per Household | Owner-occupied | Renter-occupied |
| No Vehicle | 0 (0.0%) | 0 (0.0%) |
| 1 Vehicle | 1 (6.2%) | 1 (16.7%) |
| 2 Vehicles | 2 (12.5%) | 5 (83.3%) |
| 3 or more Vehicles | 13 (81.2%) | 0 (0.0%) |
| Total | 16 (100.0%) | 6 (100.0%) |
Real Estate & Mortgages in Regan
Real Estate and Mortgage Overview in Regan
| Characteristic | Without Mortgage | With Mortgage |
| Housing Units | 5 | 11 |
| Median Property Value | - | - |
| Median Household Income | - | - |
| Monthly Housing Costs | - | - |
| Real Estate Taxes | $199 | $0 |
Property Value by Mortgage Status in Regan
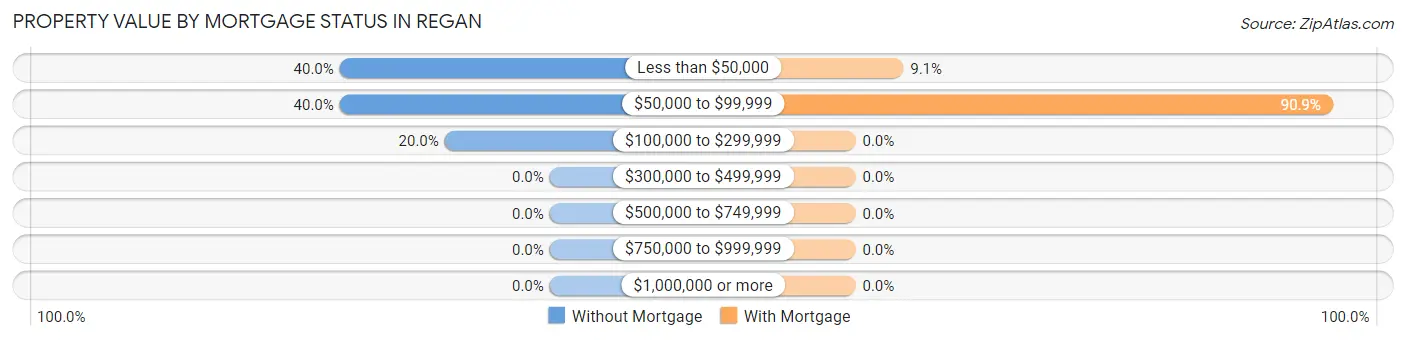
| Property Value | Without Mortgage | With Mortgage |
| Less than $50,000 | 2 (40.0%) | 1 (9.1%) |
| $50,000 to $99,999 | 2 (40.0%) | 10 (90.9%) |
| $100,000 to $299,999 | 1 (20.0%) | 0 (0.0%) |
| $300,000 to $499,999 | 0 (0.0%) | 0 (0.0%) |
| $500,000 to $749,999 | 0 (0.0%) | 0 (0.0%) |
| $750,000 to $999,999 | 0 (0.0%) | 0 (0.0%) |
| $1,000,000 or more | 0 (0.0%) | 0 (0.0%) |
| Total | 5 (100.0%) | 11 (100.0%) |
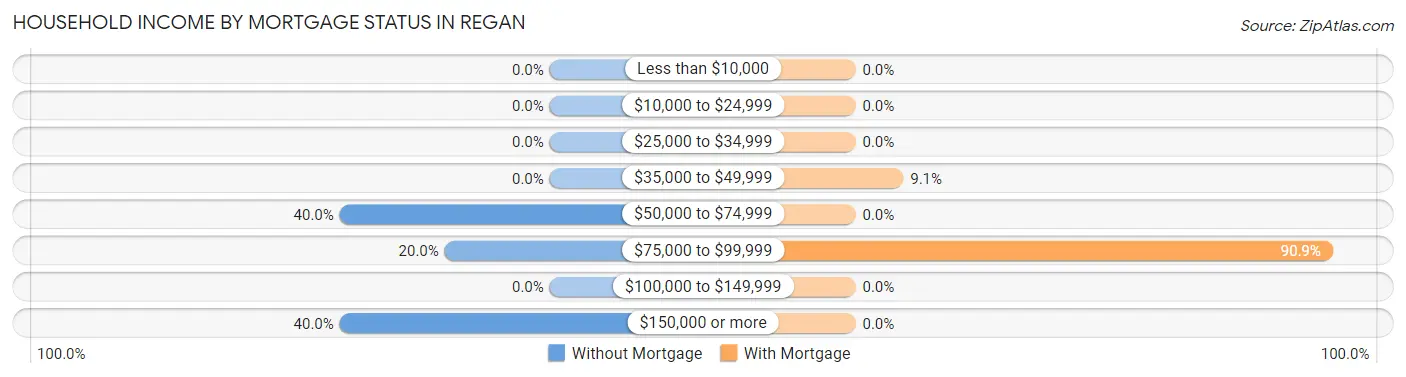
Household Income by Mortgage Status in Regan
| Household Income | Without Mortgage | With Mortgage |
| Less than $10,000 | 0 (0.0%) | 0 (0.0%) |
| $10,000 to $24,999 | 0 (0.0%) | 0 (0.0%) |
| $25,000 to $34,999 | 0 (0.0%) | 0 (0.0%) |
| $35,000 to $49,999 | 0 (0.0%) | 1 (9.1%) |
| $50,000 to $74,999 | 2 (40.0%) | 0 (0.0%) |
| $75,000 to $99,999 | 1 (20.0%) | 10 (90.9%) |
| $100,000 to $149,999 | 0 (0.0%) | 0 (0.0%) |
| $150,000 or more | 2 (40.0%) | 0 (0.0%) |
| Total | 5 (100.0%) | 11 (100.0%) |
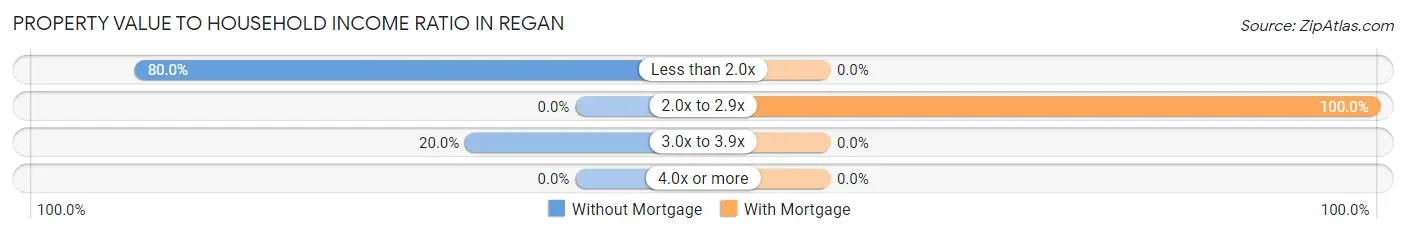
Property Value to Household Income Ratio in Regan
| Value-to-Income Ratio | Without Mortgage | With Mortgage |
| Less than 2.0x | 4 (80.0%) | 0 (0.0%) |
| 2.0x to 2.9x | 0 (0.0%) | 11 (100.0%) |
| 3.0x to 3.9x | 1 (20.0%) | 0 (0.0%) |
| 4.0x or more | 0 (0.0%) | 0 (0.0%) |
| Total | 5 (100.0%) | 11 (100.0%) |
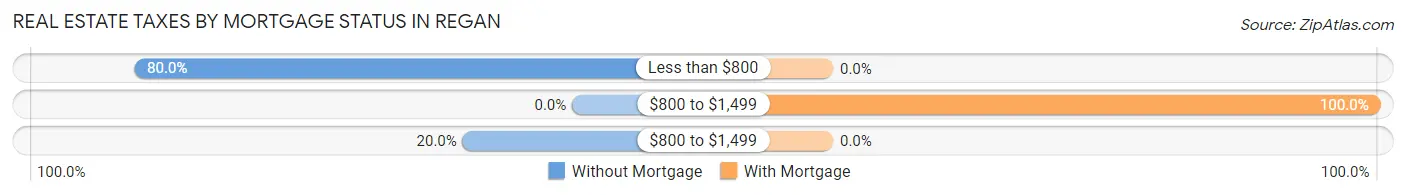
Real Estate Taxes by Mortgage Status in Regan
| Property Taxes | Without Mortgage | With Mortgage |
| Less than $800 | 4 (80.0%) | 0 (0.0%) |
| $800 to $1,499 | 0 (0.0%) | 11 (100.0%) |
| $800 to $1,499 | 1 (20.0%) | 0 (0.0%) |
| Total | 5 (100.0%) | 11 (100.0%) |
Health & Disability in Regan
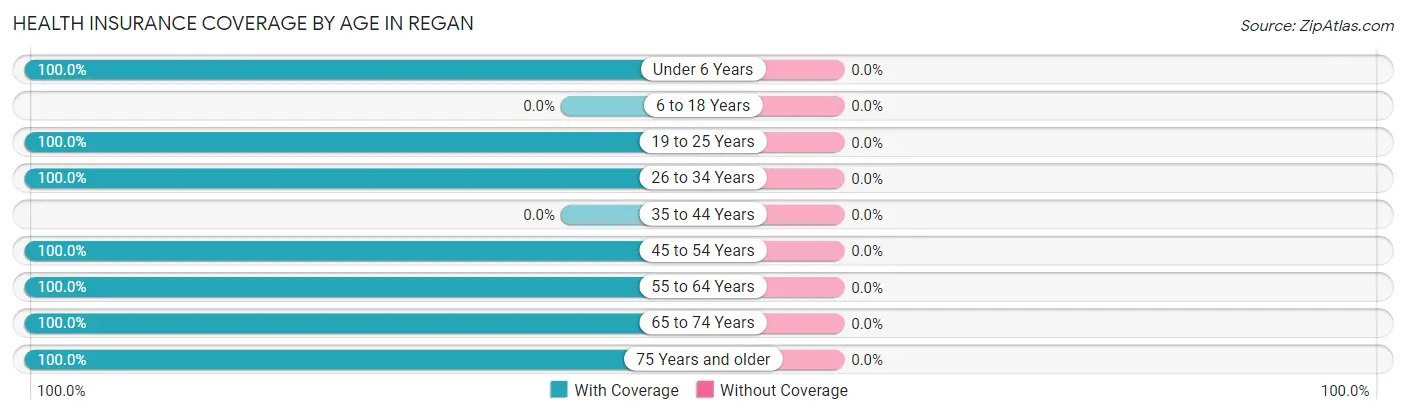
Health Insurance Coverage by Age in Regan
| Age Bracket | With Coverage | Without Coverage |
| Under 6 Years | 35 (100.0%) | 0 (0.0%) |
| 6 to 18 Years | 0 (0.0%) | 0 (0.0%) |
| 19 to 25 Years | 40 (100.0%) | 0 (0.0%) |
| 26 to 34 Years | 1 (100.0%) | 0 (0.0%) |
| 35 to 44 Years | 0 (0.0%) | 0 (0.0%) |
| 45 to 54 Years | 4 (100.0%) | 0 (0.0%) |
| 55 to 64 Years | 2 (100.0%) | 0 (0.0%) |
| 65 to 74 Years | 2 (100.0%) | 0 (0.0%) |
| 75 Years and older | 4 (100.0%) | 0 (0.0%) |
| Total | 88 (100.0%) | 0 (0.0%) |
Health Insurance Coverage by Citizenship Status in Regan
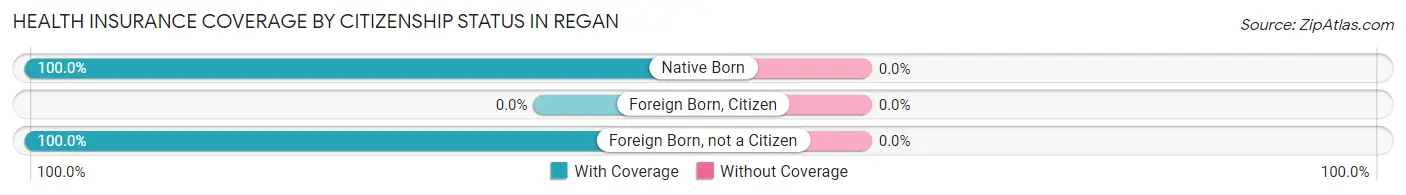
| Citizenship Status | With Coverage | Without Coverage |
| Native Born | 35 (100.0%) | 0 (0.0%) |
| Foreign Born, Citizen | 0 (0.0%) | 0 (0.0%) |
| Foreign Born, not a Citizen | 40 (100.0%) | 0 (0.0%) |
Health Insurance Coverage by Household Income in Regan
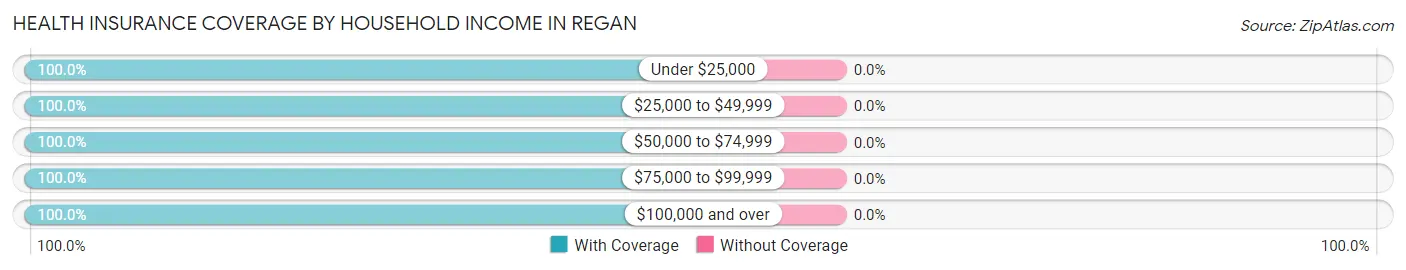
| Household Income | With Coverage | Without Coverage |
| Under $25,000 | 1 (100.0%) | 0 (0.0%) |
| $25,000 to $49,999 | 7 (100.0%) | 0 (0.0%) |
| $50,000 to $74,999 | 76 (100.0%) | 0 (0.0%) |
| $75,000 to $99,999 | 2 (100.0%) | 0 (0.0%) |
| $100,000 and over | 2 (100.0%) | 0 (0.0%) |
Public vs Private Health Insurance Coverage by Age in Regan
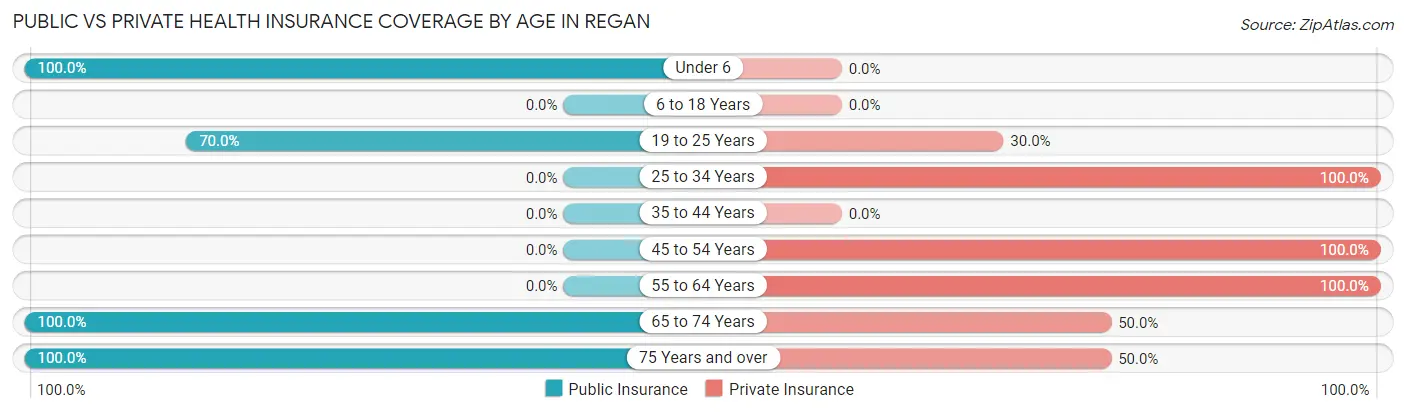
| Age Bracket | Public Insurance | Private Insurance |
| Under 6 | 35 (100.0%) | 0 (0.0%) |
| 6 to 18 Years | 0 (0.0%) | 0 (0.0%) |
| 19 to 25 Years | 28 (70.0%) | 12 (30.0%) |
| 25 to 34 Years | 0 (0.0%) | 1 (100.0%) |
| 35 to 44 Years | 0 (0.0%) | 0 (0.0%) |
| 45 to 54 Years | 0 (0.0%) | 4 (100.0%) |
| 55 to 64 Years | 0 (0.0%) | 2 (100.0%) |
| 65 to 74 Years | 2 (100.0%) | 1 (50.0%) |
| 75 Years and over | 4 (100.0%) | 2 (50.0%) |
| Total | 69 (78.4%) | 22 (25.0%) |
Disability Status by Sex by Age in Regan
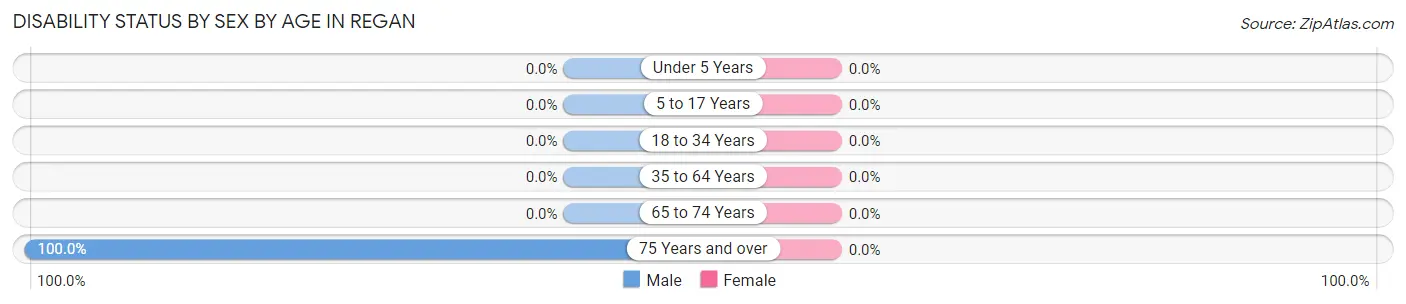
| Age Bracket | Male | Female |
| Under 5 Years | 0 (0.0%) | 0 (0.0%) |
| 5 to 17 Years | 0 (0.0%) | 0 (0.0%) |
| 18 to 34 Years | 0 (0.0%) | 0 (0.0%) |
| 35 to 64 Years | 0 (0.0%) | 0 (0.0%) |
| 65 to 74 Years | 0 (0.0%) | 0 (0.0%) |
| 75 Years and over | 4 (100.0%) | 0 (0.0%) |
Disability Class by Sex by Age in Regan
Disability Class: Hearing Difficulty
| Age Bracket | Male | Female |
| Under 5 Years | 0 (0.0%) | 0 (0.0%) |
| 5 to 17 Years | 0 (0.0%) | 0 (0.0%) |
| 18 to 34 Years | 0 (0.0%) | 0 (0.0%) |
| 35 to 64 Years | 0 (0.0%) | 0 (0.0%) |
| 65 to 74 Years | 0 (0.0%) | 0 (0.0%) |
| 75 Years and over | 2 (50.0%) | 0 (0.0%) |
Disability Class: Vision Difficulty
| Age Bracket | Male | Female |
| Under 5 Years | 0 (0.0%) | 0 (0.0%) |
| 5 to 17 Years | 0 (0.0%) | 0 (0.0%) |
| 18 to 34 Years | 0 (0.0%) | 0 (0.0%) |
| 35 to 64 Years | 0 (0.0%) | 0 (0.0%) |
| 65 to 74 Years | 0 (0.0%) | 0 (0.0%) |
| 75 Years and over | 0 (0.0%) | 0 (0.0%) |
Disability Class: Cognitive Difficulty
| Age Bracket | Male | Female |
| 5 to 17 Years | 0 (0.0%) | 0 (0.0%) |
| 18 to 34 Years | 0 (0.0%) | 0 (0.0%) |
| 35 to 64 Years | 0 (0.0%) | 0 (0.0%) |
| 65 to 74 Years | 0 (0.0%) | 0 (0.0%) |
| 75 Years and over | 2 (50.0%) | 0 (0.0%) |
Disability Class: Ambulatory Difficulty
| Age Bracket | Male | Female |
| 5 to 17 Years | 0 (0.0%) | 0 (0.0%) |
| 18 to 34 Years | 0 (0.0%) | 0 (0.0%) |
| 35 to 64 Years | 0 (0.0%) | 0 (0.0%) |
| 65 to 74 Years | 0 (0.0%) | 0 (0.0%) |
| 75 Years and over | 2 (50.0%) | 0 (0.0%) |
Disability Class: Self-Care Difficulty
| Age Bracket | Male | Female |
| 5 to 17 Years | 0 (0.0%) | 0 (0.0%) |
| 18 to 34 Years | 0 (0.0%) | 0 (0.0%) |
| 35 to 64 Years | 0 (0.0%) | 0 (0.0%) |
| 65 to 74 Years | 0 (0.0%) | 0 (0.0%) |
| 75 Years and over | 0 (0.0%) | 0 (0.0%) |
Technology Access in Regan
Computing Device Access in Regan
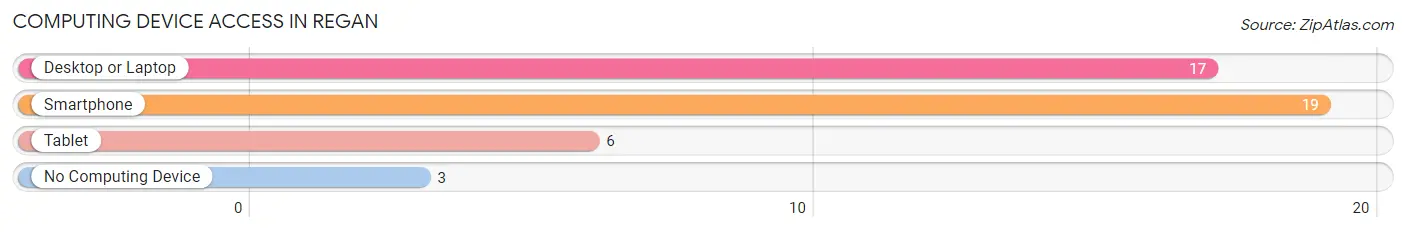
| Device Type | # Households | % Households |
| Desktop or Laptop | 17 | 77.3% |
| Smartphone | 19 | 86.4% |
| Tablet | 6 | 27.3% |
| No Computing Device | 3 | 13.6% |
| Total | 22 | 100.0% |
Internet Access in Regan
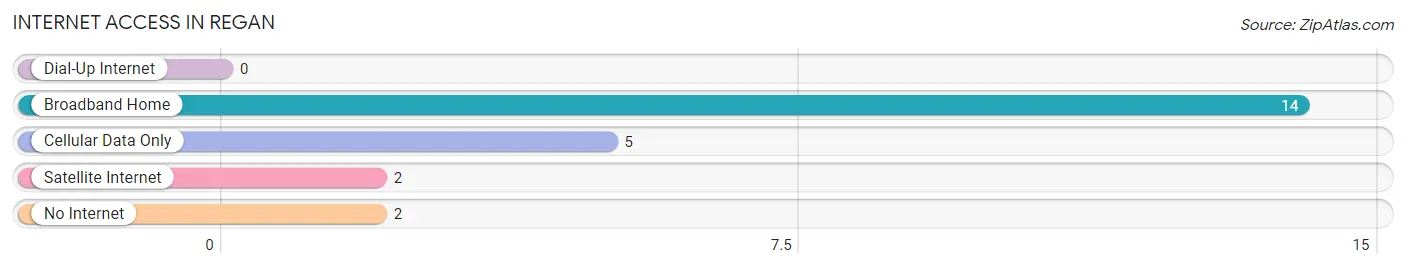
| Internet Type | # Households | % Households |
| Dial-Up Internet | 0 | 0.0% |
| Broadband Home | 14 | 63.6% |
| Cellular Data Only | 5 | 22.7% |
| Satellite Internet | 2 | 9.1% |
| No Internet | 2 | 9.1% |
| Total | 22 | 100.0% |
Regan Summary
North Dakota is a state located in the Midwestern and Great Plains regions of the United States. It is bordered by the Canadian provinces of Saskatchewan and Manitoba to the north, Minnesota to the east, South Dakota to the south, and Montana to the west. North Dakota is the 19th-largest state by area in the U.S. and the 4th-least populous, with an estimated population of 762,062 as of 2020. The state capital is Bismarck, and the largest city is Fargo.
History
The area that is now North Dakota has been inhabited for thousands of years by various Native American tribes. The first Europeans to explore the area were French fur traders, who arrived in the late 17th century. The area became part of the United States in 1803 as part of the Louisiana Purchase. In 1861, the Dakota Territory was created, which included present-day North and South Dakota. The territory was divided in 1889, and North Dakota became the 39th state in the Union on November 2, 1889.
During the late 19th and early 20th centuries, North Dakota experienced a period of rapid growth and development. The state was a major producer of wheat, and the development of railroads and other infrastructure helped to spur economic growth. The state also experienced a period of political turmoil during the early 20th century, with the Nonpartisan League and other progressive movements gaining influence.
Geography
North Dakota is located in the northern Great Plains region of the United States. It is bordered by the Canadian provinces of Saskatchewan and Manitoba to the north, Minnesota to the east, South Dakota to the south, and Montana to the west. The state has an area of 70,762 square miles, making it the 19th-largest state in the U.S.
The geography of North Dakota is varied, with the western part of the state being dominated by the Great Plains. The eastern part of the state is more hilly and forested. The Missouri River forms the western border of the state, and the Red River forms the eastern border. The state also contains several large lakes, including Lake Sakakawea, Lake Oahe, and Lake Audubon.
Economy
North Dakota has a diversified economy, with agriculture, energy, and tourism being the major industries. Agriculture is the largest sector of the state’s economy, with wheat, corn, soybeans, and other crops being the major crops. The state is also a major producer of beef, pork, and dairy products.
Energy is another major industry in North Dakota, with the state being a major producer of oil and natural gas. The state is also a major producer of wind energy, and is home to several large wind farms. Tourism is also an important part of the state’s economy, with the state’s many national parks and monuments attracting visitors from around the world.
Demographics
As of 2020, North Dakota had an estimated population of 762,062, making it the 4th-least populous state in the U.S. The state has a population density of 10.7 people per square mile, making it the 3rd-lowest in the country. The largest city in the state is Fargo, with an estimated population of 122,359.
The racial makeup of North Dakota is 87.2% White, 5.3% Native American, 2.2% Black, 1.7% Asian, and 3.6% from other races. The state also has a large Hispanic population, with 8.3% of the population being of Hispanic or Latino origin. The median household income in the state is $58,906, and the median home value is $179,400.
Common Questions
What is Per Capita Income in Regan?
Per Capita income in Regan is $23,788.
What is the Median Household income in Regan?
Median Household Income in Regan is $70,500.
What is Inequality or Gini Index in Regan?
Inequality or Gini Index in Regan is 0.23.
What is the Total Population of Regan?
Total Population of Regan is 88.
What is the Total Male Population of Regan?
Total Male Population of Regan is 23.
What is the Total Female Population of Regan?
Total Female Population of Regan is 65.
What is the Ratio of Males per 100 Females in Regan?
There are 35.38 Males per 100 Females in Regan.
What is the Ratio of Females per 100 Males in Regan?
There are 282.61 Females per 100 Males in Regan.
What is the Median Population Age in Regan?
Median Population Age in Regan is 22.3 Years.
What is the Average Family Size in Regan
Average Family Size in Regan is 6.9 People.
What is the Average Household Size in Regan
Average Household Size in Regan is 4.0 People.
How Large is the Labor Force in Regan?
There are 45 People in the Labor Forcein in Regan.
What is the Percentage of People in the Labor Force in Regan?
84.9% of People are in the Labor Force in Regan.