Hoxie, KS Map & Demographics
Hoxie Map
Hoxie Overview
$35,601
PER CAPITA INCOME
$76,953
AVG FAMILY INCOME
$68,438
AVG HOUSEHOLD INCOME
37.2%
WAGE / INCOME GAP [ % ]
62.8¢/ $1
WAGE / INCOME GAP [ $ ]
0.46
INEQUALITY / GINI INDEX
1,287
TOTAL POPULATION
621
MALE POPULATION
666
FEMALE POPULATION
93.24
MALES / 100 FEMALES
107.25
FEMALES / 100 MALES
39.1
MEDIAN AGE
4.0
AVG FAMILY SIZE
2.4
AVG HOUSEHOLD SIZE
680
LABOR FORCE [ PEOPLE ]
71.4%
PERCENT IN LABOR FORCE
Hoxie Zip Codes
Hoxie Area Codes
Income in Hoxie
Income Overview in Hoxie
Per Capita Income in Hoxie is $35,601, while median incomes of families and households are $76,953 and $68,438 respectively.
| Characteristic | Number | Measure |
| Per Capita Income | 1,287 | $35,601 |
| Median Family Income | 225 | $76,953 |
| Mean Family Income | 225 | $99,736 |
| Median Household Income | 519 | $68,438 |
| Mean Household Income | 519 | $80,953 |
| Income Deficit | 225 | $0 |
| Wage / Income Gap (%) | 1,287 | 37.21% |
| Wage / Income Gap ($) | 1,287 | 62.79¢ per $1 |
| Gini / Inequality Index | 1,287 | 0.46 |
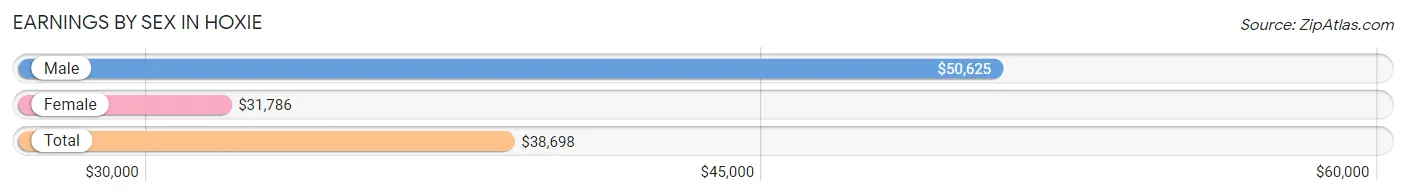
Earnings by Sex in Hoxie
Average Earnings in Hoxie are $38,698, $50,625 for men and $31,786 for women, a difference of 37.2%.
| Sex | Number | Average Earnings |
| Male | 375 (51.7%) | $50,625 |
| Female | 350 (48.3%) | $31,786 |
| Total | 725 (100.0%) | $38,698 |
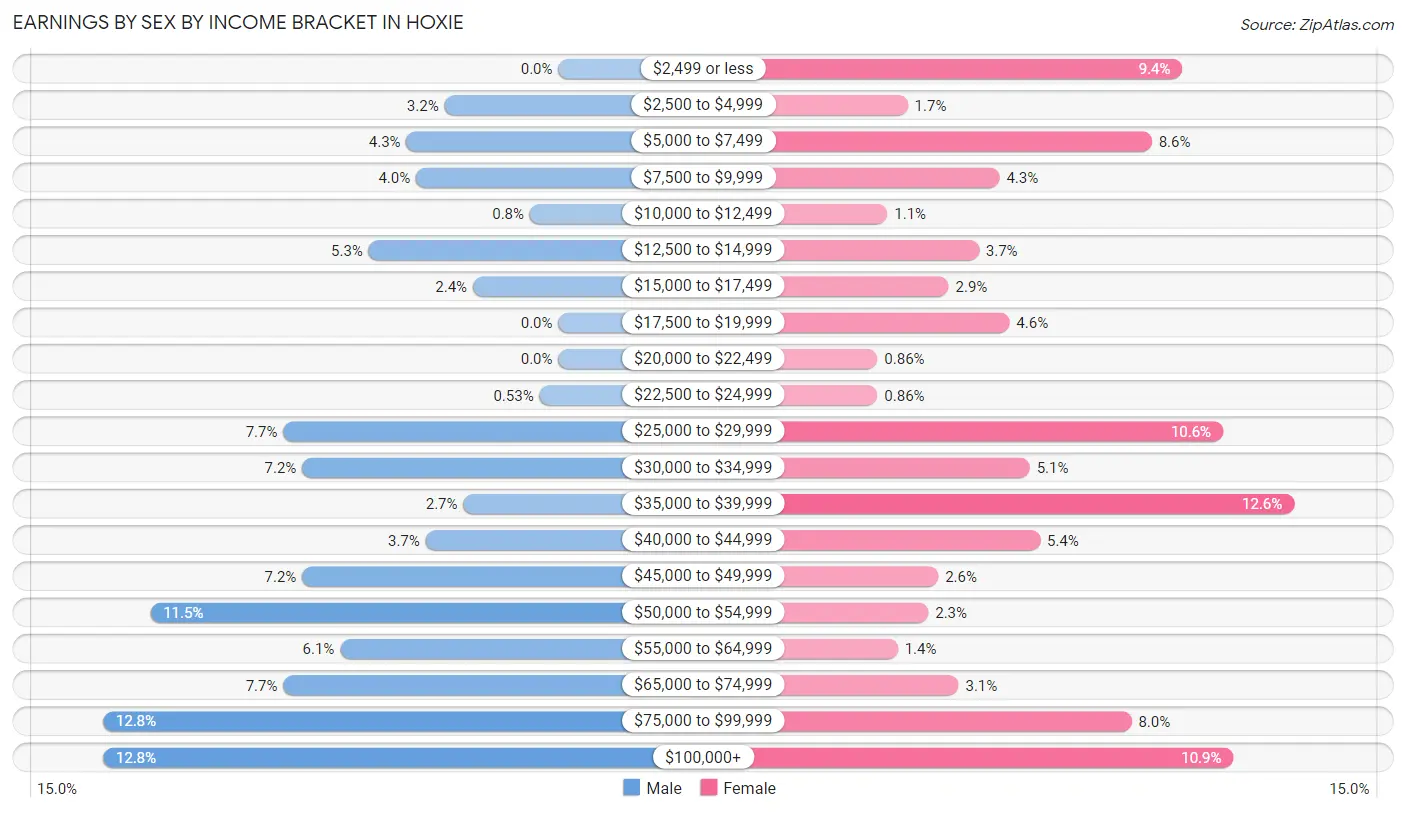
Earnings by Sex by Income Bracket in Hoxie
The most common earnings brackets in Hoxie are $75,000 to $99,999 for men (48 | 12.8%) and $35,000 to $39,999 for women (44 | 12.6%).
| Income | Male | Female |
| $2,499 or less | 0 (0.0%) | 33 (9.4%) |
| $2,500 to $4,999 | 12 (3.2%) | 6 (1.7%) |
| $5,000 to $7,499 | 16 (4.3%) | 30 (8.6%) |
| $7,500 to $9,999 | 15 (4.0%) | 15 (4.3%) |
| $10,000 to $12,499 | 3 (0.8%) | 4 (1.1%) |
| $12,500 to $14,999 | 20 (5.3%) | 13 (3.7%) |
| $15,000 to $17,499 | 9 (2.4%) | 10 (2.9%) |
| $17,500 to $19,999 | 0 (0.0%) | 16 (4.6%) |
| $20,000 to $22,499 | 0 (0.0%) | 3 (0.9%) |
| $22,500 to $24,999 | 2 (0.5%) | 3 (0.9%) |
| $25,000 to $29,999 | 29 (7.7%) | 37 (10.6%) |
| $30,000 to $34,999 | 27 (7.2%) | 18 (5.1%) |
| $35,000 to $39,999 | 10 (2.7%) | 44 (12.6%) |
| $40,000 to $44,999 | 14 (3.7%) | 19 (5.4%) |
| $45,000 to $49,999 | 27 (7.2%) | 9 (2.6%) |
| $50,000 to $54,999 | 43 (11.5%) | 8 (2.3%) |
| $55,000 to $64,999 | 23 (6.1%) | 5 (1.4%) |
| $65,000 to $74,999 | 29 (7.7%) | 11 (3.1%) |
| $75,000 to $99,999 | 48 (12.8%) | 28 (8.0%) |
| $100,000+ | 48 (12.8%) | 38 (10.9%) |
| Total | 375 (100.0%) | 350 (100.0%) |
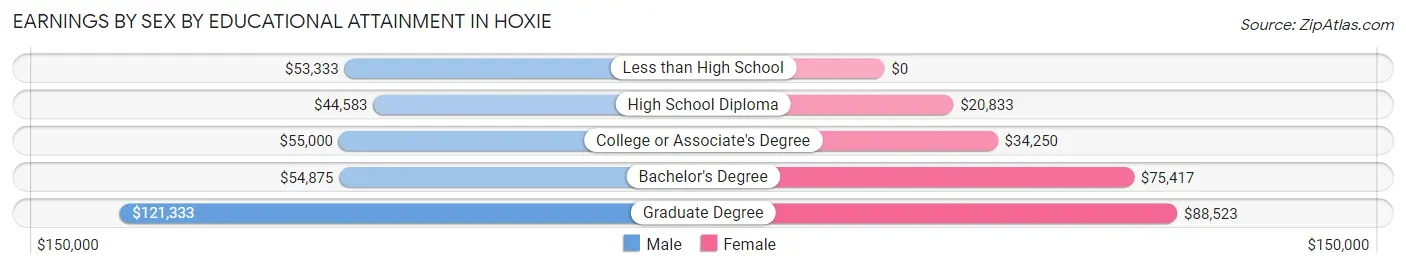
Earnings by Sex by Educational Attainment in Hoxie
Average earnings in Hoxie are $54,698 for men and $35,966 for women, a difference of 34.3%. Men with an educational attainment of graduate degree enjoy the highest average annual earnings of $121,333, while those with high school diploma education earn the least with $44,583. Women with an educational attainment of graduate degree earn the most with the average annual earnings of $88,523, while those with high school diploma education have the smallest earnings of $20,833.
| Educational Attainment | Male Income | Female Income |
| Less than High School | $53,333 | $0 |
| High School Diploma | $44,583 | $20,833 |
| College or Associate's Degree | $55,000 | $34,250 |
| Bachelor's Degree | $54,875 | $75,417 |
| Graduate Degree | $121,333 | $88,523 |
| Total | $54,698 | $35,966 |
Family Income in Hoxie
Family Income Brackets in Hoxie
According to the Hoxie family income data, there are 57 families falling into the $100,000 to $149,999 income range, which is the most common income bracket and makes up 25.3% of all families. Conversely, the $10,000 to $14,999 income bracket is the least frequent group with only 2 families (0.9%) belonging to this category.
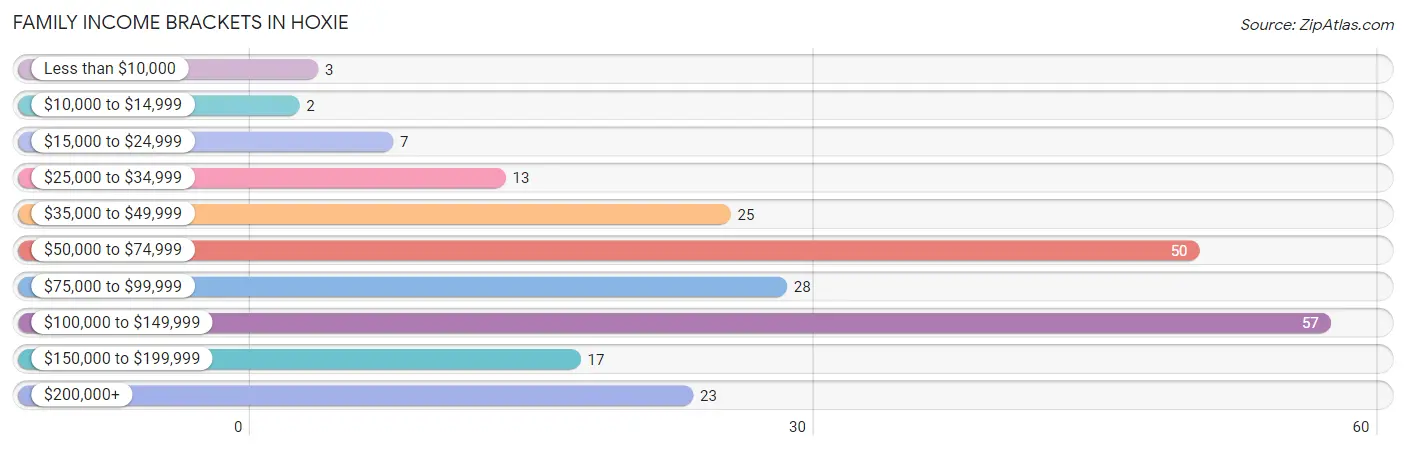
| Income Bracket | # Families | % Families |
| Less than $10,000 | 3 | 1.3% |
| $10,000 to $14,999 | 2 | 0.9% |
| $15,000 to $24,999 | 7 | 3.1% |
| $25,000 to $34,999 | 13 | 5.8% |
| $35,000 to $49,999 | 25 | 11.1% |
| $50,000 to $74,999 | 50 | 22.2% |
| $75,000 to $99,999 | 28 | 12.4% |
| $100,000 to $149,999 | 57 | 25.3% |
| $150,000 to $199,999 | 17 | 7.6% |
| $200,000+ | 23 | 10.2% |
Family Income by Famaliy Size in Hoxie
6-person families (22 | 9.8%) account for the highest median family income in Hoxie with $138,929 per family, while 2-person families (132 | 58.7%) have the highest median income of $36,875 per family member.
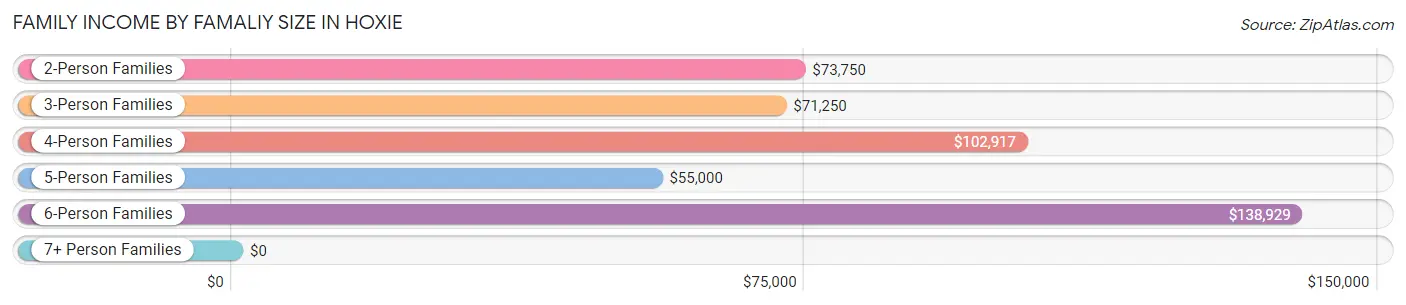
| Income Bracket | # Families | Median Income |
| 2-Person Families | 132 (58.7%) | $73,750 |
| 3-Person Families | 39 (17.3%) | $71,250 |
| 4-Person Families | 22 (9.8%) | $102,917 |
| 5-Person Families | 8 (3.6%) | $55,000 |
| 6-Person Families | 22 (9.8%) | $138,929 |
| 7+ Person Families | 2 (0.9%) | $0 |
| Total | 225 (100.0%) | $76,953 |
Family Income by Number of Earners in Hoxie
The median family income in Hoxie is $76,953, with families comprising 3+ earners (35) having the highest median family income of $104,583, while families with 1 earner (69) have the lowest median family income of $51,250, accounting for 15.6% and 30.7% of families, respectively.
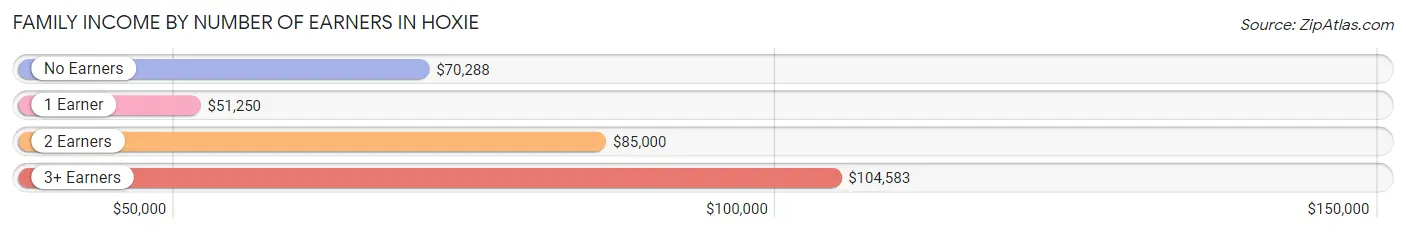
| Number of Earners | # Families | Median Income |
| No Earners | 29 (12.9%) | $70,288 |
| 1 Earner | 69 (30.7%) | $51,250 |
| 2 Earners | 92 (40.9%) | $85,000 |
| 3+ Earners | 35 (15.6%) | $104,583 |
| Total | 225 (100.0%) | $76,953 |
Household Income in Hoxie
Household Income Brackets in Hoxie
With 89 households falling in the category, the $100,000 to $149,999 income range is the most frequent in Hoxie, accounting for 17.2% of all households. In contrast, only 27 households (5.2%) fall into the $10,000 to $14,999 income bracket, making it the least populous group.
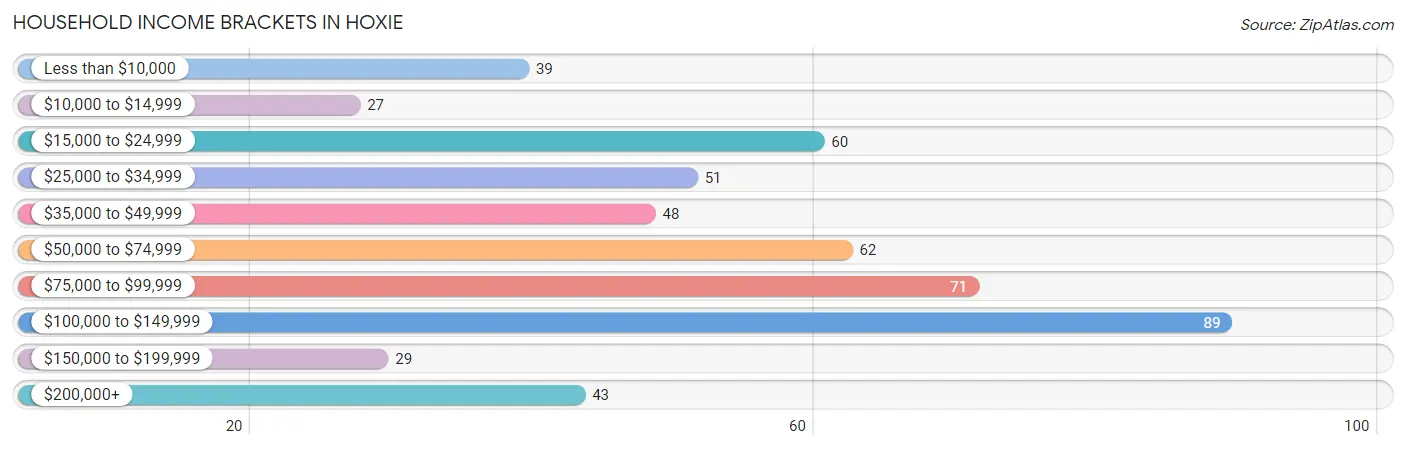
| Income Bracket | # Households | % Households |
| Less than $10,000 | 39 | 7.5% |
| $10,000 to $14,999 | 27 | 5.2% |
| $15,000 to $24,999 | 60 | 11.6% |
| $25,000 to $34,999 | 51 | 9.8% |
| $35,000 to $49,999 | 48 | 9.2% |
| $50,000 to $74,999 | 62 | 11.9% |
| $75,000 to $99,999 | 71 | 13.7% |
| $100,000 to $149,999 | 89 | 17.1% |
| $150,000 to $199,999 | 29 | 5.6% |
| $200,000+ | 43 | 8.3% |
Household Income by Householder Age in Hoxie
The median household income in Hoxie is $68,438, with the highest median household income of $85,192 found in the 25 to 44 years age bracket for the primary householder. A total of 178 households (34.3%) fall into this category. Meanwhile, the 15 to 24 years age bracket for the primary householder has the lowest median household income of $0, with 14 households (2.7%) in this group.
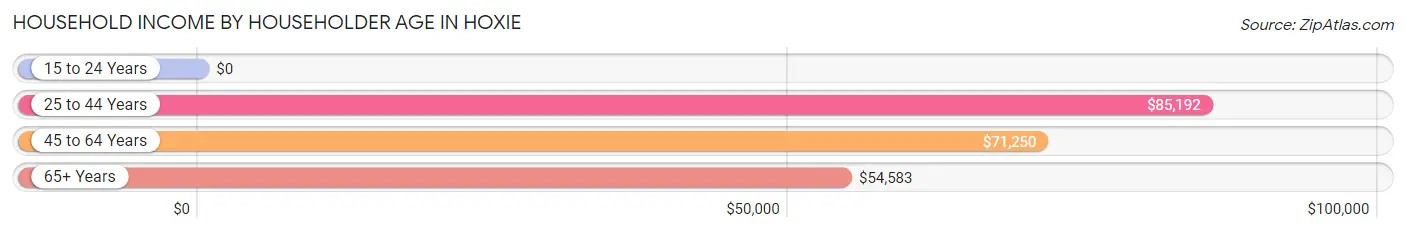
| Income Bracket | # Households | Median Income |
| 15 to 24 Years | 14 (2.7%) | $0 |
| 25 to 44 Years | 178 (34.3%) | $85,192 |
| 45 to 64 Years | 141 (27.2%) | $71,250 |
| 65+ Years | 186 (35.8%) | $54,583 |
| Total | 519 (100.0%) | $68,438 |
Poverty in Hoxie
Income Below Poverty by Sex and Age in Hoxie
With 3.9% poverty level for males and 8.7% for females among the residents of Hoxie, 55 to 64 year old males and 35 to 44 year old females are the most vulnerable to poverty, with 14 males (21.9%) and 22 females (27.2%) in their respective age groups living below the poverty level.
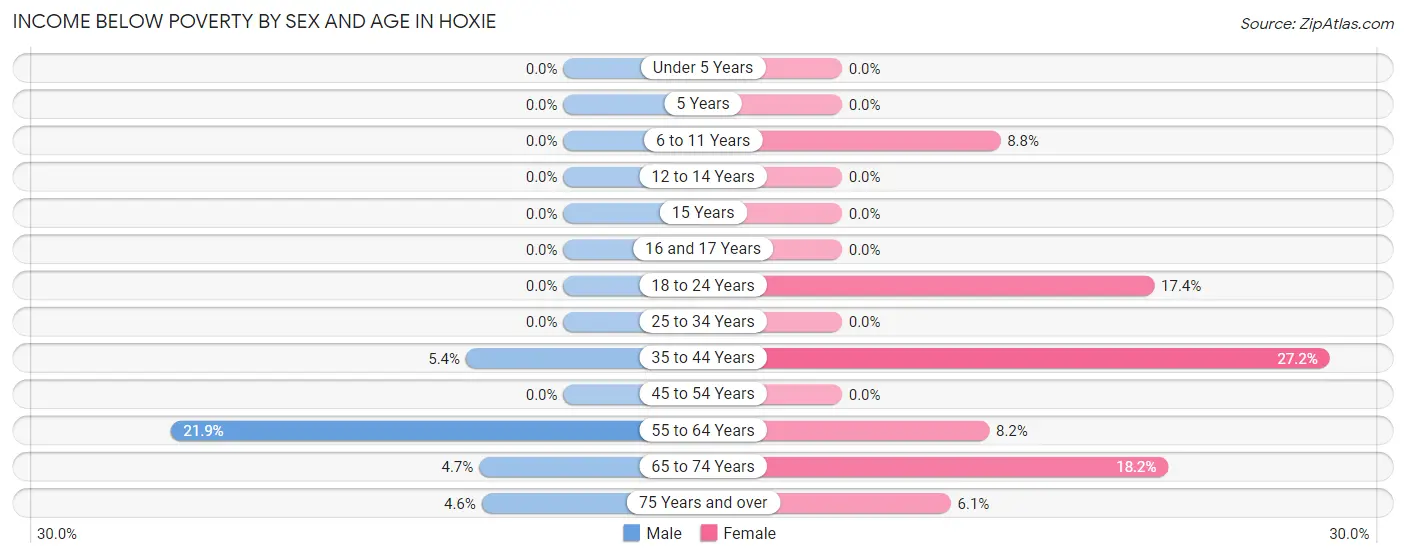
| Age Bracket | Male | Female |
| Under 5 Years | 0 (0.0%) | 0 (0.0%) |
| 5 Years | 0 (0.0%) | 0 (0.0%) |
| 6 to 11 Years | 0 (0.0%) | 6 (8.8%) |
| 12 to 14 Years | 0 (0.0%) | 0 (0.0%) |
| 15 Years | 0 (0.0%) | 0 (0.0%) |
| 16 and 17 Years | 0 (0.0%) | 0 (0.0%) |
| 18 to 24 Years | 0 (0.0%) | 4 (17.4%) |
| 25 to 34 Years | 0 (0.0%) | 0 (0.0%) |
| 35 to 44 Years | 5 (5.4%) | 22 (27.2%) |
| 45 to 54 Years | 0 (0.0%) | 0 (0.0%) |
| 55 to 64 Years | 14 (21.9%) | 5 (8.2%) |
| 65 to 74 Years | 3 (4.7%) | 12 (18.2%) |
| 75 Years and over | 2 (4.5%) | 6 (6.1%) |
| Total | 24 (3.9%) | 55 (8.7%) |
Income Above Poverty by Sex and Age in Hoxie
According to the poverty statistics in Hoxie, males aged under 5 years and females aged under 5 years are the age groups that are most secure financially, with 100.0% of males and 100.0% of females in these age groups living above the poverty line.
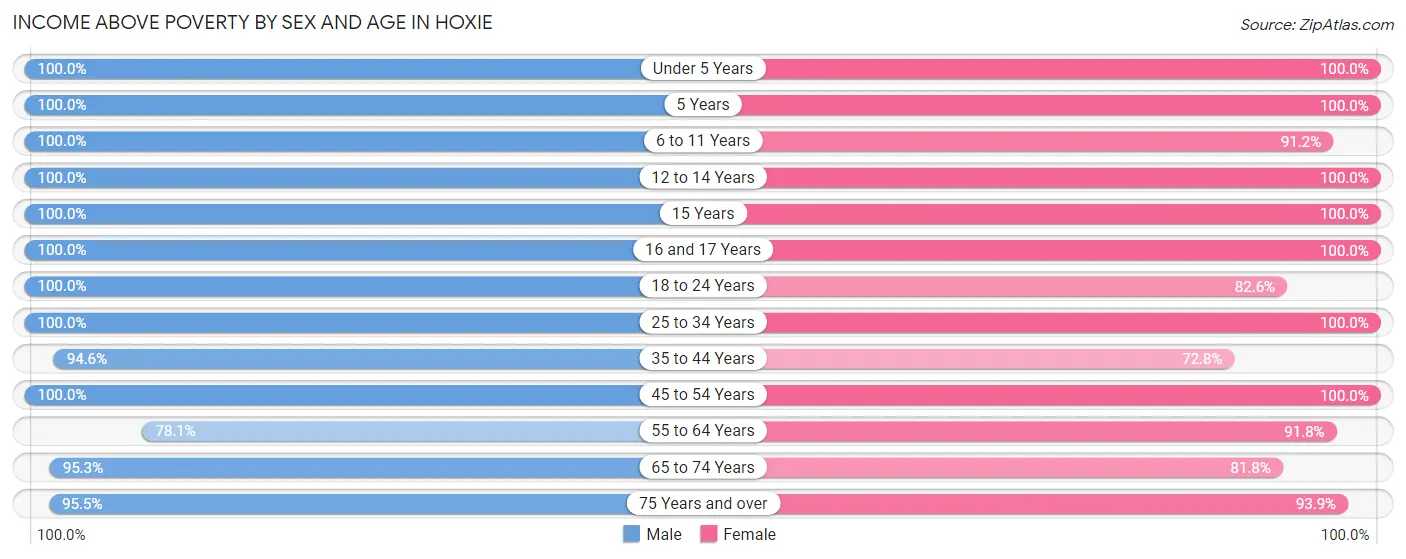
| Age Bracket | Male | Female |
| Under 5 Years | 33 (100.0%) | 34 (100.0%) |
| 5 Years | 19 (100.0%) | 3 (100.0%) |
| 6 to 11 Years | 69 (100.0%) | 62 (91.2%) |
| 12 to 14 Years | 35 (100.0%) | 37 (100.0%) |
| 15 Years | 14 (100.0%) | 15 (100.0%) |
| 16 and 17 Years | 17 (100.0%) | 29 (100.0%) |
| 18 to 24 Years | 64 (100.0%) | 19 (82.6%) |
| 25 to 34 Years | 51 (100.0%) | 69 (100.0%) |
| 35 to 44 Years | 87 (94.6%) | 59 (72.8%) |
| 45 to 54 Years | 47 (100.0%) | 49 (100.0%) |
| 55 to 64 Years | 50 (78.1%) | 56 (91.8%) |
| 65 to 74 Years | 61 (95.3%) | 54 (81.8%) |
| 75 Years and over | 42 (95.5%) | 93 (93.9%) |
| Total | 589 (96.1%) | 579 (91.3%) |
Income Below Poverty Among Married-Couple Families in Hoxie
The poverty statistics for married-couple families in Hoxie show that 2.8% or 5 of the total 178 families live below the poverty line. Families with no children have the highest poverty rate of 4.5%, comprising of 5 families. On the other hand, families with 1 or 2 children have the lowest poverty rate of 0.0%, which includes 0 families.
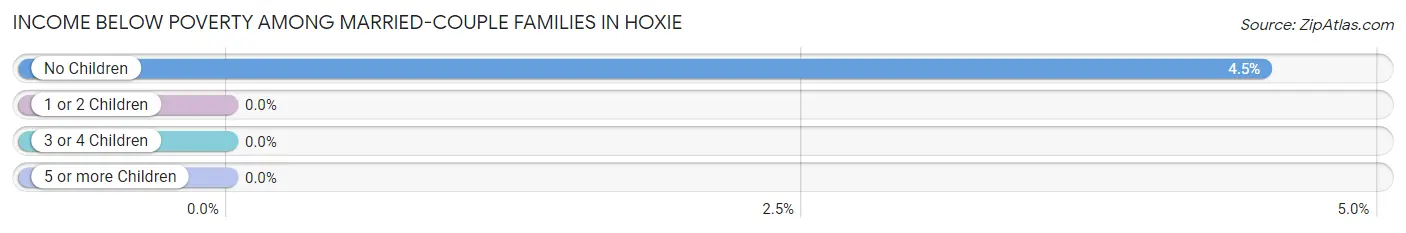
| Children | Above Poverty | Below Poverty |
| No Children | 106 (95.5%) | 5 (4.5%) |
| 1 or 2 Children | 46 (100.0%) | 0 (0.0%) |
| 3 or 4 Children | 19 (100.0%) | 0 (0.0%) |
| 5 or more Children | 2 (100.0%) | 0 (0.0%) |
| Total | 173 (97.2%) | 5 (2.8%) |
Income Below Poverty Among Single-Parent Households in Hoxie
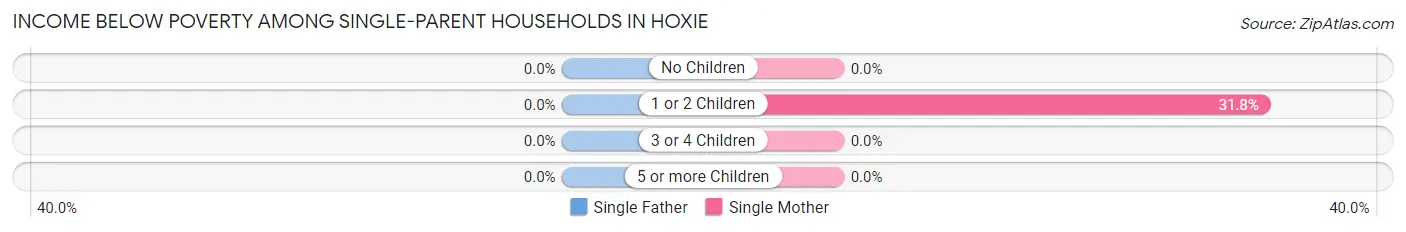
| Children | Single Father | Single Mother |
| No Children | 0 (0.0%) | 0 (0.0%) |
| 1 or 2 Children | 0 (0.0%) | 7 (31.8%) |
| 3 or 4 Children | 0 (0.0%) | 0 (0.0%) |
| 5 or more Children | 0 (0.0%) | 0 (0.0%) |
| Total | 0 (0.0%) | 7 (25.0%) |
Income Below Poverty Among Married-Couple vs Single-Parent Households in Hoxie
The poverty data for Hoxie shows that 5 of the married-couple family households (2.8%) and 7 of the single-parent households (14.9%) are living below the poverty level. Within the married-couple family households, those with no children have the highest poverty rate, with 5 households (4.5%) falling below the poverty line. Among the single-parent households, those with 1 or 2 children have the highest poverty rate, with 7 household (20.6%) living below poverty.
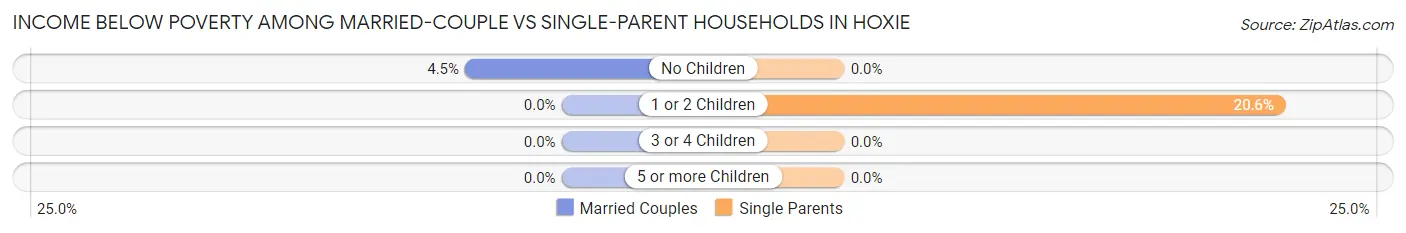
| Children | Married-Couple Families | Single-Parent Households |
| No Children | 5 (4.5%) | 0 (0.0%) |
| 1 or 2 Children | 0 (0.0%) | 7 (20.6%) |
| 3 or 4 Children | 0 (0.0%) | 0 (0.0%) |
| 5 or more Children | 0 (0.0%) | 0 (0.0%) |
| Total | 5 (2.8%) | 7 (14.9%) |
Race in Hoxie
The most populous races in Hoxie are White / Caucasian (1,142 | 88.7%), Hispanic or Latino (99 | 7.7%), and Some other Race (82 | 6.4%).
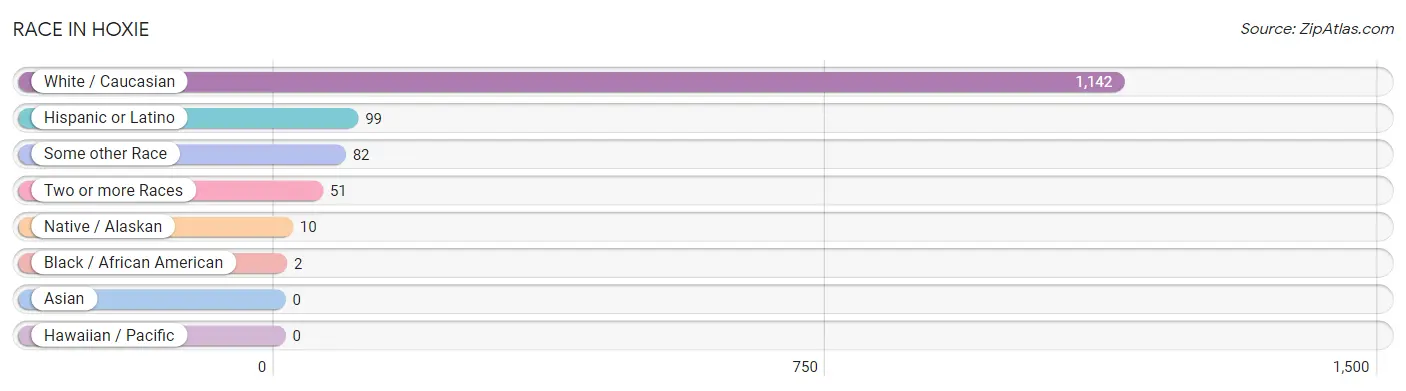
| Race | # Population | % Population |
| Asian | 0 | 0.0% |
| Black / African American | 2 | 0.2% |
| Hawaiian / Pacific | 0 | 0.0% |
| Hispanic or Latino | 99 | 7.7% |
| Native / Alaskan | 10 | 0.8% |
| White / Caucasian | 1,142 | 88.7% |
| Two or more Races | 51 | 4.0% |
| Some other Race | 82 | 6.4% |
| Total | 1,287 | 100.0% |
Ancestry in Hoxie
The most populous ancestries reported in Hoxie are German (473 | 36.7%), Irish (174 | 13.5%), English (123 | 9.6%), American (115 | 8.9%), and Mexican (99 | 7.7%), together accounting for 76.5% of all Hoxie residents.
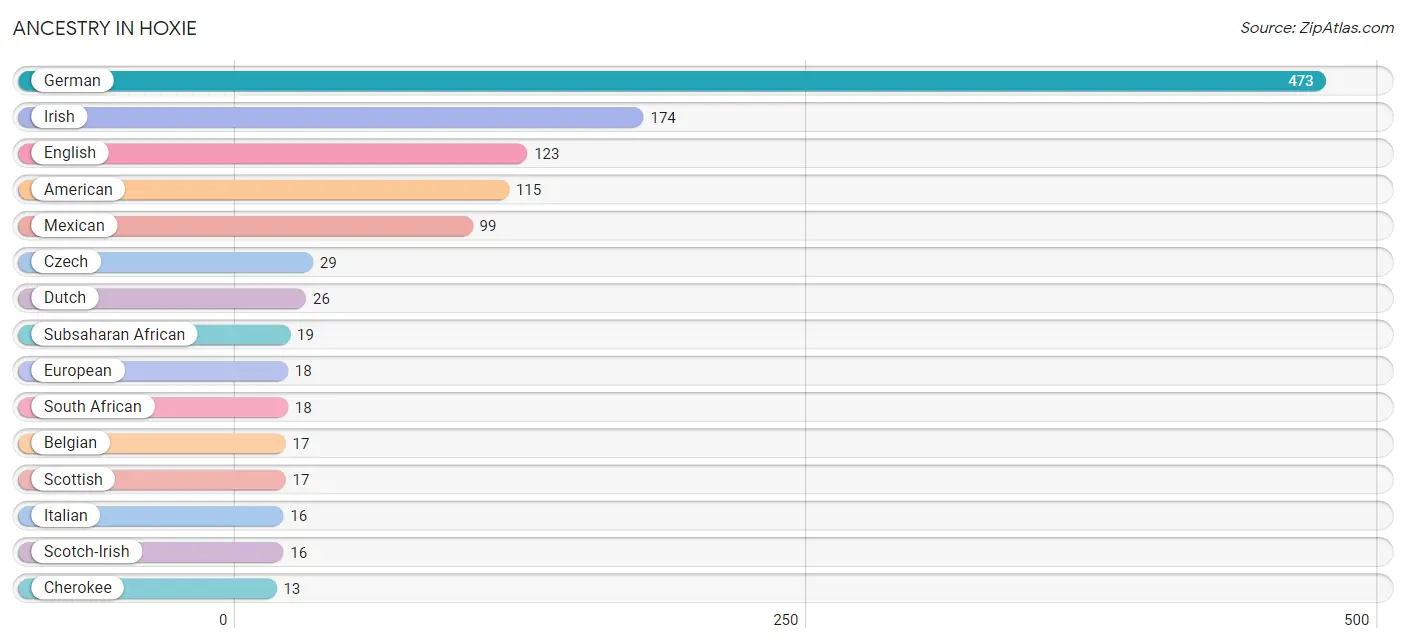
| Ancestry | # Population | % Population |
| American | 115 | 8.9% |
| Belgian | 17 | 1.3% |
| Cherokee | 13 | 1.0% |
| Czech | 29 | 2.2% |
| Danish | 12 | 0.9% |
| Dutch | 26 | 2.0% |
| English | 123 | 9.6% |
| European | 18 | 1.4% |
| Finnish | 1 | 0.1% |
| French | 6 | 0.5% |
| French Canadian | 2 | 0.2% |
| German | 473 | 36.7% |
| German Russian | 2 | 0.2% |
| Greek | 9 | 0.7% |
| Icelander | 12 | 0.9% |
| Irish | 174 | 13.5% |
| Italian | 16 | 1.2% |
| Luxembourger | 2 | 0.2% |
| Mexican | 99 | 7.7% |
| Nigerian | 1 | 0.1% |
| Norwegian | 2 | 0.2% |
| Polish | 13 | 1.0% |
| Russian | 11 | 0.9% |
| Scotch-Irish | 16 | 1.2% |
| Scottish | 17 | 1.3% |
| South African | 18 | 1.4% |
| Subsaharan African | 19 | 1.5% |
| Swedish | 8 | 0.6% |
| Swiss | 3 | 0.2% | View All 29 Rows |
Immigrants in Hoxie
The most numerous immigrant groups reported in Hoxie came from Central America (49 | 3.8%), Latin America (49 | 3.8%), Mexico (49 | 3.8%), Oceania (3 | 0.2%), and Africa (2 | 0.2%), together accounting for 11.8% of all Hoxie residents.
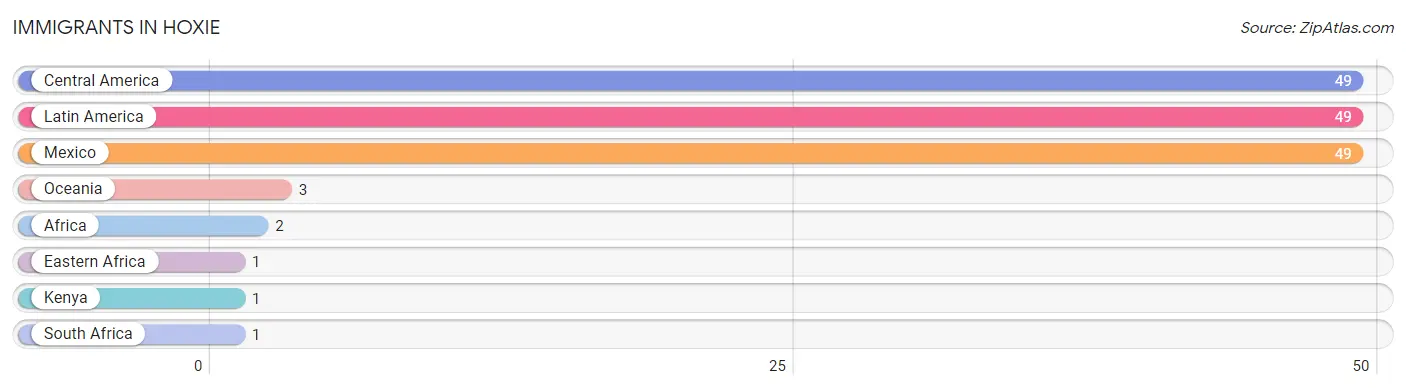
| Immigration Origin | # Population | % Population |
| Africa | 2 | 0.2% |
| Central America | 49 | 3.8% |
| Eastern Africa | 1 | 0.1% |
| Kenya | 1 | 0.1% |
| Latin America | 49 | 3.8% |
| Mexico | 49 | 3.8% |
| Oceania | 3 | 0.2% |
| South Africa | 1 | 0.1% | View All 8 Rows |
Sex and Age in Hoxie
Sex and Age in Hoxie
The most populous age groups in Hoxie are 5 to 9 Years (73 | 11.8%) for men and 75 to 79 Years (71 | 10.7%) for women.
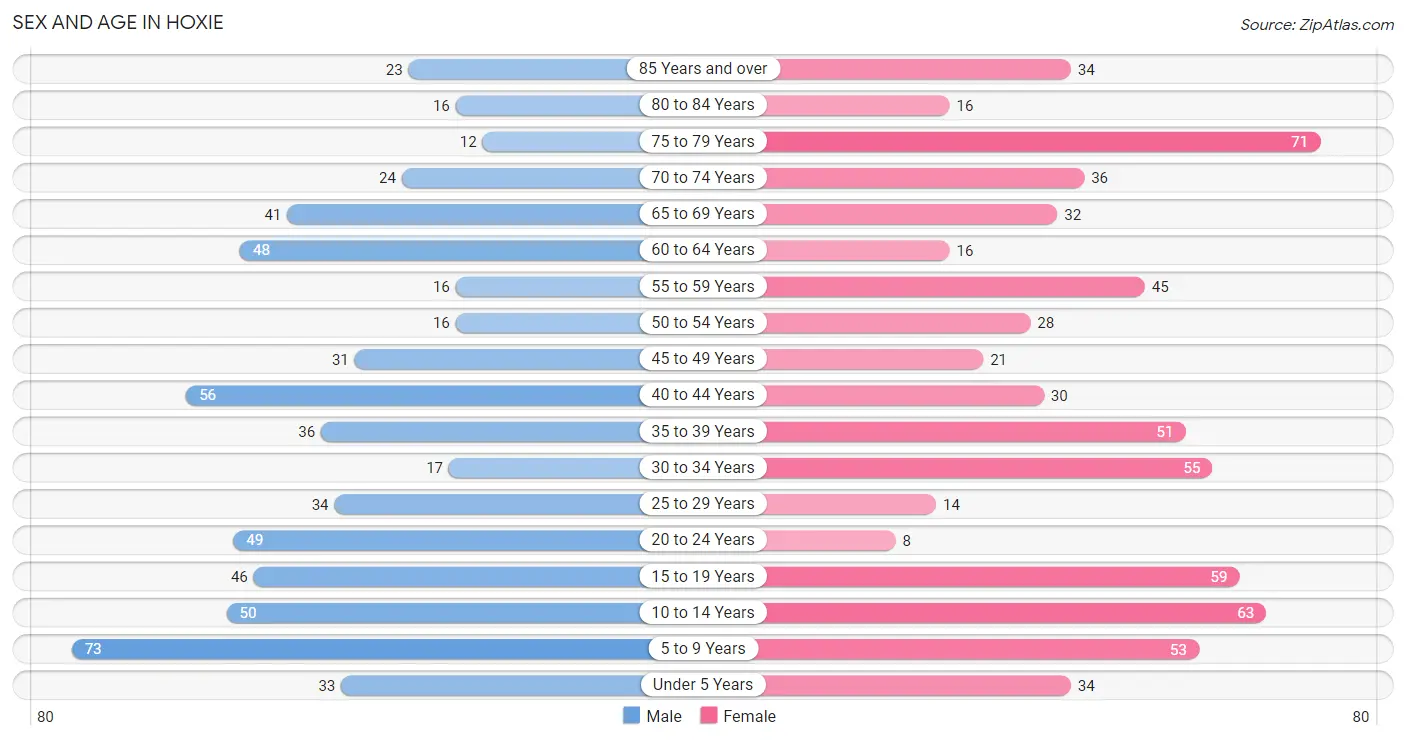
| Age Bracket | Male | Female |
| Under 5 Years | 33 (5.3%) | 34 (5.1%) |
| 5 to 9 Years | 73 (11.8%) | 53 (8.0%) |
| 10 to 14 Years | 50 (8.1%) | 63 (9.5%) |
| 15 to 19 Years | 46 (7.4%) | 59 (8.9%) |
| 20 to 24 Years | 49 (7.9%) | 8 (1.2%) |
| 25 to 29 Years | 34 (5.5%) | 14 (2.1%) |
| 30 to 34 Years | 17 (2.7%) | 55 (8.3%) |
| 35 to 39 Years | 36 (5.8%) | 51 (7.7%) |
| 40 to 44 Years | 56 (9.0%) | 30 (4.5%) |
| 45 to 49 Years | 31 (5.0%) | 21 (3.2%) |
| 50 to 54 Years | 16 (2.6%) | 28 (4.2%) |
| 55 to 59 Years | 16 (2.6%) | 45 (6.8%) |
| 60 to 64 Years | 48 (7.7%) | 16 (2.4%) |
| 65 to 69 Years | 41 (6.6%) | 32 (4.8%) |
| 70 to 74 Years | 24 (3.9%) | 36 (5.4%) |
| 75 to 79 Years | 12 (1.9%) | 71 (10.7%) |
| 80 to 84 Years | 16 (2.6%) | 16 (2.4%) |
| 85 Years and over | 23 (3.7%) | 34 (5.1%) |
| Total | 621 (100.0%) | 666 (100.0%) |
Families and Households in Hoxie
Median Family Size in Hoxie
The median family size in Hoxie is 3.96 persons per family, with married-couple families (178 | 79.1%) accounting for the largest median family size of 4.1 persons per family. On the other hand, single female/mother families (28 | 12.4%) represent the smallest median family size with 3.18 persons per family.
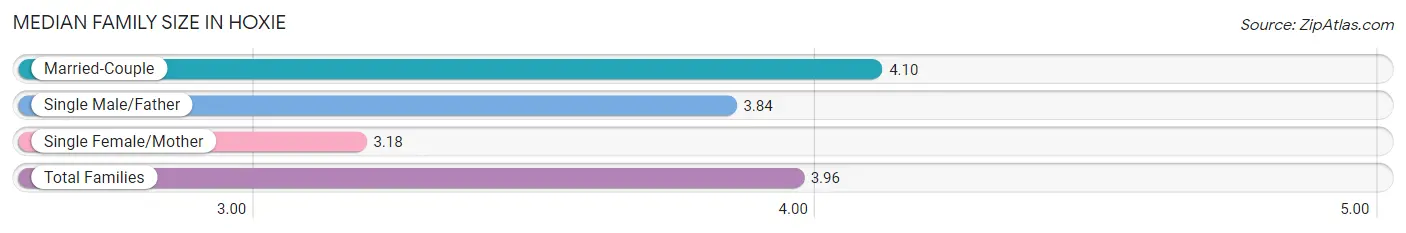
| Family Type | # Families | Family Size |
| Married-Couple | 178 (79.1%) | 4.10 |
| Single Male/Father | 19 (8.4%) | 3.84 |
| Single Female/Mother | 28 (12.4%) | 3.18 |
| Total Families | 225 (100.0%) | 3.96 |
Median Household Size in Hoxie
The median household size in Hoxie is 2.42 persons per household, with single male/father households (19 | 3.7%) accounting for the largest median household size of 4.79 persons per household. non-family households (294 | 56.7%) represent the smallest median household size with 1.17 persons per household.
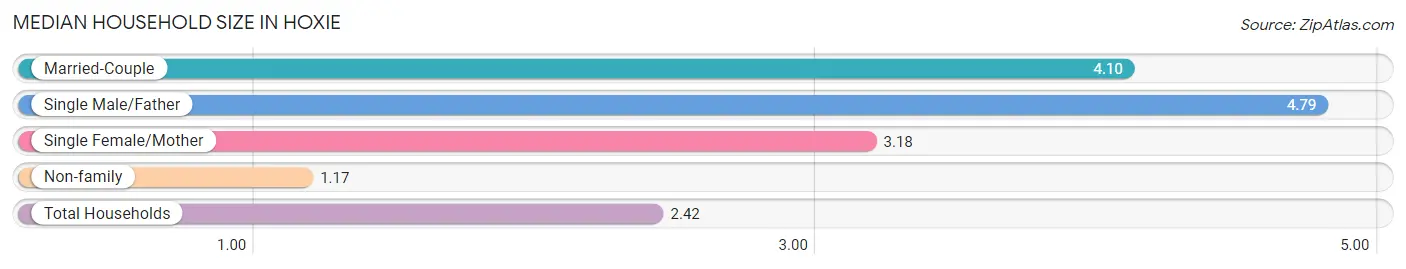
| Household Type | # Households | Household Size |
| Married-Couple | 178 (34.3%) | 4.10 |
| Single Male/Father | 19 (3.7%) | 4.79 |
| Single Female/Mother | 28 (5.4%) | 3.18 |
| Non-family | 294 (56.7%) | 1.17 |
| Total Households | 519 (100.0%) | 2.42 |
Household Size by Marriage Status in Hoxie
Out of a total of 519 households in Hoxie, 225 (43.3%) are family households, while 294 (56.7%) are nonfamily households. The most numerous type of family households are 2-person households, comprising 125, and the most common type of nonfamily households are 1-person households, comprising 247.
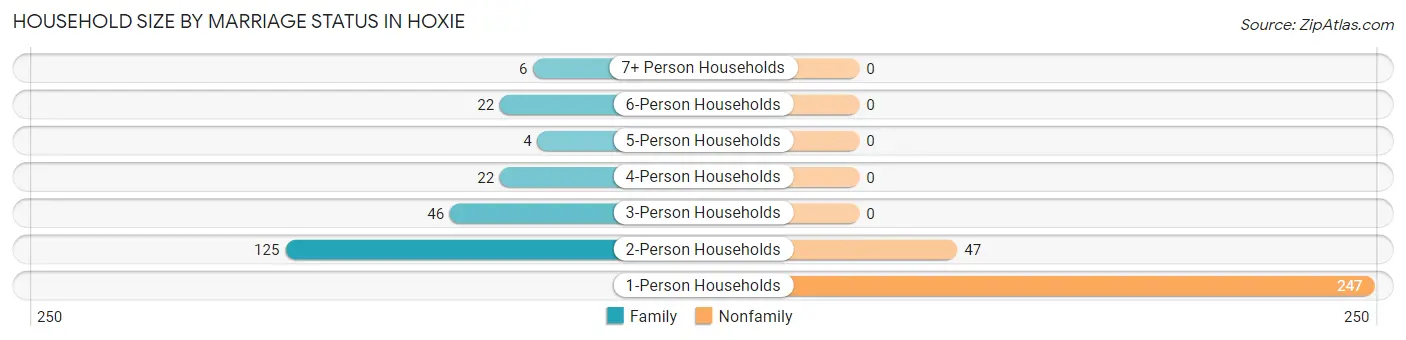
| Household Size | Family Households | Nonfamily Households |
| 1-Person Households | - | 247 (47.6%) |
| 2-Person Households | 125 (24.1%) | 47 (9.1%) |
| 3-Person Households | 46 (8.9%) | 0 (0.0%) |
| 4-Person Households | 22 (4.2%) | 0 (0.0%) |
| 5-Person Households | 4 (0.8%) | 0 (0.0%) |
| 6-Person Households | 22 (4.2%) | 0 (0.0%) |
| 7+ Person Households | 6 (1.2%) | 0 (0.0%) |
| Total | 225 (43.3%) | 294 (56.7%) |
Female Fertility in Hoxie
Fertility by Age in Hoxie
Average fertility rate in Hoxie is 16.0 births per 1,000 women. Women in the age bracket of 20 to 34 years have the highest fertility rate with 52.0 births per 1,000 women. Women in the age bracket of 20 to 34 years acount for 100.0% of all women with births.
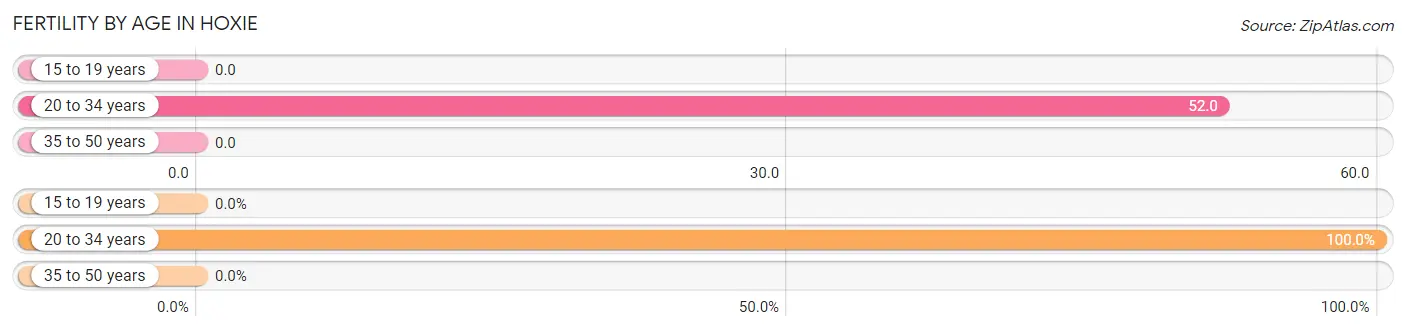
| Age Bracket | Women with Births | Births / 1,000 Women |
| 15 to 19 years | 0 (0.0%) | 0.0 |
| 20 to 34 years | 4 (100.0%) | 52.0 |
| 35 to 50 years | 0 (0.0%) | 0.0 |
| Total | 4 (100.0%) | 16.0 |
Fertility by Age by Marriage Status in Hoxie
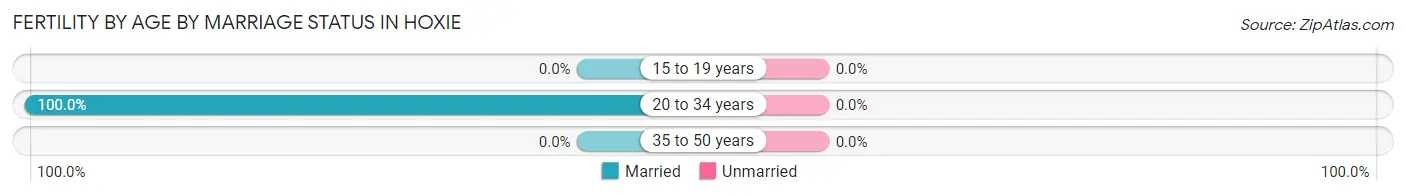
| Age Bracket | Married | Unmarried |
| 15 to 19 years | 0 (0.0%) | 0 (0.0%) |
| 20 to 34 years | 4 (100.0%) | 0 (0.0%) |
| 35 to 50 years | 0 (0.0%) | 0 (0.0%) |
| Total | 4 (100.0%) | 0 (0.0%) |
Fertility by Education in Hoxie
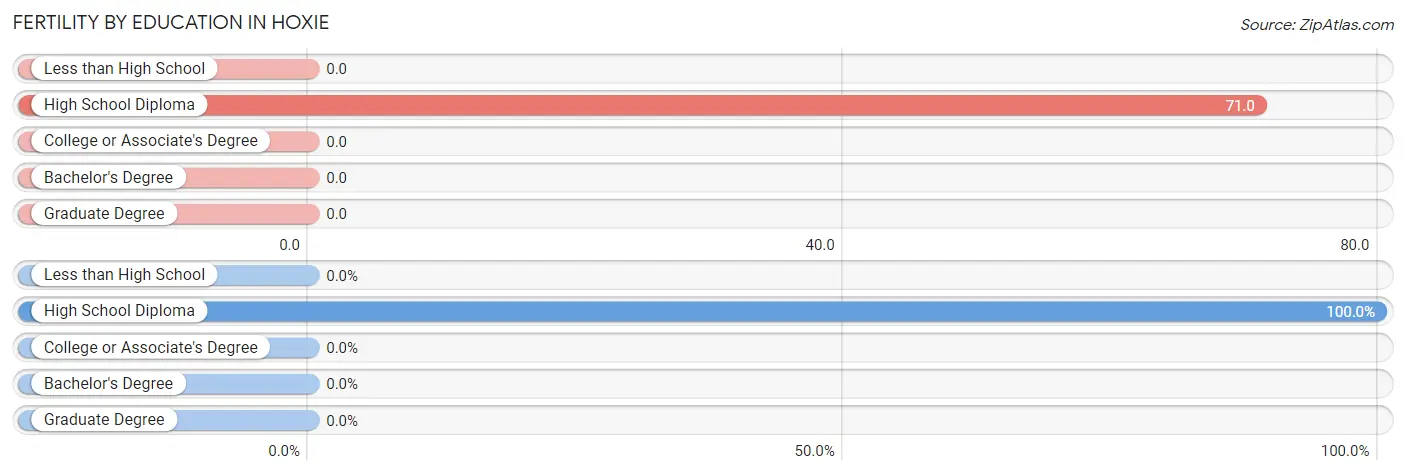
| Educational Attainment | Women with Births | Births / 1,000 Women |
| Less than High School | 0 (0.0%) | 0.0 |
| High School Diploma | 4 (100.0%) | 71.0 |
| College or Associate's Degree | 0 (0.0%) | 0.0 |
| Bachelor's Degree | 0 (0.0%) | 0.0 |
| Graduate Degree | 0 (0.0%) | 0.0 |
| Total | 4 (100.0%) | 16.0 |
Fertility by Education by Marriage Status in Hoxie
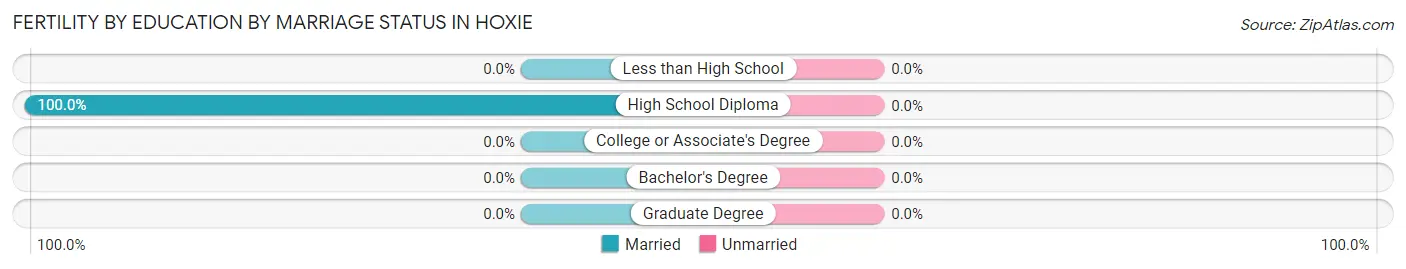
| Educational Attainment | Married | Unmarried |
| Less than High School | 0 (0.0%) | 0 (0.0%) |
| High School Diploma | 4 (100.0%) | 0 (0.0%) |
| College or Associate's Degree | 0 (0.0%) | 0 (0.0%) |
| Bachelor's Degree | 0 (0.0%) | 0 (0.0%) |
| Graduate Degree | 0 (0.0%) | 0 (0.0%) |
| Total | 4 (100.0%) | 0 (0.0%) |
Employment Characteristics in Hoxie
Employment by Class of Employer in Hoxie
Among the 666 employed individuals in Hoxie, private company employees (283 | 42.5%), local government employees (112 | 16.8%), and self-employed (not incorporated) (90 | 13.5%) make up the most common classes of employment.
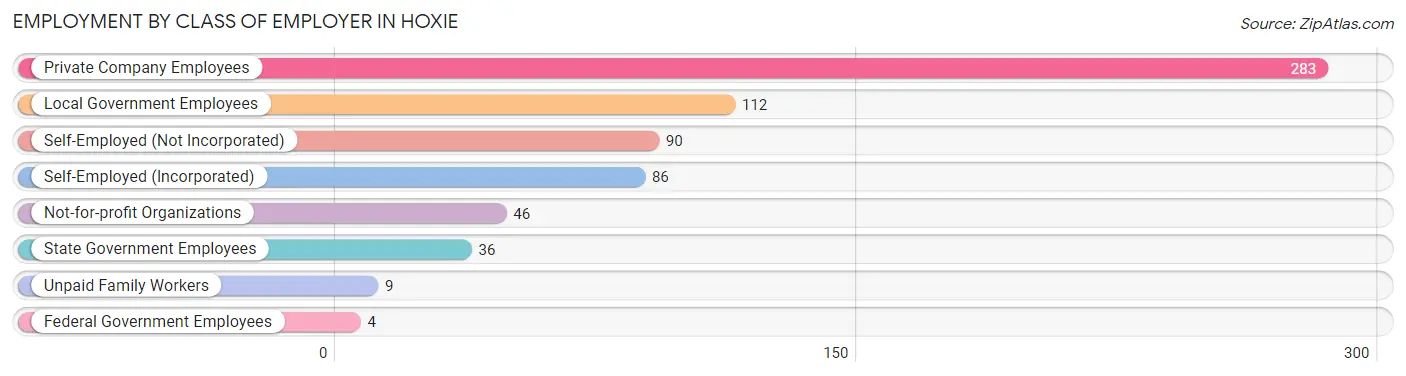
| Employer Class | # Employees | % Employees |
| Private Company Employees | 283 | 42.5% |
| Self-Employed (Incorporated) | 86 | 12.9% |
| Self-Employed (Not Incorporated) | 90 | 13.5% |
| Not-for-profit Organizations | 46 | 6.9% |
| Local Government Employees | 112 | 16.8% |
| State Government Employees | 36 | 5.4% |
| Federal Government Employees | 4 | 0.6% |
| Unpaid Family Workers | 9 | 1.3% |
| Total | 666 | 100.0% |
Employment Status by Age in Hoxie
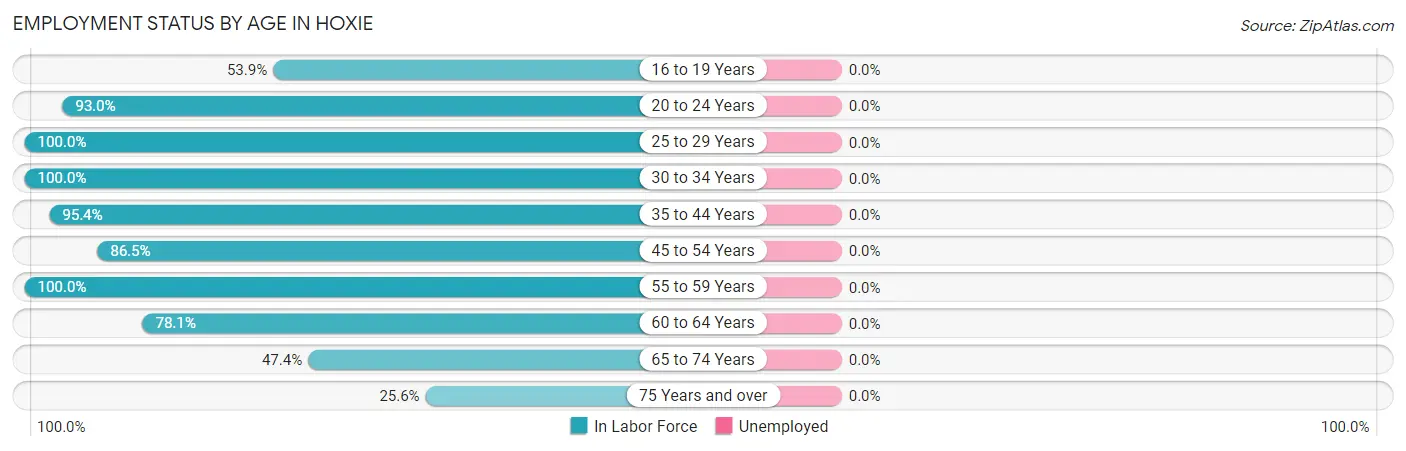
| Age Bracket | In Labor Force | Unemployed |
| 16 to 19 Years | 41 (53.9%) | 0 (0.0%) |
| 20 to 24 Years | 53 (93.0%) | 0 (0.0%) |
| 25 to 29 Years | 48 (100.0%) | 0 (0.0%) |
| 30 to 34 Years | 72 (100.0%) | 0 (0.0%) |
| 35 to 44 Years | 165 (95.4%) | 0 (0.0%) |
| 45 to 54 Years | 83 (86.5%) | 0 (0.0%) |
| 55 to 59 Years | 61 (100.0%) | 0 (0.0%) |
| 60 to 64 Years | 50 (78.1%) | 0 (0.0%) |
| 65 to 74 Years | 63 (47.4%) | 0 (0.0%) |
| 75 Years and over | 44 (25.6%) | 0 (0.0%) |
| Total | 680 (71.4%) | 0 (0.0%) |
Employment Status by Educational Attainment in Hoxie
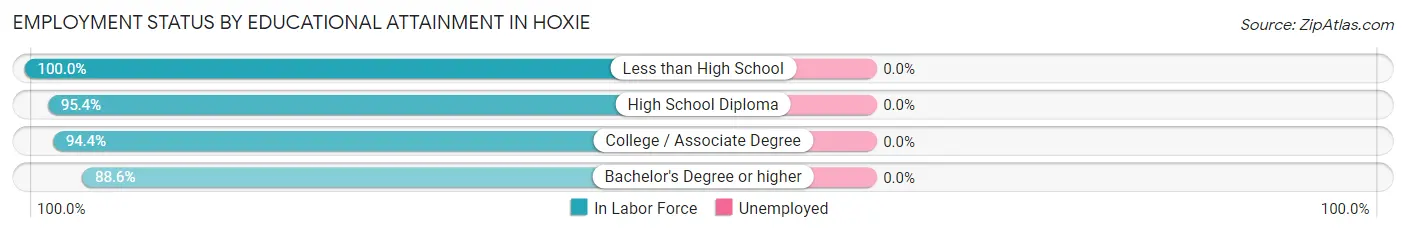
| Educational Attainment | In Labor Force | Unemployed |
| Less than High School | 9 (100.0%) | 0 (0.0%) |
| High School Diploma | 144 (95.4%) | 0 (0.0%) |
| College / Associate Degree | 202 (94.4%) | 0 (0.0%) |
| Bachelor's Degree or higher | 124 (88.6%) | 0 (0.0%) |
| Total | 479 (93.2%) | 0 (0.0%) |
Employment Occupations by Sex in Hoxie
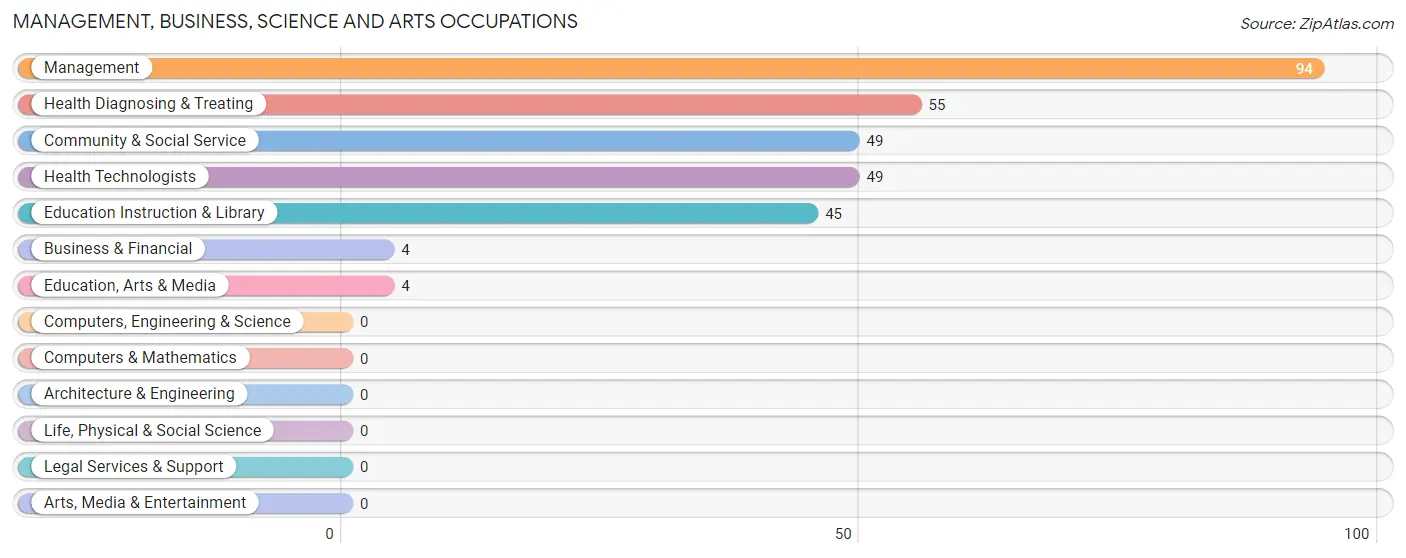
Management, Business, Science and Arts Occupations
The most common Management, Business, Science and Arts occupations in Hoxie are Management (94 | 13.8%), Health Diagnosing & Treating (55 | 8.1%), Community & Social Service (49 | 7.2%), Health Technologists (49 | 7.2%), and Education Instruction & Library (45 | 6.6%).
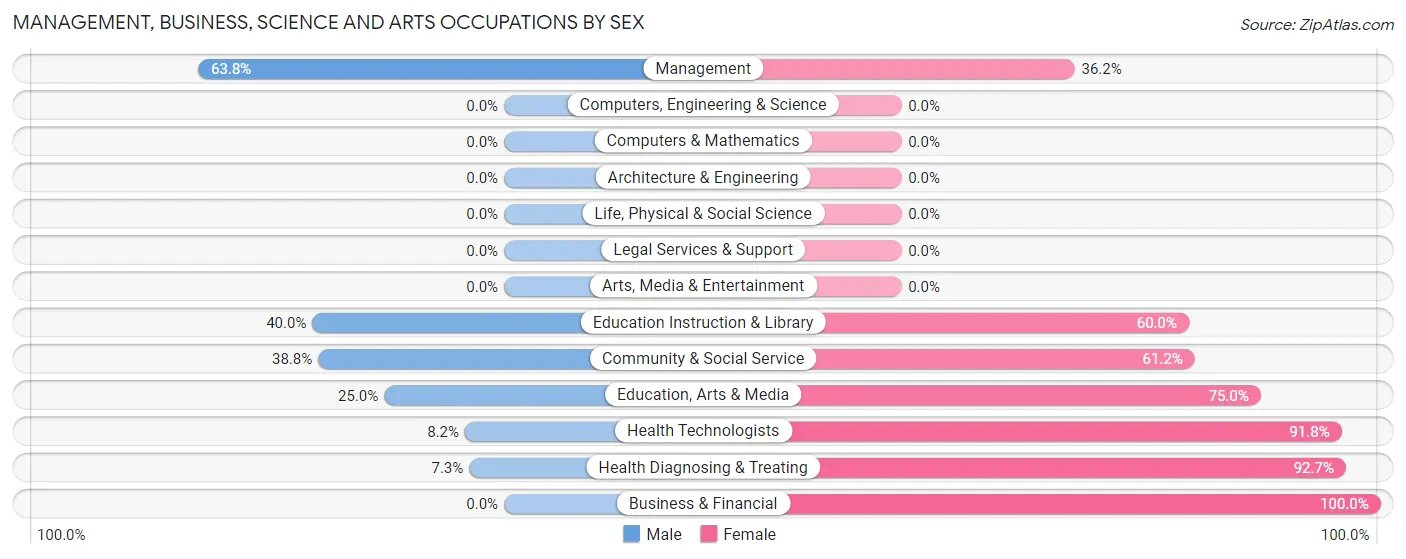
Management, Business, Science and Arts Occupations by Sex
Within the Management, Business, Science and Arts occupations in Hoxie, the most male-oriented occupations are Management (63.8%), Education Instruction & Library (40.0%), and Community & Social Service (38.8%), while the most female-oriented occupations are Business & Financial (100.0%), Health Diagnosing & Treating (92.7%), and Health Technologists (91.8%).
| Occupation | Male | Female |
| Management | 60 (63.8%) | 34 (36.2%) |
| Business & Financial | 0 (0.0%) | 4 (100.0%) |
| Computers, Engineering & Science | 0 (0.0%) | 0 (0.0%) |
| Computers & Mathematics | 0 (0.0%) | 0 (0.0%) |
| Architecture & Engineering | 0 (0.0%) | 0 (0.0%) |
| Life, Physical & Social Science | 0 (0.0%) | 0 (0.0%) |
| Community & Social Service | 19 (38.8%) | 30 (61.2%) |
| Education, Arts & Media | 1 (25.0%) | 3 (75.0%) |
| Legal Services & Support | 0 (0.0%) | 0 (0.0%) |
| Education Instruction & Library | 18 (40.0%) | 27 (60.0%) |
| Arts, Media & Entertainment | 0 (0.0%) | 0 (0.0%) |
| Health Diagnosing & Treating | 4 (7.3%) | 51 (92.7%) |
| Health Technologists | 4 (8.2%) | 45 (91.8%) |
| Total (Category) | 83 (41.1%) | 119 (58.9%) |
| Total (Overall) | 363 (53.4%) | 317 (46.6%) |
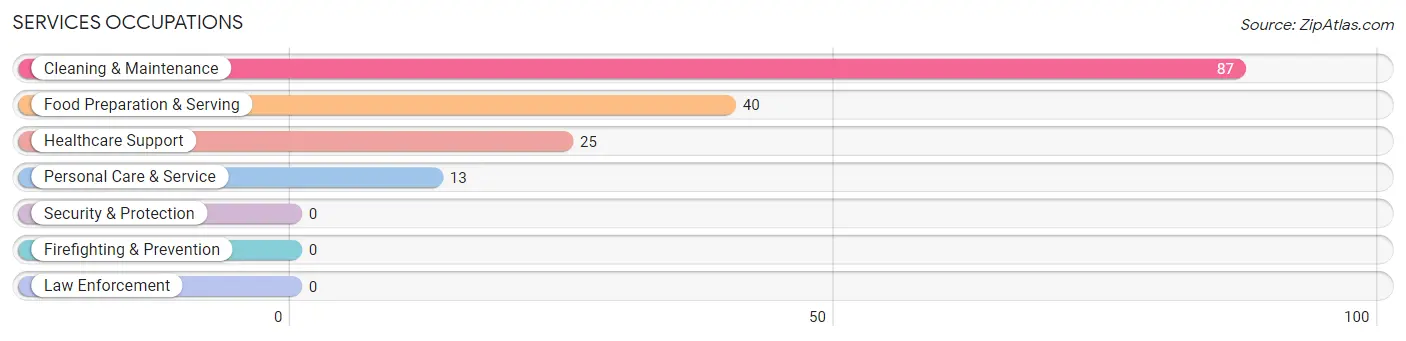
Services Occupations
The most common Services occupations in Hoxie are Cleaning & Maintenance (87 | 12.8%), Food Preparation & Serving (40 | 5.9%), Healthcare Support (25 | 3.7%), and Personal Care & Service (13 | 1.9%).
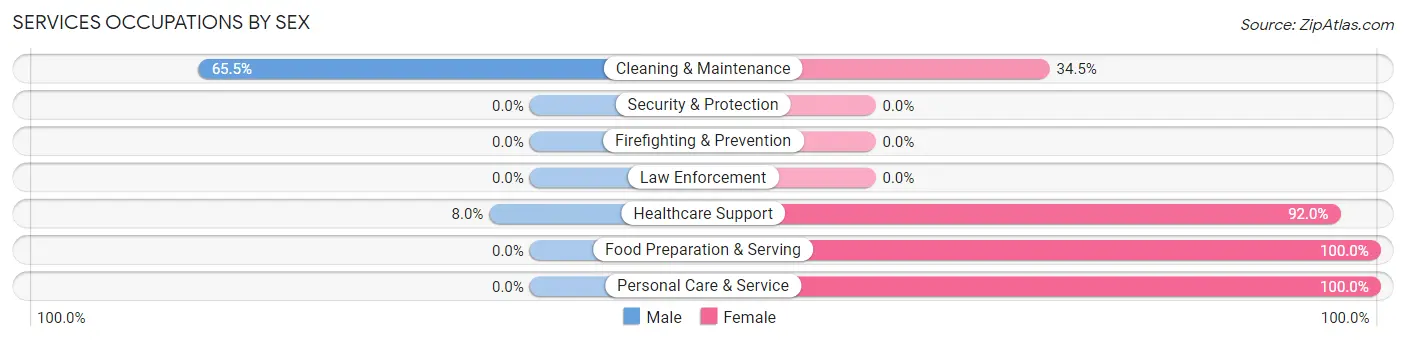
Services Occupations by Sex
Within the Services occupations in Hoxie, the most male-oriented occupations are Cleaning & Maintenance (65.5%), and Healthcare Support (8.0%), while the most female-oriented occupations are Food Preparation & Serving (100.0%), Personal Care & Service (100.0%), and Healthcare Support (92.0%).
| Occupation | Male | Female |
| Healthcare Support | 2 (8.0%) | 23 (92.0%) |
| Security & Protection | 0 (0.0%) | 0 (0.0%) |
| Firefighting & Prevention | 0 (0.0%) | 0 (0.0%) |
| Law Enforcement | 0 (0.0%) | 0 (0.0%) |
| Food Preparation & Serving | 0 (0.0%) | 40 (100.0%) |
| Cleaning & Maintenance | 57 (65.5%) | 30 (34.5%) |
| Personal Care & Service | 0 (0.0%) | 13 (100.0%) |
| Total (Category) | 59 (35.8%) | 106 (64.2%) |
| Total (Overall) | 363 (53.4%) | 317 (46.6%) |
Sales and Office Occupations
The most common Sales and Office occupations in Hoxie are Office & Administration (67 | 9.9%), and Sales & Related (54 | 7.9%).
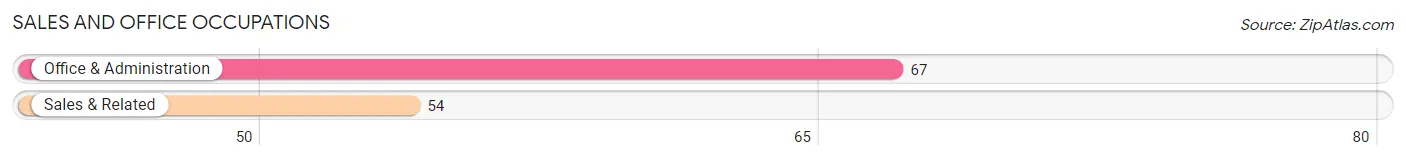
Sales and Office Occupations by Sex
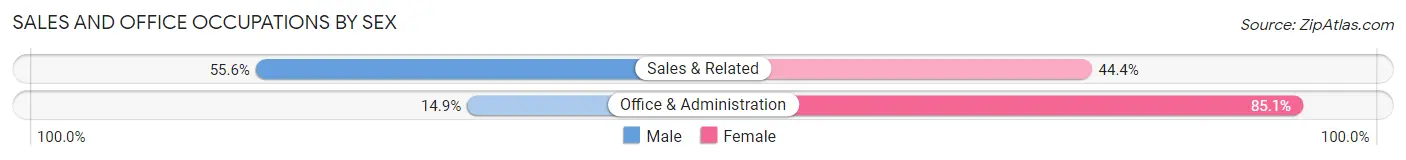
| Occupation | Male | Female |
| Sales & Related | 30 (55.6%) | 24 (44.4%) |
| Office & Administration | 10 (14.9%) | 57 (85.1%) |
| Total (Category) | 40 (33.1%) | 81 (66.9%) |
| Total (Overall) | 363 (53.4%) | 317 (46.6%) |
Natural Resources, Construction and Maintenance Occupations
The most common Natural Resources, Construction and Maintenance occupations in Hoxie are Farming, Fishing & Forestry (37 | 5.4%), Construction & Extraction (35 | 5.1%), and Installation, Maintenance & Repair (35 | 5.1%).
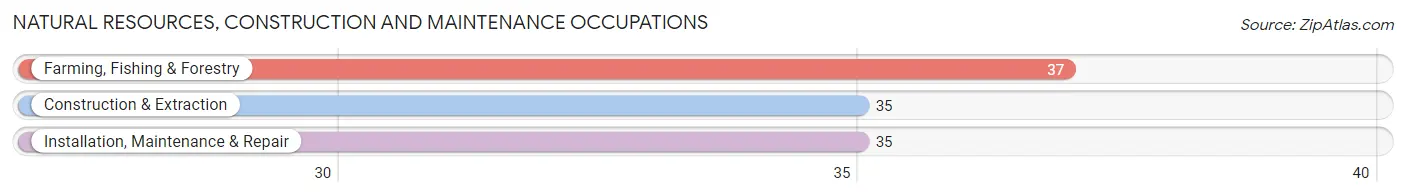
Natural Resources, Construction and Maintenance Occupations by Sex
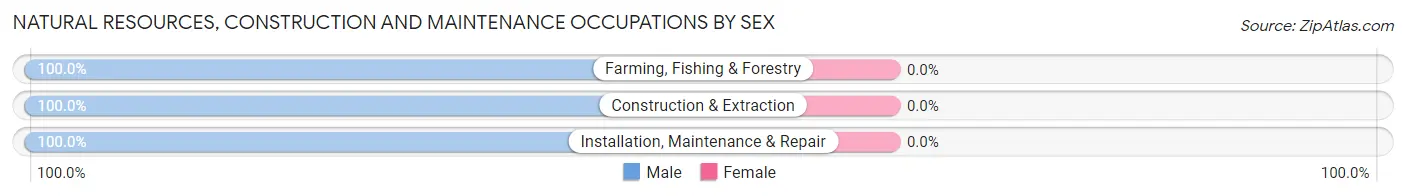
| Occupation | Male | Female |
| Farming, Fishing & Forestry | 37 (100.0%) | 0 (0.0%) |
| Construction & Extraction | 35 (100.0%) | 0 (0.0%) |
| Installation, Maintenance & Repair | 35 (100.0%) | 0 (0.0%) |
| Total (Category) | 107 (100.0%) | 0 (0.0%) |
| Total (Overall) | 363 (53.4%) | 317 (46.6%) |
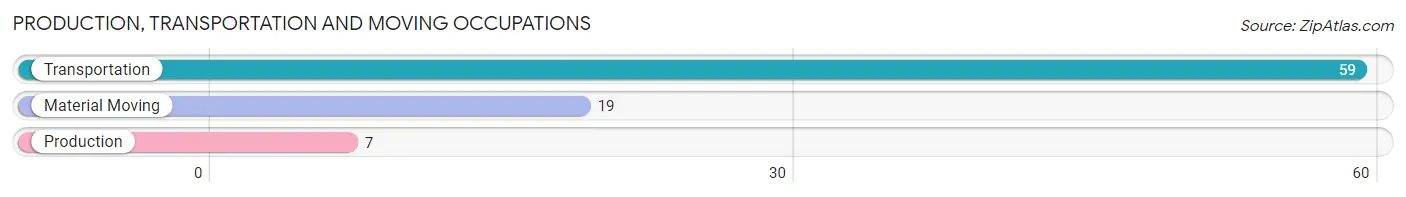
Production, Transportation and Moving Occupations
The most common Production, Transportation and Moving occupations in Hoxie are Transportation (59 | 8.7%), Material Moving (19 | 2.8%), and Production (7 | 1.0%).
Production, Transportation and Moving Occupations by Sex
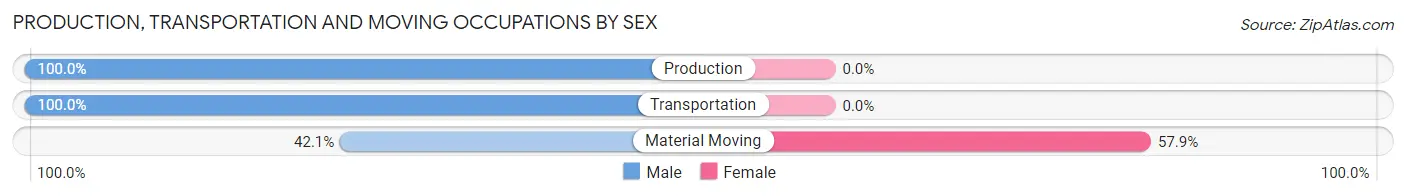
| Occupation | Male | Female |
| Production | 7 (100.0%) | 0 (0.0%) |
| Transportation | 59 (100.0%) | 0 (0.0%) |
| Material Moving | 8 (42.1%) | 11 (57.9%) |
| Total (Category) | 74 (87.1%) | 11 (12.9%) |
| Total (Overall) | 363 (53.4%) | 317 (46.6%) |
Employment Industries by Sex in Hoxie
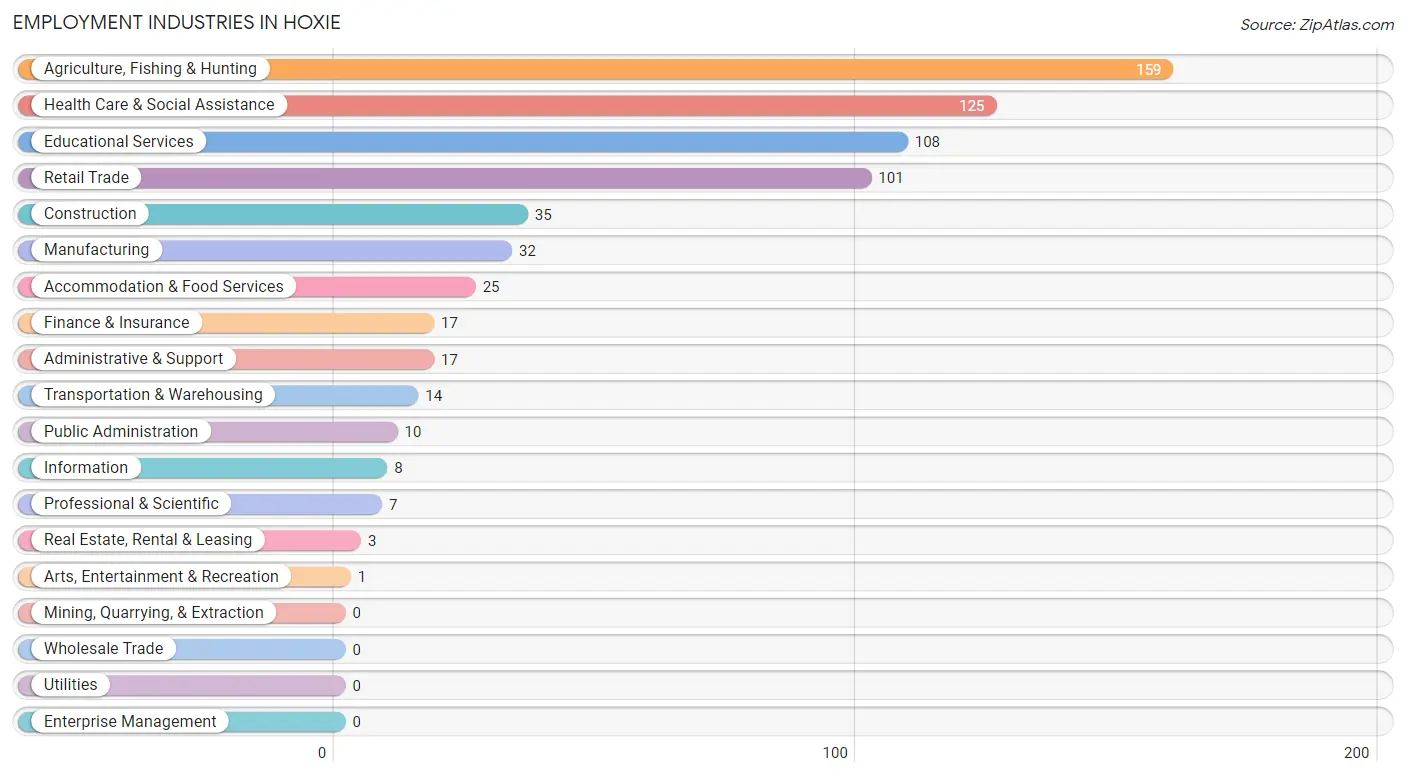
Employment Industries in Hoxie
The major employment industries in Hoxie include Agriculture, Fishing & Hunting (159 | 23.4%), Health Care & Social Assistance (125 | 18.4%), Educational Services (108 | 15.9%), Retail Trade (101 | 14.8%), and Construction (35 | 5.1%).
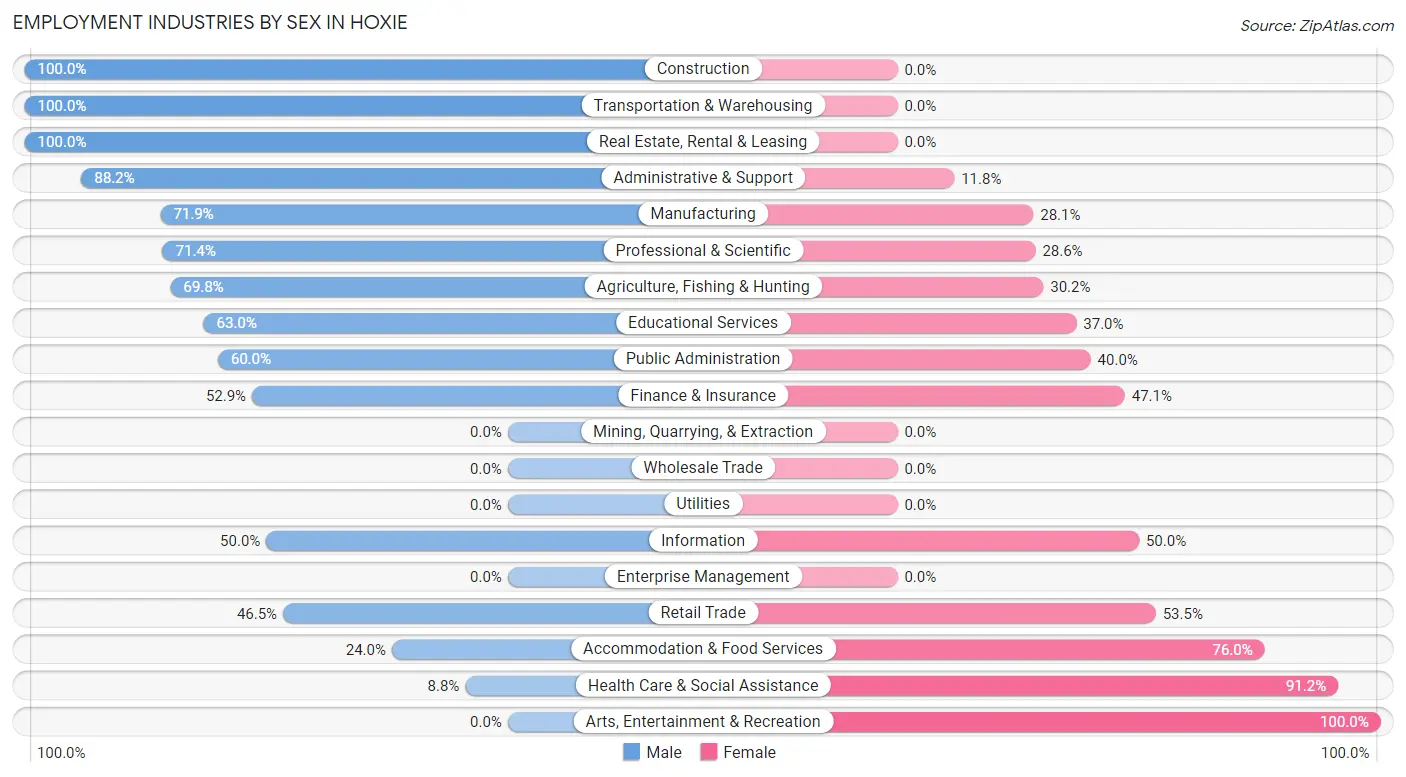
Employment Industries by Sex in Hoxie
The Hoxie industries that see more men than women are Construction (100.0%), Transportation & Warehousing (100.0%), and Real Estate, Rental & Leasing (100.0%), whereas the industries that tend to have a higher number of women are Arts, Entertainment & Recreation (100.0%), Health Care & Social Assistance (91.2%), and Accommodation & Food Services (76.0%).
| Industry | Male | Female |
| Agriculture, Fishing & Hunting | 111 (69.8%) | 48 (30.2%) |
| Mining, Quarrying, & Extraction | 0 (0.0%) | 0 (0.0%) |
| Construction | 35 (100.0%) | 0 (0.0%) |
| Manufacturing | 23 (71.9%) | 9 (28.1%) |
| Wholesale Trade | 0 (0.0%) | 0 (0.0%) |
| Retail Trade | 47 (46.5%) | 54 (53.5%) |
| Transportation & Warehousing | 14 (100.0%) | 0 (0.0%) |
| Utilities | 0 (0.0%) | 0 (0.0%) |
| Information | 4 (50.0%) | 4 (50.0%) |
| Finance & Insurance | 9 (52.9%) | 8 (47.1%) |
| Real Estate, Rental & Leasing | 3 (100.0%) | 0 (0.0%) |
| Professional & Scientific | 5 (71.4%) | 2 (28.6%) |
| Enterprise Management | 0 (0.0%) | 0 (0.0%) |
| Administrative & Support | 15 (88.2%) | 2 (11.8%) |
| Educational Services | 68 (63.0%) | 40 (37.0%) |
| Health Care & Social Assistance | 11 (8.8%) | 114 (91.2%) |
| Arts, Entertainment & Recreation | 0 (0.0%) | 1 (100.0%) |
| Accommodation & Food Services | 6 (24.0%) | 19 (76.0%) |
| Public Administration | 6 (60.0%) | 4 (40.0%) |
| Total | 363 (53.4%) | 317 (46.6%) |
Education in Hoxie
School Enrollment in Hoxie
The most common levels of schooling among the 423 students in Hoxie are elementary school (129 | 30.5%), high school (107 | 25.3%), and middle school (86 | 20.3%).
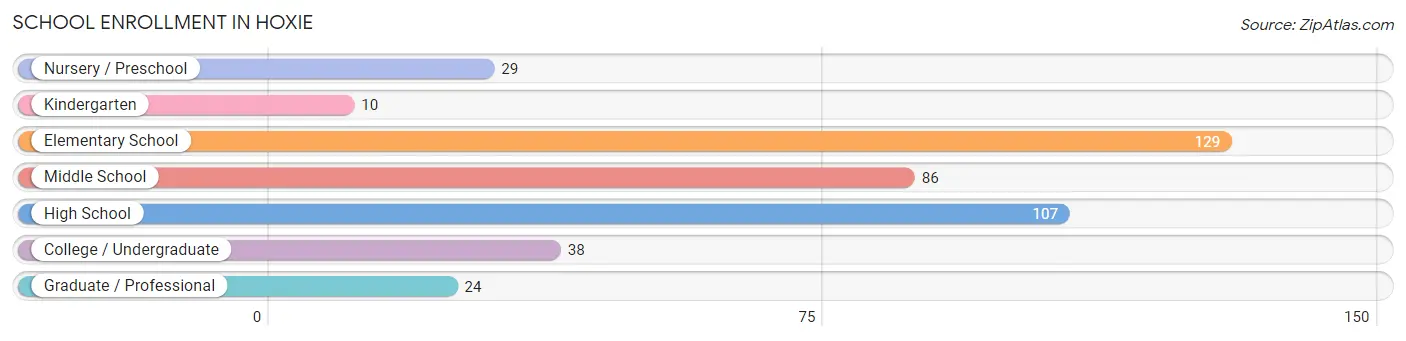
| School Level | # Students | % Students |
| Nursery / Preschool | 29 | 6.9% |
| Kindergarten | 10 | 2.4% |
| Elementary School | 129 | 30.5% |
| Middle School | 86 | 20.3% |
| High School | 107 | 25.3% |
| College / Undergraduate | 38 | 9.0% |
| Graduate / Professional | 24 | 5.7% |
| Total | 423 | 100.0% |
School Enrollment by Age by Funding Source in Hoxie
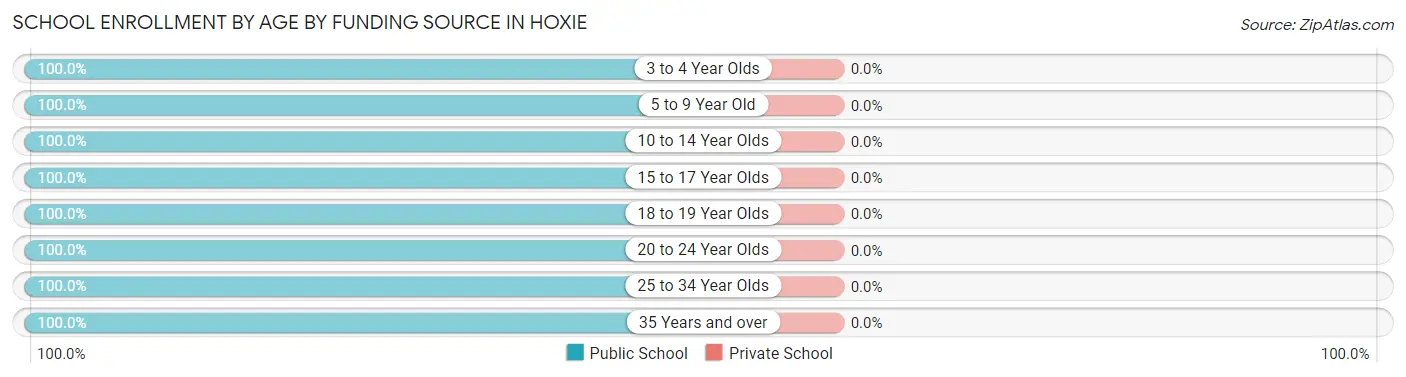
| Age Bracket | Public School | Private School |
| 3 to 4 Year Olds | 26 (100.0%) | 0 (0.0%) |
| 5 to 9 Year Old | 117 (100.0%) | 0 (0.0%) |
| 10 to 14 Year Olds | 113 (100.0%) | 0 (0.0%) |
| 15 to 17 Year Olds | 75 (100.0%) | 0 (0.0%) |
| 18 to 19 Year Olds | 30 (100.0%) | 0 (0.0%) |
| 20 to 24 Year Olds | 9 (100.0%) | 0 (0.0%) |
| 25 to 34 Year Olds | 21 (100.0%) | 0 (0.0%) |
| 35 Years and over | 32 (100.0%) | 0 (0.0%) |
| Total | 423 (100.0%) | 0 (0.0%) |
Educational Attainment by Field of Study in Hoxie
Education (107 | 39.3%), bio, nature & agricultural (51 | 18.8%), visual & performing arts (30 | 11.0%), science & technology (24 | 8.8%), and social sciences (16 | 5.9%) are the most common fields of study among 272 individuals in Hoxie who have obtained a bachelor's degree or higher.
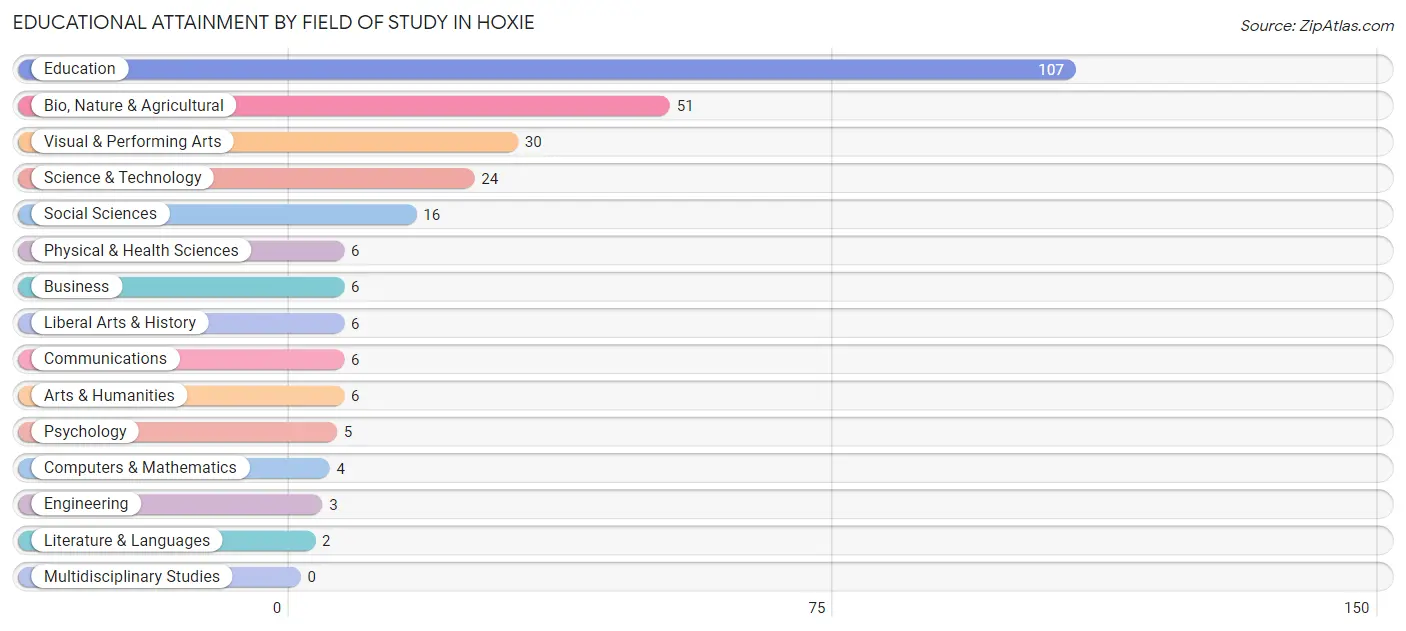
| Field of Study | # Graduates | % Graduates |
| Computers & Mathematics | 4 | 1.5% |
| Bio, Nature & Agricultural | 51 | 18.8% |
| Physical & Health Sciences | 6 | 2.2% |
| Psychology | 5 | 1.8% |
| Social Sciences | 16 | 5.9% |
| Engineering | 3 | 1.1% |
| Multidisciplinary Studies | 0 | 0.0% |
| Science & Technology | 24 | 8.8% |
| Business | 6 | 2.2% |
| Education | 107 | 39.3% |
| Literature & Languages | 2 | 0.7% |
| Liberal Arts & History | 6 | 2.2% |
| Visual & Performing Arts | 30 | 11.0% |
| Communications | 6 | 2.2% |
| Arts & Humanities | 6 | 2.2% |
| Total | 272 | 100.0% |
Transportation & Commute in Hoxie
Vehicle Availability by Sex in Hoxie
The most prevalent vehicle ownership categories in Hoxie are males with 3 vehicles (122, accounting for 33.8%) and females with 3 vehicles (58, making up 40.0%).
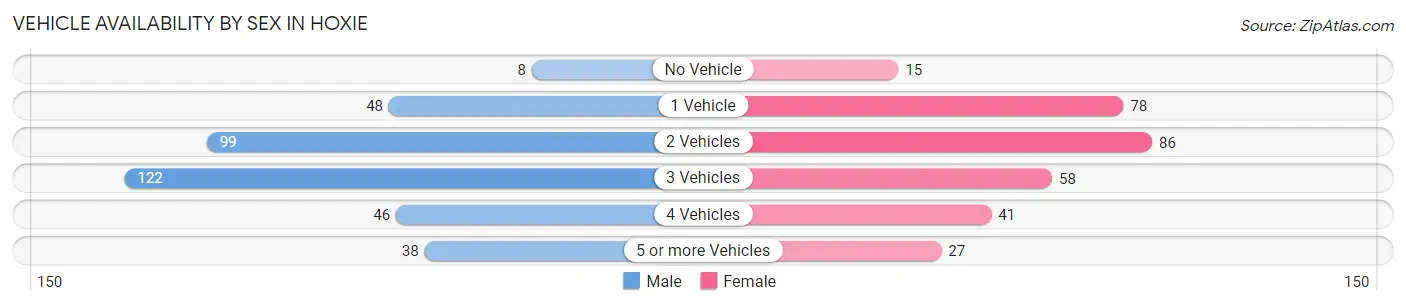
| Vehicles Available | Male | Female |
| No Vehicle | 8 (2.2%) | 15 (4.9%) |
| 1 Vehicle | 48 (13.3%) | 78 (25.6%) |
| 2 Vehicles | 99 (27.4%) | 86 (28.2%) |
| 3 Vehicles | 122 (33.8%) | 58 (19.0%) |
| 4 Vehicles | 46 (12.7%) | 41 (13.4%) |
| 5 or more Vehicles | 38 (10.5%) | 27 (8.8%) |
| Total | 361 (100.0%) | 305 (100.0%) |
Commute Time in Hoxie
The most frequently occuring commute durations in Hoxie are less than 5 minutes (228 commuters, 38.5%), 5 to 9 minutes (156 commuters, 26.3%), and 10 to 14 minutes (51 commuters, 8.6%).
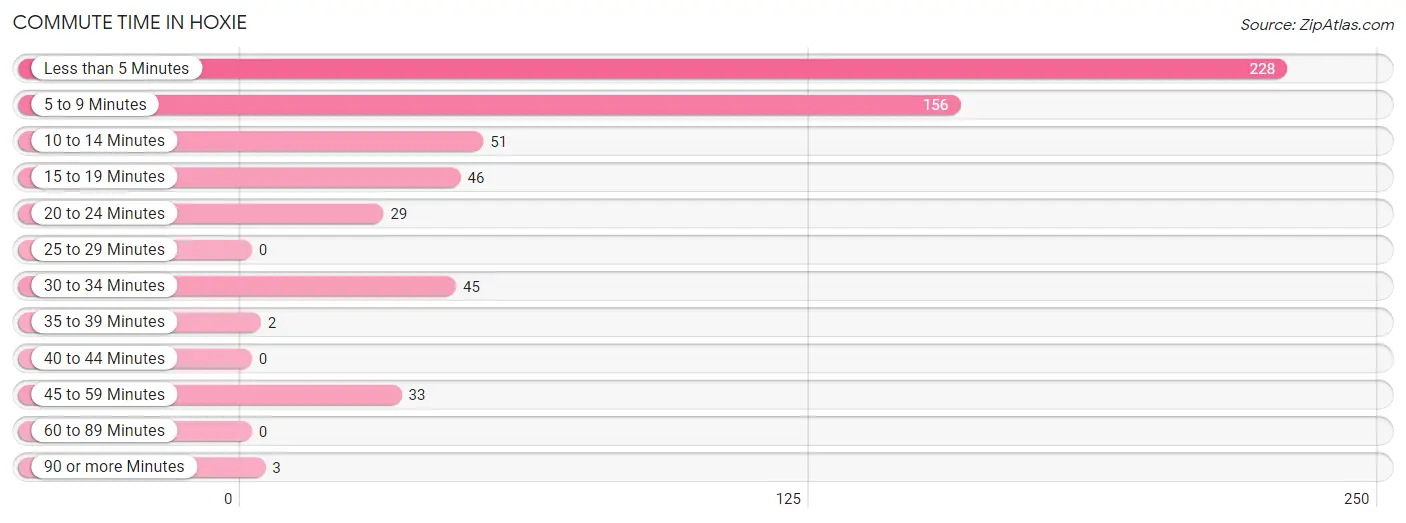
| Commute Time | # Commuters | % Commuters |
| Less than 5 Minutes | 228 | 38.5% |
| 5 to 9 Minutes | 156 | 26.3% |
| 10 to 14 Minutes | 51 | 8.6% |
| 15 to 19 Minutes | 46 | 7.8% |
| 20 to 24 Minutes | 29 | 4.9% |
| 25 to 29 Minutes | 0 | 0.0% |
| 30 to 34 Minutes | 45 | 7.6% |
| 35 to 39 Minutes | 2 | 0.3% |
| 40 to 44 Minutes | 0 | 0.0% |
| 45 to 59 Minutes | 33 | 5.6% |
| 60 to 89 Minutes | 0 | 0.0% |
| 90 or more Minutes | 3 | 0.5% |
Commute Time by Sex in Hoxie
The most common commute times in Hoxie are less than 5 minutes (124 commuters, 38.3%) for males and less than 5 minutes (104 commuters, 38.7%) for females.
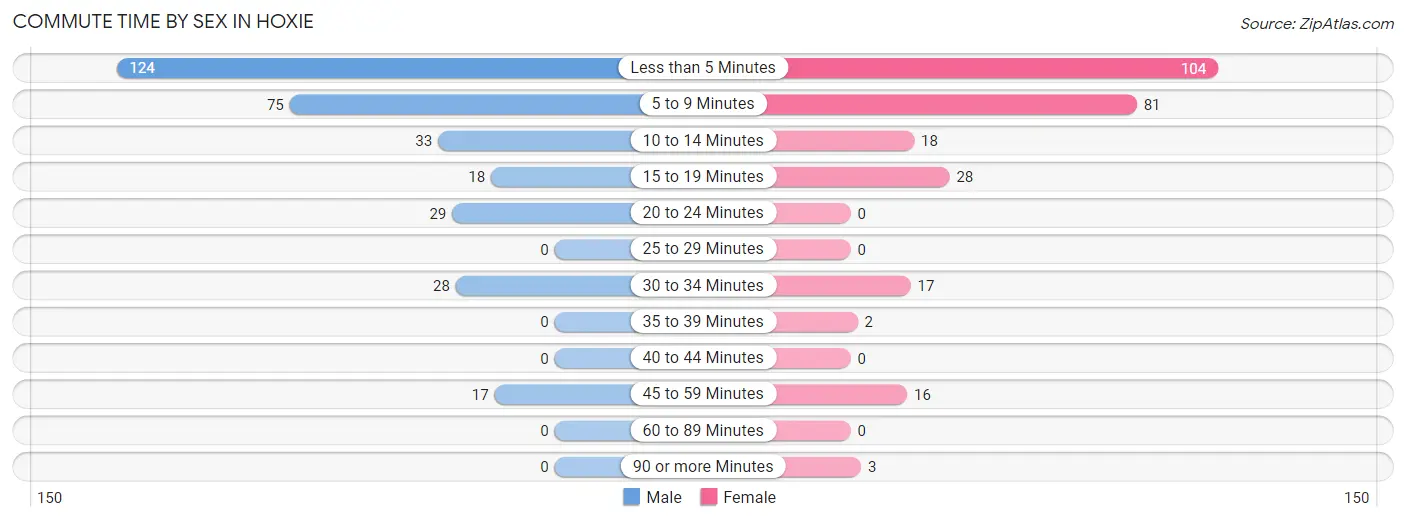
| Commute Time | Male | Female |
| Less than 5 Minutes | 124 (38.3%) | 104 (38.7%) |
| 5 to 9 Minutes | 75 (23.2%) | 81 (30.1%) |
| 10 to 14 Minutes | 33 (10.2%) | 18 (6.7%) |
| 15 to 19 Minutes | 18 (5.6%) | 28 (10.4%) |
| 20 to 24 Minutes | 29 (8.9%) | 0 (0.0%) |
| 25 to 29 Minutes | 0 (0.0%) | 0 (0.0%) |
| 30 to 34 Minutes | 28 (8.6%) | 17 (6.3%) |
| 35 to 39 Minutes | 0 (0.0%) | 2 (0.7%) |
| 40 to 44 Minutes | 0 (0.0%) | 0 (0.0%) |
| 45 to 59 Minutes | 17 (5.2%) | 16 (5.9%) |
| 60 to 89 Minutes | 0 (0.0%) | 0 (0.0%) |
| 90 or more Minutes | 0 (0.0%) | 3 (1.1%) |
Time of Departure to Work by Sex in Hoxie
The most frequent times of departure to work in Hoxie are 7:30 AM to 7:59 AM (108, 33.3%) for males and 12:00 PM to 3:59 PM (43, 16.0%) for females.
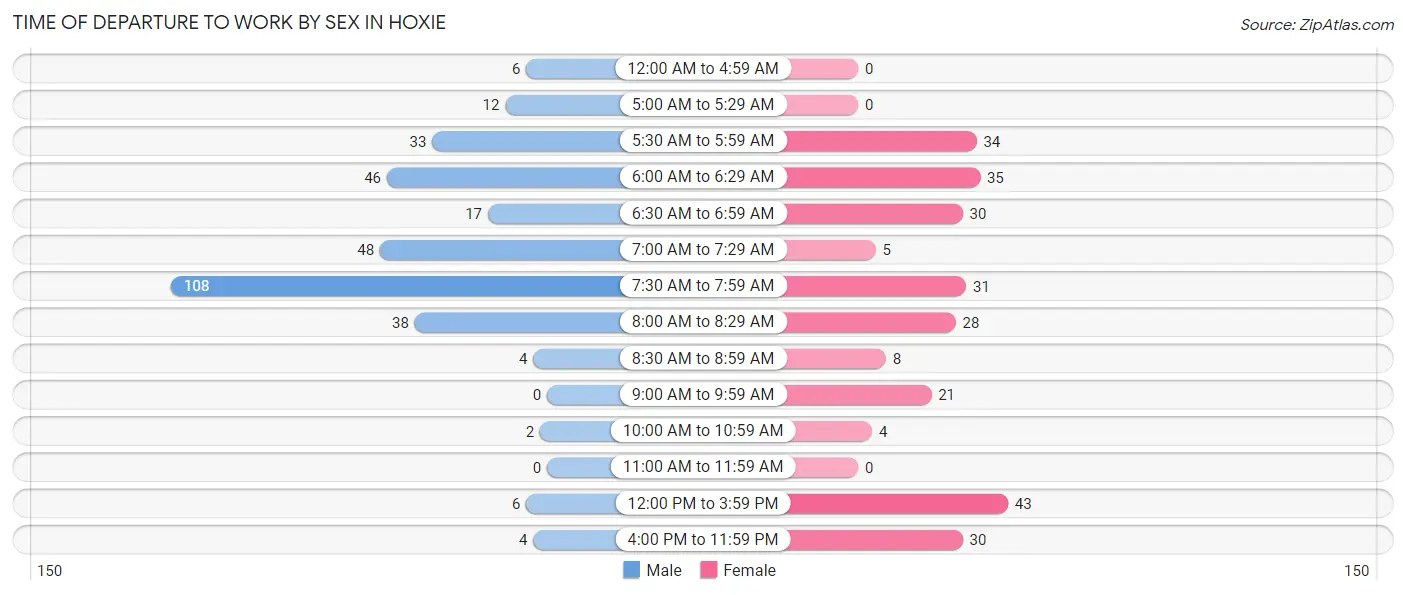
| Time of Departure | Male | Female |
| 12:00 AM to 4:59 AM | 6 (1.8%) | 0 (0.0%) |
| 5:00 AM to 5:29 AM | 12 (3.7%) | 0 (0.0%) |
| 5:30 AM to 5:59 AM | 33 (10.2%) | 34 (12.6%) |
| 6:00 AM to 6:29 AM | 46 (14.2%) | 35 (13.0%) |
| 6:30 AM to 6:59 AM | 17 (5.2%) | 30 (11.2%) |
| 7:00 AM to 7:29 AM | 48 (14.8%) | 5 (1.9%) |
| 7:30 AM to 7:59 AM | 108 (33.3%) | 31 (11.5%) |
| 8:00 AM to 8:29 AM | 38 (11.7%) | 28 (10.4%) |
| 8:30 AM to 8:59 AM | 4 (1.2%) | 8 (3.0%) |
| 9:00 AM to 9:59 AM | 0 (0.0%) | 21 (7.8%) |
| 10:00 AM to 10:59 AM | 2 (0.6%) | 4 (1.5%) |
| 11:00 AM to 11:59 AM | 0 (0.0%) | 0 (0.0%) |
| 12:00 PM to 3:59 PM | 6 (1.8%) | 43 (16.0%) |
| 4:00 PM to 11:59 PM | 4 (1.2%) | 30 (11.2%) |
| Total | 324 (100.0%) | 269 (100.0%) |
Housing Occupancy in Hoxie
Occupancy by Ownership in Hoxie
Of the total 519 dwellings in Hoxie, owner-occupied units account for 362 (69.8%), while renter-occupied units make up 157 (30.2%).
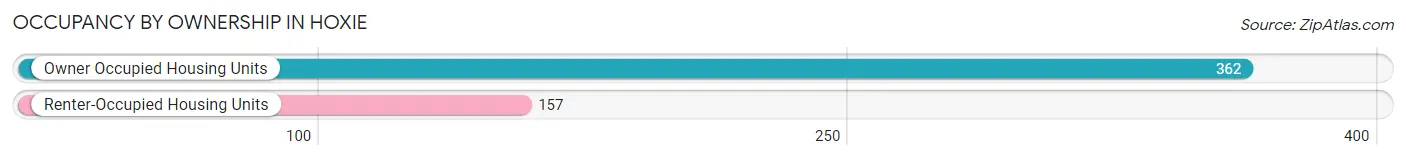
| Occupancy | # Housing Units | % Housing Units |
| Owner Occupied Housing Units | 362 | 69.8% |
| Renter-Occupied Housing Units | 157 | 30.2% |
| Total Occupied Housing Units | 519 | 100.0% |
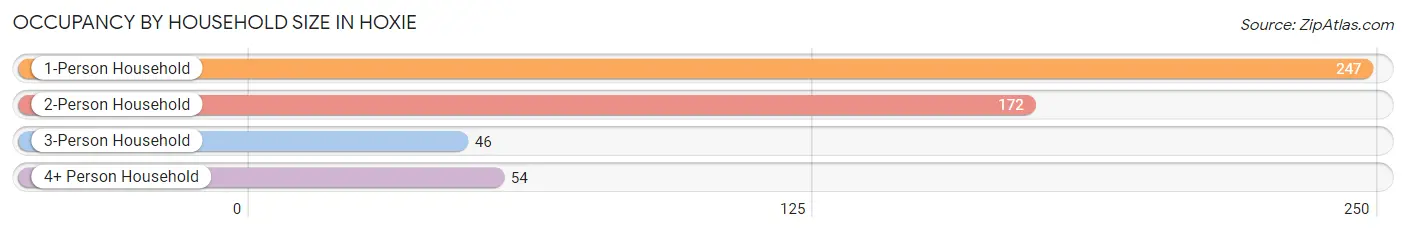
Occupancy by Household Size in Hoxie
| Household Size | # Housing Units | % Housing Units |
| 1-Person Household | 247 | 47.6% |
| 2-Person Household | 172 | 33.1% |
| 3-Person Household | 46 | 8.9% |
| 4+ Person Household | 54 | 10.4% |
| Total Housing Units | 519 | 100.0% |
Occupancy by Ownership by Household Size in Hoxie
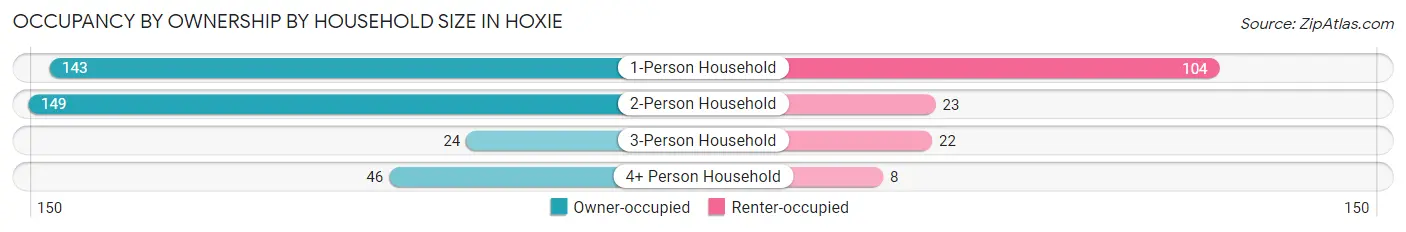
| Household Size | Owner-occupied | Renter-occupied |
| 1-Person Household | 143 (57.9%) | 104 (42.1%) |
| 2-Person Household | 149 (86.6%) | 23 (13.4%) |
| 3-Person Household | 24 (52.2%) | 22 (47.8%) |
| 4+ Person Household | 46 (85.2%) | 8 (14.8%) |
| Total Housing Units | 362 (69.8%) | 157 (30.2%) |
Occupancy by Educational Attainment in Hoxie
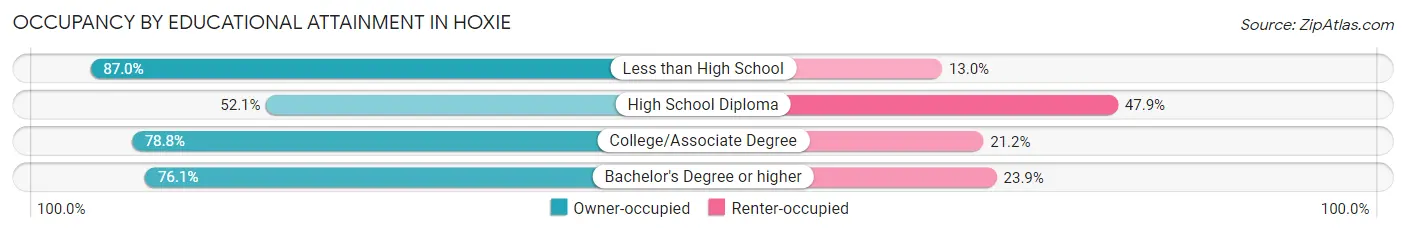
| Household Size | Owner-occupied | Renter-occupied |
| Less than High School | 20 (87.0%) | 3 (13.0%) |
| High School Diploma | 88 (52.1%) | 81 (47.9%) |
| College/Associate Degree | 152 (78.8%) | 41 (21.2%) |
| Bachelor's Degree or higher | 102 (76.1%) | 32 (23.9%) |
Occupancy by Age of Householder in Hoxie
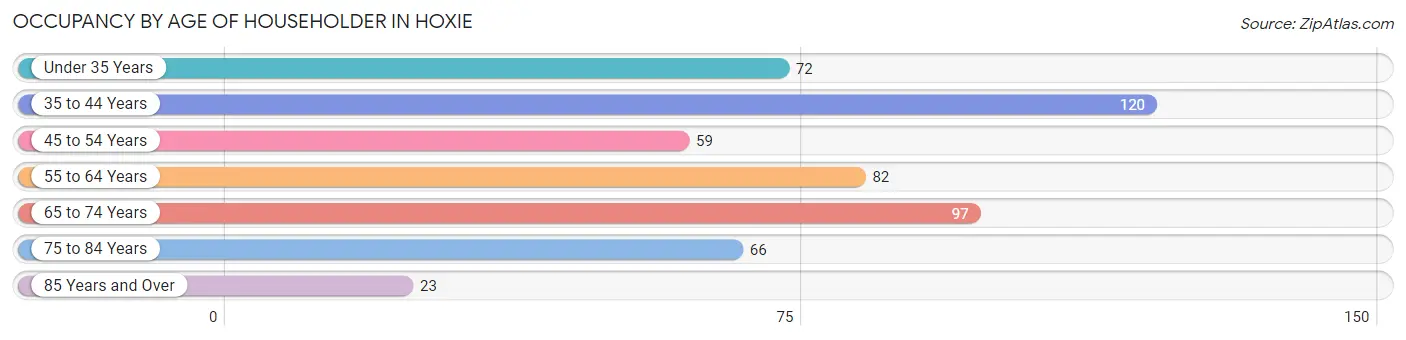
| Age Bracket | # Households | % Households |
| Under 35 Years | 72 | 13.9% |
| 35 to 44 Years | 120 | 23.1% |
| 45 to 54 Years | 59 | 11.4% |
| 55 to 64 Years | 82 | 15.8% |
| 65 to 74 Years | 97 | 18.7% |
| 75 to 84 Years | 66 | 12.7% |
| 85 Years and Over | 23 | 4.4% |
| Total | 519 | 100.0% |
Housing Finances in Hoxie
Median Income by Occupancy in Hoxie
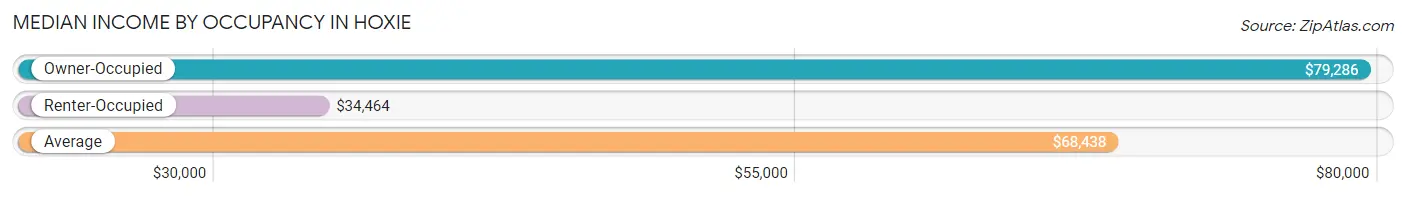
| Occupancy Type | # Households | Median Income |
| Owner-Occupied | 362 (69.8%) | $79,286 |
| Renter-Occupied | 157 (30.2%) | $34,464 |
| Average | 519 (100.0%) | $68,438 |
Occupancy by Householder Income Bracket in Hoxie
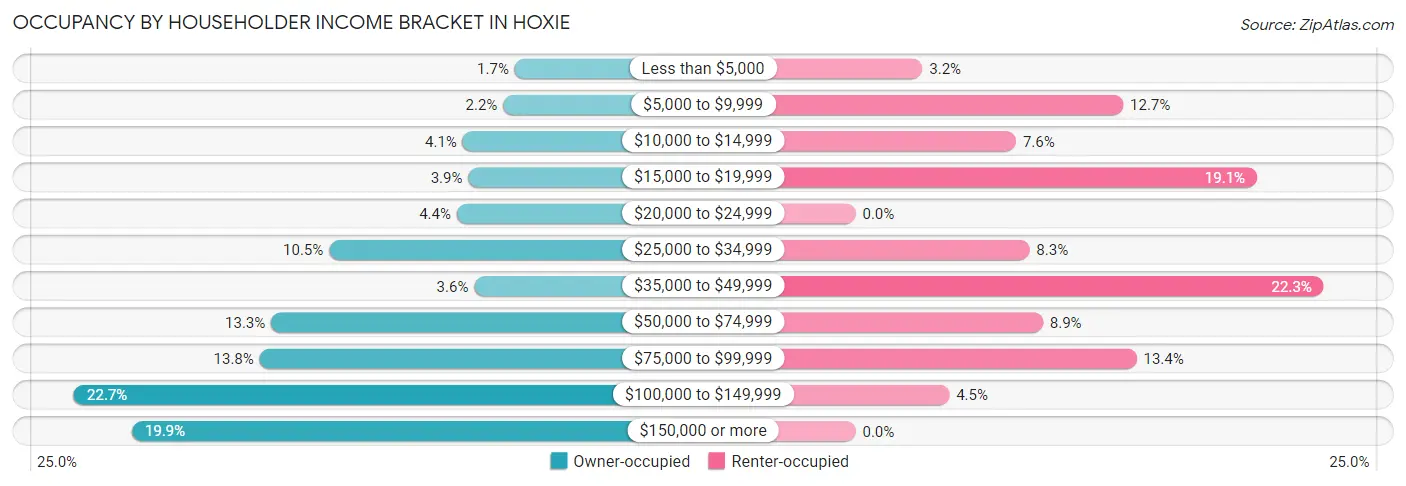
| Income Bracket | Owner-occupied | Renter-occupied |
| Less than $5,000 | 6 (1.7%) | 5 (3.2%) |
| $5,000 to $9,999 | 8 (2.2%) | 20 (12.7%) |
| $10,000 to $14,999 | 15 (4.1%) | 12 (7.6%) |
| $15,000 to $19,999 | 14 (3.9%) | 30 (19.1%) |
| $20,000 to $24,999 | 16 (4.4%) | 0 (0.0%) |
| $25,000 to $34,999 | 38 (10.5%) | 13 (8.3%) |
| $35,000 to $49,999 | 13 (3.6%) | 35 (22.3%) |
| $50,000 to $74,999 | 48 (13.3%) | 14 (8.9%) |
| $75,000 to $99,999 | 50 (13.8%) | 21 (13.4%) |
| $100,000 to $149,999 | 82 (22.7%) | 7 (4.5%) |
| $150,000 or more | 72 (19.9%) | 0 (0.0%) |
| Total | 362 (100.0%) | 157 (100.0%) |
Monthly Housing Cost Tiers in Hoxie
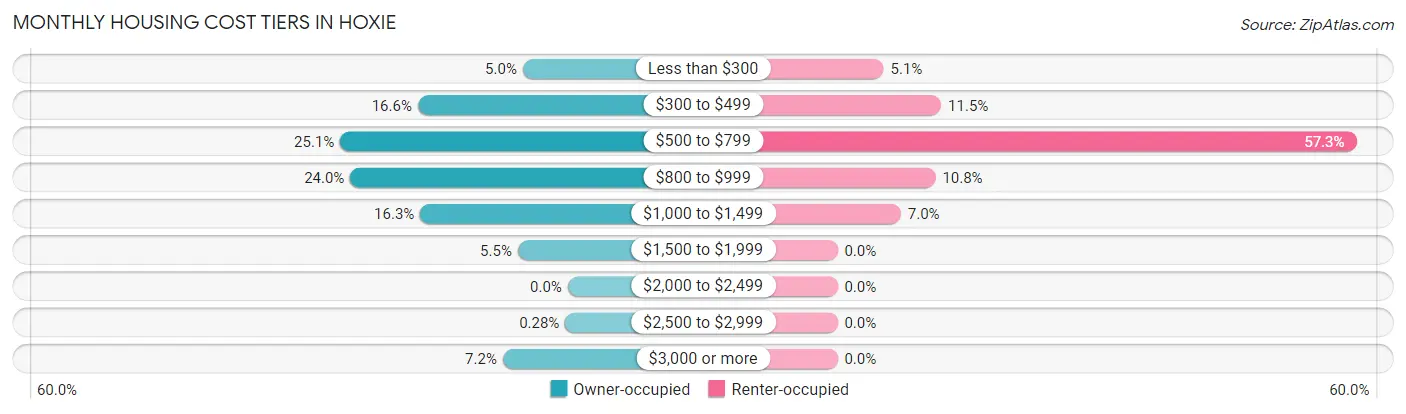
| Monthly Cost | Owner-occupied | Renter-occupied |
| Less than $300 | 18 (5.0%) | 8 (5.1%) |
| $300 to $499 | 60 (16.6%) | 18 (11.5%) |
| $500 to $799 | 91 (25.1%) | 90 (57.3%) |
| $800 to $999 | 87 (24.0%) | 17 (10.8%) |
| $1,000 to $1,499 | 59 (16.3%) | 11 (7.0%) |
| $1,500 to $1,999 | 20 (5.5%) | 0 (0.0%) |
| $2,000 to $2,499 | 0 (0.0%) | 0 (0.0%) |
| $2,500 to $2,999 | 1 (0.3%) | 0 (0.0%) |
| $3,000 or more | 26 (7.2%) | 0 (0.0%) |
| Total | 362 (100.0%) | 157 (100.0%) |
Physical Housing Characteristics in Hoxie
Housing Structures in Hoxie
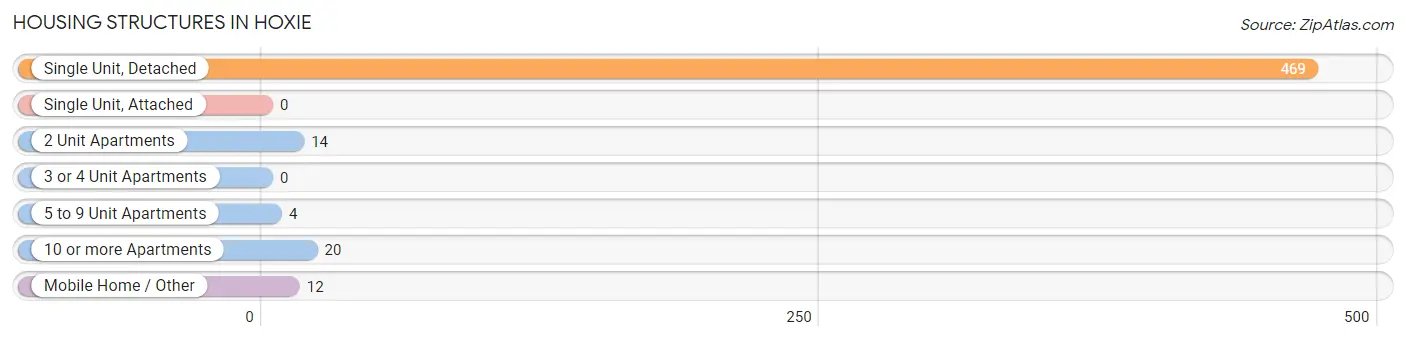
| Structure Type | # Housing Units | % Housing Units |
| Single Unit, Detached | 469 | 90.4% |
| Single Unit, Attached | 0 | 0.0% |
| 2 Unit Apartments | 14 | 2.7% |
| 3 or 4 Unit Apartments | 0 | 0.0% |
| 5 to 9 Unit Apartments | 4 | 0.8% |
| 10 or more Apartments | 20 | 3.8% |
| Mobile Home / Other | 12 | 2.3% |
| Total | 519 | 100.0% |
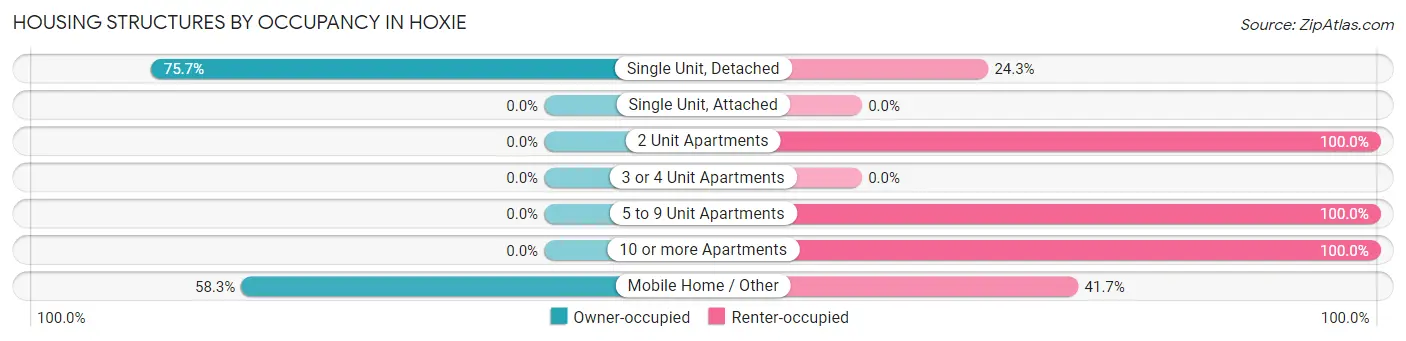
Housing Structures by Occupancy in Hoxie
| Structure Type | Owner-occupied | Renter-occupied |
| Single Unit, Detached | 355 (75.7%) | 114 (24.3%) |
| Single Unit, Attached | 0 (0.0%) | 0 (0.0%) |
| 2 Unit Apartments | 0 (0.0%) | 14 (100.0%) |
| 3 or 4 Unit Apartments | 0 (0.0%) | 0 (0.0%) |
| 5 to 9 Unit Apartments | 0 (0.0%) | 4 (100.0%) |
| 10 or more Apartments | 0 (0.0%) | 20 (100.0%) |
| Mobile Home / Other | 7 (58.3%) | 5 (41.7%) |
| Total | 362 (69.8%) | 157 (30.2%) |
Housing Structures by Number of Rooms in Hoxie
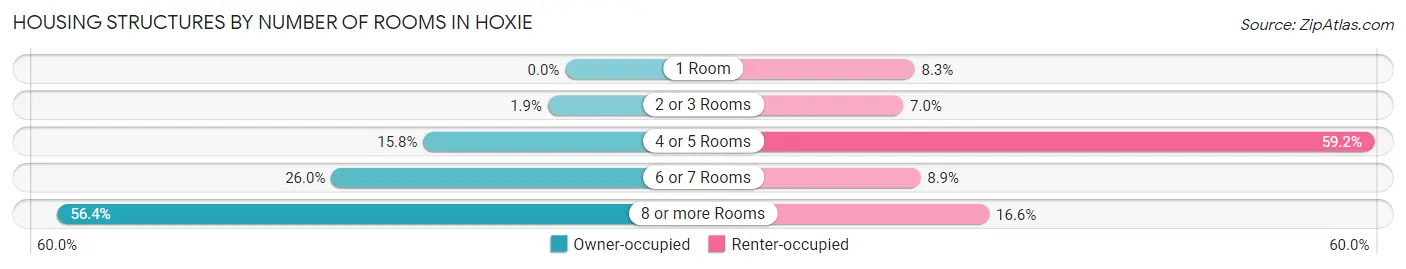
| Number of Rooms | Owner-occupied | Renter-occupied |
| 1 Room | 0 (0.0%) | 13 (8.3%) |
| 2 or 3 Rooms | 7 (1.9%) | 11 (7.0%) |
| 4 or 5 Rooms | 57 (15.8%) | 93 (59.2%) |
| 6 or 7 Rooms | 94 (26.0%) | 14 (8.9%) |
| 8 or more Rooms | 204 (56.4%) | 26 (16.6%) |
| Total | 362 (100.0%) | 157 (100.0%) |
Housing Structure by Heating Type in Hoxie
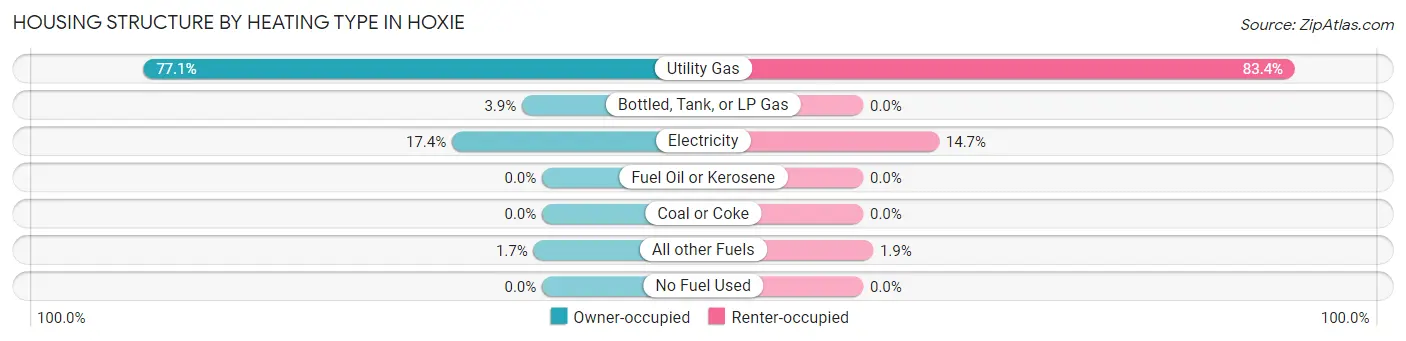
| Heating Type | Owner-occupied | Renter-occupied |
| Utility Gas | 279 (77.1%) | 131 (83.4%) |
| Bottled, Tank, or LP Gas | 14 (3.9%) | 0 (0.0%) |
| Electricity | 63 (17.4%) | 23 (14.6%) |
| Fuel Oil or Kerosene | 0 (0.0%) | 0 (0.0%) |
| Coal or Coke | 0 (0.0%) | 0 (0.0%) |
| All other Fuels | 6 (1.7%) | 3 (1.9%) |
| No Fuel Used | 0 (0.0%) | 0 (0.0%) |
| Total | 362 (100.0%) | 157 (100.0%) |
Household Vehicle Usage in Hoxie
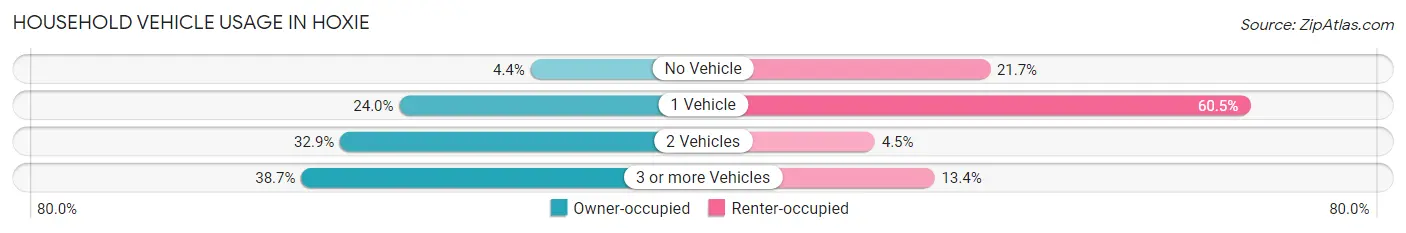
| Vehicles per Household | Owner-occupied | Renter-occupied |
| No Vehicle | 16 (4.4%) | 34 (21.7%) |
| 1 Vehicle | 87 (24.0%) | 95 (60.5%) |
| 2 Vehicles | 119 (32.9%) | 7 (4.5%) |
| 3 or more Vehicles | 140 (38.7%) | 21 (13.4%) |
| Total | 362 (100.0%) | 157 (100.0%) |
Real Estate & Mortgages in Hoxie
Real Estate and Mortgage Overview in Hoxie
| Characteristic | Without Mortgage | With Mortgage |
| Housing Units | 253 | 109 |
| Median Property Value | $160,100 | $140,300 |
| Median Household Income | $76,736 | $16 |
| Monthly Housing Costs | $580 | $26 |
| Real Estate Taxes | $2,509 | $0 |
Property Value by Mortgage Status in Hoxie
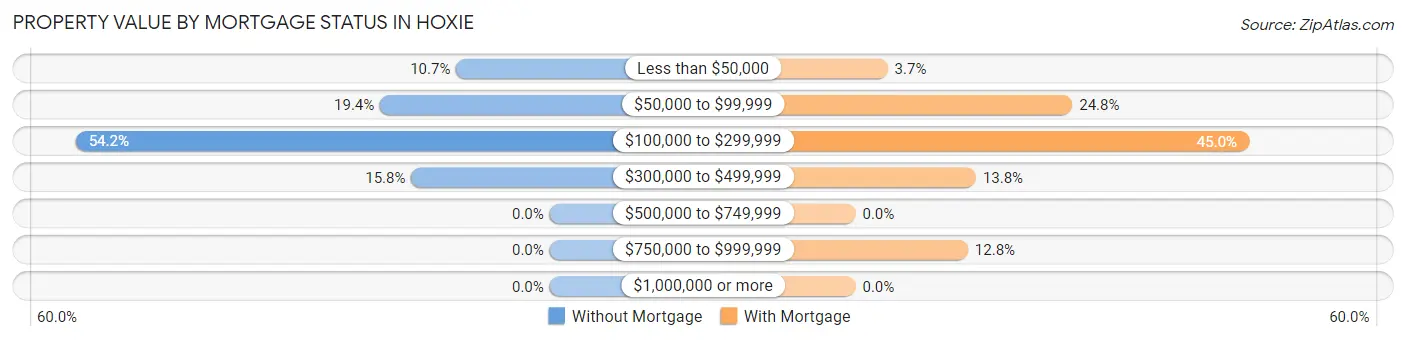
| Property Value | Without Mortgage | With Mortgage |
| Less than $50,000 | 27 (10.7%) | 4 (3.7%) |
| $50,000 to $99,999 | 49 (19.4%) | 27 (24.8%) |
| $100,000 to $299,999 | 137 (54.1%) | 49 (45.0%) |
| $300,000 to $499,999 | 40 (15.8%) | 15 (13.8%) |
| $500,000 to $749,999 | 0 (0.0%) | 0 (0.0%) |
| $750,000 to $999,999 | 0 (0.0%) | 14 (12.8%) |
| $1,000,000 or more | 0 (0.0%) | 0 (0.0%) |
| Total | 253 (100.0%) | 109 (100.0%) |
Household Income by Mortgage Status in Hoxie
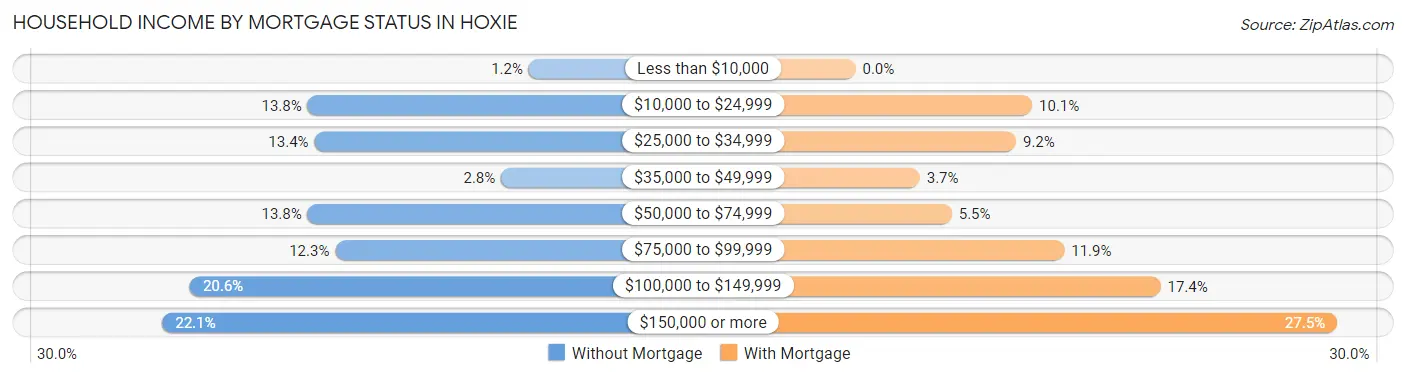
| Household Income | Without Mortgage | With Mortgage |
| Less than $10,000 | 3 (1.2%) | 0 (0.0%) |
| $10,000 to $24,999 | 35 (13.8%) | 11 (10.1%) |
| $25,000 to $34,999 | 34 (13.4%) | 10 (9.2%) |
| $35,000 to $49,999 | 7 (2.8%) | 4 (3.7%) |
| $50,000 to $74,999 | 35 (13.8%) | 6 (5.5%) |
| $75,000 to $99,999 | 31 (12.2%) | 13 (11.9%) |
| $100,000 to $149,999 | 52 (20.5%) | 19 (17.4%) |
| $150,000 or more | 56 (22.1%) | 30 (27.5%) |
| Total | 253 (100.0%) | 109 (100.0%) |
Property Value to Household Income Ratio in Hoxie
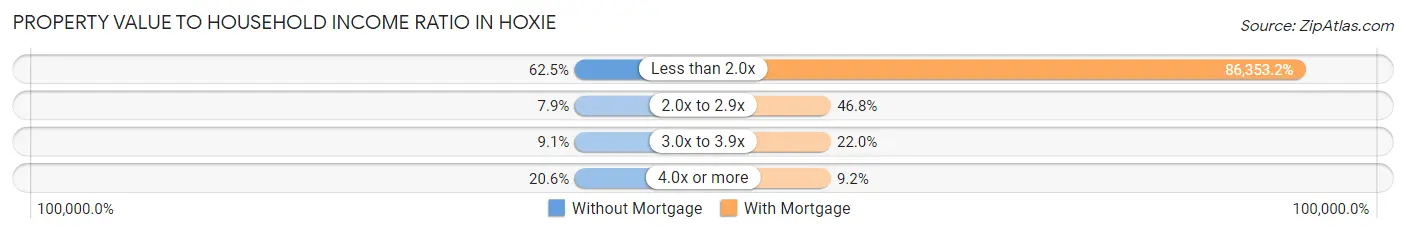
| Value-to-Income Ratio | Without Mortgage | With Mortgage |
| Less than 2.0x | 158 (62.5%) | 94,125 (86,353.2%) |
| 2.0x to 2.9x | 20 (7.9%) | 51 (46.8%) |
| 3.0x to 3.9x | 23 (9.1%) | 24 (22.0%) |
| 4.0x or more | 52 (20.5%) | 10 (9.2%) |
| Total | 253 (100.0%) | 109 (100.0%) |
Real Estate Taxes by Mortgage Status in Hoxie
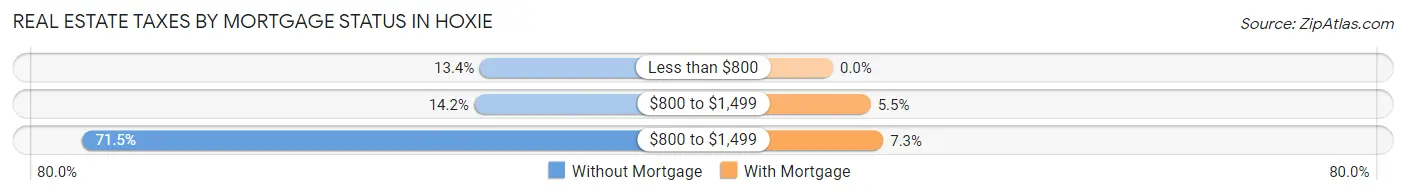
| Property Taxes | Without Mortgage | With Mortgage |
| Less than $800 | 34 (13.4%) | 0 (0.0%) |
| $800 to $1,499 | 36 (14.2%) | 6 (5.5%) |
| $800 to $1,499 | 181 (71.5%) | 8 (7.3%) |
| Total | 253 (100.0%) | 109 (100.0%) |
Health & Disability in Hoxie
Health Insurance Coverage by Age in Hoxie
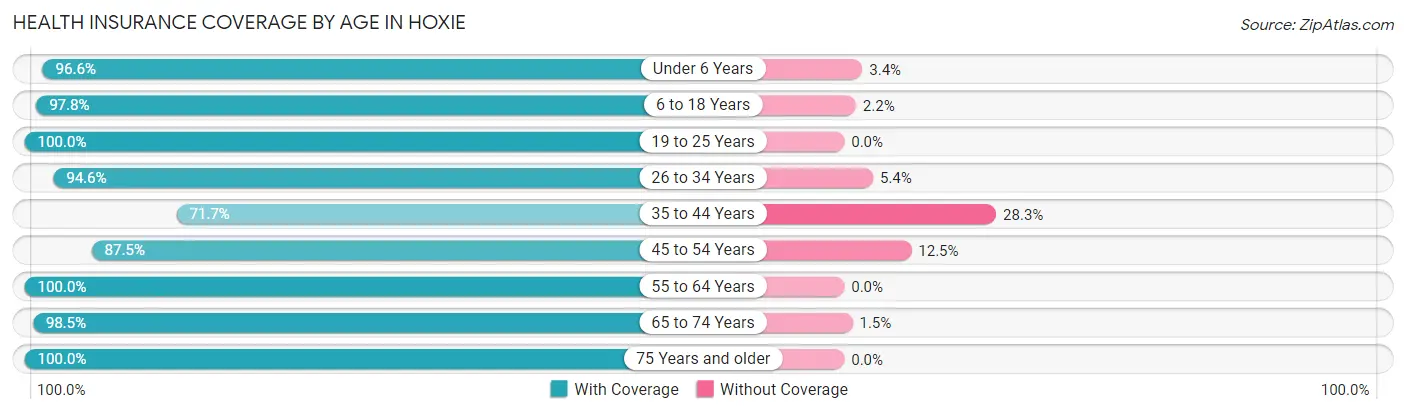
| Age Bracket | With Coverage | Without Coverage |
| Under 6 Years | 86 (96.6%) | 3 (3.4%) |
| 6 to 18 Years | 315 (97.8%) | 7 (2.2%) |
| 19 to 25 Years | 65 (100.0%) | 0 (0.0%) |
| 26 to 34 Years | 106 (94.6%) | 6 (5.4%) |
| 35 to 44 Years | 124 (71.7%) | 49 (28.3%) |
| 45 to 54 Years | 84 (87.5%) | 12 (12.5%) |
| 55 to 64 Years | 125 (100.0%) | 0 (0.0%) |
| 65 to 74 Years | 128 (98.5%) | 2 (1.5%) |
| 75 Years and older | 143 (100.0%) | 0 (0.0%) |
| Total | 1,176 (93.7%) | 79 (6.3%) |
Health Insurance Coverage by Citizenship Status in Hoxie
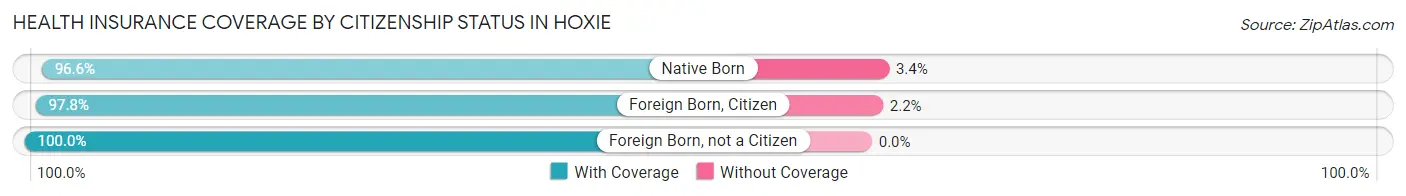
| Citizenship Status | With Coverage | Without Coverage |
| Native Born | 86 (96.6%) | 3 (3.4%) |
| Foreign Born, Citizen | 315 (97.8%) | 7 (2.2%) |
| Foreign Born, not a Citizen | 65 (100.0%) | 0 (0.0%) |
Health Insurance Coverage by Household Income in Hoxie
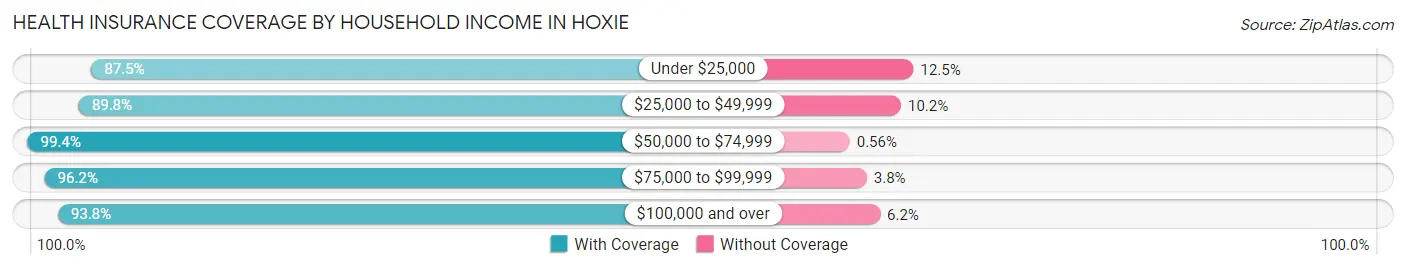
| Household Income | With Coverage | Without Coverage |
| Under $25,000 | 119 (87.5%) | 17 (12.5%) |
| $25,000 to $49,999 | 159 (89.8%) | 18 (10.2%) |
| $50,000 to $74,999 | 178 (99.4%) | 1 (0.6%) |
| $75,000 to $99,999 | 179 (96.2%) | 7 (3.8%) |
| $100,000 and over | 541 (93.8%) | 36 (6.2%) |
Public vs Private Health Insurance Coverage by Age in Hoxie
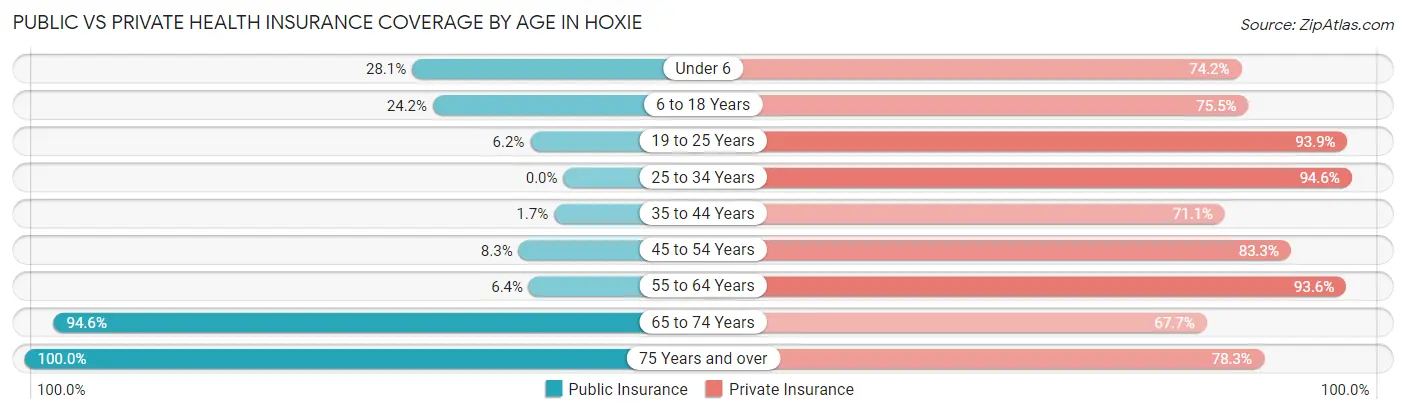
| Age Bracket | Public Insurance | Private Insurance |
| Under 6 | 25 (28.1%) | 66 (74.2%) |
| 6 to 18 Years | 78 (24.2%) | 243 (75.5%) |
| 19 to 25 Years | 4 (6.1%) | 61 (93.9%) |
| 25 to 34 Years | 0 (0.0%) | 106 (94.6%) |
| 35 to 44 Years | 3 (1.7%) | 123 (71.1%) |
| 45 to 54 Years | 8 (8.3%) | 80 (83.3%) |
| 55 to 64 Years | 8 (6.4%) | 117 (93.6%) |
| 65 to 74 Years | 123 (94.6%) | 88 (67.7%) |
| 75 Years and over | 143 (100.0%) | 112 (78.3%) |
| Total | 392 (31.2%) | 996 (79.4%) |
Disability Status by Sex by Age in Hoxie
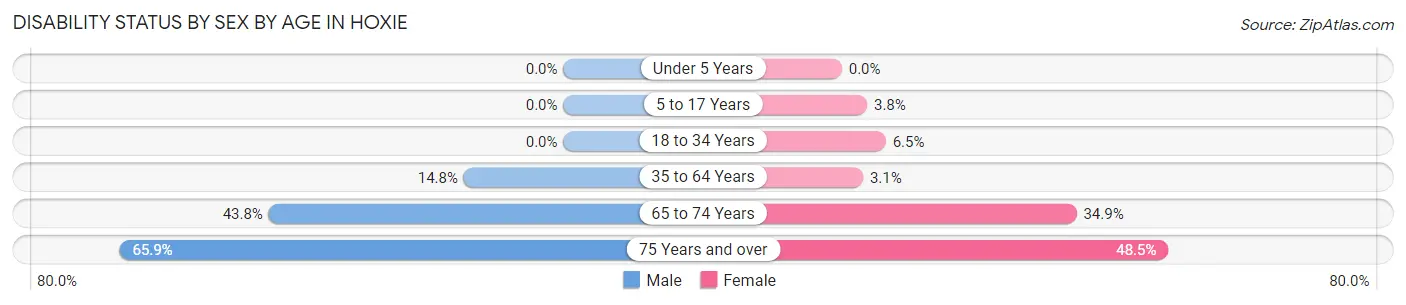
| Age Bracket | Male | Female |
| Under 5 Years | 0 (0.0%) | 0 (0.0%) |
| 5 to 17 Years | 0 (0.0%) | 6 (3.7%) |
| 18 to 34 Years | 0 (0.0%) | 6 (6.5%) |
| 35 to 64 Years | 30 (14.8%) | 6 (3.1%) |
| 65 to 74 Years | 28 (43.8%) | 23 (34.8%) |
| 75 Years and over | 29 (65.9%) | 48 (48.5%) |
Disability Class by Sex by Age in Hoxie
Disability Class: Hearing Difficulty
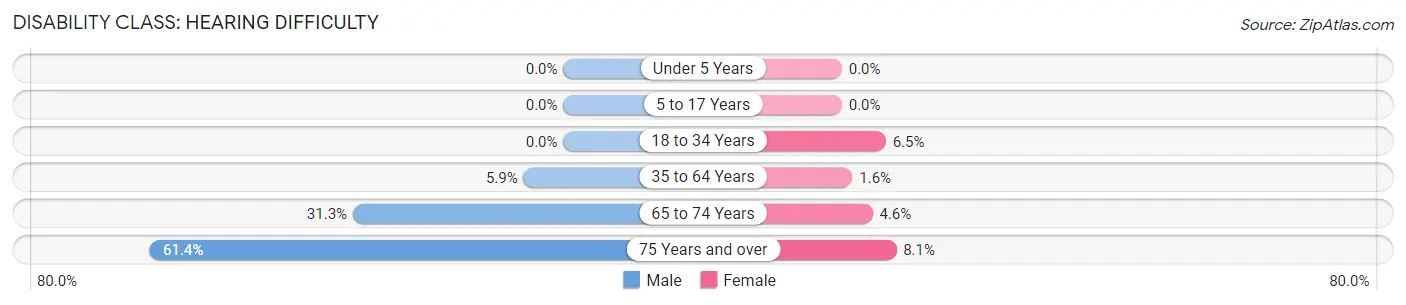
| Age Bracket | Male | Female |
| Under 5 Years | 0 (0.0%) | 0 (0.0%) |
| 5 to 17 Years | 0 (0.0%) | 0 (0.0%) |
| 18 to 34 Years | 0 (0.0%) | 6 (6.5%) |
| 35 to 64 Years | 12 (5.9%) | 3 (1.6%) |
| 65 to 74 Years | 20 (31.2%) | 3 (4.5%) |
| 75 Years and over | 27 (61.4%) | 8 (8.1%) |
Disability Class: Vision Difficulty
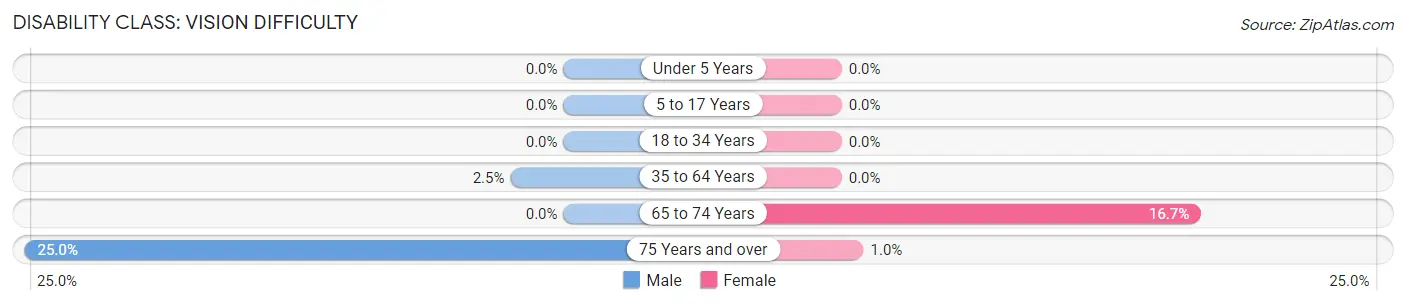
| Age Bracket | Male | Female |
| Under 5 Years | 0 (0.0%) | 0 (0.0%) |
| 5 to 17 Years | 0 (0.0%) | 0 (0.0%) |
| 18 to 34 Years | 0 (0.0%) | 0 (0.0%) |
| 35 to 64 Years | 5 (2.5%) | 0 (0.0%) |
| 65 to 74 Years | 0 (0.0%) | 11 (16.7%) |
| 75 Years and over | 11 (25.0%) | 1 (1.0%) |
Disability Class: Cognitive Difficulty
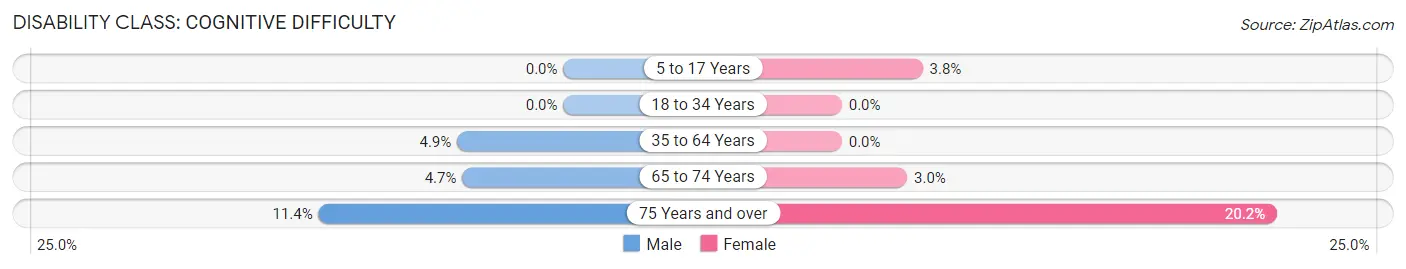
| Age Bracket | Male | Female |
| 5 to 17 Years | 0 (0.0%) | 6 (3.7%) |
| 18 to 34 Years | 0 (0.0%) | 0 (0.0%) |
| 35 to 64 Years | 10 (4.9%) | 0 (0.0%) |
| 65 to 74 Years | 3 (4.7%) | 2 (3.0%) |
| 75 Years and over | 5 (11.4%) | 20 (20.2%) |
Disability Class: Ambulatory Difficulty
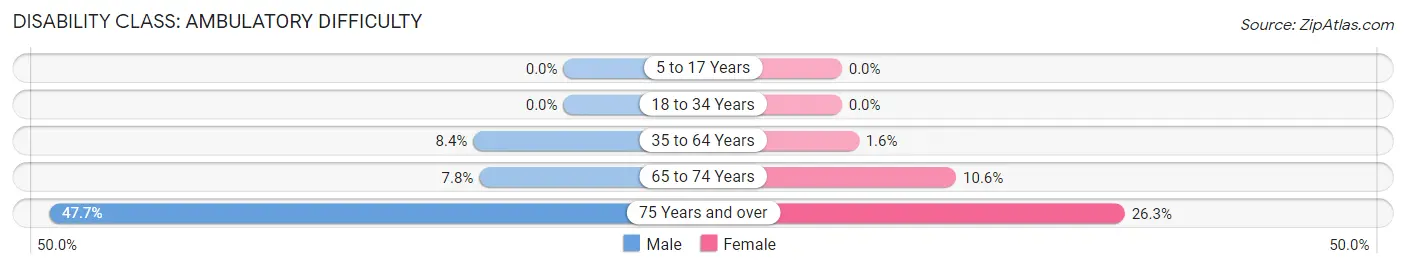
| Age Bracket | Male | Female |
| 5 to 17 Years | 0 (0.0%) | 0 (0.0%) |
| 18 to 34 Years | 0 (0.0%) | 0 (0.0%) |
| 35 to 64 Years | 17 (8.4%) | 3 (1.6%) |
| 65 to 74 Years | 5 (7.8%) | 7 (10.6%) |
| 75 Years and over | 21 (47.7%) | 26 (26.3%) |
Disability Class: Self-Care Difficulty
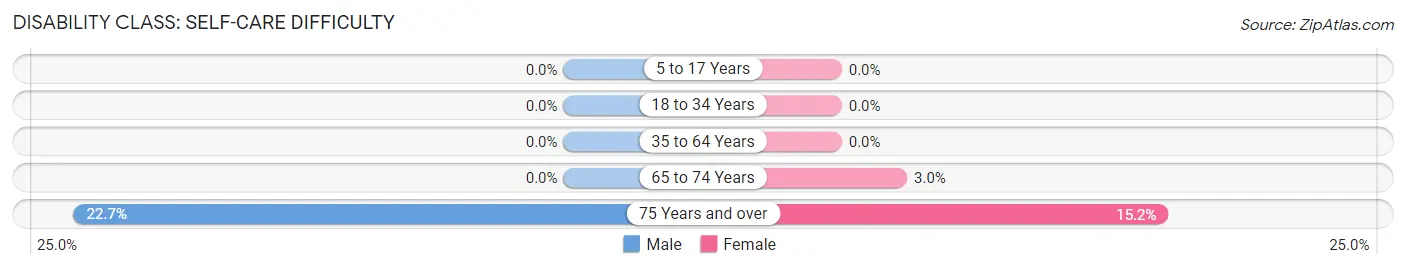
| Age Bracket | Male | Female |
| 5 to 17 Years | 0 (0.0%) | 0 (0.0%) |
| 18 to 34 Years | 0 (0.0%) | 0 (0.0%) |
| 35 to 64 Years | 0 (0.0%) | 0 (0.0%) |
| 65 to 74 Years | 0 (0.0%) | 2 (3.0%) |
| 75 Years and over | 10 (22.7%) | 15 (15.1%) |
Technology Access in Hoxie
Computing Device Access in Hoxie
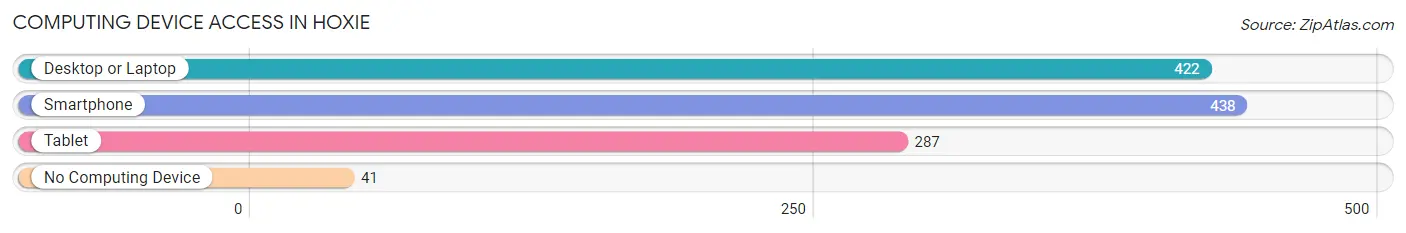
| Device Type | # Households | % Households |
| Desktop or Laptop | 422 | 81.3% |
| Smartphone | 438 | 84.4% |
| Tablet | 287 | 55.3% |
| No Computing Device | 41 | 7.9% |
| Total | 519 | 100.0% |
Internet Access in Hoxie
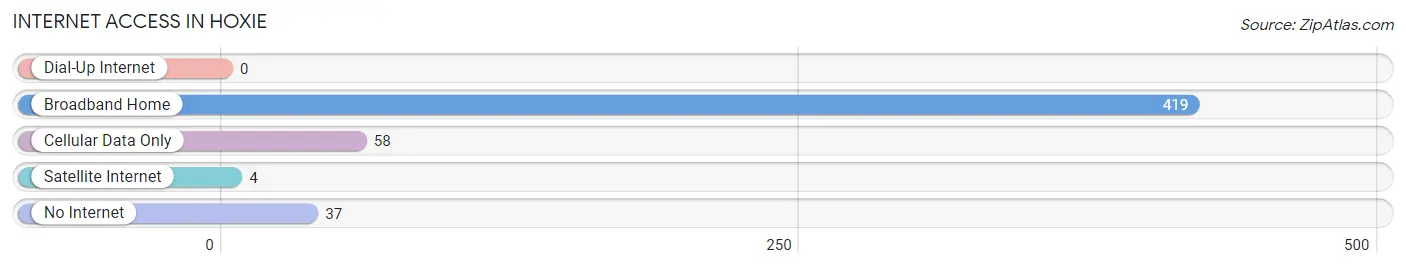
| Internet Type | # Households | % Households |
| Dial-Up Internet | 0 | 0.0% |
| Broadband Home | 419 | 80.7% |
| Cellular Data Only | 58 | 11.2% |
| Satellite Internet | 4 | 0.8% |
| No Internet | 37 | 7.1% |
| Total | 519 | 100.0% |
Hoxie Summary
Hoxie, Kansas is a small town located in Sheridan County in the northwest corner of the state. It is situated on the banks of the Smoky Hill River, and is surrounded by rolling hills and prairies. The town was founded in 1885 and has a population of approximately 1,400 people.
Hoxie is located in the High Plains region of Kansas, and is part of the Great Plains. The climate is semi-arid, with hot summers and cold winters. The average annual precipitation is about 20 inches, and the average annual temperature is around 55 degrees Fahrenheit.
The economy of Hoxie is largely based on agriculture. The town is home to several large farms, and the surrounding area is used for growing wheat, corn, and other crops. The town also has a few small businesses, including a grocery store, a hardware store, and a few restaurants.
The demographics of Hoxie are largely white, with a small Hispanic population. The median household income is around $35,000, and the median home value is around $90,000. The town has a low unemployment rate, and the poverty rate is below the national average.
Hoxie is served by the Hoxie Unified School District, which includes two elementary schools, a middle school, and a high school. The town also has a library, a post office, and a few churches.
Hoxie is a small town with a rich history and a bright future. It is a great place to live, work, and raise a family. The town is surrounded by beautiful scenery, and the people are friendly and welcoming. With its strong economy and diverse population, Hoxie is a great place to call home.
Common Questions
What is Per Capita Income in Hoxie?
Per Capita income in Hoxie is $35,601.
What is the Median Family Income in Hoxie?
Median Family Income in Hoxie is $76,953.
What is the Median Household income in Hoxie?
Median Household Income in Hoxie is $68,438.
What is Income or Wage Gap in Hoxie?
Income or Wage Gap in Hoxie is 37.2%.
Women in Hoxie earn 62.8 cents for every dollar earned by a man.
What is Inequality or Gini Index in Hoxie?
Inequality or Gini Index in Hoxie is 0.46.
What is the Total Population of Hoxie?
Total Population of Hoxie is 1,287.
What is the Total Male Population of Hoxie?
Total Male Population of Hoxie is 621.
What is the Total Female Population of Hoxie?
Total Female Population of Hoxie is 666.
What is the Ratio of Males per 100 Females in Hoxie?
There are 93.24 Males per 100 Females in Hoxie.
What is the Ratio of Females per 100 Males in Hoxie?
There are 107.25 Females per 100 Males in Hoxie.
What is the Median Population Age in Hoxie?
Median Population Age in Hoxie is 39.1 Years.
What is the Average Family Size in Hoxie
Average Family Size in Hoxie is 4.0 People.
What is the Average Household Size in Hoxie
Average Household Size in Hoxie is 2.4 People.
How Large is the Labor Force in Hoxie?
There are 680 People in the Labor Forcein in Hoxie.
What is the Percentage of People in the Labor Force in Hoxie?
71.4% of People are in the Labor Force in Hoxie.