Culpeper, VA Map & Demographics
Culpeper Map
Culpeper Overview
$36,432
PER CAPITA INCOME
$91,841
AVG FAMILY INCOME
$86,940
AVG HOUSEHOLD INCOME
33.4%
WAGE / INCOME GAP [ % ]
66.6¢/ $1
WAGE / INCOME GAP [ $ ]
$7,743
FAMILY INCOME DEFICIT
0.41
INEQUALITY / GINI INDEX
20,105
TOTAL POPULATION
9,842
MALE POPULATION
10,263
FEMALE POPULATION
95.90
MALES / 100 FEMALES
104.28
FEMALES / 100 MALES
34.3
MEDIAN AGE
3.2
AVG FAMILY SIZE
3.0
AVG HOUSEHOLD SIZE
10,446
LABOR FORCE [ PEOPLE ]
70.6%
PERCENT IN LABOR FORCE
3.9%
UNEMPLOYMENT RATE
Culpeper Zip Codes
Culpeper Area Codes
Income in Culpeper
Income Overview in Culpeper
Per Capita Income in Culpeper is $36,432, while median incomes of families and households are $91,841 and $86,940 respectively.
| Characteristic | Number | Measure |
| Per Capita Income | 20,105 | $36,432 |
| Median Family Income | 5,157 | $91,841 |
| Mean Family Income | 5,157 | $103,574 |
| Median Household Income | 6,740 | $86,940 |
| Mean Household Income | 6,740 | $106,762 |
| Income Deficit | 5,157 | $7,743 |
| Wage / Income Gap (%) | 20,105 | 33.41% |
| Wage / Income Gap ($) | 20,105 | 66.59¢ per $1 |
| Gini / Inequality Index | 20,105 | 0.41 |
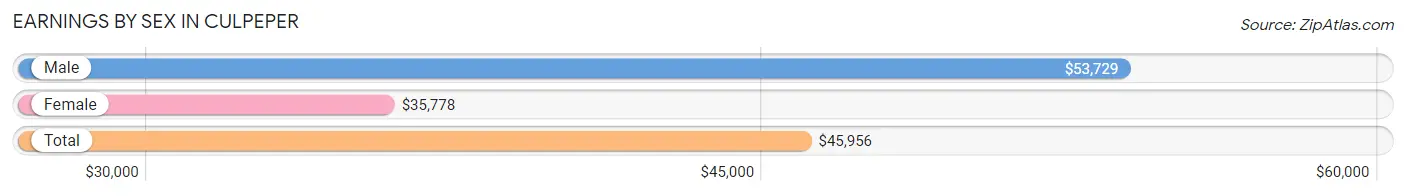
Earnings by Sex in Culpeper
Average Earnings in Culpeper are $45,956, $53,729 for men and $35,778 for women, a difference of 33.4%.
| Sex | Number | Average Earnings |
| Male | 5,572 (51.2%) | $53,729 |
| Female | 5,311 (48.8%) | $35,778 |
| Total | 10,883 (100.0%) | $45,956 |
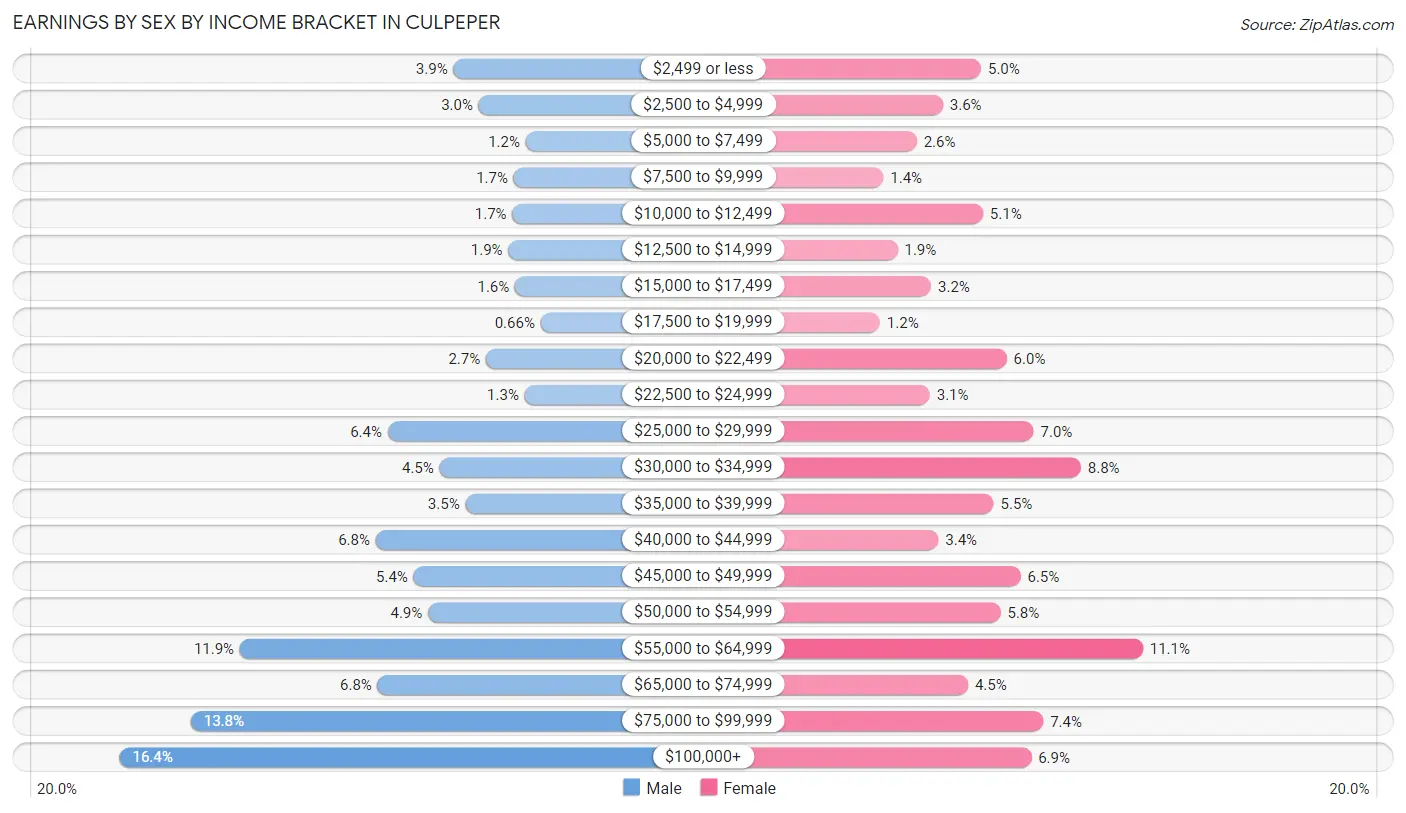
Earnings by Sex by Income Bracket in Culpeper
The most common earnings brackets in Culpeper are $100,000+ for men (916 | 16.4%) and $55,000 to $64,999 for women (589 | 11.1%).
| Income | Male | Female |
| $2,499 or less | 219 (3.9%) | 267 (5.0%) |
| $2,500 to $4,999 | 166 (3.0%) | 191 (3.6%) |
| $5,000 to $7,499 | 68 (1.2%) | 139 (2.6%) |
| $7,500 to $9,999 | 93 (1.7%) | 73 (1.4%) |
| $10,000 to $12,499 | 96 (1.7%) | 271 (5.1%) |
| $12,500 to $14,999 | 104 (1.9%) | 101 (1.9%) |
| $15,000 to $17,499 | 90 (1.6%) | 168 (3.2%) |
| $17,500 to $19,999 | 37 (0.7%) | 66 (1.2%) |
| $20,000 to $22,499 | 151 (2.7%) | 318 (6.0%) |
| $22,500 to $24,999 | 70 (1.3%) | 165 (3.1%) |
| $25,000 to $29,999 | 356 (6.4%) | 372 (7.0%) |
| $30,000 to $34,999 | 248 (4.4%) | 466 (8.8%) |
| $35,000 to $39,999 | 194 (3.5%) | 292 (5.5%) |
| $40,000 to $44,999 | 381 (6.8%) | 182 (3.4%) |
| $45,000 to $49,999 | 302 (5.4%) | 346 (6.5%) |
| $50,000 to $54,999 | 272 (4.9%) | 306 (5.8%) |
| $55,000 to $64,999 | 665 (11.9%) | 589 (11.1%) |
| $65,000 to $74,999 | 377 (6.8%) | 241 (4.5%) |
| $75,000 to $99,999 | 767 (13.8%) | 391 (7.4%) |
| $100,000+ | 916 (16.4%) | 367 (6.9%) |
| Total | 5,572 (100.0%) | 5,311 (100.0%) |
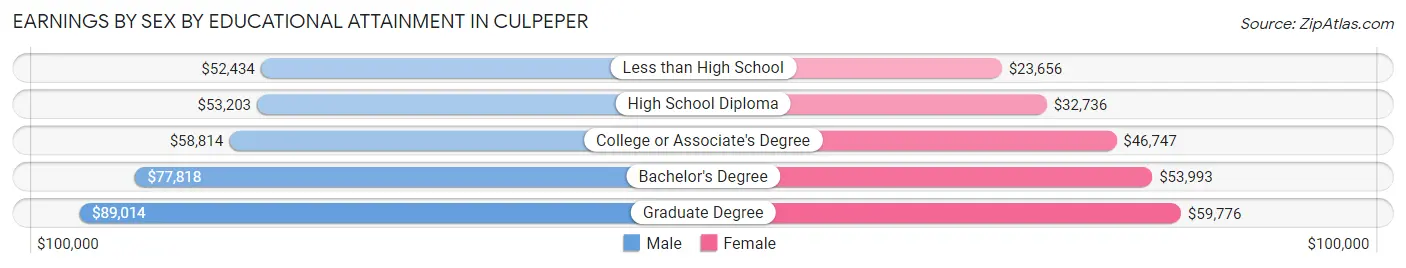
Earnings by Sex by Educational Attainment in Culpeper
Average earnings in Culpeper are $58,373 for men and $45,191 for women, a difference of 22.6%. Men with an educational attainment of graduate degree enjoy the highest average annual earnings of $89,014, while those with less than high school education earn the least with $52,434. Women with an educational attainment of graduate degree earn the most with the average annual earnings of $59,776, while those with less than high school education have the smallest earnings of $23,656.
| Educational Attainment | Male Income | Female Income |
| Less than High School | $52,434 | $23,656 |
| High School Diploma | $53,203 | $32,736 |
| College or Associate's Degree | $58,814 | $46,747 |
| Bachelor's Degree | $77,818 | $53,993 |
| Graduate Degree | $89,014 | $59,776 |
| Total | $58,373 | $45,191 |
Family Income in Culpeper
Family Income Brackets in Culpeper
According to the Culpeper family income data, there are 1,263 families falling into the $100,000 to $149,999 income range, which is the most common income bracket and makes up 24.5% of all families. Conversely, the $15,000 to $24,999 income bracket is the least frequent group with only 83 families (1.6%) belonging to this category.
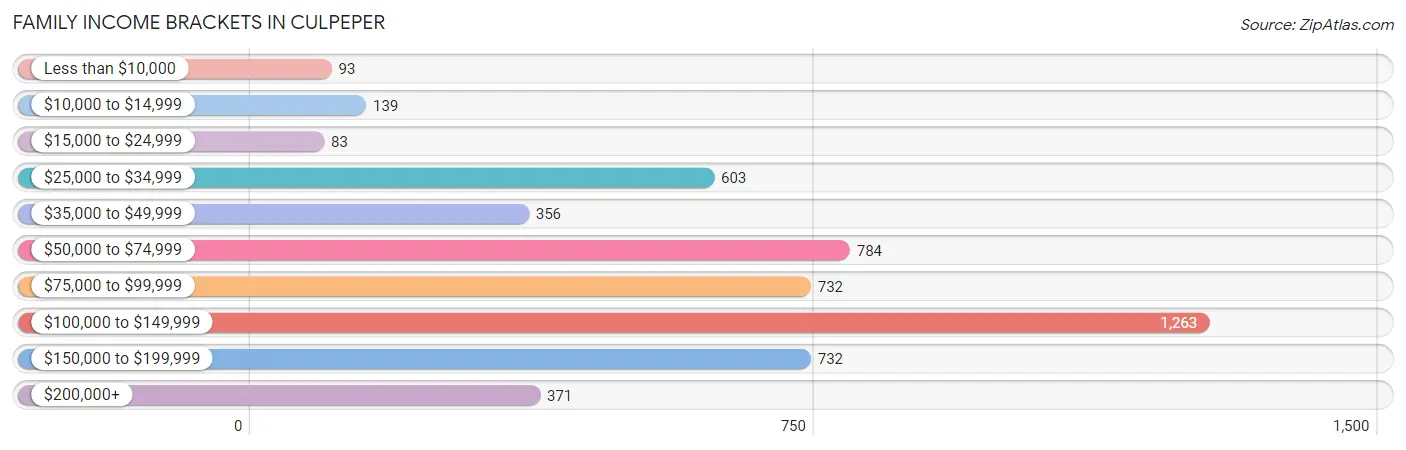
| Income Bracket | # Families | % Families |
| Less than $10,000 | 93 | 1.8% |
| $10,000 to $14,999 | 139 | 2.7% |
| $15,000 to $24,999 | 83 | 1.6% |
| $25,000 to $34,999 | 603 | 11.7% |
| $35,000 to $49,999 | 356 | 6.9% |
| $50,000 to $74,999 | 784 | 15.2% |
| $75,000 to $99,999 | 732 | 14.2% |
| $100,000 to $149,999 | 1,263 | 24.5% |
| $150,000 to $199,999 | 732 | 14.2% |
| $200,000+ | 371 | 7.2% |
Family Income by Famaliy Size in Culpeper
6-person families (85 | 1.7%) account for the highest median family income in Culpeper with $176,840 per family, while 2-person families (2,248 | 43.6%) have the highest median income of $45,250 per family member.
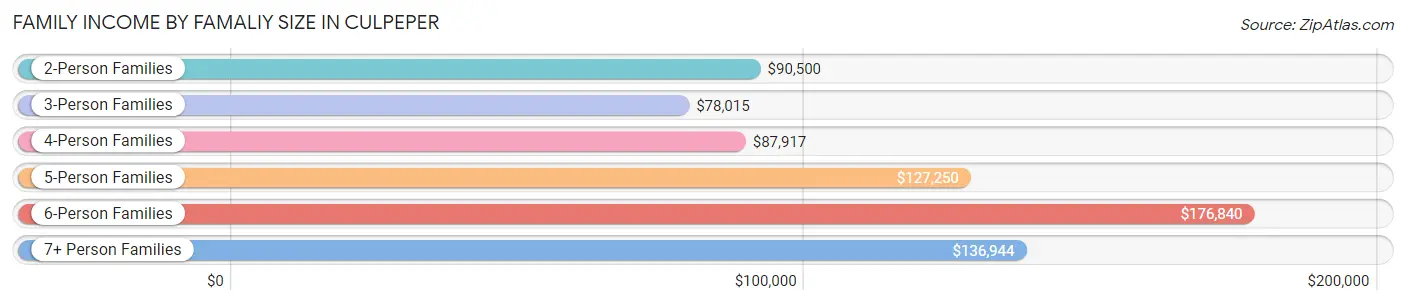
| Income Bracket | # Families | Median Income |
| 2-Person Families | 2,248 (43.6%) | $90,500 |
| 3-Person Families | 1,099 (21.3%) | $78,015 |
| 4-Person Families | 1,176 (22.8%) | $87,917 |
| 5-Person Families | 401 (7.8%) | $127,250 |
| 6-Person Families | 85 (1.7%) | $176,840 |
| 7+ Person Families | 148 (2.9%) | $136,944 |
| Total | 5,157 (100.0%) | $91,841 |
Family Income by Number of Earners in Culpeper
The median family income in Culpeper is $91,841, with families comprising 3+ earners (648) having the highest median family income of $148,182, while families with no earners (605) have the lowest median family income of $51,023, accounting for 12.6% and 11.7% of families, respectively.
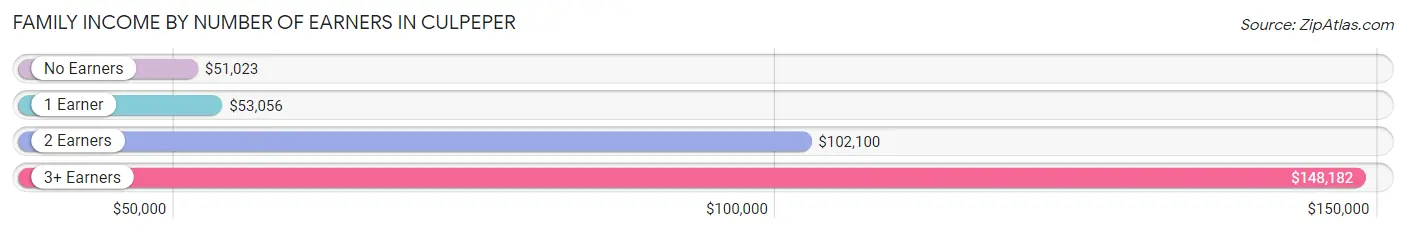
| Number of Earners | # Families | Median Income |
| No Earners | 605 (11.7%) | $51,023 |
| 1 Earner | 1,792 (34.7%) | $53,056 |
| 2 Earners | 2,112 (40.9%) | $102,100 |
| 3+ Earners | 648 (12.6%) | $148,182 |
| Total | 5,157 (100.0%) | $91,841 |
Household Income in Culpeper
Household Income Brackets in Culpeper
With 1,429 households falling in the category, the $50,000 to $74,999 income range is the most frequent in Culpeper, accounting for 21.2% of all households. In contrast, only 155 households (2.3%) fall into the $10,000 to $14,999 income bracket, making it the least populous group.
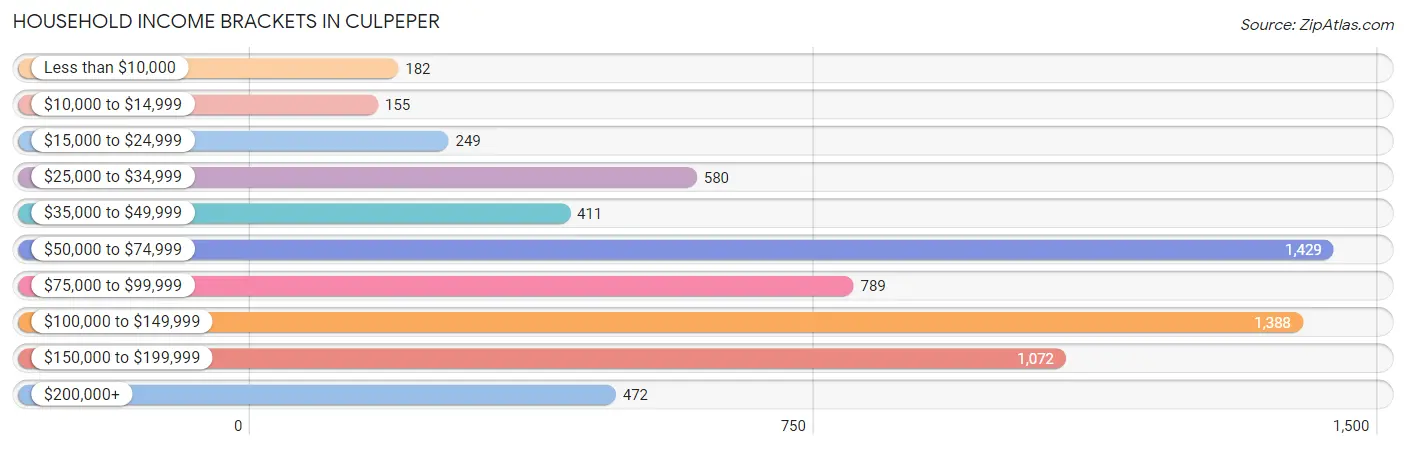
| Income Bracket | # Households | % Households |
| Less than $10,000 | 182 | 2.7% |
| $10,000 to $14,999 | 155 | 2.3% |
| $15,000 to $24,999 | 249 | 3.7% |
| $25,000 to $34,999 | 580 | 8.6% |
| $35,000 to $49,999 | 411 | 6.1% |
| $50,000 to $74,999 | 1,429 | 21.2% |
| $75,000 to $99,999 | 789 | 11.7% |
| $100,000 to $149,999 | 1,388 | 20.6% |
| $150,000 to $199,999 | 1,072 | 15.9% |
| $200,000+ | 472 | 7.0% |
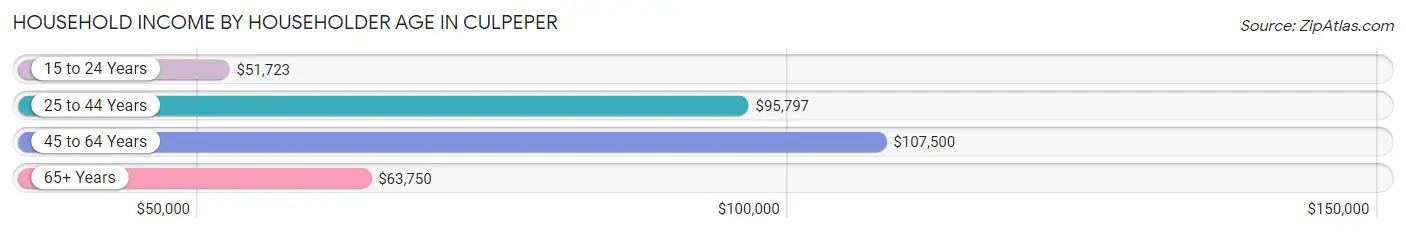
Household Income by Householder Age in Culpeper
The median household income in Culpeper is $86,940, with the highest median household income of $107,500 found in the 45 to 64 years age bracket for the primary householder. A total of 2,542 households (37.7%) fall into this category. Meanwhile, the 15 to 24 years age bracket for the primary householder has the lowest median household income of $51,723, with 436 households (6.5%) in this group.
| Income Bracket | # Households | Median Income |
| 15 to 24 Years | 436 (6.5%) | $51,723 |
| 25 to 44 Years | 2,561 (38.0%) | $95,797 |
| 45 to 64 Years | 2,542 (37.7%) | $107,500 |
| 65+ Years | 1,201 (17.8%) | $63,750 |
| Total | 6,740 (100.0%) | $86,940 |
Poverty in Culpeper
Income Below Poverty by Sex and Age in Culpeper
With 8.5% poverty level for males and 12.3% for females among the residents of Culpeper, 12 to 14 year old males and 15 year old females are the most vulnerable to poverty, with 111 males (23.7%) and 21 females (32.8%) in their respective age groups living below the poverty level.
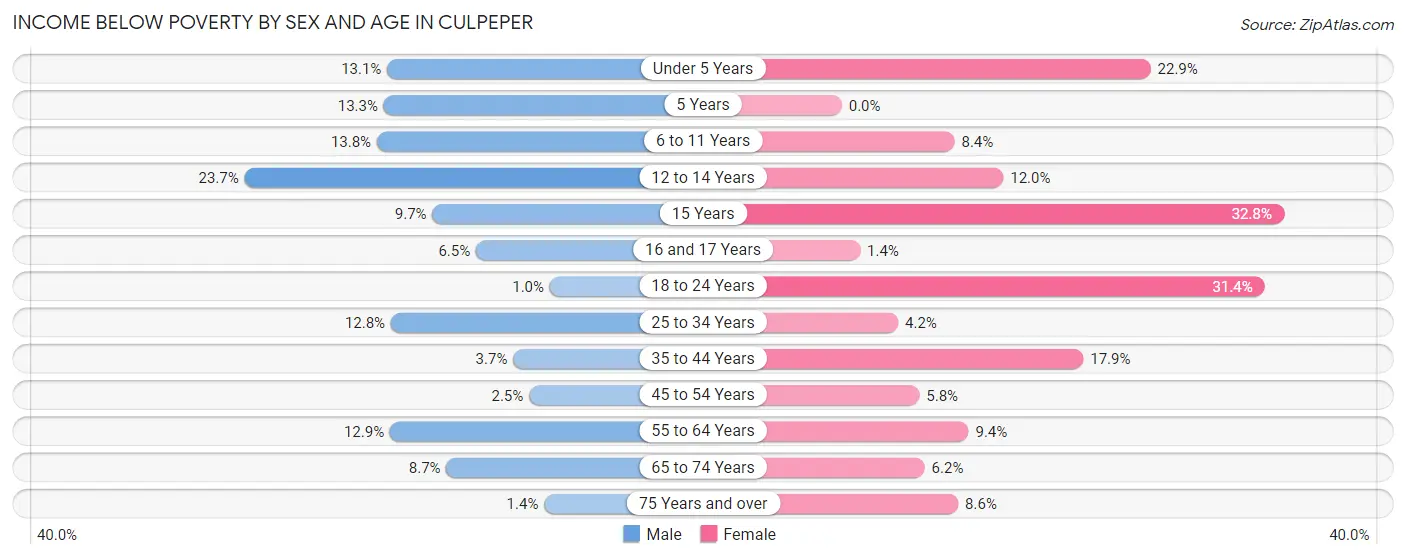
| Age Bracket | Male | Female |
| Under 5 Years | 122 (13.1%) | 163 (22.9%) |
| 5 Years | 18 (13.3%) | 0 (0.0%) |
| 6 to 11 Years | 111 (13.8%) | 79 (8.4%) |
| 12 to 14 Years | 111 (23.7%) | 97 (12.0%) |
| 15 Years | 14 (9.7%) | 21 (32.8%) |
| 16 and 17 Years | 14 (6.5%) | 4 (1.4%) |
| 18 to 24 Years | 11 (1.0%) | 285 (31.4%) |
| 25 to 34 Years | 151 (12.8%) | 47 (4.2%) |
| 35 to 44 Years | 62 (3.7%) | 301 (17.9%) |
| 45 to 54 Years | 26 (2.5%) | 71 (5.8%) |
| 55 to 64 Years | 122 (12.9%) | 106 (9.4%) |
| 65 to 74 Years | 46 (8.7%) | 42 (6.1%) |
| 75 Years and over | 6 (1.4%) | 40 (8.6%) |
| Total | 814 (8.5%) | 1,256 (12.3%) |
Income Above Poverty by Sex and Age in Culpeper
According to the poverty statistics in Culpeper, males aged 18 to 24 years and females aged 5 years are the age groups that are most secure financially, with 99.0% of males and 100.0% of females in these age groups living above the poverty line.
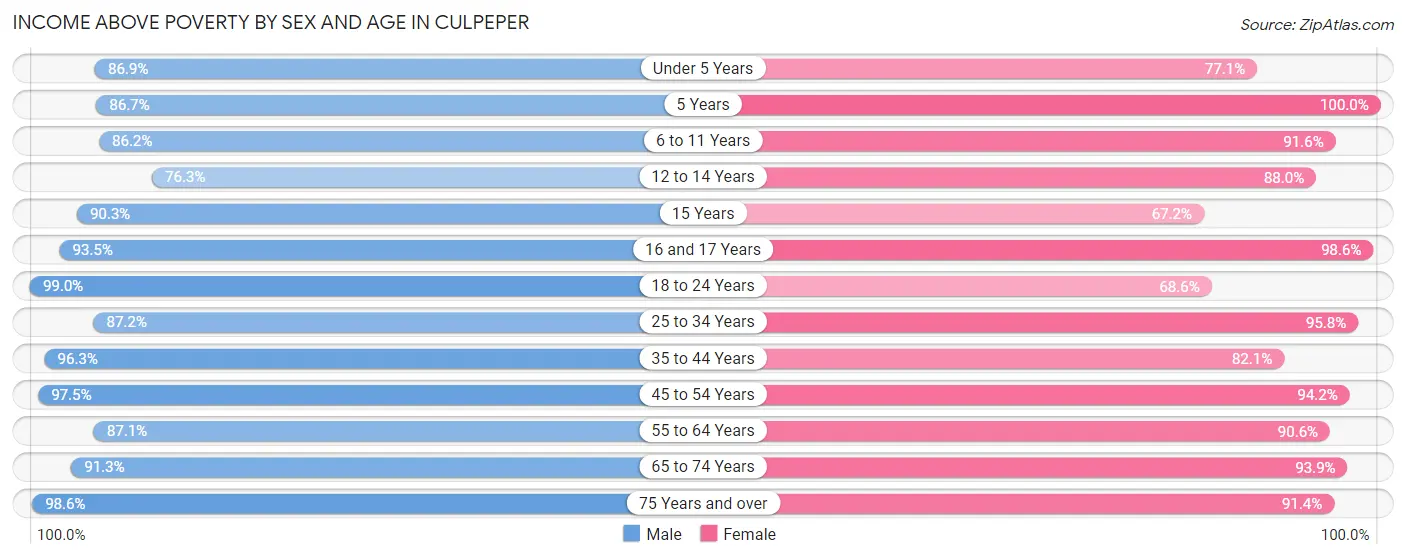
| Age Bracket | Male | Female |
| Under 5 Years | 811 (86.9%) | 548 (77.1%) |
| 5 Years | 117 (86.7%) | 137 (100.0%) |
| 6 to 11 Years | 691 (86.2%) | 865 (91.6%) |
| 12 to 14 Years | 358 (76.3%) | 712 (88.0%) |
| 15 Years | 130 (90.3%) | 43 (67.2%) |
| 16 and 17 Years | 202 (93.5%) | 291 (98.6%) |
| 18 to 24 Years | 1,093 (99.0%) | 623 (68.6%) |
| 25 to 34 Years | 1,029 (87.2%) | 1,078 (95.8%) |
| 35 to 44 Years | 1,605 (96.3%) | 1,378 (82.1%) |
| 45 to 54 Years | 996 (97.5%) | 1,162 (94.2%) |
| 55 to 64 Years | 826 (87.1%) | 1,021 (90.6%) |
| 65 to 74 Years | 484 (91.3%) | 641 (93.9%) |
| 75 Years and over | 417 (98.6%) | 423 (91.4%) |
| Total | 8,759 (91.5%) | 8,922 (87.7%) |
Income Below Poverty Among Married-Couple Families in Culpeper
The poverty statistics for married-couple families in Culpeper show that 2.5% or 75 of the total 2,988 families live below the poverty line. Families with 1 or 2 children have the highest poverty rate of 4.2%, comprising of 41 families. On the other hand, families with 3 or 4 children have the lowest poverty rate of 0.0%, which includes 0 families.
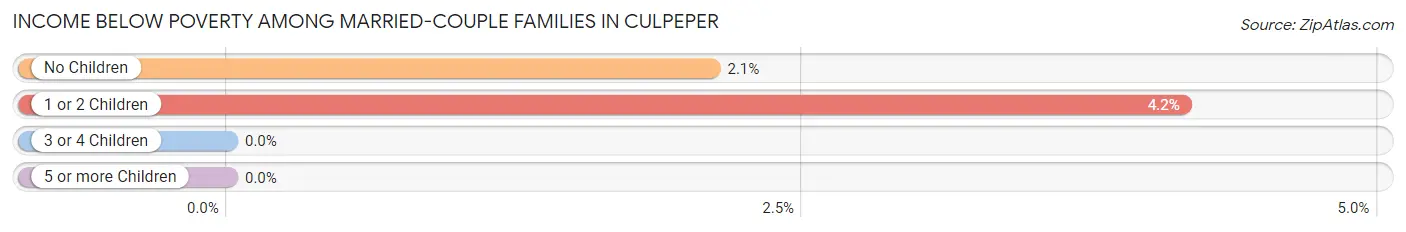
| Children | Above Poverty | Below Poverty |
| No Children | 1,582 (97.9%) | 34 (2.1%) |
| 1 or 2 Children | 946 (95.9%) | 41 (4.2%) |
| 3 or 4 Children | 319 (100.0%) | 0 (0.0%) |
| 5 or more Children | 66 (100.0%) | 0 (0.0%) |
| Total | 2,913 (97.5%) | 75 (2.5%) |
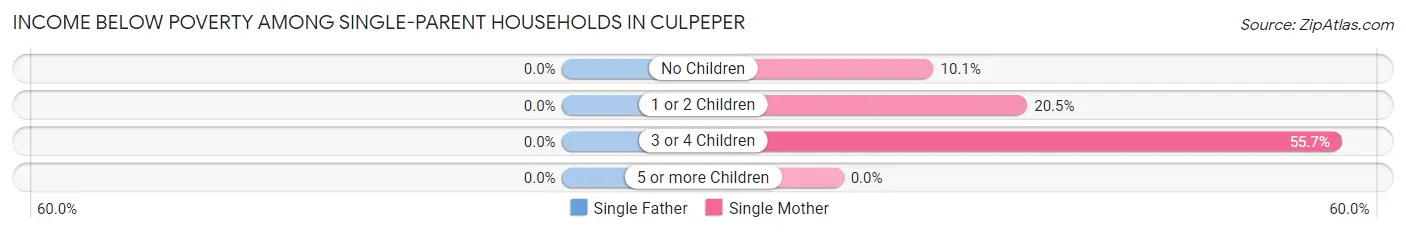
Income Below Poverty Among Single-Parent Households in Culpeper
| Children | Single Father | Single Mother |
| No Children | 0 (0.0%) | 56 (10.1%) |
| 1 or 2 Children | 0 (0.0%) | 167 (20.5%) |
| 3 or 4 Children | 0 (0.0%) | 182 (55.7%) |
| 5 or more Children | 0 (0.0%) | 0 (0.0%) |
| Total | 0 (0.0%) | 405 (23.8%) |
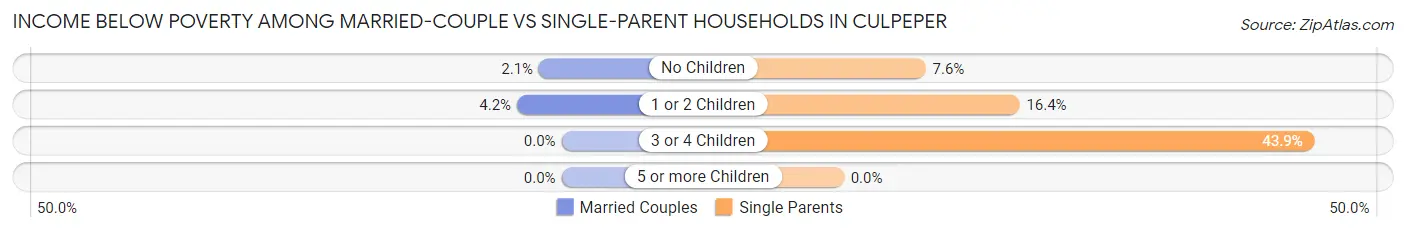
Income Below Poverty Among Married-Couple vs Single-Parent Households in Culpeper
The poverty data for Culpeper shows that 75 of the married-couple family households (2.5%) and 405 of the single-parent households (18.7%) are living below the poverty level. Within the married-couple family households, those with 1 or 2 children have the highest poverty rate, with 41 households (4.2%) falling below the poverty line. Among the single-parent households, those with 3 or 4 children have the highest poverty rate, with 182 household (43.9%) living below poverty.
| Children | Married-Couple Families | Single-Parent Households |
| No Children | 34 (2.1%) | 56 (7.6%) |
| 1 or 2 Children | 41 (4.2%) | 167 (16.4%) |
| 3 or 4 Children | 0 (0.0%) | 182 (43.9%) |
| 5 or more Children | 0 (0.0%) | 0 (0.0%) |
| Total | 75 (2.5%) | 405 (18.7%) |
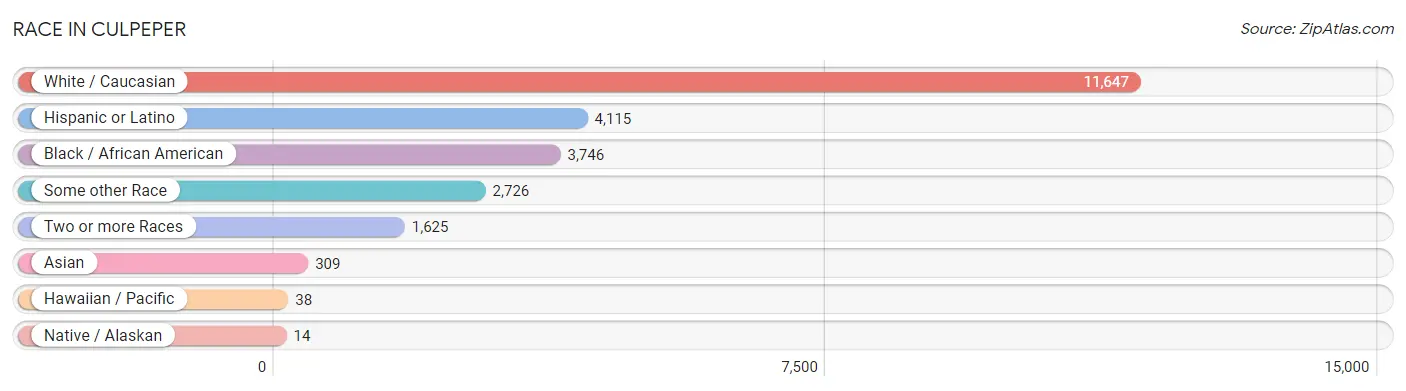
Race in Culpeper
The most populous races in Culpeper are White / Caucasian (11,647 | 57.9%), Hispanic or Latino (4,115 | 20.5%), and Black / African American (3,746 | 18.6%).
| Race | # Population | % Population |
| Asian | 309 | 1.5% |
| Black / African American | 3,746 | 18.6% |
| Hawaiian / Pacific | 38 | 0.2% |
| Hispanic or Latino | 4,115 | 20.5% |
| Native / Alaskan | 14 | 0.1% |
| White / Caucasian | 11,647 | 57.9% |
| Two or more Races | 1,625 | 8.1% |
| Some other Race | 2,726 | 13.6% |
| Total | 20,105 | 100.0% |
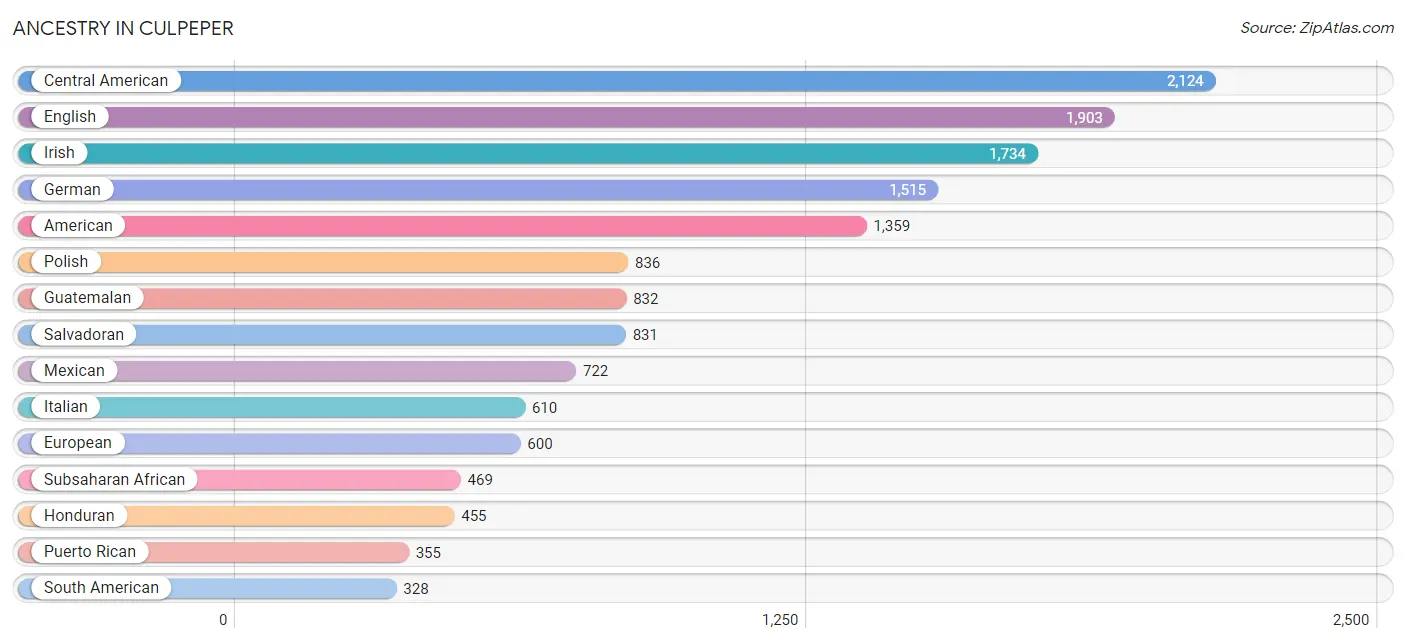
Ancestry in Culpeper
The most populous ancestries reported in Culpeper are Central American (2,124 | 10.6%), English (1,903 | 9.5%), Irish (1,734 | 8.6%), German (1,515 | 7.5%), and American (1,359 | 6.8%), together accounting for 42.9% of all Culpeper residents.
| Ancestry | # Population | % Population |
| African | 106 | 0.5% |
| American | 1,359 | 6.8% |
| Arab | 26 | 0.1% |
| Argentinean | 18 | 0.1% |
| Bahamian | 32 | 0.2% |
| Bhutanese | 187 | 0.9% |
| Bolivian | 28 | 0.1% |
| British | 34 | 0.2% |
| Canadian | 32 | 0.2% |
| Central American | 2,124 | 10.6% |
| Central American Indian | 27 | 0.1% |
| Cherokee | 17 | 0.1% |
| Chilean | 36 | 0.2% |
| Colombian | 123 | 0.6% |
| Cuban | 259 | 1.3% |
| Czechoslovakian | 34 | 0.2% |
| Danish | 9 | 0.0% |
| Dominican | 59 | 0.3% |
| Dutch | 51 | 0.3% |
| English | 1,903 | 9.5% |
| Ethiopian | 39 | 0.2% |
| European | 600 | 3.0% |
| Finnish | 14 | 0.1% |
| French | 284 | 1.4% |
| French Canadian | 23 | 0.1% |
| German | 1,515 | 7.5% |
| Greek | 71 | 0.4% |
| Guatemalan | 832 | 4.1% |
| Haitian | 10 | 0.1% |
| Honduran | 455 | 2.3% |
| Hungarian | 22 | 0.1% |
| Indian (Asian) | 110 | 0.5% |
| Irish | 1,734 | 8.6% |
| Iroquois | 7 | 0.0% |
| Italian | 610 | 3.0% |
| Jamaican | 100 | 0.5% |
| Korean | 28 | 0.1% |
| Liberian | 259 | 1.3% |
| Malaysian | 63 | 0.3% |
| Mexican | 722 | 3.6% |
| Native Hawaiian | 38 | 0.2% |
| Nigerian | 8 | 0.0% |
| Northern European | 9 | 0.0% |
| Norwegian | 66 | 0.3% |
| Pakistani | 32 | 0.2% |
| Panamanian | 6 | 0.0% |
| Peruvian | 123 | 0.6% |
| Polish | 836 | 4.2% |
| Puerto Rican | 355 | 1.8% |
| Russian | 47 | 0.2% |
| Salvadoran | 831 | 4.1% |
| Scotch-Irish | 205 | 1.0% |
| Scottish | 261 | 1.3% |
| Sioux | 14 | 0.1% |
| Slovak | 68 | 0.3% |
| South African | 57 | 0.3% |
| South American | 328 | 1.6% |
| Spanish | 31 | 0.2% |
| Sri Lankan | 9 | 0.0% |
| Subsaharan African | 469 | 2.3% |
| Swedish | 268 | 1.3% |
| Swiss | 11 | 0.1% |
| Syrian | 14 | 0.1% |
| Thai | 55 | 0.3% |
| Trinidadian and Tobagonian | 6 | 0.0% |
| Turkish | 80 | 0.4% |
| Ukrainian | 22 | 0.1% |
| Welsh | 110 | 0.5% |
| West Indian | 6 | 0.0% |
| Yugoslavian | 36 | 0.2% | View All 70 Rows |
Immigrants in Culpeper
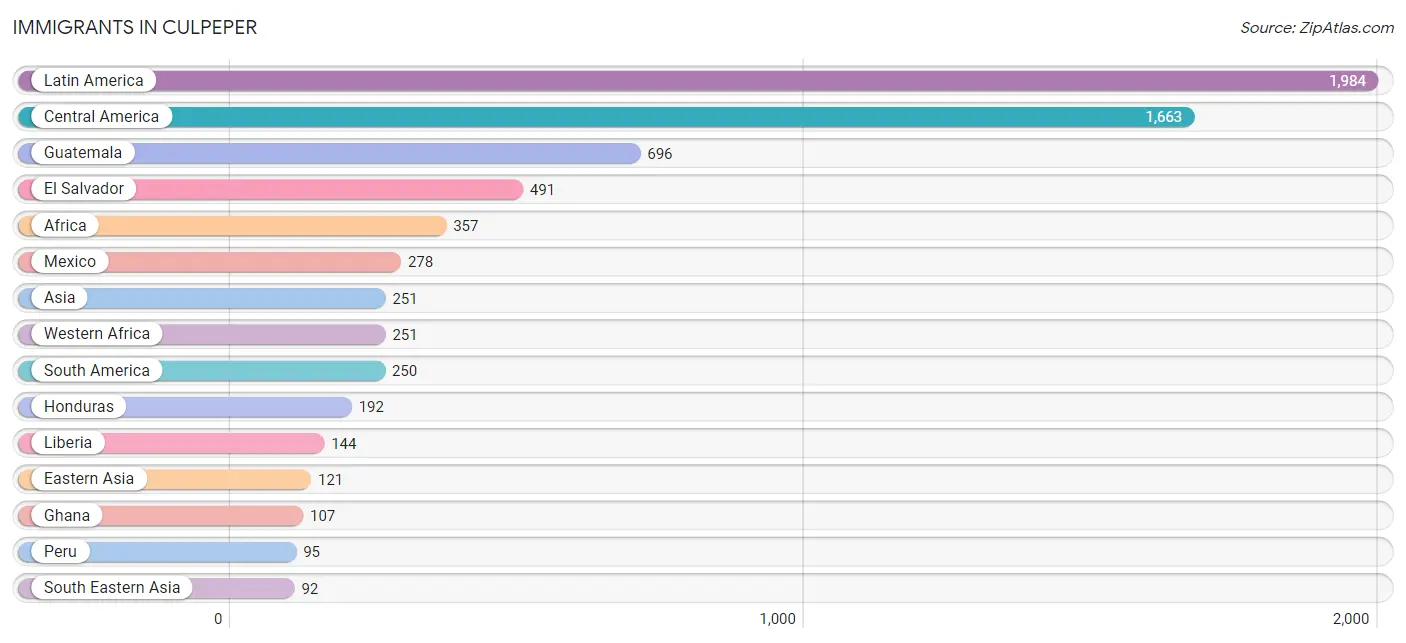
The most numerous immigrant groups reported in Culpeper came from Latin America (1,984 | 9.9%), Central America (1,663 | 8.3%), Guatemala (696 | 3.5%), El Salvador (491 | 2.4%), and Africa (357 | 1.8%), together accounting for 25.8% of all Culpeper residents.
| Immigration Origin | # Population | % Population |
| Africa | 357 | 1.8% |
| Asia | 251 | 1.3% |
| Bolivia | 63 | 0.3% |
| Canada | 18 | 0.1% |
| Caribbean | 71 | 0.4% |
| Central America | 1,663 | 8.3% |
| Chile | 59 | 0.3% |
| China | 67 | 0.3% |
| Colombia | 33 | 0.2% |
| Denmark | 20 | 0.1% |
| Eastern Africa | 39 | 0.2% |
| Eastern Asia | 121 | 0.6% |
| Eastern Europe | 32 | 0.2% |
| El Salvador | 491 | 2.4% |
| Ethiopia | 39 | 0.2% |
| Europe | 78 | 0.4% |
| Germany | 26 | 0.1% |
| Ghana | 107 | 0.5% |
| Guatemala | 696 | 3.5% |
| Honduras | 192 | 0.9% |
| India | 14 | 0.1% |
| Jamaica | 65 | 0.3% |
| Japan | 54 | 0.3% |
| Laos | 32 | 0.2% |
| Latin America | 1,984 | 9.9% |
| Liberia | 144 | 0.7% |
| Mexico | 278 | 1.4% |
| Northern Europe | 20 | 0.1% |
| Pakistan | 24 | 0.1% |
| Panama | 6 | 0.0% |
| Peru | 95 | 0.5% |
| Philippines | 9 | 0.0% |
| Russia | 32 | 0.2% |
| South Africa | 16 | 0.1% |
| South America | 250 | 1.2% |
| South Central Asia | 38 | 0.2% |
| South Eastern Asia | 92 | 0.5% |
| Thailand | 31 | 0.2% |
| Trinidad and Tobago | 6 | 0.0% |
| Vietnam | 20 | 0.1% |
| Western Africa | 251 | 1.3% |
| Western Europe | 26 | 0.1% | View All 42 Rows |
Sex and Age in Culpeper
Sex and Age in Culpeper
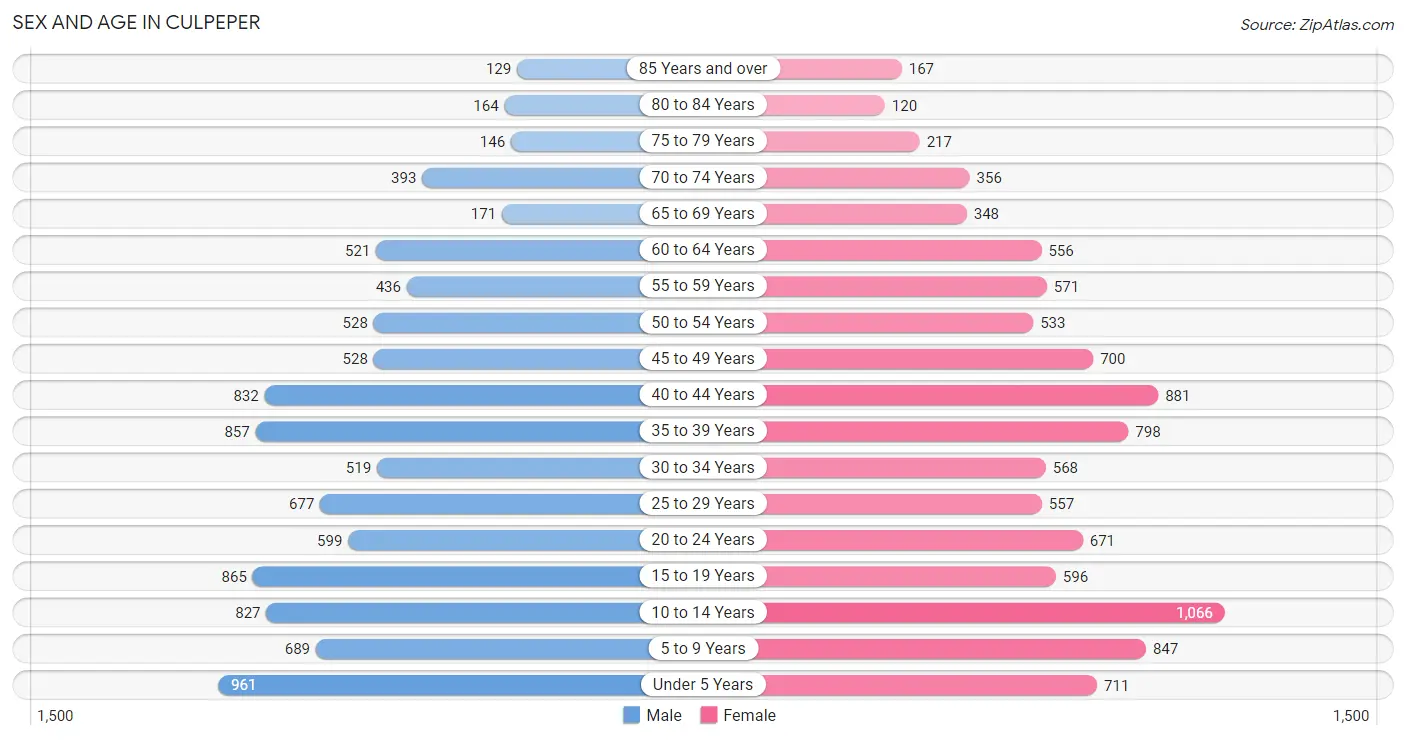
The most populous age groups in Culpeper are Under 5 Years (961 | 9.8%) for men and 10 to 14 Years (1,066 | 10.4%) for women.
| Age Bracket | Male | Female |
| Under 5 Years | 961 (9.8%) | 711 (6.9%) |
| 5 to 9 Years | 689 (7.0%) | 847 (8.3%) |
| 10 to 14 Years | 827 (8.4%) | 1,066 (10.4%) |
| 15 to 19 Years | 865 (8.8%) | 596 (5.8%) |
| 20 to 24 Years | 599 (6.1%) | 671 (6.5%) |
| 25 to 29 Years | 677 (6.9%) | 557 (5.4%) |
| 30 to 34 Years | 519 (5.3%) | 568 (5.5%) |
| 35 to 39 Years | 857 (8.7%) | 798 (7.8%) |
| 40 to 44 Years | 832 (8.5%) | 881 (8.6%) |
| 45 to 49 Years | 528 (5.4%) | 700 (6.8%) |
| 50 to 54 Years | 528 (5.4%) | 533 (5.2%) |
| 55 to 59 Years | 436 (4.4%) | 571 (5.6%) |
| 60 to 64 Years | 521 (5.3%) | 556 (5.4%) |
| 65 to 69 Years | 171 (1.7%) | 348 (3.4%) |
| 70 to 74 Years | 393 (4.0%) | 356 (3.5%) |
| 75 to 79 Years | 146 (1.5%) | 217 (2.1%) |
| 80 to 84 Years | 164 (1.7%) | 120 (1.2%) |
| 85 Years and over | 129 (1.3%) | 167 (1.6%) |
| Total | 9,842 (100.0%) | 10,263 (100.0%) |
Families and Households in Culpeper
Median Family Size in Culpeper
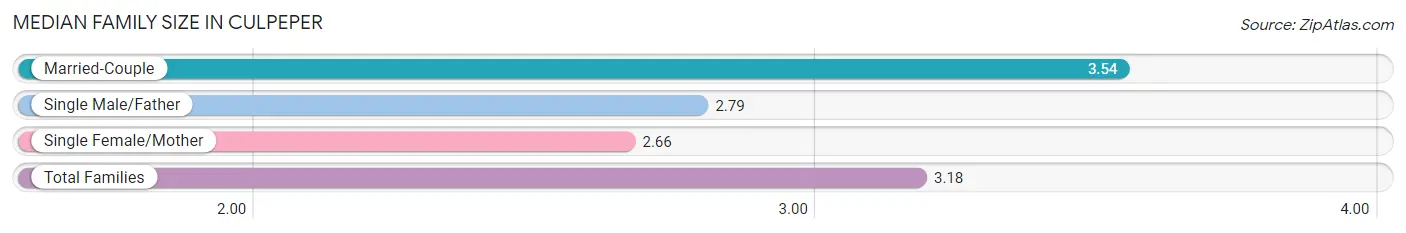
The median family size in Culpeper is 3.18 persons per family, with married-couple families (2,988 | 57.9%) accounting for the largest median family size of 3.54 persons per family. On the other hand, single female/mother families (1,698 | 32.9%) represent the smallest median family size with 2.66 persons per family.
| Family Type | # Families | Family Size |
| Married-Couple | 2,988 (57.9%) | 3.54 |
| Single Male/Father | 471 (9.1%) | 2.79 |
| Single Female/Mother | 1,698 (32.9%) | 2.66 |
| Total Families | 5,157 (100.0%) | 3.18 |
Median Household Size in Culpeper
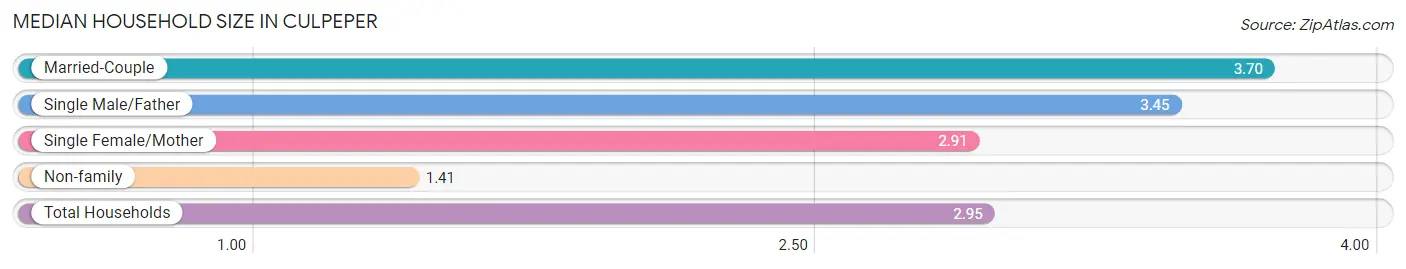
The median household size in Culpeper is 2.95 persons per household, with married-couple households (2,988 | 44.3%) accounting for the largest median household size of 3.7 persons per household. non-family households (1,583 | 23.5%) represent the smallest median household size with 1.41 persons per household.
| Household Type | # Households | Household Size |
| Married-Couple | 2,988 (44.3%) | 3.70 |
| Single Male/Father | 471 (7.0%) | 3.45 |
| Single Female/Mother | 1,698 (25.2%) | 2.91 |
| Non-family | 1,583 (23.5%) | 1.41 |
| Total Households | 6,740 (100.0%) | 2.95 |
Household Size by Marriage Status in Culpeper
Out of a total of 6,740 households in Culpeper, 5,157 (76.5%) are family households, while 1,583 (23.5%) are nonfamily households. The most numerous type of family households are 2-person households, comprising 2,021, and the most common type of nonfamily households are 1-person households, comprising 1,186.
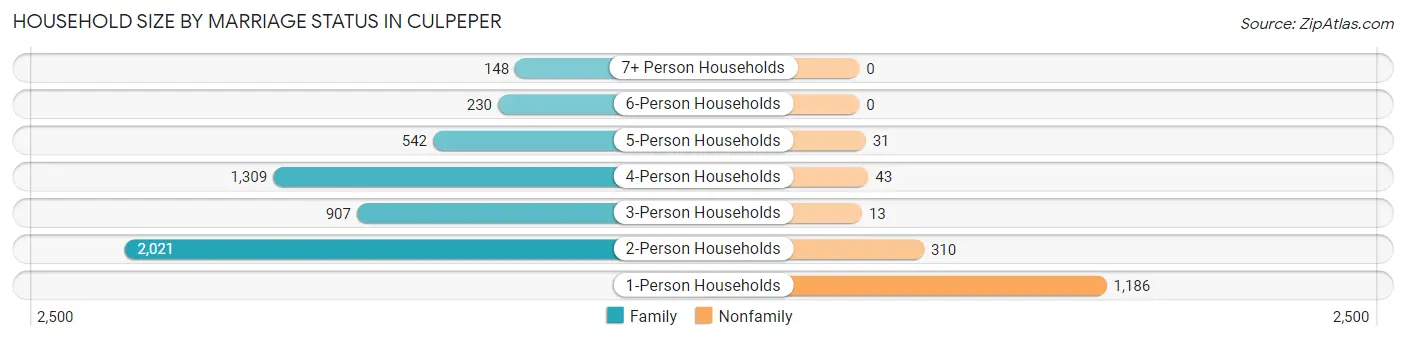
| Household Size | Family Households | Nonfamily Households |
| 1-Person Households | - | 1,186 (17.6%) |
| 2-Person Households | 2,021 (30.0%) | 310 (4.6%) |
| 3-Person Households | 907 (13.5%) | 13 (0.2%) |
| 4-Person Households | 1,309 (19.4%) | 43 (0.6%) |
| 5-Person Households | 542 (8.0%) | 31 (0.5%) |
| 6-Person Households | 230 (3.4%) | 0 (0.0%) |
| 7+ Person Households | 148 (2.2%) | 0 (0.0%) |
| Total | 5,157 (76.5%) | 1,583 (23.5%) |
Female Fertility in Culpeper
Fertility by Age in Culpeper
Average fertility rate in Culpeper is 42.0 births per 1,000 women. Women in the age bracket of 20 to 34 years have the highest fertility rate with 111.0 births per 1,000 women. Women in the age bracket of 20 to 34 years acount for 97.6% of all women with births.
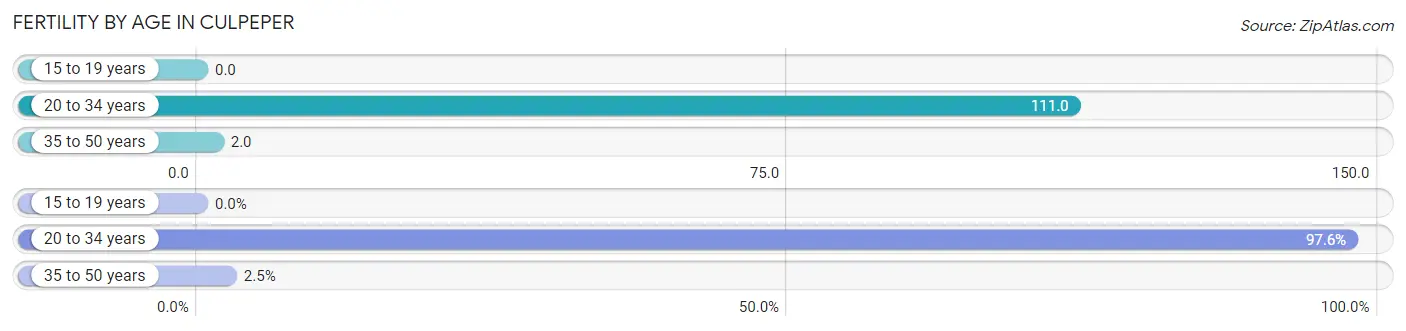
| Age Bracket | Women with Births | Births / 1,000 Women |
| 15 to 19 years | 0 (0.0%) | 0.0 |
| 20 to 34 years | 199 (97.6%) | 111.0 |
| 35 to 50 years | 5 (2.5%) | 2.0 |
| Total | 204 (100.0%) | 42.0 |
Fertility by Age by Marriage Status in Culpeper
16.2% of women with births (204) in Culpeper are married. The highest percentage of unmarried women with births falls into 20 to 34 years age bracket with 85.9% of them unmarried at the time of birth, while the lowest percentage of unmarried women with births belong to 35 to 50 years age bracket with 0.0% of them unmarried.
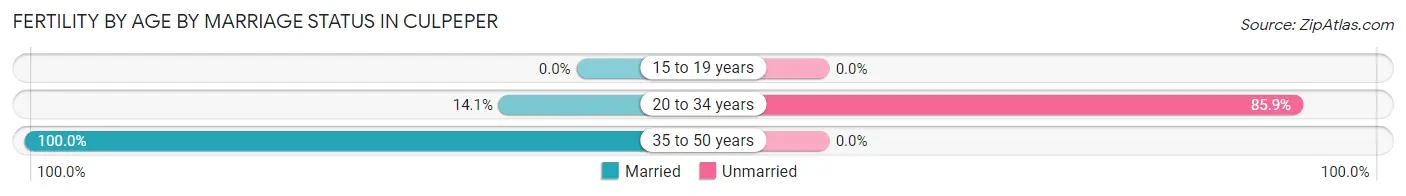
| Age Bracket | Married | Unmarried |
| 15 to 19 years | 0 (0.0%) | 0 (0.0%) |
| 20 to 34 years | 28 (14.1%) | 171 (85.9%) |
| 35 to 50 years | 5 (100.0%) | 0 (0.0%) |
| Total | 33 (16.2%) | 171 (83.8%) |
Fertility by Education in Culpeper
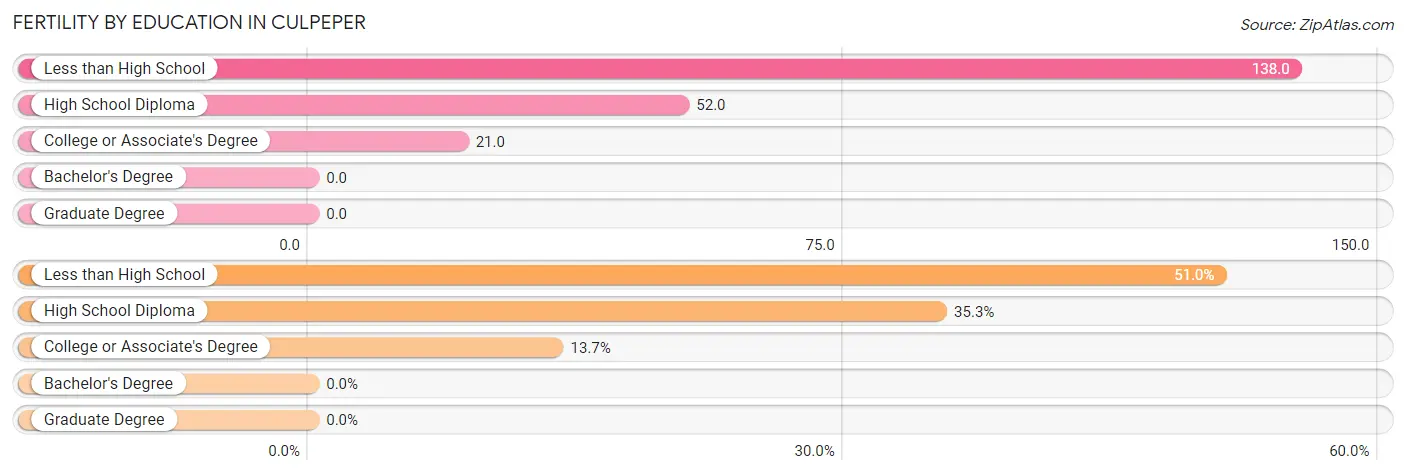
| Educational Attainment | Women with Births | Births / 1,000 Women |
| Less than High School | 104 (51.0%) | 138.0 |
| High School Diploma | 72 (35.3%) | 52.0 |
| College or Associate's Degree | 28 (13.7%) | 21.0 |
| Bachelor's Degree | 0 (0.0%) | 0.0 |
| Graduate Degree | 0 (0.0%) | 0.0 |
| Total | 204 (100.0%) | 42.0 |
Fertility by Education by Marriage Status in Culpeper
83.8% of women with births in Culpeper are unmarried. Women with the educational attainment of college or associate's degree are most likely to be married with 100.0% of them married at childbirth, while women with the educational attainment of high school diploma are least likely to be married with 100.0% of them unmarried at childbirth.
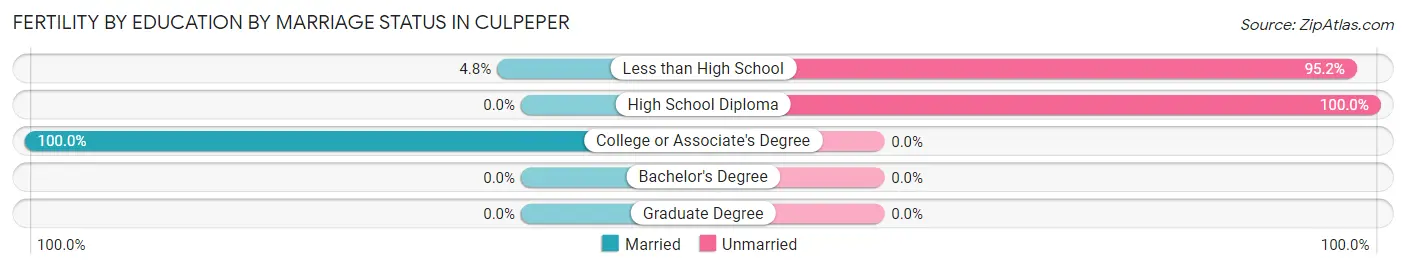
| Educational Attainment | Married | Unmarried |
| Less than High School | 5 (4.8%) | 99 (95.2%) |
| High School Diploma | 0 (0.0%) | 72 (100.0%) |
| College or Associate's Degree | 28 (100.0%) | 0 (0.0%) |
| Bachelor's Degree | 0 (0.0%) | 0 (0.0%) |
| Graduate Degree | 0 (0.0%) | 0 (0.0%) |
| Total | 33 (16.2%) | 171 (83.8%) |
Employment Characteristics in Culpeper
Employment by Class of Employer in Culpeper
Among the 9,907 employed individuals in Culpeper, private company employees (6,910 | 69.8%), local government employees (1,009 | 10.2%), and federal government employees (598 | 6.0%) make up the most common classes of employment.
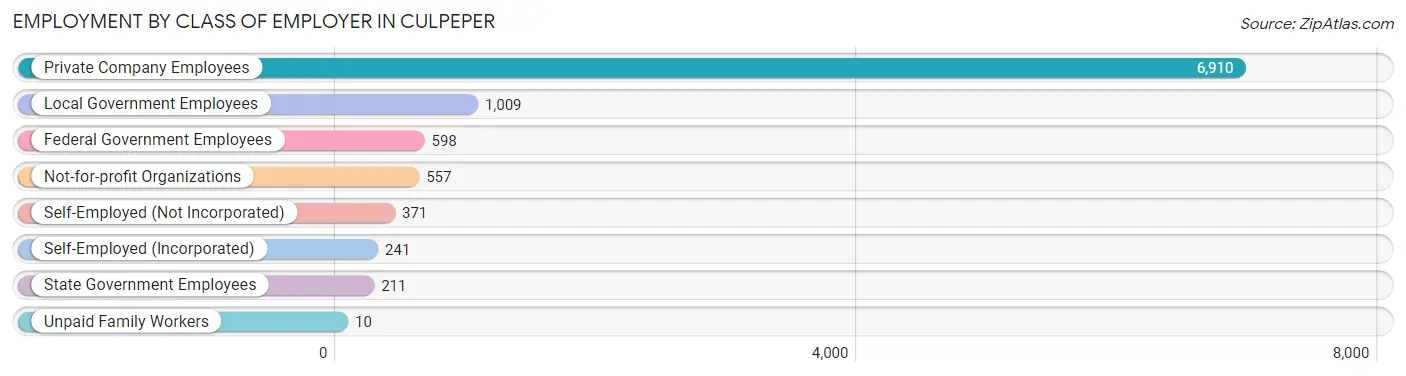
| Employer Class | # Employees | % Employees |
| Private Company Employees | 6,910 | 69.8% |
| Self-Employed (Incorporated) | 241 | 2.4% |
| Self-Employed (Not Incorporated) | 371 | 3.7% |
| Not-for-profit Organizations | 557 | 5.6% |
| Local Government Employees | 1,009 | 10.2% |
| State Government Employees | 211 | 2.1% |
| Federal Government Employees | 598 | 6.0% |
| Unpaid Family Workers | 10 | 0.1% |
| Total | 9,907 | 100.0% |
Employment Status by Age in Culpeper
According to the labor force statistics for Culpeper, out of the total population over 16 years of age (14,796), 70.6% or 10,446 individuals are in the labor force, with 3.9% or 407 of them unemployed. The age group with the highest labor force participation rate is 25 to 29 years, with 95.1% or 1,174 individuals in the labor force. Within the labor force, the 55 to 59 years age range has the highest percentage of unemployed individuals, with 13.2% or 91 of them being unemployed.
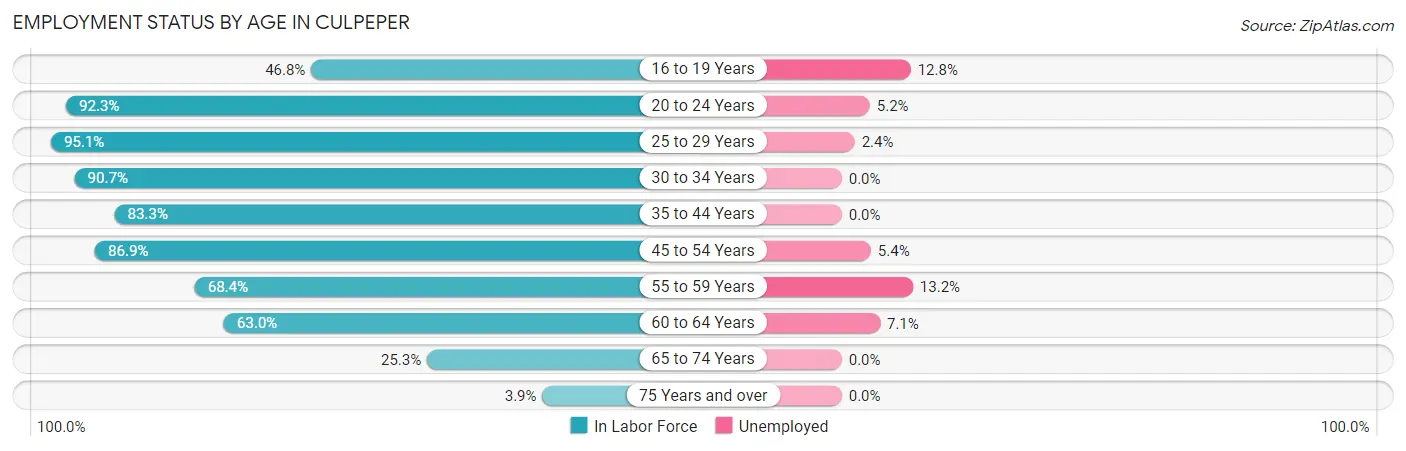
| Age Bracket | In Labor Force | Unemployed |
| 16 to 19 Years | 586 (46.8%) | 75 (12.8%) |
| 20 to 24 Years | 1,172 (92.3%) | 61 (5.2%) |
| 25 to 29 Years | 1,174 (95.1%) | 28 (2.4%) |
| 30 to 34 Years | 986 (90.7%) | 0 (0.0%) |
| 35 to 44 Years | 2,806 (83.3%) | 0 (0.0%) |
| 45 to 54 Years | 1,989 (86.9%) | 107 (5.4%) |
| 55 to 59 Years | 689 (68.4%) | 91 (13.2%) |
| 60 to 64 Years | 679 (63.0%) | 48 (7.1%) |
| 65 to 74 Years | 321 (25.3%) | 0 (0.0%) |
| 75 Years and over | 37 (3.9%) | 0 (0.0%) |
| Total | 10,446 (70.6%) | 407 (3.9%) |
Employment Status by Educational Attainment in Culpeper
According to labor force statistics for Culpeper, 82.7% of individuals (8,321) out of the total population between 25 and 64 years of age (10,062) are in the labor force, with 3.3% or 275 of them being unemployed. The group with the highest labor force participation rate are those with the educational attainment of bachelor's degree or higher, with 85.7% or 2,623 individuals in the labor force. Within the labor force, individuals with less than high school education have the highest percentage of unemployment, with 13.9% or 125 of them being unemployed.
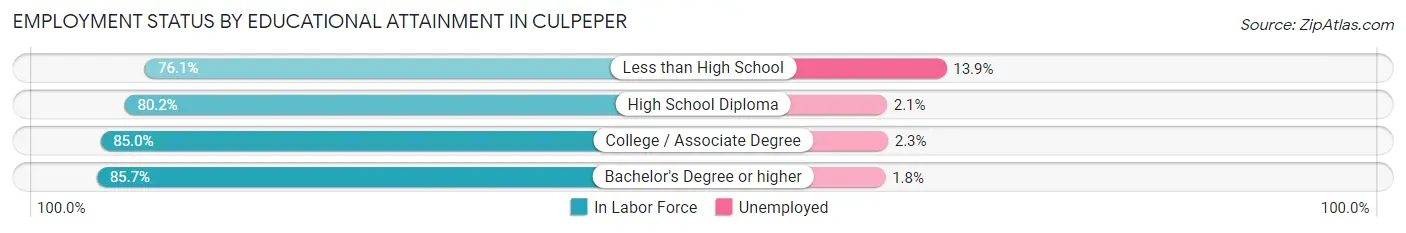
| Educational Attainment | In Labor Force | Unemployed |
| Less than High School | 898 (76.1%) | 164 (13.9%) |
| High School Diploma | 2,457 (80.2%) | 64 (2.1%) |
| College / Associate Degree | 2,344 (85.0%) | 63 (2.3%) |
| Bachelor's Degree or higher | 2,623 (85.7%) | 55 (1.8%) |
| Total | 8,321 (82.7%) | 332 (3.3%) |
Employment Occupations by Sex in Culpeper
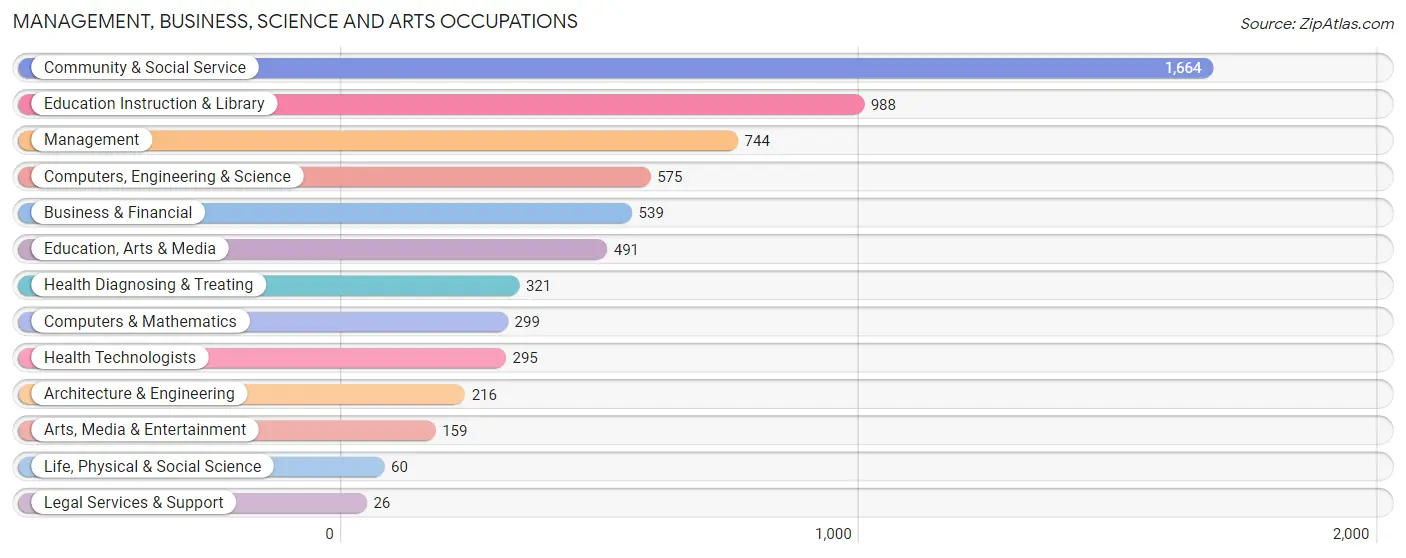
Management, Business, Science and Arts Occupations
The most common Management, Business, Science and Arts occupations in Culpeper are Community & Social Service (1,664 | 16.7%), Education Instruction & Library (988 | 9.9%), Management (744 | 7.4%), Computers, Engineering & Science (575 | 5.8%), and Business & Financial (539 | 5.4%).
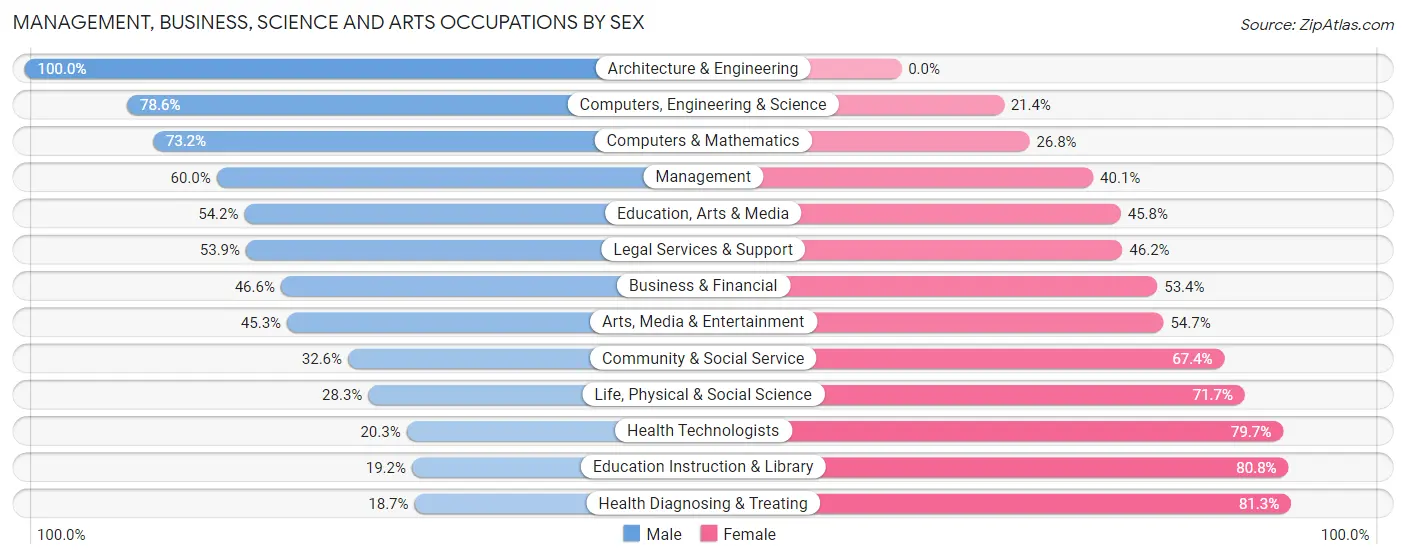
Management, Business, Science and Arts Occupations by Sex
Within the Management, Business, Science and Arts occupations in Culpeper, the most male-oriented occupations are Architecture & Engineering (100.0%), Computers, Engineering & Science (78.6%), and Computers & Mathematics (73.2%), while the most female-oriented occupations are Health Diagnosing & Treating (81.3%), Education Instruction & Library (80.8%), and Health Technologists (79.7%).
| Occupation | Male | Female |
| Management | 446 (60.0%) | 298 (40.1%) |
| Business & Financial | 251 (46.6%) | 288 (53.4%) |
| Computers, Engineering & Science | 452 (78.6%) | 123 (21.4%) |
| Computers & Mathematics | 219 (73.2%) | 80 (26.8%) |
| Architecture & Engineering | 216 (100.0%) | 0 (0.0%) |
| Life, Physical & Social Science | 17 (28.3%) | 43 (71.7%) |
| Community & Social Service | 542 (32.6%) | 1,122 (67.4%) |
| Education, Arts & Media | 266 (54.2%) | 225 (45.8%) |
| Legal Services & Support | 14 (53.8%) | 12 (46.2%) |
| Education Instruction & Library | 190 (19.2%) | 798 (80.8%) |
| Arts, Media & Entertainment | 72 (45.3%) | 87 (54.7%) |
| Health Diagnosing & Treating | 60 (18.7%) | 261 (81.3%) |
| Health Technologists | 60 (20.3%) | 235 (79.7%) |
| Total (Category) | 1,751 (45.6%) | 2,092 (54.4%) |
| Total (Overall) | 5,158 (51.7%) | 4,827 (48.3%) |
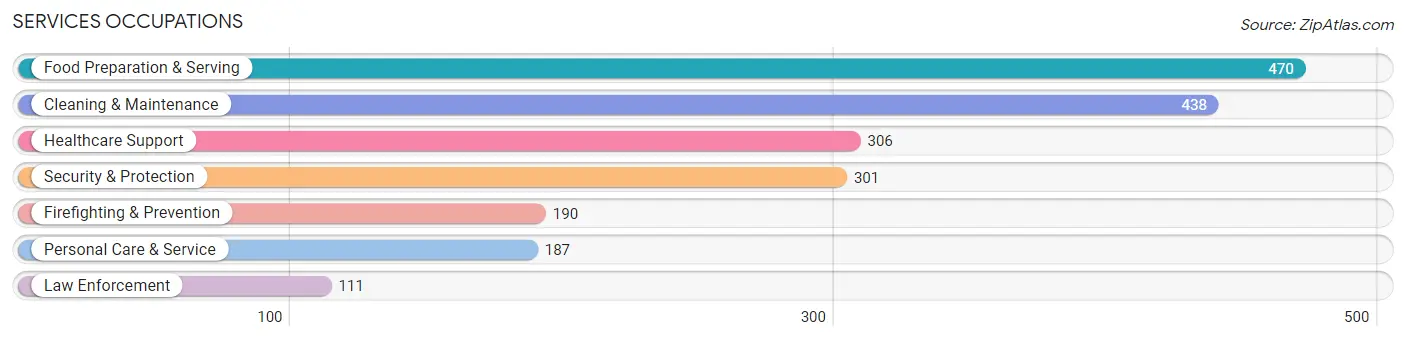
Services Occupations
The most common Services occupations in Culpeper are Food Preparation & Serving (470 | 4.7%), Cleaning & Maintenance (438 | 4.4%), Healthcare Support (306 | 3.1%), Security & Protection (301 | 3.0%), and Firefighting & Prevention (190 | 1.9%).
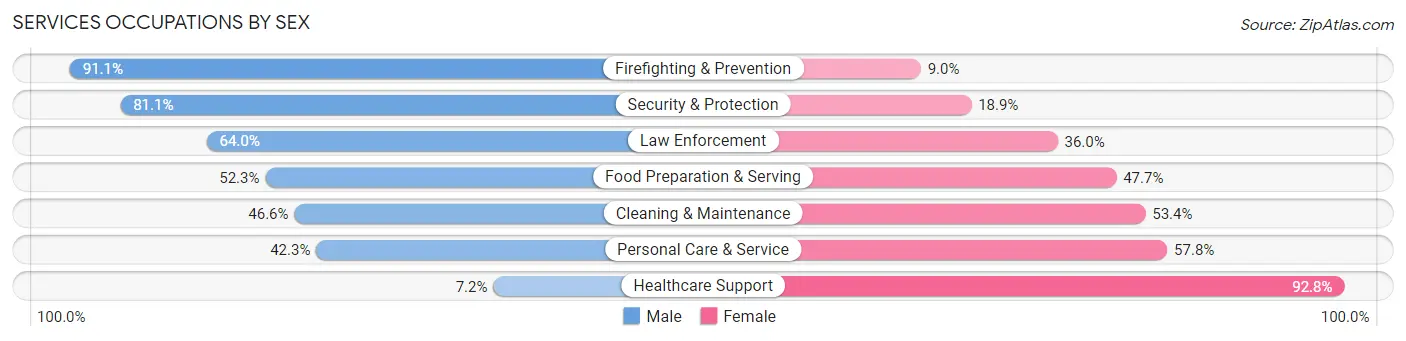
Services Occupations by Sex
Within the Services occupations in Culpeper, the most male-oriented occupations are Firefighting & Prevention (91.0%), Security & Protection (81.1%), and Law Enforcement (64.0%), while the most female-oriented occupations are Healthcare Support (92.8%), Personal Care & Service (57.8%), and Cleaning & Maintenance (53.4%).
| Occupation | Male | Female |
| Healthcare Support | 22 (7.2%) | 284 (92.8%) |
| Security & Protection | 244 (81.1%) | 57 (18.9%) |
| Firefighting & Prevention | 173 (91.0%) | 17 (8.9%) |
| Law Enforcement | 71 (64.0%) | 40 (36.0%) |
| Food Preparation & Serving | 246 (52.3%) | 224 (47.7%) |
| Cleaning & Maintenance | 204 (46.6%) | 234 (53.4%) |
| Personal Care & Service | 79 (42.2%) | 108 (57.8%) |
| Total (Category) | 795 (46.7%) | 907 (53.3%) |
| Total (Overall) | 5,158 (51.7%) | 4,827 (48.3%) |
Sales and Office Occupations
The most common Sales and Office occupations in Culpeper are Office & Administration (1,124 | 11.3%), and Sales & Related (954 | 9.6%).

Sales and Office Occupations by Sex
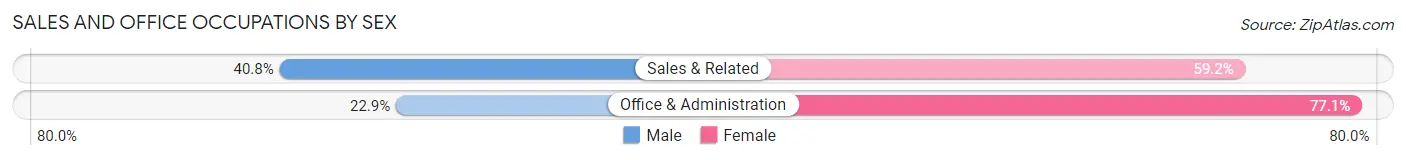
| Occupation | Male | Female |
| Sales & Related | 389 (40.8%) | 565 (59.2%) |
| Office & Administration | 257 (22.9%) | 867 (77.1%) |
| Total (Category) | 646 (31.1%) | 1,432 (68.9%) |
| Total (Overall) | 5,158 (51.7%) | 4,827 (48.3%) |
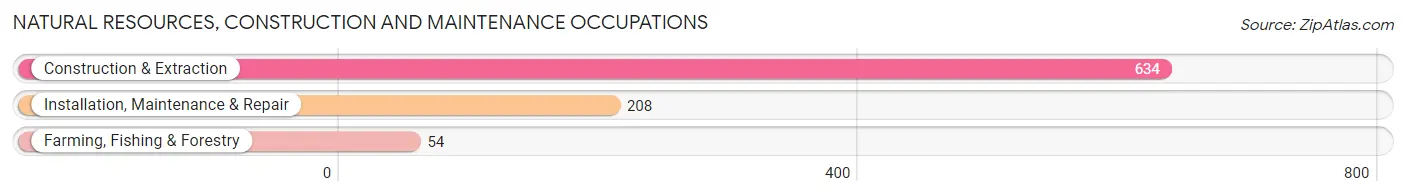
Natural Resources, Construction and Maintenance Occupations
The most common Natural Resources, Construction and Maintenance occupations in Culpeper are Construction & Extraction (634 | 6.4%), Installation, Maintenance & Repair (208 | 2.1%), and Farming, Fishing & Forestry (54 | 0.5%).
Natural Resources, Construction and Maintenance Occupations by Sex
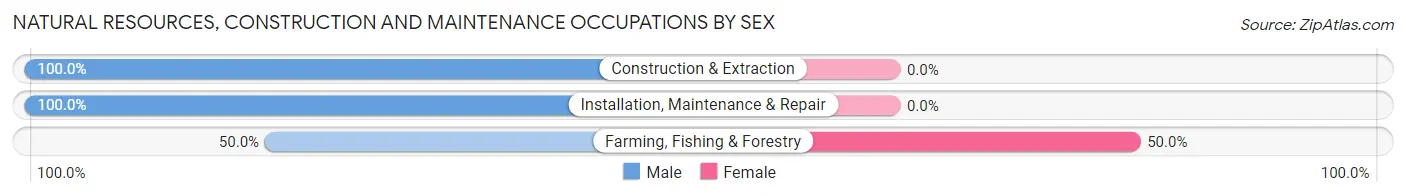
| Occupation | Male | Female |
| Farming, Fishing & Forestry | 27 (50.0%) | 27 (50.0%) |
| Construction & Extraction | 634 (100.0%) | 0 (0.0%) |
| Installation, Maintenance & Repair | 208 (100.0%) | 0 (0.0%) |
| Total (Category) | 869 (97.0%) | 27 (3.0%) |
| Total (Overall) | 5,158 (51.7%) | 4,827 (48.3%) |
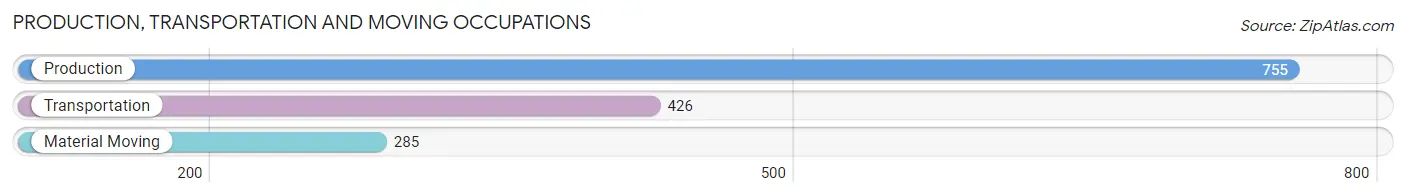
Production, Transportation and Moving Occupations
The most common Production, Transportation and Moving occupations in Culpeper are Production (755 | 7.6%), Transportation (426 | 4.3%), and Material Moving (285 | 2.9%).
Production, Transportation and Moving Occupations by Sex
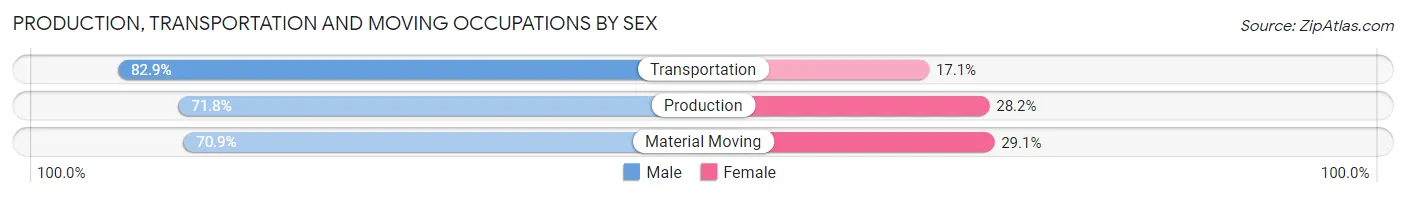
| Occupation | Male | Female |
| Production | 542 (71.8%) | 213 (28.2%) |
| Transportation | 353 (82.9%) | 73 (17.1%) |
| Material Moving | 202 (70.9%) | 83 (29.1%) |
| Total (Category) | 1,097 (74.8%) | 369 (25.2%) |
| Total (Overall) | 5,158 (51.7%) | 4,827 (48.3%) |
Employment Industries by Sex in Culpeper
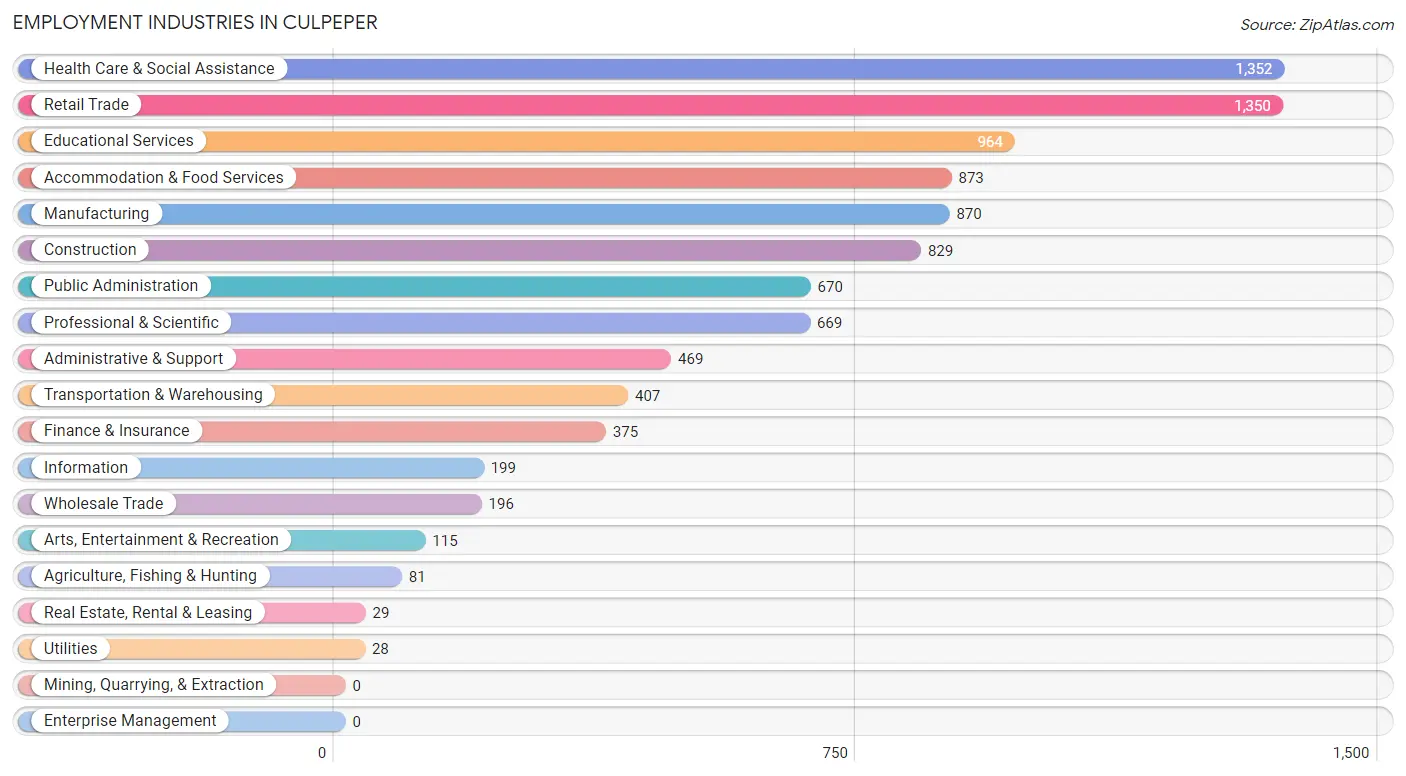
Employment Industries in Culpeper
The major employment industries in Culpeper include Health Care & Social Assistance (1,352 | 13.5%), Retail Trade (1,350 | 13.5%), Educational Services (964 | 9.7%), Accommodation & Food Services (873 | 8.7%), and Manufacturing (870 | 8.7%).
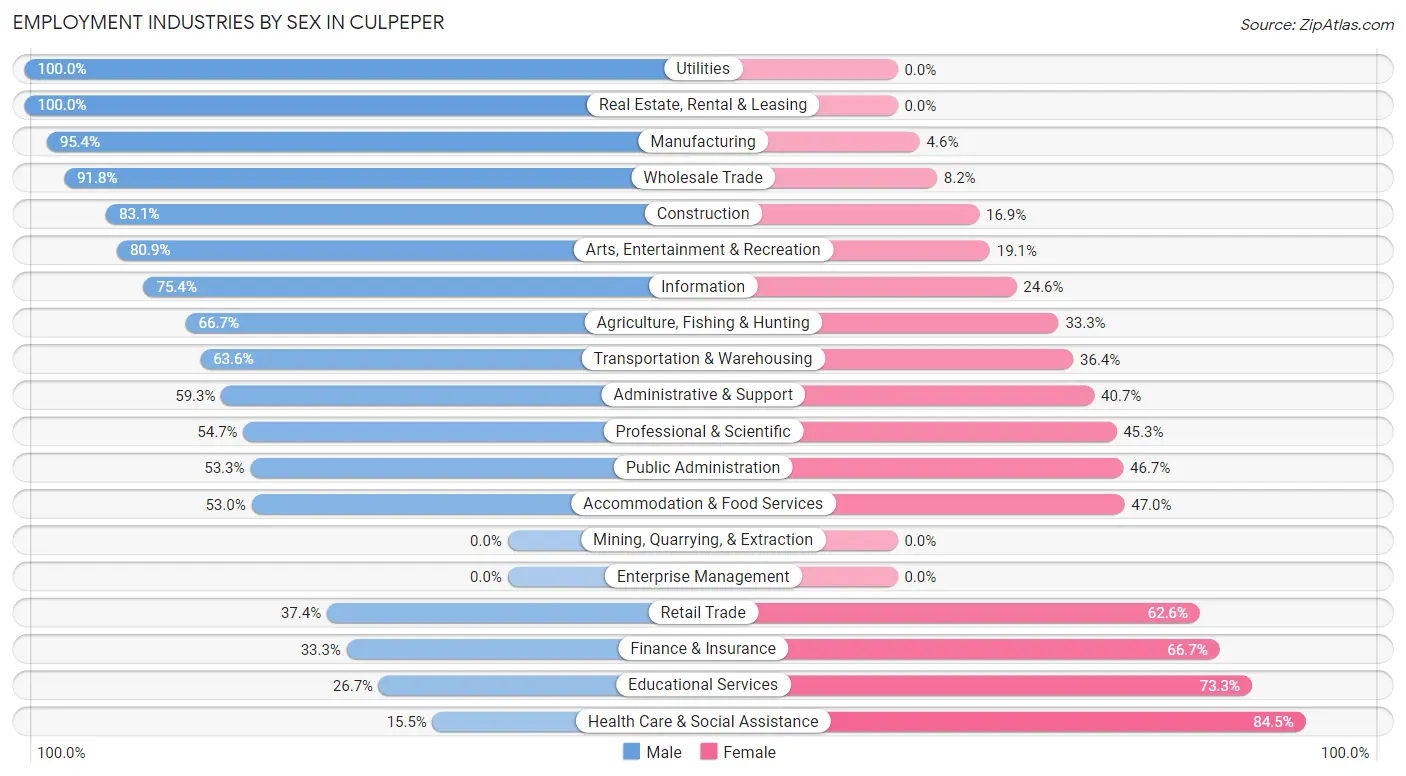
Employment Industries by Sex in Culpeper
The Culpeper industries that see more men than women are Utilities (100.0%), Real Estate, Rental & Leasing (100.0%), and Manufacturing (95.4%), whereas the industries that tend to have a higher number of women are Health Care & Social Assistance (84.5%), Educational Services (73.3%), and Finance & Insurance (66.7%).
| Industry | Male | Female |
| Agriculture, Fishing & Hunting | 54 (66.7%) | 27 (33.3%) |
| Mining, Quarrying, & Extraction | 0 (0.0%) | 0 (0.0%) |
| Construction | 689 (83.1%) | 140 (16.9%) |
| Manufacturing | 830 (95.4%) | 40 (4.6%) |
| Wholesale Trade | 180 (91.8%) | 16 (8.2%) |
| Retail Trade | 505 (37.4%) | 845 (62.6%) |
| Transportation & Warehousing | 259 (63.6%) | 148 (36.4%) |
| Utilities | 28 (100.0%) | 0 (0.0%) |
| Information | 150 (75.4%) | 49 (24.6%) |
| Finance & Insurance | 125 (33.3%) | 250 (66.7%) |
| Real Estate, Rental & Leasing | 29 (100.0%) | 0 (0.0%) |
| Professional & Scientific | 366 (54.7%) | 303 (45.3%) |
| Enterprise Management | 0 (0.0%) | 0 (0.0%) |
| Administrative & Support | 278 (59.3%) | 191 (40.7%) |
| Educational Services | 257 (26.7%) | 707 (73.3%) |
| Health Care & Social Assistance | 210 (15.5%) | 1,142 (84.5%) |
| Arts, Entertainment & Recreation | 93 (80.9%) | 22 (19.1%) |
| Accommodation & Food Services | 463 (53.0%) | 410 (47.0%) |
| Public Administration | 357 (53.3%) | 313 (46.7%) |
| Total | 5,158 (51.7%) | 4,827 (48.3%) |
Education in Culpeper
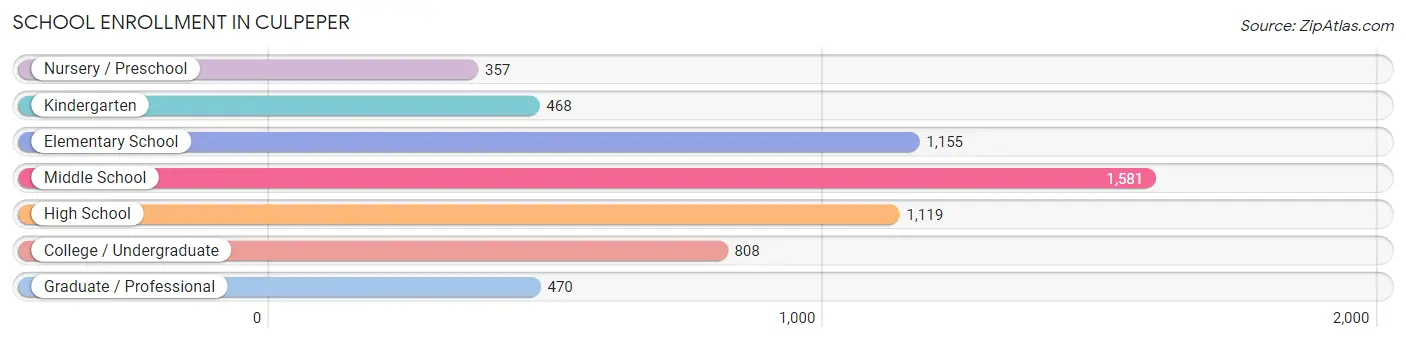
School Enrollment in Culpeper
The most common levels of schooling among the 5,958 students in Culpeper are middle school (1,581 | 26.5%), elementary school (1,155 | 19.4%), and high school (1,119 | 18.8%).
| School Level | # Students | % Students |
| Nursery / Preschool | 357 | 6.0% |
| Kindergarten | 468 | 7.9% |
| Elementary School | 1,155 | 19.4% |
| Middle School | 1,581 | 26.5% |
| High School | 1,119 | 18.8% |
| College / Undergraduate | 808 | 13.6% |
| Graduate / Professional | 470 | 7.9% |
| Total | 5,958 | 100.0% |
School Enrollment by Age by Funding Source in Culpeper
Out of a total of 5,958 students who are enrolled in schools in Culpeper, 798 (13.4%) attend a private institution, while the remaining 5,160 (86.6%) are enrolled in public schools. The age group of 35 years and over has the highest likelihood of being enrolled in private schools, with 250 (42.6% in the age bracket) enrolled. Conversely, the age group of 20 to 24 year olds has the lowest likelihood of being enrolled in a private school, with 269 (100.0% in the age bracket) attending a public institution.
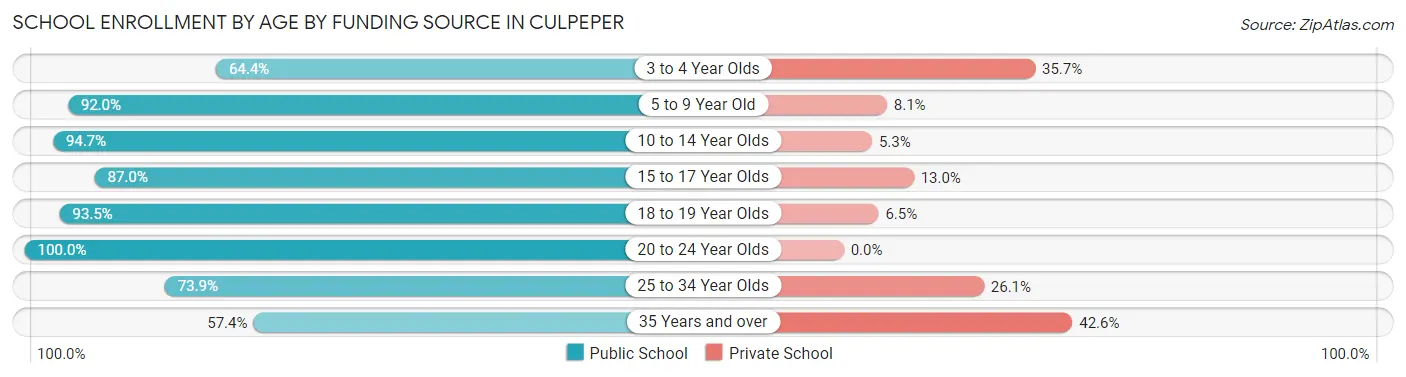
| Age Bracket | Public School | Private School |
| 3 to 4 Year Olds | 287 (64.3%) | 159 (35.6%) |
| 5 to 9 Year Old | 1,370 (91.9%) | 120 (8.1%) |
| 10 to 14 Year Olds | 1,781 (94.7%) | 99 (5.3%) |
| 15 to 17 Year Olds | 600 (87.0%) | 90 (13.0%) |
| 18 to 19 Year Olds | 346 (93.5%) | 24 (6.5%) |
| 20 to 24 Year Olds | 269 (100.0%) | 0 (0.0%) |
| 25 to 34 Year Olds | 167 (73.9%) | 59 (26.1%) |
| 35 Years and over | 337 (57.4%) | 250 (42.6%) |
| Total | 5,160 (86.6%) | 798 (13.4%) |
Educational Attainment by Field of Study in Culpeper
Business (698 | 17.2%), education (569 | 14.0%), arts & humanities (525 | 13.0%), social sciences (510 | 12.6%), and psychology (369 | 9.1%) are the most common fields of study among 4,053 individuals in Culpeper who have obtained a bachelor's degree or higher.
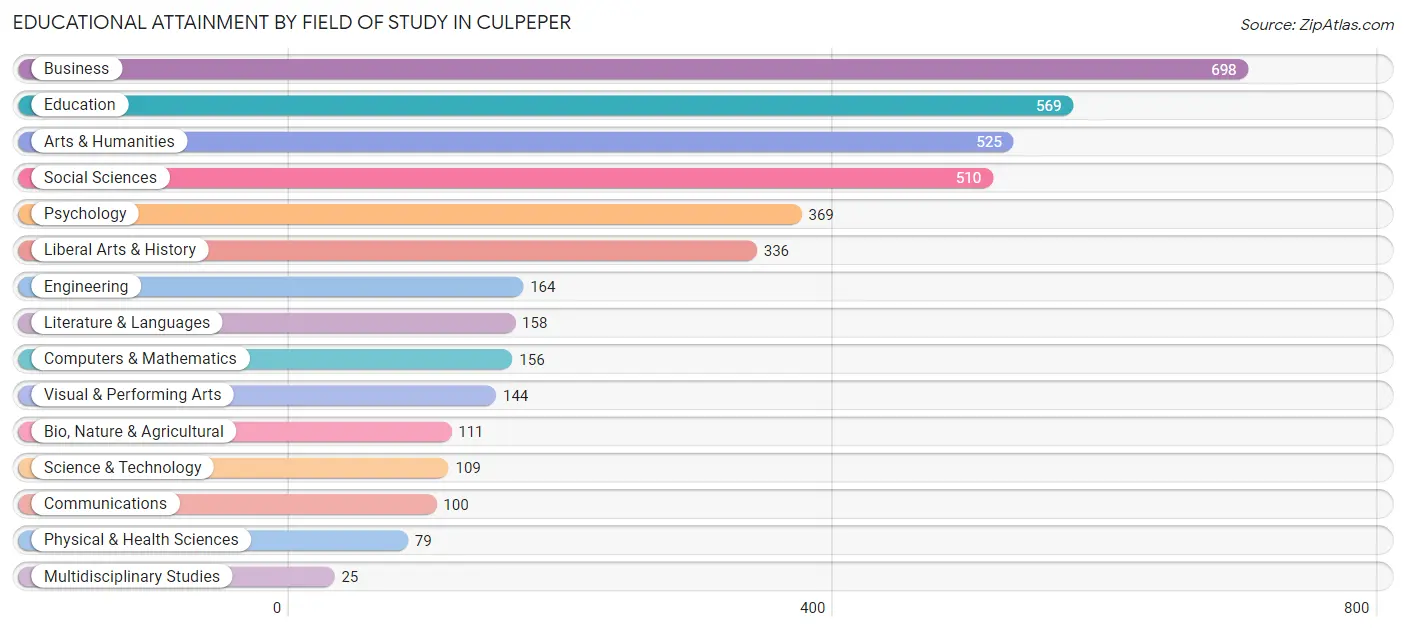
| Field of Study | # Graduates | % Graduates |
| Computers & Mathematics | 156 | 3.8% |
| Bio, Nature & Agricultural | 111 | 2.7% |
| Physical & Health Sciences | 79 | 1.9% |
| Psychology | 369 | 9.1% |
| Social Sciences | 510 | 12.6% |
| Engineering | 164 | 4.1% |
| Multidisciplinary Studies | 25 | 0.6% |
| Science & Technology | 109 | 2.7% |
| Business | 698 | 17.2% |
| Education | 569 | 14.0% |
| Literature & Languages | 158 | 3.9% |
| Liberal Arts & History | 336 | 8.3% |
| Visual & Performing Arts | 144 | 3.5% |
| Communications | 100 | 2.5% |
| Arts & Humanities | 525 | 13.0% |
| Total | 4,053 | 100.0% |
Transportation & Commute in Culpeper
Vehicle Availability by Sex in Culpeper
The most prevalent vehicle ownership categories in Culpeper are males with 2 vehicles (2,298, accounting for 44.7%) and females with 2 vehicles (1,631, making up 48.5%).
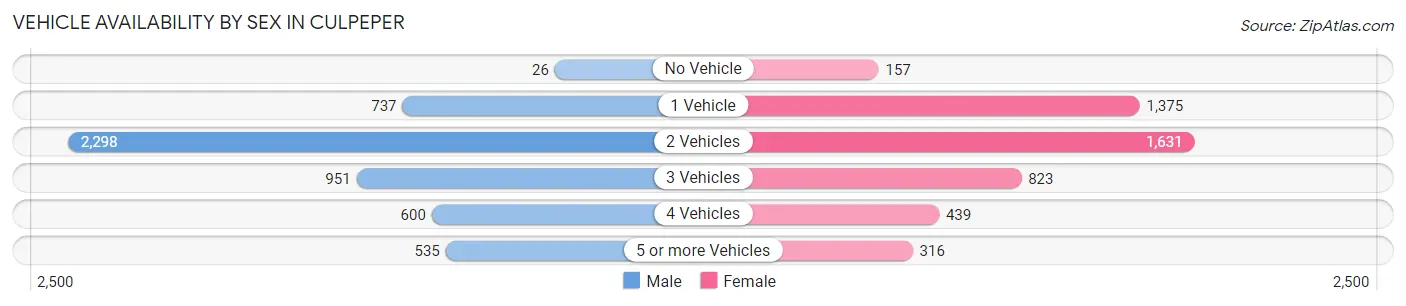
| Vehicles Available | Male | Female |
| No Vehicle | 26 (0.5%) | 157 (3.3%) |
| 1 Vehicle | 737 (14.3%) | 1,375 (29.0%) |
| 2 Vehicles | 2,298 (44.7%) | 1,631 (34.4%) |
| 3 Vehicles | 951 (18.5%) | 823 (17.4%) |
| 4 Vehicles | 600 (11.7%) | 439 (9.3%) |
| 5 or more Vehicles | 535 (10.4%) | 316 (6.7%) |
| Total | 5,147 (100.0%) | 4,741 (100.0%) |
Commute Time in Culpeper
The most frequently occuring commute durations in Culpeper are 5 to 9 minutes (1,873 commuters, 20.2%), 10 to 14 minutes (1,422 commuters, 15.3%), and 90 or more minutes (1,178 commuters, 12.7%).
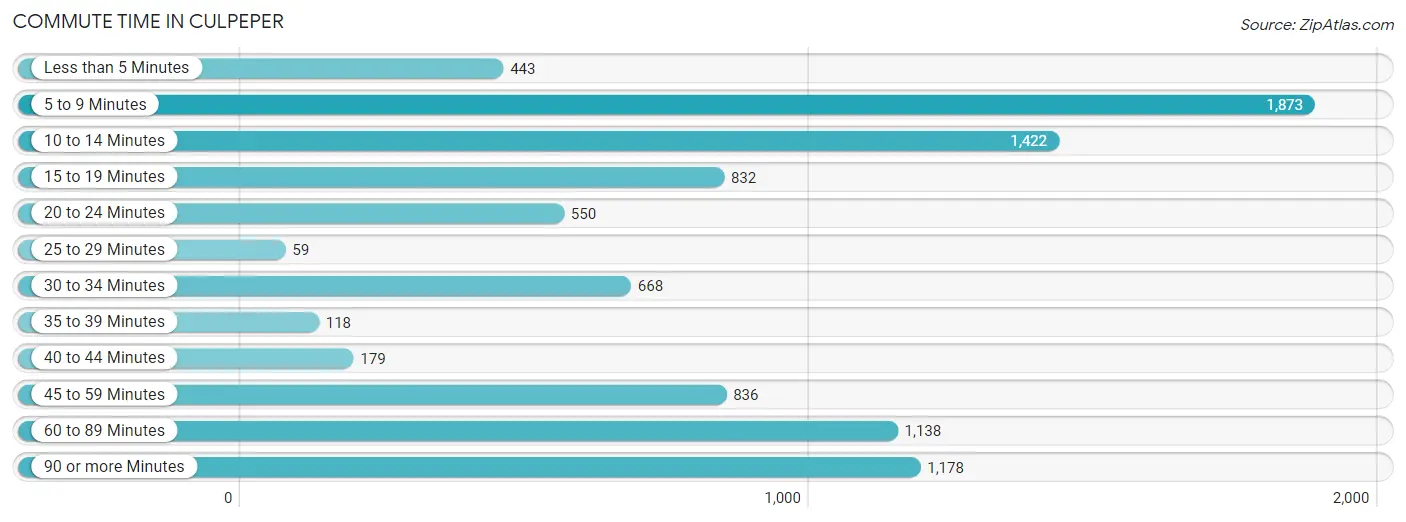
| Commute Time | # Commuters | % Commuters |
| Less than 5 Minutes | 443 | 4.8% |
| 5 to 9 Minutes | 1,873 | 20.2% |
| 10 to 14 Minutes | 1,422 | 15.3% |
| 15 to 19 Minutes | 832 | 8.9% |
| 20 to 24 Minutes | 550 | 5.9% |
| 25 to 29 Minutes | 59 | 0.6% |
| 30 to 34 Minutes | 668 | 7.2% |
| 35 to 39 Minutes | 118 | 1.3% |
| 40 to 44 Minutes | 179 | 1.9% |
| 45 to 59 Minutes | 836 | 9.0% |
| 60 to 89 Minutes | 1,138 | 12.2% |
| 90 or more Minutes | 1,178 | 12.7% |
Commute Time by Sex in Culpeper
The most common commute times in Culpeper are 5 to 9 minutes (901 commuters, 18.5%) for males and 5 to 9 minutes (972 commuters, 22.0%) for females.
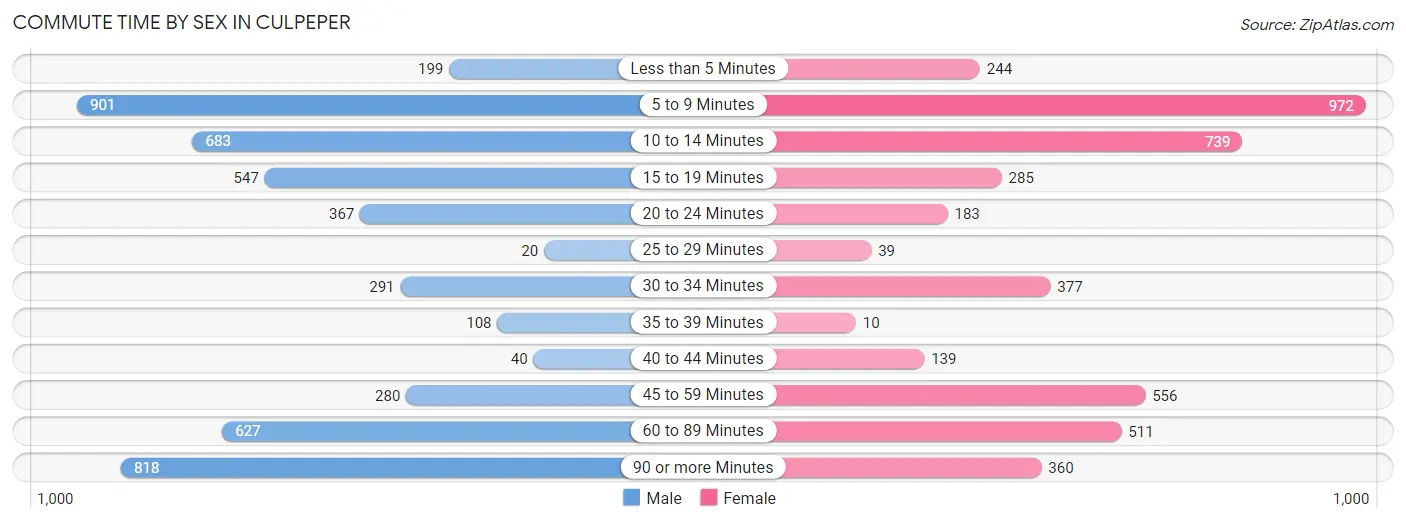
| Commute Time | Male | Female |
| Less than 5 Minutes | 199 (4.1%) | 244 (5.5%) |
| 5 to 9 Minutes | 901 (18.5%) | 972 (22.0%) |
| 10 to 14 Minutes | 683 (14.0%) | 739 (16.7%) |
| 15 to 19 Minutes | 547 (11.2%) | 285 (6.5%) |
| 20 to 24 Minutes | 367 (7.5%) | 183 (4.1%) |
| 25 to 29 Minutes | 20 (0.4%) | 39 (0.9%) |
| 30 to 34 Minutes | 291 (6.0%) | 377 (8.5%) |
| 35 to 39 Minutes | 108 (2.2%) | 10 (0.2%) |
| 40 to 44 Minutes | 40 (0.8%) | 139 (3.2%) |
| 45 to 59 Minutes | 280 (5.7%) | 556 (12.6%) |
| 60 to 89 Minutes | 627 (12.9%) | 511 (11.6%) |
| 90 or more Minutes | 818 (16.8%) | 360 (8.2%) |
Time of Departure to Work by Sex in Culpeper
The most frequent times of departure to work in Culpeper are 12:00 AM to 4:59 AM (947, 19.4%) for males and 7:30 AM to 7:59 AM (620, 14.0%) for females.
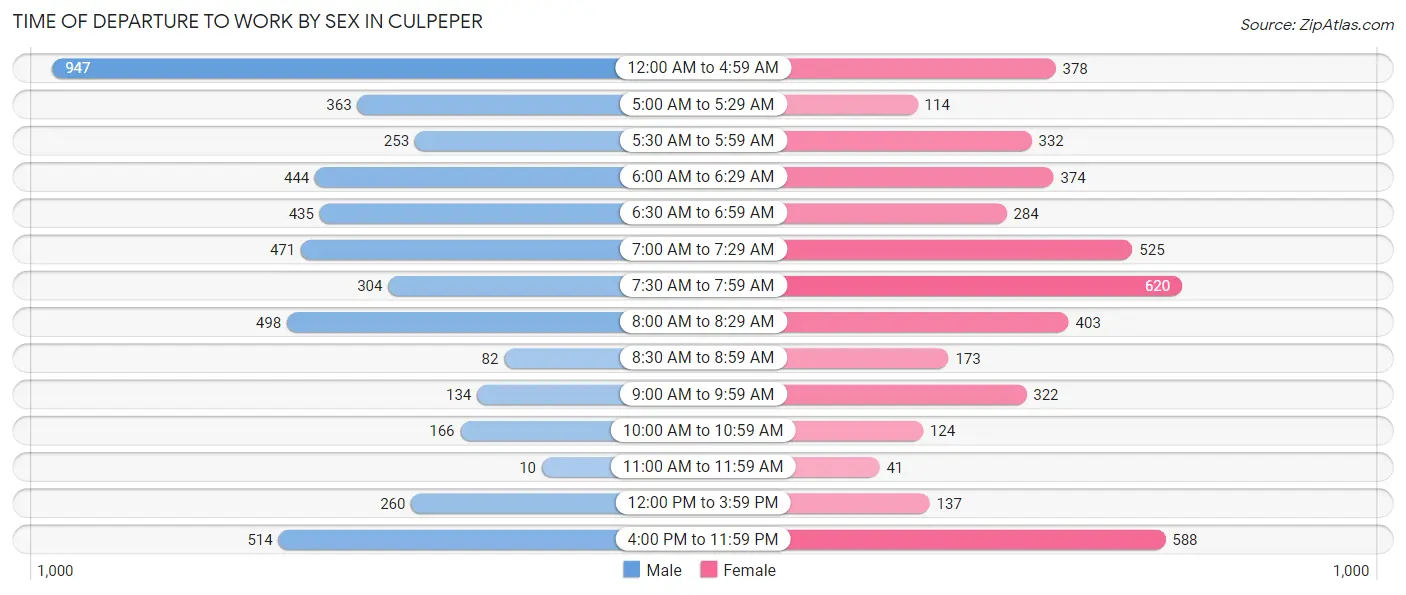
| Time of Departure | Male | Female |
| 12:00 AM to 4:59 AM | 947 (19.4%) | 378 (8.6%) |
| 5:00 AM to 5:29 AM | 363 (7.4%) | 114 (2.6%) |
| 5:30 AM to 5:59 AM | 253 (5.2%) | 332 (7.5%) |
| 6:00 AM to 6:29 AM | 444 (9.1%) | 374 (8.5%) |
| 6:30 AM to 6:59 AM | 435 (8.9%) | 284 (6.4%) |
| 7:00 AM to 7:29 AM | 471 (9.7%) | 525 (11.9%) |
| 7:30 AM to 7:59 AM | 304 (6.2%) | 620 (14.0%) |
| 8:00 AM to 8:29 AM | 498 (10.2%) | 403 (9.1%) |
| 8:30 AM to 8:59 AM | 82 (1.7%) | 173 (3.9%) |
| 9:00 AM to 9:59 AM | 134 (2.8%) | 322 (7.3%) |
| 10:00 AM to 10:59 AM | 166 (3.4%) | 124 (2.8%) |
| 11:00 AM to 11:59 AM | 10 (0.2%) | 41 (0.9%) |
| 12:00 PM to 3:59 PM | 260 (5.3%) | 137 (3.1%) |
| 4:00 PM to 11:59 PM | 514 (10.5%) | 588 (13.3%) |
| Total | 4,881 (100.0%) | 4,415 (100.0%) |
Housing Occupancy in Culpeper
Occupancy by Ownership in Culpeper
Of the total 6,740 dwellings in Culpeper, owner-occupied units account for 3,920 (58.2%), while renter-occupied units make up 2,820 (41.8%).
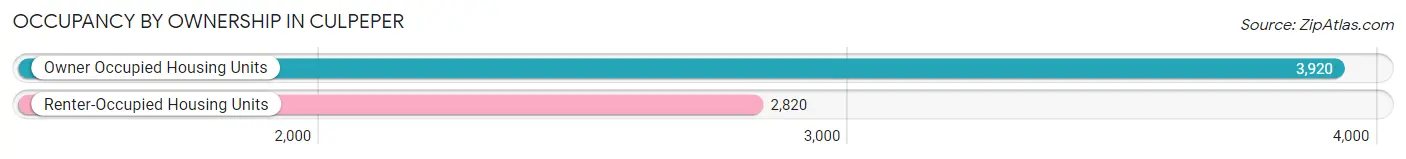
| Occupancy | # Housing Units | % Housing Units |
| Owner Occupied Housing Units | 3,920 | 58.2% |
| Renter-Occupied Housing Units | 2,820 | 41.8% |
| Total Occupied Housing Units | 6,740 | 100.0% |
Occupancy by Household Size in Culpeper
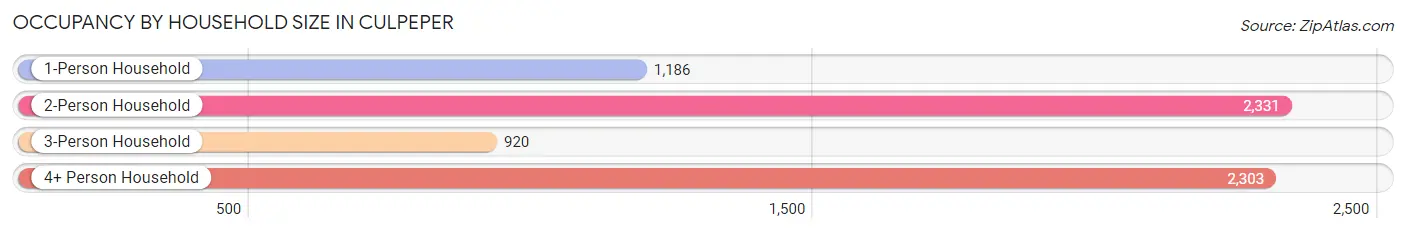
| Household Size | # Housing Units | % Housing Units |
| 1-Person Household | 1,186 | 17.6% |
| 2-Person Household | 2,331 | 34.6% |
| 3-Person Household | 920 | 13.7% |
| 4+ Person Household | 2,303 | 34.2% |
| Total Housing Units | 6,740 | 100.0% |
Occupancy by Ownership by Household Size in Culpeper
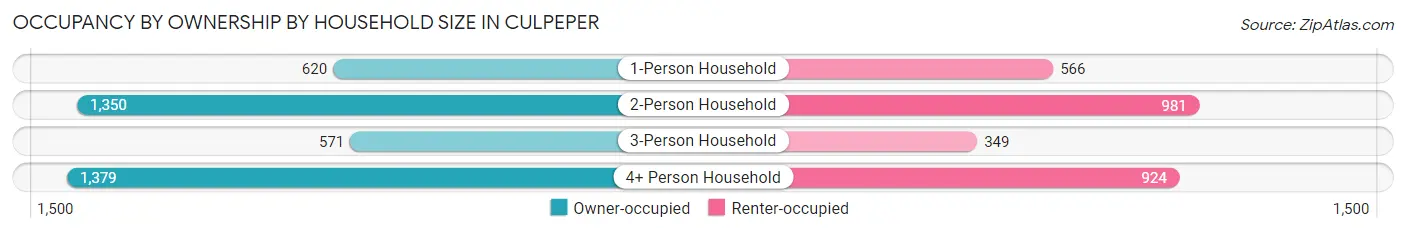
| Household Size | Owner-occupied | Renter-occupied |
| 1-Person Household | 620 (52.3%) | 566 (47.7%) |
| 2-Person Household | 1,350 (57.9%) | 981 (42.1%) |
| 3-Person Household | 571 (62.1%) | 349 (37.9%) |
| 4+ Person Household | 1,379 (59.9%) | 924 (40.1%) |
| Total Housing Units | 3,920 (58.2%) | 2,820 (41.8%) |
Occupancy by Educational Attainment in Culpeper
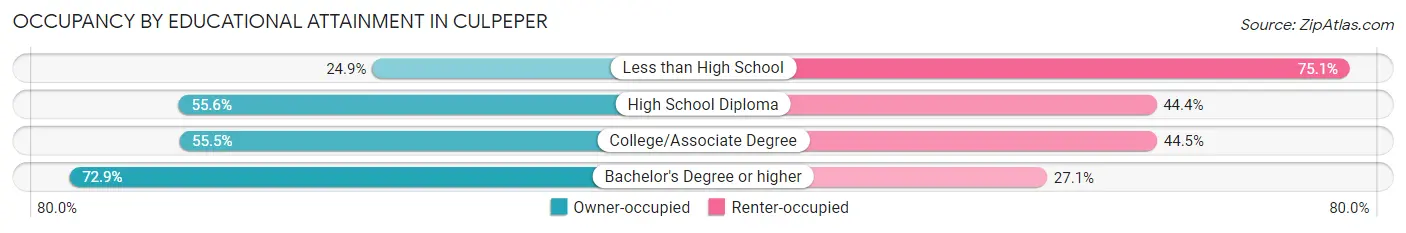
| Household Size | Owner-occupied | Renter-occupied |
| Less than High School | 183 (24.9%) | 553 (75.1%) |
| High School Diploma | 952 (55.6%) | 761 (44.4%) |
| College/Associate Degree | 1,094 (55.5%) | 878 (44.5%) |
| Bachelor's Degree or higher | 1,691 (72.9%) | 628 (27.1%) |
Occupancy by Age of Householder in Culpeper
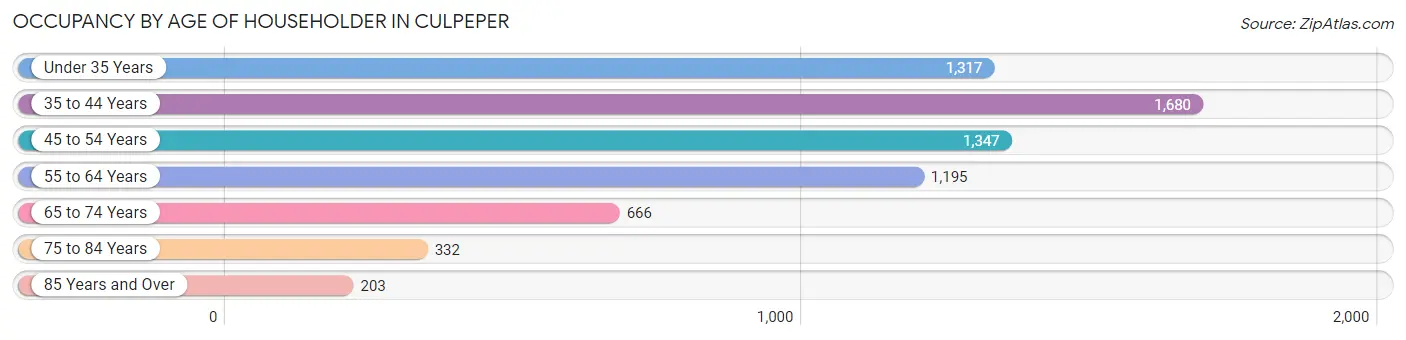
| Age Bracket | # Households | % Households |
| Under 35 Years | 1,317 | 19.5% |
| 35 to 44 Years | 1,680 | 24.9% |
| 45 to 54 Years | 1,347 | 20.0% |
| 55 to 64 Years | 1,195 | 17.7% |
| 65 to 74 Years | 666 | 9.9% |
| 75 to 84 Years | 332 | 4.9% |
| 85 Years and Over | 203 | 3.0% |
| Total | 6,740 | 100.0% |
Housing Finances in Culpeper
Median Income by Occupancy in Culpeper
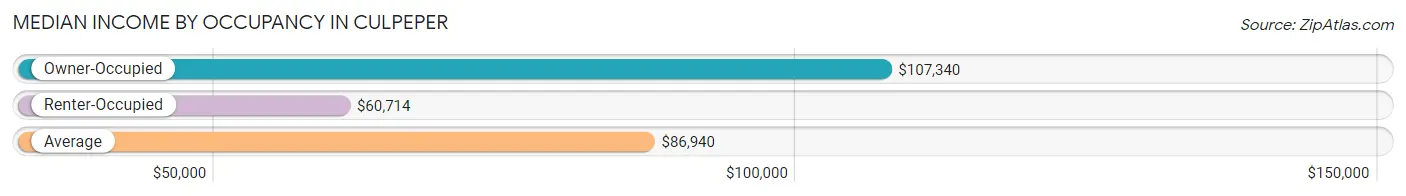
| Occupancy Type | # Households | Median Income |
| Owner-Occupied | 3,920 (58.2%) | $107,340 |
| Renter-Occupied | 2,820 (41.8%) | $60,714 |
| Average | 6,740 (100.0%) | $86,940 |
Occupancy by Householder Income Bracket in Culpeper
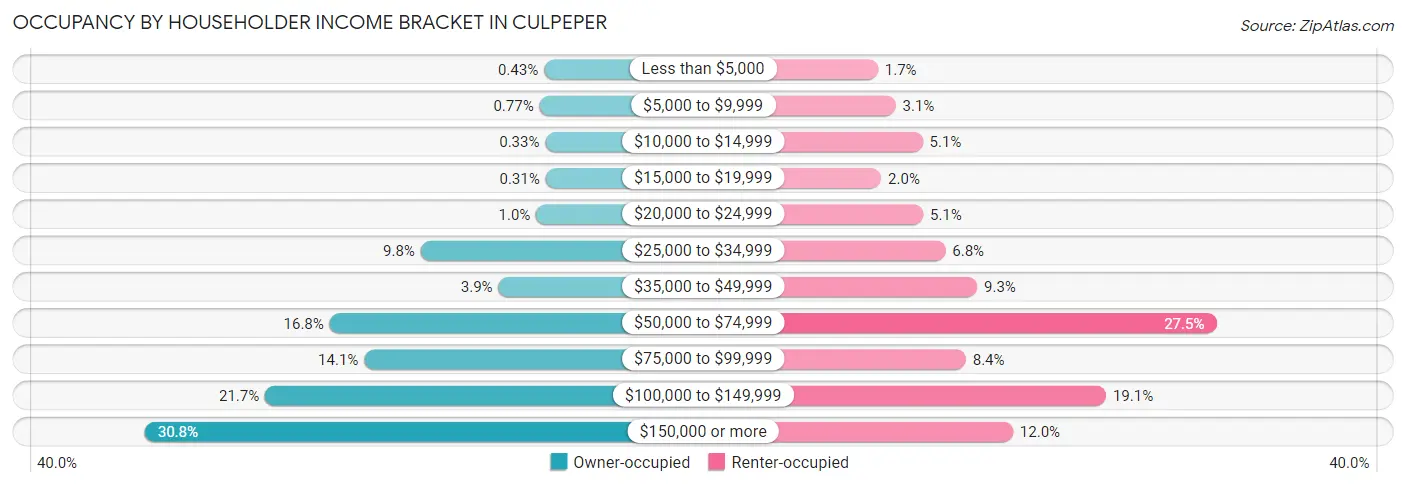
| Income Bracket | Owner-occupied | Renter-occupied |
| Less than $5,000 | 17 (0.4%) | 48 (1.7%) |
| $5,000 to $9,999 | 30 (0.8%) | 86 (3.0%) |
| $10,000 to $14,999 | 13 (0.3%) | 144 (5.1%) |
| $15,000 to $19,999 | 12 (0.3%) | 55 (1.9%) |
| $20,000 to $24,999 | 40 (1.0%) | 145 (5.1%) |
| $25,000 to $34,999 | 385 (9.8%) | 193 (6.8%) |
| $35,000 to $49,999 | 153 (3.9%) | 261 (9.3%) |
| $50,000 to $74,999 | 657 (16.8%) | 775 (27.5%) |
| $75,000 to $99,999 | 554 (14.1%) | 237 (8.4%) |
| $100,000 to $149,999 | 850 (21.7%) | 538 (19.1%) |
| $150,000 or more | 1,209 (30.8%) | 338 (12.0%) |
| Total | 3,920 (100.0%) | 2,820 (100.0%) |
Monthly Housing Cost Tiers in Culpeper
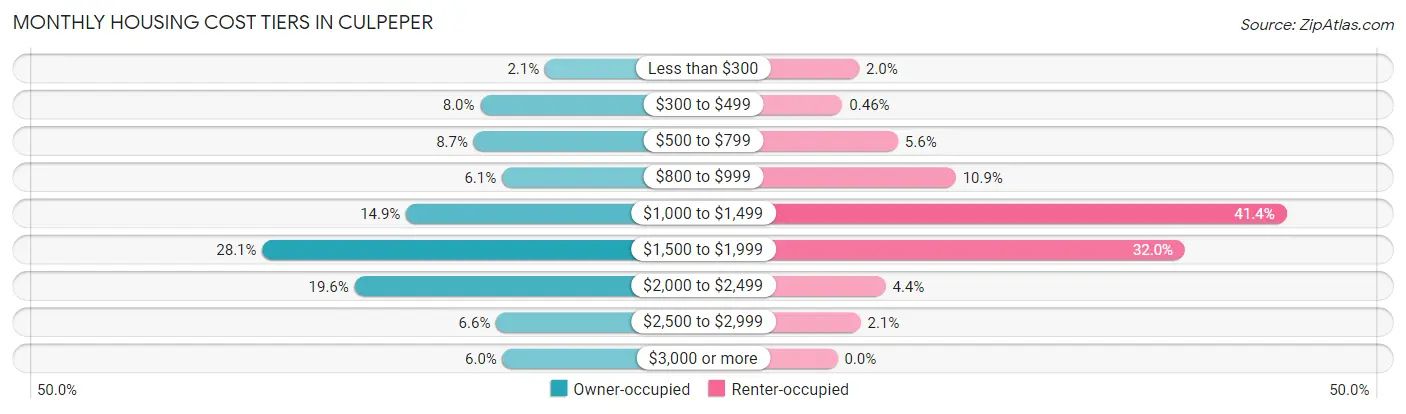
| Monthly Cost | Owner-occupied | Renter-occupied |
| Less than $300 | 82 (2.1%) | 56 (2.0%) |
| $300 to $499 | 315 (8.0%) | 13 (0.5%) |
| $500 to $799 | 339 (8.6%) | 157 (5.6%) |
| $800 to $999 | 237 (6.0%) | 307 (10.9%) |
| $1,000 to $1,499 | 583 (14.9%) | 1,166 (41.3%) |
| $1,500 to $1,999 | 1,102 (28.1%) | 902 (32.0%) |
| $2,000 to $2,499 | 769 (19.6%) | 125 (4.4%) |
| $2,500 to $2,999 | 258 (6.6%) | 60 (2.1%) |
| $3,000 or more | 235 (6.0%) | 0 (0.0%) |
| Total | 3,920 (100.0%) | 2,820 (100.0%) |
Physical Housing Characteristics in Culpeper
Housing Structures in Culpeper
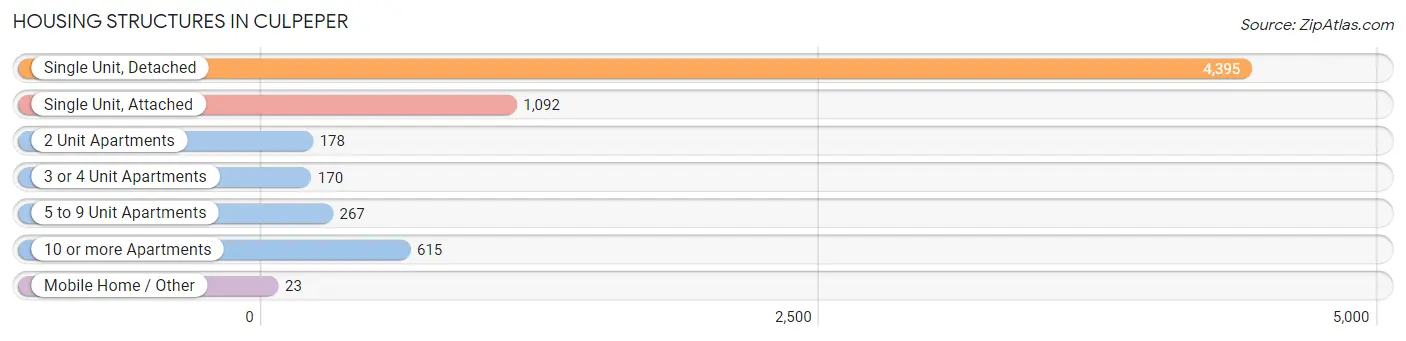
| Structure Type | # Housing Units | % Housing Units |
| Single Unit, Detached | 4,395 | 65.2% |
| Single Unit, Attached | 1,092 | 16.2% |
| 2 Unit Apartments | 178 | 2.6% |
| 3 or 4 Unit Apartments | 170 | 2.5% |
| 5 to 9 Unit Apartments | 267 | 4.0% |
| 10 or more Apartments | 615 | 9.1% |
| Mobile Home / Other | 23 | 0.3% |
| Total | 6,740 | 100.0% |
Housing Structures by Occupancy in Culpeper
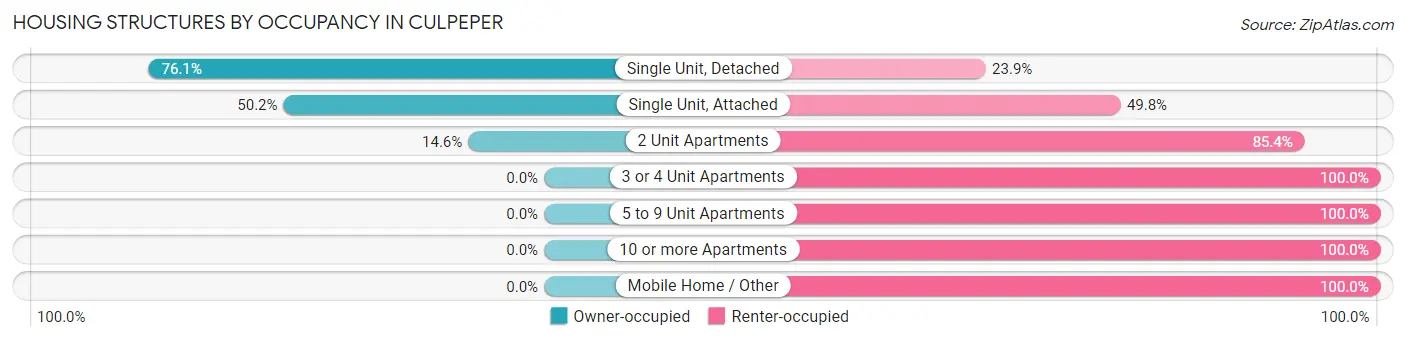
| Structure Type | Owner-occupied | Renter-occupied |
| Single Unit, Detached | 3,346 (76.1%) | 1,049 (23.9%) |
| Single Unit, Attached | 548 (50.2%) | 544 (49.8%) |
| 2 Unit Apartments | 26 (14.6%) | 152 (85.4%) |
| 3 or 4 Unit Apartments | 0 (0.0%) | 170 (100.0%) |
| 5 to 9 Unit Apartments | 0 (0.0%) | 267 (100.0%) |
| 10 or more Apartments | 0 (0.0%) | 615 (100.0%) |
| Mobile Home / Other | 0 (0.0%) | 23 (100.0%) |
| Total | 3,920 (58.2%) | 2,820 (41.8%) |
Housing Structures by Number of Rooms in Culpeper
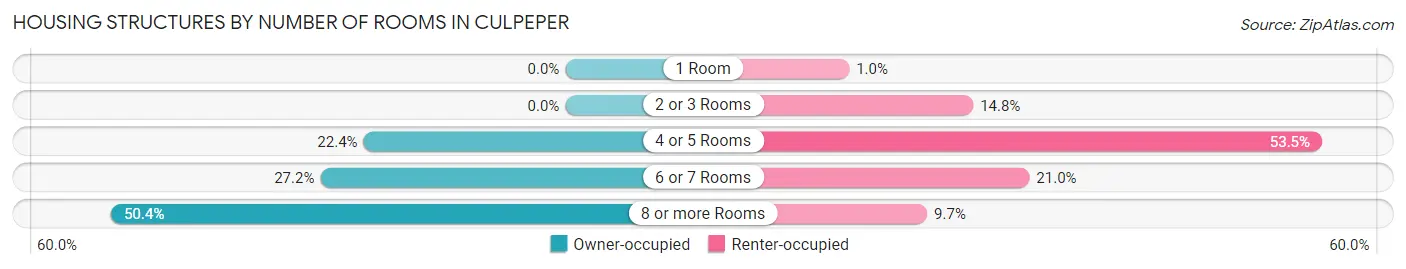
| Number of Rooms | Owner-occupied | Renter-occupied |
| 1 Room | 0 (0.0%) | 29 (1.0%) |
| 2 or 3 Rooms | 0 (0.0%) | 417 (14.8%) |
| 4 or 5 Rooms | 878 (22.4%) | 1,508 (53.5%) |
| 6 or 7 Rooms | 1,066 (27.2%) | 593 (21.0%) |
| 8 or more Rooms | 1,976 (50.4%) | 273 (9.7%) |
| Total | 3,920 (100.0%) | 2,820 (100.0%) |
Housing Structure by Heating Type in Culpeper
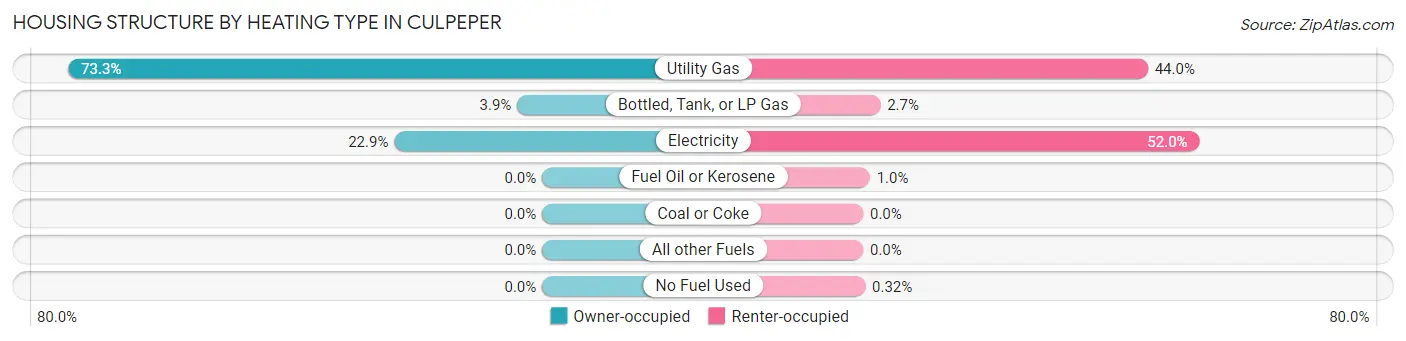
| Heating Type | Owner-occupied | Renter-occupied |
| Utility Gas | 2,873 (73.3%) | 1,241 (44.0%) |
| Bottled, Tank, or LP Gas | 151 (3.8%) | 75 (2.7%) |
| Electricity | 896 (22.9%) | 1,466 (52.0%) |
| Fuel Oil or Kerosene | 0 (0.0%) | 29 (1.0%) |
| Coal or Coke | 0 (0.0%) | 0 (0.0%) |
| All other Fuels | 0 (0.0%) | 0 (0.0%) |
| No Fuel Used | 0 (0.0%) | 9 (0.3%) |
| Total | 3,920 (100.0%) | 2,820 (100.0%) |
Household Vehicle Usage in Culpeper
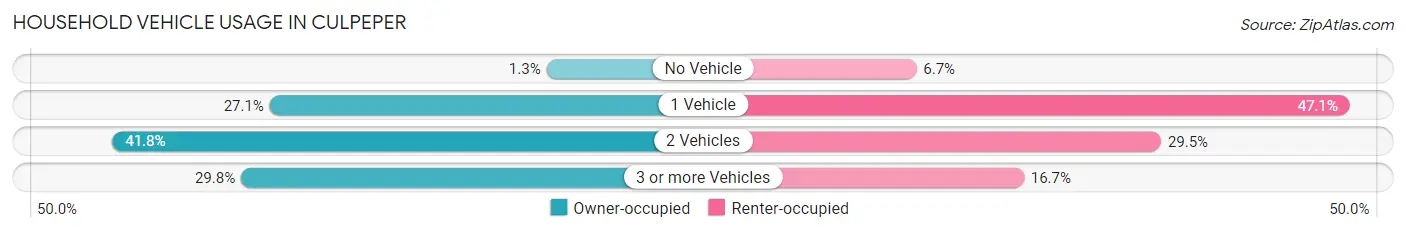
| Vehicles per Household | Owner-occupied | Renter-occupied |
| No Vehicle | 50 (1.3%) | 188 (6.7%) |
| 1 Vehicle | 1,063 (27.1%) | 1,329 (47.1%) |
| 2 Vehicles | 1,639 (41.8%) | 832 (29.5%) |
| 3 or more Vehicles | 1,168 (29.8%) | 471 (16.7%) |
| Total | 3,920 (100.0%) | 2,820 (100.0%) |
Real Estate & Mortgages in Culpeper
Real Estate and Mortgage Overview in Culpeper
| Characteristic | Without Mortgage | With Mortgage |
| Housing Units | 781 | 3,139 |
| Median Property Value | $344,600 | $337,800 |
| Median Household Income | $84,116 | $1,013 |
| Monthly Housing Costs | $545 | $235 |
| Real Estate Taxes | $2,019 | $103 |
Property Value by Mortgage Status in Culpeper
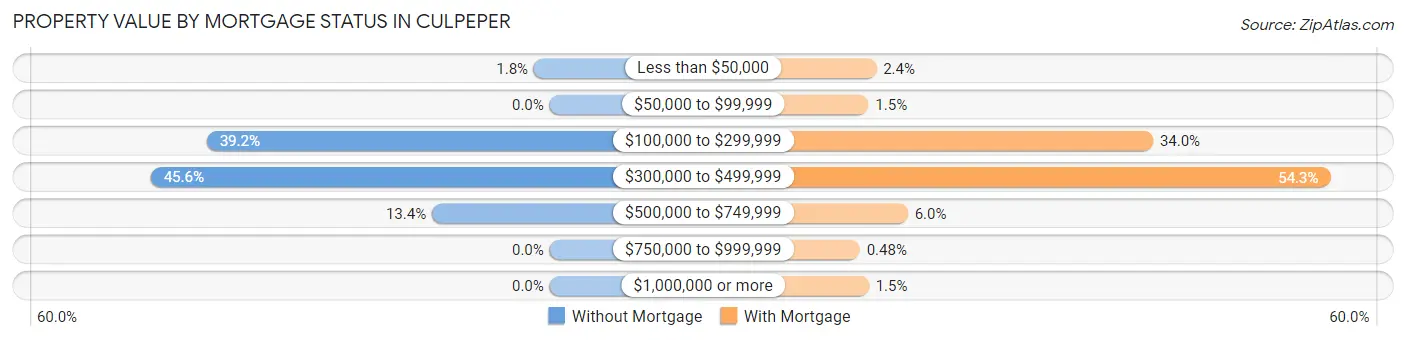
| Property Value | Without Mortgage | With Mortgage |
| Less than $50,000 | 14 (1.8%) | 74 (2.4%) |
| $50,000 to $99,999 | 0 (0.0%) | 46 (1.5%) |
| $100,000 to $299,999 | 306 (39.2%) | 1,067 (34.0%) |
| $300,000 to $499,999 | 356 (45.6%) | 1,703 (54.2%) |
| $500,000 to $749,999 | 105 (13.4%) | 187 (6.0%) |
| $750,000 to $999,999 | 0 (0.0%) | 15 (0.5%) |
| $1,000,000 or more | 0 (0.0%) | 47 (1.5%) |
| Total | 781 (100.0%) | 3,139 (100.0%) |
Household Income by Mortgage Status in Culpeper
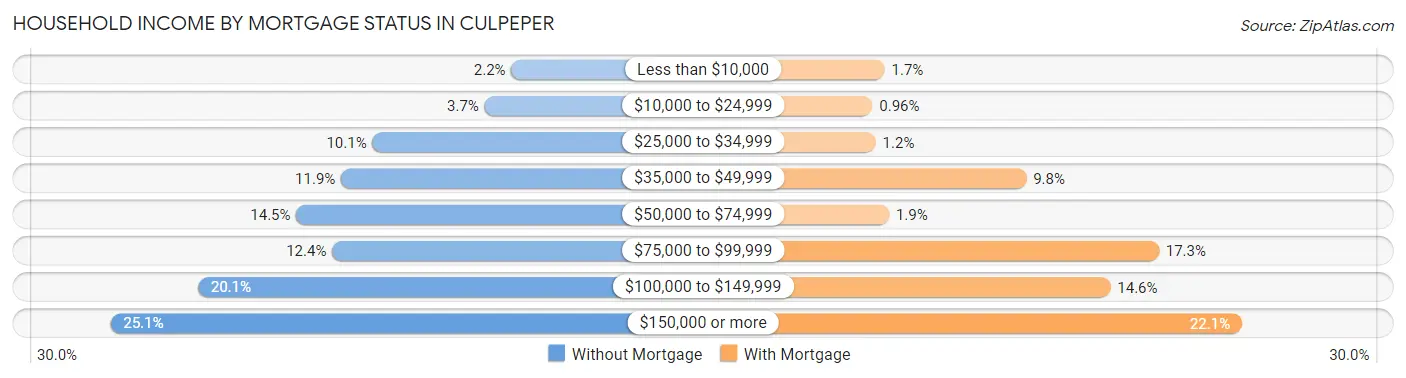
| Household Income | Without Mortgage | With Mortgage |
| Less than $10,000 | 17 (2.2%) | 52 (1.7%) |
| $10,000 to $24,999 | 29 (3.7%) | 30 (1.0%) |
| $25,000 to $34,999 | 79 (10.1%) | 36 (1.1%) |
| $35,000 to $49,999 | 93 (11.9%) | 306 (9.8%) |
| $50,000 to $74,999 | 113 (14.5%) | 60 (1.9%) |
| $75,000 to $99,999 | 97 (12.4%) | 544 (17.3%) |
| $100,000 to $149,999 | 157 (20.1%) | 457 (14.6%) |
| $150,000 or more | 196 (25.1%) | 693 (22.1%) |
| Total | 781 (100.0%) | 3,139 (100.0%) |
Property Value to Household Income Ratio in Culpeper
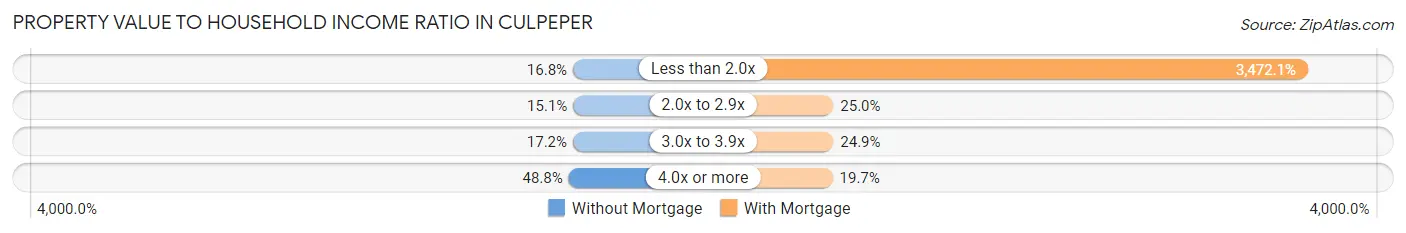
| Value-to-Income Ratio | Without Mortgage | With Mortgage |
| Less than 2.0x | 131 (16.8%) | 108,990 (3,472.1%) |
| 2.0x to 2.9x | 118 (15.1%) | 786 (25.0%) |
| 3.0x to 3.9x | 134 (17.2%) | 783 (24.9%) |
| 4.0x or more | 381 (48.8%) | 617 (19.7%) |
| Total | 781 (100.0%) | 3,139 (100.0%) |
Real Estate Taxes by Mortgage Status in Culpeper
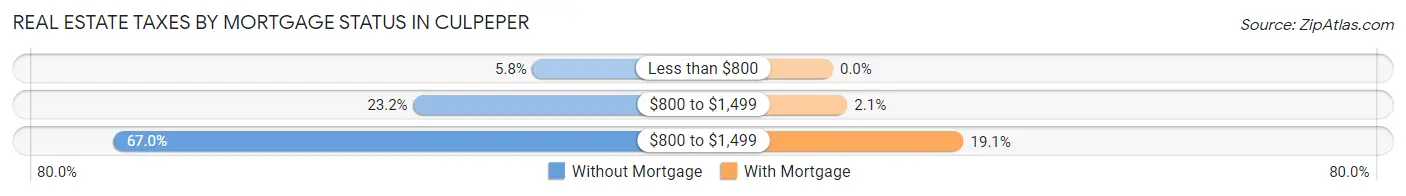
| Property Taxes | Without Mortgage | With Mortgage |
| Less than $800 | 45 (5.8%) | 0 (0.0%) |
| $800 to $1,499 | 181 (23.2%) | 66 (2.1%) |
| $800 to $1,499 | 523 (67.0%) | 599 (19.1%) |
| Total | 781 (100.0%) | 3,139 (100.0%) |
Health & Disability in Culpeper
Health Insurance Coverage by Age in Culpeper
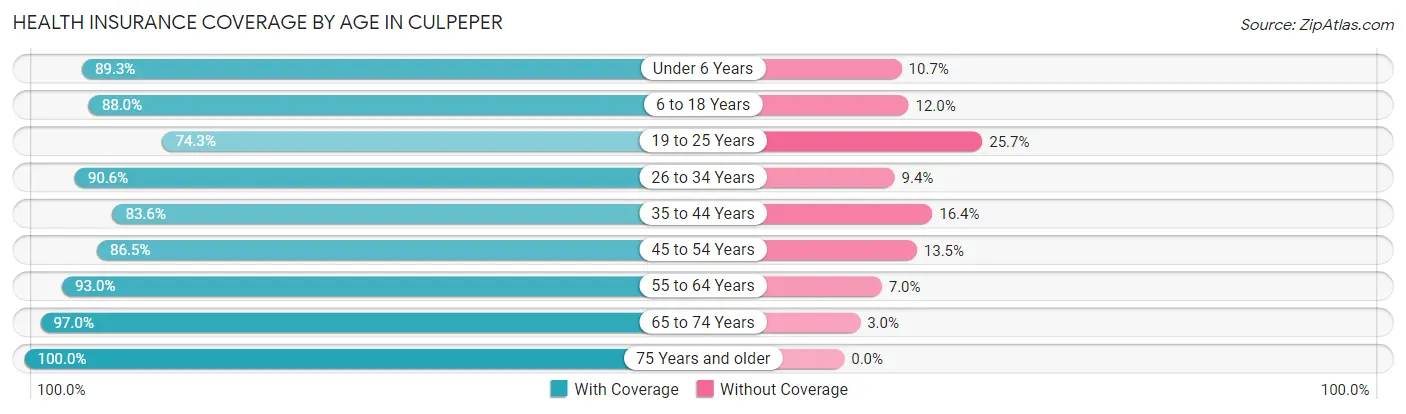
| Age Bracket | With Coverage | Without Coverage |
| Under 6 Years | 1,736 (89.3%) | 208 (10.7%) |
| 6 to 18 Years | 3,824 (88.0%) | 521 (12.0%) |
| 19 to 25 Years | 1,328 (74.3%) | 460 (25.7%) |
| 26 to 34 Years | 1,827 (90.6%) | 189 (9.4%) |
| 35 to 44 Years | 2,797 (83.6%) | 549 (16.4%) |
| 45 to 54 Years | 1,950 (86.5%) | 305 (13.5%) |
| 55 to 64 Years | 1,930 (93.0%) | 145 (7.0%) |
| 65 to 74 Years | 1,177 (97.0%) | 36 (3.0%) |
| 75 Years and older | 886 (100.0%) | 0 (0.0%) |
| Total | 17,455 (87.8%) | 2,413 (12.1%) |
Health Insurance Coverage by Citizenship Status in Culpeper
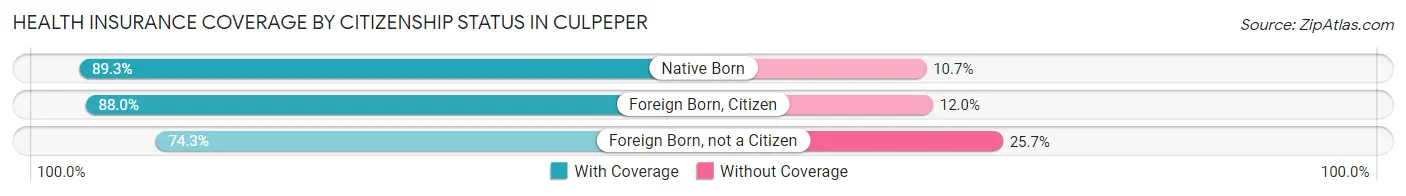
| Citizenship Status | With Coverage | Without Coverage |
| Native Born | 1,736 (89.3%) | 208 (10.7%) |
| Foreign Born, Citizen | 3,824 (88.0%) | 521 (12.0%) |
| Foreign Born, not a Citizen | 1,328 (74.3%) | 460 (25.7%) |
Health Insurance Coverage by Household Income in Culpeper
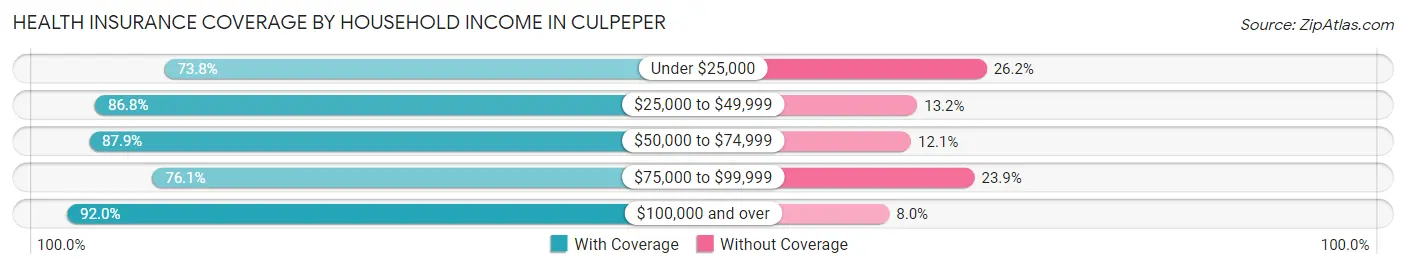
| Household Income | With Coverage | Without Coverage |
| Under $25,000 | 718 (73.8%) | 255 (26.2%) |
| $25,000 to $49,999 | 2,011 (86.8%) | 306 (13.2%) |
| $50,000 to $74,999 | 3,055 (87.9%) | 419 (12.1%) |
| $75,000 to $99,999 | 1,863 (76.1%) | 586 (23.9%) |
| $100,000 and over | 9,750 (92.0%) | 845 (8.0%) |
Public vs Private Health Insurance Coverage by Age in Culpeper
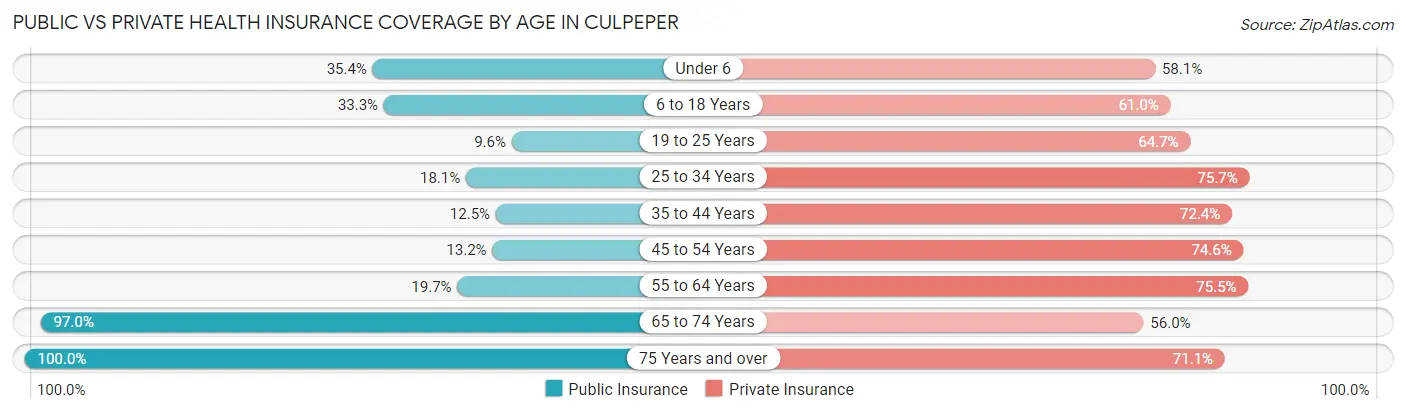
| Age Bracket | Public Insurance | Private Insurance |
| Under 6 | 688 (35.4%) | 1,130 (58.1%) |
| 6 to 18 Years | 1,447 (33.3%) | 2,652 (61.0%) |
| 19 to 25 Years | 171 (9.6%) | 1,157 (64.7%) |
| 25 to 34 Years | 364 (18.1%) | 1,526 (75.7%) |
| 35 to 44 Years | 419 (12.5%) | 2,424 (72.4%) |
| 45 to 54 Years | 297 (13.2%) | 1,682 (74.6%) |
| 55 to 64 Years | 408 (19.7%) | 1,566 (75.5%) |
| 65 to 74 Years | 1,177 (97.0%) | 679 (56.0%) |
| 75 Years and over | 886 (100.0%) | 630 (71.1%) |
| Total | 5,857 (29.5%) | 13,446 (67.7%) |
Disability Status by Sex by Age in Culpeper
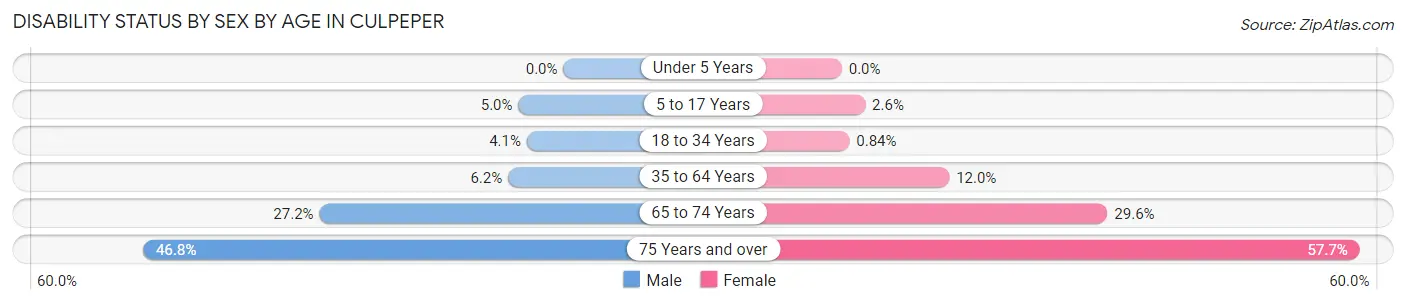
| Age Bracket | Male | Female |
| Under 5 Years | 0 (0.0%) | 0 (0.0%) |
| 5 to 17 Years | 94 (5.0%) | 59 (2.6%) |
| 18 to 34 Years | 92 (4.1%) | 17 (0.8%) |
| 35 to 64 Years | 224 (6.2%) | 483 (12.0%) |
| 65 to 74 Years | 144 (27.2%) | 202 (29.6%) |
| 75 Years and over | 198 (46.8%) | 267 (57.7%) |
Disability Class by Sex by Age in Culpeper
Disability Class: Hearing Difficulty
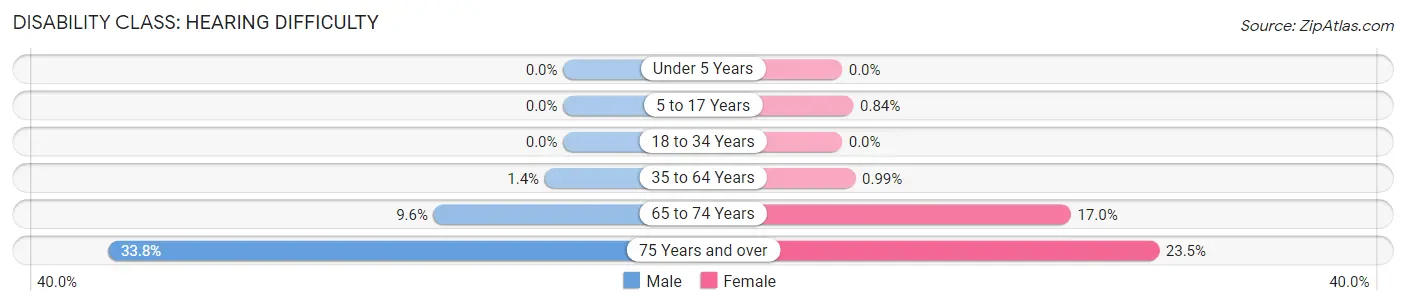
| Age Bracket | Male | Female |
| Under 5 Years | 0 (0.0%) | 0 (0.0%) |
| 5 to 17 Years | 0 (0.0%) | 19 (0.8%) |
| 18 to 34 Years | 0 (0.0%) | 0 (0.0%) |
| 35 to 64 Years | 50 (1.4%) | 40 (1.0%) |
| 65 to 74 Years | 51 (9.6%) | 116 (17.0%) |
| 75 Years and over | 143 (33.8%) | 109 (23.5%) |
Disability Class: Vision Difficulty
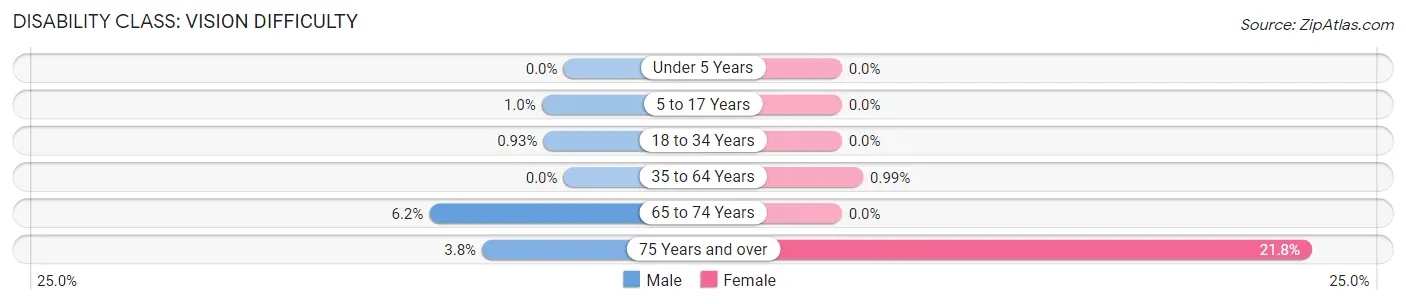
| Age Bracket | Male | Female |
| Under 5 Years | 0 (0.0%) | 0 (0.0%) |
| 5 to 17 Years | 19 (1.0%) | 0 (0.0%) |
| 18 to 34 Years | 21 (0.9%) | 0 (0.0%) |
| 35 to 64 Years | 0 (0.0%) | 40 (1.0%) |
| 65 to 74 Years | 33 (6.2%) | 0 (0.0%) |
| 75 Years and over | 16 (3.8%) | 101 (21.8%) |
Disability Class: Cognitive Difficulty
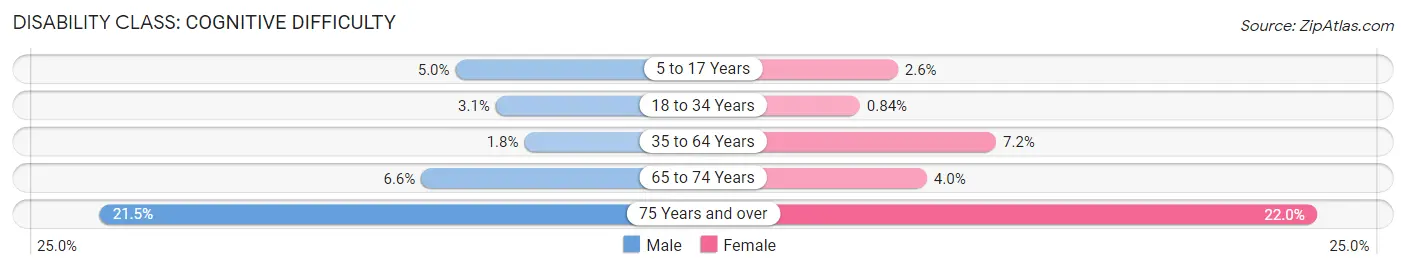
| Age Bracket | Male | Female |
| 5 to 17 Years | 94 (5.0%) | 59 (2.6%) |
| 18 to 34 Years | 71 (3.1%) | 17 (0.8%) |
| 35 to 64 Years | 66 (1.8%) | 289 (7.2%) |
| 65 to 74 Years | 35 (6.6%) | 27 (4.0%) |
| 75 Years and over | 91 (21.5%) | 102 (22.0%) |
Disability Class: Ambulatory Difficulty
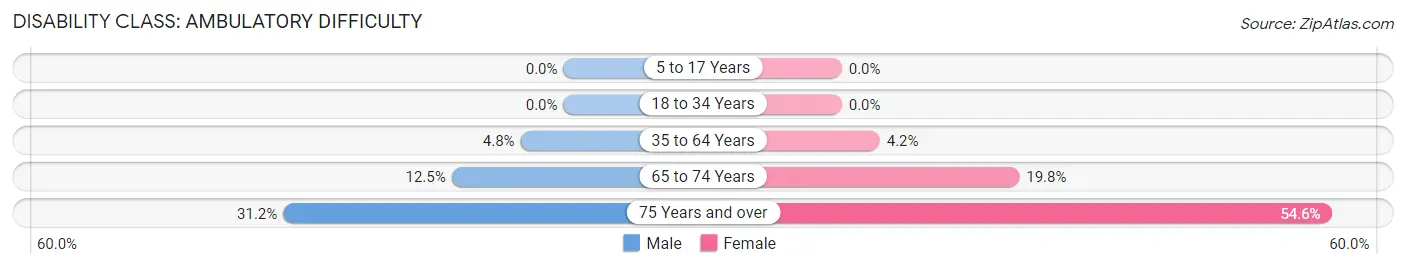
| Age Bracket | Male | Female |
| 5 to 17 Years | 0 (0.0%) | 0 (0.0%) |
| 18 to 34 Years | 0 (0.0%) | 0 (0.0%) |
| 35 to 64 Years | 174 (4.8%) | 171 (4.2%) |
| 65 to 74 Years | 66 (12.4%) | 135 (19.8%) |
| 75 Years and over | 132 (31.2%) | 253 (54.6%) |
Disability Class: Self-Care Difficulty
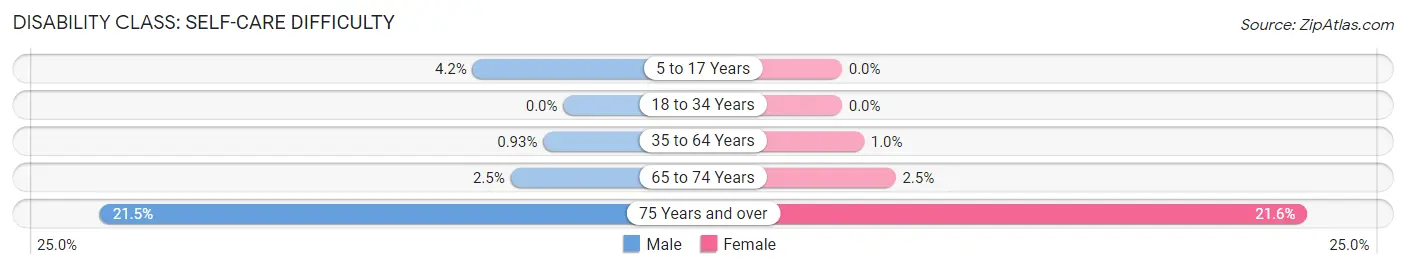
| Age Bracket | Male | Female |
| 5 to 17 Years | 79 (4.2%) | 0 (0.0%) |
| 18 to 34 Years | 0 (0.0%) | 0 (0.0%) |
| 35 to 64 Years | 34 (0.9%) | 41 (1.0%) |
| 65 to 74 Years | 13 (2.5%) | 17 (2.5%) |
| 75 Years and over | 91 (21.5%) | 100 (21.6%) |
Technology Access in Culpeper
Computing Device Access in Culpeper
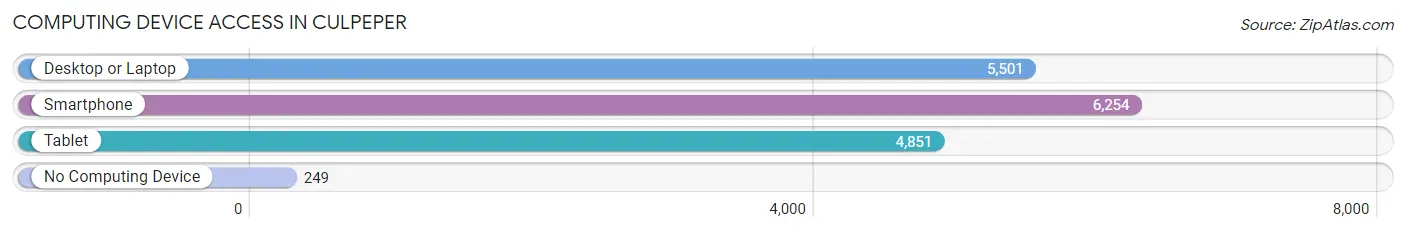
| Device Type | # Households | % Households |
| Desktop or Laptop | 5,501 | 81.6% |
| Smartphone | 6,254 | 92.8% |
| Tablet | 4,851 | 72.0% |
| No Computing Device | 249 | 3.7% |
| Total | 6,740 | 100.0% |
Internet Access in Culpeper
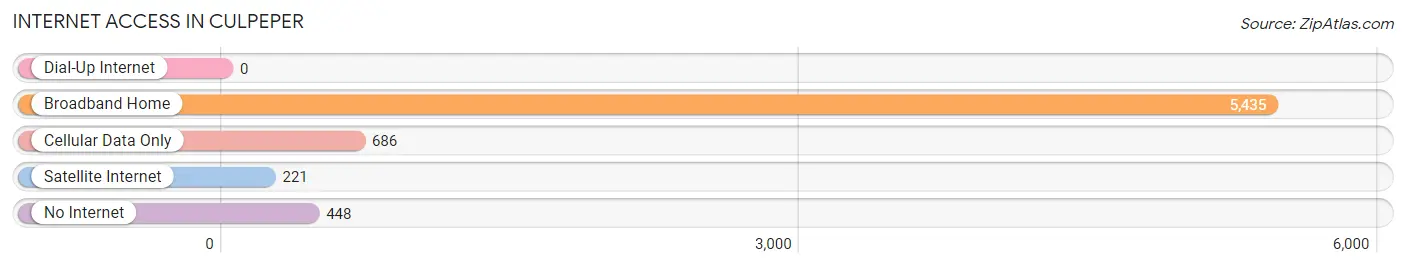
| Internet Type | # Households | % Households |
| Dial-Up Internet | 0 | 0.0% |
| Broadband Home | 5,435 | 80.6% |
| Cellular Data Only | 686 | 10.2% |
| Satellite Internet | 221 | 3.3% |
| No Internet | 448 | 6.7% |
| Total | 6,740 | 100.0% |
Culpeper Summary
Culpeper, Virginia is a small town located in the northern part of the state, about an hour and a half from Washington, D.C. It is the county seat of Culpeper County and is home to a population of around 16,000 people. The town is known for its rich history, beautiful scenery, and vibrant economy.
History
Culpeper was founded in 1748 by Colonel Thomas Colley, who named the town after his friend, Lord Thomas Culpeper. The town was originally a trading post and was the site of several battles during the Revolutionary War. During the Civil War, Culpeper was the site of several battles, including the Battle of Cedar Mountain and the Battle of Brandy Station. After the war, the town experienced a period of growth and prosperity, becoming a center for agriculture and industry.
Geography
Culpeper is located in the northern part of Virginia, about an hour and a half from Washington, D.C. The town is situated in the foothills of the Blue Ridge Mountains and is surrounded by rolling hills and lush forests. The town is located at the intersection of US Route 15 and US Route 29, making it easily accessible from the surrounding areas.
Economy
Culpeper’s economy is largely based on agriculture and tourism. The town is home to several wineries, breweries, and distilleries, as well as a variety of restaurants and shops. The town is also home to several large employers, including the Culpeper Regional Hospital, the Culpeper County Public Schools, and the Culpeper County Sheriff’s Office.
Demographics
As of the 2010 census, Culpeper had a population of 16,379 people. The racial makeup of the town was 79.3% White, 14.2% African American, 0.4% Native American, 1.2% Asian, 0.1% Pacific Islander, and 4.8% from other races. The median household income was $45,945, and the median family income was $54,945.
Culpeper is a small town with a rich history and a vibrant economy. The town is home to a diverse population and is a popular destination for tourists and locals alike. With its beautiful scenery and close proximity to Washington, D.C., Culpeper is an ideal place to live and work.
Common Questions
What is Per Capita Income in Culpeper?
Per Capita income in Culpeper is $36,432.
What is the Median Family Income in Culpeper?
Median Family Income in Culpeper is $91,841.
What is the Median Household income in Culpeper?
Median Household Income in Culpeper is $86,940.
What is Income or Wage Gap in Culpeper?
Income or Wage Gap in Culpeper is 33.4%.
Women in Culpeper earn 66.6 cents for every dollar earned by a man.
What is Family Income Deficit in Culpeper?
Family Income Deficit in Culpeper is $7,743.
Families that are below poverty line in Culpeper earn $7,743 less on average than the poverty threshold level.
What is Inequality or Gini Index in Culpeper?
Inequality or Gini Index in Culpeper is 0.41.
What is the Total Population of Culpeper?
Total Population of Culpeper is 20,105.
What is the Total Male Population of Culpeper?
Total Male Population of Culpeper is 9,842.
What is the Total Female Population of Culpeper?
Total Female Population of Culpeper is 10,263.
What is the Ratio of Males per 100 Females in Culpeper?
There are 95.90 Males per 100 Females in Culpeper.
What is the Ratio of Females per 100 Males in Culpeper?
There are 104.28 Females per 100 Males in Culpeper.
What is the Median Population Age in Culpeper?
Median Population Age in Culpeper is 34.3 Years.
What is the Average Family Size in Culpeper
Average Family Size in Culpeper is 3.2 People.
What is the Average Household Size in Culpeper
Average Household Size in Culpeper is 3.0 People.
How Large is the Labor Force in Culpeper?
There are 10,446 People in the Labor Forcein in Culpeper.
What is the Percentage of People in the Labor Force in Culpeper?
70.6% of People are in the Labor Force in Culpeper.
What is the Unemployment Rate in Culpeper?
Unemployment Rate in Culpeper is 3.9%.