Elwood, IL Map & Demographics
Elwood Map
Elwood Overview
$39,932
PER CAPITA INCOME
$91,818
AVG FAMILY INCOME
$78,214
AVG HOUSEHOLD INCOME
30.8%
WAGE / INCOME GAP [ % ]
69.2¢/ $1
WAGE / INCOME GAP [ $ ]
0.39
INEQUALITY / GINI INDEX
2,315
TOTAL POPULATION
1,121
MALE POPULATION
1,194
FEMALE POPULATION
93.89
MALES / 100 FEMALES
106.51
FEMALES / 100 MALES
40.9
MEDIAN AGE
2.8
AVG FAMILY SIZE
2.5
AVG HOUSEHOLD SIZE
1,307
LABOR FORCE [ PEOPLE ]
65.8%
PERCENT IN LABOR FORCE
3.2%
UNEMPLOYMENT RATE
Elwood Zip Codes
Elwood Area Codes
Income in Elwood
Income Overview in Elwood
Per Capita Income in Elwood is $39,932, while median incomes of families and households are $91,818 and $78,214 respectively.
| Characteristic | Number | Measure |
| Per Capita Income | 2,315 | $39,932 |
| Median Family Income | 634 | $91,818 |
| Mean Family Income | 634 | $109,267 |
| Median Household Income | 936 | $78,214 |
| Mean Household Income | 936 | $97,588 |
| Income Deficit | 634 | $0 |
| Wage / Income Gap (%) | 2,315 | 30.79% |
| Wage / Income Gap ($) | 2,315 | 69.21¢ per $1 |
| Gini / Inequality Index | 2,315 | 0.39 |
Earnings by Sex in Elwood
Average Earnings in Elwood are $48,301, $59,563 for men and $41,222 for women, a difference of 30.8%.
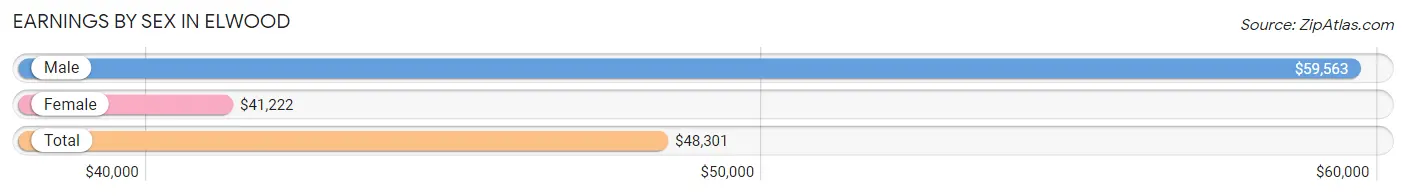
| Sex | Number | Average Earnings |
| Male | 669 (49.5%) | $59,563 |
| Female | 682 (50.5%) | $41,222 |
| Total | 1,351 (100.0%) | $48,301 |
Earnings by Sex by Income Bracket in Elwood
The most common earnings brackets in Elwood are $100,000+ for men (161 | 24.1%) and $75,000 to $99,999 for women (75 | 11.0%).
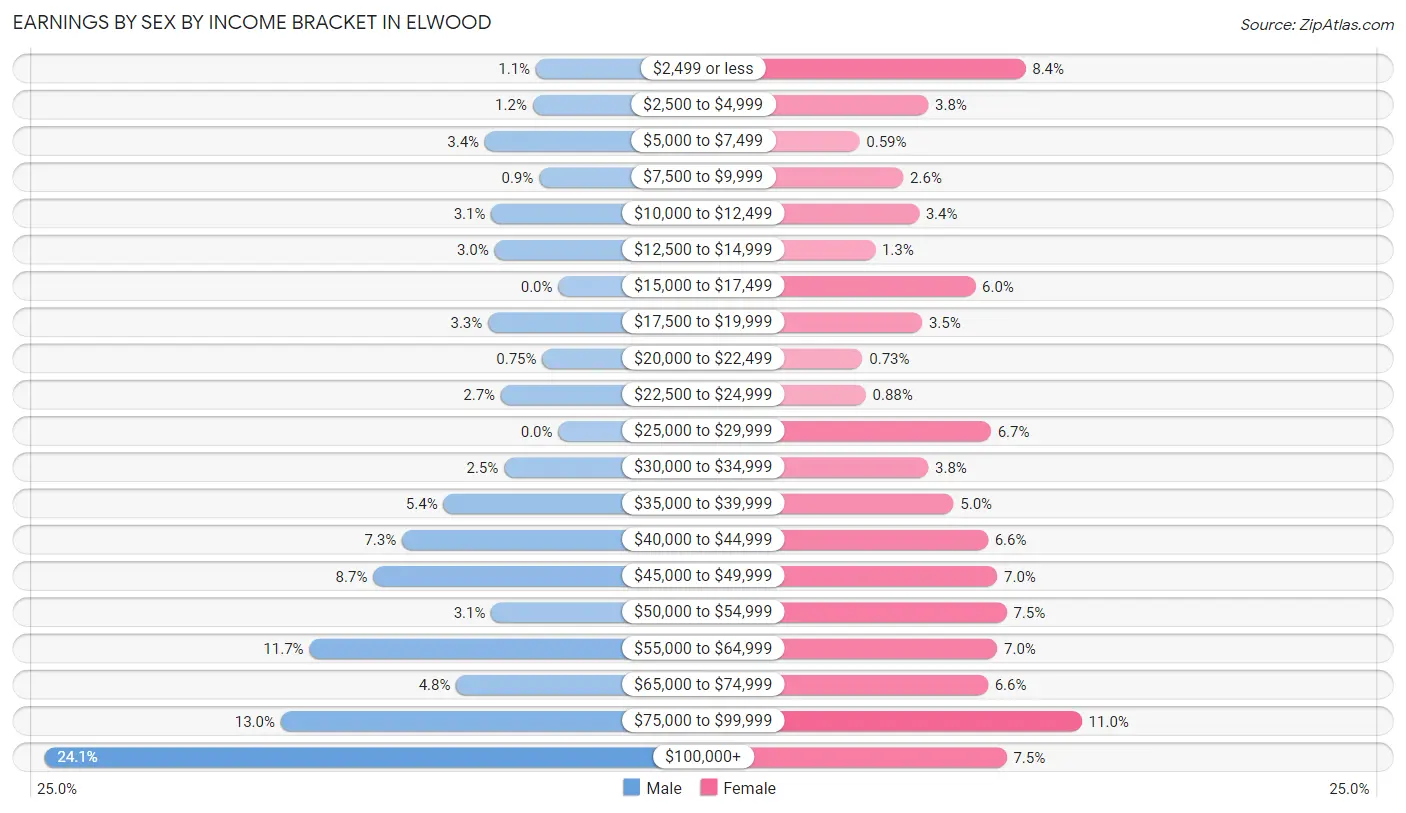
| Income | Male | Female |
| $2,499 or less | 7 (1.1%) | 57 (8.4%) |
| $2,500 to $4,999 | 8 (1.2%) | 26 (3.8%) |
| $5,000 to $7,499 | 23 (3.4%) | 4 (0.6%) |
| $7,500 to $9,999 | 6 (0.9%) | 18 (2.6%) |
| $10,000 to $12,499 | 21 (3.1%) | 23 (3.4%) |
| $12,500 to $14,999 | 20 (3.0%) | 9 (1.3%) |
| $15,000 to $17,499 | 0 (0.0%) | 41 (6.0%) |
| $17,500 to $19,999 | 22 (3.3%) | 24 (3.5%) |
| $20,000 to $22,499 | 5 (0.7%) | 5 (0.7%) |
| $22,500 to $24,999 | 18 (2.7%) | 6 (0.9%) |
| $25,000 to $29,999 | 0 (0.0%) | 46 (6.7%) |
| $30,000 to $34,999 | 17 (2.5%) | 26 (3.8%) |
| $35,000 to $39,999 | 36 (5.4%) | 34 (5.0%) |
| $40,000 to $44,999 | 49 (7.3%) | 45 (6.6%) |
| $45,000 to $49,999 | 58 (8.7%) | 48 (7.0%) |
| $50,000 to $54,999 | 21 (3.1%) | 51 (7.5%) |
| $55,000 to $64,999 | 78 (11.7%) | 48 (7.0%) |
| $65,000 to $74,999 | 32 (4.8%) | 45 (6.6%) |
| $75,000 to $99,999 | 87 (13.0%) | 75 (11.0%) |
| $100,000+ | 161 (24.1%) | 51 (7.5%) |
| Total | 669 (100.0%) | 682 (100.0%) |
Earnings by Sex by Educational Attainment in Elwood
Average earnings in Elwood are $61,855 for men and $45,766 for women, a difference of 26.0%. Men with an educational attainment of graduate degree enjoy the highest average annual earnings of $105,625, while those with less than high school education earn the least with $43,500. Women with an educational attainment of graduate degree earn the most with the average annual earnings of $64,609, while those with less than high school education have the smallest earnings of $18,750.
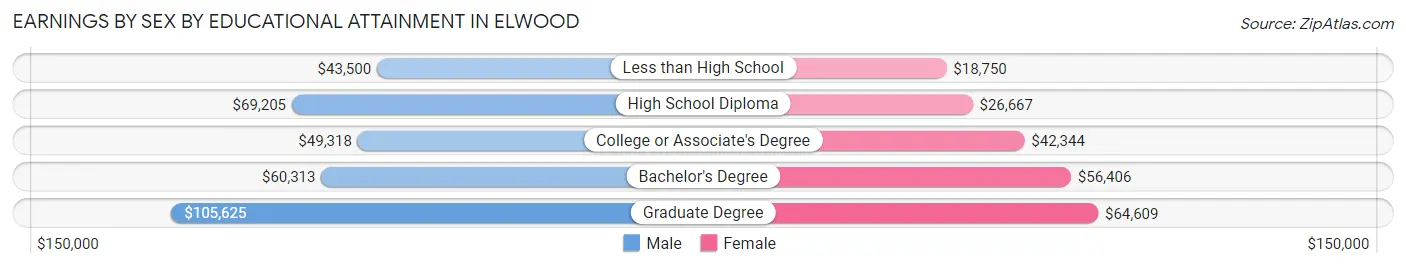
| Educational Attainment | Male Income | Female Income |
| Less than High School | $43,500 | $18,750 |
| High School Diploma | $69,205 | $26,667 |
| College or Associate's Degree | $49,318 | $42,344 |
| Bachelor's Degree | $60,313 | $56,406 |
| Graduate Degree | $105,625 | $64,609 |
| Total | $61,855 | $45,766 |
Family Income in Elwood
Family Income Brackets in Elwood
According to the Elwood family income data, there are 132 families falling into the $150,000 to $199,999 income range, which is the most common income bracket and makes up 20.8% of all families. Conversely, the $10,000 to $14,999 income bracket is the least frequent group with only 5 families (0.8%) belonging to this category.
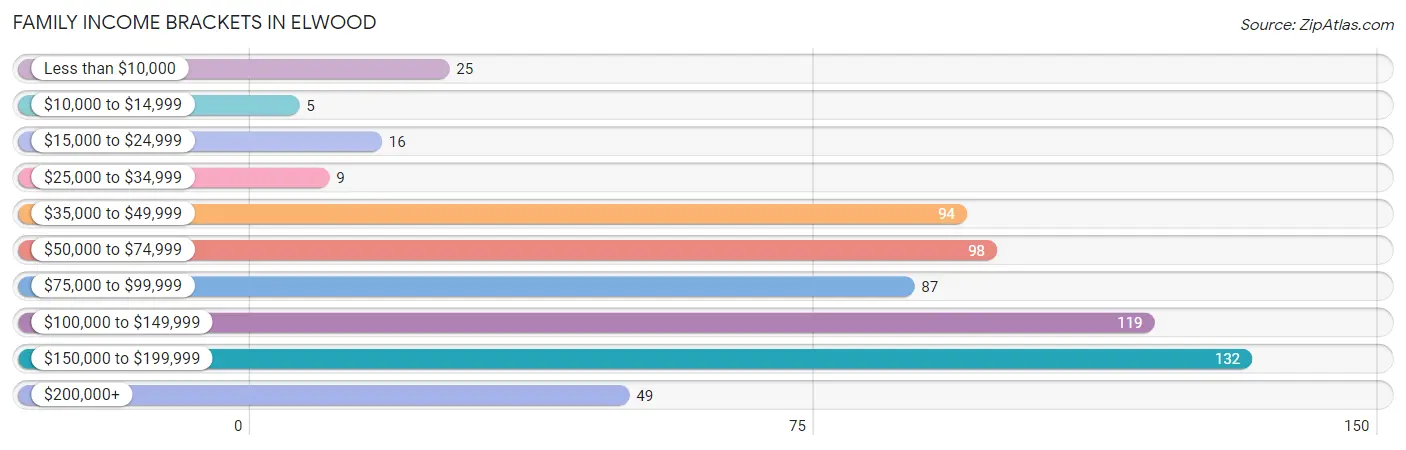
| Income Bracket | # Families | % Families |
| Less than $10,000 | 25 | 3.9% |
| $10,000 to $14,999 | 5 | 0.8% |
| $15,000 to $24,999 | 16 | 2.5% |
| $25,000 to $34,999 | 9 | 1.4% |
| $35,000 to $49,999 | 94 | 14.8% |
| $50,000 to $74,999 | 98 | 15.5% |
| $75,000 to $99,999 | 87 | 13.7% |
| $100,000 to $149,999 | 119 | 18.8% |
| $150,000 to $199,999 | 132 | 20.8% |
| $200,000+ | 49 | 7.7% |
Family Income by Famaliy Size in Elwood
4-person families (74 | 11.7%) account for the highest median family income in Elwood with $109,000 per family, while 2-person families (336 | 53.0%) have the highest median income of $45,750 per family member.
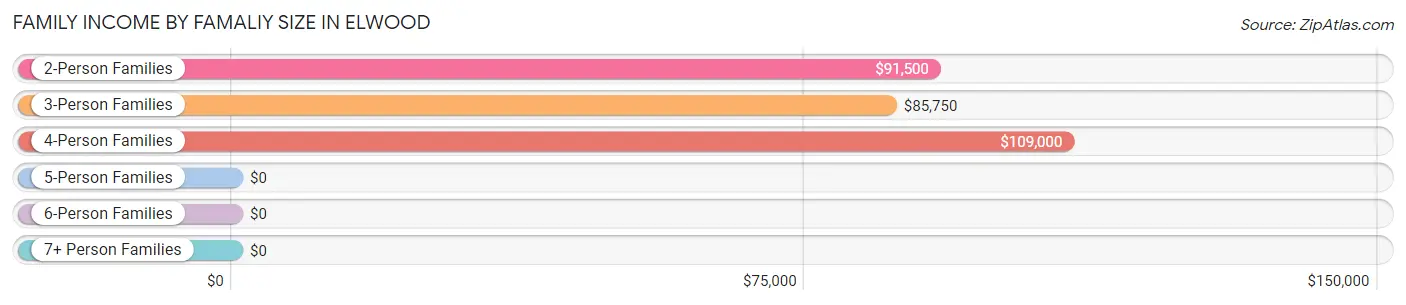
| Income Bracket | # Families | Median Income |
| 2-Person Families | 336 (53.0%) | $91,500 |
| 3-Person Families | 183 (28.9%) | $85,750 |
| 4-Person Families | 74 (11.7%) | $109,000 |
| 5-Person Families | 31 (4.9%) | $0 |
| 6-Person Families | 4 (0.6%) | $0 |
| 7+ Person Families | 6 (0.9%) | $0 |
| Total | 634 (100.0%) | $91,818 |
Family Income by Number of Earners in Elwood
The median family income in Elwood is $91,818, with families comprising 3+ earners (54) having the highest median family income of $141,250, while families with no earners (101) have the lowest median family income of $55,750, accounting for 8.5% and 15.9% of families, respectively.
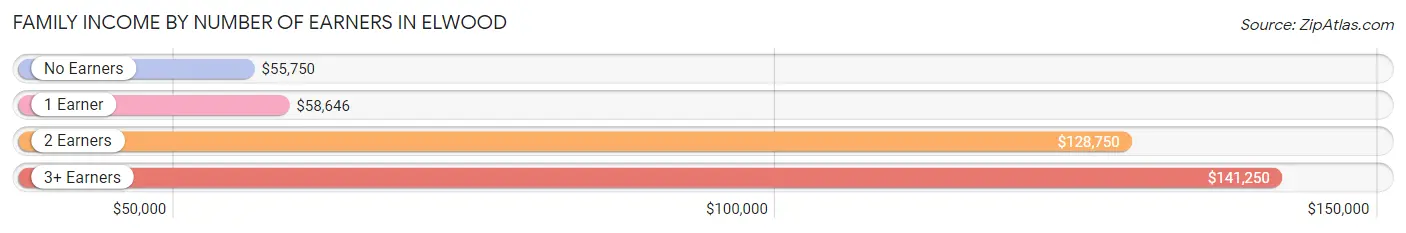
| Number of Earners | # Families | Median Income |
| No Earners | 101 (15.9%) | $55,750 |
| 1 Earner | 161 (25.4%) | $58,646 |
| 2 Earners | 318 (50.2%) | $128,750 |
| 3+ Earners | 54 (8.5%) | $141,250 |
| Total | 634 (100.0%) | $91,818 |
Household Income in Elwood
Household Income Brackets in Elwood
With 177 households falling in the category, the $50,000 to $74,999 income range is the most frequent in Elwood, accounting for 18.9% of all households. In contrast, only 5 households (0.5%) fall into the $10,000 to $14,999 income bracket, making it the least populous group.
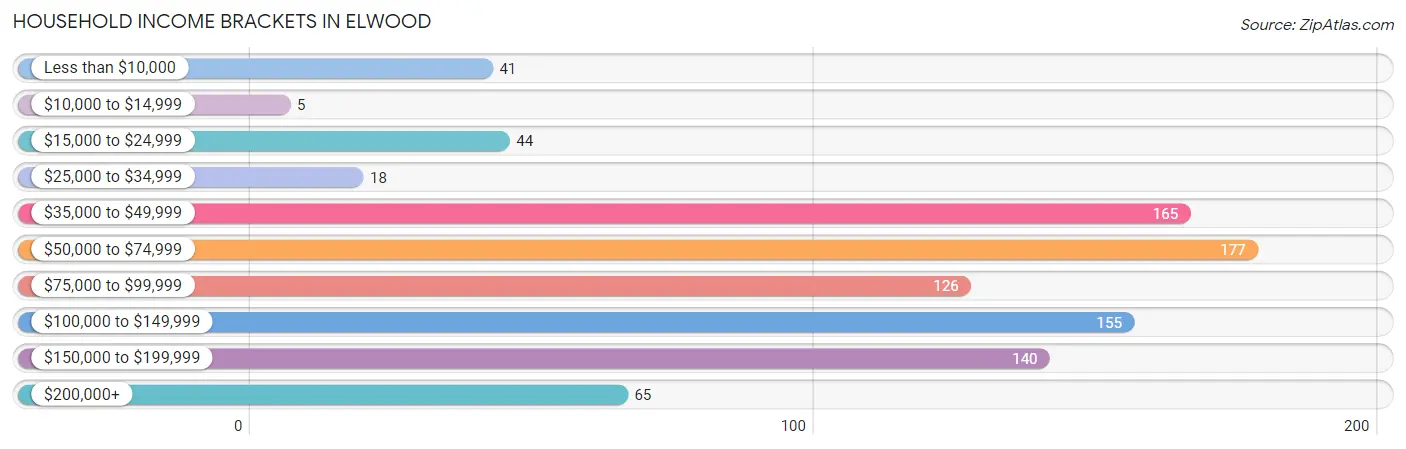
| Income Bracket | # Households | % Households |
| Less than $10,000 | 41 | 4.4% |
| $10,000 to $14,999 | 5 | 0.5% |
| $15,000 to $24,999 | 44 | 4.7% |
| $25,000 to $34,999 | 18 | 1.9% |
| $35,000 to $49,999 | 165 | 17.6% |
| $50,000 to $74,999 | 177 | 18.9% |
| $75,000 to $99,999 | 126 | 13.5% |
| $100,000 to $149,999 | 155 | 16.6% |
| $150,000 to $199,999 | 140 | 15.0% |
| $200,000+ | 65 | 6.9% |
Household Income by Householder Age in Elwood
The median household income in Elwood is $78,214, with the highest median household income of $119,167 found in the 45 to 64 years age bracket for the primary householder. A total of 372 households (39.7%) fall into this category. Meanwhile, the 15 to 24 years age bracket for the primary householder has the lowest median household income of $0, with 14 households (1.5%) in this group.
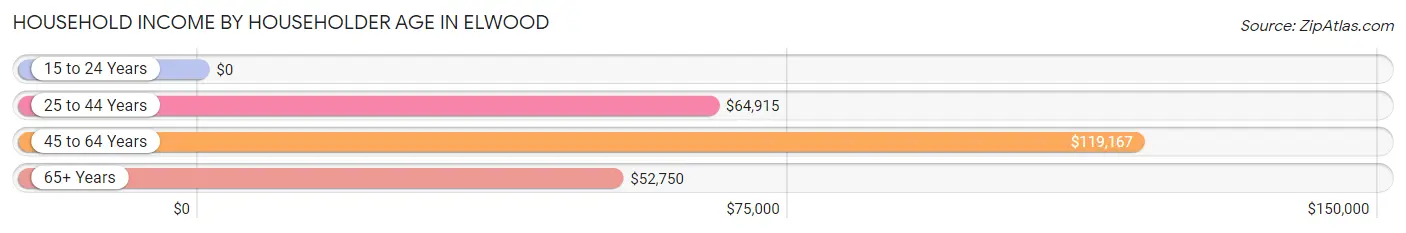
| Income Bracket | # Households | Median Income |
| 15 to 24 Years | 14 (1.5%) | $0 |
| 25 to 44 Years | 329 (35.1%) | $64,915 |
| 45 to 64 Years | 372 (39.7%) | $119,167 |
| 65+ Years | 221 (23.6%) | $52,750 |
| Total | 936 (100.0%) | $78,214 |
Poverty in Elwood
Income Below Poverty by Sex and Age in Elwood
With 9.4% poverty level for males and 12.1% for females among the residents of Elwood, 5 year old males and 6 to 11 year old females are the most vulnerable to poverty, with 13 males (72.2%) and 24 females (38.7%) in their respective age groups living below the poverty level.
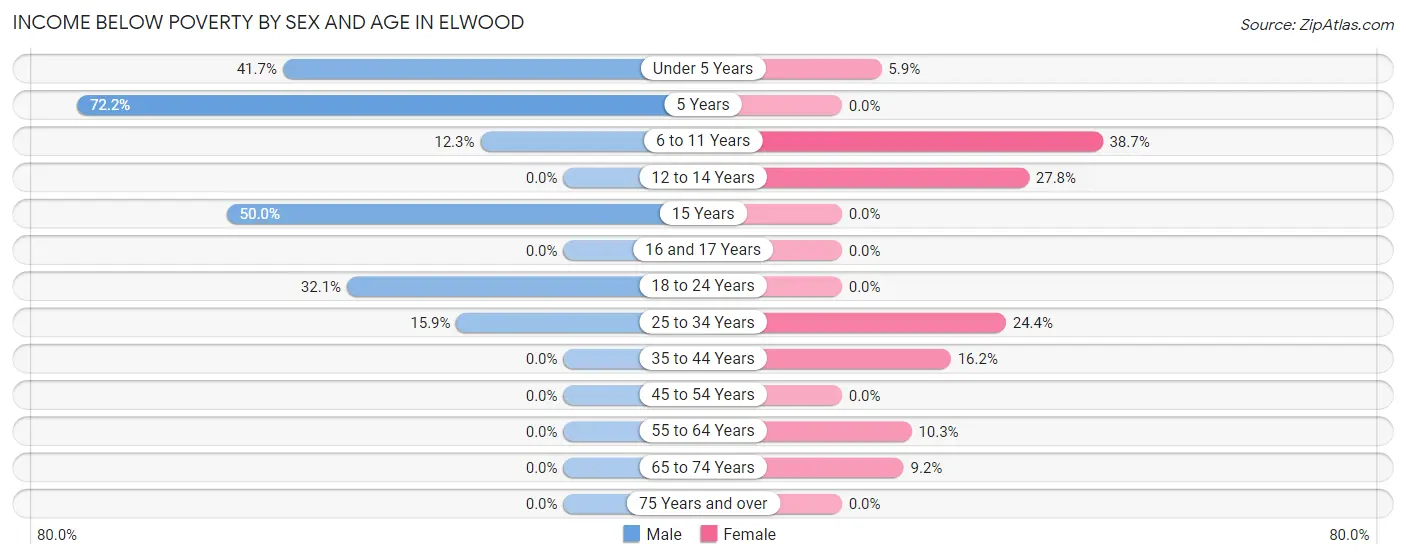
| Age Bracket | Male | Female |
| Under 5 Years | 15 (41.7%) | 5 (5.9%) |
| 5 Years | 13 (72.2%) | 0 (0.0%) |
| 6 to 11 Years | 9 (12.3%) | 24 (38.7%) |
| 12 to 14 Years | 0 (0.0%) | 5 (27.8%) |
| 15 Years | 7 (50.0%) | 0 (0.0%) |
| 16 and 17 Years | 0 (0.0%) | 0 (0.0%) |
| 18 to 24 Years | 27 (32.1%) | 0 (0.0%) |
| 25 to 34 Years | 34 (15.9%) | 47 (24.3%) |
| 35 to 44 Years | 0 (0.0%) | 28 (16.2%) |
| 45 to 54 Years | 0 (0.0%) | 0 (0.0%) |
| 55 to 64 Years | 0 (0.0%) | 27 (10.3%) |
| 65 to 74 Years | 0 (0.0%) | 9 (9.2%) |
| 75 Years and over | 0 (0.0%) | 0 (0.0%) |
| Total | 105 (9.4%) | 145 (12.1%) |
Income Above Poverty by Sex and Age in Elwood
According to the poverty statistics in Elwood, males aged 12 to 14 years and females aged 18 to 24 years are the age groups that are most secure financially, with 100.0% of males and 100.0% of females in these age groups living above the poverty line.
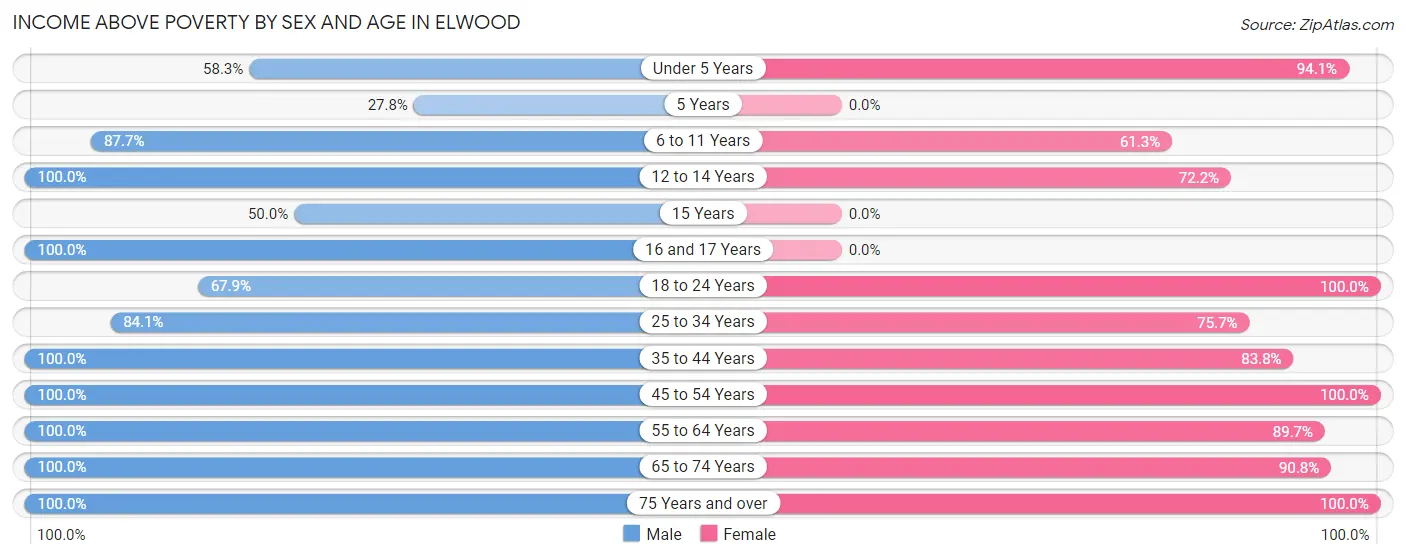
| Age Bracket | Male | Female |
| Under 5 Years | 21 (58.3%) | 80 (94.1%) |
| 5 Years | 5 (27.8%) | 0 (0.0%) |
| 6 to 11 Years | 64 (87.7%) | 38 (61.3%) |
| 12 to 14 Years | 23 (100.0%) | 13 (72.2%) |
| 15 Years | 7 (50.0%) | 0 (0.0%) |
| 16 and 17 Years | 51 (100.0%) | 0 (0.0%) |
| 18 to 24 Years | 57 (67.9%) | 110 (100.0%) |
| 25 to 34 Years | 180 (84.1%) | 146 (75.6%) |
| 35 to 44 Years | 144 (100.0%) | 145 (83.8%) |
| 45 to 54 Years | 99 (100.0%) | 104 (100.0%) |
| 55 to 64 Years | 216 (100.0%) | 234 (89.7%) |
| 65 to 74 Years | 91 (100.0%) | 89 (90.8%) |
| 75 Years and over | 58 (100.0%) | 90 (100.0%) |
| Total | 1,016 (90.6%) | 1,049 (87.9%) |
Income Below Poverty Among Married-Couple Families in Elwood
The poverty statistics for married-couple families in Elwood show that 0.8% or 4 of the total 503 families live below the poverty line. Families with 3 or 4 children have the highest poverty rate of 20.0%, comprising of 4 families. On the other hand, families with no children have the lowest poverty rate of 0.0%, which includes 0 families.
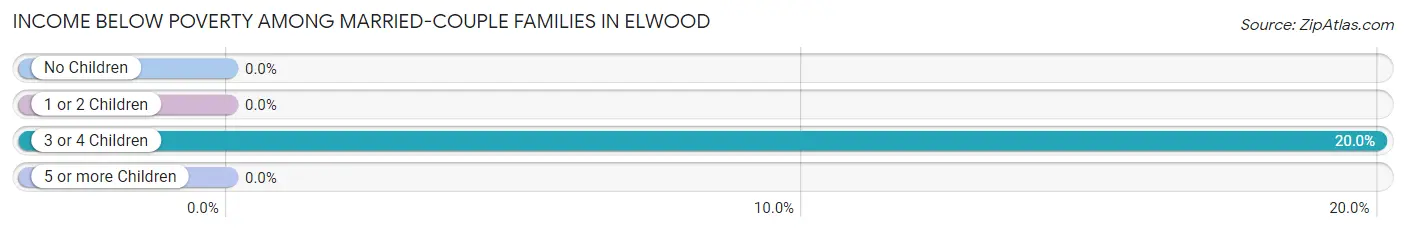
| Children | Above Poverty | Below Poverty |
| No Children | 343 (100.0%) | 0 (0.0%) |
| 1 or 2 Children | 140 (100.0%) | 0 (0.0%) |
| 3 or 4 Children | 16 (80.0%) | 4 (20.0%) |
| 5 or more Children | 0 (0.0%) | 0 (0.0%) |
| Total | 499 (99.2%) | 4 (0.8%) |
Income Below Poverty Among Single-Parent Households in Elwood
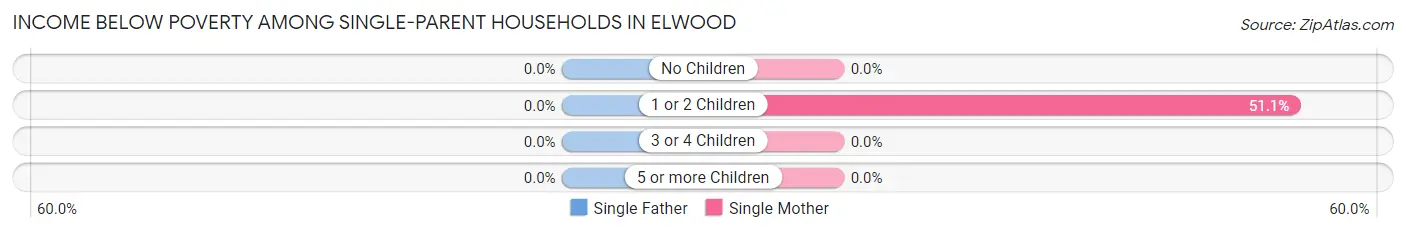
| Children | Single Father | Single Mother |
| No Children | 0 (0.0%) | 0 (0.0%) |
| 1 or 2 Children | 0 (0.0%) | 46 (51.1%) |
| 3 or 4 Children | 0 (0.0%) | 0 (0.0%) |
| 5 or more Children | 0 (0.0%) | 0 (0.0%) |
| Total | 0 (0.0%) | 46 (43.8%) |
Income Below Poverty Among Married-Couple vs Single-Parent Households in Elwood
The poverty data for Elwood shows that 4 of the married-couple family households (0.8%) and 46 of the single-parent households (35.1%) are living below the poverty level. Within the married-couple family households, those with 3 or 4 children have the highest poverty rate, with 4 households (20.0%) falling below the poverty line. Among the single-parent households, those with 1 or 2 children have the highest poverty rate, with 46 household (48.9%) living below poverty.
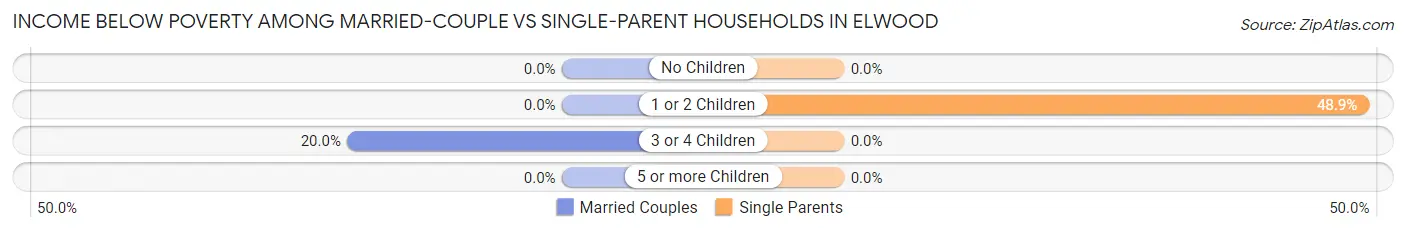
| Children | Married-Couple Families | Single-Parent Households |
| No Children | 0 (0.0%) | 0 (0.0%) |
| 1 or 2 Children | 0 (0.0%) | 46 (48.9%) |
| 3 or 4 Children | 4 (20.0%) | 0 (0.0%) |
| 5 or more Children | 0 (0.0%) | 0 (0.0%) |
| Total | 4 (0.8%) | 46 (35.1%) |
Race in Elwood
The most populous races in Elwood are White / Caucasian (2,040 | 88.1%), Hispanic or Latino (198 | 8.6%), and Black / African American (140 | 6.0%).
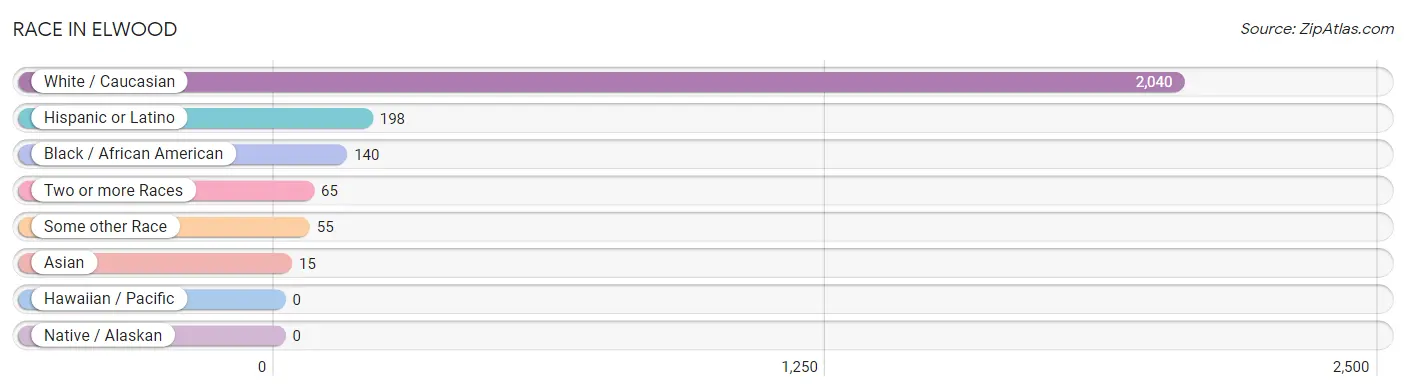
| Race | # Population | % Population |
| Asian | 15 | 0.6% |
| Black / African American | 140 | 6.0% |
| Hawaiian / Pacific | 0 | 0.0% |
| Hispanic or Latino | 198 | 8.6% |
| Native / Alaskan | 0 | 0.0% |
| White / Caucasian | 2,040 | 88.1% |
| Two or more Races | 65 | 2.8% |
| Some other Race | 55 | 2.4% |
| Total | 2,315 | 100.0% |
Ancestry in Elwood
The most populous ancestries reported in Elwood are German (457 | 19.7%), Irish (401 | 17.3%), Polish (376 | 16.2%), Italian (304 | 13.1%), and Mexican (189 | 8.2%), together accounting for 74.6% of all Elwood residents.
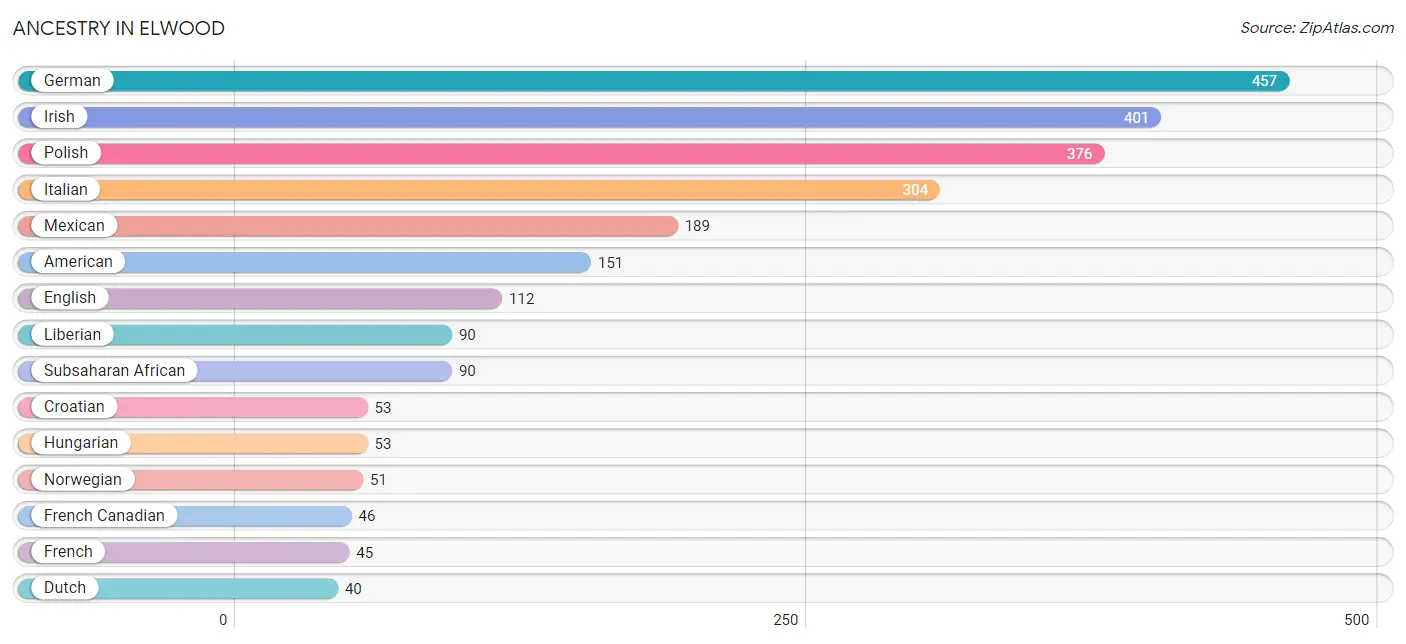
| Ancestry | # Population | % Population |
| American | 151 | 6.5% |
| Blackfeet | 5 | 0.2% |
| Colombian | 3 | 0.1% |
| Croatian | 53 | 2.3% |
| Czech | 11 | 0.5% |
| Dutch | 40 | 1.7% |
| English | 112 | 4.8% |
| European | 37 | 1.6% |
| French | 45 | 1.9% |
| French Canadian | 46 | 2.0% |
| German | 457 | 19.7% |
| Hungarian | 53 | 2.3% |
| Irish | 401 | 17.3% |
| Italian | 304 | 13.1% |
| Liberian | 90 | 3.9% |
| Lithuanian | 6 | 0.3% |
| Mexican | 189 | 8.2% |
| Norwegian | 51 | 2.2% |
| Polish | 376 | 16.2% |
| Scotch-Irish | 6 | 0.3% |
| Scottish | 23 | 1.0% |
| Slavic | 7 | 0.3% |
| Slovak | 12 | 0.5% |
| Slovene | 19 | 0.8% |
| South American | 3 | 0.1% |
| Spanish | 6 | 0.3% |
| Subsaharan African | 90 | 3.9% |
| Swedish | 29 | 1.3% |
| Swiss | 6 | 0.3% |
| Vietnamese | 15 | 0.6% |
| Welsh | 14 | 0.6% | View All 31 Rows |
Immigrants in Elwood
The most numerous immigrant groups reported in Elwood came from Africa (17 | 0.7%), Liberia (17 | 0.7%), Western Africa (17 | 0.7%), Latin America (14 | 0.6%), and Europe (13 | 0.6%), together accounting for 3.4% of all Elwood residents.
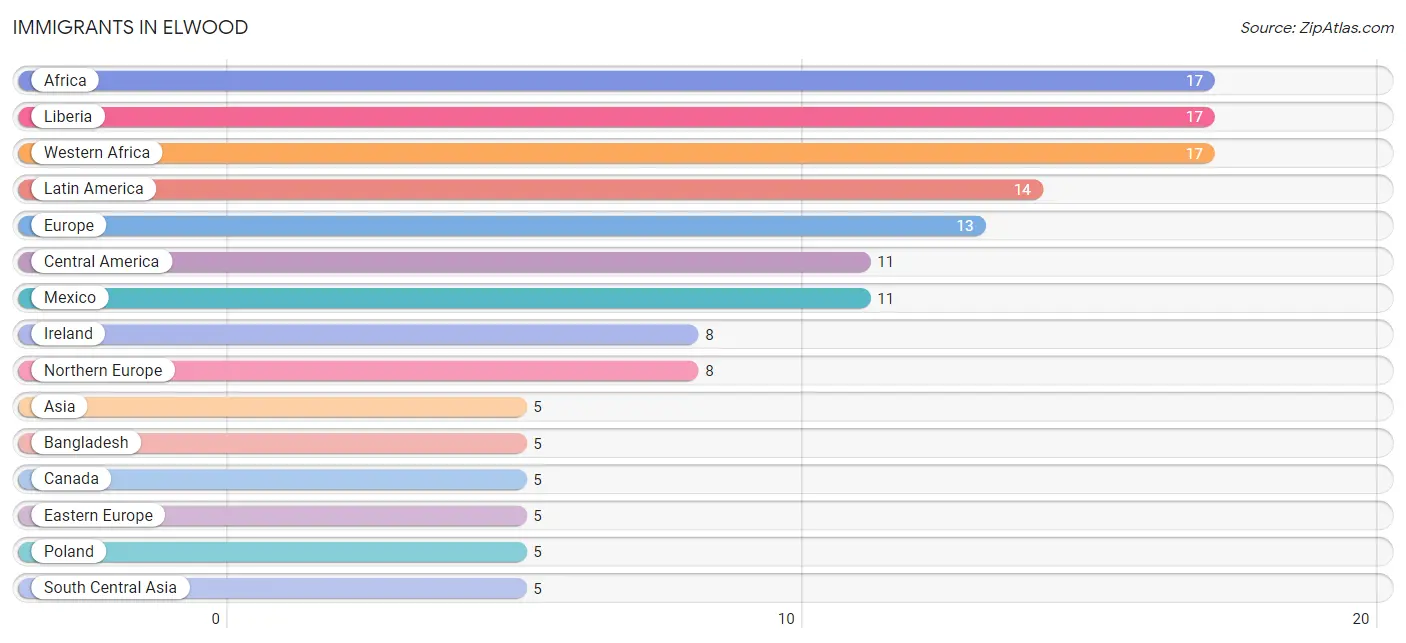
| Immigration Origin | # Population | % Population |
| Africa | 17 | 0.7% |
| Asia | 5 | 0.2% |
| Bangladesh | 5 | 0.2% |
| Canada | 5 | 0.2% |
| Central America | 11 | 0.5% |
| Colombia | 3 | 0.1% |
| Eastern Europe | 5 | 0.2% |
| Europe | 13 | 0.6% |
| Ireland | 8 | 0.4% |
| Latin America | 14 | 0.6% |
| Liberia | 17 | 0.7% |
| Mexico | 11 | 0.5% |
| Northern Europe | 8 | 0.4% |
| Poland | 5 | 0.2% |
| South America | 3 | 0.1% |
| South Central Asia | 5 | 0.2% |
| Western Africa | 17 | 0.7% | View All 17 Rows |
Sex and Age in Elwood
Sex and Age in Elwood
The most populous age groups in Elwood are 30 to 34 Years (138 | 12.3%) for men and 55 to 59 Years (190 | 15.9%) for women.
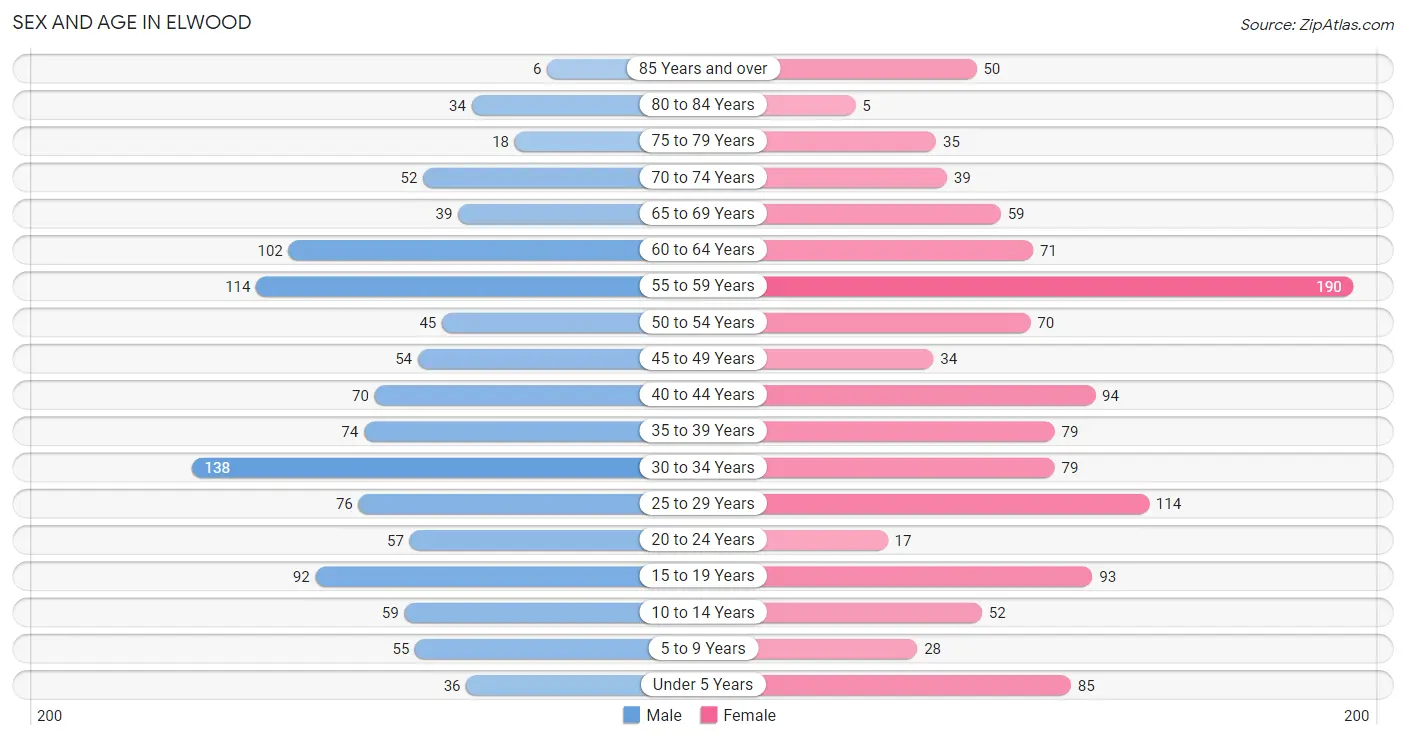
| Age Bracket | Male | Female |
| Under 5 Years | 36 (3.2%) | 85 (7.1%) |
| 5 to 9 Years | 55 (4.9%) | 28 (2.4%) |
| 10 to 14 Years | 59 (5.3%) | 52 (4.4%) |
| 15 to 19 Years | 92 (8.2%) | 93 (7.8%) |
| 20 to 24 Years | 57 (5.1%) | 17 (1.4%) |
| 25 to 29 Years | 76 (6.8%) | 114 (9.6%) |
| 30 to 34 Years | 138 (12.3%) | 79 (6.6%) |
| 35 to 39 Years | 74 (6.6%) | 79 (6.6%) |
| 40 to 44 Years | 70 (6.2%) | 94 (7.9%) |
| 45 to 49 Years | 54 (4.8%) | 34 (2.9%) |
| 50 to 54 Years | 45 (4.0%) | 70 (5.9%) |
| 55 to 59 Years | 114 (10.2%) | 190 (15.9%) |
| 60 to 64 Years | 102 (9.1%) | 71 (5.9%) |
| 65 to 69 Years | 39 (3.5%) | 59 (4.9%) |
| 70 to 74 Years | 52 (4.6%) | 39 (3.3%) |
| 75 to 79 Years | 18 (1.6%) | 35 (2.9%) |
| 80 to 84 Years | 34 (3.0%) | 5 (0.4%) |
| 85 Years and over | 6 (0.5%) | 50 (4.2%) |
| Total | 1,121 (100.0%) | 1,194 (100.0%) |
Families and Households in Elwood
Median Family Size in Elwood
The median family size in Elwood is 2.82 persons per family, with single male/father families (26 | 4.1%) accounting for the largest median family size of 4.85 persons per family. On the other hand, single female/mother families (105 | 16.6%) represent the smallest median family size with 2.55 persons per family.
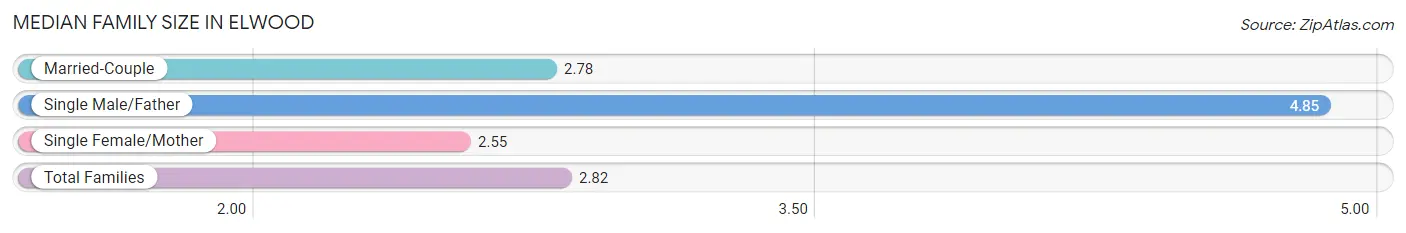
| Family Type | # Families | Family Size |
| Married-Couple | 503 (79.3%) | 2.78 |
| Single Male/Father | 26 (4.1%) | 4.85 |
| Single Female/Mother | 105 (16.6%) | 2.55 |
| Total Families | 634 (100.0%) | 2.82 |
Median Household Size in Elwood
The median household size in Elwood is 2.47 persons per household, with single male/father households (26 | 2.8%) accounting for the largest median household size of 5 persons per household. non-family households (302 | 32.3%) represent the smallest median household size with 1.42 persons per household.
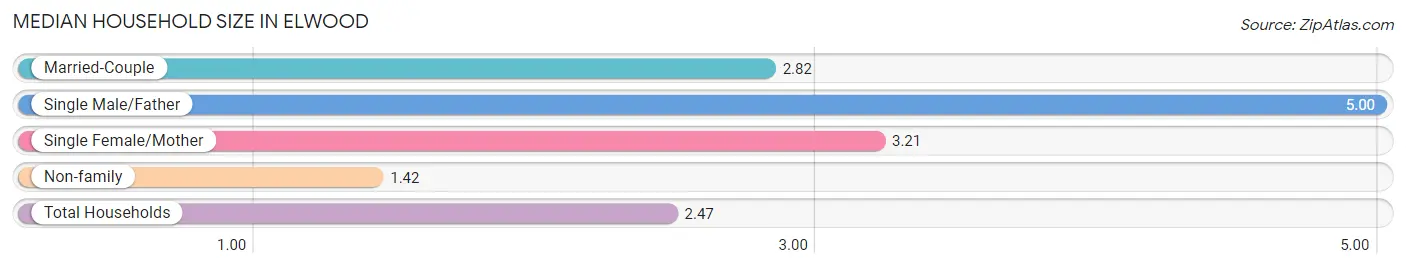
| Household Type | # Households | Household Size |
| Married-Couple | 503 (53.7%) | 2.82 |
| Single Male/Father | 26 (2.8%) | 5.00 |
| Single Female/Mother | 105 (11.2%) | 3.21 |
| Non-family | 302 (32.3%) | 1.42 |
| Total Households | 936 (100.0%) | 2.47 |
Household Size by Marriage Status in Elwood
Out of a total of 936 households in Elwood, 634 (67.7%) are family households, while 302 (32.3%) are nonfamily households. The most numerous type of family households are 2-person households, comprising 296, and the most common type of nonfamily households are 1-person households, comprising 201.
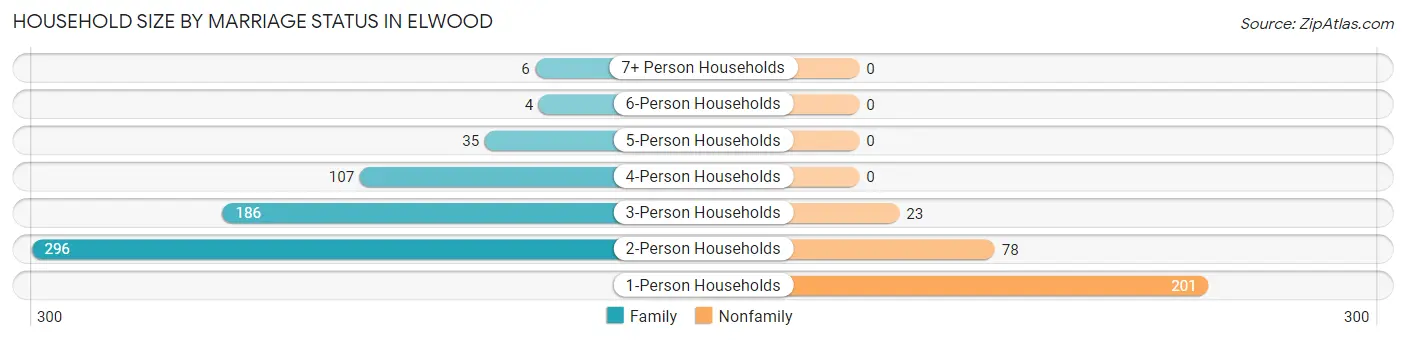
| Household Size | Family Households | Nonfamily Households |
| 1-Person Households | - | 201 (21.5%) |
| 2-Person Households | 296 (31.6%) | 78 (8.3%) |
| 3-Person Households | 186 (19.9%) | 23 (2.5%) |
| 4-Person Households | 107 (11.4%) | 0 (0.0%) |
| 5-Person Households | 35 (3.7%) | 0 (0.0%) |
| 6-Person Households | 4 (0.4%) | 0 (0.0%) |
| 7+ Person Households | 6 (0.6%) | 0 (0.0%) |
| Total | 634 (67.7%) | 302 (32.3%) |
Female Fertility in Elwood
Fertility by Age in Elwood
Average fertility rate in Elwood is 75.0 births per 1,000 women. Women in the age bracket of 35 to 50 years have the highest fertility rate with 97.0 births per 1,000 women. Women in the age bracket of 35 to 50 years acount for 53.8% of all women with births.
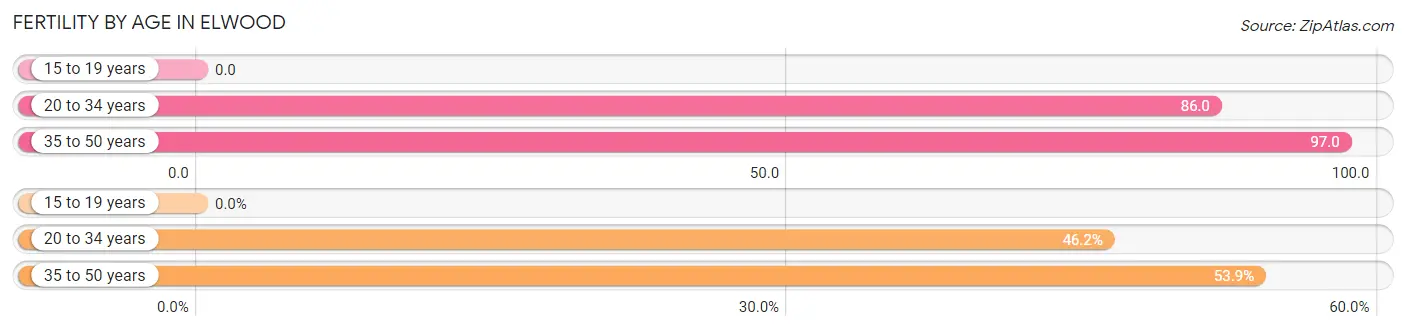
| Age Bracket | Women with Births | Births / 1,000 Women |
| 15 to 19 years | 0 (0.0%) | 0.0 |
| 20 to 34 years | 18 (46.2%) | 86.0 |
| 35 to 50 years | 21 (53.8%) | 97.0 |
| Total | 39 (100.0%) | 75.0 |
Fertility by Age by Marriage Status in Elwood
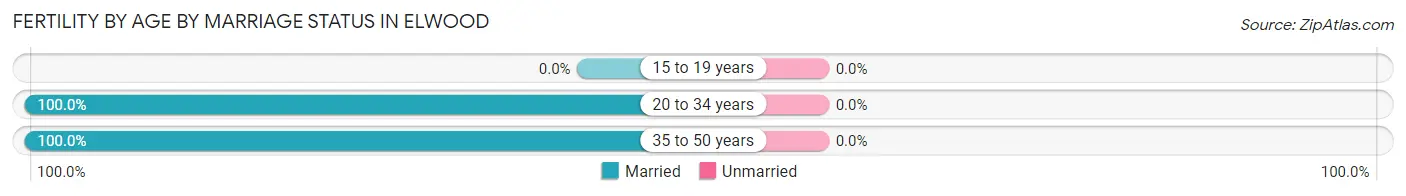
| Age Bracket | Married | Unmarried |
| 15 to 19 years | 0 (0.0%) | 0 (0.0%) |
| 20 to 34 years | 18 (100.0%) | 0 (0.0%) |
| 35 to 50 years | 21 (100.0%) | 0 (0.0%) |
| Total | 39 (100.0%) | 0 (0.0%) |
Fertility by Education in Elwood
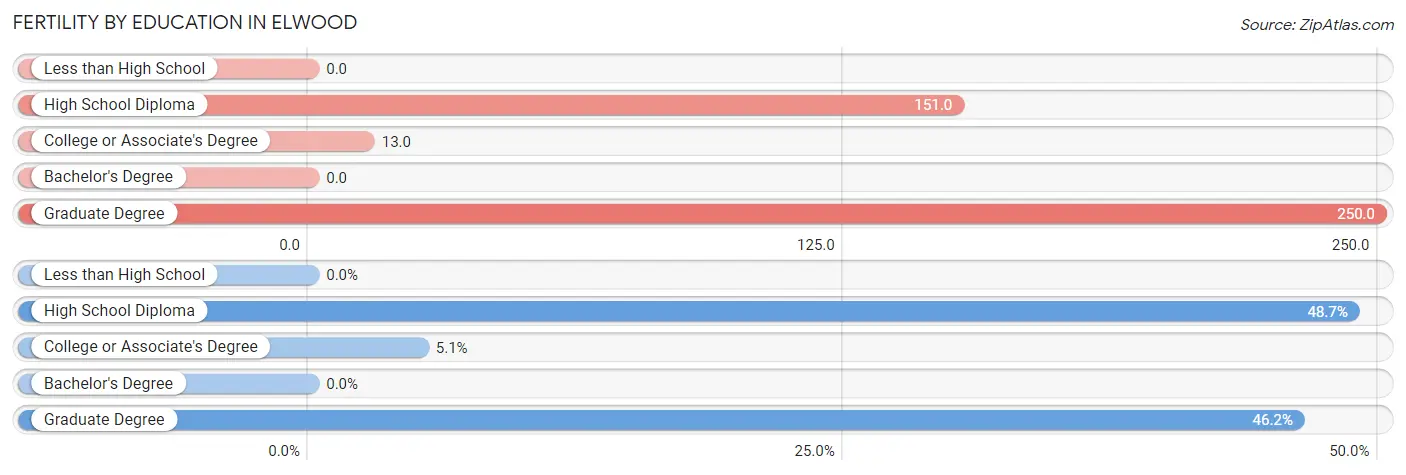
| Educational Attainment | Women with Births | Births / 1,000 Women |
| Less than High School | 0 (0.0%) | 0.0 |
| High School Diploma | 19 (48.7%) | 151.0 |
| College or Associate's Degree | 2 (5.1%) | 13.0 |
| Bachelor's Degree | 0 (0.0%) | 0.0 |
| Graduate Degree | 18 (46.2%) | 250.0 |
| Total | 39 (100.0%) | 75.0 |
Fertility by Education by Marriage Status in Elwood
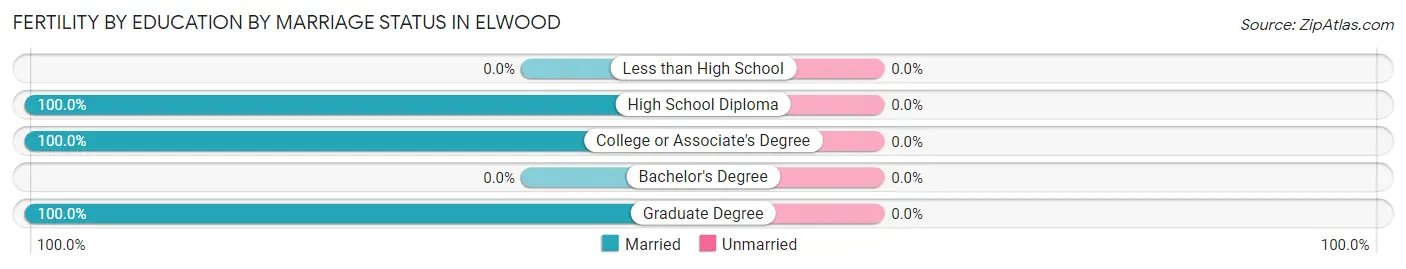
| Educational Attainment | Married | Unmarried |
| Less than High School | 0 (0.0%) | 0 (0.0%) |
| High School Diploma | 19 (100.0%) | 0 (0.0%) |
| College or Associate's Degree | 2 (100.0%) | 0 (0.0%) |
| Bachelor's Degree | 0 (0.0%) | 0 (0.0%) |
| Graduate Degree | 18 (100.0%) | 0 (0.0%) |
| Total | 39 (100.0%) | 0 (0.0%) |
Employment Characteristics in Elwood
Employment by Class of Employer in Elwood
Among the 1,238 employed individuals in Elwood, private company employees (872 | 70.4%), self-employed (incorporated) (163 | 13.2%), and local government employees (104 | 8.4%) make up the most common classes of employment.
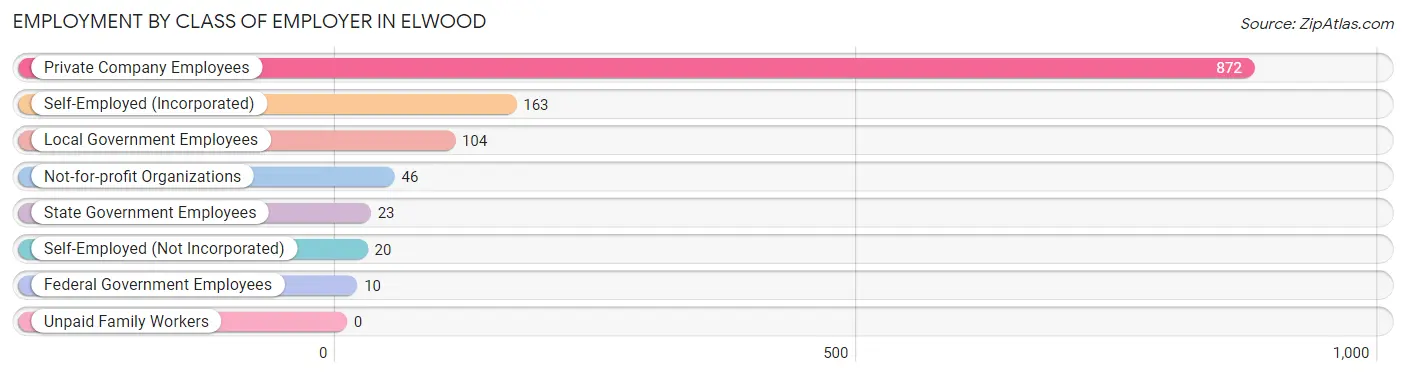
| Employer Class | # Employees | % Employees |
| Private Company Employees | 872 | 70.4% |
| Self-Employed (Incorporated) | 163 | 13.2% |
| Self-Employed (Not Incorporated) | 20 | 1.6% |
| Not-for-profit Organizations | 46 | 3.7% |
| Local Government Employees | 104 | 8.4% |
| State Government Employees | 23 | 1.9% |
| Federal Government Employees | 10 | 0.8% |
| Unpaid Family Workers | 0 | 0.0% |
| Total | 1,238 | 100.0% |
Employment Status by Age in Elwood
According to the labor force statistics for Elwood, out of the total population over 16 years of age (1,986), 65.8% or 1,307 individuals are in the labor force, with 3.2% or 42 of them unemployed. The age group with the highest labor force participation rate is 20 to 24 years, with 100.0% or 74 individuals in the labor force. Within the labor force, the 20 to 24 years age range has the highest percentage of unemployed individuals, with 31.1% or 23 of them being unemployed.
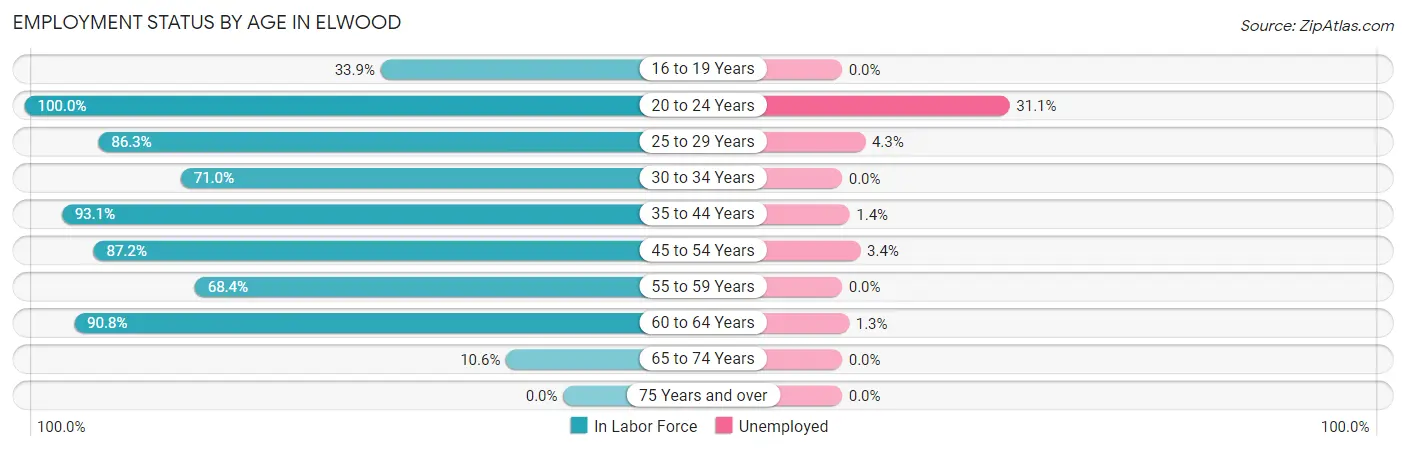
| Age Bracket | In Labor Force | Unemployed |
| 16 to 19 Years | 58 (33.9%) | 0 (0.0%) |
| 20 to 24 Years | 74 (100.0%) | 23 (31.1%) |
| 25 to 29 Years | 164 (86.3%) | 7 (4.3%) |
| 30 to 34 Years | 154 (71.0%) | 0 (0.0%) |
| 35 to 44 Years | 295 (93.1%) | 4 (1.4%) |
| 45 to 54 Years | 177 (87.2%) | 6 (3.4%) |
| 55 to 59 Years | 208 (68.4%) | 0 (0.0%) |
| 60 to 64 Years | 157 (90.8%) | 2 (1.3%) |
| 65 to 74 Years | 20 (10.6%) | 0 (0.0%) |
| 75 Years and over | 0 (0.0%) | 0 (0.0%) |
| Total | 1,307 (65.8%) | 42 (3.2%) |
Employment Status by Educational Attainment in Elwood
According to labor force statistics for Elwood, 82.3% of individuals (1,155) out of the total population between 25 and 64 years of age (1,404) are in the labor force, with 1.6% or 18 of them being unemployed. The group with the highest labor force participation rate are those with the educational attainment of bachelor's degree or higher, with 88.5% or 224 individuals in the labor force. Within the labor force, individuals with high school diploma education have the highest percentage of unemployment, with 2.7% or 13 of them being unemployed.
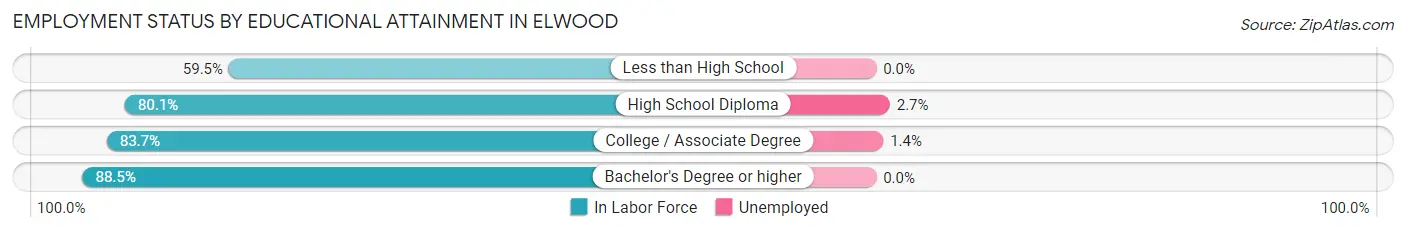
| Educational Attainment | In Labor Force | Unemployed |
| Less than High School | 25 (59.5%) | 0 (0.0%) |
| High School Diploma | 490 (80.1%) | 17 (2.7%) |
| College / Associate Degree | 416 (83.7%) | 7 (1.4%) |
| Bachelor's Degree or higher | 224 (88.5%) | 0 (0.0%) |
| Total | 1,155 (82.3%) | 22 (1.6%) |
Employment Occupations by Sex in Elwood
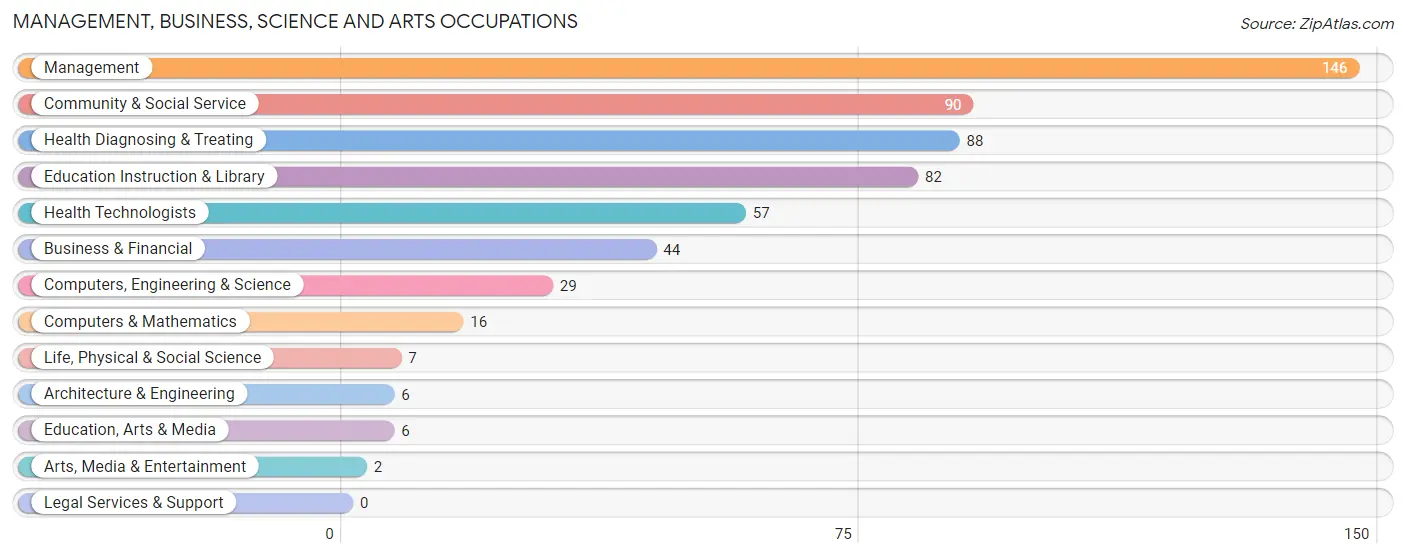
Management, Business, Science and Arts Occupations
The most common Management, Business, Science and Arts occupations in Elwood are Management (146 | 11.5%), Community & Social Service (90 | 7.1%), Health Diagnosing & Treating (88 | 7.0%), Education Instruction & Library (82 | 6.5%), and Health Technologists (57 | 4.5%).
Management, Business, Science and Arts Occupations by Sex
Within the Management, Business, Science and Arts occupations in Elwood, the most male-oriented occupations are Architecture & Engineering (100.0%), Life, Physical & Social Science (100.0%), and Computers, Engineering & Science (86.2%), while the most female-oriented occupations are Education, Arts & Media (100.0%), Arts, Media & Entertainment (100.0%), and Health Technologists (86.0%).
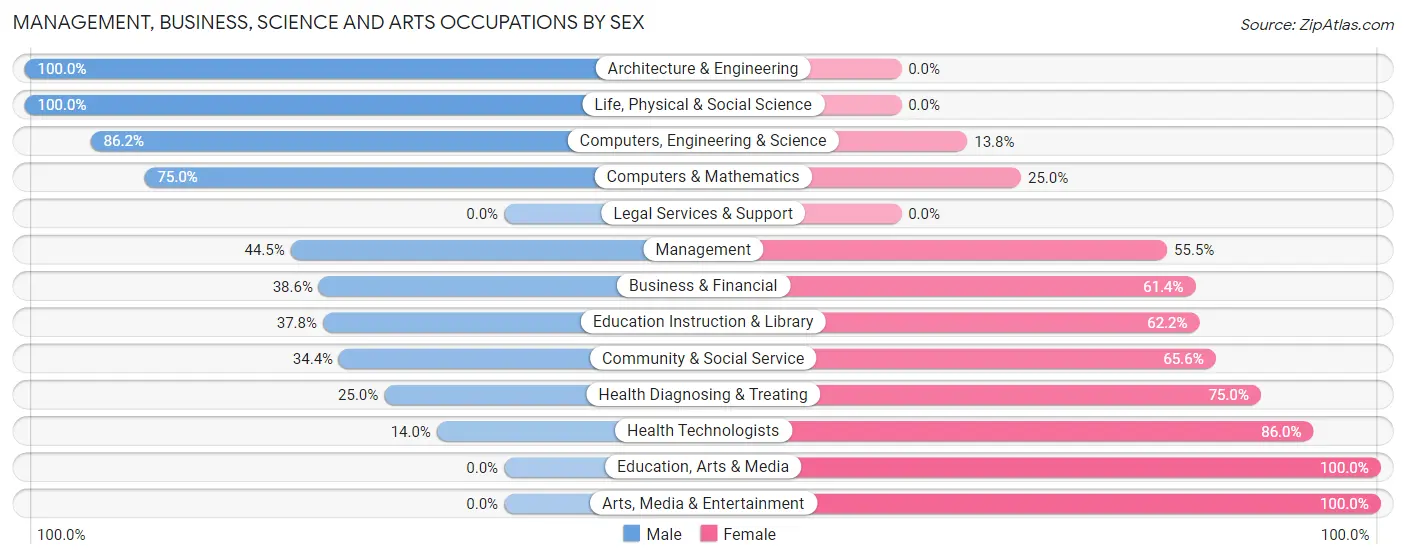
| Occupation | Male | Female |
| Management | 65 (44.5%) | 81 (55.5%) |
| Business & Financial | 17 (38.6%) | 27 (61.4%) |
| Computers, Engineering & Science | 25 (86.2%) | 4 (13.8%) |
| Computers & Mathematics | 12 (75.0%) | 4 (25.0%) |
| Architecture & Engineering | 6 (100.0%) | 0 (0.0%) |
| Life, Physical & Social Science | 7 (100.0%) | 0 (0.0%) |
| Community & Social Service | 31 (34.4%) | 59 (65.6%) |
| Education, Arts & Media | 0 (0.0%) | 6 (100.0%) |
| Legal Services & Support | 0 (0.0%) | 0 (0.0%) |
| Education Instruction & Library | 31 (37.8%) | 51 (62.2%) |
| Arts, Media & Entertainment | 0 (0.0%) | 2 (100.0%) |
| Health Diagnosing & Treating | 22 (25.0%) | 66 (75.0%) |
| Health Technologists | 8 (14.0%) | 49 (86.0%) |
| Total (Category) | 160 (40.3%) | 237 (59.7%) |
| Total (Overall) | 623 (49.2%) | 642 (50.7%) |
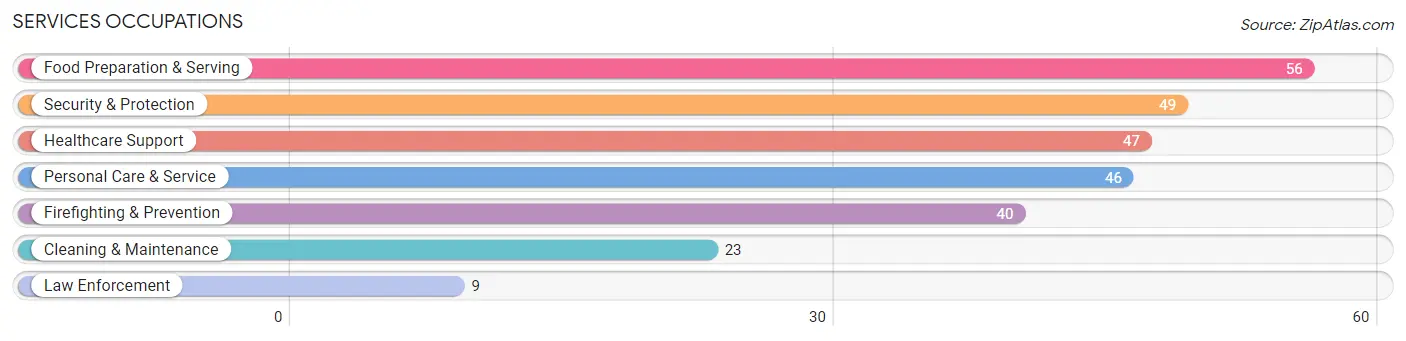
Services Occupations
The most common Services occupations in Elwood are Food Preparation & Serving (56 | 4.4%), Security & Protection (49 | 3.9%), Healthcare Support (47 | 3.7%), Personal Care & Service (46 | 3.6%), and Firefighting & Prevention (40 | 3.2%).
Services Occupations by Sex
Within the Services occupations in Elwood, the most male-oriented occupations are Law Enforcement (100.0%), Security & Protection (89.8%), and Firefighting & Prevention (87.5%), while the most female-oriented occupations are Healthcare Support (100.0%), Personal Care & Service (100.0%), and Food Preparation & Serving (75.0%).
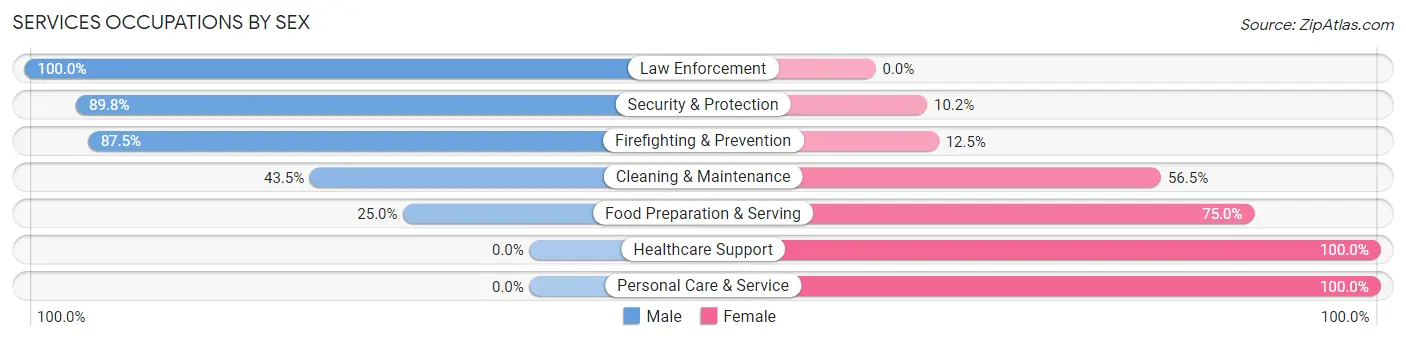
| Occupation | Male | Female |
| Healthcare Support | 0 (0.0%) | 47 (100.0%) |
| Security & Protection | 44 (89.8%) | 5 (10.2%) |
| Firefighting & Prevention | 35 (87.5%) | 5 (12.5%) |
| Law Enforcement | 9 (100.0%) | 0 (0.0%) |
| Food Preparation & Serving | 14 (25.0%) | 42 (75.0%) |
| Cleaning & Maintenance | 10 (43.5%) | 13 (56.5%) |
| Personal Care & Service | 0 (0.0%) | 46 (100.0%) |
| Total (Category) | 68 (30.8%) | 153 (69.2%) |
| Total (Overall) | 623 (49.2%) | 642 (50.7%) |
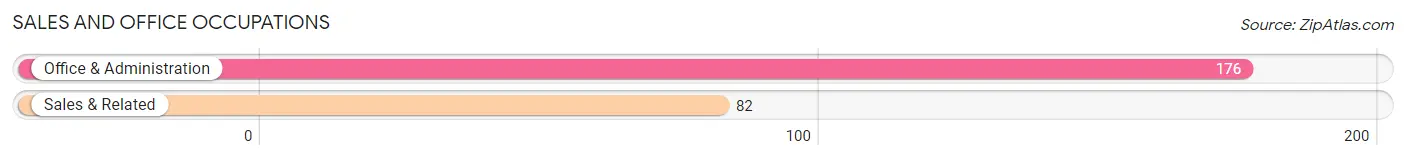
Sales and Office Occupations
The most common Sales and Office occupations in Elwood are Office & Administration (176 | 13.9%), and Sales & Related (82 | 6.5%).
Sales and Office Occupations by Sex
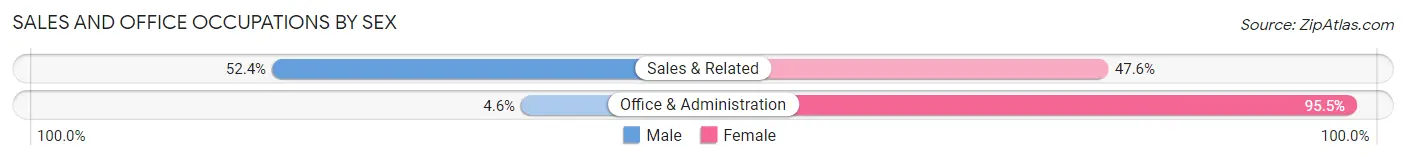
| Occupation | Male | Female |
| Sales & Related | 43 (52.4%) | 39 (47.6%) |
| Office & Administration | 8 (4.5%) | 168 (95.5%) |
| Total (Category) | 51 (19.8%) | 207 (80.2%) |
| Total (Overall) | 623 (49.2%) | 642 (50.7%) |
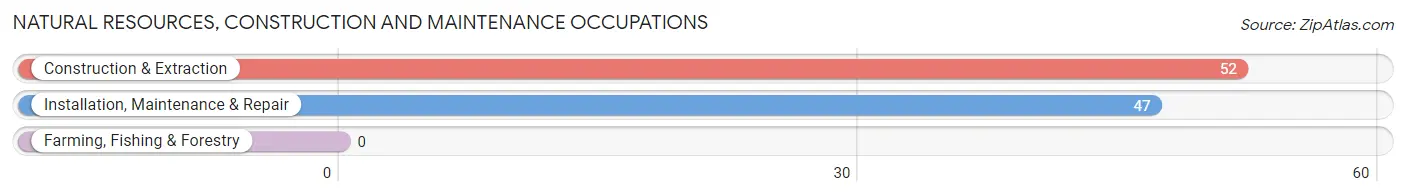
Natural Resources, Construction and Maintenance Occupations
The most common Natural Resources, Construction and Maintenance occupations in Elwood are Construction & Extraction (52 | 4.1%), and Installation, Maintenance & Repair (47 | 3.7%).
Natural Resources, Construction and Maintenance Occupations by Sex
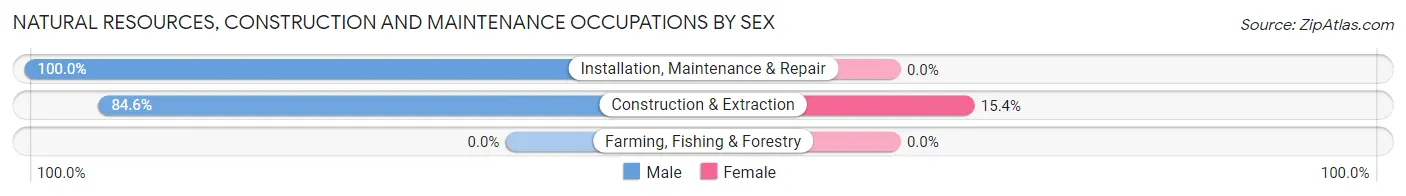
| Occupation | Male | Female |
| Farming, Fishing & Forestry | 0 (0.0%) | 0 (0.0%) |
| Construction & Extraction | 44 (84.6%) | 8 (15.4%) |
| Installation, Maintenance & Repair | 47 (100.0%) | 0 (0.0%) |
| Total (Category) | 91 (91.9%) | 8 (8.1%) |
| Total (Overall) | 623 (49.2%) | 642 (50.7%) |
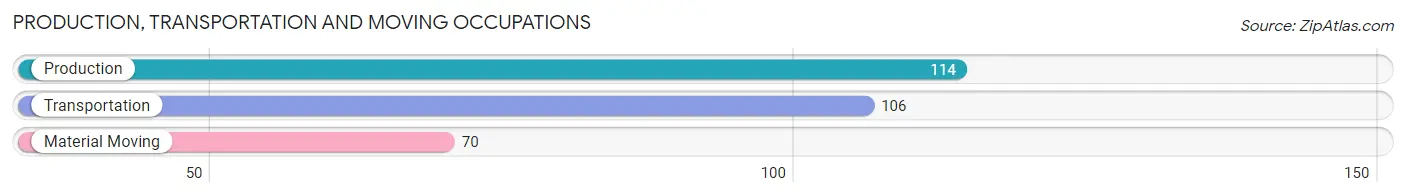
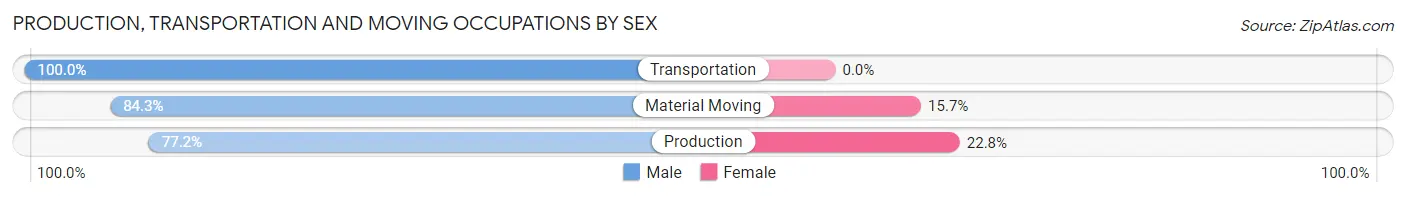
Production, Transportation and Moving Occupations
The most common Production, Transportation and Moving occupations in Elwood are Production (114 | 9.0%), Transportation (106 | 8.4%), and Material Moving (70 | 5.5%).
Production, Transportation and Moving Occupations by Sex
| Occupation | Male | Female |
| Production | 88 (77.2%) | 26 (22.8%) |
| Transportation | 106 (100.0%) | 0 (0.0%) |
| Material Moving | 59 (84.3%) | 11 (15.7%) |
| Total (Category) | 253 (87.2%) | 37 (12.8%) |
| Total (Overall) | 623 (49.2%) | 642 (50.7%) |
Employment Industries by Sex in Elwood
Employment Industries in Elwood
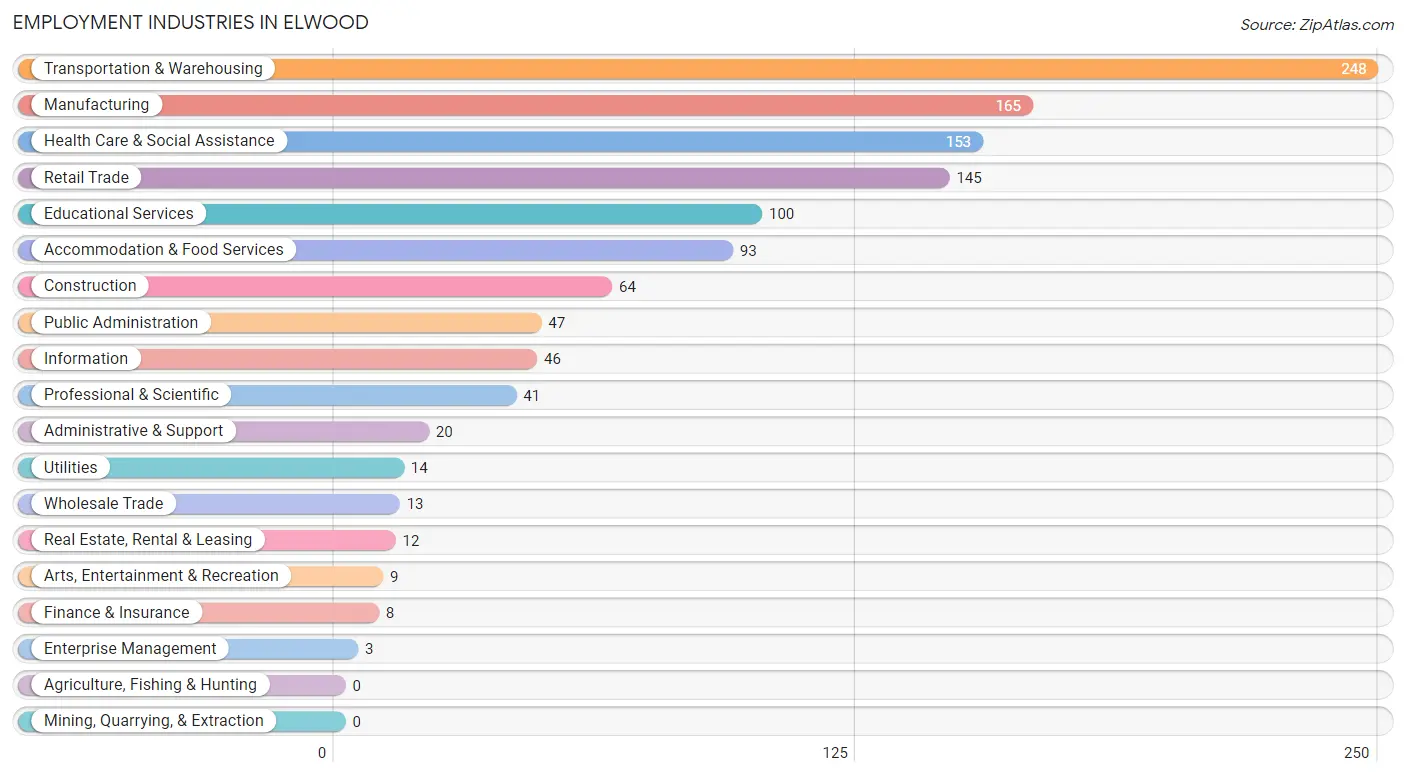
The major employment industries in Elwood include Transportation & Warehousing (248 | 19.6%), Manufacturing (165 | 13.0%), Health Care & Social Assistance (153 | 12.1%), Retail Trade (145 | 11.5%), and Educational Services (100 | 7.9%).
Employment Industries by Sex in Elwood
The Elwood industries that see more men than women are Wholesale Trade (100.0%), Utilities (100.0%), and Enterprise Management (100.0%), whereas the industries that tend to have a higher number of women are Information (100.0%), Finance & Insurance (100.0%), and Health Care & Social Assistance (82.4%).
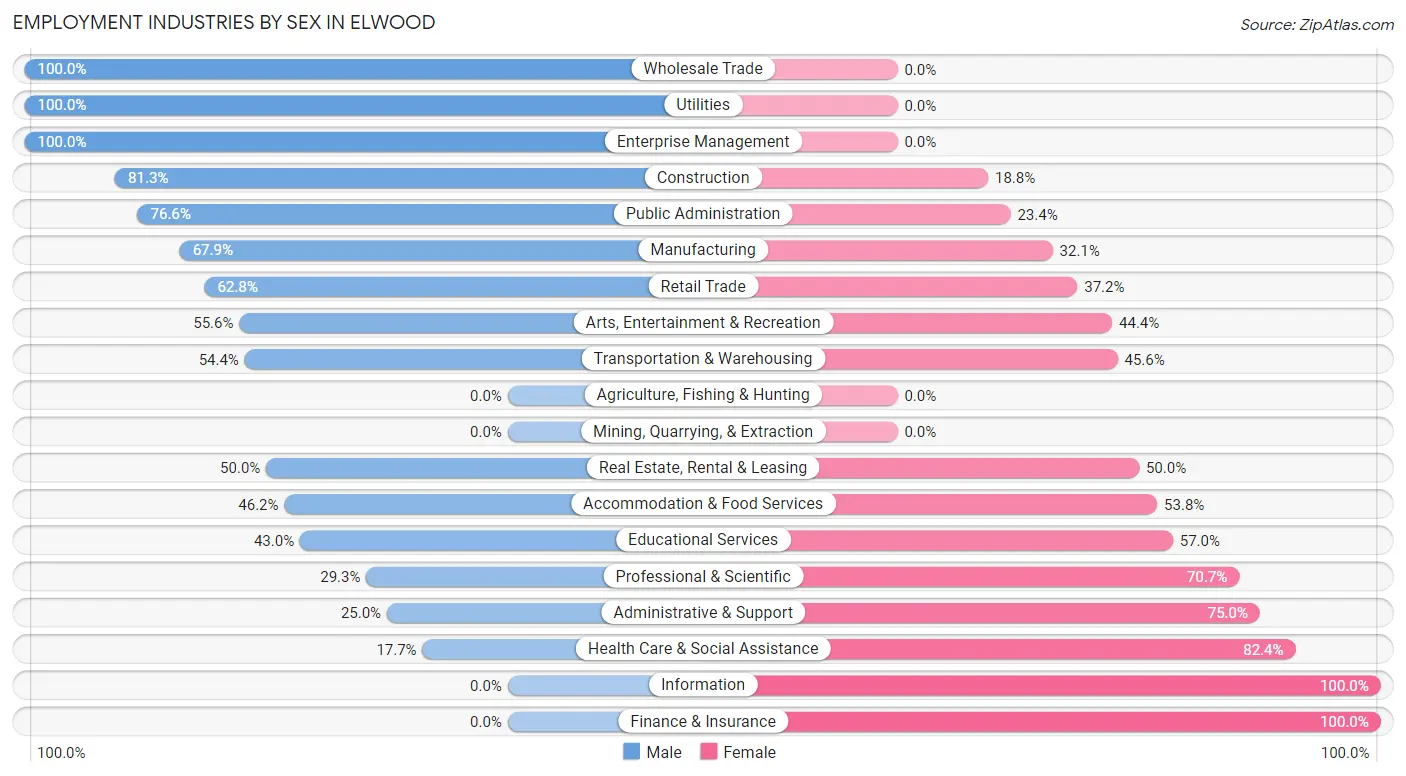
| Industry | Male | Female |
| Agriculture, Fishing & Hunting | 0 (0.0%) | 0 (0.0%) |
| Mining, Quarrying, & Extraction | 0 (0.0%) | 0 (0.0%) |
| Construction | 52 (81.2%) | 12 (18.8%) |
| Manufacturing | 112 (67.9%) | 53 (32.1%) |
| Wholesale Trade | 13 (100.0%) | 0 (0.0%) |
| Retail Trade | 91 (62.8%) | 54 (37.2%) |
| Transportation & Warehousing | 135 (54.4%) | 113 (45.6%) |
| Utilities | 14 (100.0%) | 0 (0.0%) |
| Information | 0 (0.0%) | 46 (100.0%) |
| Finance & Insurance | 0 (0.0%) | 8 (100.0%) |
| Real Estate, Rental & Leasing | 6 (50.0%) | 6 (50.0%) |
| Professional & Scientific | 12 (29.3%) | 29 (70.7%) |
| Enterprise Management | 3 (100.0%) | 0 (0.0%) |
| Administrative & Support | 5 (25.0%) | 15 (75.0%) |
| Educational Services | 43 (43.0%) | 57 (57.0%) |
| Health Care & Social Assistance | 27 (17.6%) | 126 (82.4%) |
| Arts, Entertainment & Recreation | 5 (55.6%) | 4 (44.4%) |
| Accommodation & Food Services | 43 (46.2%) | 50 (53.8%) |
| Public Administration | 36 (76.6%) | 11 (23.4%) |
| Total | 623 (49.2%) | 642 (50.7%) |
Education in Elwood
School Enrollment in Elwood
The most common levels of schooling among the 424 students in Elwood are high school (175 | 41.3%), middle school (82 | 19.3%), and elementary school (77 | 18.2%).
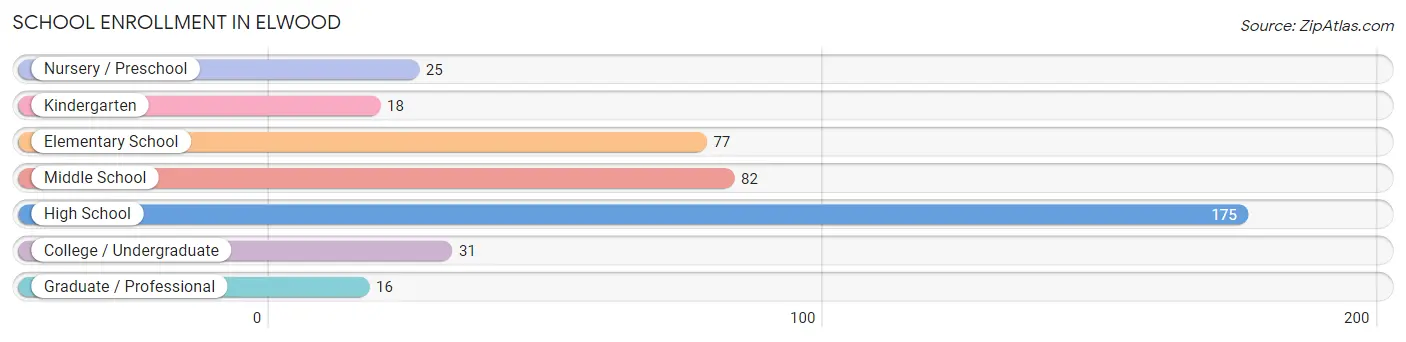
| School Level | # Students | % Students |
| Nursery / Preschool | 25 | 5.9% |
| Kindergarten | 18 | 4.3% |
| Elementary School | 77 | 18.2% |
| Middle School | 82 | 19.3% |
| High School | 175 | 41.3% |
| College / Undergraduate | 31 | 7.3% |
| Graduate / Professional | 16 | 3.8% |
| Total | 424 | 100.0% |
School Enrollment by Age by Funding Source in Elwood
Out of a total of 424 students who are enrolled in schools in Elwood, 13 (3.1%) attend a private institution, while the remaining 411 (96.9%) are enrolled in public schools. The age group of 25 to 34 year olds has the highest likelihood of being enrolled in private schools, with 5 (23.8% in the age bracket) enrolled. Conversely, the age group of 3 to 4 year olds has the lowest likelihood of being enrolled in a private school, with 25 (100.0% in the age bracket) attending a public institution.
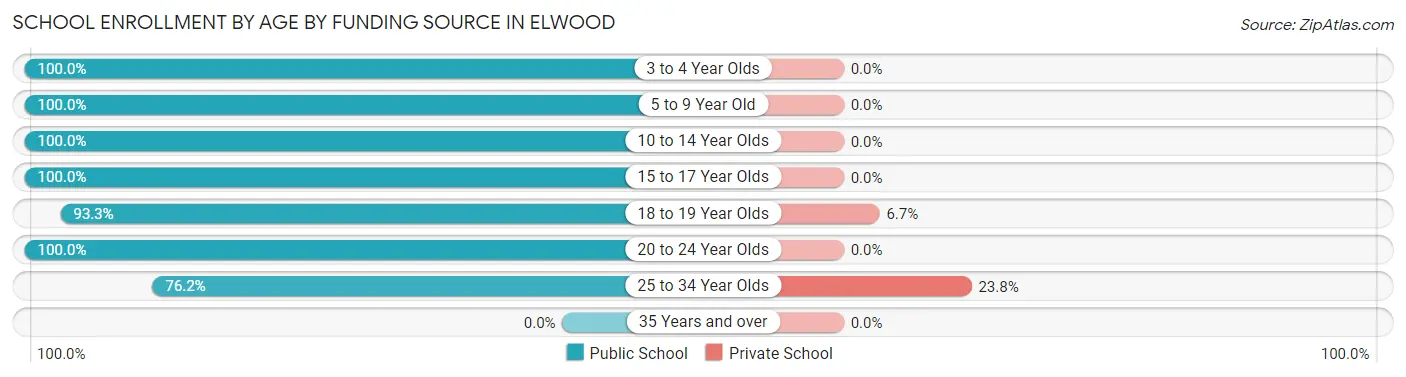
| Age Bracket | Public School | Private School |
| 3 to 4 Year Olds | 25 (100.0%) | 0 (0.0%) |
| 5 to 9 Year Old | 83 (100.0%) | 0 (0.0%) |
| 10 to 14 Year Olds | 111 (100.0%) | 0 (0.0%) |
| 15 to 17 Year Olds | 58 (100.0%) | 0 (0.0%) |
| 18 to 19 Year Olds | 112 (93.3%) | 8 (6.7%) |
| 20 to 24 Year Olds | 6 (100.0%) | 0 (0.0%) |
| 25 to 34 Year Olds | 16 (76.2%) | 5 (23.8%) |
| 35 Years and over | 0 (0.0%) | 0 (0.0%) |
| Total | 411 (96.9%) | 13 (3.1%) |
Educational Attainment by Field of Study in Elwood
Education (78 | 26.3%), science & technology (75 | 25.3%), business (44 | 14.8%), psychology (20 | 6.7%), and communications (19 | 6.4%) are the most common fields of study among 297 individuals in Elwood who have obtained a bachelor's degree or higher.
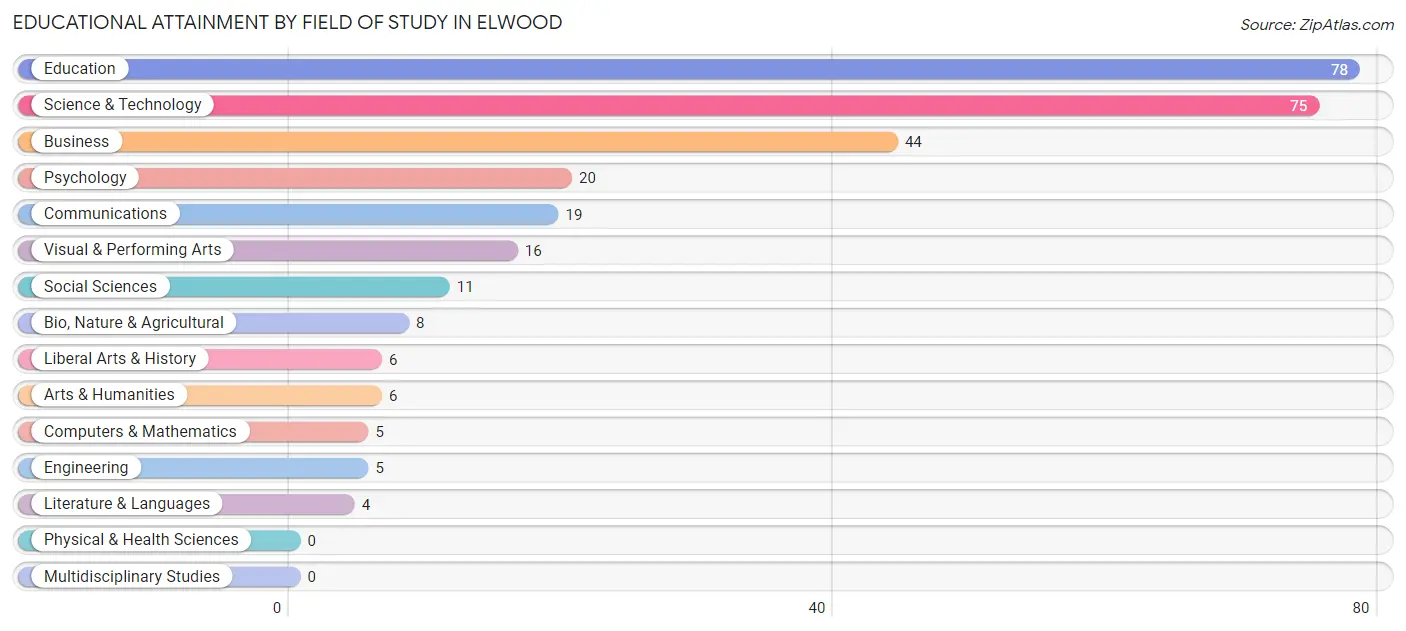
| Field of Study | # Graduates | % Graduates |
| Computers & Mathematics | 5 | 1.7% |
| Bio, Nature & Agricultural | 8 | 2.7% |
| Physical & Health Sciences | 0 | 0.0% |
| Psychology | 20 | 6.7% |
| Social Sciences | 11 | 3.7% |
| Engineering | 5 | 1.7% |
| Multidisciplinary Studies | 0 | 0.0% |
| Science & Technology | 75 | 25.3% |
| Business | 44 | 14.8% |
| Education | 78 | 26.3% |
| Literature & Languages | 4 | 1.3% |
| Liberal Arts & History | 6 | 2.0% |
| Visual & Performing Arts | 16 | 5.4% |
| Communications | 19 | 6.4% |
| Arts & Humanities | 6 | 2.0% |
| Total | 297 | 100.0% |
Transportation & Commute in Elwood
Vehicle Availability by Sex in Elwood
The most prevalent vehicle ownership categories in Elwood are males with 2 vehicles (354, accounting for 57.7%) and females with 2 vehicles (339, making up 56.7%).
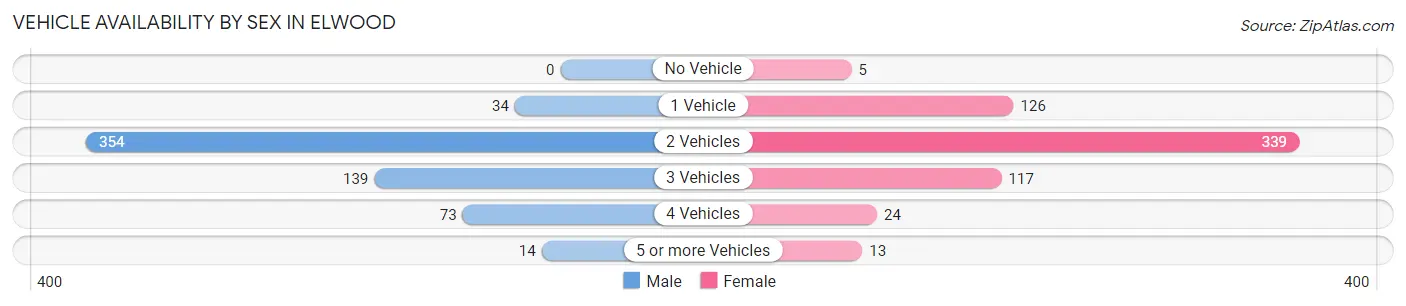
| Vehicles Available | Male | Female |
| No Vehicle | 0 (0.0%) | 5 (0.8%) |
| 1 Vehicle | 34 (5.5%) | 126 (20.2%) |
| 2 Vehicles | 354 (57.7%) | 339 (54.3%) |
| 3 Vehicles | 139 (22.6%) | 117 (18.8%) |
| 4 Vehicles | 73 (11.9%) | 24 (3.8%) |
| 5 or more Vehicles | 14 (2.3%) | 13 (2.1%) |
| Total | 614 (100.0%) | 624 (100.0%) |
Commute Time in Elwood
The most frequently occuring commute durations in Elwood are 20 to 24 minutes (226 commuters, 19.3%), 15 to 19 minutes (157 commuters, 13.4%), and 30 to 34 minutes (131 commuters, 11.2%).
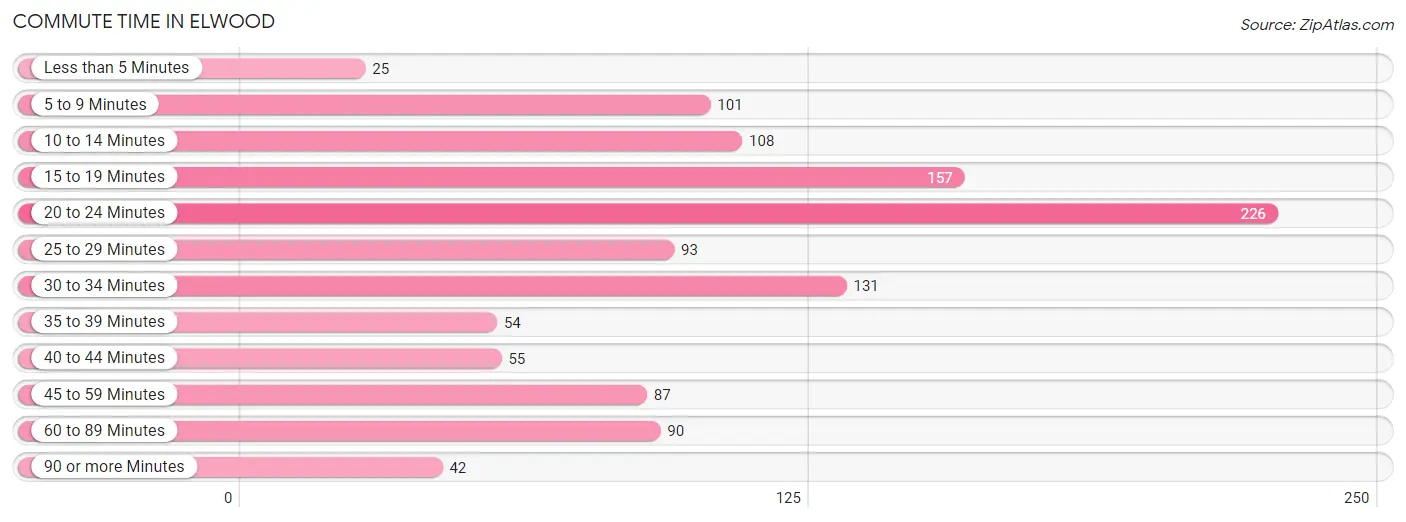
| Commute Time | # Commuters | % Commuters |
| Less than 5 Minutes | 25 | 2.1% |
| 5 to 9 Minutes | 101 | 8.6% |
| 10 to 14 Minutes | 108 | 9.2% |
| 15 to 19 Minutes | 157 | 13.4% |
| 20 to 24 Minutes | 226 | 19.3% |
| 25 to 29 Minutes | 93 | 8.0% |
| 30 to 34 Minutes | 131 | 11.2% |
| 35 to 39 Minutes | 54 | 4.6% |
| 40 to 44 Minutes | 55 | 4.7% |
| 45 to 59 Minutes | 87 | 7.4% |
| 60 to 89 Minutes | 90 | 7.7% |
| 90 or more Minutes | 42 | 3.6% |
Commute Time by Sex in Elwood
The most common commute times in Elwood are 20 to 24 minutes (85 commuters, 14.2%) for males and 20 to 24 minutes (141 commuters, 24.7%) for females.
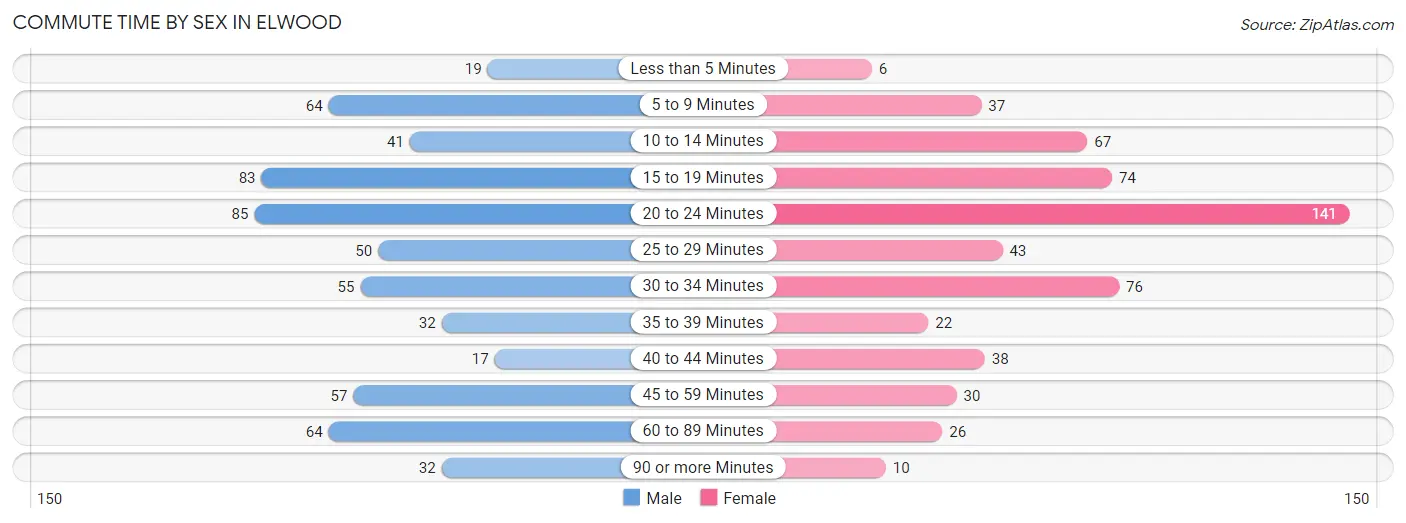
| Commute Time | Male | Female |
| Less than 5 Minutes | 19 (3.2%) | 6 (1.1%) |
| 5 to 9 Minutes | 64 (10.7%) | 37 (6.5%) |
| 10 to 14 Minutes | 41 (6.8%) | 67 (11.7%) |
| 15 to 19 Minutes | 83 (13.9%) | 74 (13.0%) |
| 20 to 24 Minutes | 85 (14.2%) | 141 (24.7%) |
| 25 to 29 Minutes | 50 (8.4%) | 43 (7.5%) |
| 30 to 34 Minutes | 55 (9.2%) | 76 (13.3%) |
| 35 to 39 Minutes | 32 (5.3%) | 22 (3.9%) |
| 40 to 44 Minutes | 17 (2.8%) | 38 (6.7%) |
| 45 to 59 Minutes | 57 (9.5%) | 30 (5.3%) |
| 60 to 89 Minutes | 64 (10.7%) | 26 (4.6%) |
| 90 or more Minutes | 32 (5.3%) | 10 (1.8%) |
Time of Departure to Work by Sex in Elwood
The most frequent times of departure to work in Elwood are 5:30 AM to 5:59 AM (102, 17.0%) for males and 8:00 AM to 8:29 AM (100, 17.5%) for females.
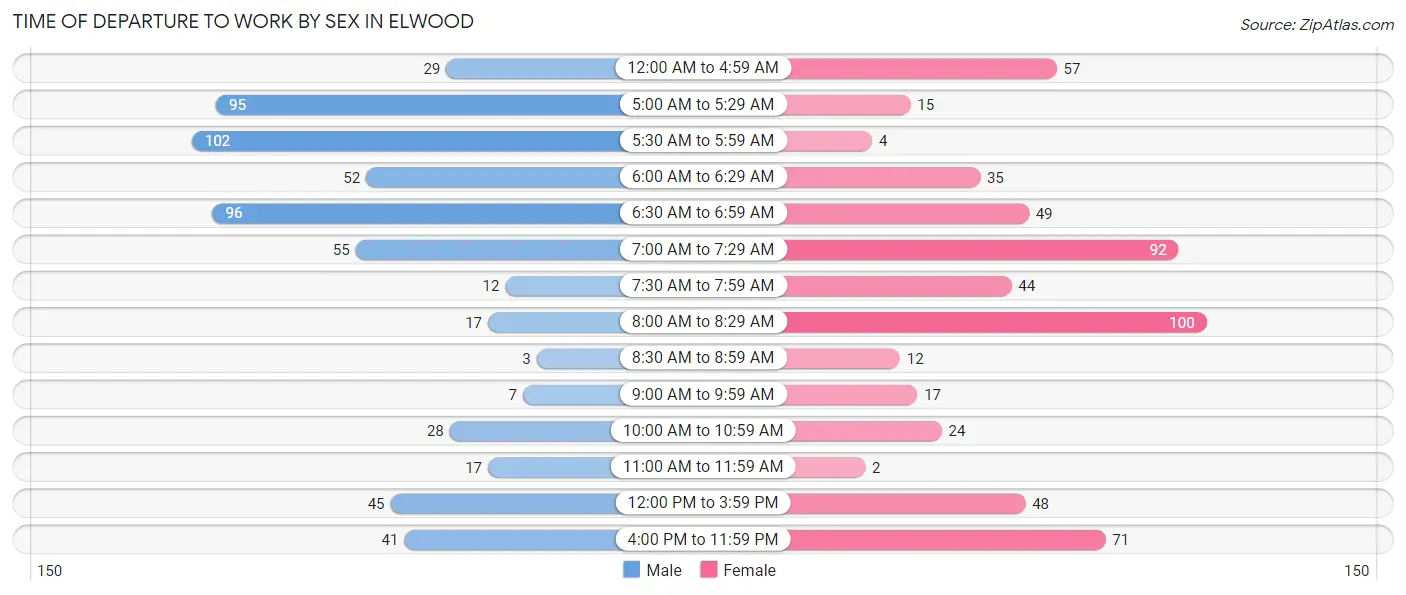
| Time of Departure | Male | Female |
| 12:00 AM to 4:59 AM | 29 (4.8%) | 57 (10.0%) |
| 5:00 AM to 5:29 AM | 95 (15.9%) | 15 (2.6%) |
| 5:30 AM to 5:59 AM | 102 (17.0%) | 4 (0.7%) |
| 6:00 AM to 6:29 AM | 52 (8.7%) | 35 (6.1%) |
| 6:30 AM to 6:59 AM | 96 (16.0%) | 49 (8.6%) |
| 7:00 AM to 7:29 AM | 55 (9.2%) | 92 (16.1%) |
| 7:30 AM to 7:59 AM | 12 (2.0%) | 44 (7.7%) |
| 8:00 AM to 8:29 AM | 17 (2.8%) | 100 (17.5%) |
| 8:30 AM to 8:59 AM | 3 (0.5%) | 12 (2.1%) |
| 9:00 AM to 9:59 AM | 7 (1.2%) | 17 (3.0%) |
| 10:00 AM to 10:59 AM | 28 (4.7%) | 24 (4.2%) |
| 11:00 AM to 11:59 AM | 17 (2.8%) | 2 (0.4%) |
| 12:00 PM to 3:59 PM | 45 (7.5%) | 48 (8.4%) |
| 4:00 PM to 11:59 PM | 41 (6.8%) | 71 (12.5%) |
| Total | 599 (100.0%) | 570 (100.0%) |
Housing Occupancy in Elwood
Occupancy by Ownership in Elwood
Of the total 936 dwellings in Elwood, owner-occupied units account for 780 (83.3%), while renter-occupied units make up 156 (16.7%).
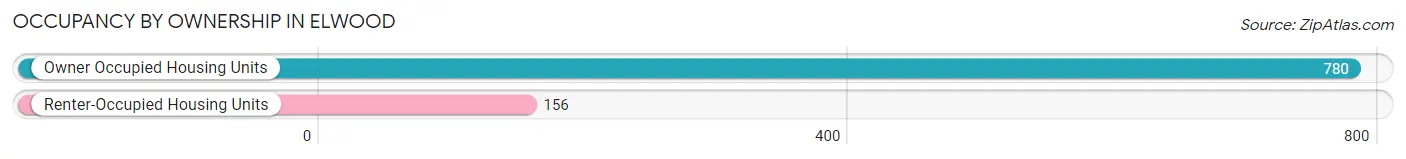
| Occupancy | # Housing Units | % Housing Units |
| Owner Occupied Housing Units | 780 | 83.3% |
| Renter-Occupied Housing Units | 156 | 16.7% |
| Total Occupied Housing Units | 936 | 100.0% |
Occupancy by Household Size in Elwood
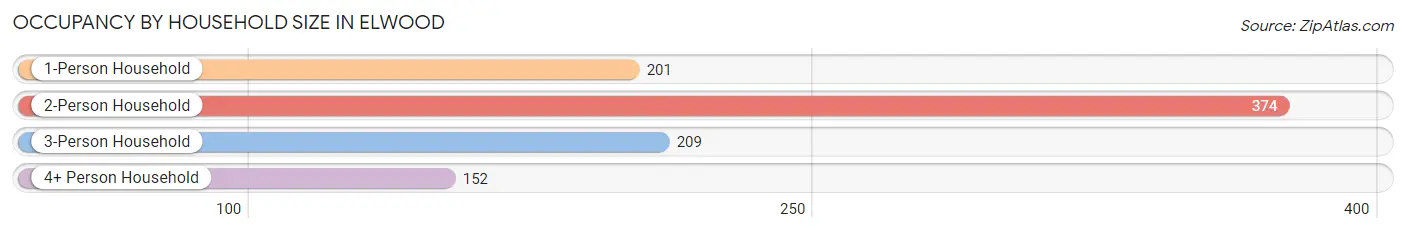
| Household Size | # Housing Units | % Housing Units |
| 1-Person Household | 201 | 21.5% |
| 2-Person Household | 374 | 40.0% |
| 3-Person Household | 209 | 22.3% |
| 4+ Person Household | 152 | 16.2% |
| Total Housing Units | 936 | 100.0% |
Occupancy by Ownership by Household Size in Elwood
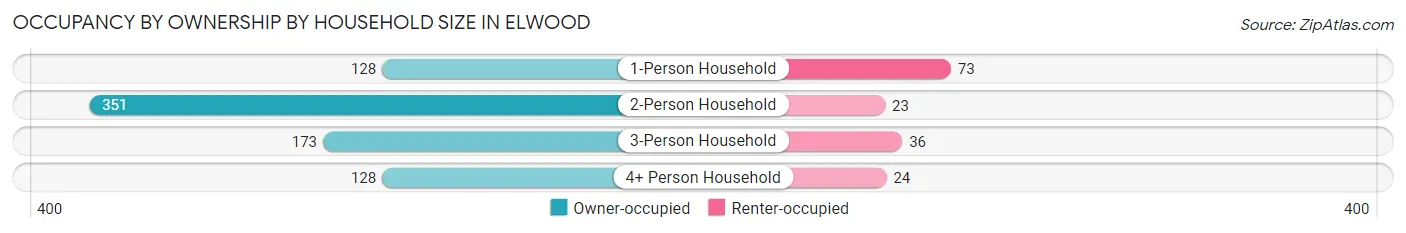
| Household Size | Owner-occupied | Renter-occupied |
| 1-Person Household | 128 (63.7%) | 73 (36.3%) |
| 2-Person Household | 351 (93.9%) | 23 (6.1%) |
| 3-Person Household | 173 (82.8%) | 36 (17.2%) |
| 4+ Person Household | 128 (84.2%) | 24 (15.8%) |
| Total Housing Units | 780 (83.3%) | 156 (16.7%) |
Occupancy by Educational Attainment in Elwood
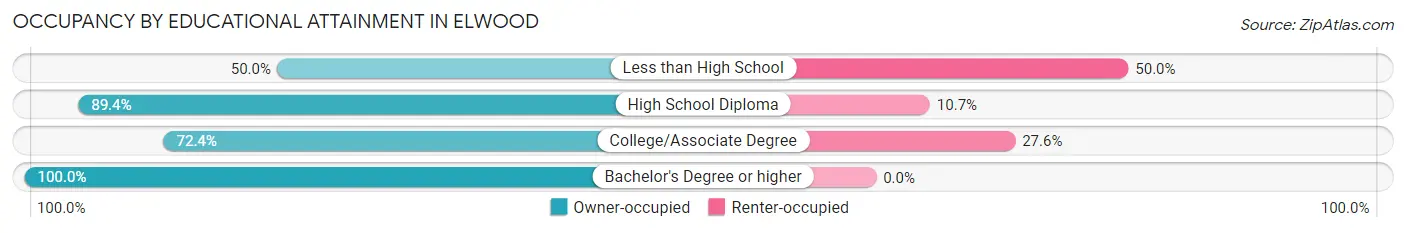
| Household Size | Owner-occupied | Renter-occupied |
| Less than High School | 21 (50.0%) | 21 (50.0%) |
| High School Diploma | 344 (89.3%) | 41 (10.6%) |
| College/Associate Degree | 247 (72.4%) | 94 (27.6%) |
| Bachelor's Degree or higher | 168 (100.0%) | 0 (0.0%) |
Occupancy by Age of Householder in Elwood
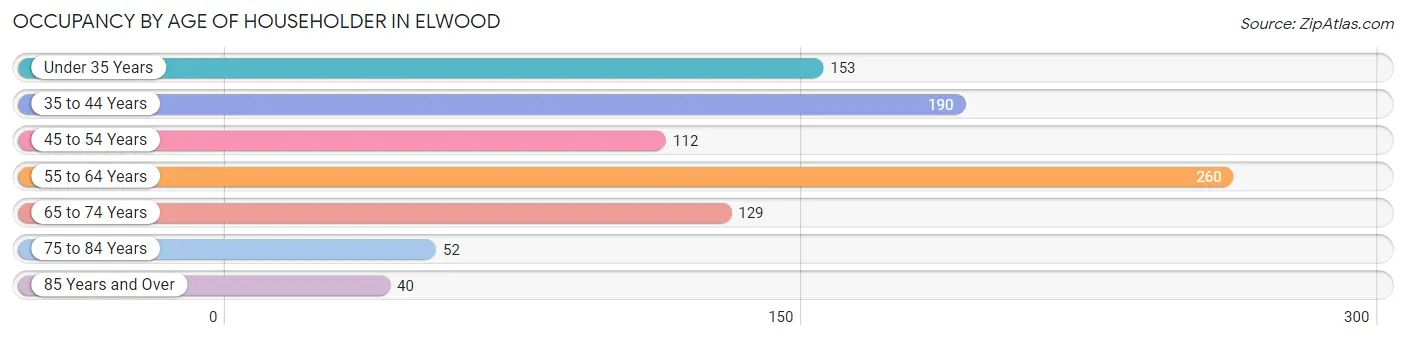
| Age Bracket | # Households | % Households |
| Under 35 Years | 153 | 16.4% |
| 35 to 44 Years | 190 | 20.3% |
| 45 to 54 Years | 112 | 12.0% |
| 55 to 64 Years | 260 | 27.8% |
| 65 to 74 Years | 129 | 13.8% |
| 75 to 84 Years | 52 | 5.6% |
| 85 Years and Over | 40 | 4.3% |
| Total | 936 | 100.0% |
Housing Finances in Elwood
Median Income by Occupancy in Elwood
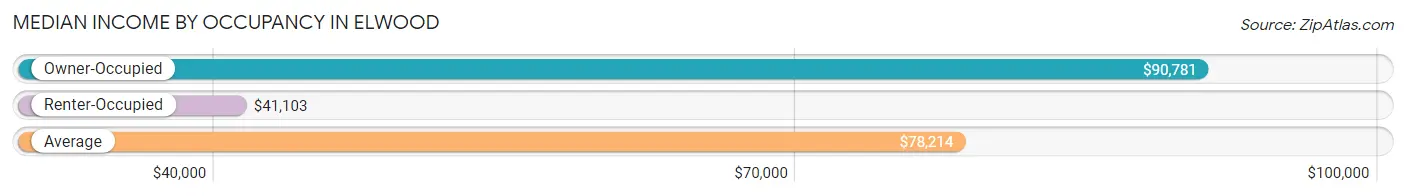
| Occupancy Type | # Households | Median Income |
| Owner-Occupied | 780 (83.3%) | $90,781 |
| Renter-Occupied | 156 (16.7%) | $41,103 |
| Average | 936 (100.0%) | $78,214 |
Occupancy by Householder Income Bracket in Elwood
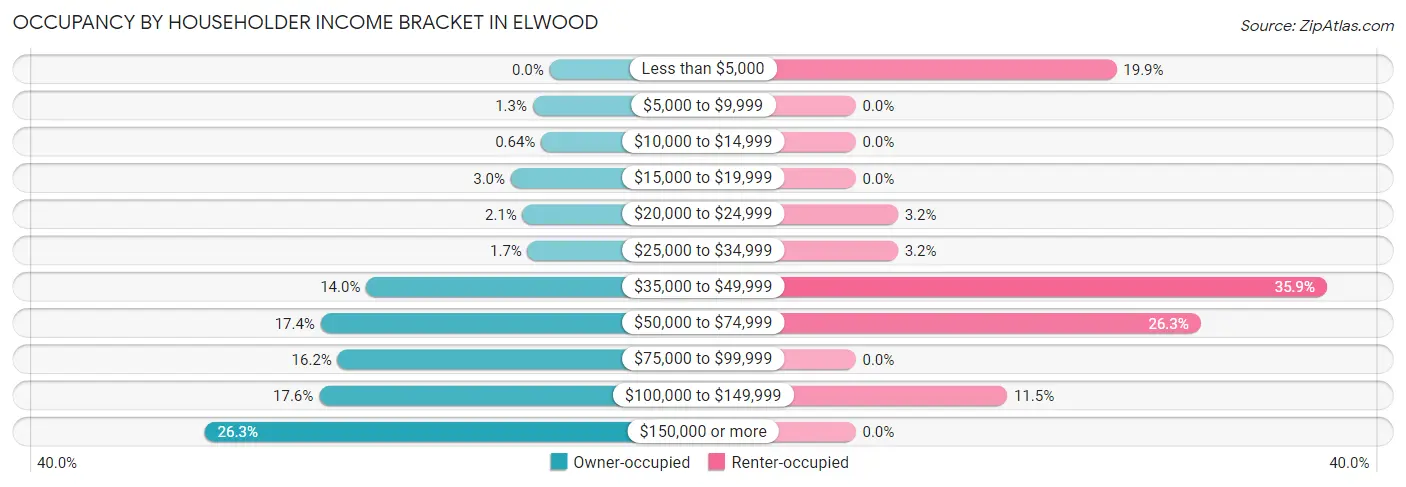
| Income Bracket | Owner-occupied | Renter-occupied |
| Less than $5,000 | 0 (0.0%) | 31 (19.9%) |
| $5,000 to $9,999 | 10 (1.3%) | 0 (0.0%) |
| $10,000 to $14,999 | 5 (0.6%) | 0 (0.0%) |
| $15,000 to $19,999 | 23 (2.9%) | 0 (0.0%) |
| $20,000 to $24,999 | 16 (2.1%) | 5 (3.2%) |
| $25,000 to $34,999 | 13 (1.7%) | 5 (3.2%) |
| $35,000 to $49,999 | 109 (14.0%) | 56 (35.9%) |
| $50,000 to $74,999 | 136 (17.4%) | 41 (26.3%) |
| $75,000 to $99,999 | 126 (16.2%) | 0 (0.0%) |
| $100,000 to $149,999 | 137 (17.6%) | 18 (11.5%) |
| $150,000 or more | 205 (26.3%) | 0 (0.0%) |
| Total | 780 (100.0%) | 156 (100.0%) |
Monthly Housing Cost Tiers in Elwood
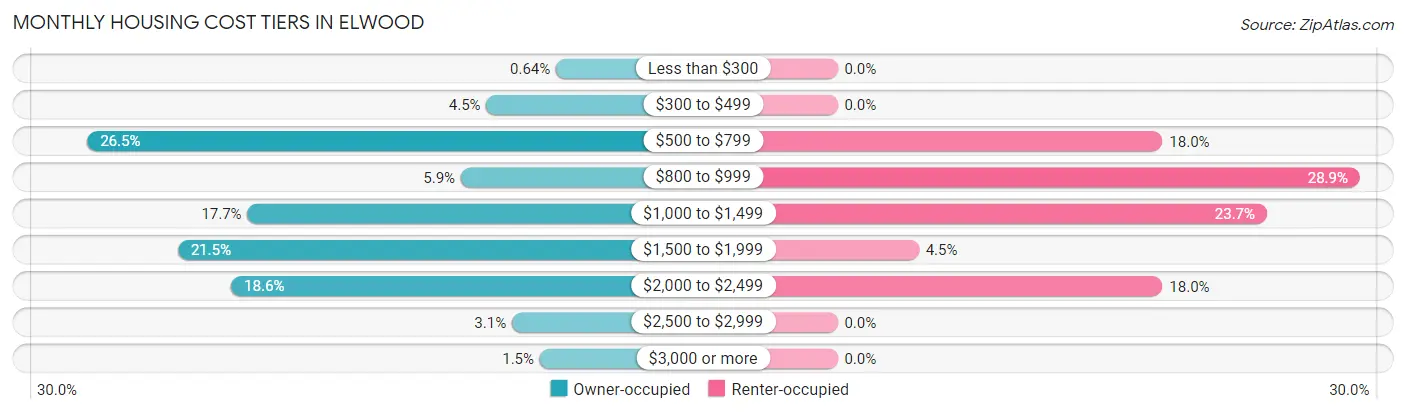
| Monthly Cost | Owner-occupied | Renter-occupied |
| Less than $300 | 5 (0.6%) | 0 (0.0%) |
| $300 to $499 | 35 (4.5%) | 0 (0.0%) |
| $500 to $799 | 207 (26.5%) | 28 (17.9%) |
| $800 to $999 | 46 (5.9%) | 45 (28.8%) |
| $1,000 to $1,499 | 138 (17.7%) | 37 (23.7%) |
| $1,500 to $1,999 | 168 (21.5%) | 7 (4.5%) |
| $2,000 to $2,499 | 145 (18.6%) | 28 (17.9%) |
| $2,500 to $2,999 | 24 (3.1%) | 0 (0.0%) |
| $3,000 or more | 12 (1.5%) | 0 (0.0%) |
| Total | 780 (100.0%) | 156 (100.0%) |
Physical Housing Characteristics in Elwood
Housing Structures in Elwood
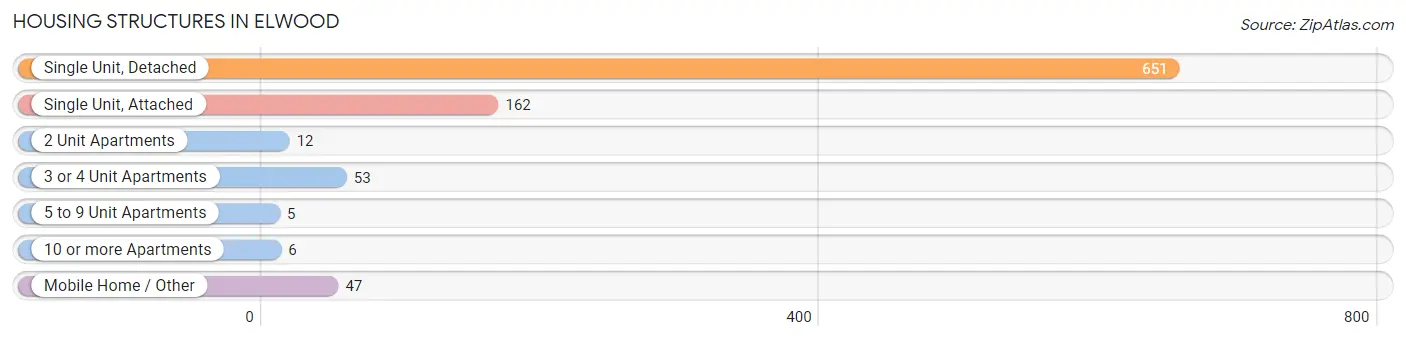
| Structure Type | # Housing Units | % Housing Units |
| Single Unit, Detached | 651 | 69.6% |
| Single Unit, Attached | 162 | 17.3% |
| 2 Unit Apartments | 12 | 1.3% |
| 3 or 4 Unit Apartments | 53 | 5.7% |
| 5 to 9 Unit Apartments | 5 | 0.5% |
| 10 or more Apartments | 6 | 0.6% |
| Mobile Home / Other | 47 | 5.0% |
| Total | 936 | 100.0% |
Housing Structures by Occupancy in Elwood
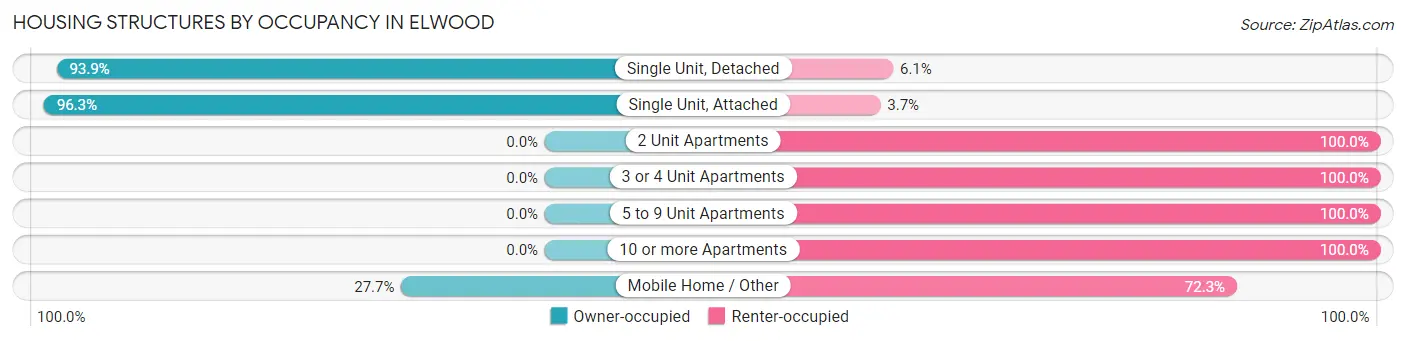
| Structure Type | Owner-occupied | Renter-occupied |
| Single Unit, Detached | 611 (93.9%) | 40 (6.1%) |
| Single Unit, Attached | 156 (96.3%) | 6 (3.7%) |
| 2 Unit Apartments | 0 (0.0%) | 12 (100.0%) |
| 3 or 4 Unit Apartments | 0 (0.0%) | 53 (100.0%) |
| 5 to 9 Unit Apartments | 0 (0.0%) | 5 (100.0%) |
| 10 or more Apartments | 0 (0.0%) | 6 (100.0%) |
| Mobile Home / Other | 13 (27.7%) | 34 (72.3%) |
| Total | 780 (83.3%) | 156 (16.7%) |
Housing Structures by Number of Rooms in Elwood
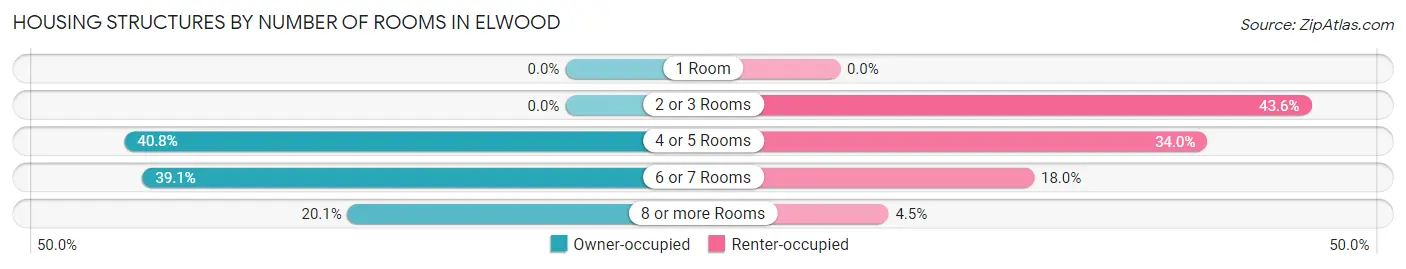
| Number of Rooms | Owner-occupied | Renter-occupied |
| 1 Room | 0 (0.0%) | 0 (0.0%) |
| 2 or 3 Rooms | 0 (0.0%) | 68 (43.6%) |
| 4 or 5 Rooms | 318 (40.8%) | 53 (34.0%) |
| 6 or 7 Rooms | 305 (39.1%) | 28 (17.9%) |
| 8 or more Rooms | 157 (20.1%) | 7 (4.5%) |
| Total | 780 (100.0%) | 156 (100.0%) |
Housing Structure by Heating Type in Elwood
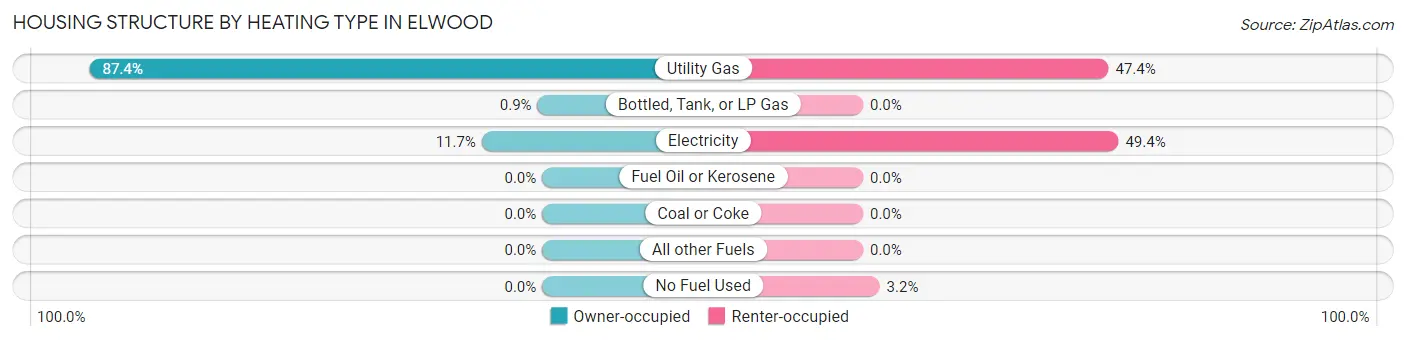
| Heating Type | Owner-occupied | Renter-occupied |
| Utility Gas | 682 (87.4%) | 74 (47.4%) |
| Bottled, Tank, or LP Gas | 7 (0.9%) | 0 (0.0%) |
| Electricity | 91 (11.7%) | 77 (49.4%) |
| Fuel Oil or Kerosene | 0 (0.0%) | 0 (0.0%) |
| Coal or Coke | 0 (0.0%) | 0 (0.0%) |
| All other Fuels | 0 (0.0%) | 0 (0.0%) |
| No Fuel Used | 0 (0.0%) | 5 (3.2%) |
| Total | 780 (100.0%) | 156 (100.0%) |
Household Vehicle Usage in Elwood
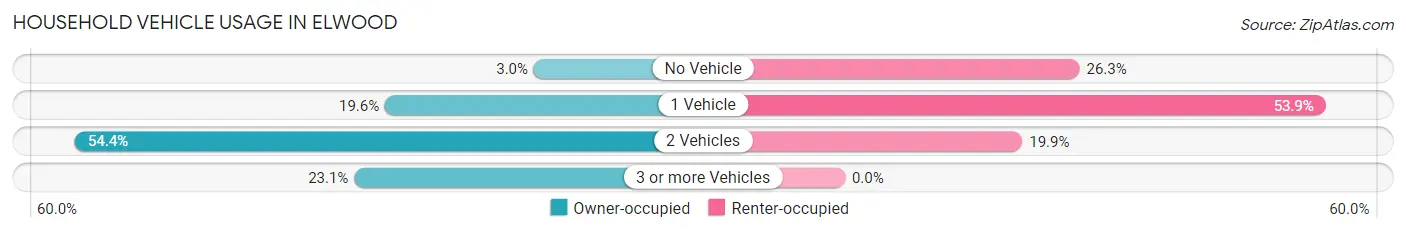
| Vehicles per Household | Owner-occupied | Renter-occupied |
| No Vehicle | 23 (2.9%) | 41 (26.3%) |
| 1 Vehicle | 153 (19.6%) | 84 (53.8%) |
| 2 Vehicles | 424 (54.4%) | 31 (19.9%) |
| 3 or more Vehicles | 180 (23.1%) | 0 (0.0%) |
| Total | 780 (100.0%) | 156 (100.0%) |
Real Estate & Mortgages in Elwood
Real Estate and Mortgage Overview in Elwood
| Characteristic | Without Mortgage | With Mortgage |
| Housing Units | 274 | 506 |
| Median Property Value | $187,600 | $218,400 |
| Median Household Income | $79,688 | $124 |
| Monthly Housing Costs | $645 | $12 |
| Real Estate Taxes | $3,885 | $0 |
Property Value by Mortgage Status in Elwood
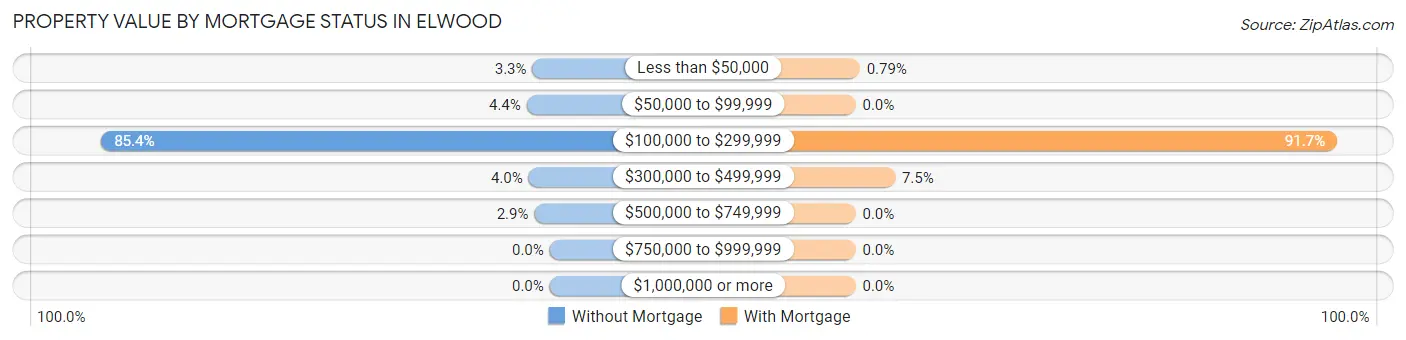
| Property Value | Without Mortgage | With Mortgage |
| Less than $50,000 | 9 (3.3%) | 4 (0.8%) |
| $50,000 to $99,999 | 12 (4.4%) | 0 (0.0%) |
| $100,000 to $299,999 | 234 (85.4%) | 464 (91.7%) |
| $300,000 to $499,999 | 11 (4.0%) | 38 (7.5%) |
| $500,000 to $749,999 | 8 (2.9%) | 0 (0.0%) |
| $750,000 to $999,999 | 0 (0.0%) | 0 (0.0%) |
| $1,000,000 or more | 0 (0.0%) | 0 (0.0%) |
| Total | 274 (100.0%) | 506 (100.0%) |
Household Income by Mortgage Status in Elwood
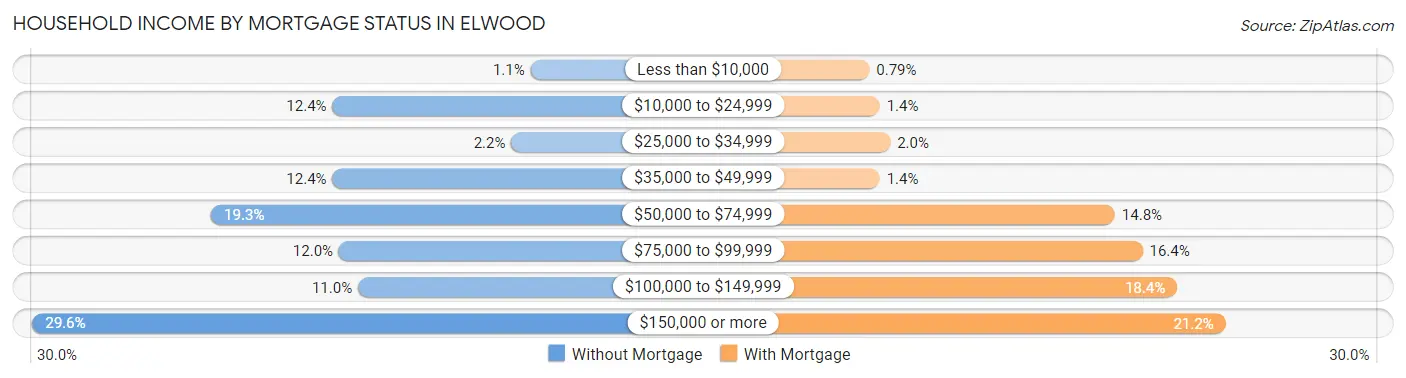
| Household Income | Without Mortgage | With Mortgage |
| Less than $10,000 | 3 (1.1%) | 4 (0.8%) |
| $10,000 to $24,999 | 34 (12.4%) | 7 (1.4%) |
| $25,000 to $34,999 | 6 (2.2%) | 10 (2.0%) |
| $35,000 to $49,999 | 34 (12.4%) | 7 (1.4%) |
| $50,000 to $74,999 | 53 (19.3%) | 75 (14.8%) |
| $75,000 to $99,999 | 33 (12.0%) | 83 (16.4%) |
| $100,000 to $149,999 | 30 (11.0%) | 93 (18.4%) |
| $150,000 or more | 81 (29.6%) | 107 (21.1%) |
| Total | 274 (100.0%) | 506 (100.0%) |
Property Value to Household Income Ratio in Elwood
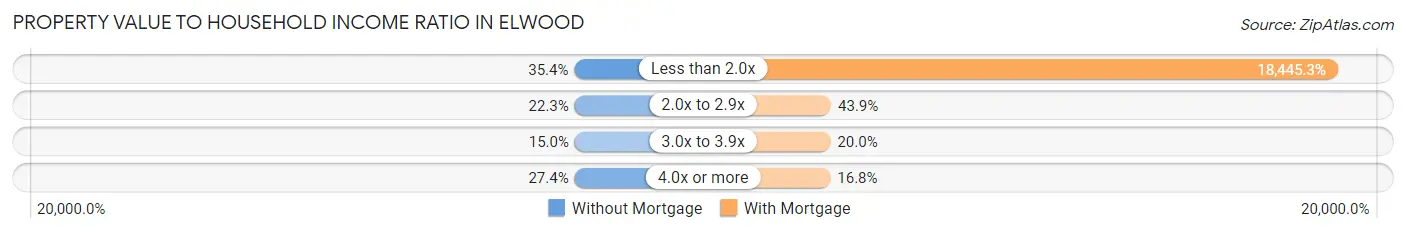
| Value-to-Income Ratio | Without Mortgage | With Mortgage |
| Less than 2.0x | 97 (35.4%) | 93,333 (18,445.3%) |
| 2.0x to 2.9x | 61 (22.3%) | 222 (43.9%) |
| 3.0x to 3.9x | 41 (15.0%) | 101 (20.0%) |
| 4.0x or more | 75 (27.4%) | 85 (16.8%) |
| Total | 274 (100.0%) | 506 (100.0%) |
Real Estate Taxes by Mortgage Status in Elwood
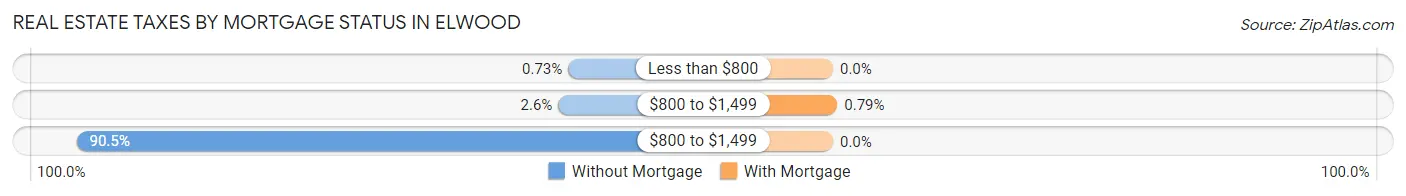
| Property Taxes | Without Mortgage | With Mortgage |
| Less than $800 | 2 (0.7%) | 0 (0.0%) |
| $800 to $1,499 | 7 (2.5%) | 4 (0.8%) |
| $800 to $1,499 | 248 (90.5%) | 0 (0.0%) |
| Total | 274 (100.0%) | 506 (100.0%) |
Health & Disability in Elwood
Health Insurance Coverage by Age in Elwood
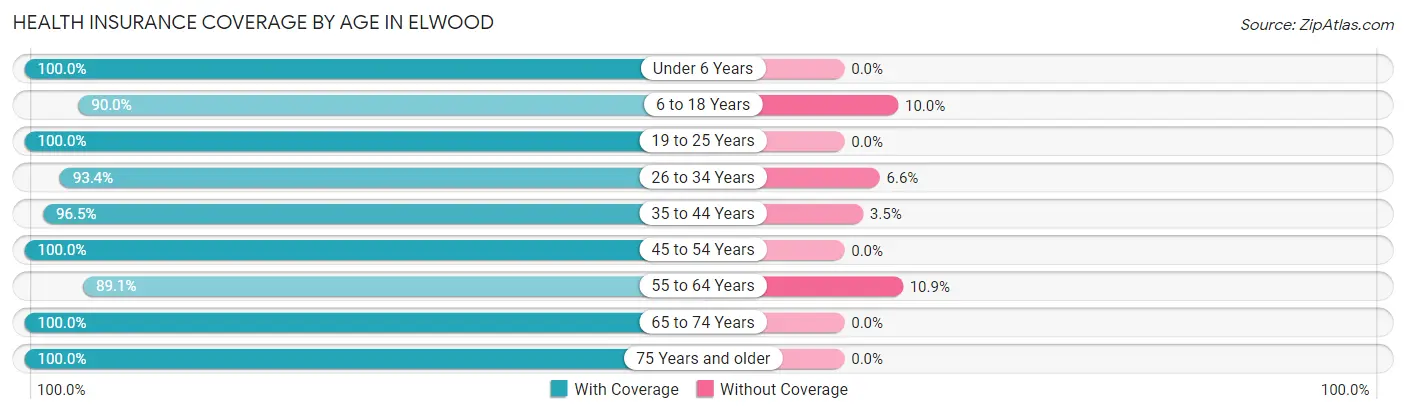
| Age Bracket | With Coverage | Without Coverage |
| Under 6 Years | 139 (100.0%) | 0 (0.0%) |
| 6 to 18 Years | 314 (90.0%) | 35 (10.0%) |
| 19 to 25 Years | 128 (100.0%) | 0 (0.0%) |
| 26 to 34 Years | 341 (93.4%) | 24 (6.6%) |
| 35 to 44 Years | 306 (96.5%) | 11 (3.5%) |
| 45 to 54 Years | 203 (100.0%) | 0 (0.0%) |
| 55 to 64 Years | 425 (89.1%) | 52 (10.9%) |
| 65 to 74 Years | 189 (100.0%) | 0 (0.0%) |
| 75 Years and older | 148 (100.0%) | 0 (0.0%) |
| Total | 2,193 (94.7%) | 122 (5.3%) |
Health Insurance Coverage by Citizenship Status in Elwood
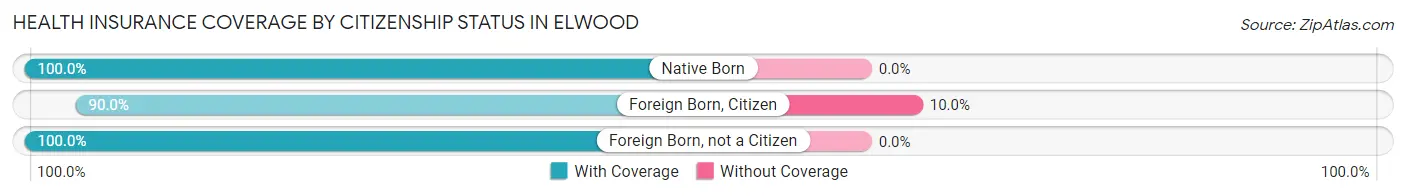
| Citizenship Status | With Coverage | Without Coverage |
| Native Born | 139 (100.0%) | 0 (0.0%) |
| Foreign Born, Citizen | 314 (90.0%) | 35 (10.0%) |
| Foreign Born, not a Citizen | 128 (100.0%) | 0 (0.0%) |
Health Insurance Coverage by Household Income in Elwood
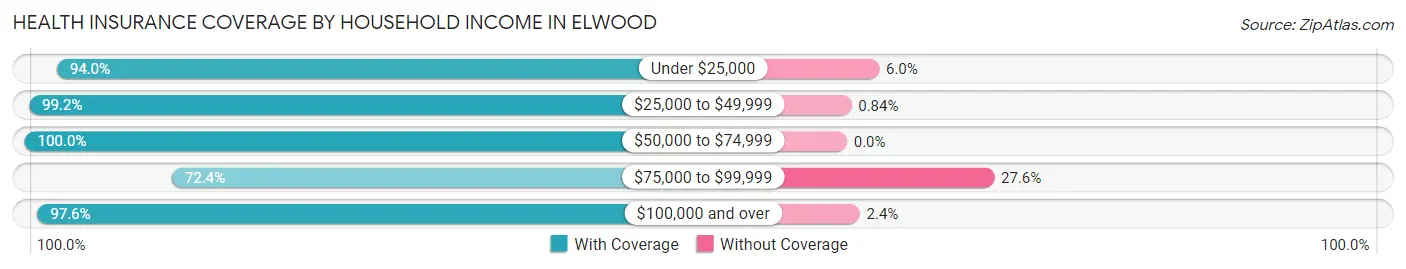
| Household Income | With Coverage | Without Coverage |
| Under $25,000 | 140 (94.0%) | 9 (6.0%) |
| $25,000 to $49,999 | 470 (99.2%) | 4 (0.8%) |
| $50,000 to $74,999 | 384 (100.0%) | 0 (0.0%) |
| $75,000 to $99,999 | 223 (72.4%) | 85 (27.6%) |
| $100,000 and over | 976 (97.6%) | 24 (2.4%) |
Public vs Private Health Insurance Coverage by Age in Elwood
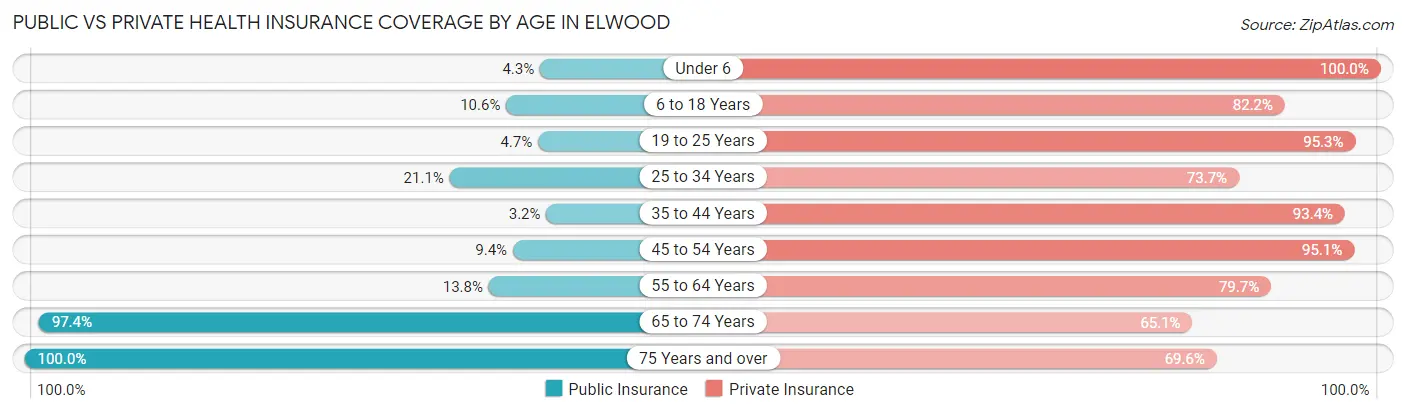
| Age Bracket | Public Insurance | Private Insurance |
| Under 6 | 6 (4.3%) | 139 (100.0%) |
| 6 to 18 Years | 37 (10.6%) | 287 (82.2%) |
| 19 to 25 Years | 6 (4.7%) | 122 (95.3%) |
| 25 to 34 Years | 77 (21.1%) | 269 (73.7%) |
| 35 to 44 Years | 10 (3.2%) | 296 (93.4%) |
| 45 to 54 Years | 19 (9.4%) | 193 (95.1%) |
| 55 to 64 Years | 66 (13.8%) | 380 (79.7%) |
| 65 to 74 Years | 184 (97.4%) | 123 (65.1%) |
| 75 Years and over | 148 (100.0%) | 103 (69.6%) |
| Total | 553 (23.9%) | 1,912 (82.6%) |
Disability Status by Sex by Age in Elwood
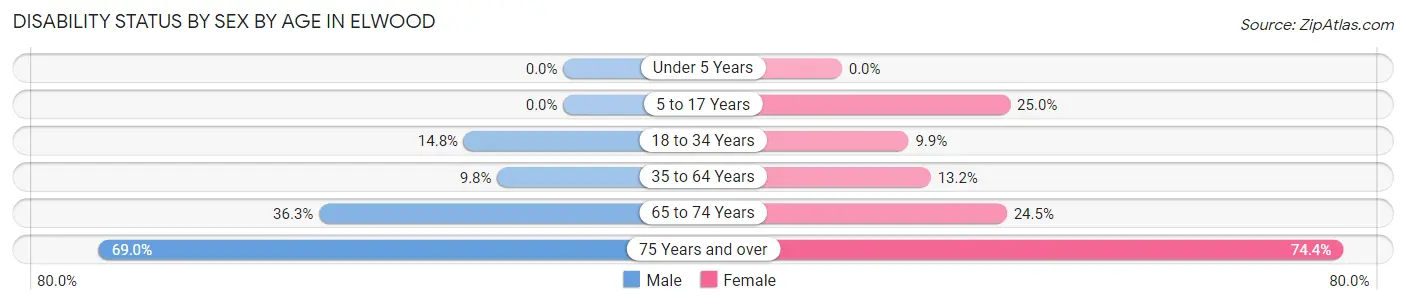
| Age Bracket | Male | Female |
| Under 5 Years | 0 (0.0%) | 0 (0.0%) |
| 5 to 17 Years | 0 (0.0%) | 20 (25.0%) |
| 18 to 34 Years | 44 (14.8%) | 30 (9.9%) |
| 35 to 64 Years | 45 (9.8%) | 71 (13.2%) |
| 65 to 74 Years | 33 (36.3%) | 24 (24.5%) |
| 75 Years and over | 40 (69.0%) | 67 (74.4%) |
Disability Class by Sex by Age in Elwood
Disability Class: Hearing Difficulty
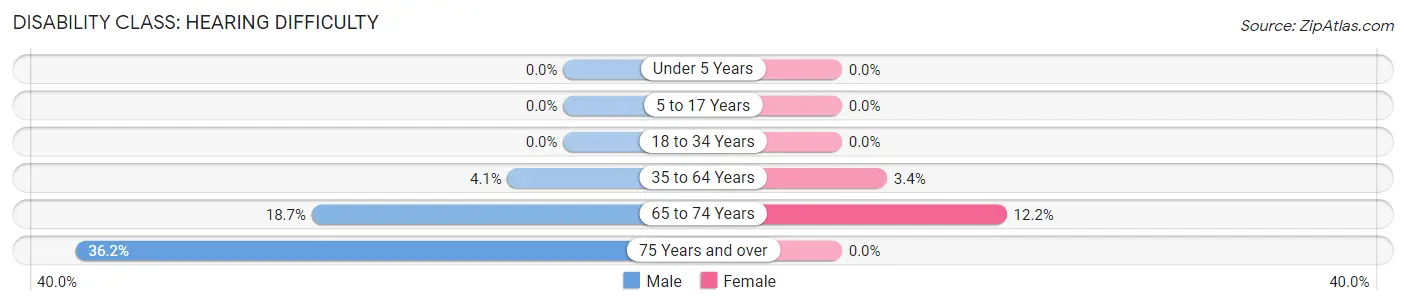
| Age Bracket | Male | Female |
| Under 5 Years | 0 (0.0%) | 0 (0.0%) |
| 5 to 17 Years | 0 (0.0%) | 0 (0.0%) |
| 18 to 34 Years | 0 (0.0%) | 0 (0.0%) |
| 35 to 64 Years | 19 (4.1%) | 18 (3.4%) |
| 65 to 74 Years | 17 (18.7%) | 12 (12.2%) |
| 75 Years and over | 21 (36.2%) | 0 (0.0%) |
Disability Class: Vision Difficulty
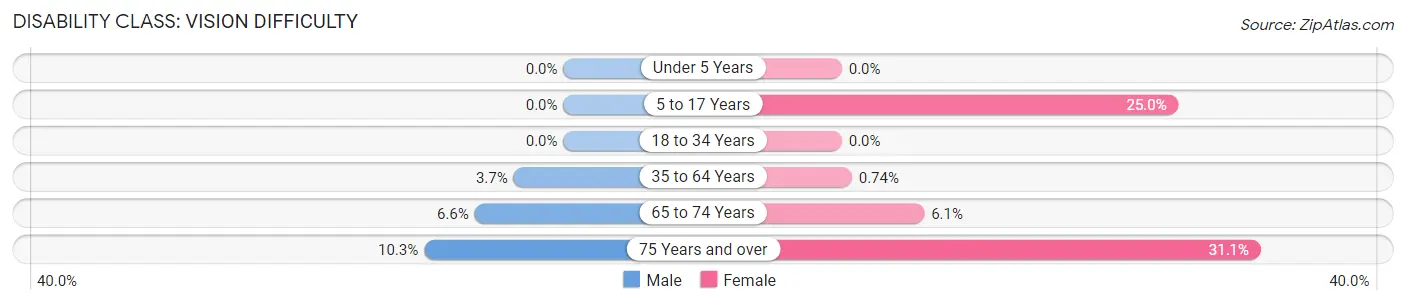
| Age Bracket | Male | Female |
| Under 5 Years | 0 (0.0%) | 0 (0.0%) |
| 5 to 17 Years | 0 (0.0%) | 20 (25.0%) |
| 18 to 34 Years | 0 (0.0%) | 0 (0.0%) |
| 35 to 64 Years | 17 (3.7%) | 4 (0.7%) |
| 65 to 74 Years | 6 (6.6%) | 6 (6.1%) |
| 75 Years and over | 6 (10.3%) | 28 (31.1%) |
Disability Class: Cognitive Difficulty
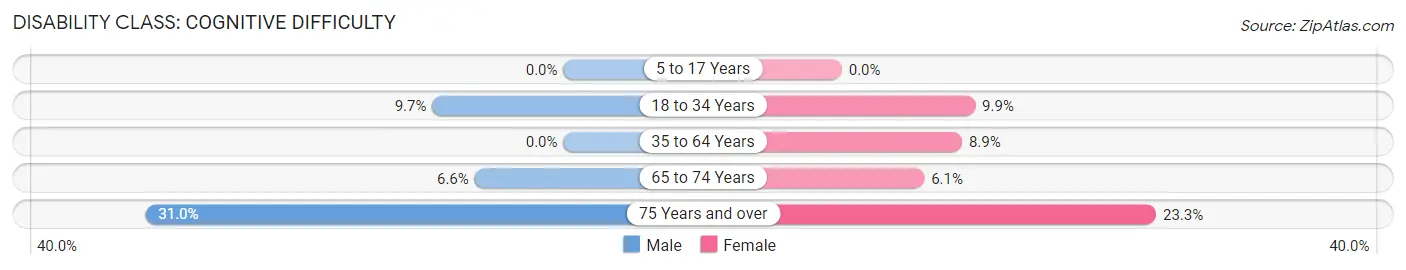
| Age Bracket | Male | Female |
| 5 to 17 Years | 0 (0.0%) | 0 (0.0%) |
| 18 to 34 Years | 29 (9.7%) | 30 (9.9%) |
| 35 to 64 Years | 0 (0.0%) | 48 (8.9%) |
| 65 to 74 Years | 6 (6.6%) | 6 (6.1%) |
| 75 Years and over | 18 (31.0%) | 21 (23.3%) |
Disability Class: Ambulatory Difficulty
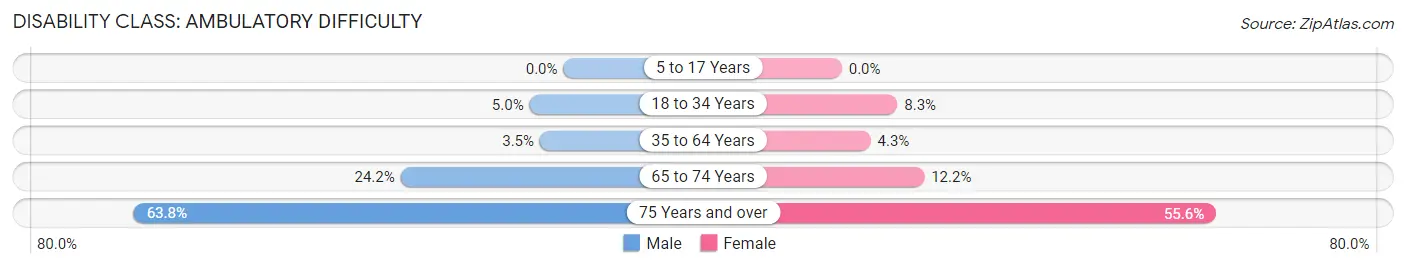
| Age Bracket | Male | Female |
| 5 to 17 Years | 0 (0.0%) | 0 (0.0%) |
| 18 to 34 Years | 15 (5.0%) | 25 (8.3%) |
| 35 to 64 Years | 16 (3.5%) | 23 (4.3%) |
| 65 to 74 Years | 22 (24.2%) | 12 (12.2%) |
| 75 Years and over | 37 (63.8%) | 50 (55.6%) |
Disability Class: Self-Care Difficulty
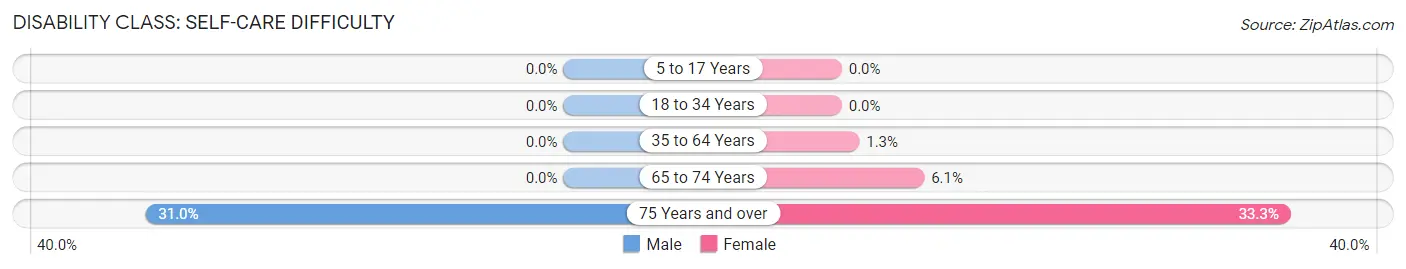
| Age Bracket | Male | Female |
| 5 to 17 Years | 0 (0.0%) | 0 (0.0%) |
| 18 to 34 Years | 0 (0.0%) | 0 (0.0%) |
| 35 to 64 Years | 0 (0.0%) | 7 (1.3%) |
| 65 to 74 Years | 0 (0.0%) | 6 (6.1%) |
| 75 Years and over | 18 (31.0%) | 30 (33.3%) |
Technology Access in Elwood
Computing Device Access in Elwood
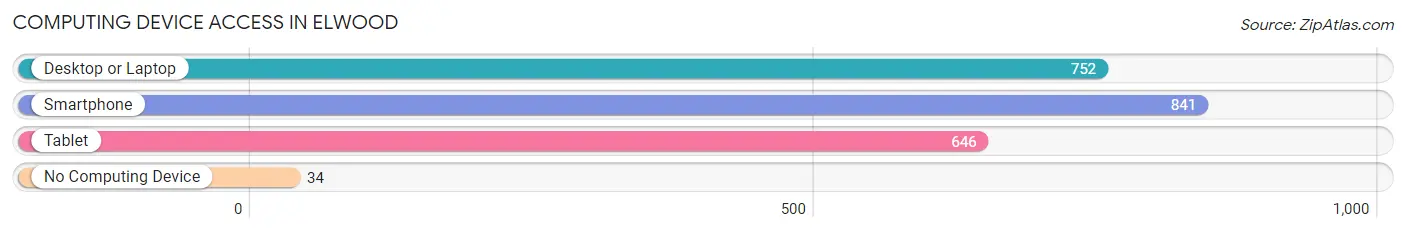
| Device Type | # Households | % Households |
| Desktop or Laptop | 752 | 80.3% |
| Smartphone | 841 | 89.8% |
| Tablet | 646 | 69.0% |
| No Computing Device | 34 | 3.6% |
| Total | 936 | 100.0% |
Internet Access in Elwood
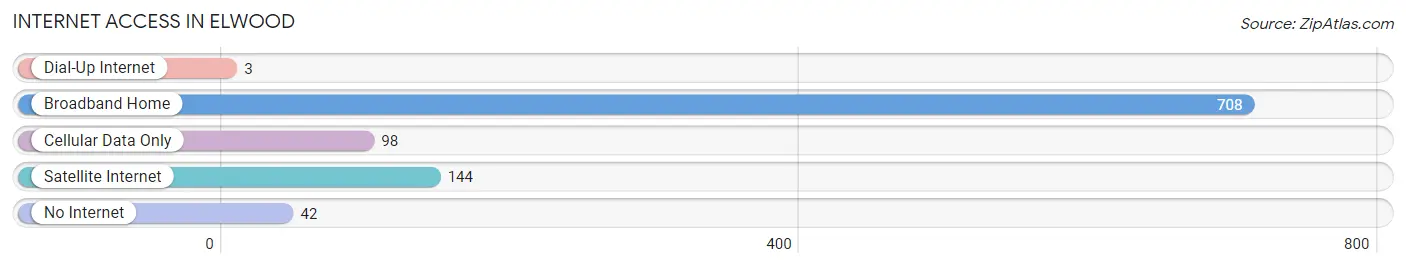
| Internet Type | # Households | % Households |
| Dial-Up Internet | 3 | 0.3% |
| Broadband Home | 708 | 75.6% |
| Cellular Data Only | 98 | 10.5% |
| Satellite Internet | 144 | 15.4% |
| No Internet | 42 | 4.5% |
| Total | 936 | 100.0% |
Elwood Summary
Elwood, Illinois is a small village located in Will County, Illinois, about 40 miles southwest of Chicago. The village is situated on the banks of the Des Plaines River and is home to a population of just over 8,000 people. Elwood is a part of the Joliet-Naperville-Aurora metropolitan area and is a popular destination for those looking to escape the hustle and bustle of the city.
History
Elwood was first settled in 1835 by a group of settlers from New York. The village was originally known as “Hardscrabble” due to the difficult terrain and lack of resources. The name was changed to Elwood in 1845 after a local resident, Elwood Smith. The village was officially incorporated in 1867.
In the late 19th century, Elwood was a thriving agricultural community. The village was home to several grain elevators, a flour mill, and a brickyard. The village also had a number of small businesses, including a blacksmith, a livery stable, and a general store.
In the early 20th century, Elwood began to experience a period of growth and development. The village was connected to the Chicago and Alton Railroad in 1902, which allowed for increased transportation and commerce. The village also saw the construction of several new buildings, including a post office, a bank, and a hotel.
Geography
Elwood is located in Will County, Illinois, about 40 miles southwest of Chicago. The village is situated on the banks of the Des Plaines River and is bordered by the towns of Joliet, Plainfield, and Lockport. Elwood is part of the Joliet-Naperville-Aurora metropolitan area and is located in the Chicago metropolitan statistical area.
The village has a total area of 2.2 square miles, all of which is land. The village is located at an elevation of 645 feet above sea level. The climate in Elwood is classified as humid continental, with hot, humid summers and cold, snowy winters.
Economy
Elwood’s economy is largely based on agriculture and manufacturing. The village is home to several large agricultural operations, including a grain elevator, a flour mill, and a brickyard. The village also has a number of small businesses, including a blacksmith, a livery stable, and a general store.
The village is also home to several large manufacturing companies, including a steel mill, a paper mill, and a plastics factory. The village is also home to a number of retail stores, restaurants, and other businesses.
Demographics
As of the 2010 census, Elwood had a population of 8,092 people. The racial makeup of the village was 87.3% White, 5.3% African American, 0.4% Native American, 0.7% Asian, and 4.3% from other races. Hispanic or Latino of any race were 8.3% of the population.
The median household income in Elwood was $50,945, and the median family income was $60,945. The per capita income in Elwood was $22,945. About 6.3% of families and 8.3% of the population were below the poverty line.
Common Questions
What is Per Capita Income in Elwood?
Per Capita income in Elwood is $39,932.
What is the Median Family Income in Elwood?
Median Family Income in Elwood is $91,818.
What is the Median Household income in Elwood?
Median Household Income in Elwood is $78,214.
What is Income or Wage Gap in Elwood?
Income or Wage Gap in Elwood is 30.8%.
Women in Elwood earn 69.2 cents for every dollar earned by a man.
What is Inequality or Gini Index in Elwood?
Inequality or Gini Index in Elwood is 0.39.
What is the Total Population of Elwood?
Total Population of Elwood is 2,315.
What is the Total Male Population of Elwood?
Total Male Population of Elwood is 1,121.
What is the Total Female Population of Elwood?
Total Female Population of Elwood is 1,194.
What is the Ratio of Males per 100 Females in Elwood?
There are 93.89 Males per 100 Females in Elwood.
What is the Ratio of Females per 100 Males in Elwood?
There are 106.51 Females per 100 Males in Elwood.
What is the Median Population Age in Elwood?
Median Population Age in Elwood is 40.9 Years.
What is the Average Family Size in Elwood
Average Family Size in Elwood is 2.8 People.
What is the Average Household Size in Elwood
Average Household Size in Elwood is 2.5 People.
How Large is the Labor Force in Elwood?
There are 1,307 People in the Labor Forcein in Elwood.
What is the Percentage of People in the Labor Force in Elwood?
65.8% of People are in the Labor Force in Elwood.
What is the Unemployment Rate in Elwood?
Unemployment Rate in Elwood is 3.2%.