Jackson, MN Map & Demographics
Jackson Map
Jackson Overview
$35,917
PER CAPITA INCOME
$74,714
AVG FAMILY INCOME
$65,531
AVG HOUSEHOLD INCOME
20.3%
WAGE / INCOME GAP [ % ]
79.7¢/ $1
WAGE / INCOME GAP [ $ ]
0.39
INEQUALITY / GINI INDEX
3,301
TOTAL POPULATION
1,637
MALE POPULATION
1,664
FEMALE POPULATION
98.38
MALES / 100 FEMALES
101.65
FEMALES / 100 MALES
46.9
MEDIAN AGE
2.8
AVG FAMILY SIZE
2.0
AVG HOUSEHOLD SIZE
1,785
LABOR FORCE [ PEOPLE ]
64.0%
PERCENT IN LABOR FORCE
3.0%
UNEMPLOYMENT RATE
Jackson Zip Codes
Jackson Area Codes
Income in Jackson
Income Overview in Jackson
Per Capita Income in Jackson is $35,917, while median incomes of families and households are $74,714 and $65,531 respectively.
| Characteristic | Number | Measure |
| Per Capita Income | 3,301 | $35,917 |
| Median Family Income | 795 | $74,714 |
| Mean Family Income | 795 | $87,285 |
| Median Household Income | 1,609 | $65,531 |
| Mean Household Income | 1,609 | $72,101 |
| Income Deficit | 795 | $0 |
| Wage / Income Gap (%) | 3,301 | 20.33% |
| Wage / Income Gap ($) | 3,301 | 79.67¢ per $1 |
| Gini / Inequality Index | 3,301 | 0.39 |
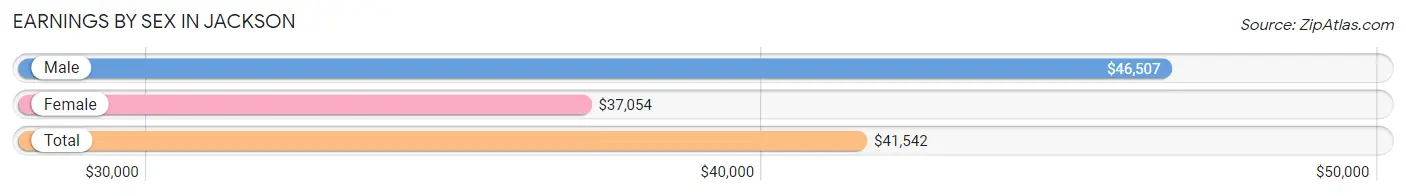
Earnings by Sex in Jackson
Average Earnings in Jackson are $41,542, $46,507 for men and $37,054 for women, a difference of 20.3%.
| Sex | Number | Average Earnings |
| Male | 953 (51.3%) | $46,507 |
| Female | 905 (48.7%) | $37,054 |
| Total | 1,858 (100.0%) | $41,542 |
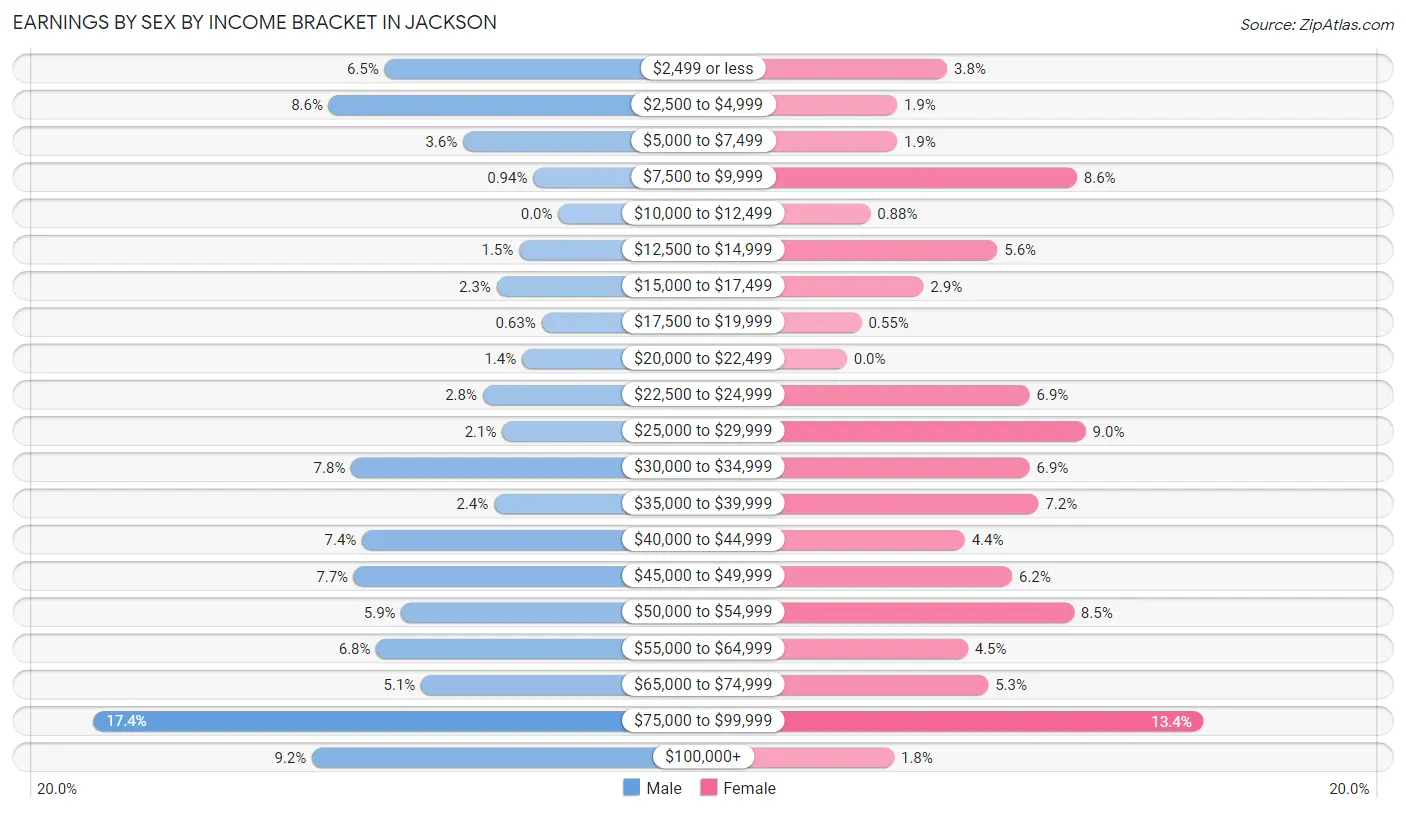
Earnings by Sex by Income Bracket in Jackson
The most common earnings brackets in Jackson are $75,000 to $99,999 for men (166 | 17.4%) and $75,000 to $99,999 for women (121 | 13.4%).
| Income | Male | Female |
| $2,499 or less | 62 (6.5%) | 34 (3.8%) |
| $2,500 to $4,999 | 82 (8.6%) | 17 (1.9%) |
| $5,000 to $7,499 | 34 (3.6%) | 17 (1.9%) |
| $7,500 to $9,999 | 9 (0.9%) | 78 (8.6%) |
| $10,000 to $12,499 | 0 (0.0%) | 8 (0.9%) |
| $12,500 to $14,999 | 14 (1.5%) | 51 (5.6%) |
| $15,000 to $17,499 | 22 (2.3%) | 26 (2.9%) |
| $17,500 to $19,999 | 6 (0.6%) | 5 (0.5%) |
| $20,000 to $22,499 | 13 (1.4%) | 0 (0.0%) |
| $22,500 to $24,999 | 27 (2.8%) | 62 (6.9%) |
| $25,000 to $29,999 | 20 (2.1%) | 81 (8.9%) |
| $30,000 to $34,999 | 74 (7.8%) | 62 (6.9%) |
| $35,000 to $39,999 | 23 (2.4%) | 65 (7.2%) |
| $40,000 to $44,999 | 70 (7.3%) | 40 (4.4%) |
| $45,000 to $49,999 | 73 (7.7%) | 56 (6.2%) |
| $50,000 to $54,999 | 56 (5.9%) | 77 (8.5%) |
| $55,000 to $64,999 | 65 (6.8%) | 41 (4.5%) |
| $65,000 to $74,999 | 49 (5.1%) | 48 (5.3%) |
| $75,000 to $99,999 | 166 (17.4%) | 121 (13.4%) |
| $100,000+ | 88 (9.2%) | 16 (1.8%) |
| Total | 953 (100.0%) | 905 (100.0%) |
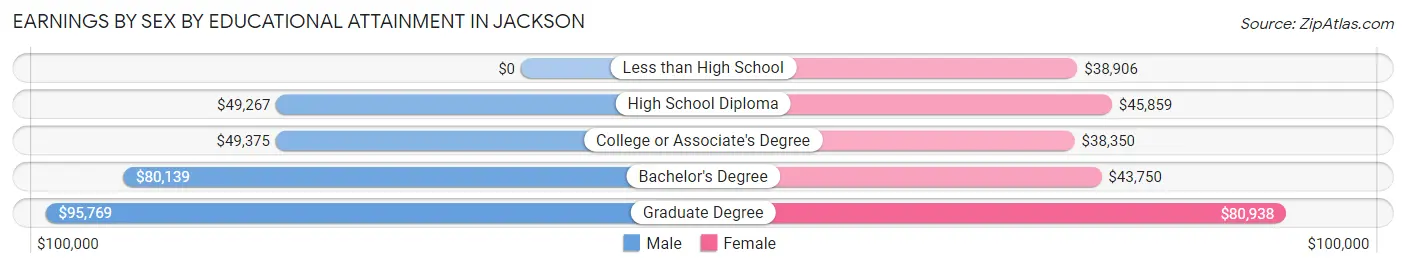
Earnings by Sex by Educational Attainment in Jackson
Average earnings in Jackson are $52,228 for men and $41,360 for women, a difference of 20.8%. Men with an educational attainment of graduate degree enjoy the highest average annual earnings of $95,769, while those with high school diploma education earn the least with $49,267. Women with an educational attainment of graduate degree earn the most with the average annual earnings of $80,938, while those with college or associate's degree education have the smallest earnings of $38,350.
| Educational Attainment | Male Income | Female Income |
| Less than High School | - | - |
| High School Diploma | $49,267 | $45,859 |
| College or Associate's Degree | $49,375 | $38,350 |
| Bachelor's Degree | $80,139 | $43,750 |
| Graduate Degree | $95,769 | $80,938 |
| Total | $52,228 | $41,360 |
Family Income in Jackson
Family Income Brackets in Jackson
According to the Jackson family income data, there are 199 families falling into the $50,000 to $74,999 income range, which is the most common income bracket and makes up 25.0% of all families. Conversely, the less than $10,000 income bracket is the least frequent group with only 6 families (0.7%) belonging to this category.
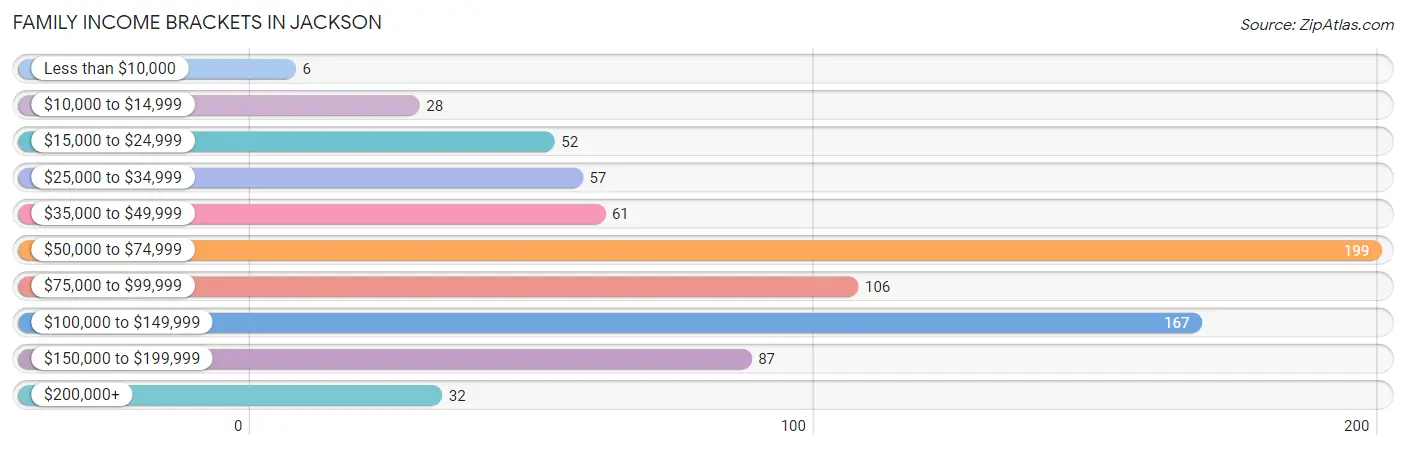
| Income Bracket | # Families | % Families |
| Less than $10,000 | 6 | 0.8% |
| $10,000 to $14,999 | 28 | 3.5% |
| $15,000 to $24,999 | 52 | 6.5% |
| $25,000 to $34,999 | 57 | 7.2% |
| $35,000 to $49,999 | 61 | 7.7% |
| $50,000 to $74,999 | 199 | 25.0% |
| $75,000 to $99,999 | 106 | 13.3% |
| $100,000 to $149,999 | 167 | 21.0% |
| $150,000 to $199,999 | 87 | 10.9% |
| $200,000+ | 32 | 4.0% |
Family Income by Famaliy Size in Jackson
4-person families (112 | 14.1%) account for the highest median family income in Jackson with $106,957 per family, while 2-person families (451 | 56.7%) have the highest median income of $37,278 per family member.
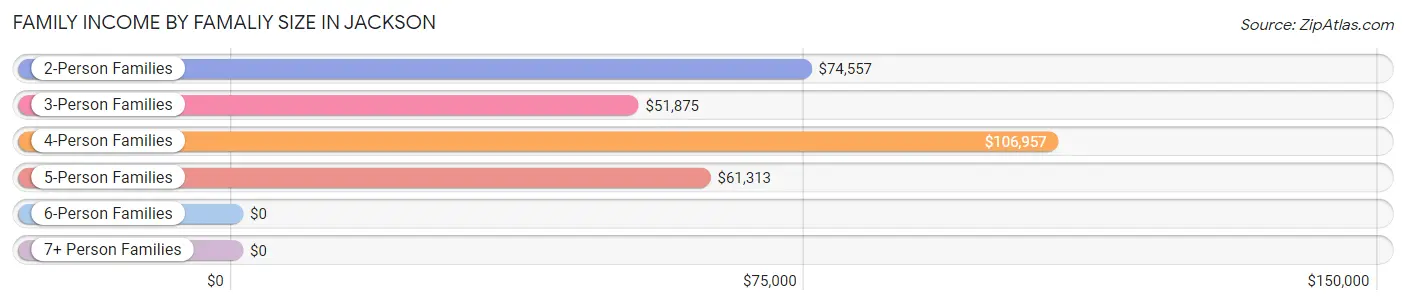
| Income Bracket | # Families | Median Income |
| 2-Person Families | 451 (56.7%) | $74,557 |
| 3-Person Families | 162 (20.4%) | $51,875 |
| 4-Person Families | 112 (14.1%) | $106,957 |
| 5-Person Families | 65 (8.2%) | $61,313 |
| 6-Person Families | 5 (0.6%) | $0 |
| 7+ Person Families | 0 (0.0%) | $0 |
| Total | 795 (100.0%) | $74,714 |
Family Income by Number of Earners in Jackson
The median family income in Jackson is $74,714, with families comprising 3+ earners (92) having the highest median family income of $108,667, while families with 1 earner (218) have the lowest median family income of $51,094, accounting for 11.6% and 27.4% of families, respectively.
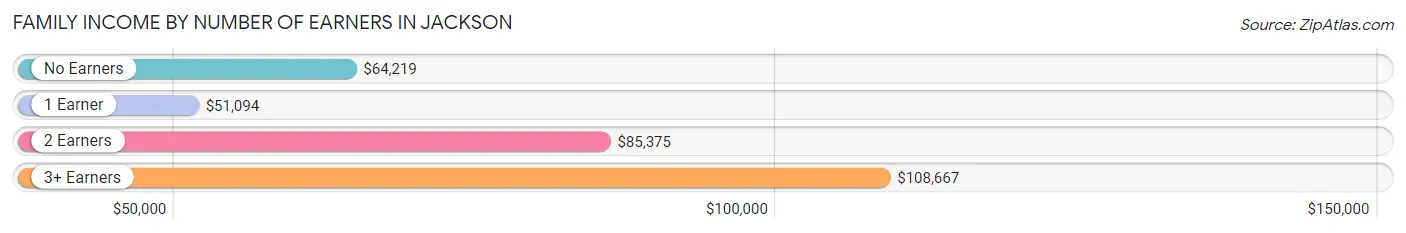
| Number of Earners | # Families | Median Income |
| No Earners | 159 (20.0%) | $64,219 |
| 1 Earner | 218 (27.4%) | $51,094 |
| 2 Earners | 326 (41.0%) | $85,375 |
| 3+ Earners | 92 (11.6%) | $108,667 |
| Total | 795 (100.0%) | $74,714 |
Household Income in Jackson
Household Income Brackets in Jackson
With 302 households falling in the category, the $50,000 to $74,999 income range is the most frequent in Jackson, accounting for 18.8% of all households. In contrast, only 48 households (3.0%) fall into the $200,000+ income bracket, making it the least populous group.
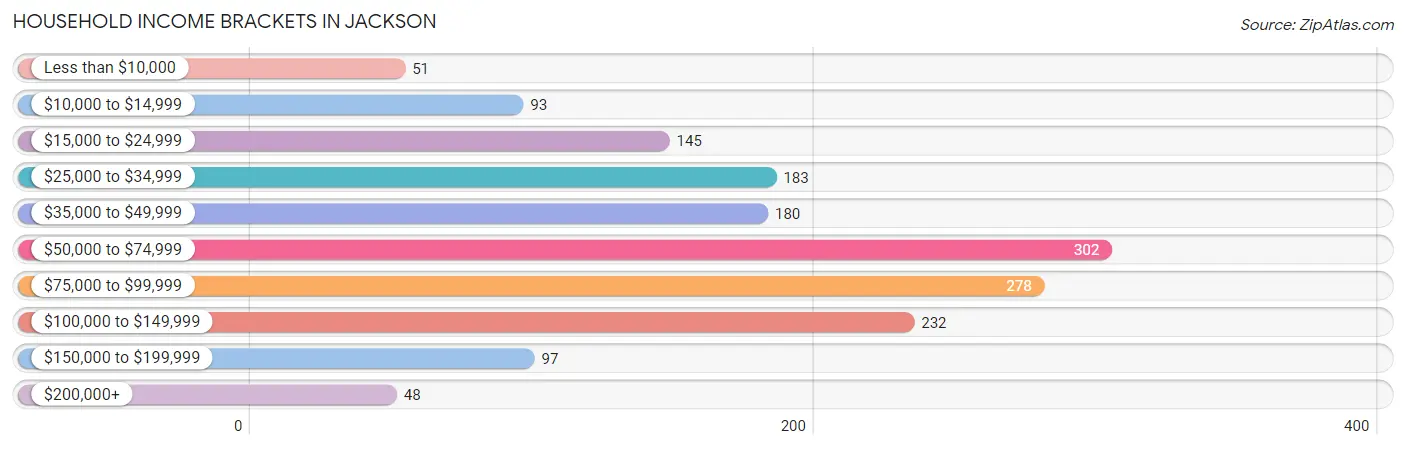
| Income Bracket | # Households | % Households |
| Less than $10,000 | 51 | 3.2% |
| $10,000 to $14,999 | 93 | 5.8% |
| $15,000 to $24,999 | 145 | 9.0% |
| $25,000 to $34,999 | 183 | 11.4% |
| $35,000 to $49,999 | 180 | 11.2% |
| $50,000 to $74,999 | 302 | 18.8% |
| $75,000 to $99,999 | 278 | 17.3% |
| $100,000 to $149,999 | 232 | 14.4% |
| $150,000 to $199,999 | 97 | 6.0% |
| $200,000+ | 48 | 3.0% |
Household Income by Householder Age in Jackson
The median household income in Jackson is $65,531, with the highest median household income of $79,044 found in the 45 to 64 years age bracket for the primary householder. A total of 548 households (34.1%) fall into this category. Meanwhile, the 15 to 24 years age bracket for the primary householder has the lowest median household income of $13,894, with 114 households (7.1%) in this group.
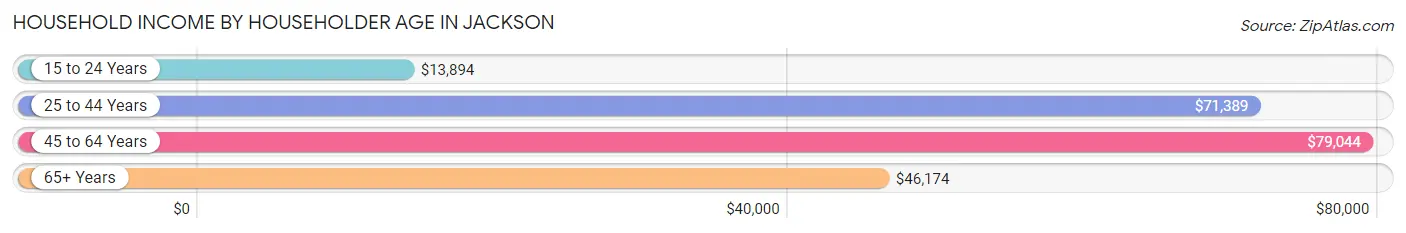
| Income Bracket | # Households | Median Income |
| 15 to 24 Years | 114 (7.1%) | $13,894 |
| 25 to 44 Years | 406 (25.2%) | $71,389 |
| 45 to 64 Years | 548 (34.1%) | $79,044 |
| 65+ Years | 541 (33.6%) | $46,174 |
| Total | 1,609 (100.0%) | $65,531 |
Poverty in Jackson
Income Below Poverty by Sex and Age in Jackson
With 18.6% poverty level for males and 11.3% for females among the residents of Jackson, under 5 year old males and 15 year old females are the most vulnerable to poverty, with 70 males (62.0%) and 24 females (72.7%) in their respective age groups living below the poverty level.
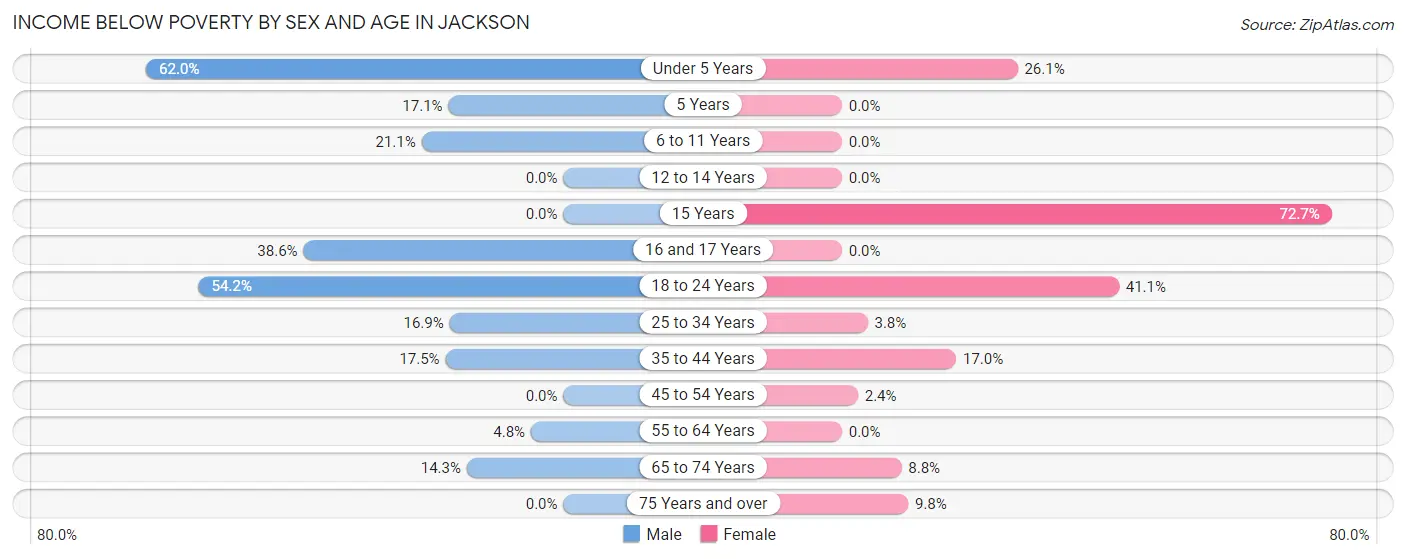
| Age Bracket | Male | Female |
| Under 5 Years | 70 (62.0%) | 30 (26.1%) |
| 5 Years | 7 (17.1%) | 0 (0.0%) |
| 6 to 11 Years | 8 (21.0%) | 0 (0.0%) |
| 12 to 14 Years | 0 (0.0%) | 0 (0.0%) |
| 15 Years | 0 (0.0%) | 24 (72.7%) |
| 16 and 17 Years | 22 (38.6%) | 0 (0.0%) |
| 18 to 24 Years | 78 (54.2%) | 51 (41.1%) |
| 25 to 34 Years | 36 (16.9%) | 6 (3.8%) |
| 35 to 44 Years | 31 (17.5%) | 28 (17.0%) |
| 45 to 54 Years | 0 (0.0%) | 6 (2.4%) |
| 55 to 64 Years | 12 (4.8%) | 0 (0.0%) |
| 65 to 74 Years | 35 (14.3%) | 19 (8.8%) |
| 75 Years and over | 0 (0.0%) | 19 (9.8%) |
| Total | 299 (18.6%) | 183 (11.3%) |
Income Above Poverty by Sex and Age in Jackson
According to the poverty statistics in Jackson, males aged 12 to 14 years and females aged 5 years are the age groups that are most secure financially, with 100.0% of males and 100.0% of females in these age groups living above the poverty line.
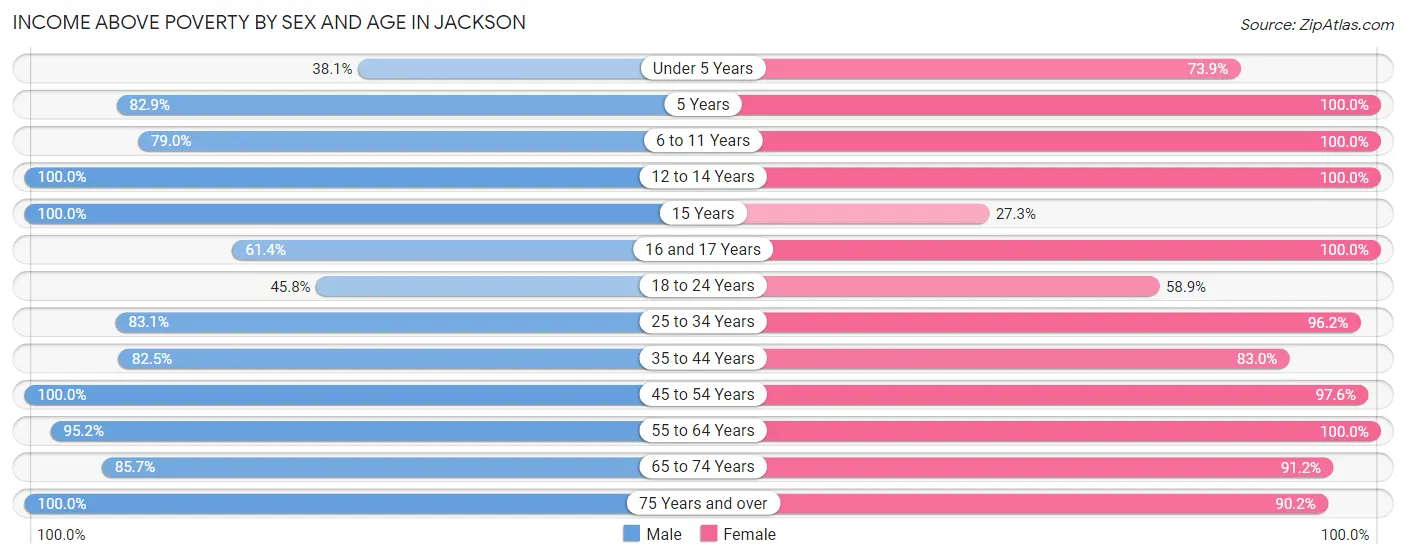
| Age Bracket | Male | Female |
| Under 5 Years | 43 (38.1%) | 85 (73.9%) |
| 5 Years | 34 (82.9%) | 16 (100.0%) |
| 6 to 11 Years | 30 (78.9%) | 45 (100.0%) |
| 12 to 14 Years | 33 (100.0%) | 60 (100.0%) |
| 15 Years | 7 (100.0%) | 9 (27.3%) |
| 16 and 17 Years | 35 (61.4%) | 38 (100.0%) |
| 18 to 24 Years | 66 (45.8%) | 73 (58.9%) |
| 25 to 34 Years | 177 (83.1%) | 151 (96.2%) |
| 35 to 44 Years | 146 (82.5%) | 137 (83.0%) |
| 45 to 54 Years | 185 (100.0%) | 247 (97.6%) |
| 55 to 64 Years | 237 (95.2%) | 205 (100.0%) |
| 65 to 74 Years | 209 (85.7%) | 196 (91.2%) |
| 75 Years and over | 102 (100.0%) | 174 (90.2%) |
| Total | 1,304 (81.4%) | 1,436 (88.7%) |
Income Below Poverty Among Married-Couple Families in Jackson
The poverty statistics for married-couple families in Jackson show that 0.9% or 6 of the total 649 families live below the poverty line. Families with 3 or 4 children have the highest poverty rate of 12.5%, comprising of 6 families. On the other hand, families with no children have the lowest poverty rate of 0.0%, which includes 0 families.
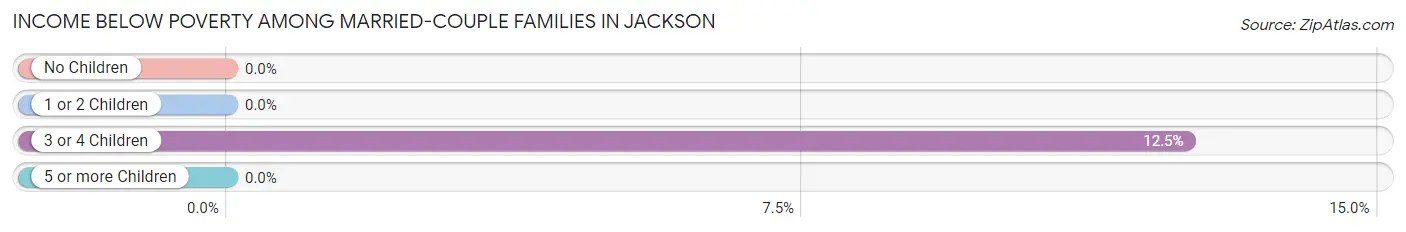
| Children | Above Poverty | Below Poverty |
| No Children | 435 (100.0%) | 0 (0.0%) |
| 1 or 2 Children | 166 (100.0%) | 0 (0.0%) |
| 3 or 4 Children | 42 (87.5%) | 6 (12.5%) |
| 5 or more Children | 0 (0.0%) | 0 (0.0%) |
| Total | 643 (99.1%) | 6 (0.9%) |
Income Below Poverty Among Single-Parent Households in Jackson
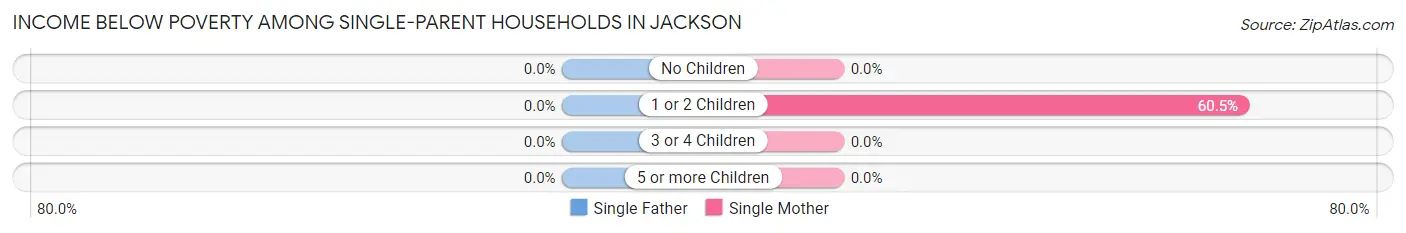
| Children | Single Father | Single Mother |
| No Children | 0 (0.0%) | 0 (0.0%) |
| 1 or 2 Children | 0 (0.0%) | 69 (60.5%) |
| 3 or 4 Children | 0 (0.0%) | 0 (0.0%) |
| 5 or more Children | 0 (0.0%) | 0 (0.0%) |
| Total | 0 (0.0%) | 69 (47.3%) |
Income Below Poverty Among Married-Couple vs Single-Parent Households in Jackson
The poverty data for Jackson shows that 6 of the married-couple family households (0.9%) and 69 of the single-parent households (47.3%) are living below the poverty level. Within the married-couple family households, those with 3 or 4 children have the highest poverty rate, with 6 households (12.5%) falling below the poverty line. Among the single-parent households, those with 1 or 2 children have the highest poverty rate, with 69 household (60.5%) living below poverty.

| Children | Married-Couple Families | Single-Parent Households |
| No Children | 0 (0.0%) | 0 (0.0%) |
| 1 or 2 Children | 0 (0.0%) | 69 (60.5%) |
| 3 or 4 Children | 6 (12.5%) | 0 (0.0%) |
| 5 or more Children | 0 (0.0%) | 0 (0.0%) |
| Total | 6 (0.9%) | 69 (47.3%) |
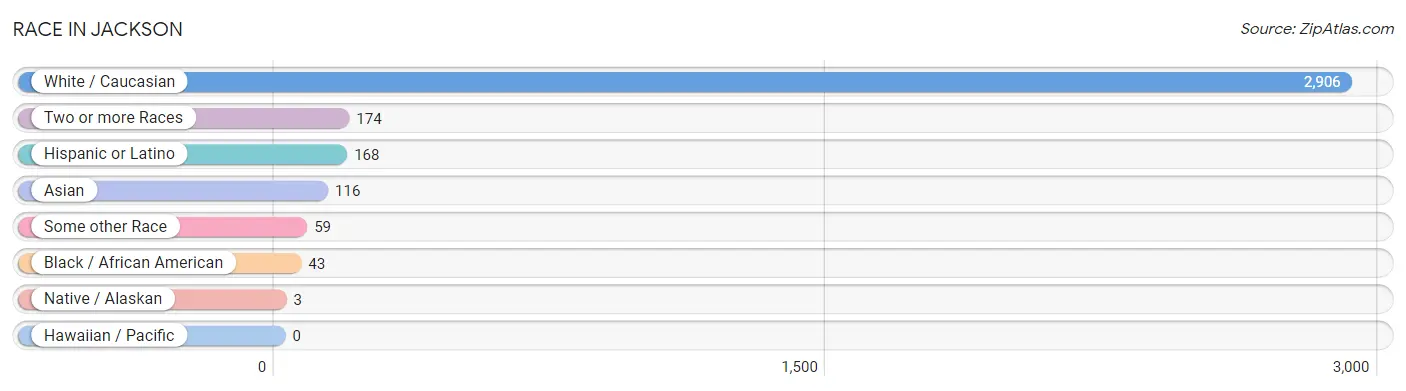
Race in Jackson
The most populous races in Jackson are White / Caucasian (2,906 | 88.0%), Two or more Races (174 | 5.3%), and Hispanic or Latino (168 | 5.1%).
| Race | # Population | % Population |
| Asian | 116 | 3.5% |
| Black / African American | 43 | 1.3% |
| Hawaiian / Pacific | 0 | 0.0% |
| Hispanic or Latino | 168 | 5.1% |
| Native / Alaskan | 3 | 0.1% |
| White / Caucasian | 2,906 | 88.0% |
| Two or more Races | 174 | 5.3% |
| Some other Race | 59 | 1.8% |
| Total | 3,301 | 100.0% |
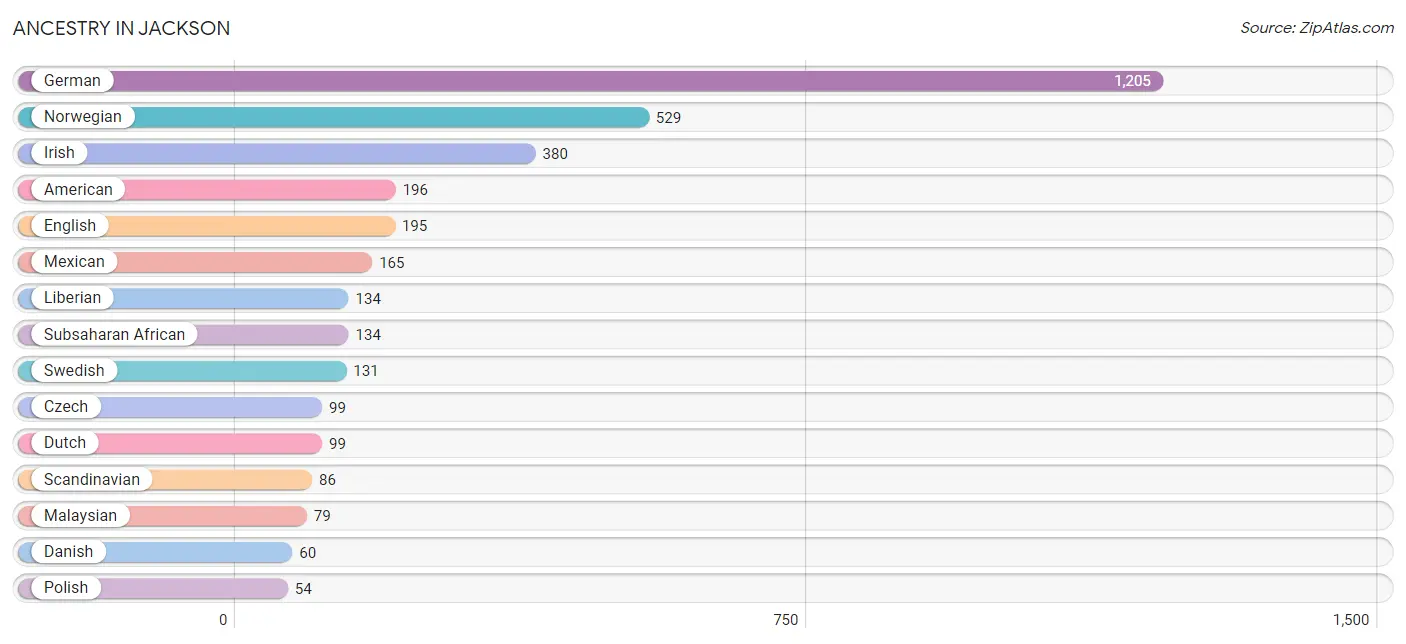
Ancestry in Jackson
The most populous ancestries reported in Jackson are German (1,205 | 36.5%), Norwegian (529 | 16.0%), Irish (380 | 11.5%), American (196 | 5.9%), and English (195 | 5.9%), together accounting for 75.9% of all Jackson residents.
| Ancestry | # Population | % Population |
| American | 196 | 5.9% |
| Belgian | 19 | 0.6% |
| Burmese | 29 | 0.9% |
| Chippewa | 3 | 0.1% |
| Czech | 99 | 3.0% |
| Czechoslovakian | 9 | 0.3% |
| Danish | 60 | 1.8% |
| Dutch | 99 | 3.0% |
| English | 195 | 5.9% |
| European | 21 | 0.6% |
| Finnish | 32 | 1.0% |
| French | 35 | 1.1% |
| German | 1,205 | 36.5% |
| German Russian | 10 | 0.3% |
| Irish | 380 | 11.5% |
| Italian | 19 | 0.6% |
| Korean | 37 | 1.1% |
| Liberian | 134 | 4.1% |
| Malaysian | 79 | 2.4% |
| Mexican | 165 | 5.0% |
| Northern European | 16 | 0.5% |
| Norwegian | 529 | 16.0% |
| Polish | 54 | 1.6% |
| Portuguese | 8 | 0.2% |
| Russian | 8 | 0.2% |
| Scandinavian | 86 | 2.6% |
| Scotch-Irish | 31 | 0.9% |
| Scottish | 28 | 0.9% |
| Sioux | 36 | 1.1% |
| Spanish | 3 | 0.1% |
| Subsaharan African | 134 | 4.1% |
| Swedish | 131 | 4.0% |
| Swiss | 11 | 0.3% | View All 33 Rows |
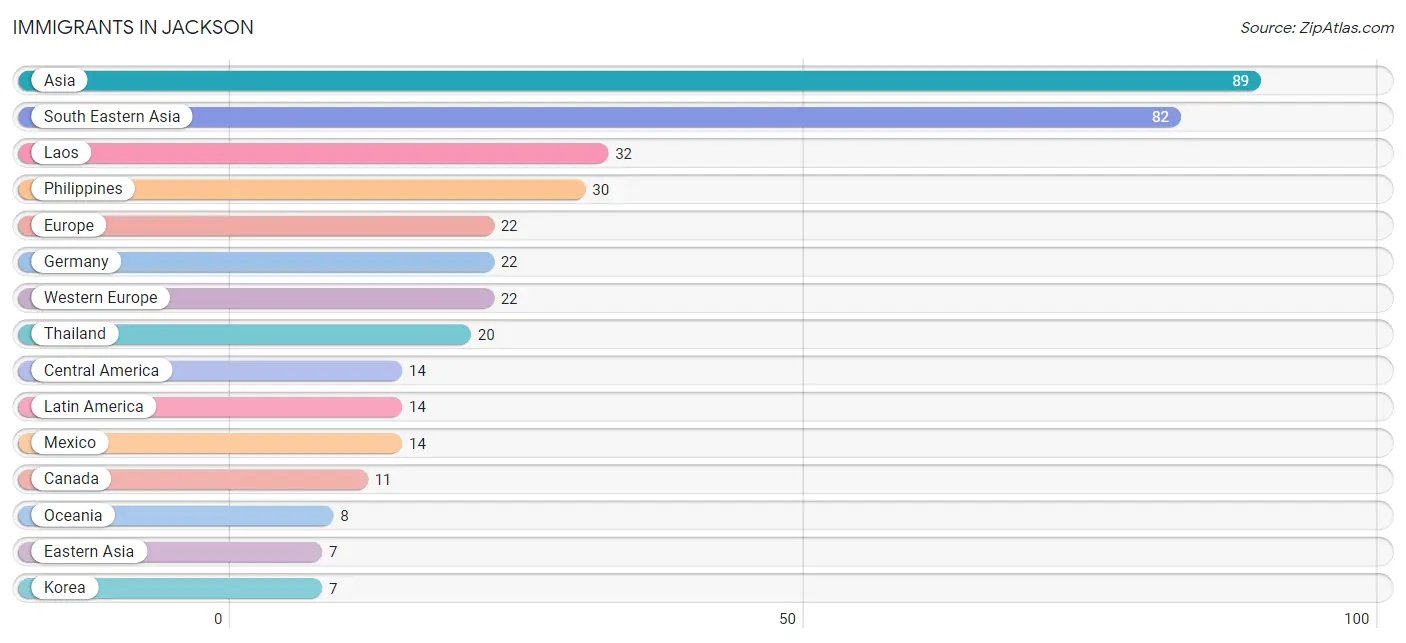
Immigrants in Jackson
The most numerous immigrant groups reported in Jackson came from Asia (89 | 2.7%), South Eastern Asia (82 | 2.5%), Laos (32 | 1.0%), Philippines (30 | 0.9%), and Europe (22 | 0.7%), together accounting for 7.7% of all Jackson residents.
| Immigration Origin | # Population | % Population |
| Asia | 89 | 2.7% |
| Canada | 11 | 0.3% |
| Central America | 14 | 0.4% |
| Eastern Asia | 7 | 0.2% |
| Europe | 22 | 0.7% |
| Germany | 22 | 0.7% |
| Korea | 7 | 0.2% |
| Laos | 32 | 1.0% |
| Latin America | 14 | 0.4% |
| Mexico | 14 | 0.4% |
| Oceania | 8 | 0.2% |
| Philippines | 30 | 0.9% |
| South Eastern Asia | 82 | 2.5% |
| Thailand | 20 | 0.6% |
| Western Europe | 22 | 0.7% | View All 15 Rows |
Sex and Age in Jackson
Sex and Age in Jackson
The most populous age groups in Jackson are 25 to 29 Years (162 | 9.9%) for men and 70 to 74 Years (142 | 8.5%) for women.
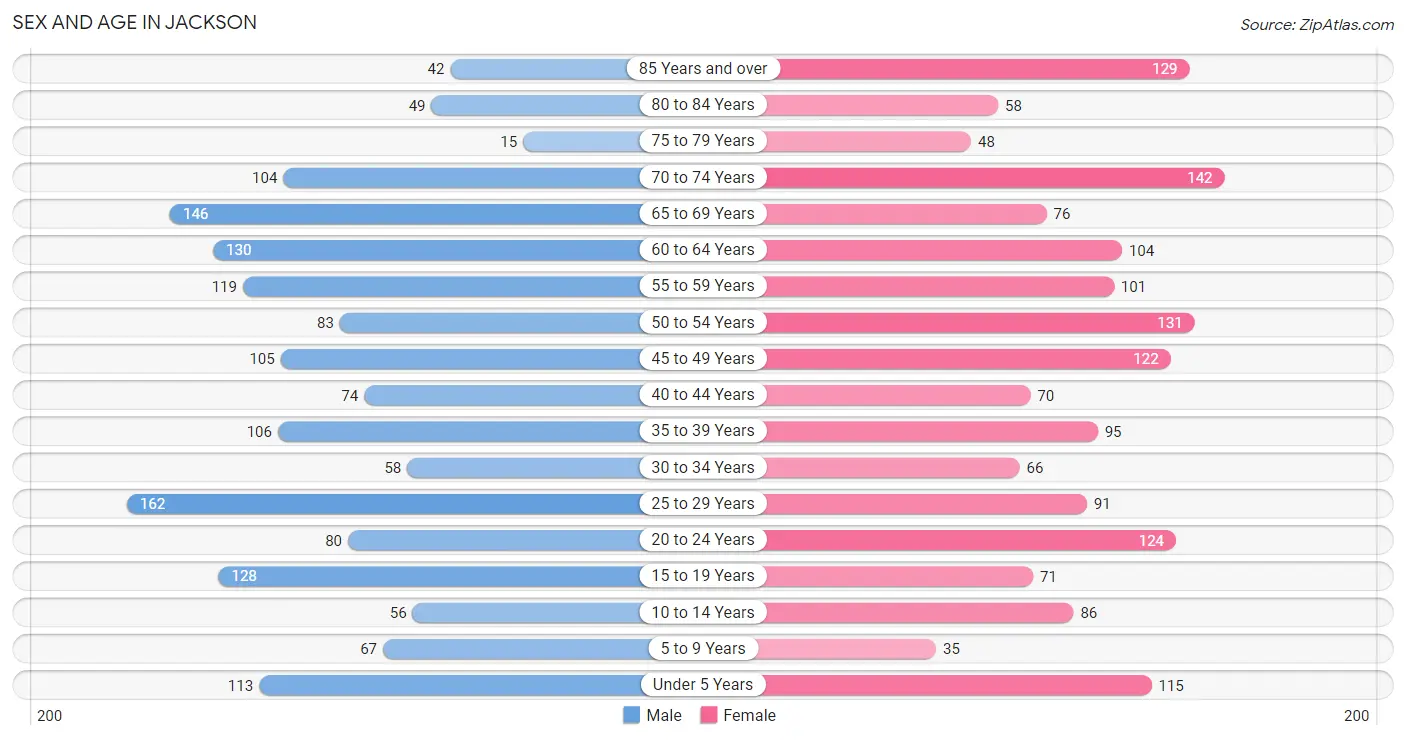
| Age Bracket | Male | Female |
| Under 5 Years | 113 (6.9%) | 115 (6.9%) |
| 5 to 9 Years | 67 (4.1%) | 35 (2.1%) |
| 10 to 14 Years | 56 (3.4%) | 86 (5.2%) |
| 15 to 19 Years | 128 (7.8%) | 71 (4.3%) |
| 20 to 24 Years | 80 (4.9%) | 124 (7.4%) |
| 25 to 29 Years | 162 (9.9%) | 91 (5.5%) |
| 30 to 34 Years | 58 (3.5%) | 66 (4.0%) |
| 35 to 39 Years | 106 (6.5%) | 95 (5.7%) |
| 40 to 44 Years | 74 (4.5%) | 70 (4.2%) |
| 45 to 49 Years | 105 (6.4%) | 122 (7.3%) |
| 50 to 54 Years | 83 (5.1%) | 131 (7.9%) |
| 55 to 59 Years | 119 (7.3%) | 101 (6.1%) |
| 60 to 64 Years | 130 (7.9%) | 104 (6.2%) |
| 65 to 69 Years | 146 (8.9%) | 76 (4.6%) |
| 70 to 74 Years | 104 (6.4%) | 142 (8.5%) |
| 75 to 79 Years | 15 (0.9%) | 48 (2.9%) |
| 80 to 84 Years | 49 (3.0%) | 58 (3.5%) |
| 85 Years and over | 42 (2.6%) | 129 (7.7%) |
| Total | 1,637 (100.0%) | 1,664 (100.0%) |
Families and Households in Jackson
Median Family Size in Jackson
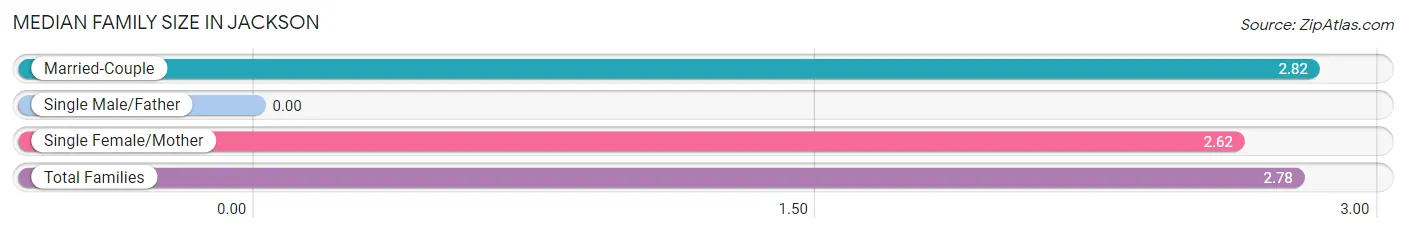
| Family Type | # Families | Family Size |
| Married-Couple | 649 (81.6%) | 2.82 |
| Single Male/Father | 0 (0.0%) | - |
| Single Female/Mother | 146 (18.4%) | 2.62 |
| Total Families | 795 (100.0%) | 2.78 |
Median Household Size in Jackson
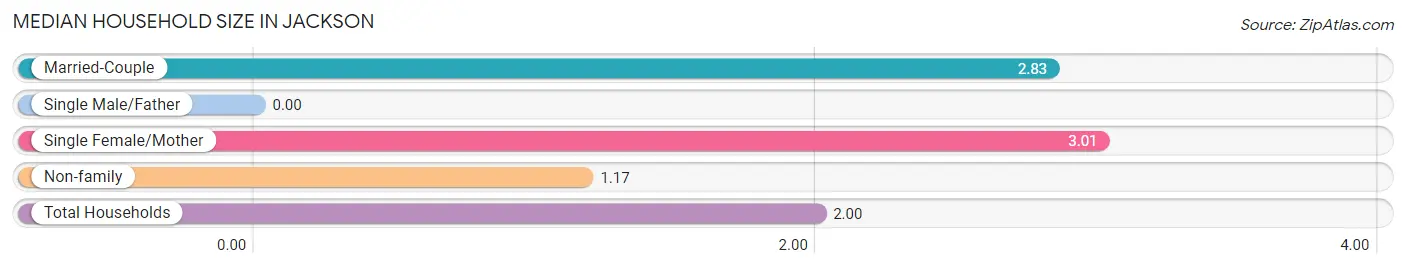
| Household Type | # Households | Household Size |
| Married-Couple | 649 (40.3%) | 2.83 |
| Single Male/Father | 0 (0.0%) | - |
| Single Female/Mother | 146 (9.1%) | 3.01 |
| Non-family | 814 (50.6%) | 1.17 |
| Total Households | 1,609 (100.0%) | 2.00 |
Household Size by Marriage Status in Jackson
Out of a total of 1,609 households in Jackson, 795 (49.4%) are family households, while 814 (50.6%) are nonfamily households. The most numerous type of family households are 2-person households, comprising 451, and the most common type of nonfamily households are 1-person households, comprising 678.
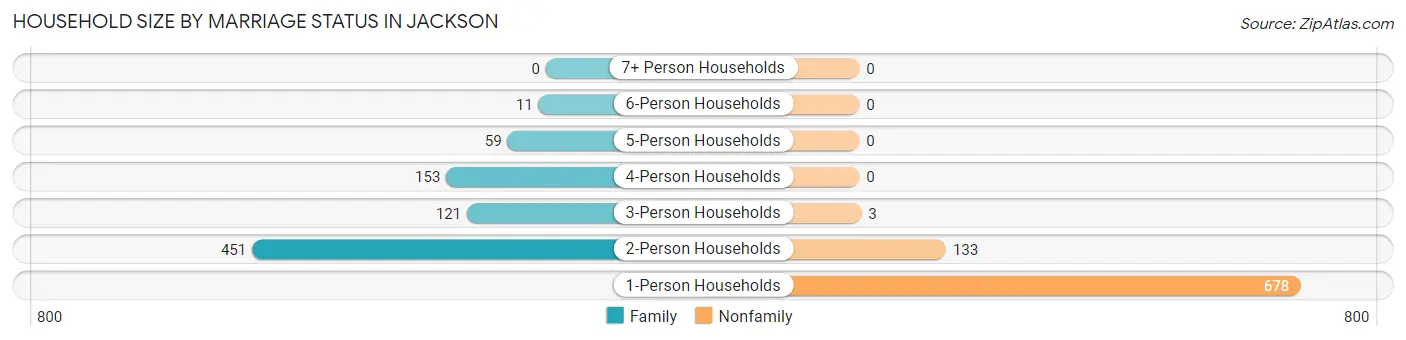
| Household Size | Family Households | Nonfamily Households |
| 1-Person Households | - | 678 (42.1%) |
| 2-Person Households | 451 (28.0%) | 133 (8.3%) |
| 3-Person Households | 121 (7.5%) | 3 (0.2%) |
| 4-Person Households | 153 (9.5%) | 0 (0.0%) |
| 5-Person Households | 59 (3.7%) | 0 (0.0%) |
| 6-Person Households | 11 (0.7%) | 0 (0.0%) |
| 7+ Person Households | 0 (0.0%) | 0 (0.0%) |
| Total | 795 (49.4%) | 814 (50.6%) |
Female Fertility in Jackson
Fertility by Age in Jackson
Average fertility rate in Jackson is 113.0 births per 1,000 women. Women in the age bracket of 20 to 34 years have the highest fertility rate with 199.0 births per 1,000 women. Women in the age bracket of 20 to 34 years acount for 74.7% of all women with births.
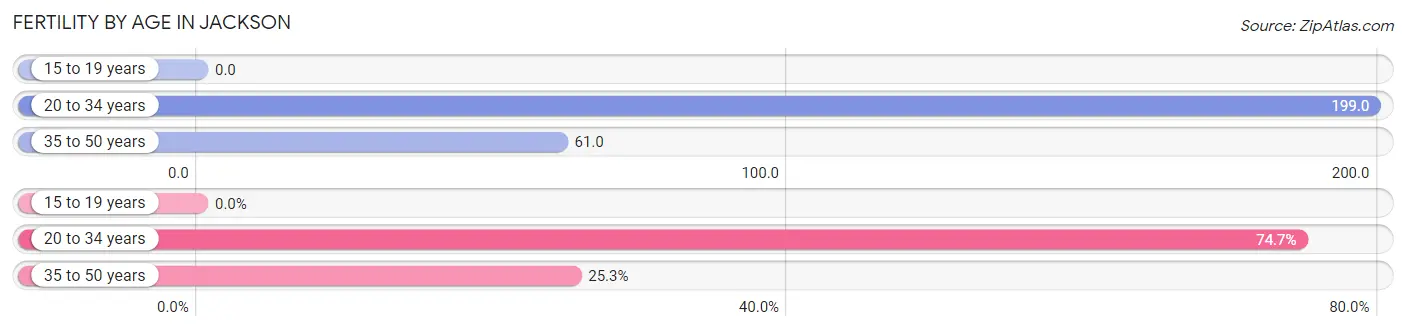
| Age Bracket | Women with Births | Births / 1,000 Women |
| 15 to 19 years | 0 (0.0%) | 0.0 |
| 20 to 34 years | 56 (74.7%) | 199.0 |
| 35 to 50 years | 19 (25.3%) | 61.0 |
| Total | 75 (100.0%) | 113.0 |
Fertility by Age by Marriage Status in Jackson
82.7% of women with births (75) in Jackson are married. The highest percentage of unmarried women with births falls into 20 to 34 years age bracket with 23.2% of them unmarried at the time of birth, while the lowest percentage of unmarried women with births belong to 35 to 50 years age bracket with 0.0% of them unmarried.
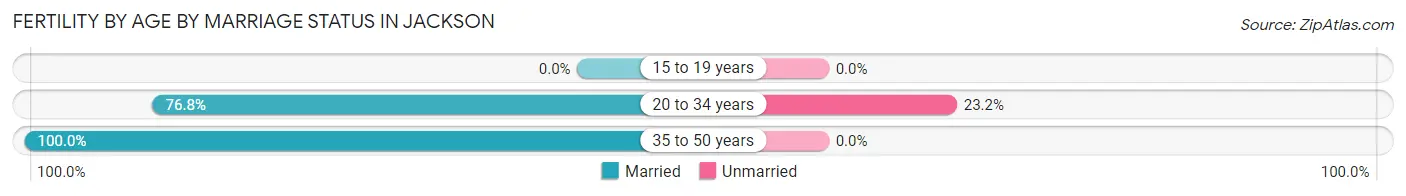
| Age Bracket | Married | Unmarried |
| 15 to 19 years | 0 (0.0%) | 0 (0.0%) |
| 20 to 34 years | 43 (76.8%) | 13 (23.2%) |
| 35 to 50 years | 19 (100.0%) | 0 (0.0%) |
| Total | 62 (82.7%) | 13 (17.3%) |
Fertility by Education in Jackson
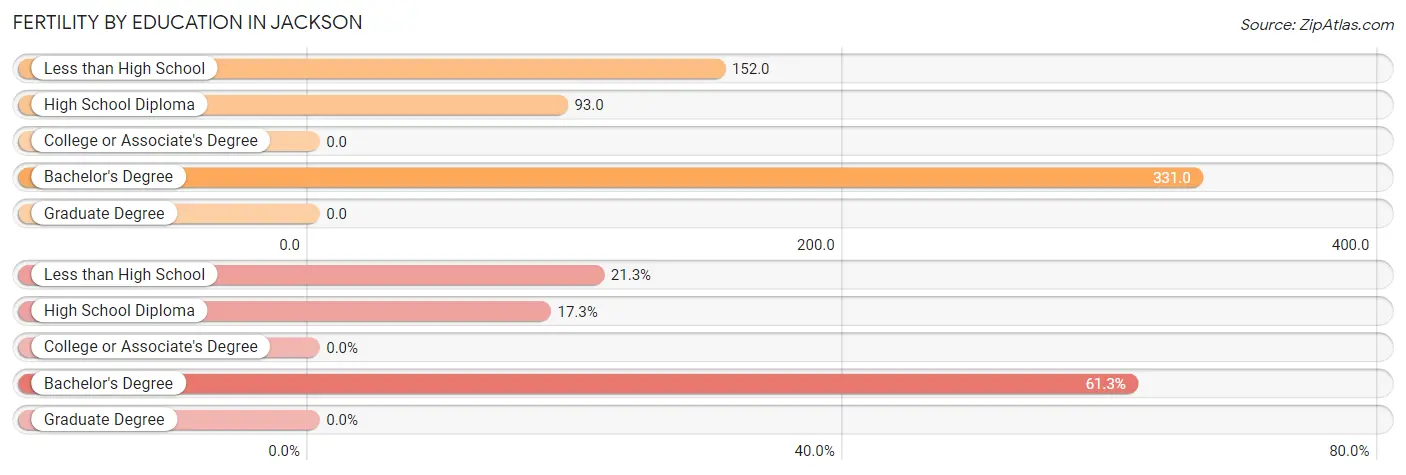
| Educational Attainment | Women with Births | Births / 1,000 Women |
| Less than High School | 16 (21.3%) | 152.0 |
| High School Diploma | 13 (17.3%) | 93.0 |
| College or Associate's Degree | 0 (0.0%) | 0.0 |
| Bachelor's Degree | 46 (61.3%) | 331.0 |
| Graduate Degree | 0 (0.0%) | 0.0 |
| Total | 75 (100.0%) | 113.0 |
Fertility by Education by Marriage Status in Jackson
17.3% of women with births in Jackson are unmarried. Women with the educational attainment of less than high school are most likely to be married with 100.0% of them married at childbirth, while women with the educational attainment of high school diploma are least likely to be married with 100.0% of them unmarried at childbirth.
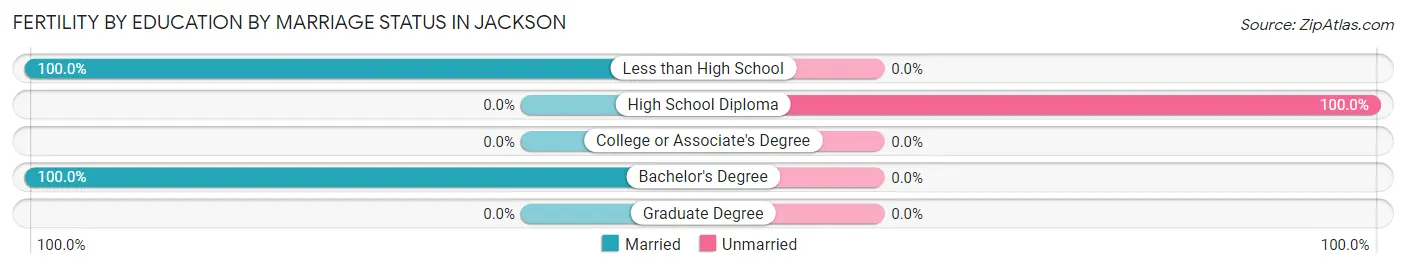
| Educational Attainment | Married | Unmarried |
| Less than High School | 16 (100.0%) | 0 (0.0%) |
| High School Diploma | 0 (0.0%) | 13 (100.0%) |
| College or Associate's Degree | 0 (0.0%) | 0 (0.0%) |
| Bachelor's Degree | 46 (100.0%) | 0 (0.0%) |
| Graduate Degree | 0 (0.0%) | 0 (0.0%) |
| Total | 62 (82.7%) | 13 (17.3%) |
Employment Characteristics in Jackson
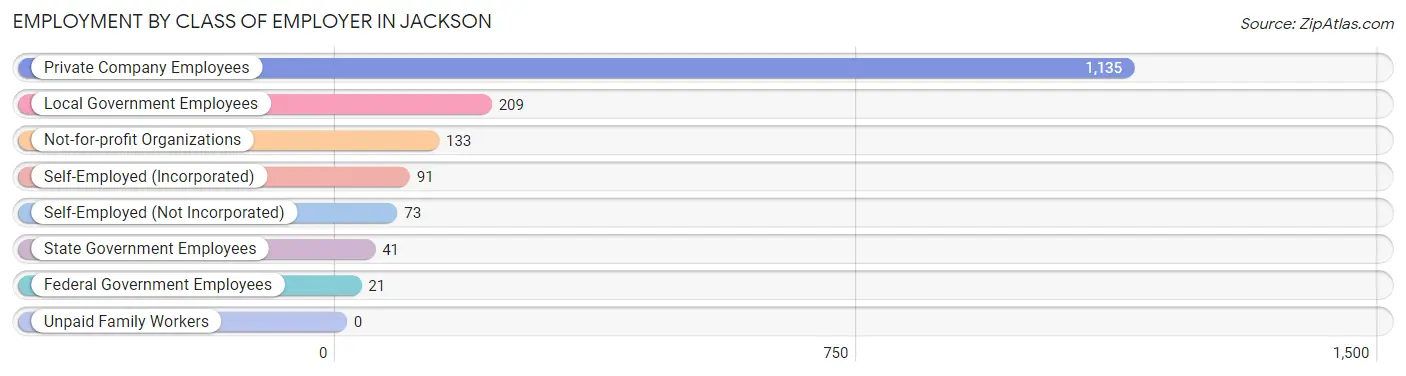
Employment by Class of Employer in Jackson
Among the 1,703 employed individuals in Jackson, private company employees (1,135 | 66.6%), local government employees (209 | 12.3%), and not-for-profit organizations (133 | 7.8%) make up the most common classes of employment.
| Employer Class | # Employees | % Employees |
| Private Company Employees | 1,135 | 66.6% |
| Self-Employed (Incorporated) | 91 | 5.3% |
| Self-Employed (Not Incorporated) | 73 | 4.3% |
| Not-for-profit Organizations | 133 | 7.8% |
| Local Government Employees | 209 | 12.3% |
| State Government Employees | 41 | 2.4% |
| Federal Government Employees | 21 | 1.2% |
| Unpaid Family Workers | 0 | 0.0% |
| Total | 1,703 | 100.0% |
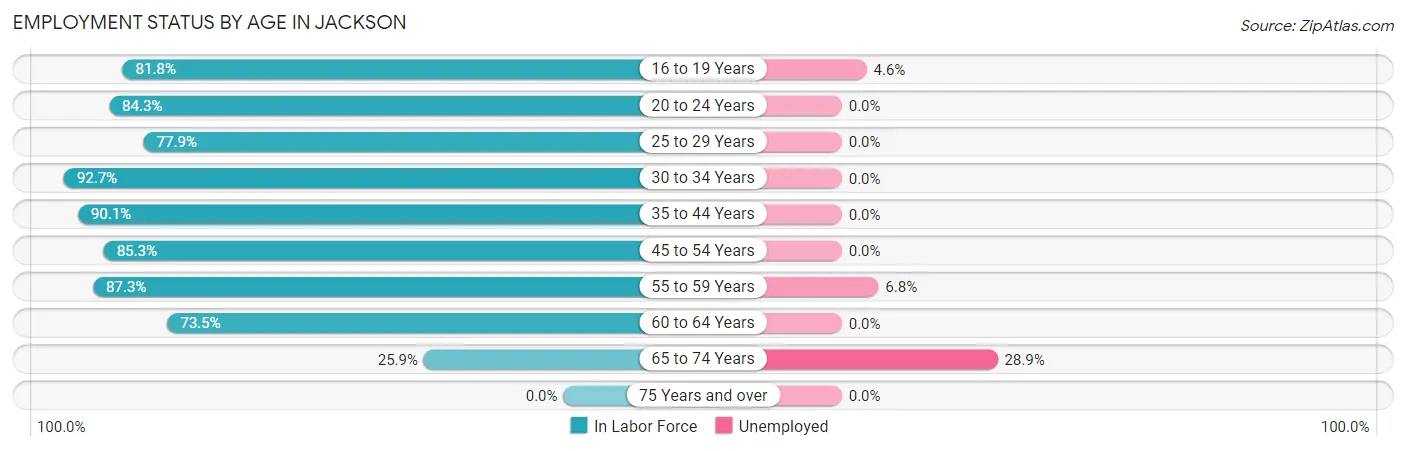
Employment Status by Age in Jackson
According to the labor force statistics for Jackson, out of the total population over 16 years of age (2,789), 64.0% or 1,785 individuals are in the labor force, with 3.0% or 54 of them unemployed. The age group with the highest labor force participation rate is 30 to 34 years, with 92.7% or 115 individuals in the labor force. Within the labor force, the 65 to 74 years age range has the highest percentage of unemployed individuals, with 28.9% or 35 of them being unemployed.
| Age Bracket | In Labor Force | Unemployed |
| 16 to 19 Years | 130 (81.8%) | 6 (4.6%) |
| 20 to 24 Years | 172 (84.3%) | 0 (0.0%) |
| 25 to 29 Years | 197 (77.9%) | 0 (0.0%) |
| 30 to 34 Years | 115 (92.7%) | 0 (0.0%) |
| 35 to 44 Years | 311 (90.1%) | 0 (0.0%) |
| 45 to 54 Years | 376 (85.3%) | 0 (0.0%) |
| 55 to 59 Years | 192 (87.3%) | 13 (6.8%) |
| 60 to 64 Years | 172 (73.5%) | 0 (0.0%) |
| 65 to 74 Years | 121 (25.9%) | 35 (28.9%) |
| 75 Years and over | 0 (0.0%) | 0 (0.0%) |
| Total | 1,785 (64.0%) | 54 (3.0%) |
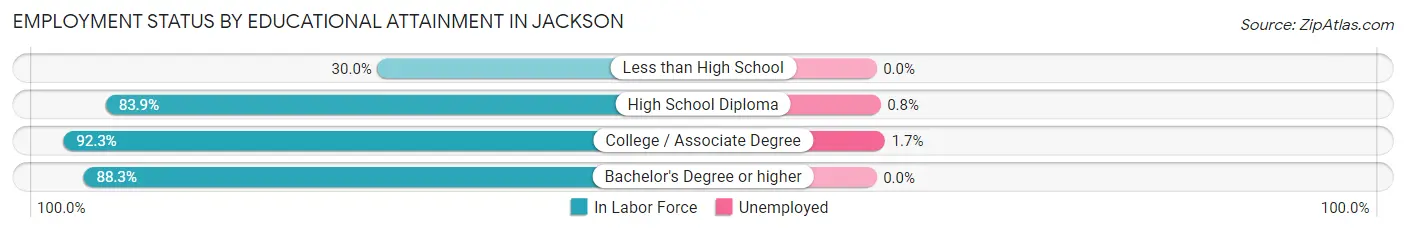
Employment Status by Educational Attainment in Jackson
According to labor force statistics for Jackson, 84.3% of individuals (1,363) out of the total population between 25 and 64 years of age (1,617) are in the labor force, with 1.0% or 14 of them being unemployed. The group with the highest labor force participation rate are those with the educational attainment of college / associate degree, with 92.3% or 586 individuals in the labor force. Within the labor force, individuals with college / associate degree education have the highest percentage of unemployment, with 1.7% or 10 of them being unemployed.
| Educational Attainment | In Labor Force | Unemployed |
| Less than High School | 36 (30.0%) | 0 (0.0%) |
| High School Diploma | 380 (83.9%) | 4 (0.8%) |
| College / Associate Degree | 586 (92.3%) | 11 (1.7%) |
| Bachelor's Degree or higher | 361 (88.3%) | 0 (0.0%) |
| Total | 1,363 (84.3%) | 16 (1.0%) |
Employment Occupations by Sex in Jackson
Management, Business, Science and Arts Occupations
The most common Management, Business, Science and Arts occupations in Jackson are Community & Social Service (145 | 8.4%), Management (127 | 7.3%), Computers, Engineering & Science (113 | 6.5%), Health Diagnosing & Treating (106 | 6.1%), and Architecture & Engineering (97 | 5.6%).
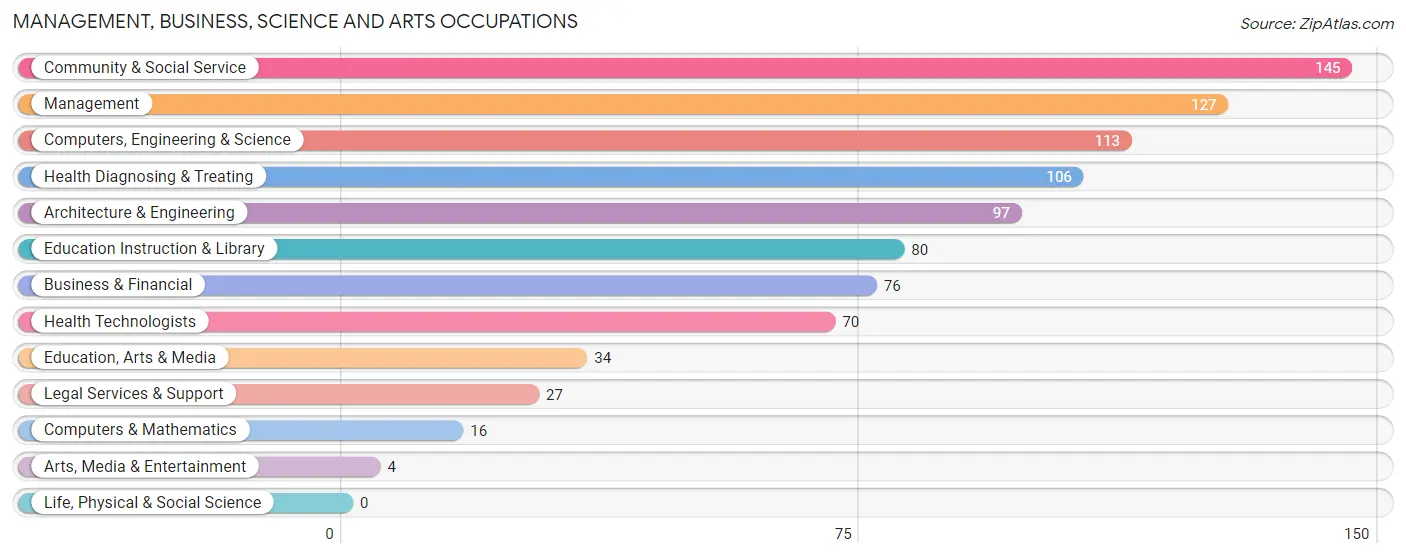
Management, Business, Science and Arts Occupations by Sex
Within the Management, Business, Science and Arts occupations in Jackson, the most male-oriented occupations are Computers & Mathematics (100.0%), Legal Services & Support (100.0%), and Arts, Media & Entertainment (100.0%), while the most female-oriented occupations are Health Diagnosing & Treating (94.3%), Health Technologists (91.4%), and Education, Arts & Media (88.2%).
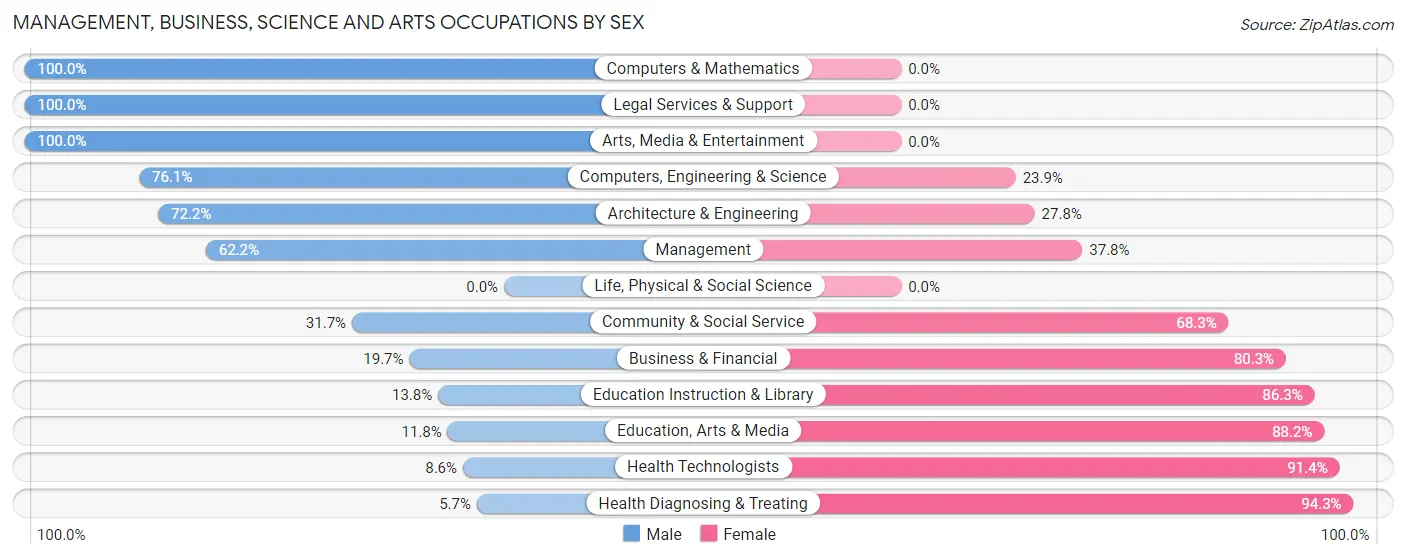
| Occupation | Male | Female |
| Management | 79 (62.2%) | 48 (37.8%) |
| Business & Financial | 15 (19.7%) | 61 (80.3%) |
| Computers, Engineering & Science | 86 (76.1%) | 27 (23.9%) |
| Computers & Mathematics | 16 (100.0%) | 0 (0.0%) |
| Architecture & Engineering | 70 (72.2%) | 27 (27.8%) |
| Life, Physical & Social Science | 0 (0.0%) | 0 (0.0%) |
| Community & Social Service | 46 (31.7%) | 99 (68.3%) |
| Education, Arts & Media | 4 (11.8%) | 30 (88.2%) |
| Legal Services & Support | 27 (100.0%) | 0 (0.0%) |
| Education Instruction & Library | 11 (13.8%) | 69 (86.3%) |
| Arts, Media & Entertainment | 4 (100.0%) | 0 (0.0%) |
| Health Diagnosing & Treating | 6 (5.7%) | 100 (94.3%) |
| Health Technologists | 6 (8.6%) | 64 (91.4%) |
| Total (Category) | 232 (40.9%) | 335 (59.1%) |
| Total (Overall) | 873 (50.4%) | 859 (49.6%) |
Services Occupations
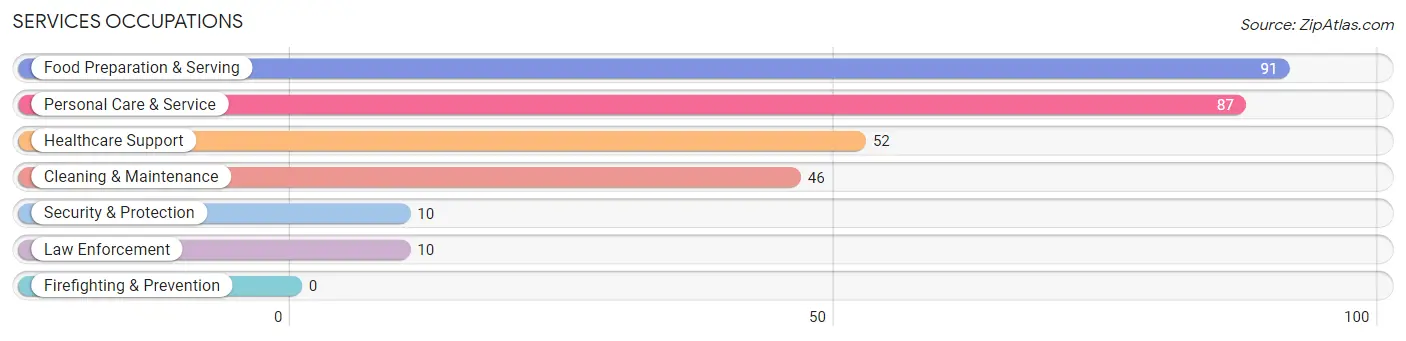
The most common Services occupations in Jackson are Food Preparation & Serving (91 | 5.2%), Personal Care & Service (87 | 5.0%), Healthcare Support (52 | 3.0%), Cleaning & Maintenance (46 | 2.7%), and Security & Protection (10 | 0.6%).
Services Occupations by Sex
Within the Services occupations in Jackson, the most male-oriented occupations are Security & Protection (100.0%), Law Enforcement (100.0%), and Cleaning & Maintenance (84.8%), while the most female-oriented occupations are Personal Care & Service (93.1%), Food Preparation & Serving (49.4%), and Healthcare Support (15.4%).
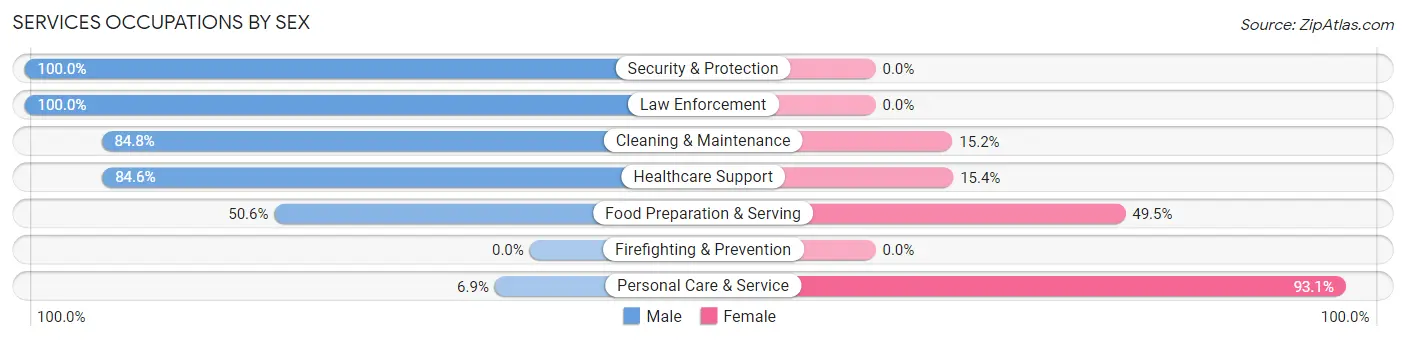
| Occupation | Male | Female |
| Healthcare Support | 44 (84.6%) | 8 (15.4%) |
| Security & Protection | 10 (100.0%) | 0 (0.0%) |
| Firefighting & Prevention | 0 (0.0%) | 0 (0.0%) |
| Law Enforcement | 10 (100.0%) | 0 (0.0%) |
| Food Preparation & Serving | 46 (50.5%) | 45 (49.4%) |
| Cleaning & Maintenance | 39 (84.8%) | 7 (15.2%) |
| Personal Care & Service | 6 (6.9%) | 81 (93.1%) |
| Total (Category) | 145 (50.7%) | 141 (49.3%) |
| Total (Overall) | 873 (50.4%) | 859 (49.6%) |
Sales and Office Occupations
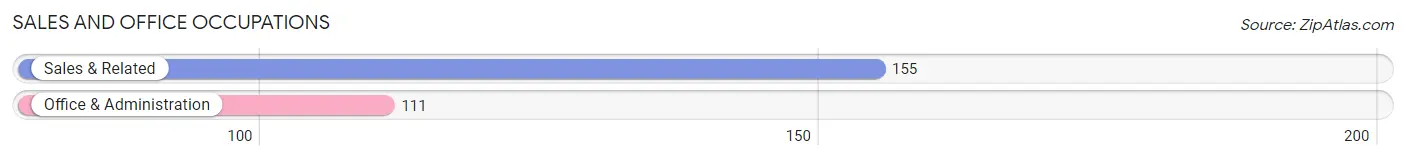
The most common Sales and Office occupations in Jackson are Sales & Related (155 | 8.9%), and Office & Administration (111 | 6.4%).
Sales and Office Occupations by Sex
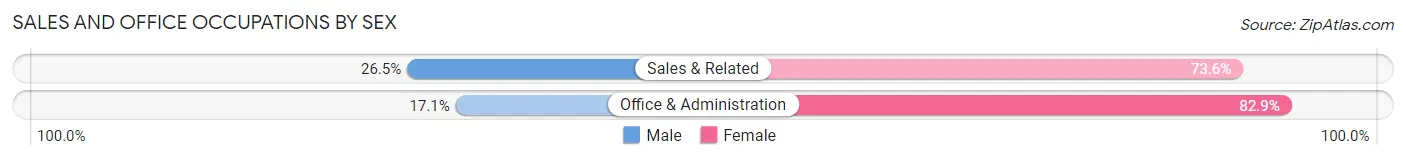
| Occupation | Male | Female |
| Sales & Related | 41 (26.5%) | 114 (73.6%) |
| Office & Administration | 19 (17.1%) | 92 (82.9%) |
| Total (Category) | 60 (22.6%) | 206 (77.4%) |
| Total (Overall) | 873 (50.4%) | 859 (49.6%) |
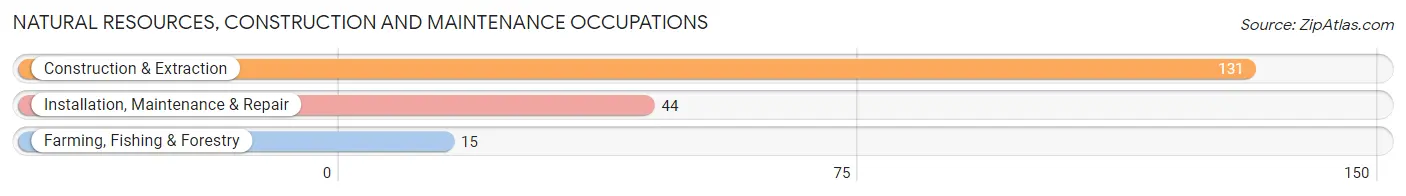
Natural Resources, Construction and Maintenance Occupations
The most common Natural Resources, Construction and Maintenance occupations in Jackson are Construction & Extraction (131 | 7.6%), Installation, Maintenance & Repair (44 | 2.5%), and Farming, Fishing & Forestry (15 | 0.9%).
Natural Resources, Construction and Maintenance Occupations by Sex
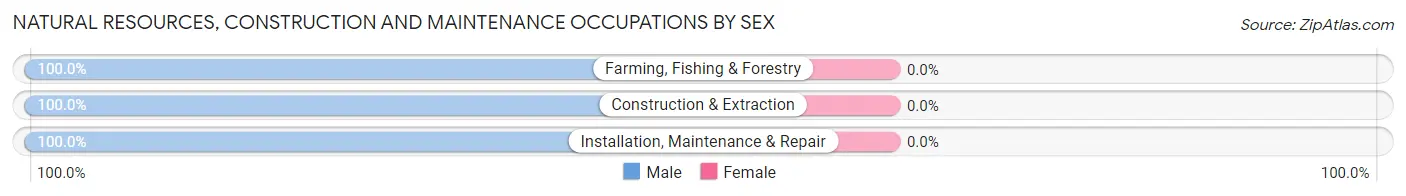
| Occupation | Male | Female |
| Farming, Fishing & Forestry | 15 (100.0%) | 0 (0.0%) |
| Construction & Extraction | 131 (100.0%) | 0 (0.0%) |
| Installation, Maintenance & Repair | 44 (100.0%) | 0 (0.0%) |
| Total (Category) | 190 (100.0%) | 0 (0.0%) |
| Total (Overall) | 873 (50.4%) | 859 (49.6%) |
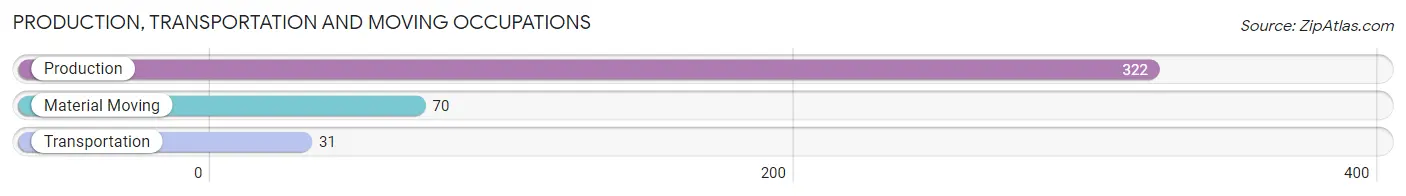
Production, Transportation and Moving Occupations
The most common Production, Transportation and Moving occupations in Jackson are Production (322 | 18.6%), Material Moving (70 | 4.0%), and Transportation (31 | 1.8%).
Production, Transportation and Moving Occupations by Sex
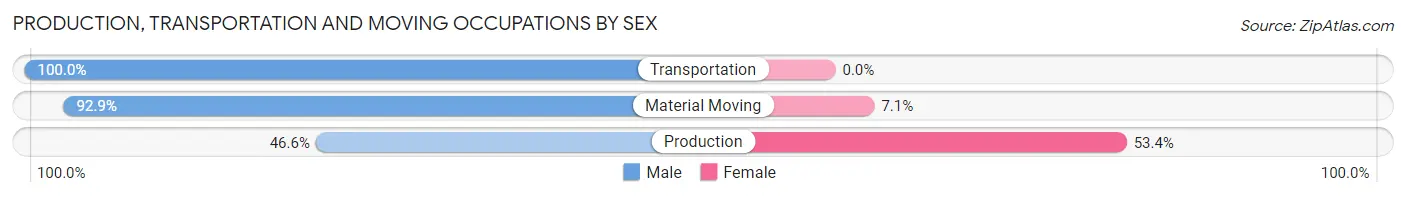
| Occupation | Male | Female |
| Production | 150 (46.6%) | 172 (53.4%) |
| Transportation | 31 (100.0%) | 0 (0.0%) |
| Material Moving | 65 (92.9%) | 5 (7.1%) |
| Total (Category) | 246 (58.2%) | 177 (41.8%) |
| Total (Overall) | 873 (50.4%) | 859 (49.6%) |
Employment Industries by Sex in Jackson
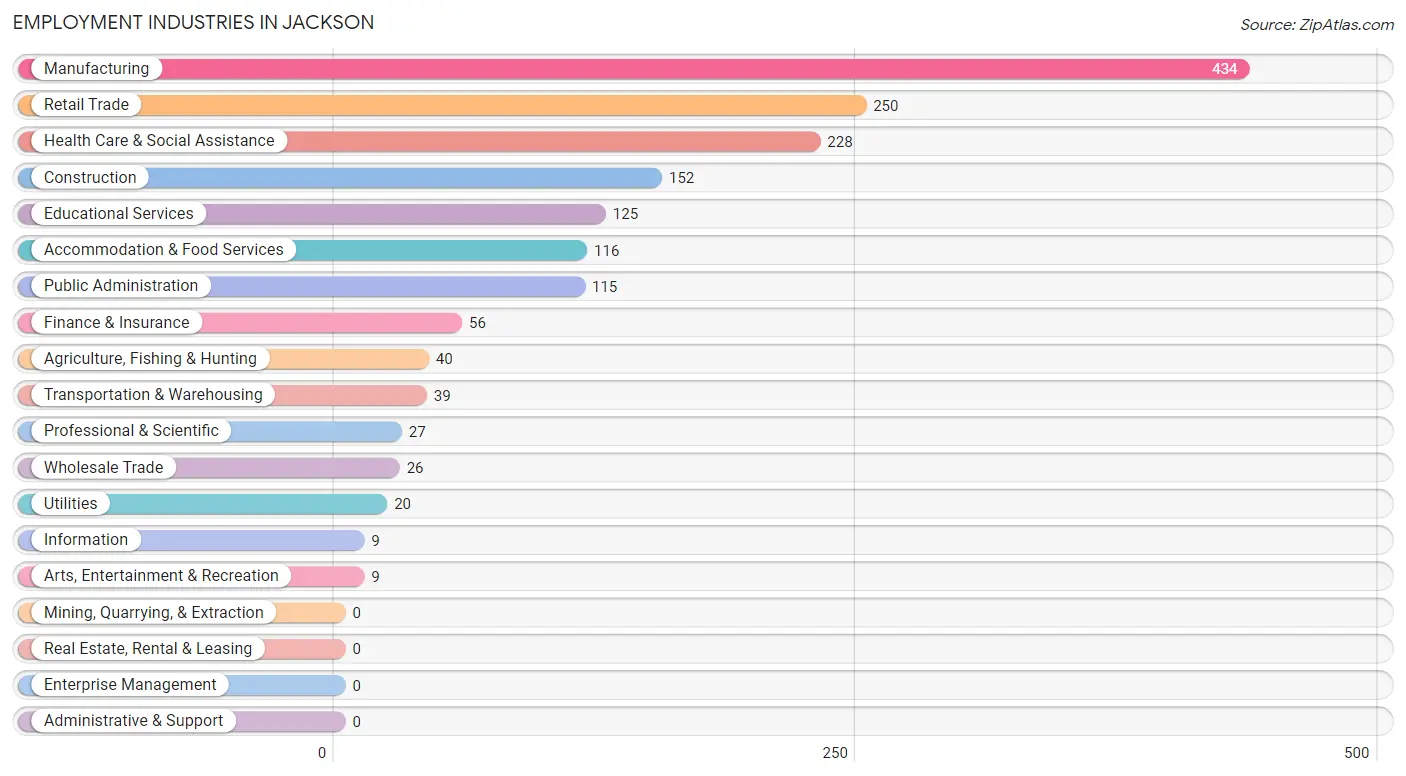
Employment Industries in Jackson
The major employment industries in Jackson include Manufacturing (434 | 25.1%), Retail Trade (250 | 14.4%), Health Care & Social Assistance (228 | 13.2%), Construction (152 | 8.8%), and Educational Services (125 | 7.2%).
Employment Industries by Sex in Jackson
The Jackson industries that see more men than women are Construction (100.0%), Wholesale Trade (100.0%), and Utilities (100.0%), whereas the industries that tend to have a higher number of women are Finance & Insurance (91.1%), Public Administration (80.0%), and Health Care & Social Assistance (75.4%).
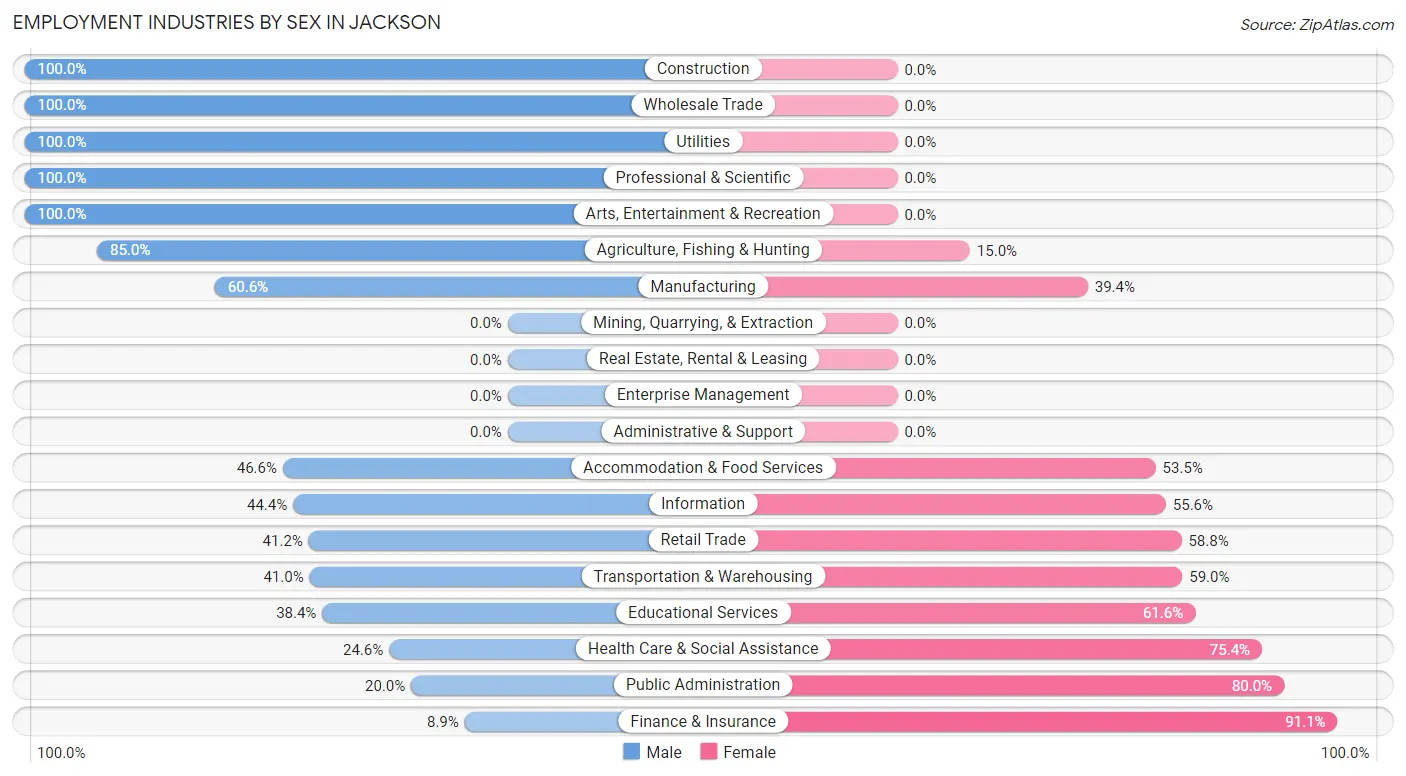
| Industry | Male | Female |
| Agriculture, Fishing & Hunting | 34 (85.0%) | 6 (15.0%) |
| Mining, Quarrying, & Extraction | 0 (0.0%) | 0 (0.0%) |
| Construction | 152 (100.0%) | 0 (0.0%) |
| Manufacturing | 263 (60.6%) | 171 (39.4%) |
| Wholesale Trade | 26 (100.0%) | 0 (0.0%) |
| Retail Trade | 103 (41.2%) | 147 (58.8%) |
| Transportation & Warehousing | 16 (41.0%) | 23 (59.0%) |
| Utilities | 20 (100.0%) | 0 (0.0%) |
| Information | 4 (44.4%) | 5 (55.6%) |
| Finance & Insurance | 5 (8.9%) | 51 (91.1%) |
| Real Estate, Rental & Leasing | 0 (0.0%) | 0 (0.0%) |
| Professional & Scientific | 27 (100.0%) | 0 (0.0%) |
| Enterprise Management | 0 (0.0%) | 0 (0.0%) |
| Administrative & Support | 0 (0.0%) | 0 (0.0%) |
| Educational Services | 48 (38.4%) | 77 (61.6%) |
| Health Care & Social Assistance | 56 (24.6%) | 172 (75.4%) |
| Arts, Entertainment & Recreation | 9 (100.0%) | 0 (0.0%) |
| Accommodation & Food Services | 54 (46.6%) | 62 (53.4%) |
| Public Administration | 23 (20.0%) | 92 (80.0%) |
| Total | 873 (50.4%) | 859 (49.6%) |
Education in Jackson
School Enrollment in Jackson
The most common levels of schooling among the 523 students in Jackson are high school (141 | 27.0%), college / undergraduate (141 | 27.0%), and middle school (131 | 25.1%).
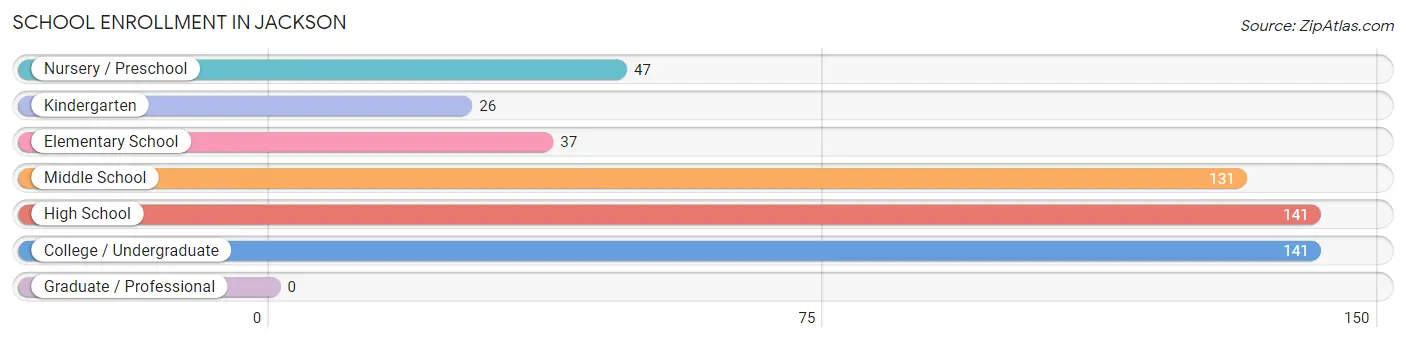
| School Level | # Students | % Students |
| Nursery / Preschool | 47 | 9.0% |
| Kindergarten | 26 | 5.0% |
| Elementary School | 37 | 7.1% |
| Middle School | 131 | 25.1% |
| High School | 141 | 27.0% |
| College / Undergraduate | 141 | 27.0% |
| Graduate / Professional | 0 | 0.0% |
| Total | 523 | 100.0% |
School Enrollment by Age by Funding Source in Jackson
Out of a total of 523 students who are enrolled in schools in Jackson, 9 (1.7%) attend a private institution, while the remaining 514 (98.3%) are enrolled in public schools. The age group of 5 to 9 year old has the highest likelihood of being enrolled in private schools, with 9 (11.7% in the age bracket) enrolled. Conversely, the age group of 3 to 4 year olds has the lowest likelihood of being enrolled in a private school, with 22 (100.0% in the age bracket) attending a public institution.
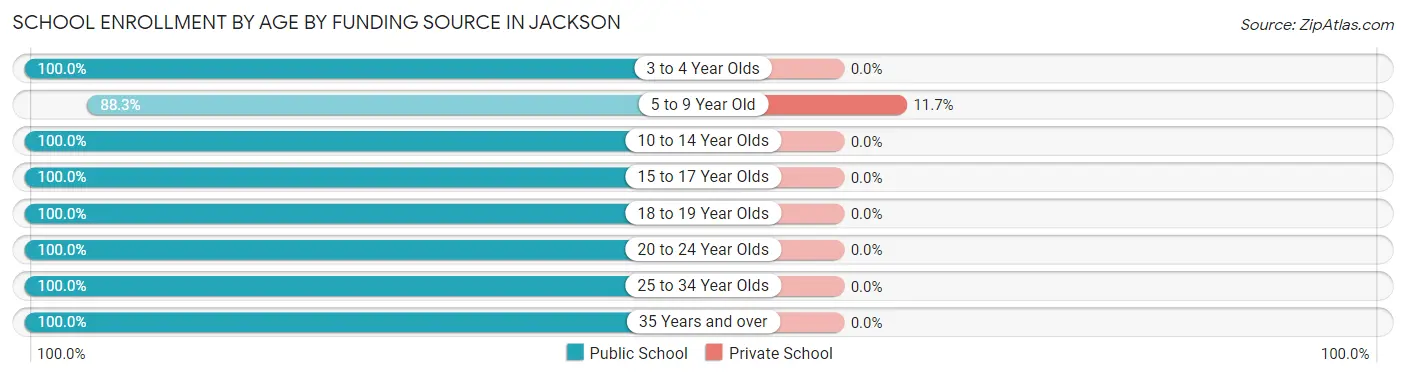
| Age Bracket | Public School | Private School |
| 3 to 4 Year Olds | 22 (100.0%) | 0 (0.0%) |
| 5 to 9 Year Old | 68 (88.3%) | 9 (11.7%) |
| 10 to 14 Year Olds | 142 (100.0%) | 0 (0.0%) |
| 15 to 17 Year Olds | 135 (100.0%) | 0 (0.0%) |
| 18 to 19 Year Olds | 35 (100.0%) | 0 (0.0%) |
| 20 to 24 Year Olds | 51 (100.0%) | 0 (0.0%) |
| 25 to 34 Year Olds | 26 (100.0%) | 0 (0.0%) |
| 35 Years and over | 35 (100.0%) | 0 (0.0%) |
| Total | 514 (98.3%) | 9 (1.7%) |
Educational Attainment by Field of Study in Jackson
Education (122 | 22.0%), engineering (86 | 15.5%), science & technology (85 | 15.3%), business (76 | 13.7%), and liberal arts & history (42 | 7.6%) are the most common fields of study among 554 individuals in Jackson who have obtained a bachelor's degree or higher.
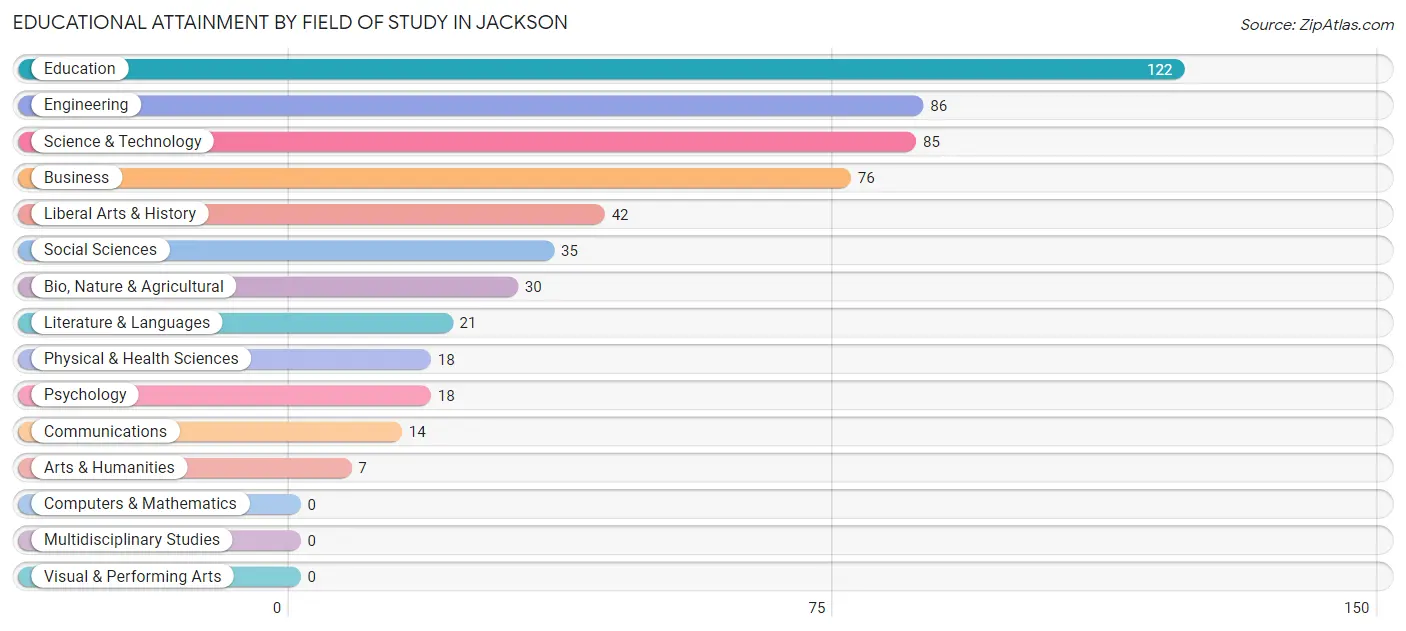
| Field of Study | # Graduates | % Graduates |
| Computers & Mathematics | 0 | 0.0% |
| Bio, Nature & Agricultural | 30 | 5.4% |
| Physical & Health Sciences | 18 | 3.3% |
| Psychology | 18 | 3.3% |
| Social Sciences | 35 | 6.3% |
| Engineering | 86 | 15.5% |
| Multidisciplinary Studies | 0 | 0.0% |
| Science & Technology | 85 | 15.3% |
| Business | 76 | 13.7% |
| Education | 122 | 22.0% |
| Literature & Languages | 21 | 3.8% |
| Liberal Arts & History | 42 | 7.6% |
| Visual & Performing Arts | 0 | 0.0% |
| Communications | 14 | 2.5% |
| Arts & Humanities | 7 | 1.3% |
| Total | 554 | 100.0% |
Transportation & Commute in Jackson
Vehicle Availability by Sex in Jackson
The most prevalent vehicle ownership categories in Jackson are males with 2 vehicles (334, accounting for 38.5%) and females with 2 vehicles (331, making up 40.0%).
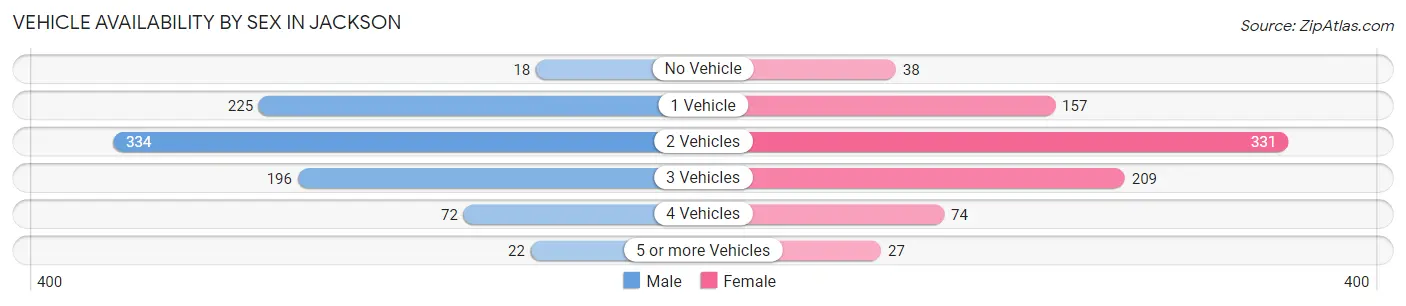
| Vehicles Available | Male | Female |
| No Vehicle | 18 (2.1%) | 38 (4.5%) |
| 1 Vehicle | 225 (26.0%) | 157 (18.8%) |
| 2 Vehicles | 334 (38.5%) | 331 (39.6%) |
| 3 Vehicles | 196 (22.6%) | 209 (25.0%) |
| 4 Vehicles | 72 (8.3%) | 74 (8.8%) |
| 5 or more Vehicles | 22 (2.5%) | 27 (3.2%) |
| Total | 867 (100.0%) | 836 (100.0%) |
Commute Time in Jackson
The most frequently occuring commute durations in Jackson are 5 to 9 minutes (615 commuters, 37.7%), less than 5 minutes (403 commuters, 24.7%), and 20 to 24 minutes (151 commuters, 9.2%).
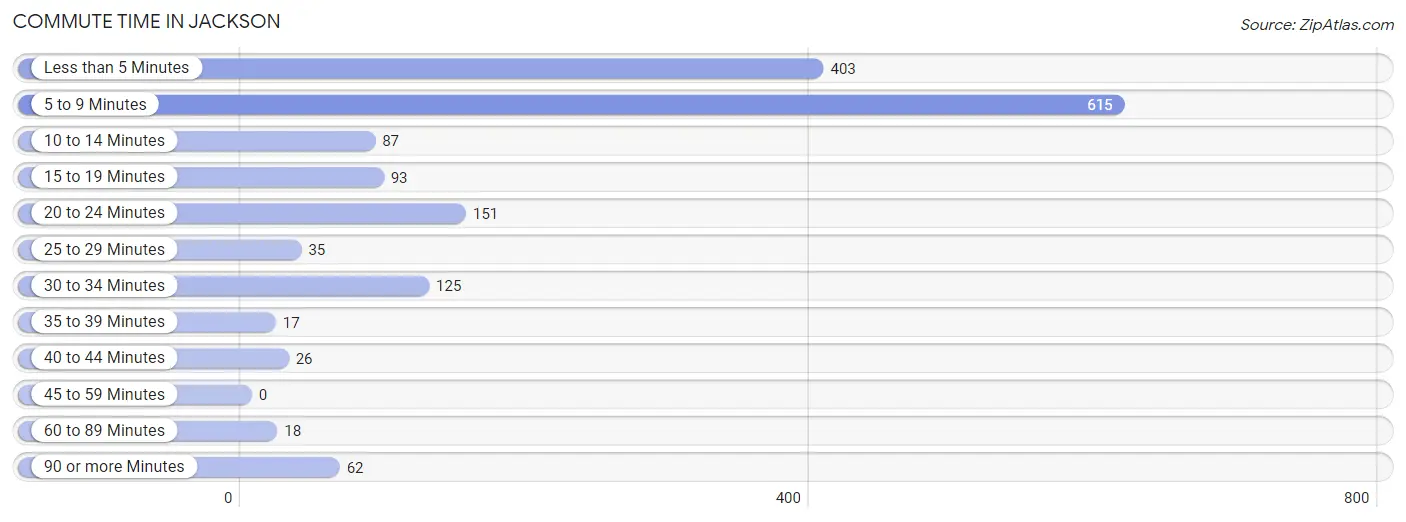
| Commute Time | # Commuters | % Commuters |
| Less than 5 Minutes | 403 | 24.7% |
| 5 to 9 Minutes | 615 | 37.7% |
| 10 to 14 Minutes | 87 | 5.3% |
| 15 to 19 Minutes | 93 | 5.7% |
| 20 to 24 Minutes | 151 | 9.2% |
| 25 to 29 Minutes | 35 | 2.1% |
| 30 to 34 Minutes | 125 | 7.7% |
| 35 to 39 Minutes | 17 | 1.0% |
| 40 to 44 Minutes | 26 | 1.6% |
| 45 to 59 Minutes | 0 | 0.0% |
| 60 to 89 Minutes | 18 | 1.1% |
| 90 or more Minutes | 62 | 3.8% |
Commute Time by Sex in Jackson
The most common commute times in Jackson are 5 to 9 minutes (288 commuters, 33.4%) for males and 5 to 9 minutes (327 commuters, 42.5%) for females.
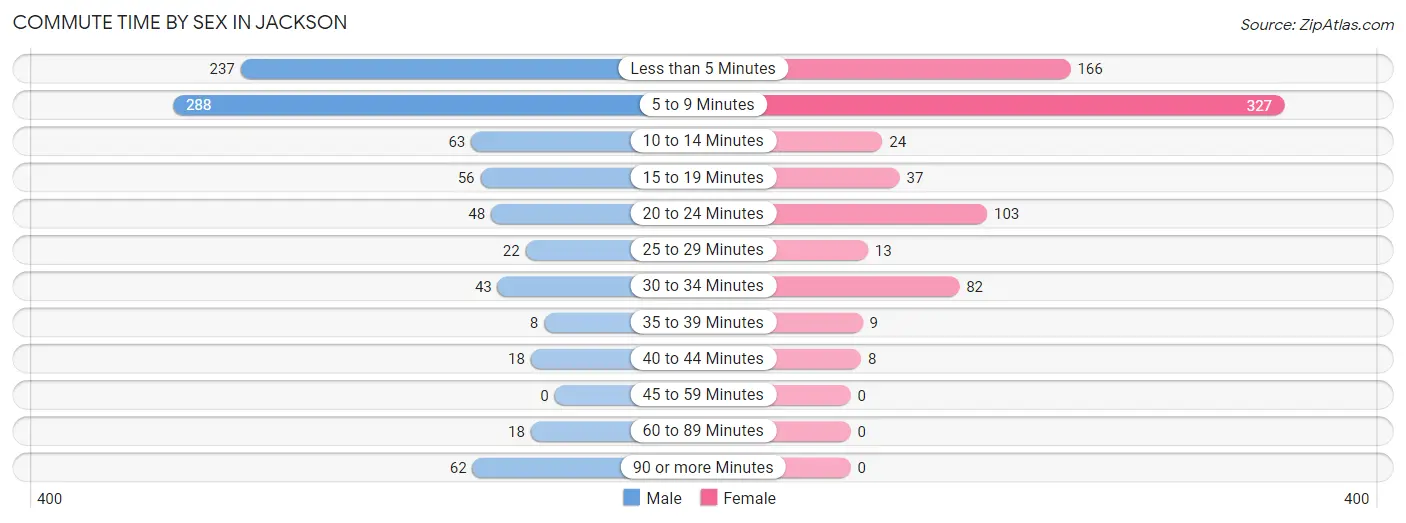
| Commute Time | Male | Female |
| Less than 5 Minutes | 237 (27.5%) | 166 (21.6%) |
| 5 to 9 Minutes | 288 (33.4%) | 327 (42.5%) |
| 10 to 14 Minutes | 63 (7.3%) | 24 (3.1%) |
| 15 to 19 Minutes | 56 (6.5%) | 37 (4.8%) |
| 20 to 24 Minutes | 48 (5.6%) | 103 (13.4%) |
| 25 to 29 Minutes | 22 (2.5%) | 13 (1.7%) |
| 30 to 34 Minutes | 43 (5.0%) | 82 (10.7%) |
| 35 to 39 Minutes | 8 (0.9%) | 9 (1.2%) |
| 40 to 44 Minutes | 18 (2.1%) | 8 (1.0%) |
| 45 to 59 Minutes | 0 (0.0%) | 0 (0.0%) |
| 60 to 89 Minutes | 18 (2.1%) | 0 (0.0%) |
| 90 or more Minutes | 62 (7.2%) | 0 (0.0%) |
Time of Departure to Work by Sex in Jackson
The most frequent times of departure to work in Jackson are 7:30 AM to 7:59 AM (215, 24.9%) for males and 7:30 AM to 7:59 AM (263, 34.2%) for females.
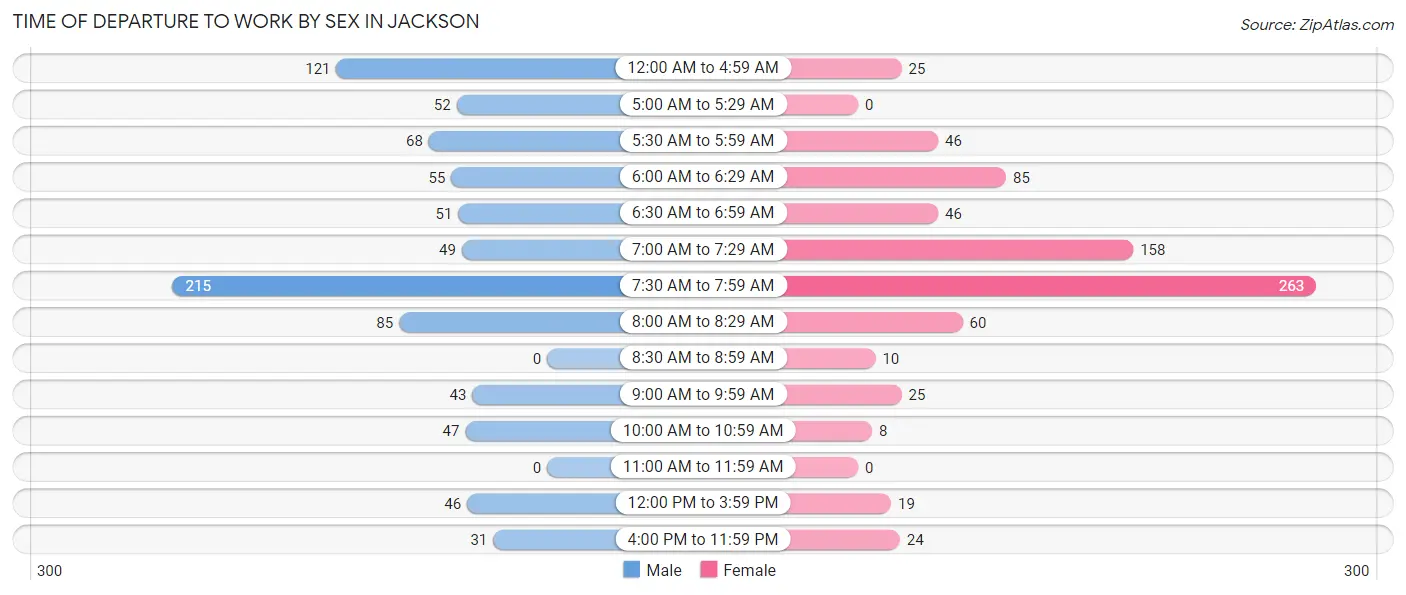
| Time of Departure | Male | Female |
| 12:00 AM to 4:59 AM | 121 (14.0%) | 25 (3.3%) |
| 5:00 AM to 5:29 AM | 52 (6.0%) | 0 (0.0%) |
| 5:30 AM to 5:59 AM | 68 (7.9%) | 46 (6.0%) |
| 6:00 AM to 6:29 AM | 55 (6.4%) | 85 (11.1%) |
| 6:30 AM to 6:59 AM | 51 (5.9%) | 46 (6.0%) |
| 7:00 AM to 7:29 AM | 49 (5.7%) | 158 (20.5%) |
| 7:30 AM to 7:59 AM | 215 (24.9%) | 263 (34.2%) |
| 8:00 AM to 8:29 AM | 85 (9.9%) | 60 (7.8%) |
| 8:30 AM to 8:59 AM | 0 (0.0%) | 10 (1.3%) |
| 9:00 AM to 9:59 AM | 43 (5.0%) | 25 (3.3%) |
| 10:00 AM to 10:59 AM | 47 (5.4%) | 8 (1.0%) |
| 11:00 AM to 11:59 AM | 0 (0.0%) | 0 (0.0%) |
| 12:00 PM to 3:59 PM | 46 (5.3%) | 19 (2.5%) |
| 4:00 PM to 11:59 PM | 31 (3.6%) | 24 (3.1%) |
| Total | 863 (100.0%) | 769 (100.0%) |
Housing Occupancy in Jackson
Occupancy by Ownership in Jackson
Of the total 1,609 dwellings in Jackson, owner-occupied units account for 1,143 (71.0%), while renter-occupied units make up 466 (29.0%).
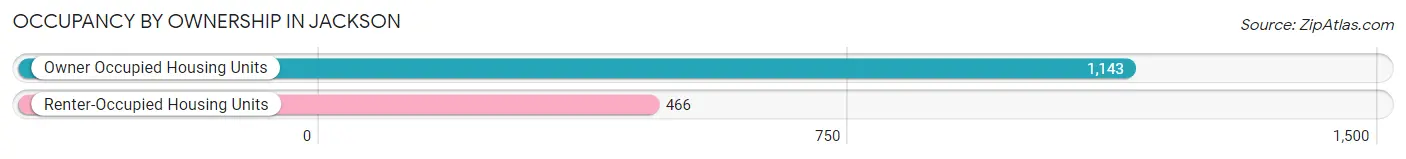
| Occupancy | # Housing Units | % Housing Units |
| Owner Occupied Housing Units | 1,143 | 71.0% |
| Renter-Occupied Housing Units | 466 | 29.0% |
| Total Occupied Housing Units | 1,609 | 100.0% |
Occupancy by Household Size in Jackson
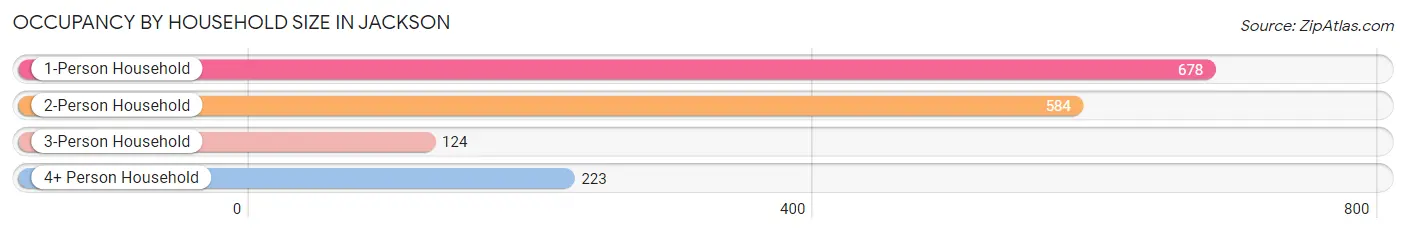
| Household Size | # Housing Units | % Housing Units |
| 1-Person Household | 678 | 42.1% |
| 2-Person Household | 584 | 36.3% |
| 3-Person Household | 124 | 7.7% |
| 4+ Person Household | 223 | 13.9% |
| Total Housing Units | 1,609 | 100.0% |
Occupancy by Ownership by Household Size in Jackson
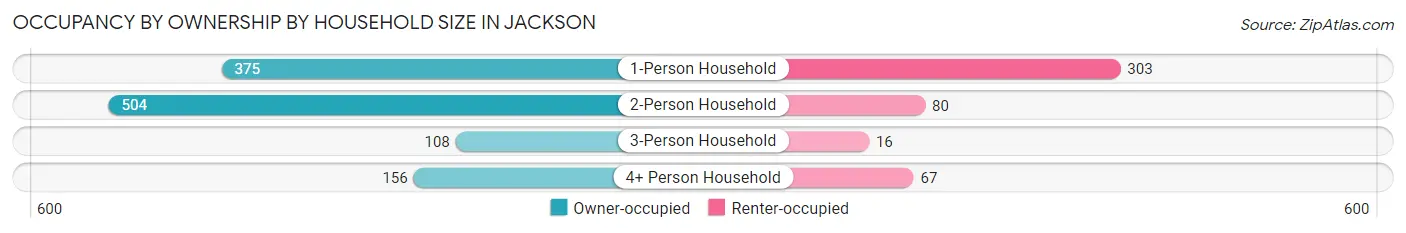
| Household Size | Owner-occupied | Renter-occupied |
| 1-Person Household | 375 (55.3%) | 303 (44.7%) |
| 2-Person Household | 504 (86.3%) | 80 (13.7%) |
| 3-Person Household | 108 (87.1%) | 16 (12.9%) |
| 4+ Person Household | 156 (70.0%) | 67 (30.0%) |
| Total Housing Units | 1,143 (71.0%) | 466 (29.0%) |
Occupancy by Educational Attainment in Jackson
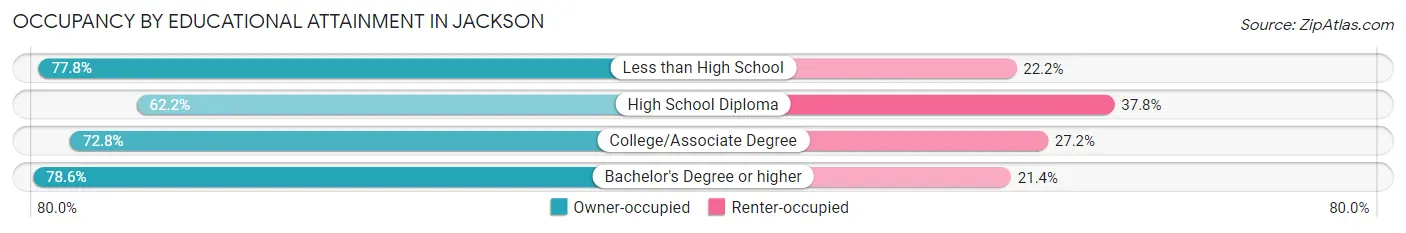
| Household Size | Owner-occupied | Renter-occupied |
| Less than High School | 63 (77.8%) | 18 (22.2%) |
| High School Diploma | 331 (62.2%) | 201 (37.8%) |
| College/Associate Degree | 425 (72.8%) | 159 (27.2%) |
| Bachelor's Degree or higher | 324 (78.6%) | 88 (21.4%) |
Occupancy by Age of Householder in Jackson
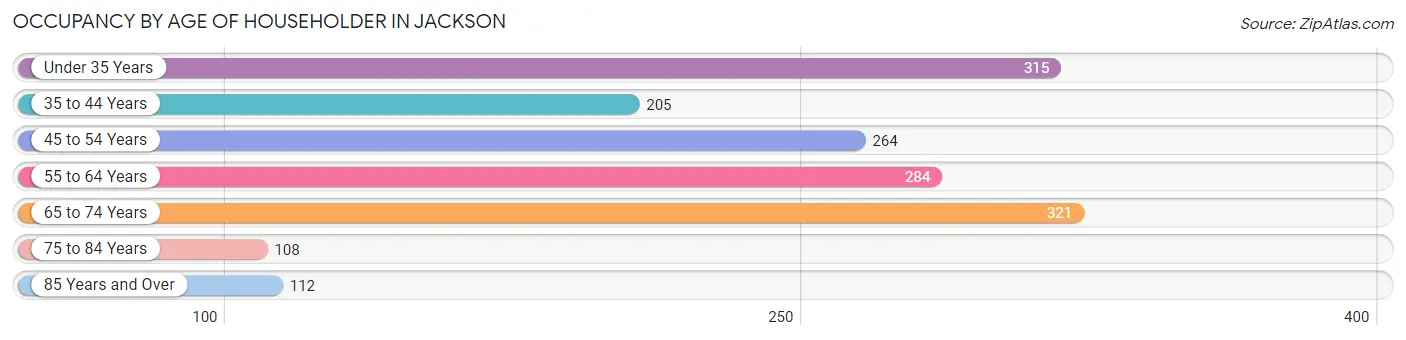
| Age Bracket | # Households | % Households |
| Under 35 Years | 315 | 19.6% |
| 35 to 44 Years | 205 | 12.7% |
| 45 to 54 Years | 264 | 16.4% |
| 55 to 64 Years | 284 | 17.6% |
| 65 to 74 Years | 321 | 20.0% |
| 75 to 84 Years | 108 | 6.7% |
| 85 Years and Over | 112 | 7.0% |
| Total | 1,609 | 100.0% |
Housing Finances in Jackson
Median Income by Occupancy in Jackson
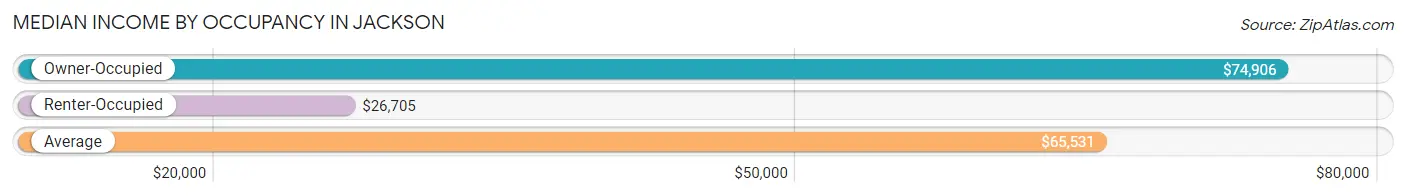
| Occupancy Type | # Households | Median Income |
| Owner-Occupied | 1,143 (71.0%) | $74,906 |
| Renter-Occupied | 466 (29.0%) | $26,705 |
| Average | 1,609 (100.0%) | $65,531 |
Occupancy by Householder Income Bracket in Jackson
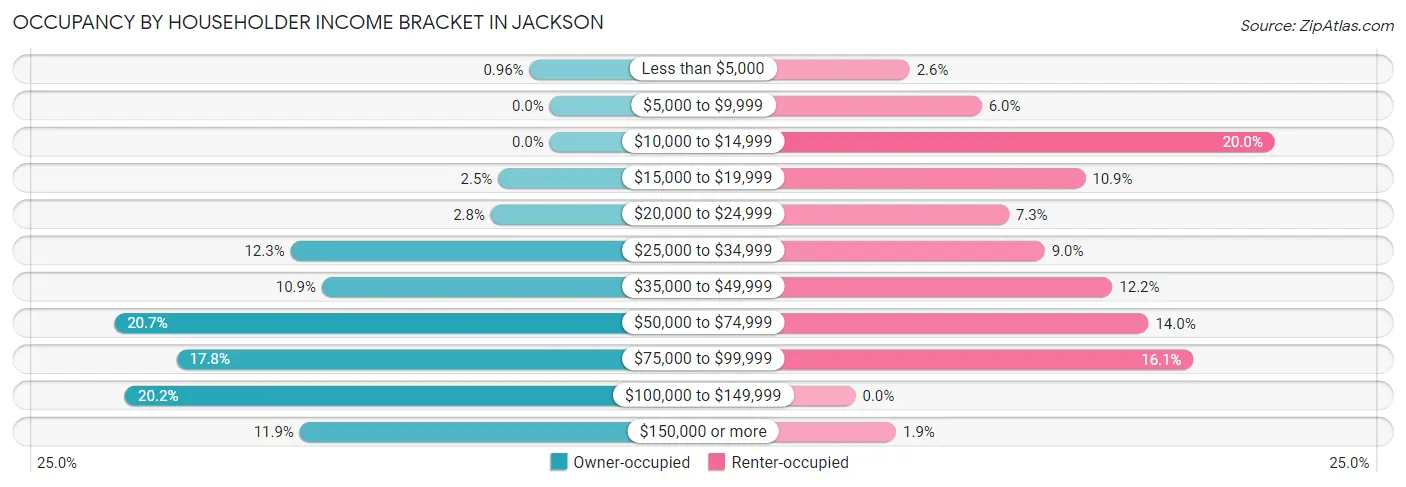
| Income Bracket | Owner-occupied | Renter-occupied |
| Less than $5,000 | 11 (1.0%) | 12 (2.6%) |
| $5,000 to $9,999 | 0 (0.0%) | 28 (6.0%) |
| $10,000 to $14,999 | 0 (0.0%) | 93 (20.0%) |
| $15,000 to $19,999 | 28 (2.5%) | 51 (10.9%) |
| $20,000 to $24,999 | 32 (2.8%) | 34 (7.3%) |
| $25,000 to $34,999 | 141 (12.3%) | 42 (9.0%) |
| $35,000 to $49,999 | 124 (10.8%) | 57 (12.2%) |
| $50,000 to $74,999 | 237 (20.7%) | 65 (14.0%) |
| $75,000 to $99,999 | 203 (17.8%) | 75 (16.1%) |
| $100,000 to $149,999 | 231 (20.2%) | 0 (0.0%) |
| $150,000 or more | 136 (11.9%) | 9 (1.9%) |
| Total | 1,143 (100.0%) | 466 (100.0%) |
Monthly Housing Cost Tiers in Jackson
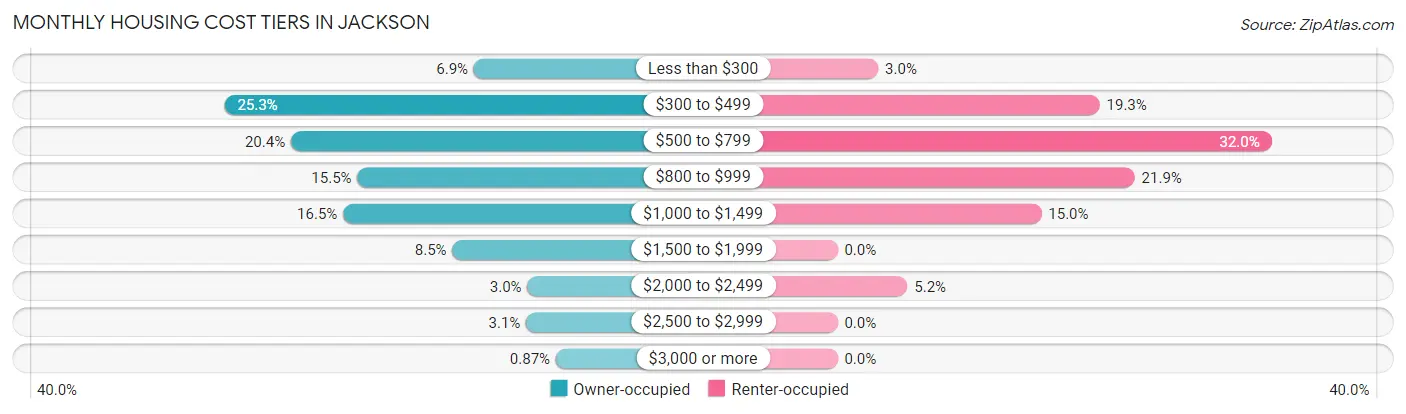
| Monthly Cost | Owner-occupied | Renter-occupied |
| Less than $300 | 79 (6.9%) | 14 (3.0%) |
| $300 to $499 | 289 (25.3%) | 90 (19.3%) |
| $500 to $799 | 233 (20.4%) | 149 (32.0%) |
| $800 to $999 | 177 (15.5%) | 102 (21.9%) |
| $1,000 to $1,499 | 189 (16.5%) | 70 (15.0%) |
| $1,500 to $1,999 | 97 (8.5%) | 0 (0.0%) |
| $2,000 to $2,499 | 34 (3.0%) | 24 (5.1%) |
| $2,500 to $2,999 | 35 (3.1%) | 0 (0.0%) |
| $3,000 or more | 10 (0.9%) | 0 (0.0%) |
| Total | 1,143 (100.0%) | 466 (100.0%) |
Physical Housing Characteristics in Jackson
Housing Structures in Jackson
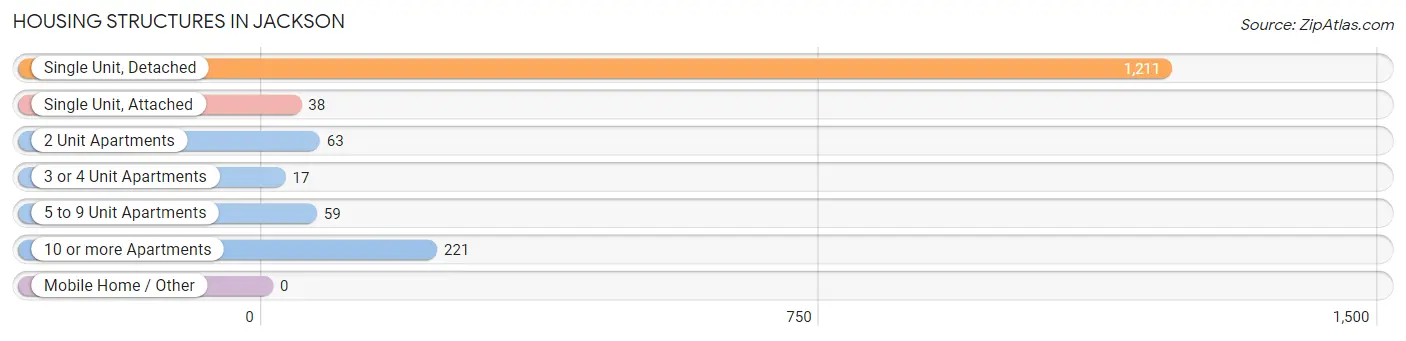
| Structure Type | # Housing Units | % Housing Units |
| Single Unit, Detached | 1,211 | 75.3% |
| Single Unit, Attached | 38 | 2.4% |
| 2 Unit Apartments | 63 | 3.9% |
| 3 or 4 Unit Apartments | 17 | 1.1% |
| 5 to 9 Unit Apartments | 59 | 3.7% |
| 10 or more Apartments | 221 | 13.7% |
| Mobile Home / Other | 0 | 0.0% |
| Total | 1,609 | 100.0% |
Housing Structures by Occupancy in Jackson
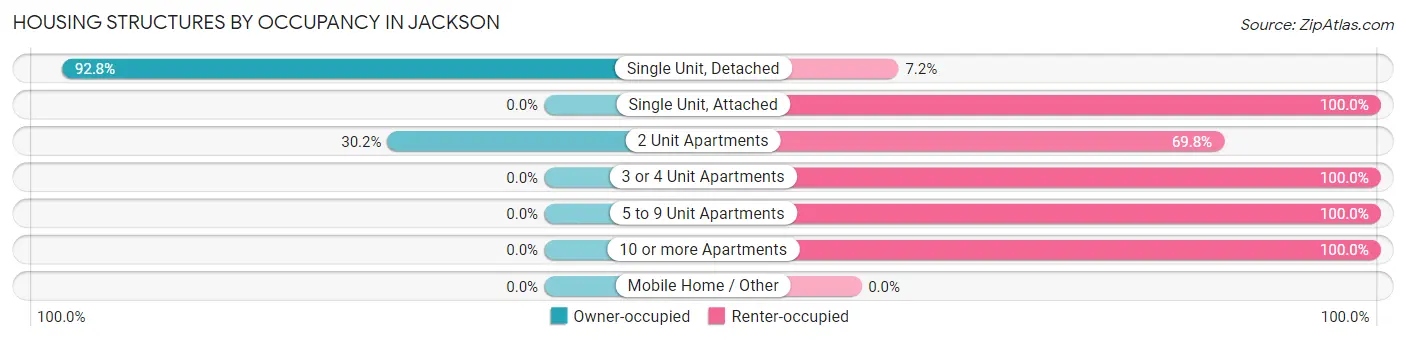
| Structure Type | Owner-occupied | Renter-occupied |
| Single Unit, Detached | 1,124 (92.8%) | 87 (7.2%) |
| Single Unit, Attached | 0 (0.0%) | 38 (100.0%) |
| 2 Unit Apartments | 19 (30.2%) | 44 (69.8%) |
| 3 or 4 Unit Apartments | 0 (0.0%) | 17 (100.0%) |
| 5 to 9 Unit Apartments | 0 (0.0%) | 59 (100.0%) |
| 10 or more Apartments | 0 (0.0%) | 221 (100.0%) |
| Mobile Home / Other | 0 (0.0%) | 0 (0.0%) |
| Total | 1,143 (71.0%) | 466 (29.0%) |
Housing Structures by Number of Rooms in Jackson
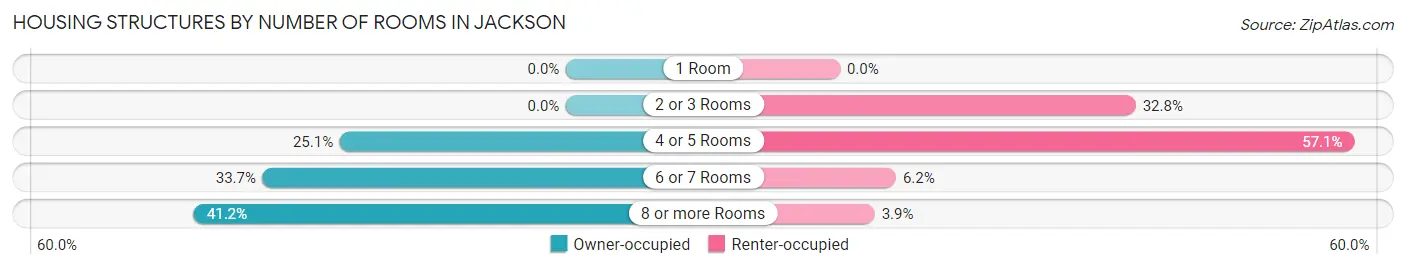
| Number of Rooms | Owner-occupied | Renter-occupied |
| 1 Room | 0 (0.0%) | 0 (0.0%) |
| 2 or 3 Rooms | 0 (0.0%) | 153 (32.8%) |
| 4 or 5 Rooms | 287 (25.1%) | 266 (57.1%) |
| 6 or 7 Rooms | 385 (33.7%) | 29 (6.2%) |
| 8 or more Rooms | 471 (41.2%) | 18 (3.9%) |
| Total | 1,143 (100.0%) | 466 (100.0%) |
Housing Structure by Heating Type in Jackson
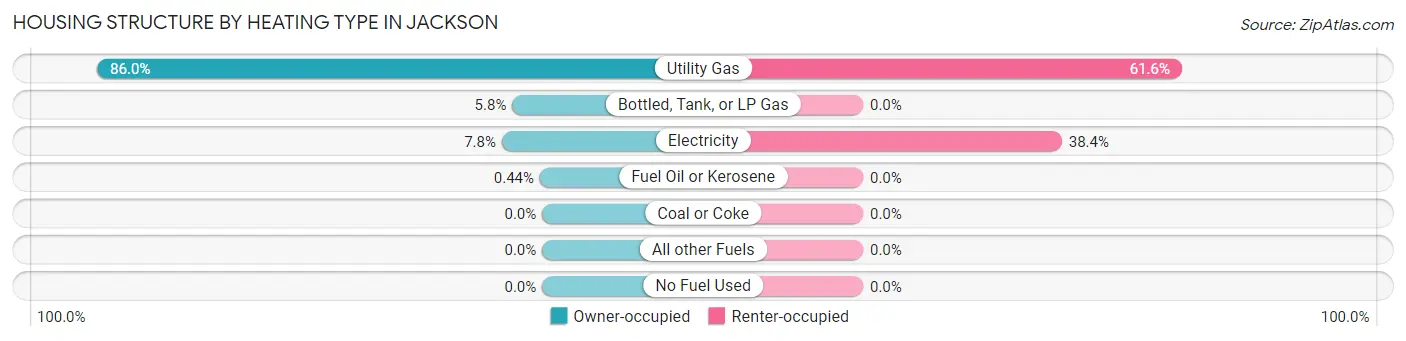
| Heating Type | Owner-occupied | Renter-occupied |
| Utility Gas | 983 (86.0%) | 287 (61.6%) |
| Bottled, Tank, or LP Gas | 66 (5.8%) | 0 (0.0%) |
| Electricity | 89 (7.8%) | 179 (38.4%) |
| Fuel Oil or Kerosene | 5 (0.4%) | 0 (0.0%) |
| Coal or Coke | 0 (0.0%) | 0 (0.0%) |
| All other Fuels | 0 (0.0%) | 0 (0.0%) |
| No Fuel Used | 0 (0.0%) | 0 (0.0%) |
| Total | 1,143 (100.0%) | 466 (100.0%) |
Household Vehicle Usage in Jackson
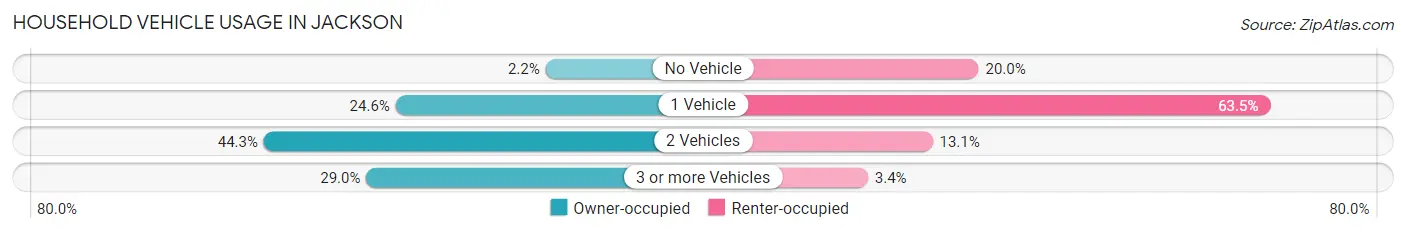
| Vehicles per Household | Owner-occupied | Renter-occupied |
| No Vehicle | 25 (2.2%) | 93 (20.0%) |
| 1 Vehicle | 281 (24.6%) | 296 (63.5%) |
| 2 Vehicles | 506 (44.3%) | 61 (13.1%) |
| 3 or more Vehicles | 331 (29.0%) | 16 (3.4%) |
| Total | 1,143 (100.0%) | 466 (100.0%) |
Real Estate & Mortgages in Jackson
Real Estate and Mortgage Overview in Jackson
| Characteristic | Without Mortgage | With Mortgage |
| Housing Units | 516 | 627 |
| Median Property Value | $106,700 | $151,700 |
| Median Household Income | $72,895 | $104 |
| Monthly Housing Costs | $419 | $10 |
| Real Estate Taxes | $1,053 | $0 |
Property Value by Mortgage Status in Jackson
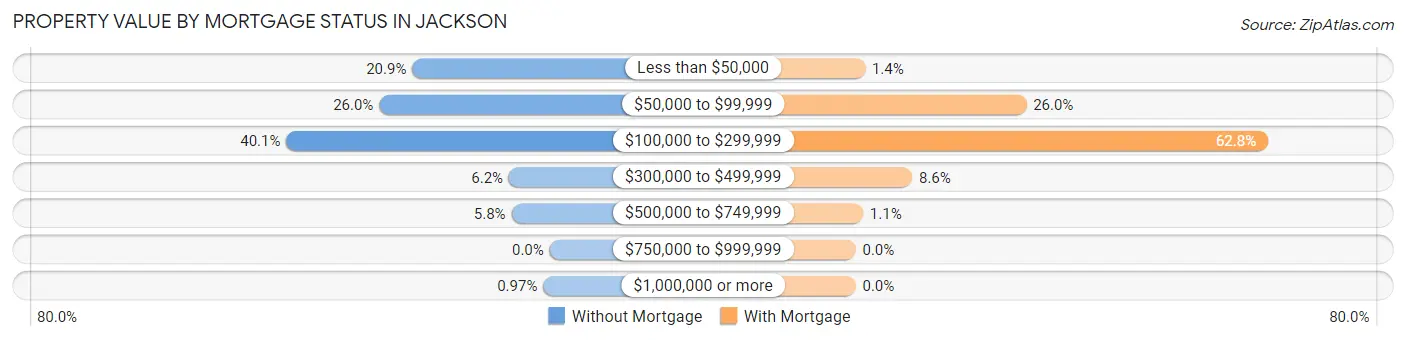
| Property Value | Without Mortgage | With Mortgage |
| Less than $50,000 | 108 (20.9%) | 9 (1.4%) |
| $50,000 to $99,999 | 134 (26.0%) | 163 (26.0%) |
| $100,000 to $299,999 | 207 (40.1%) | 394 (62.8%) |
| $300,000 to $499,999 | 32 (6.2%) | 54 (8.6%) |
| $500,000 to $749,999 | 30 (5.8%) | 7 (1.1%) |
| $750,000 to $999,999 | 0 (0.0%) | 0 (0.0%) |
| $1,000,000 or more | 5 (1.0%) | 0 (0.0%) |
| Total | 516 (100.0%) | 627 (100.0%) |
Household Income by Mortgage Status in Jackson
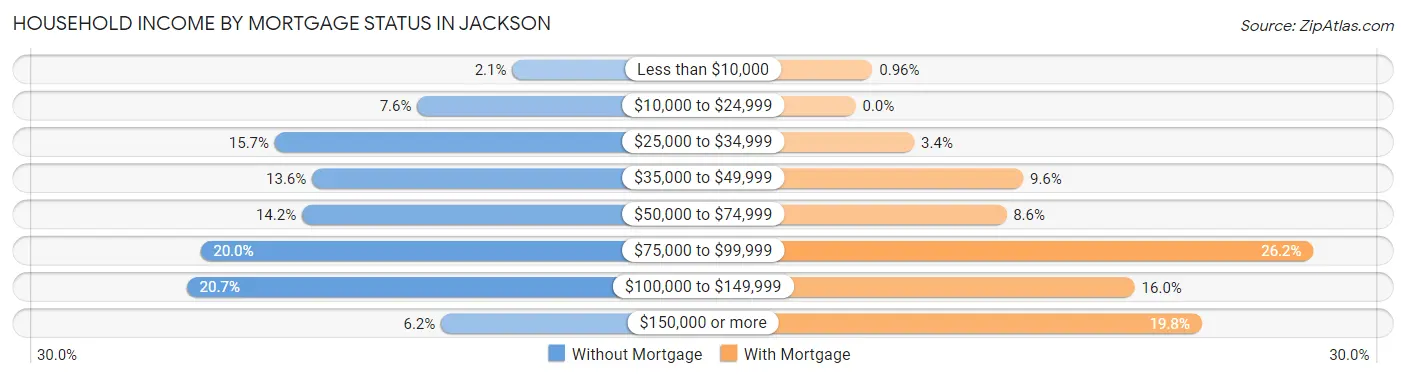
| Household Income | Without Mortgage | With Mortgage |
| Less than $10,000 | 11 (2.1%) | 6 (1.0%) |
| $10,000 to $24,999 | 39 (7.6%) | 0 (0.0%) |
| $25,000 to $34,999 | 81 (15.7%) | 21 (3.4%) |
| $35,000 to $49,999 | 70 (13.6%) | 60 (9.6%) |
| $50,000 to $74,999 | 73 (14.1%) | 54 (8.6%) |
| $75,000 to $99,999 | 103 (20.0%) | 164 (26.2%) |
| $100,000 to $149,999 | 107 (20.7%) | 100 (16.0%) |
| $150,000 or more | 32 (6.2%) | 124 (19.8%) |
| Total | 516 (100.0%) | 627 (100.0%) |
Property Value to Household Income Ratio in Jackson
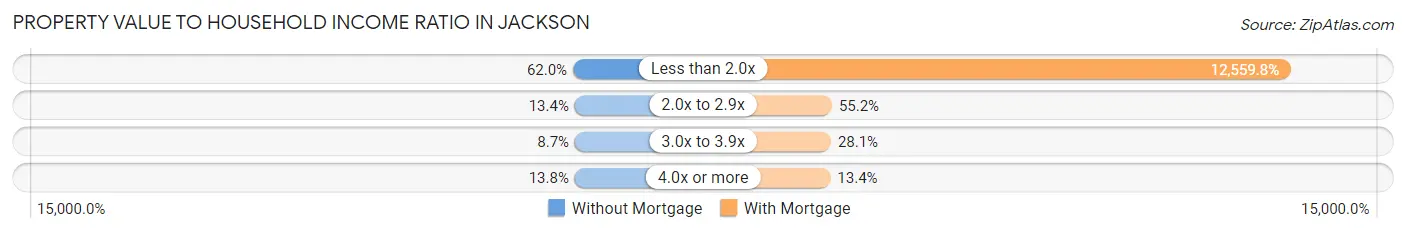
| Value-to-Income Ratio | Without Mortgage | With Mortgage |
| Less than 2.0x | 320 (62.0%) | 78,750 (12,559.8%) |
| 2.0x to 2.9x | 69 (13.4%) | 346 (55.2%) |
| 3.0x to 3.9x | 45 (8.7%) | 176 (28.1%) |
| 4.0x or more | 71 (13.8%) | 84 (13.4%) |
| Total | 516 (100.0%) | 627 (100.0%) |
Real Estate Taxes by Mortgage Status in Jackson
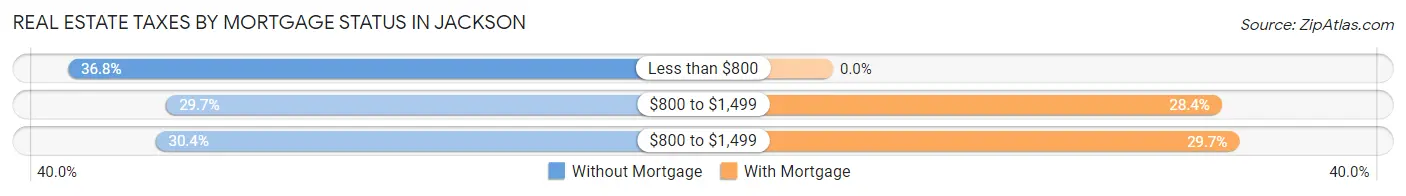
| Property Taxes | Without Mortgage | With Mortgage |
| Less than $800 | 190 (36.8%) | 0 (0.0%) |
| $800 to $1,499 | 153 (29.6%) | 178 (28.4%) |
| $800 to $1,499 | 157 (30.4%) | 186 (29.7%) |
| Total | 516 (100.0%) | 627 (100.0%) |
Health & Disability in Jackson
Health Insurance Coverage by Age in Jackson
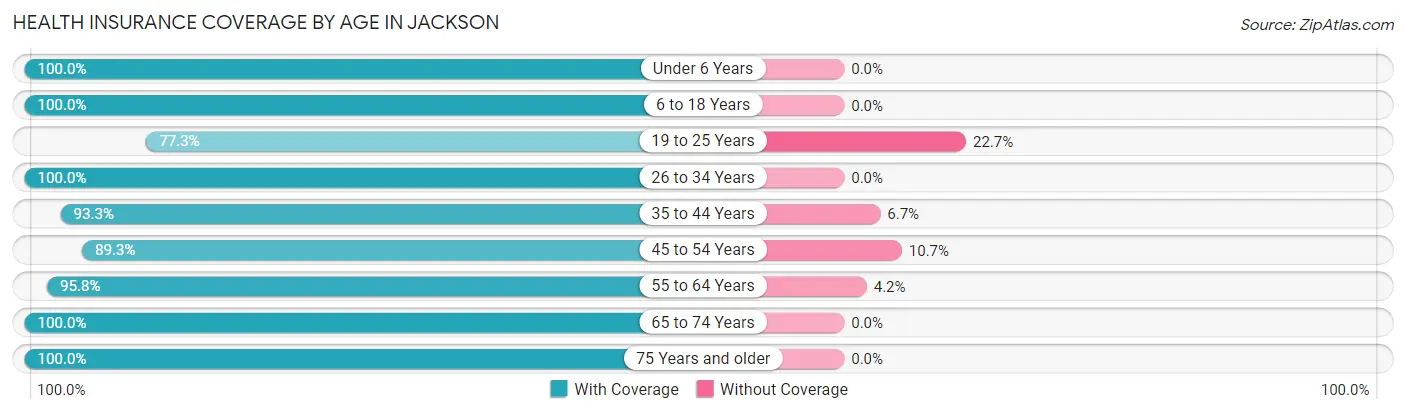
| Age Bracket | With Coverage | Without Coverage |
| Under 6 Years | 285 (100.0%) | 0 (0.0%) |
| 6 to 18 Years | 328 (100.0%) | 0 (0.0%) |
| 19 to 25 Years | 286 (77.3%) | 84 (22.7%) |
| 26 to 34 Years | 262 (100.0%) | 0 (0.0%) |
| 35 to 44 Years | 319 (93.3%) | 23 (6.7%) |
| 45 to 54 Years | 391 (89.3%) | 47 (10.7%) |
| 55 to 64 Years | 435 (95.8%) | 19 (4.2%) |
| 65 to 74 Years | 459 (100.0%) | 0 (0.0%) |
| 75 Years and older | 295 (100.0%) | 0 (0.0%) |
| Total | 3,060 (94.7%) | 173 (5.3%) |
Health Insurance Coverage by Citizenship Status in Jackson
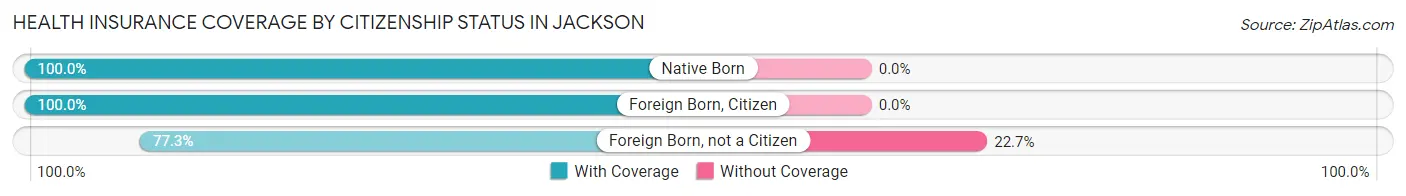
| Citizenship Status | With Coverage | Without Coverage |
| Native Born | 285 (100.0%) | 0 (0.0%) |
| Foreign Born, Citizen | 328 (100.0%) | 0 (0.0%) |
| Foreign Born, not a Citizen | 286 (77.3%) | 84 (22.7%) |
Health Insurance Coverage by Household Income in Jackson
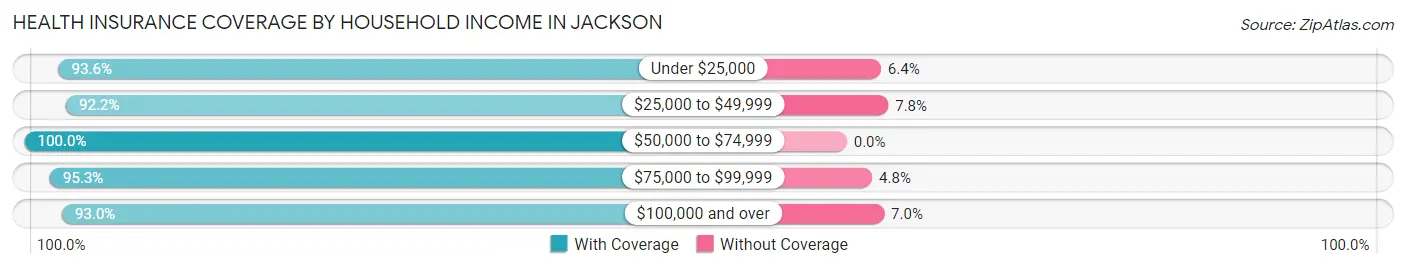
| Household Income | With Coverage | Without Coverage |
| Under $25,000 | 527 (93.6%) | 36 (6.4%) |
| $25,000 to $49,999 | 487 (92.2%) | 41 (7.8%) |
| $50,000 to $74,999 | 601 (100.0%) | 0 (0.0%) |
| $75,000 to $99,999 | 481 (95.3%) | 24 (4.8%) |
| $100,000 and over | 956 (93.0%) | 72 (7.0%) |
Public vs Private Health Insurance Coverage by Age in Jackson
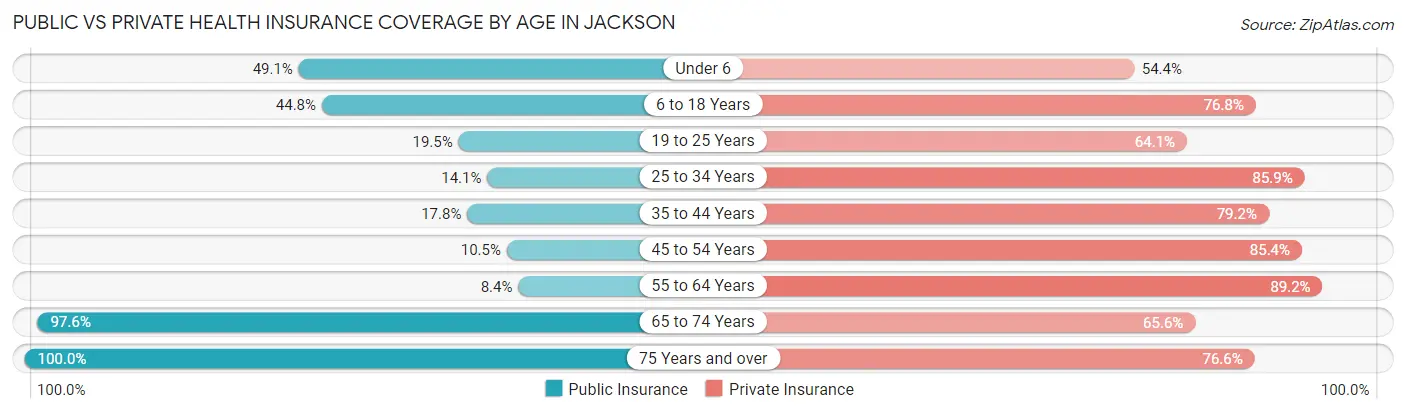
| Age Bracket | Public Insurance | Private Insurance |
| Under 6 | 140 (49.1%) | 155 (54.4%) |
| 6 to 18 Years | 147 (44.8%) | 252 (76.8%) |
| 19 to 25 Years | 72 (19.5%) | 237 (64.0%) |
| 25 to 34 Years | 37 (14.1%) | 225 (85.9%) |
| 35 to 44 Years | 61 (17.8%) | 271 (79.2%) |
| 45 to 54 Years | 46 (10.5%) | 374 (85.4%) |
| 55 to 64 Years | 38 (8.4%) | 405 (89.2%) |
| 65 to 74 Years | 448 (97.6%) | 301 (65.6%) |
| 75 Years and over | 295 (100.0%) | 226 (76.6%) |
| Total | 1,284 (39.7%) | 2,446 (75.7%) |
Disability Status by Sex by Age in Jackson
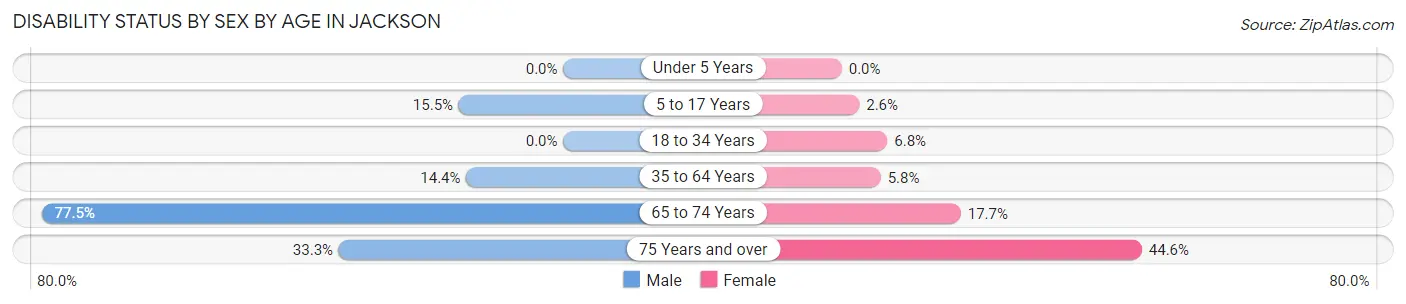
| Age Bracket | Male | Female |
| Under 5 Years | 0 (0.0%) | 0 (0.0%) |
| 5 to 17 Years | 29 (15.5%) | 5 (2.6%) |
| 18 to 34 Years | 0 (0.0%) | 19 (6.8%) |
| 35 to 64 Years | 88 (14.4%) | 36 (5.8%) |
| 65 to 74 Years | 189 (77.5%) | 38 (17.7%) |
| 75 Years and over | 34 (33.3%) | 86 (44.6%) |
Disability Class by Sex by Age in Jackson
Disability Class: Hearing Difficulty
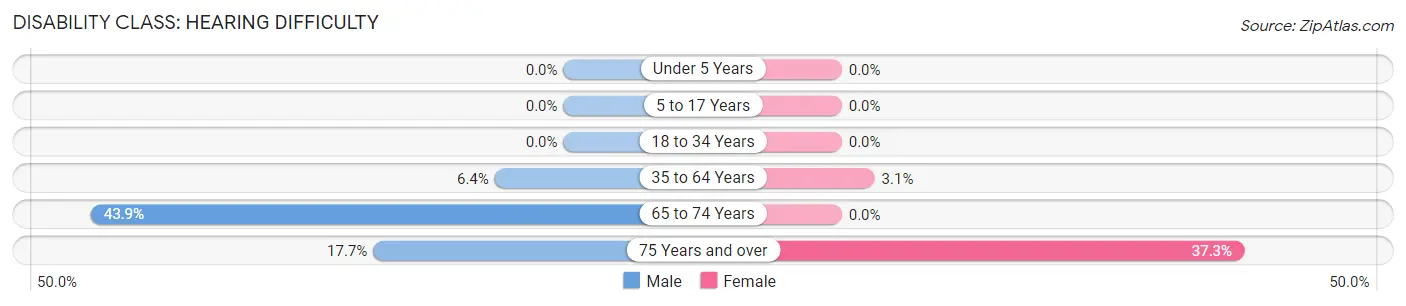
| Age Bracket | Male | Female |
| Under 5 Years | 0 (0.0%) | 0 (0.0%) |
| 5 to 17 Years | 0 (0.0%) | 0 (0.0%) |
| 18 to 34 Years | 0 (0.0%) | 0 (0.0%) |
| 35 to 64 Years | 39 (6.4%) | 19 (3.0%) |
| 65 to 74 Years | 107 (43.9%) | 0 (0.0%) |
| 75 Years and over | 18 (17.6%) | 72 (37.3%) |
Disability Class: Vision Difficulty
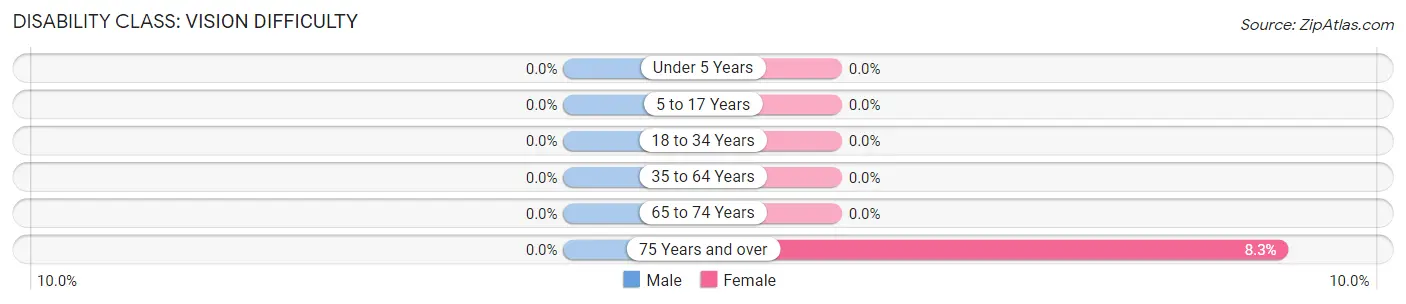
| Age Bracket | Male | Female |
| Under 5 Years | 0 (0.0%) | 0 (0.0%) |
| 5 to 17 Years | 0 (0.0%) | 0 (0.0%) |
| 18 to 34 Years | 0 (0.0%) | 0 (0.0%) |
| 35 to 64 Years | 0 (0.0%) | 0 (0.0%) |
| 65 to 74 Years | 0 (0.0%) | 0 (0.0%) |
| 75 Years and over | 0 (0.0%) | 16 (8.3%) |
Disability Class: Cognitive Difficulty
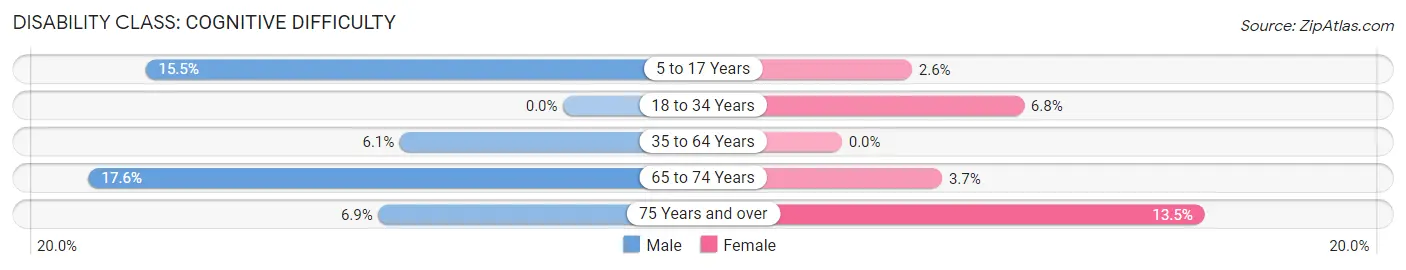
| Age Bracket | Male | Female |
| 5 to 17 Years | 29 (15.5%) | 5 (2.6%) |
| 18 to 34 Years | 0 (0.0%) | 19 (6.8%) |
| 35 to 64 Years | 37 (6.1%) | 0 (0.0%) |
| 65 to 74 Years | 43 (17.6%) | 8 (3.7%) |
| 75 Years and over | 7 (6.9%) | 26 (13.5%) |
Disability Class: Ambulatory Difficulty
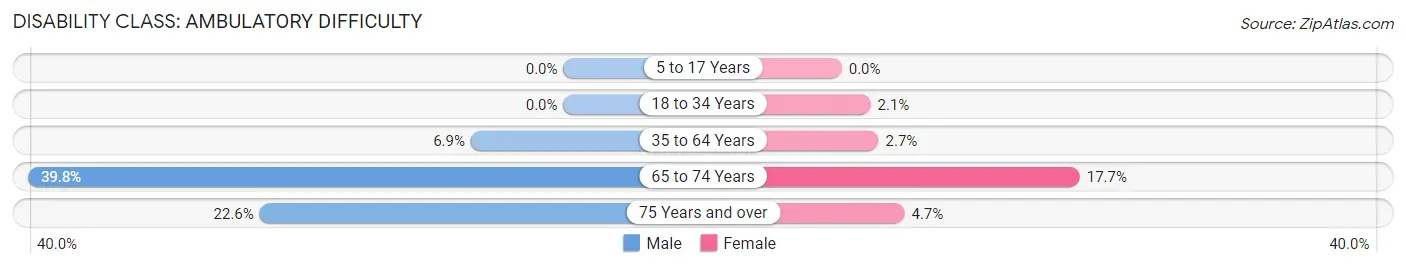
| Age Bracket | Male | Female |
| 5 to 17 Years | 0 (0.0%) | 0 (0.0%) |
| 18 to 34 Years | 0 (0.0%) | 6 (2.1%) |
| 35 to 64 Years | 42 (6.9%) | 17 (2.7%) |
| 65 to 74 Years | 97 (39.8%) | 38 (17.7%) |
| 75 Years and over | 23 (22.6%) | 9 (4.7%) |
Disability Class: Self-Care Difficulty
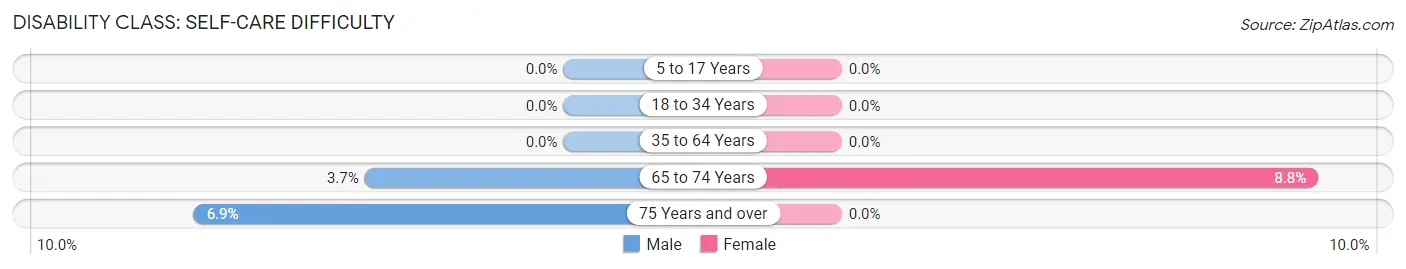
| Age Bracket | Male | Female |
| 5 to 17 Years | 0 (0.0%) | 0 (0.0%) |
| 18 to 34 Years | 0 (0.0%) | 0 (0.0%) |
| 35 to 64 Years | 0 (0.0%) | 0 (0.0%) |
| 65 to 74 Years | 9 (3.7%) | 19 (8.8%) |
| 75 Years and over | 7 (6.9%) | 0 (0.0%) |
Technology Access in Jackson
Computing Device Access in Jackson
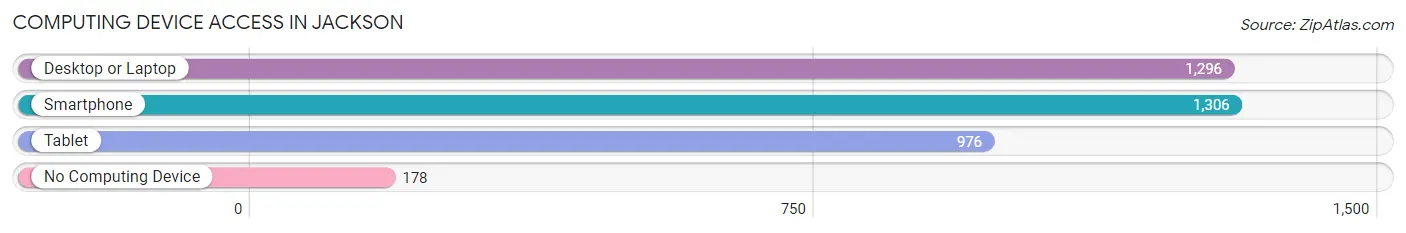
| Device Type | # Households | % Households |
| Desktop or Laptop | 1,296 | 80.5% |
| Smartphone | 1,306 | 81.2% |
| Tablet | 976 | 60.7% |
| No Computing Device | 178 | 11.1% |
| Total | 1,609 | 100.0% |
Internet Access in Jackson
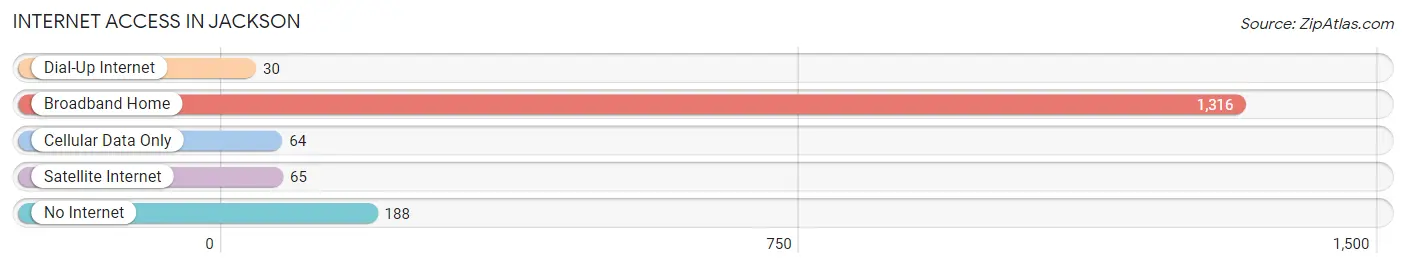
| Internet Type | # Households | % Households |
| Dial-Up Internet | 30 | 1.9% |
| Broadband Home | 1,316 | 81.8% |
| Cellular Data Only | 64 | 4.0% |
| Satellite Internet | 65 | 4.0% |
| No Internet | 188 | 11.7% |
| Total | 1,609 | 100.0% |
Jackson Summary
Jackson, Minnesota is a small city located in the southwestern corner of the state, near the Iowa border. It is the county seat of Jackson County and has a population of just over 4,000 people. The city is known for its rural charm and its strong sense of community.
History
Jackson was founded in 1856 by a group of settlers from Wisconsin. The city was named after President Andrew Jackson, who had recently died. The settlers were attracted to the area by its fertile soil and abundant natural resources. The city was incorporated in 1872 and quickly grew to become an important agricultural center.
In the late 19th century, Jackson was a major producer of wheat, corn, and other grains. The city also had a thriving lumber industry, with several sawmills located in the area. In the early 20th century, Jackson began to diversify its economy, with the establishment of several manufacturing plants.
Geography
Jackson is located in the southwestern corner of Minnesota, near the Iowa border. The city is situated on the banks of the Des Moines River, which flows through the city. The city is surrounded by rolling hills and farmland, and is located in the midst of the Minnesota River Valley.
The climate in Jackson is typical of the Midwest, with hot summers and cold winters. The average temperature in the summer is around 75 degrees Fahrenheit, while the average temperature in the winter is around 20 degrees Fahrenheit.
Economy
Jackson’s economy is largely based on agriculture and manufacturing. The city is home to several large agricultural companies, including Cargill, Land O’Lakes, and CHS. The city also has several manufacturing plants, including a paper mill and a plastics plant.
In addition to agriculture and manufacturing, Jackson also has a thriving tourism industry. The city is home to several popular attractions, including the Jackson County Historical Museum, the Jackson County Fairgrounds, and the Jackson County Speedway.
Demographics
As of the 2010 census, Jackson had a population of 4,077 people. The racial makeup of the city was 95.3% White, 0.7% African American, 0.3% Native American, 0.3% Asian, 0.1% Pacific Islander, and 2.3% from other races. The median household income in Jackson was $41,945, and the median family income was $50,945.
Jackson is a small city with a strong sense of community. The city is home to several churches, schools, and other organizations that help to foster a sense of community. The city also has a vibrant arts and culture scene, with several galleries, theaters, and other venues.
Common Questions
What is Per Capita Income in Jackson?
Per Capita income in Jackson is $35,917.
What is the Median Family Income in Jackson?
Median Family Income in Jackson is $74,714.
What is the Median Household income in Jackson?
Median Household Income in Jackson is $65,531.
What is Income or Wage Gap in Jackson?
Income or Wage Gap in Jackson is 20.3%.
Women in Jackson earn 79.7 cents for every dollar earned by a man.
What is Inequality or Gini Index in Jackson?
Inequality or Gini Index in Jackson is 0.39.
What is the Total Population of Jackson?
Total Population of Jackson is 3,301.
What is the Total Male Population of Jackson?
Total Male Population of Jackson is 1,637.
What is the Total Female Population of Jackson?
Total Female Population of Jackson is 1,664.
What is the Ratio of Males per 100 Females in Jackson?
There are 98.38 Males per 100 Females in Jackson.
What is the Ratio of Females per 100 Males in Jackson?
There are 101.65 Females per 100 Males in Jackson.
What is the Median Population Age in Jackson?
Median Population Age in Jackson is 46.9 Years.
What is the Average Family Size in Jackson
Average Family Size in Jackson is 2.8 People.
What is the Average Household Size in Jackson
Average Household Size in Jackson is 2.0 People.
How Large is the Labor Force in Jackson?
There are 1,785 People in the Labor Forcein in Jackson.
What is the Percentage of People in the Labor Force in Jackson?
64.0% of People are in the Labor Force in Jackson.
What is the Unemployment Rate in Jackson?
Unemployment Rate in Jackson is 3.0%.