Sandstone, MN Map & Demographics
Sandstone Map
Sandstone Overview
$16,701
PER CAPITA INCOME
$50,833
AVG FAMILY INCOME
$39,602
AVG HOUSEHOLD INCOME
32.0%
WAGE / INCOME GAP [ % ]
68.0¢/ $1
WAGE / INCOME GAP [ $ ]
0.46
INEQUALITY / GINI INDEX
2,566
TOTAL POPULATION
1,686
MALE POPULATION
880
FEMALE POPULATION
191.59
MALES / 100 FEMALES
52.19
FEMALES / 100 MALES
39.6
MEDIAN AGE
3.1
AVG FAMILY SIZE
2.4
AVG HOUSEHOLD SIZE
662
LABOR FORCE [ PEOPLE ]
29.4%
PERCENT IN LABOR FORCE
5.4%
UNEMPLOYMENT RATE
Sandstone Zip Codes
Sandstone Area Codes
Income in Sandstone
Income Overview in Sandstone
Per Capita Income in Sandstone is $16,701, while median incomes of families and households are $50,833 and $39,602 respectively.
| Characteristic | Number | Measure |
| Per Capita Income | 2,566 | $16,701 |
| Median Family Income | 322 | $50,833 |
| Mean Family Income | 322 | $63,233 |
| Median Household Income | 661 | $39,602 |
| Mean Household Income | 661 | $52,252 |
| Income Deficit | 322 | $0 |
| Wage / Income Gap (%) | 2,566 | 32.00% |
| Wage / Income Gap ($) | 2,566 | 68.00¢ per $1 |
| Gini / Inequality Index | 2,566 | 0.46 |
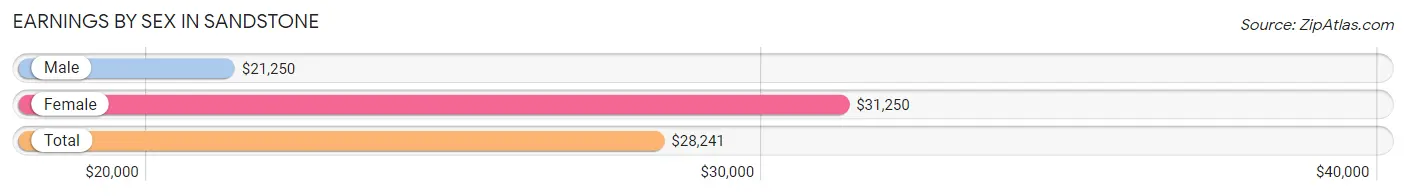
Earnings by Sex in Sandstone
Average Earnings in Sandstone are $28,241, $21,250 for men and $31,250 for women, a difference of 32.0%.
| Sex | Number | Average Earnings |
| Male | 627 (65.4%) | $21,250 |
| Female | 331 (34.5%) | $31,250 |
| Total | 958 (100.0%) | $28,241 |
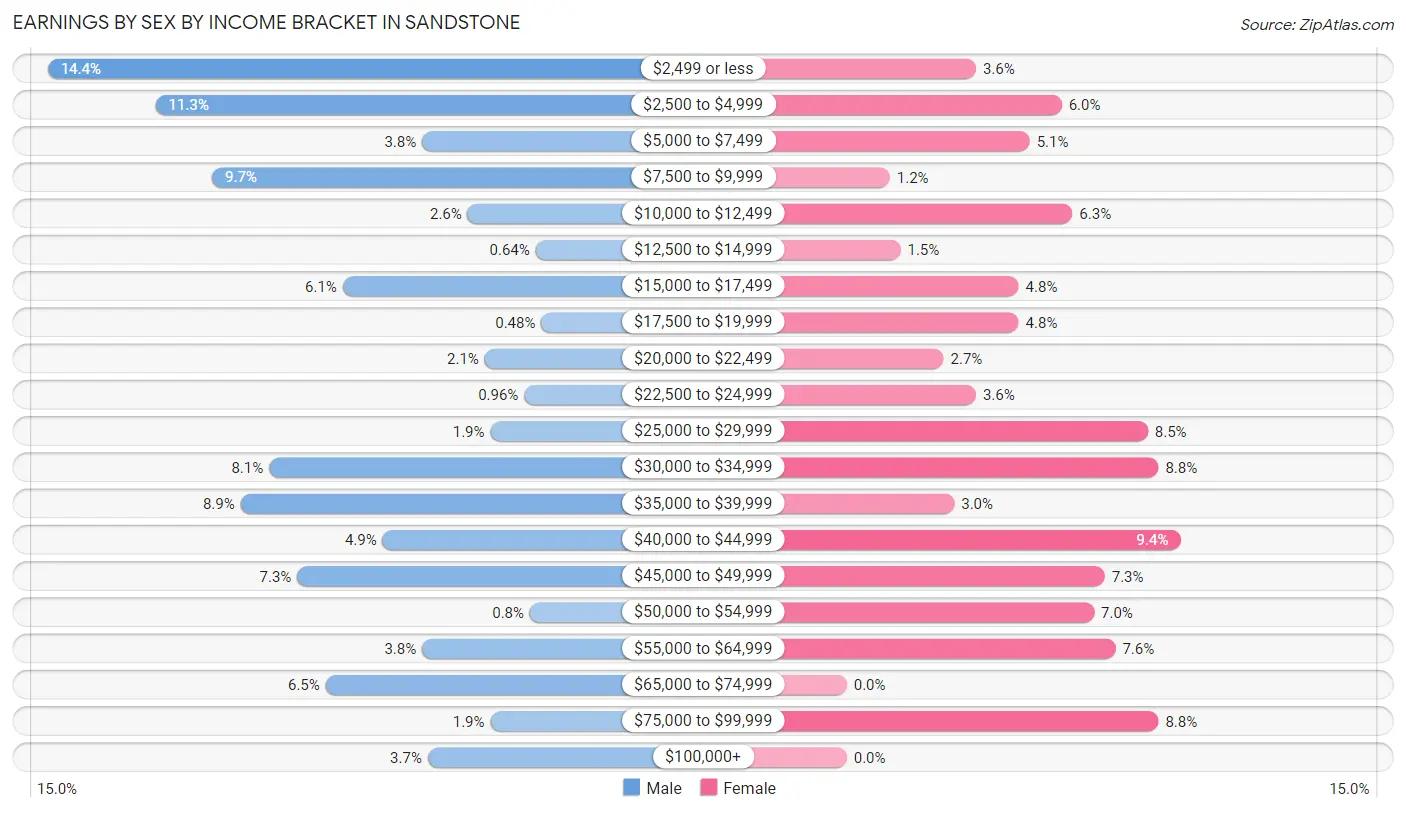
Earnings by Sex by Income Bracket in Sandstone
The most common earnings brackets in Sandstone are $2,499 or less for men (90 | 14.3%) and $40,000 to $44,999 for women (31 | 9.4%).
| Income | Male | Female |
| $2,499 or less | 90 (14.3%) | 12 (3.6%) |
| $2,500 to $4,999 | 71 (11.3%) | 20 (6.0%) |
| $5,000 to $7,499 | 24 (3.8%) | 17 (5.1%) |
| $7,500 to $9,999 | 61 (9.7%) | 4 (1.2%) |
| $10,000 to $12,499 | 16 (2.5%) | 21 (6.3%) |
| $12,500 to $14,999 | 4 (0.6%) | 5 (1.5%) |
| $15,000 to $17,499 | 38 (6.1%) | 16 (4.8%) |
| $17,500 to $19,999 | 3 (0.5%) | 16 (4.8%) |
| $20,000 to $22,499 | 13 (2.1%) | 9 (2.7%) |
| $22,500 to $24,999 | 6 (1.0%) | 12 (3.6%) |
| $25,000 to $29,999 | 12 (1.9%) | 28 (8.5%) |
| $30,000 to $34,999 | 51 (8.1%) | 29 (8.8%) |
| $35,000 to $39,999 | 56 (8.9%) | 10 (3.0%) |
| $40,000 to $44,999 | 31 (4.9%) | 31 (9.4%) |
| $45,000 to $49,999 | 46 (7.3%) | 24 (7.2%) |
| $50,000 to $54,999 | 5 (0.8%) | 23 (7.0%) |
| $55,000 to $64,999 | 24 (3.8%) | 25 (7.5%) |
| $65,000 to $74,999 | 41 (6.5%) | 0 (0.0%) |
| $75,000 to $99,999 | 12 (1.9%) | 29 (8.8%) |
| $100,000+ | 23 (3.7%) | 0 (0.0%) |
| Total | 627 (100.0%) | 331 (100.0%) |
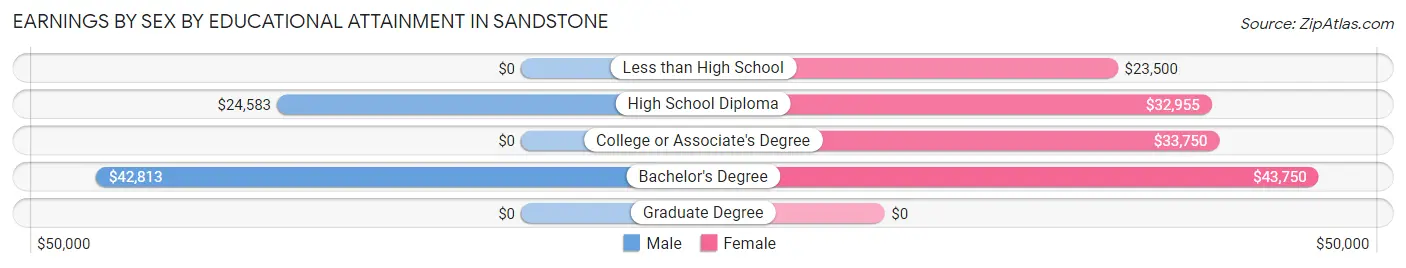
Earnings by Sex by Educational Attainment in Sandstone
Average earnings in Sandstone are $27,500 for men and $34,306 for women, a difference of 19.8%. Men with an educational attainment of bachelor's degree enjoy the highest average annual earnings of $42,813, while those with high school diploma education earn the least with $24,583. Women with an educational attainment of bachelor's degree earn the most with the average annual earnings of $43,750, while those with less than high school education have the smallest earnings of $23,500.
| Educational Attainment | Male Income | Female Income |
| Less than High School | - | - |
| High School Diploma | $24,583 | $32,955 |
| College or Associate's Degree | - | - |
| Bachelor's Degree | $42,813 | $43,750 |
| Graduate Degree | - | - |
| Total | $27,500 | $34,306 |
Family Income in Sandstone
Family Income Brackets in Sandstone
According to the Sandstone family income data, there are 72 families falling into the $25,000 to $34,999 income range, which is the most common income bracket and makes up 22.4% of all families. Conversely, the $10,000 to $14,999 income bracket is the least frequent group with only 3 families (0.9%) belonging to this category.
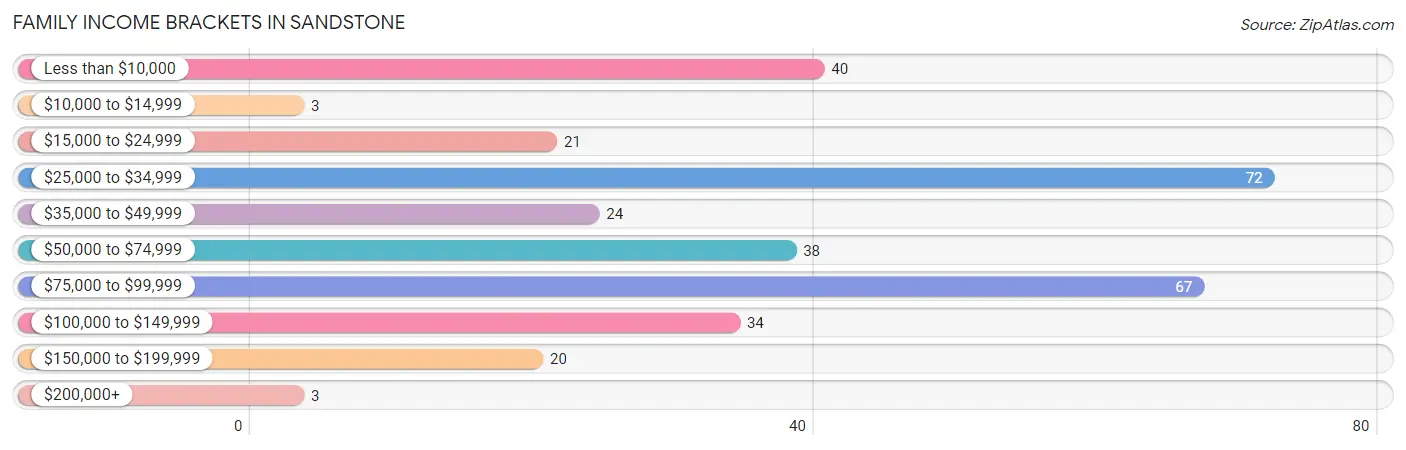
| Income Bracket | # Families | % Families |
| Less than $10,000 | 40 | 12.4% |
| $10,000 to $14,999 | 3 | 0.9% |
| $15,000 to $24,999 | 21 | 6.5% |
| $25,000 to $34,999 | 72 | 22.4% |
| $35,000 to $49,999 | 24 | 7.5% |
| $50,000 to $74,999 | 38 | 11.8% |
| $75,000 to $99,999 | 67 | 20.8% |
| $100,000 to $149,999 | 34 | 10.6% |
| $150,000 to $199,999 | 20 | 6.2% |
| $200,000+ | 3 | 0.9% |
Family Income by Famaliy Size in Sandstone
4-person families (43 | 13.4%) account for the highest median family income in Sandstone with $77,292 per family, while 4-person families (43 | 13.4%) have the highest median income of $19,323 per family member.
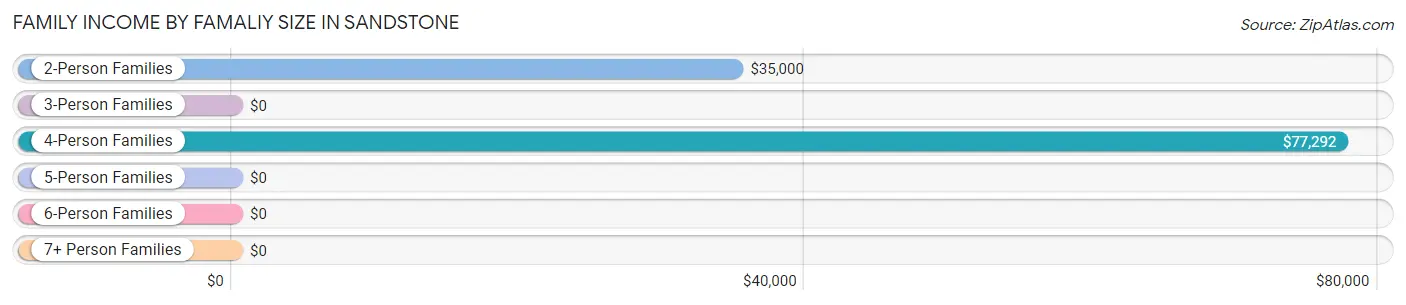
| Income Bracket | # Families | Median Income |
| 2-Person Families | 170 (52.8%) | $35,000 |
| 3-Person Families | 67 (20.8%) | $0 |
| 4-Person Families | 43 (13.4%) | $77,292 |
| 5-Person Families | 38 (11.8%) | $0 |
| 6-Person Families | 4 (1.2%) | $0 |
| 7+ Person Families | 0 (0.0%) | $0 |
| Total | 322 (100.0%) | $50,833 |
Family Income by Number of Earners in Sandstone
The median family income in Sandstone is $50,833, with families comprising 3+ earners (38) having the highest median family income of $144,375, while families with no earners (90) have the lowest median family income of $28,750, accounting for 11.8% and 28.0% of families, respectively.
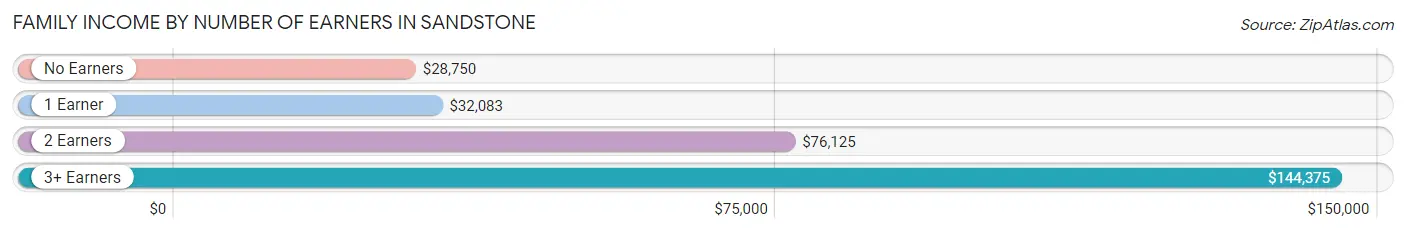
| Number of Earners | # Families | Median Income |
| No Earners | 90 (28.0%) | $28,750 |
| 1 Earner | 104 (32.3%) | $32,083 |
| 2 Earners | 90 (28.0%) | $76,125 |
| 3+ Earners | 38 (11.8%) | $144,375 |
| Total | 322 (100.0%) | $50,833 |
Household Income in Sandstone
Household Income Brackets in Sandstone
With 96 households falling in the category, the $75,000 to $99,999 income range is the most frequent in Sandstone, accounting for 14.5% of all households. In contrast, only 3 households (0.4%) fall into the $200,000+ income bracket, making it the least populous group.
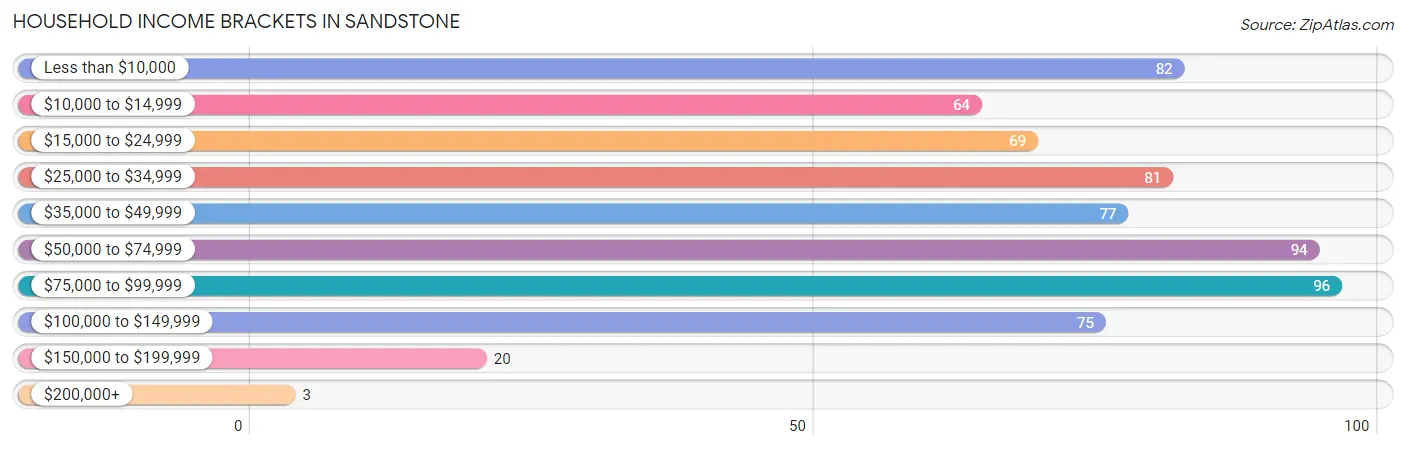
| Income Bracket | # Households | % Households |
| Less than $10,000 | 82 | 12.4% |
| $10,000 to $14,999 | 64 | 9.7% |
| $15,000 to $24,999 | 69 | 10.4% |
| $25,000 to $34,999 | 81 | 12.3% |
| $35,000 to $49,999 | 77 | 11.6% |
| $50,000 to $74,999 | 94 | 14.2% |
| $75,000 to $99,999 | 96 | 14.5% |
| $100,000 to $149,999 | 75 | 11.3% |
| $150,000 to $199,999 | 20 | 3.0% |
| $200,000+ | 3 | 0.5% |
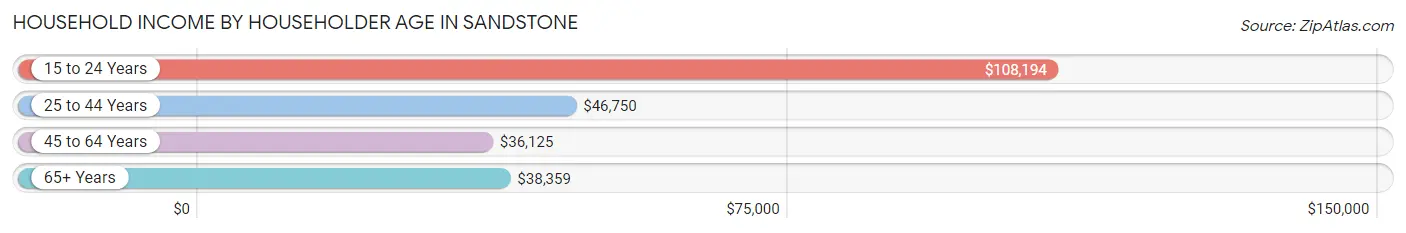
Household Income by Householder Age in Sandstone
The median household income in Sandstone is $39,602, with the highest median household income of $108,194 found in the 15 to 24 years age bracket for the primary householder. A total of 13 households (2.0%) fall into this category. Meanwhile, the 45 to 64 years age bracket for the primary householder has the lowest median household income of $36,125, with 227 households (34.3%) in this group.
| Income Bracket | # Households | Median Income |
| 15 to 24 Years | 13 (2.0%) | $108,194 |
| 25 to 44 Years | 186 (28.1%) | $46,750 |
| 45 to 64 Years | 227 (34.3%) | $36,125 |
| 65+ Years | 235 (35.5%) | $38,359 |
| Total | 661 (100.0%) | $39,602 |
Poverty in Sandstone
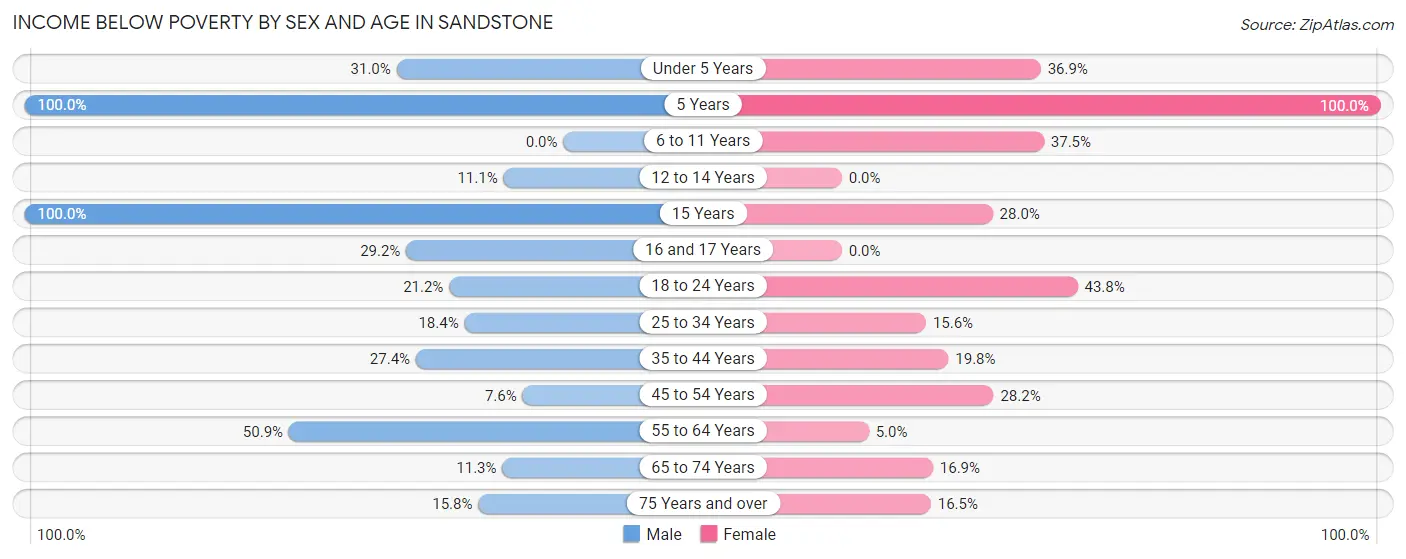
Income Below Poverty by Sex and Age in Sandstone
With 23.8% poverty level for males and 23.0% for females among the residents of Sandstone, 5 year old males and 5 year old females are the most vulnerable to poverty, with 3 males (100.0%) and 6 females (100.0%) in their respective age groups living below the poverty level.
| Age Bracket | Male | Female |
| Under 5 Years | 13 (30.9%) | 24 (36.9%) |
| 5 Years | 3 (100.0%) | 6 (100.0%) |
| 6 to 11 Years | 0 (0.0%) | 18 (37.5%) |
| 12 to 14 Years | 4 (11.1%) | 0 (0.0%) |
| 15 Years | 4 (100.0%) | 7 (28.0%) |
| 16 and 17 Years | 7 (29.2%) | 0 (0.0%) |
| 18 to 24 Years | 25 (21.2%) | 35 (43.8%) |
| 25 to 34 Years | 20 (18.3%) | 15 (15.6%) |
| 35 to 44 Years | 26 (27.4%) | 18 (19.8%) |
| 45 to 54 Years | 5 (7.6%) | 29 (28.2%) |
| 55 to 64 Years | 54 (50.9%) | 4 (5.0%) |
| 65 to 74 Years | 6 (11.3%) | 12 (16.9%) |
| 75 Years and over | 9 (15.8%) | 19 (16.5%) |
| Total | 176 (23.8%) | 187 (23.0%) |
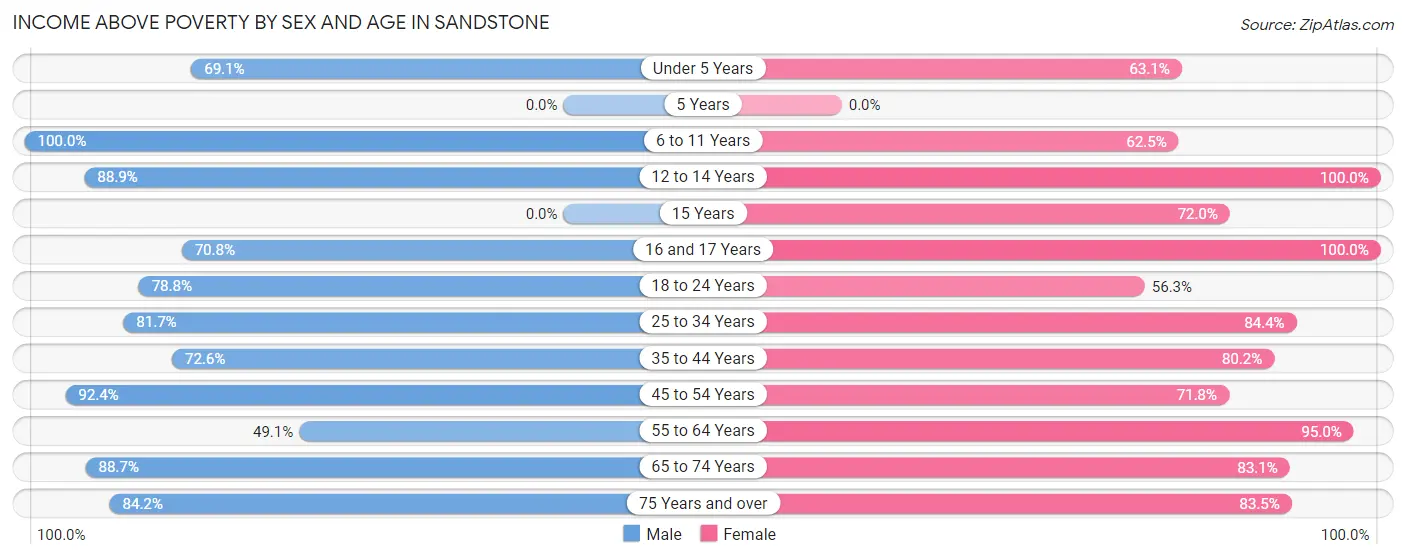
Income Above Poverty by Sex and Age in Sandstone
According to the poverty statistics in Sandstone, males aged 6 to 11 years and females aged 12 to 14 years are the age groups that are most secure financially, with 100.0% of males and 100.0% of females in these age groups living above the poverty line.
| Age Bracket | Male | Female |
| Under 5 Years | 29 (69.1%) | 41 (63.1%) |
| 5 Years | 0 (0.0%) | 0 (0.0%) |
| 6 to 11 Years | 26 (100.0%) | 30 (62.5%) |
| 12 to 14 Years | 32 (88.9%) | 18 (100.0%) |
| 15 Years | 0 (0.0%) | 18 (72.0%) |
| 16 and 17 Years | 17 (70.8%) | 15 (100.0%) |
| 18 to 24 Years | 93 (78.8%) | 45 (56.2%) |
| 25 to 34 Years | 89 (81.7%) | 81 (84.4%) |
| 35 to 44 Years | 69 (72.6%) | 73 (80.2%) |
| 45 to 54 Years | 61 (92.4%) | 74 (71.8%) |
| 55 to 64 Years | 52 (49.1%) | 76 (95.0%) |
| 65 to 74 Years | 47 (88.7%) | 59 (83.1%) |
| 75 Years and over | 48 (84.2%) | 96 (83.5%) |
| Total | 563 (76.2%) | 626 (77.0%) |
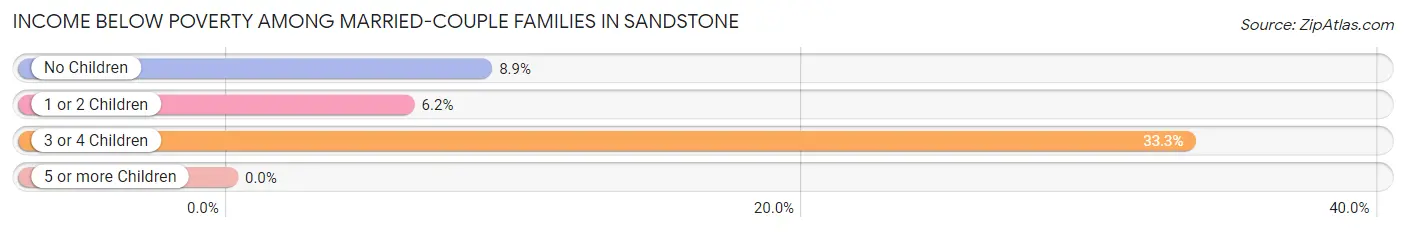
Income Below Poverty Among Married-Couple Families in Sandstone
The poverty statistics for married-couple families in Sandstone show that 9.5% or 18 of the total 190 families live below the poverty line. Families with 3 or 4 children have the highest poverty rate of 33.3%, comprising of 4 families. On the other hand, families with 1 or 2 children have the lowest poverty rate of 6.1%, which includes 4 families.
| Children | Above Poverty | Below Poverty |
| No Children | 103 (91.1%) | 10 (8.8%) |
| 1 or 2 Children | 61 (93.9%) | 4 (6.1%) |
| 3 or 4 Children | 8 (66.7%) | 4 (33.3%) |
| 5 or more Children | 0 (0.0%) | 0 (0.0%) |
| Total | 172 (90.5%) | 18 (9.5%) |
Income Below Poverty Among Single-Parent Households in Sandstone
According to the poverty data in Sandstone, 41.4% or 29 single-father households and 16.1% or 10 single-mother households are living below the poverty line. Among single-father households, those with 1 or 2 children have the highest poverty rate, with 26 households (46.4%) experiencing poverty. Likewise, among single-mother households, those with 1 or 2 children have the highest poverty rate, with 10 households (20.8%) falling below the poverty line.
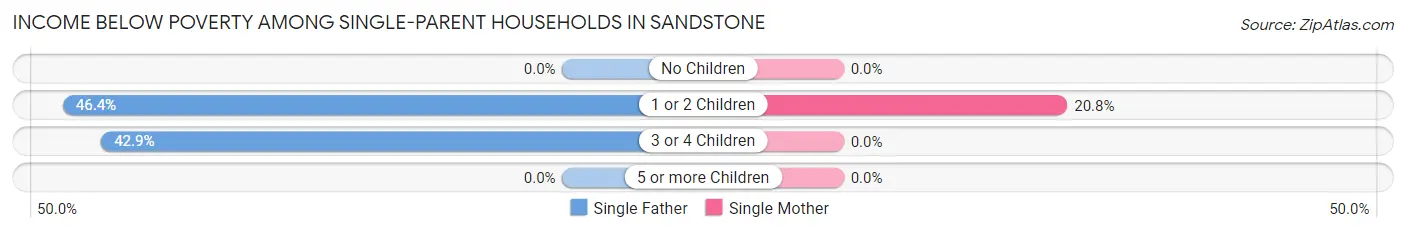
| Children | Single Father | Single Mother |
| No Children | 0 (0.0%) | 0 (0.0%) |
| 1 or 2 Children | 26 (46.4%) | 10 (20.8%) |
| 3 or 4 Children | 3 (42.9%) | 0 (0.0%) |
| 5 or more Children | 0 (0.0%) | 0 (0.0%) |
| Total | 29 (41.4%) | 10 (16.1%) |
Income Below Poverty Among Married-Couple vs Single-Parent Households in Sandstone
The poverty data for Sandstone shows that 18 of the married-couple family households (9.5%) and 39 of the single-parent households (29.5%) are living below the poverty level. Within the married-couple family households, those with 3 or 4 children have the highest poverty rate, with 4 households (33.3%) falling below the poverty line. Among the single-parent households, those with 3 or 4 children have the highest poverty rate, with 3 household (42.9%) living below poverty.
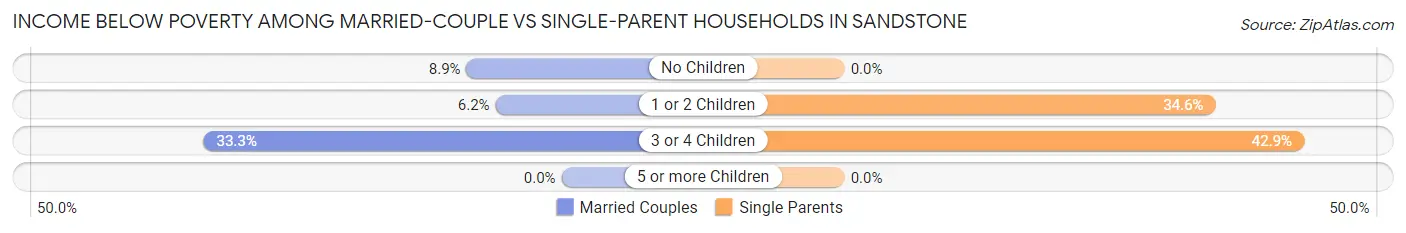
| Children | Married-Couple Families | Single-Parent Households |
| No Children | 10 (8.8%) | 0 (0.0%) |
| 1 or 2 Children | 4 (6.1%) | 36 (34.6%) |
| 3 or 4 Children | 4 (33.3%) | 3 (42.9%) |
| 5 or more Children | 0 (0.0%) | 0 (0.0%) |
| Total | 18 (9.5%) | 39 (29.5%) |
Race in Sandstone
The most populous races in Sandstone are White / Caucasian (2,004 | 78.1%), Hispanic or Latino (340 | 13.3%), and Black / African American (269 | 10.5%).
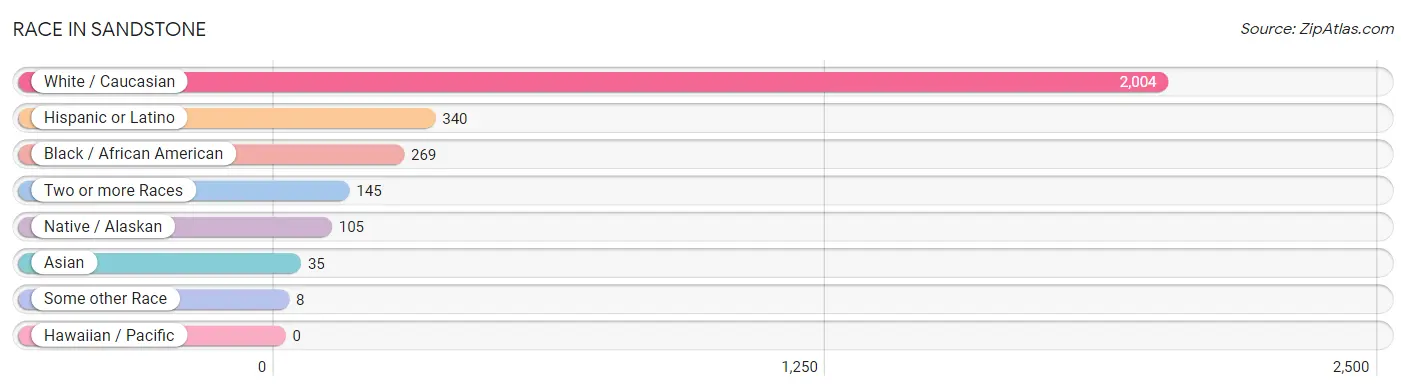
| Race | # Population | % Population |
| Asian | 35 | 1.4% |
| Black / African American | 269 | 10.5% |
| Hawaiian / Pacific | 0 | 0.0% |
| Hispanic or Latino | 340 | 13.3% |
| Native / Alaskan | 105 | 4.1% |
| White / Caucasian | 2,004 | 78.1% |
| Two or more Races | 145 | 5.7% |
| Some other Race | 8 | 0.3% |
| Total | 2,566 | 100.0% |
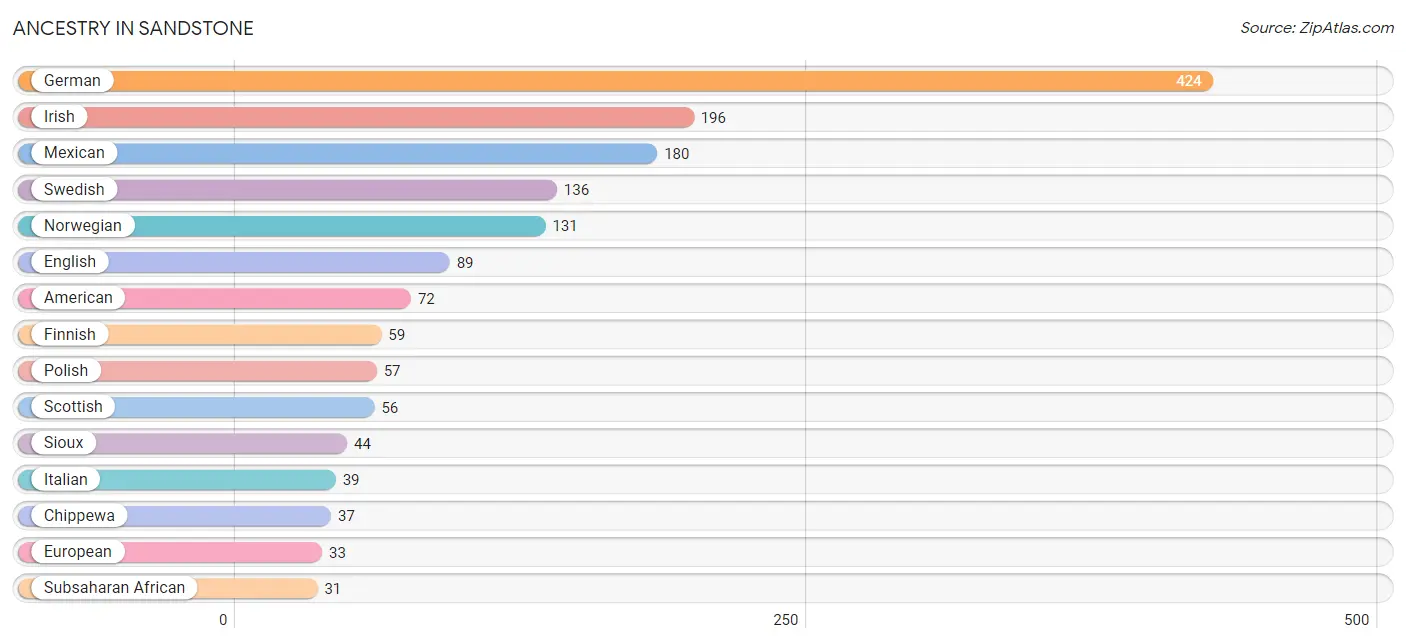
Ancestry in Sandstone
The most populous ancestries reported in Sandstone are German (424 | 16.5%), Irish (196 | 7.6%), Mexican (180 | 7.0%), Swedish (136 | 5.3%), and Norwegian (131 | 5.1%), together accounting for 41.6% of all Sandstone residents.
| Ancestry | # Population | % Population |
| African | 8 | 0.3% |
| American | 72 | 2.8% |
| Arab | 8 | 0.3% |
| Bangladeshi | 9 | 0.4% |
| Belgian | 3 | 0.1% |
| British | 3 | 0.1% |
| Burmese | 4 | 0.2% |
| Canadian | 3 | 0.1% |
| Chippewa | 37 | 1.4% |
| Cuban | 23 | 0.9% |
| Czech | 18 | 0.7% |
| Danish | 23 | 0.9% |
| Dutch | 15 | 0.6% |
| English | 89 | 3.5% |
| European | 33 | 1.3% |
| Finnish | 59 | 2.3% |
| French | 15 | 0.6% |
| French American Indian | 4 | 0.2% |
| French Canadian | 14 | 0.5% |
| German | 424 | 16.5% |
| Greek | 3 | 0.1% |
| Hungarian | 10 | 0.4% |
| Indian (Asian) | 8 | 0.3% |
| Irish | 196 | 7.6% |
| Italian | 39 | 1.5% |
| Korean | 2 | 0.1% |
| Liberian | 23 | 0.9% |
| Mexican | 180 | 7.0% |
| Moroccan | 8 | 0.3% |
| Norwegian | 131 | 5.1% |
| Polish | 57 | 2.2% |
| Russian | 6 | 0.2% |
| Scandinavian | 17 | 0.7% |
| Scotch-Irish | 2 | 0.1% |
| Scottish | 56 | 2.2% |
| Shoshone | 2 | 0.1% |
| Sioux | 44 | 1.7% |
| Slavic | 5 | 0.2% |
| Spaniard | 2 | 0.1% |
| Spanish | 10 | 0.4% |
| Subsaharan African | 31 | 1.2% |
| Swedish | 136 | 5.3% |
| Swiss | 6 | 0.2% |
| Welsh | 2 | 0.1% | View All 44 Rows |
Immigrants in Sandstone
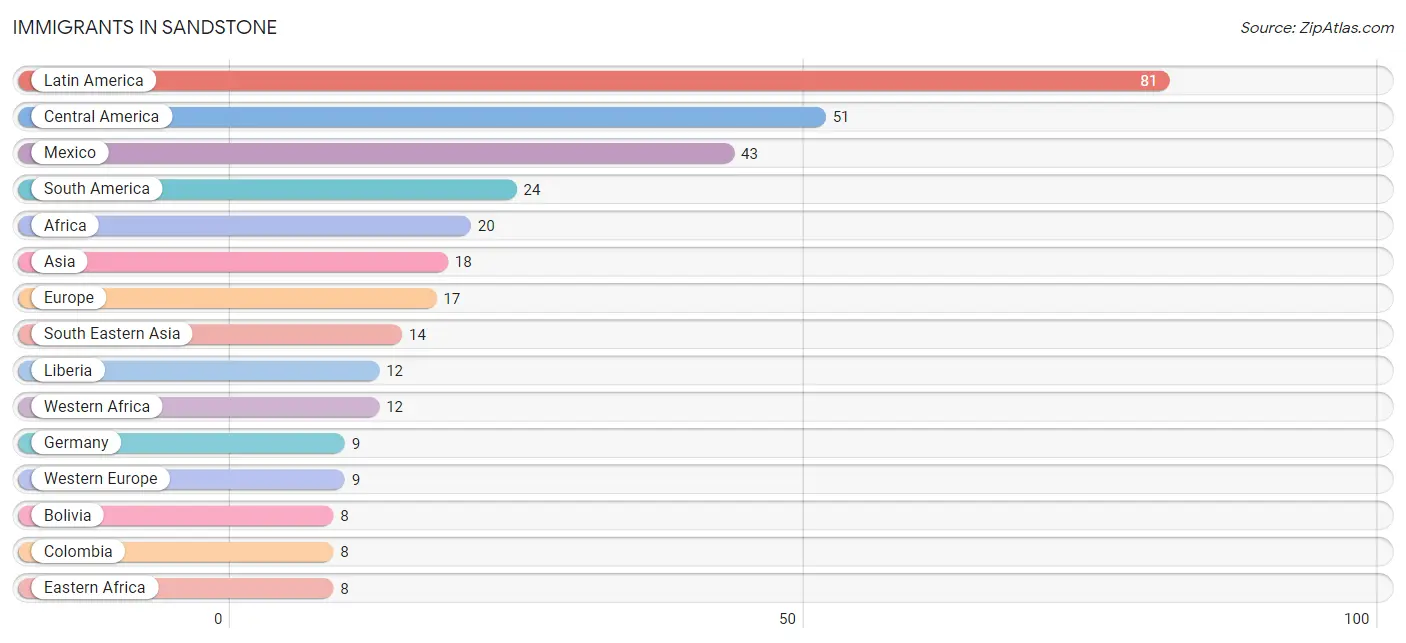
The most numerous immigrant groups reported in Sandstone came from Latin America (81 | 3.2%), Central America (51 | 2.0%), Mexico (43 | 1.7%), South America (24 | 0.9%), and Africa (20 | 0.8%), together accounting for 8.6% of all Sandstone residents.
| Immigration Origin | # Population | % Population |
| Africa | 20 | 0.8% |
| Asia | 18 | 0.7% |
| Bolivia | 8 | 0.3% |
| Canada | 7 | 0.3% |
| Caribbean | 6 | 0.2% |
| Central America | 51 | 2.0% |
| Colombia | 8 | 0.3% |
| Dominican Republic | 6 | 0.2% |
| Eastern Africa | 8 | 0.3% |
| Eastern Asia | 4 | 0.2% |
| Eastern Europe | 6 | 0.2% |
| Ecuador | 8 | 0.3% |
| Europe | 17 | 0.7% |
| Germany | 9 | 0.4% |
| Guatemala | 8 | 0.3% |
| Korea | 4 | 0.2% |
| Latin America | 81 | 3.2% |
| Liberia | 12 | 0.5% |
| Mexico | 43 | 1.7% |
| Poland | 3 | 0.1% |
| Somalia | 8 | 0.3% |
| South America | 24 | 0.9% |
| South Eastern Asia | 14 | 0.5% |
| Southern Europe | 2 | 0.1% |
| Spain | 2 | 0.1% |
| Thailand | 8 | 0.3% |
| Ukraine | 3 | 0.1% |
| Vietnam | 6 | 0.2% |
| Western Africa | 12 | 0.5% |
| Western Europe | 9 | 0.4% | View All 30 Rows |
Sex and Age in Sandstone
Sex and Age in Sandstone
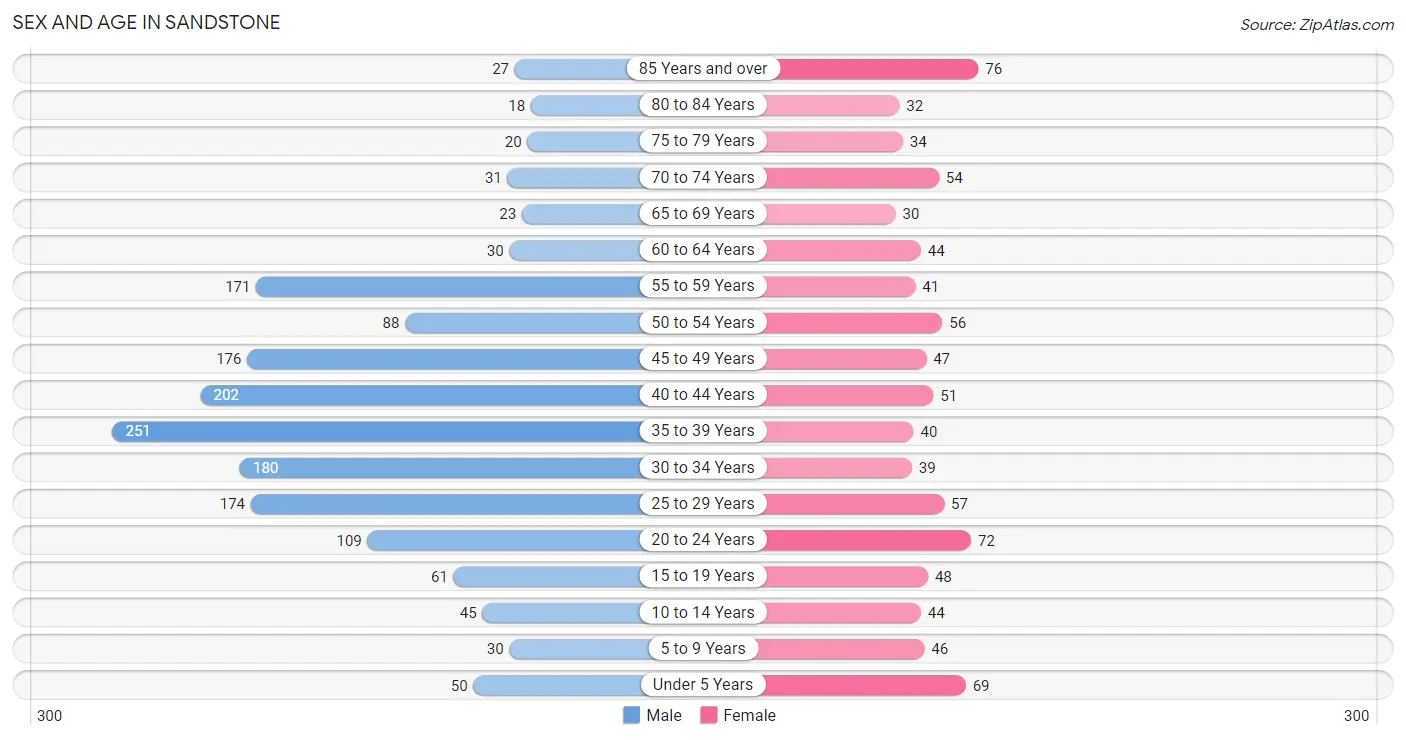
The most populous age groups in Sandstone are 35 to 39 Years (251 | 14.9%) for men and 85 Years and over (76 | 8.6%) for women.
| Age Bracket | Male | Female |
| Under 5 Years | 50 (3.0%) | 69 (7.8%) |
| 5 to 9 Years | 30 (1.8%) | 46 (5.2%) |
| 10 to 14 Years | 45 (2.7%) | 44 (5.0%) |
| 15 to 19 Years | 61 (3.6%) | 48 (5.4%) |
| 20 to 24 Years | 109 (6.5%) | 72 (8.2%) |
| 25 to 29 Years | 174 (10.3%) | 57 (6.5%) |
| 30 to 34 Years | 180 (10.7%) | 39 (4.4%) |
| 35 to 39 Years | 251 (14.9%) | 40 (4.5%) |
| 40 to 44 Years | 202 (12.0%) | 51 (5.8%) |
| 45 to 49 Years | 176 (10.4%) | 47 (5.3%) |
| 50 to 54 Years | 88 (5.2%) | 56 (6.4%) |
| 55 to 59 Years | 171 (10.1%) | 41 (4.7%) |
| 60 to 64 Years | 30 (1.8%) | 44 (5.0%) |
| 65 to 69 Years | 23 (1.4%) | 30 (3.4%) |
| 70 to 74 Years | 31 (1.8%) | 54 (6.1%) |
| 75 to 79 Years | 20 (1.2%) | 34 (3.9%) |
| 80 to 84 Years | 18 (1.1%) | 32 (3.6%) |
| 85 Years and over | 27 (1.6%) | 76 (8.6%) |
| Total | 1,686 (100.0%) | 880 (100.0%) |
Families and Households in Sandstone
Median Family Size in Sandstone
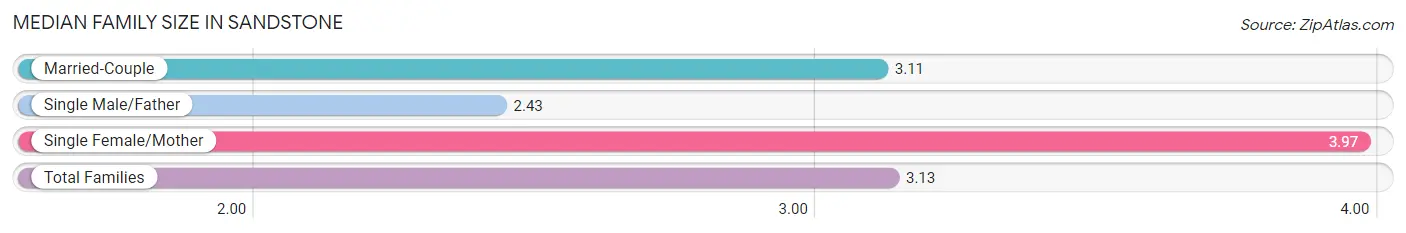
The median family size in Sandstone is 3.13 persons per family, with single female/mother families (62 | 19.3%) accounting for the largest median family size of 3.97 persons per family. On the other hand, single male/father families (70 | 21.7%) represent the smallest median family size with 2.43 persons per family.
| Family Type | # Families | Family Size |
| Married-Couple | 190 (59.0%) | 3.11 |
| Single Male/Father | 70 (21.7%) | 2.43 |
| Single Female/Mother | 62 (19.3%) | 3.97 |
| Total Families | 322 (100.0%) | 3.13 |
Median Household Size in Sandstone
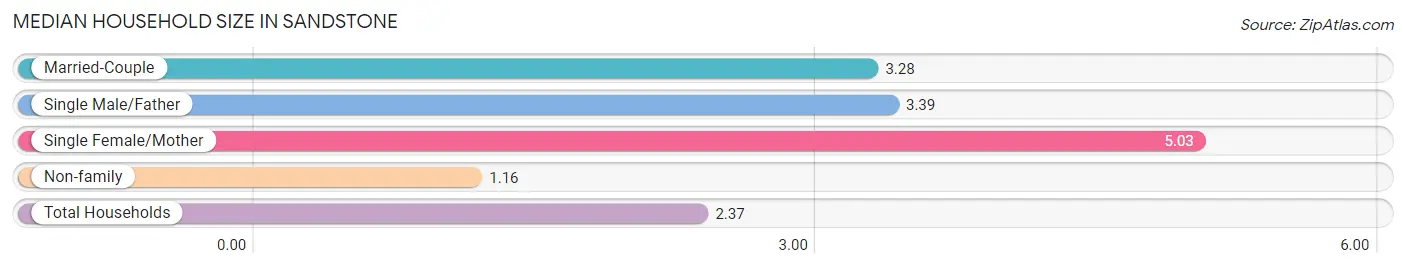
The median household size in Sandstone is 2.37 persons per household, with single female/mother households (62 | 9.4%) accounting for the largest median household size of 5.03 persons per household. non-family households (339 | 51.3%) represent the smallest median household size with 1.16 persons per household.
| Household Type | # Households | Household Size |
| Married-Couple | 190 (28.7%) | 3.28 |
| Single Male/Father | 70 (10.6%) | 3.39 |
| Single Female/Mother | 62 (9.4%) | 5.03 |
| Non-family | 339 (51.3%) | 1.16 |
| Total Households | 661 (100.0%) | 2.37 |
Household Size by Marriage Status in Sandstone
Out of a total of 661 households in Sandstone, 322 (48.7%) are family households, while 339 (51.3%) are nonfamily households. The most numerous type of family households are 2-person households, comprising 124, and the most common type of nonfamily households are 1-person households, comprising 303.
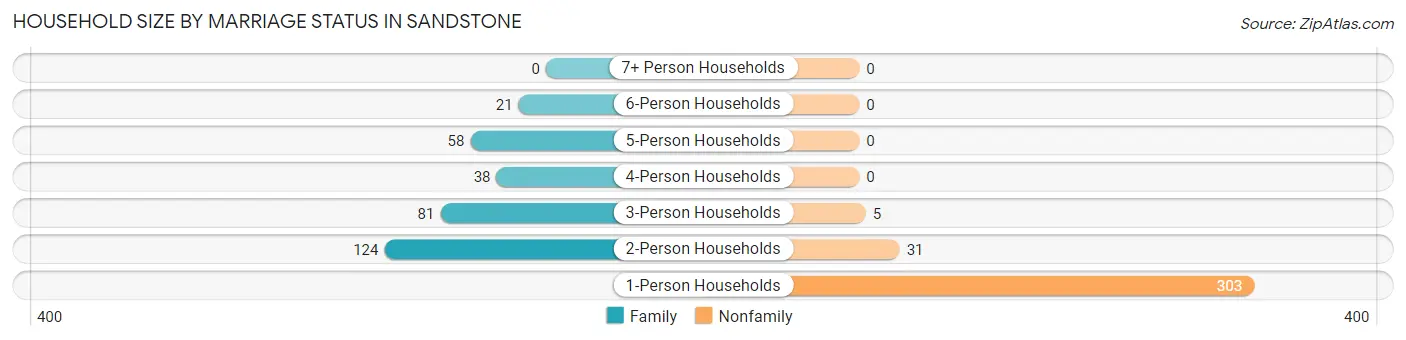
| Household Size | Family Households | Nonfamily Households |
| 1-Person Households | - | 303 (45.8%) |
| 2-Person Households | 124 (18.8%) | 31 (4.7%) |
| 3-Person Households | 81 (12.2%) | 5 (0.8%) |
| 4-Person Households | 38 (5.8%) | 0 (0.0%) |
| 5-Person Households | 58 (8.8%) | 0 (0.0%) |
| 6-Person Households | 21 (3.2%) | 0 (0.0%) |
| 7+ Person Households | 0 (0.0%) | 0 (0.0%) |
| Total | 322 (48.7%) | 339 (51.3%) |
Female Fertility in Sandstone
Fertility by Age in Sandstone
Average fertility rate in Sandstone is 8.0 births per 1,000 women. Women in the age bracket of 20 to 34 years have the highest fertility rate with 18.0 births per 1,000 women. Women in the age bracket of 20 to 34 years acount for 100.0% of all women with births.
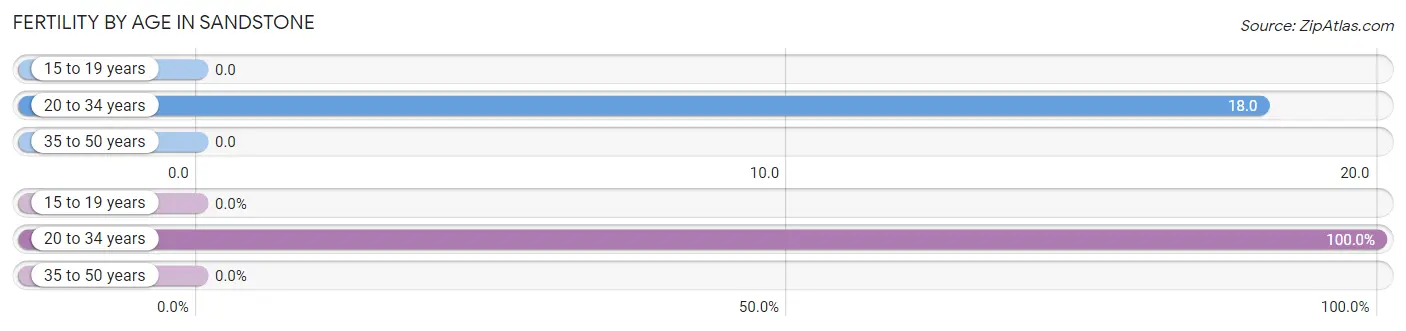
| Age Bracket | Women with Births | Births / 1,000 Women |
| 15 to 19 years | 0 (0.0%) | 0.0 |
| 20 to 34 years | 3 (100.0%) | 18.0 |
| 35 to 50 years | 0 (0.0%) | 0.0 |
| Total | 3 (100.0%) | 8.0 |
Fertility by Age by Marriage Status in Sandstone
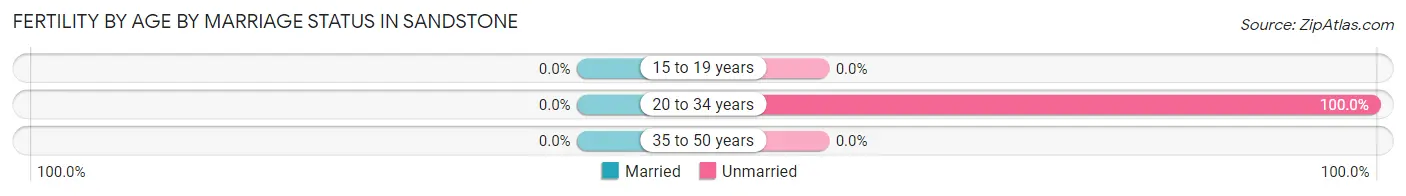
| Age Bracket | Married | Unmarried |
| 15 to 19 years | 0 (0.0%) | 0 (0.0%) |
| 20 to 34 years | 0 (0.0%) | 3 (100.0%) |
| 35 to 50 years | 0 (0.0%) | 0 (0.0%) |
| Total | 0 (0.0%) | 3 (100.0%) |
Fertility by Education in Sandstone
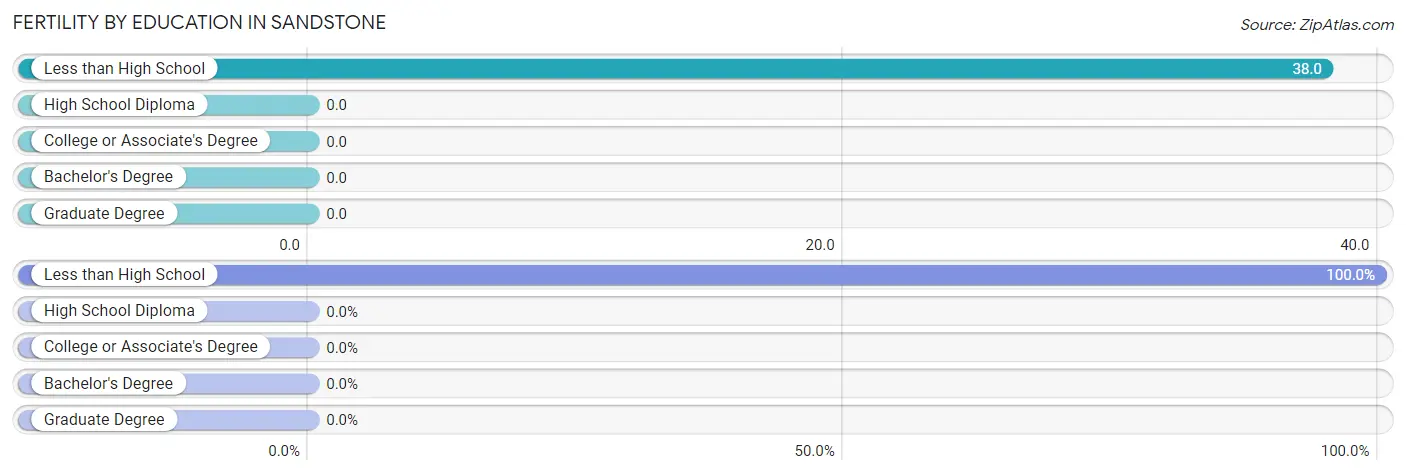
| Educational Attainment | Women with Births | Births / 1,000 Women |
| Less than High School | 3 (100.0%) | 38.0 |
| High School Diploma | 0 (0.0%) | 0.0 |
| College or Associate's Degree | 0 (0.0%) | 0.0 |
| Bachelor's Degree | 0 (0.0%) | 0.0 |
| Graduate Degree | 0 (0.0%) | 0.0 |
| Total | 3 (100.0%) | 8.0 |
Fertility by Education by Marriage Status in Sandstone
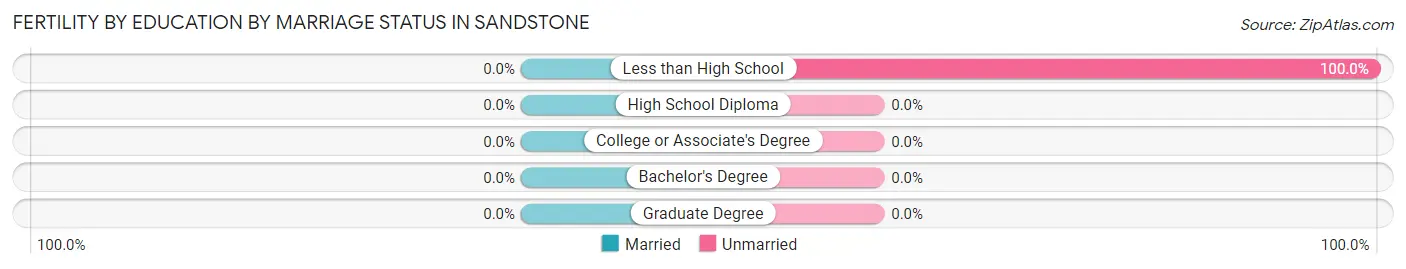
| Educational Attainment | Married | Unmarried |
| Less than High School | 0 (0.0%) | 3 (100.0%) |
| High School Diploma | 0 (0.0%) | 0 (0.0%) |
| College or Associate's Degree | 0 (0.0%) | 0 (0.0%) |
| Bachelor's Degree | 0 (0.0%) | 0 (0.0%) |
| Graduate Degree | 0 (0.0%) | 0 (0.0%) |
| Total | 0 (0.0%) | 3 (100.0%) |
Employment Characteristics in Sandstone
Employment by Class of Employer in Sandstone
Among the 612 employed individuals in Sandstone, private company employees (443 | 72.4%), local government employees (56 | 9.1%), and federal government employees (48 | 7.8%) make up the most common classes of employment.
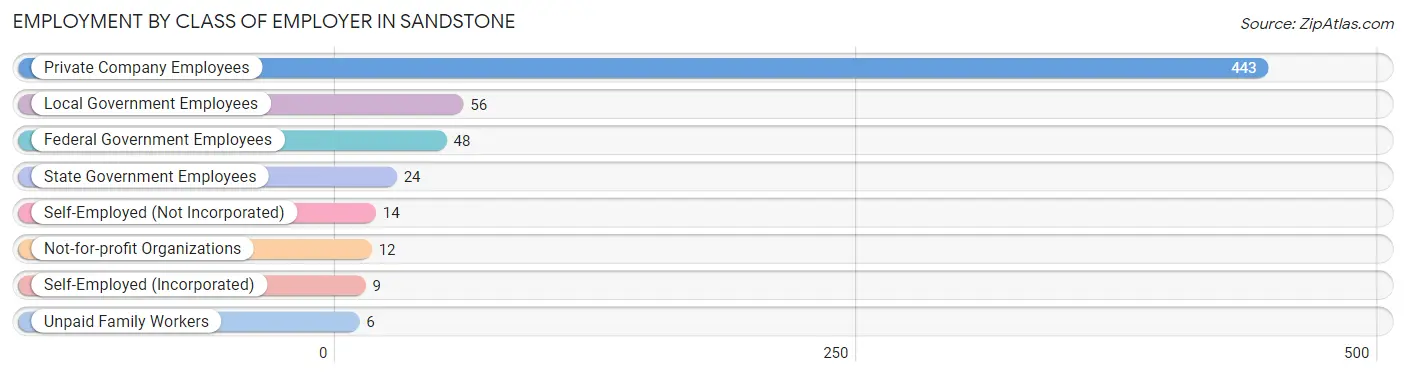
| Employer Class | # Employees | % Employees |
| Private Company Employees | 443 | 72.4% |
| Self-Employed (Incorporated) | 9 | 1.5% |
| Self-Employed (Not Incorporated) | 14 | 2.3% |
| Not-for-profit Organizations | 12 | 2.0% |
| Local Government Employees | 56 | 9.1% |
| State Government Employees | 24 | 3.9% |
| Federal Government Employees | 48 | 7.8% |
| Unpaid Family Workers | 6 | 1.0% |
| Total | 612 | 100.0% |
Employment Status by Age in Sandstone
According to the labor force statistics for Sandstone, out of the total population over 16 years of age (2,253), 29.4% or 662 individuals are in the labor force, with 5.4% or 36 of them unemployed. The age group with the highest labor force participation rate is 16 to 19 years, with 70.0% or 56 individuals in the labor force. Within the labor force, the 30 to 34 years age range has the highest percentage of unemployed individuals, with 22.7% or 17 of them being unemployed.
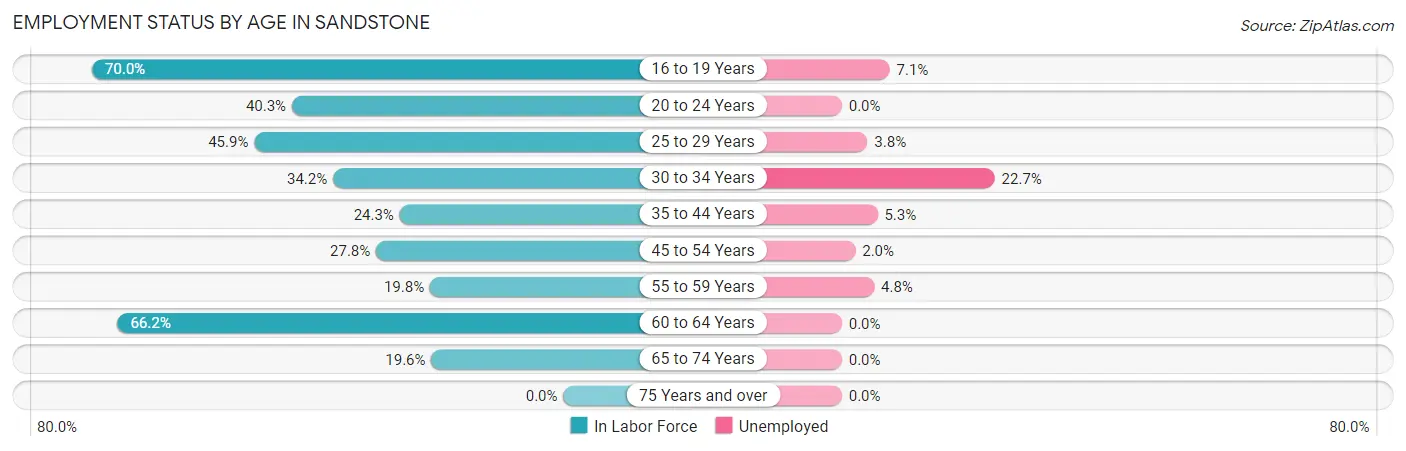
| Age Bracket | In Labor Force | Unemployed |
| 16 to 19 Years | 56 (70.0%) | 4 (7.1%) |
| 20 to 24 Years | 73 (40.3%) | 0 (0.0%) |
| 25 to 29 Years | 106 (45.9%) | 4 (3.8%) |
| 30 to 34 Years | 75 (34.2%) | 17 (22.7%) |
| 35 to 44 Years | 132 (24.3%) | 7 (5.3%) |
| 45 to 54 Years | 102 (27.8%) | 2 (2.0%) |
| 55 to 59 Years | 42 (19.8%) | 2 (4.8%) |
| 60 to 64 Years | 49 (66.2%) | 0 (0.0%) |
| 65 to 74 Years | 27 (19.6%) | 0 (0.0%) |
| 75 Years and over | 0 (0.0%) | 0 (0.0%) |
| Total | 662 (29.4%) | 36 (5.4%) |
Employment Status by Educational Attainment in Sandstone
According to labor force statistics for Sandstone, 30.7% of individuals (506) out of the total population between 25 and 64 years of age (1,647) are in the labor force, with 6.3% or 32 of them being unemployed. The group with the highest labor force participation rate are those with the educational attainment of bachelor's degree or higher, with 67.0% or 75 individuals in the labor force. Within the labor force, individuals with less than high school education have the highest percentage of unemployment, with 34.3% or 12 of them being unemployed.
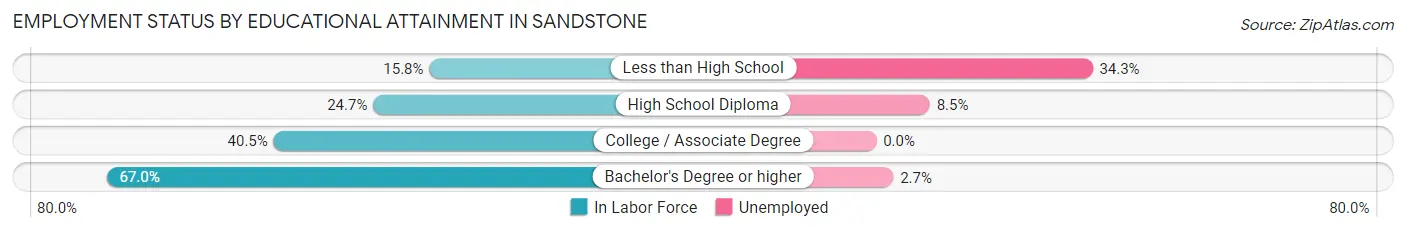
| Educational Attainment | In Labor Force | Unemployed |
| Less than High School | 35 (15.8%) | 76 (34.3%) |
| High School Diploma | 213 (24.7%) | 73 (8.5%) |
| College / Associate Degree | 183 (40.5%) | 0 (0.0%) |
| Bachelor's Degree or higher | 75 (67.0%) | 3 (2.7%) |
| Total | 506 (30.7%) | 104 (6.3%) |
Employment Occupations by Sex in Sandstone
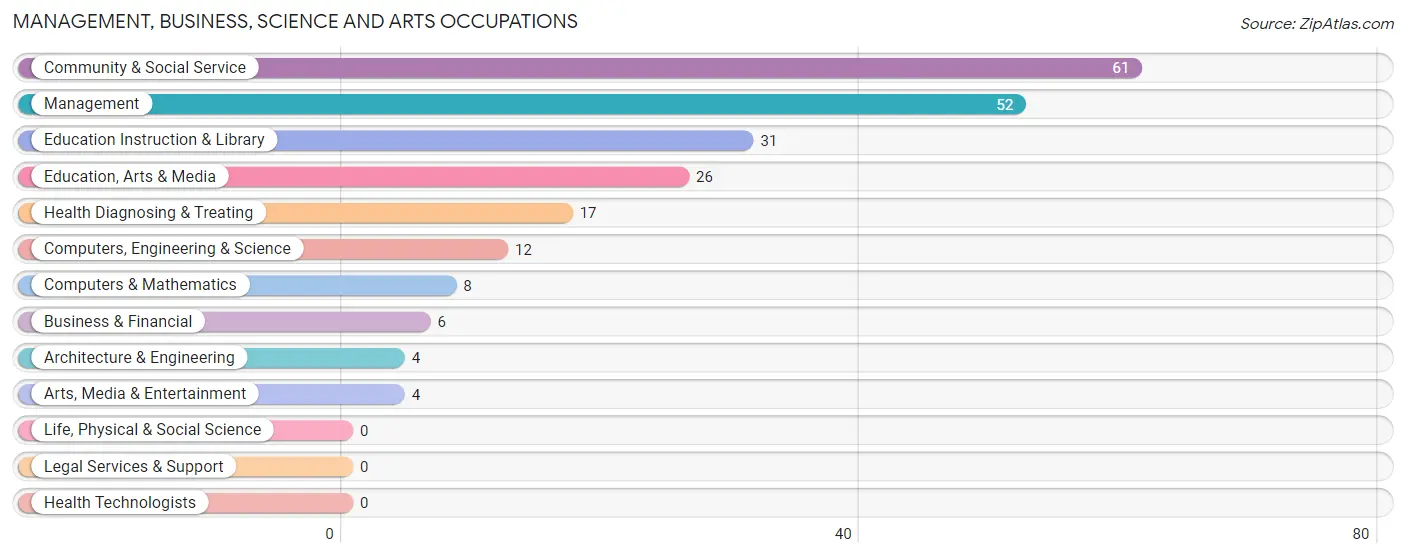
Management, Business, Science and Arts Occupations
The most common Management, Business, Science and Arts occupations in Sandstone are Community & Social Service (61 | 9.7%), Management (52 | 8.3%), Education Instruction & Library (31 | 5.0%), Education, Arts & Media (26 | 4.2%), and Health Diagnosing & Treating (17 | 2.7%).
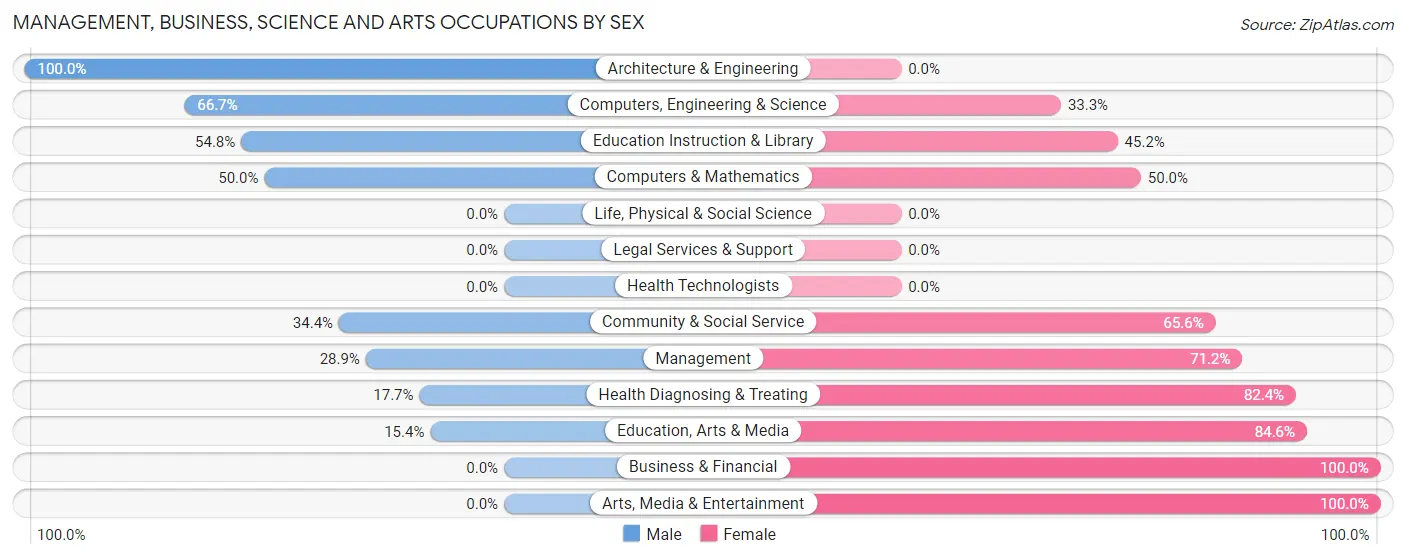
Management, Business, Science and Arts Occupations by Sex
Within the Management, Business, Science and Arts occupations in Sandstone, the most male-oriented occupations are Architecture & Engineering (100.0%), Computers, Engineering & Science (66.7%), and Education Instruction & Library (54.8%), while the most female-oriented occupations are Business & Financial (100.0%), Arts, Media & Entertainment (100.0%), and Education, Arts & Media (84.6%).
| Occupation | Male | Female |
| Management | 15 (28.8%) | 37 (71.2%) |
| Business & Financial | 0 (0.0%) | 6 (100.0%) |
| Computers, Engineering & Science | 8 (66.7%) | 4 (33.3%) |
| Computers & Mathematics | 4 (50.0%) | 4 (50.0%) |
| Architecture & Engineering | 4 (100.0%) | 0 (0.0%) |
| Life, Physical & Social Science | 0 (0.0%) | 0 (0.0%) |
| Community & Social Service | 21 (34.4%) | 40 (65.6%) |
| Education, Arts & Media | 4 (15.4%) | 22 (84.6%) |
| Legal Services & Support | 0 (0.0%) | 0 (0.0%) |
| Education Instruction & Library | 17 (54.8%) | 14 (45.2%) |
| Arts, Media & Entertainment | 0 (0.0%) | 4 (100.0%) |
| Health Diagnosing & Treating | 3 (17.6%) | 14 (82.4%) |
| Health Technologists | 0 (0.0%) | 0 (0.0%) |
| Total (Category) | 47 (31.8%) | 101 (68.2%) |
| Total (Overall) | 302 (48.2%) | 324 (51.8%) |
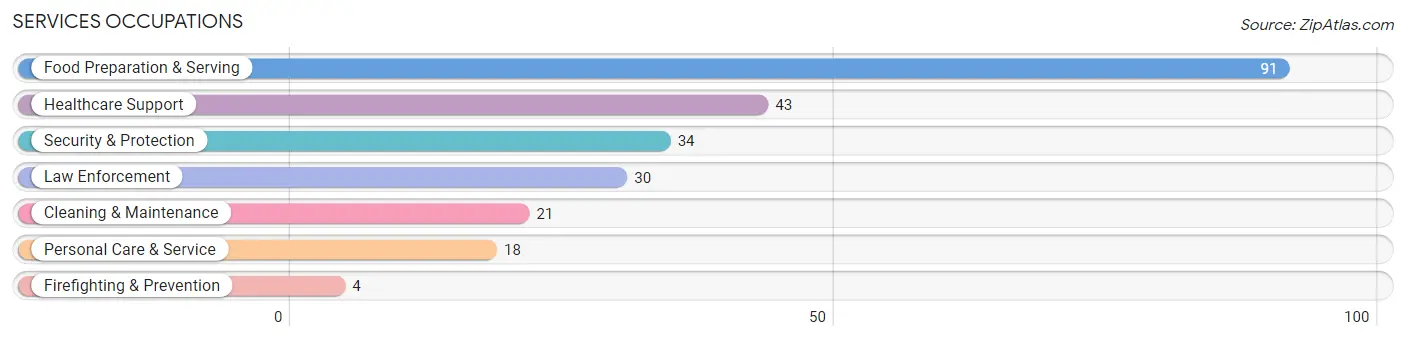
Services Occupations
The most common Services occupations in Sandstone are Food Preparation & Serving (91 | 14.5%), Healthcare Support (43 | 6.9%), Security & Protection (34 | 5.4%), Law Enforcement (30 | 4.8%), and Cleaning & Maintenance (21 | 3.4%).
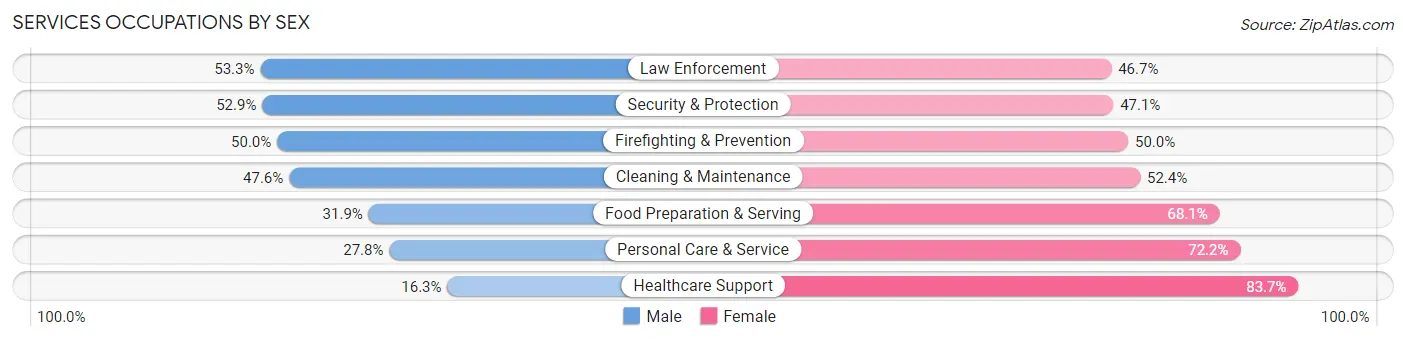
Services Occupations by Sex
Within the Services occupations in Sandstone, the most male-oriented occupations are Law Enforcement (53.3%), Security & Protection (52.9%), and Firefighting & Prevention (50.0%), while the most female-oriented occupations are Healthcare Support (83.7%), Personal Care & Service (72.2%), and Food Preparation & Serving (68.1%).
| Occupation | Male | Female |
| Healthcare Support | 7 (16.3%) | 36 (83.7%) |
| Security & Protection | 18 (52.9%) | 16 (47.1%) |
| Firefighting & Prevention | 2 (50.0%) | 2 (50.0%) |
| Law Enforcement | 16 (53.3%) | 14 (46.7%) |
| Food Preparation & Serving | 29 (31.9%) | 62 (68.1%) |
| Cleaning & Maintenance | 10 (47.6%) | 11 (52.4%) |
| Personal Care & Service | 5 (27.8%) | 13 (72.2%) |
| Total (Category) | 69 (33.3%) | 138 (66.7%) |
| Total (Overall) | 302 (48.2%) | 324 (51.8%) |
Sales and Office Occupations
The most common Sales and Office occupations in Sandstone are Sales & Related (70 | 11.2%), and Office & Administration (55 | 8.8%).
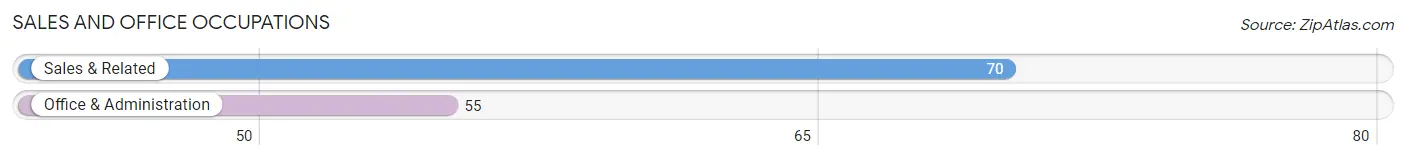
Sales and Office Occupations by Sex
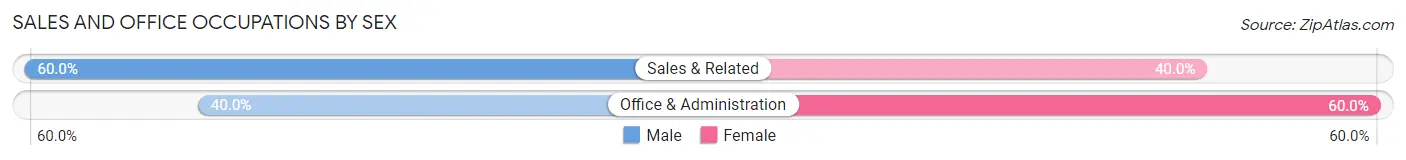
| Occupation | Male | Female |
| Sales & Related | 42 (60.0%) | 28 (40.0%) |
| Office & Administration | 22 (40.0%) | 33 (60.0%) |
| Total (Category) | 64 (51.2%) | 61 (48.8%) |
| Total (Overall) | 302 (48.2%) | 324 (51.8%) |
Natural Resources, Construction and Maintenance Occupations
The most common Natural Resources, Construction and Maintenance occupations in Sandstone are Construction & Extraction (17 | 2.7%), and Farming, Fishing & Forestry (4 | 0.6%).
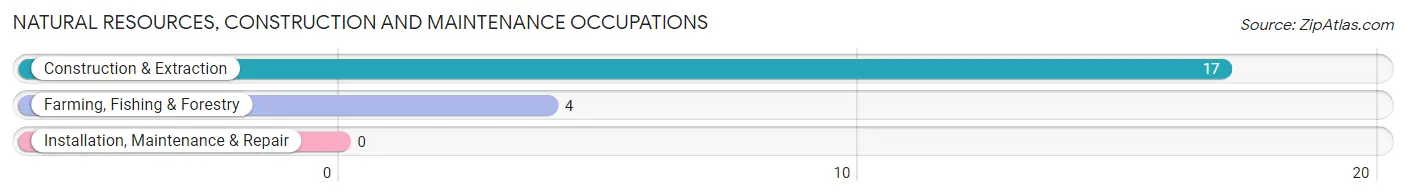
Natural Resources, Construction and Maintenance Occupations by Sex
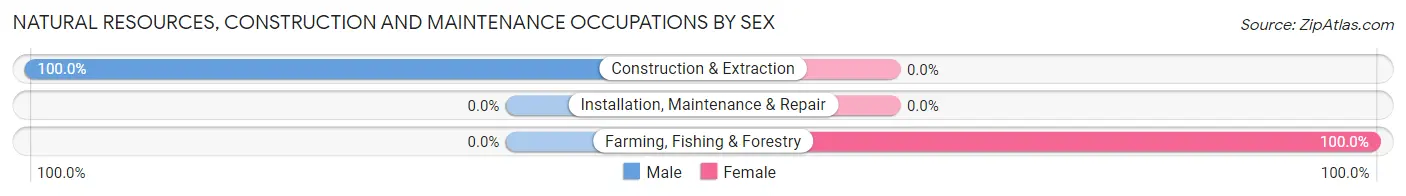
| Occupation | Male | Female |
| Farming, Fishing & Forestry | 0 (0.0%) | 4 (100.0%) |
| Construction & Extraction | 17 (100.0%) | 0 (0.0%) |
| Installation, Maintenance & Repair | 0 (0.0%) | 0 (0.0%) |
| Total (Category) | 17 (80.9%) | 4 (19.1%) |
| Total (Overall) | 302 (48.2%) | 324 (51.8%) |
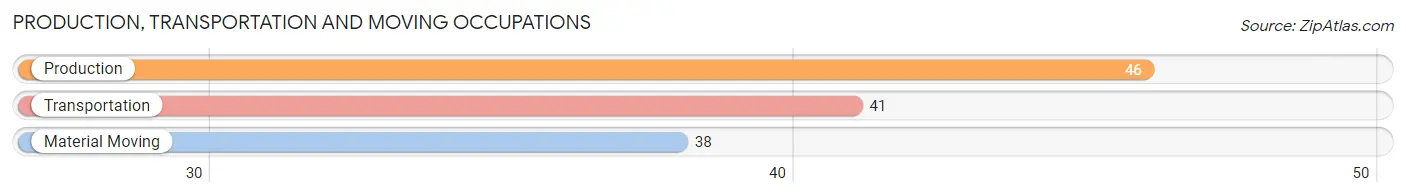
Production, Transportation and Moving Occupations
The most common Production, Transportation and Moving occupations in Sandstone are Production (46 | 7.3%), Transportation (41 | 6.6%), and Material Moving (38 | 6.1%).
Production, Transportation and Moving Occupations by Sex
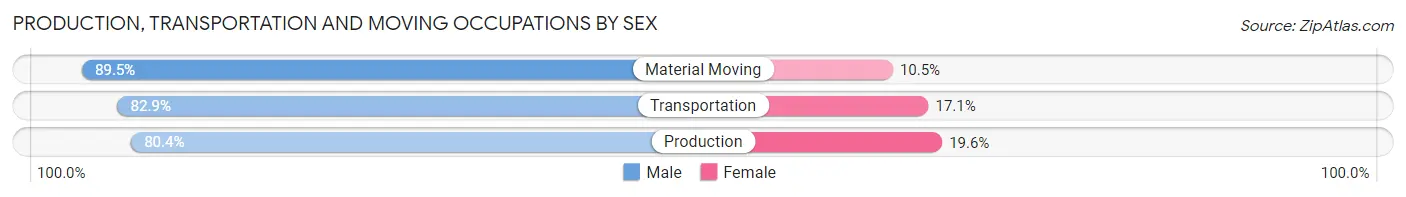
| Occupation | Male | Female |
| Production | 37 (80.4%) | 9 (19.6%) |
| Transportation | 34 (82.9%) | 7 (17.1%) |
| Material Moving | 34 (89.5%) | 4 (10.5%) |
| Total (Category) | 105 (84.0%) | 20 (16.0%) |
| Total (Overall) | 302 (48.2%) | 324 (51.8%) |
Employment Industries by Sex in Sandstone
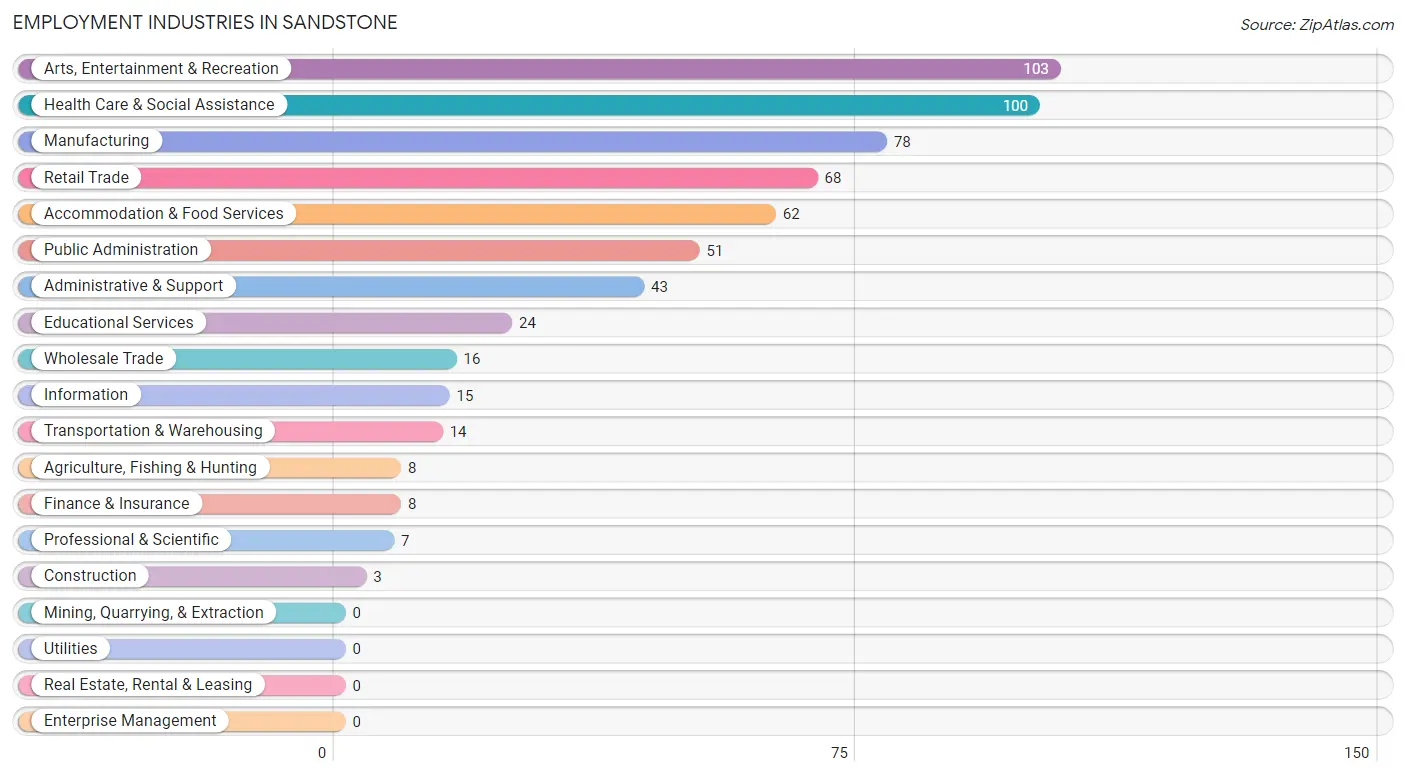
Employment Industries in Sandstone
The major employment industries in Sandstone include Arts, Entertainment & Recreation (103 | 16.5%), Health Care & Social Assistance (100 | 16.0%), Manufacturing (78 | 12.5%), Retail Trade (68 | 10.9%), and Accommodation & Food Services (62 | 9.9%).
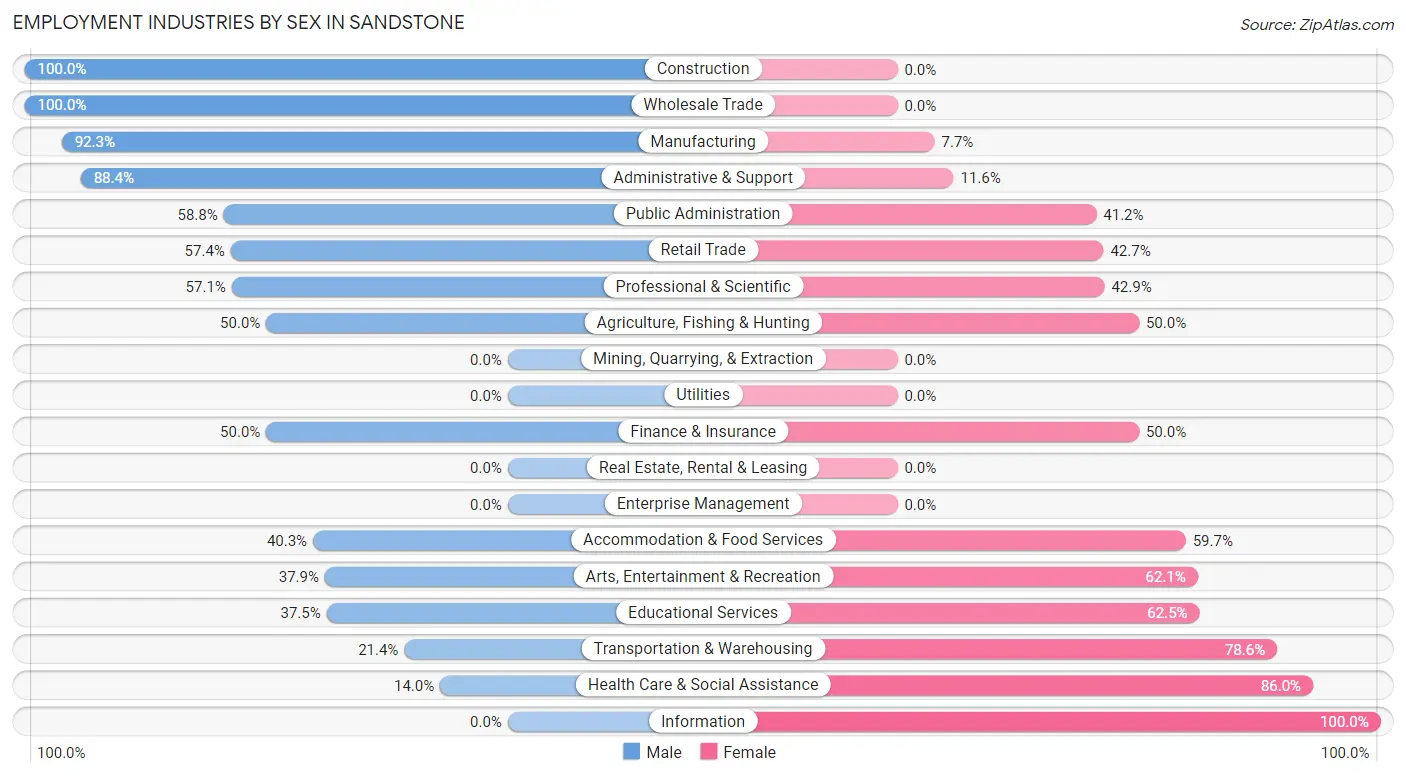
Employment Industries by Sex in Sandstone
The Sandstone industries that see more men than women are Construction (100.0%), Wholesale Trade (100.0%), and Manufacturing (92.3%), whereas the industries that tend to have a higher number of women are Information (100.0%), Health Care & Social Assistance (86.0%), and Transportation & Warehousing (78.6%).
| Industry | Male | Female |
| Agriculture, Fishing & Hunting | 4 (50.0%) | 4 (50.0%) |
| Mining, Quarrying, & Extraction | 0 (0.0%) | 0 (0.0%) |
| Construction | 3 (100.0%) | 0 (0.0%) |
| Manufacturing | 72 (92.3%) | 6 (7.7%) |
| Wholesale Trade | 16 (100.0%) | 0 (0.0%) |
| Retail Trade | 39 (57.4%) | 29 (42.6%) |
| Transportation & Warehousing | 3 (21.4%) | 11 (78.6%) |
| Utilities | 0 (0.0%) | 0 (0.0%) |
| Information | 0 (0.0%) | 15 (100.0%) |
| Finance & Insurance | 4 (50.0%) | 4 (50.0%) |
| Real Estate, Rental & Leasing | 0 (0.0%) | 0 (0.0%) |
| Professional & Scientific | 4 (57.1%) | 3 (42.9%) |
| Enterprise Management | 0 (0.0%) | 0 (0.0%) |
| Administrative & Support | 38 (88.4%) | 5 (11.6%) |
| Educational Services | 9 (37.5%) | 15 (62.5%) |
| Health Care & Social Assistance | 14 (14.0%) | 86 (86.0%) |
| Arts, Entertainment & Recreation | 39 (37.9%) | 64 (62.1%) |
| Accommodation & Food Services | 25 (40.3%) | 37 (59.7%) |
| Public Administration | 30 (58.8%) | 21 (41.2%) |
| Total | 302 (48.2%) | 324 (51.8%) |
Education in Sandstone
School Enrollment in Sandstone
The most common levels of schooling among the 353 students in Sandstone are high school (135 | 38.2%), college / undergraduate (72 | 20.4%), and middle school (58 | 16.4%).
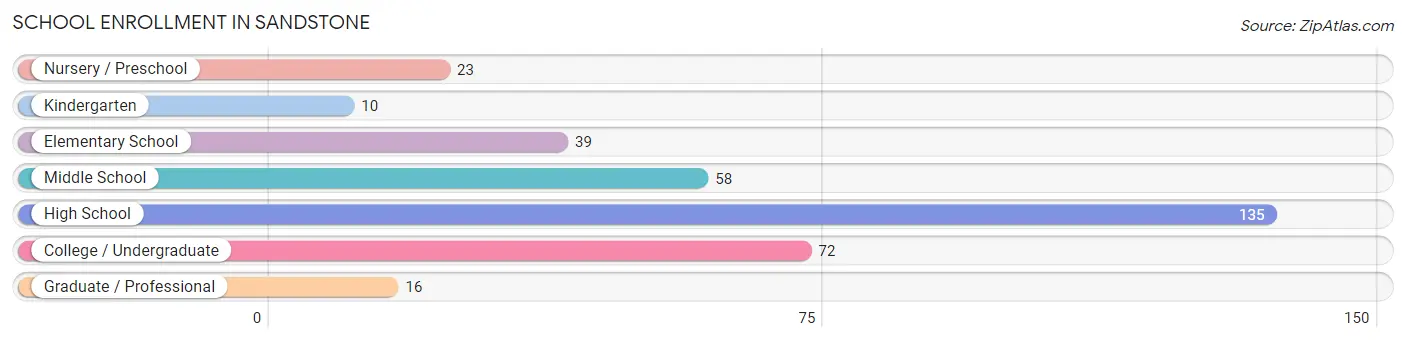
| School Level | # Students | % Students |
| Nursery / Preschool | 23 | 6.5% |
| Kindergarten | 10 | 2.8% |
| Elementary School | 39 | 11.1% |
| Middle School | 58 | 16.4% |
| High School | 135 | 38.2% |
| College / Undergraduate | 72 | 20.4% |
| Graduate / Professional | 16 | 4.5% |
| Total | 353 | 100.0% |
School Enrollment by Age by Funding Source in Sandstone
Out of a total of 353 students who are enrolled in schools in Sandstone, 39 (11.0%) attend a private institution, while the remaining 314 (89.0%) are enrolled in public schools. The age group of 25 to 34 year olds has the highest likelihood of being enrolled in private schools, with 8 (24.2% in the age bracket) enrolled. Conversely, the age group of 3 to 4 year olds has the lowest likelihood of being enrolled in a private school, with 11 (100.0% in the age bracket) attending a public institution.
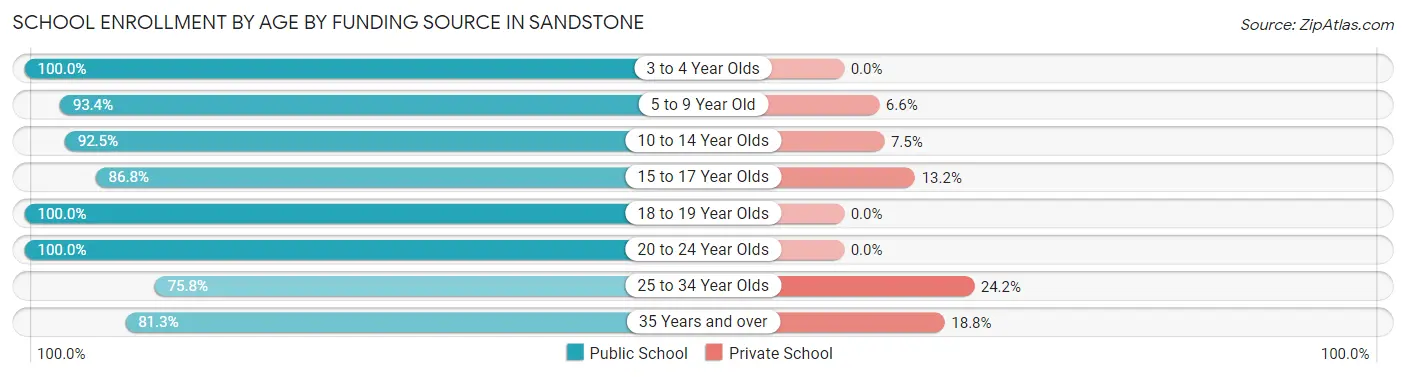
| Age Bracket | Public School | Private School |
| 3 to 4 Year Olds | 11 (100.0%) | 0 (0.0%) |
| 5 to 9 Year Old | 57 (93.4%) | 4 (6.6%) |
| 10 to 14 Year Olds | 74 (92.5%) | 6 (7.5%) |
| 15 to 17 Year Olds | 59 (86.8%) | 9 (13.2%) |
| 18 to 19 Year Olds | 20 (100.0%) | 0 (0.0%) |
| 20 to 24 Year Olds | 16 (100.0%) | 0 (0.0%) |
| 25 to 34 Year Olds | 25 (75.8%) | 8 (24.2%) |
| 35 Years and over | 52 (81.2%) | 12 (18.8%) |
| Total | 314 (89.0%) | 39 (11.0%) |
Educational Attainment by Field of Study in Sandstone
Education (46 | 24.6%), social sciences (26 | 13.9%), psychology (21 | 11.2%), business (21 | 11.2%), and arts & humanities (15 | 8.0%) are the most common fields of study among 187 individuals in Sandstone who have obtained a bachelor's degree or higher.
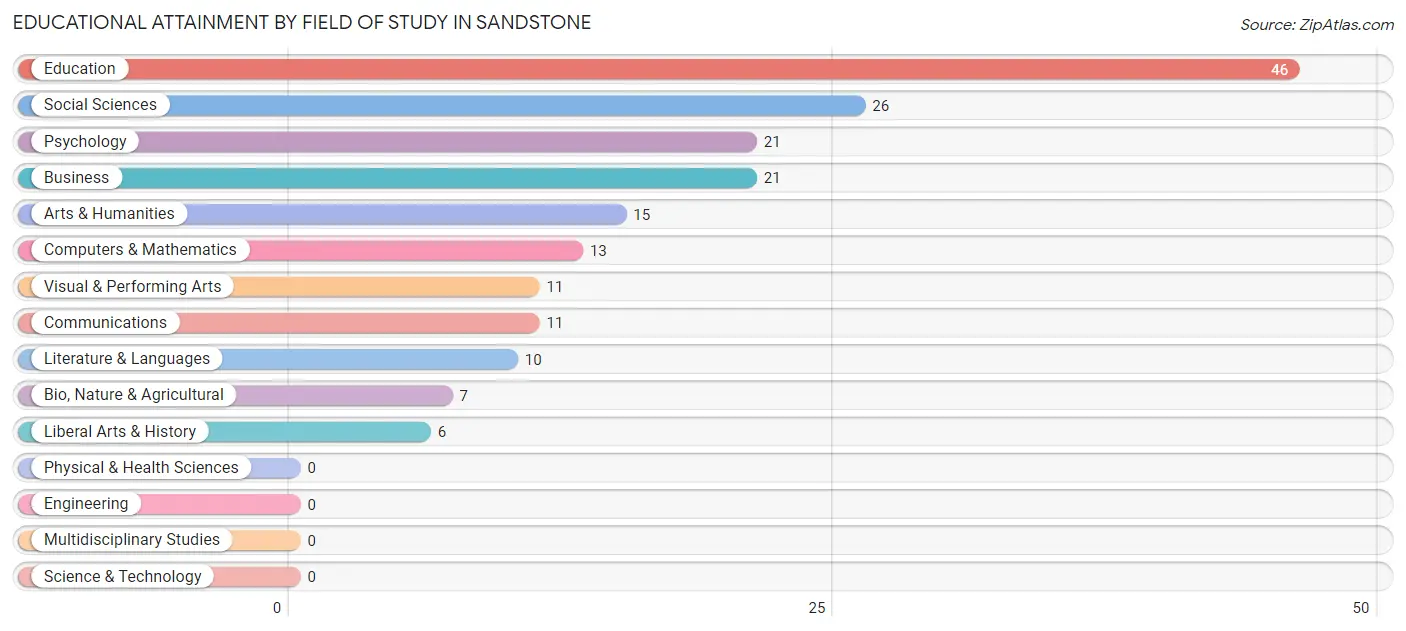
| Field of Study | # Graduates | % Graduates |
| Computers & Mathematics | 13 | 7.0% |
| Bio, Nature & Agricultural | 7 | 3.7% |
| Physical & Health Sciences | 0 | 0.0% |
| Psychology | 21 | 11.2% |
| Social Sciences | 26 | 13.9% |
| Engineering | 0 | 0.0% |
| Multidisciplinary Studies | 0 | 0.0% |
| Science & Technology | 0 | 0.0% |
| Business | 21 | 11.2% |
| Education | 46 | 24.6% |
| Literature & Languages | 10 | 5.3% |
| Liberal Arts & History | 6 | 3.2% |
| Visual & Performing Arts | 11 | 5.9% |
| Communications | 11 | 5.9% |
| Arts & Humanities | 15 | 8.0% |
| Total | 187 | 100.0% |
Transportation & Commute in Sandstone
Vehicle Availability by Sex in Sandstone
The most prevalent vehicle ownership categories in Sandstone are males with 2 vehicles (125, accounting for 42.2%) and females with 2 vehicles (147, making up 39.6%).
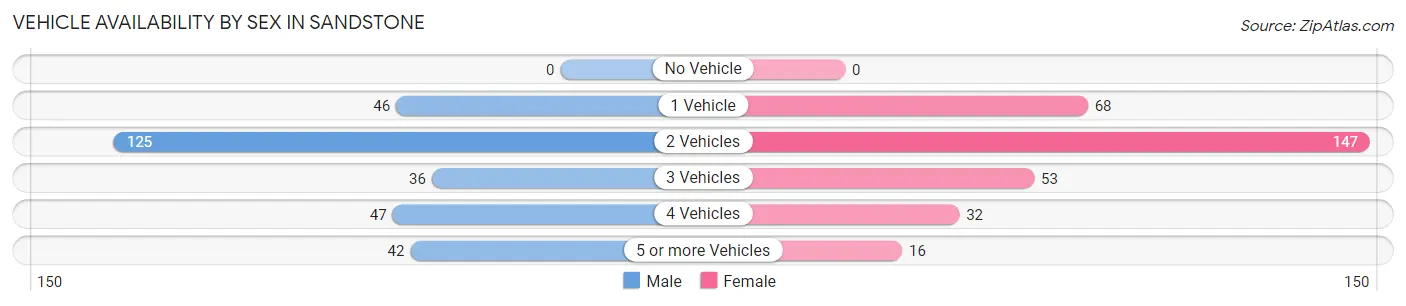
| Vehicles Available | Male | Female |
| No Vehicle | 0 (0.0%) | 0 (0.0%) |
| 1 Vehicle | 46 (15.5%) | 68 (21.5%) |
| 2 Vehicles | 125 (42.2%) | 147 (46.5%) |
| 3 Vehicles | 36 (12.2%) | 53 (16.8%) |
| 4 Vehicles | 47 (15.9%) | 32 (10.1%) |
| 5 or more Vehicles | 42 (14.2%) | 16 (5.1%) |
| Total | 296 (100.0%) | 316 (100.0%) |
Commute Time in Sandstone
The most frequently occuring commute durations in Sandstone are 15 to 19 minutes (111 commuters, 19.5%), 10 to 14 minutes (96 commuters, 16.9%), and 5 to 9 minutes (69 commuters, 12.1%).
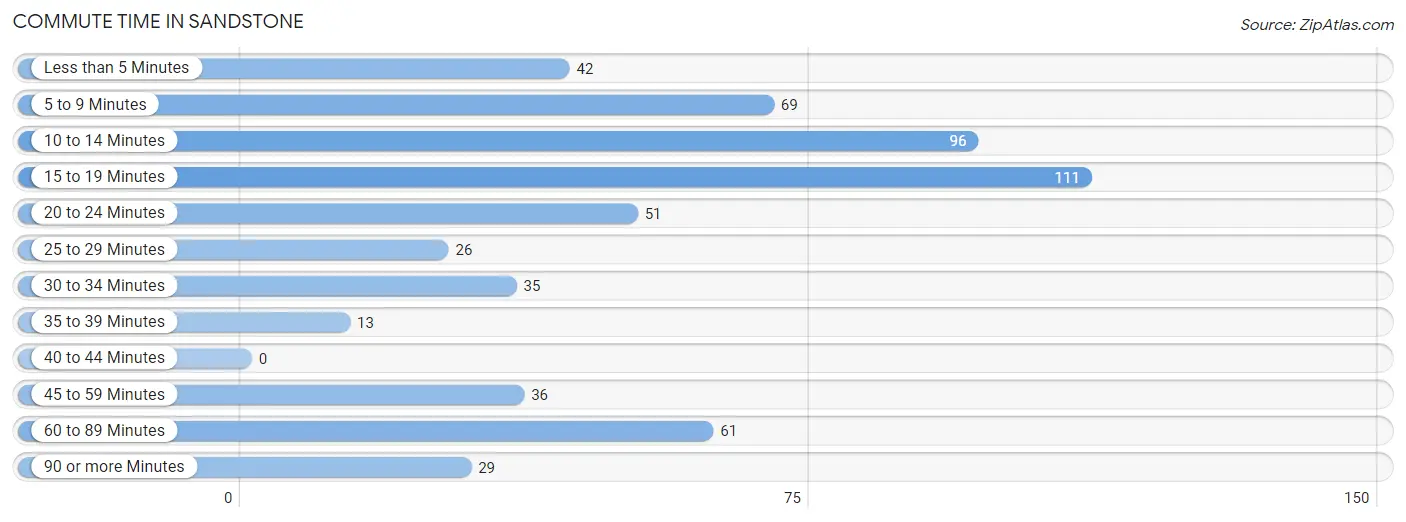
| Commute Time | # Commuters | % Commuters |
| Less than 5 Minutes | 42 | 7.4% |
| 5 to 9 Minutes | 69 | 12.1% |
| 10 to 14 Minutes | 96 | 16.9% |
| 15 to 19 Minutes | 111 | 19.5% |
| 20 to 24 Minutes | 51 | 9.0% |
| 25 to 29 Minutes | 26 | 4.6% |
| 30 to 34 Minutes | 35 | 6.1% |
| 35 to 39 Minutes | 13 | 2.3% |
| 40 to 44 Minutes | 0 | 0.0% |
| 45 to 59 Minutes | 36 | 6.3% |
| 60 to 89 Minutes | 61 | 10.7% |
| 90 or more Minutes | 29 | 5.1% |
Commute Time by Sex in Sandstone
The most common commute times in Sandstone are 15 to 19 minutes (55 commuters, 19.6%) for males and 10 to 14 minutes (65 commuters, 22.6%) for females.
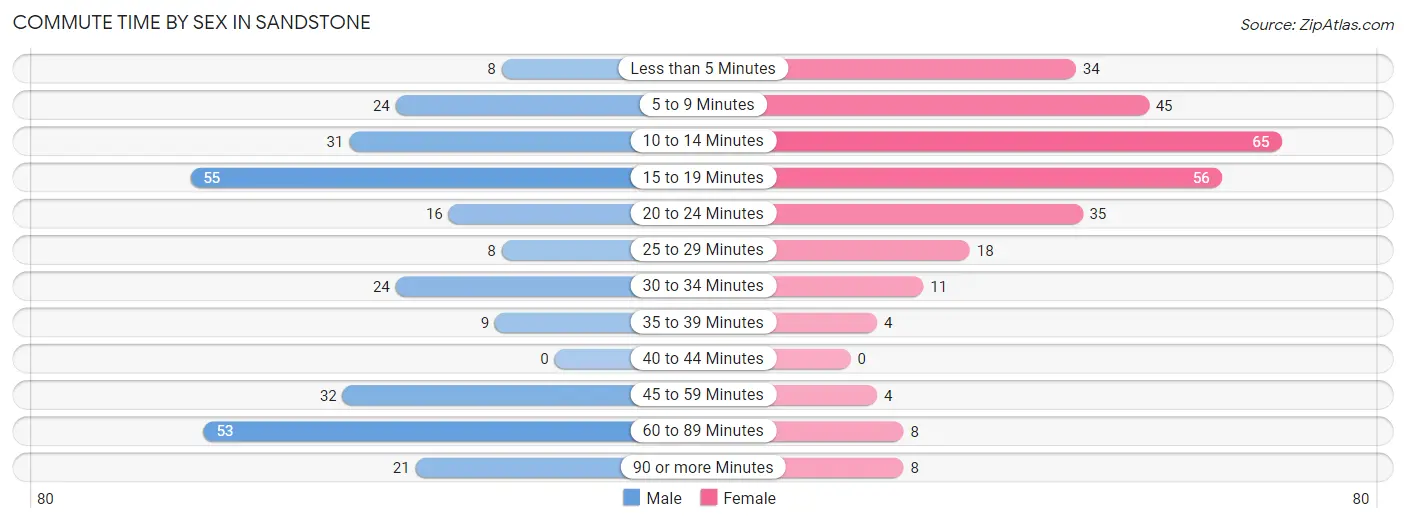
| Commute Time | Male | Female |
| Less than 5 Minutes | 8 (2.9%) | 34 (11.8%) |
| 5 to 9 Minutes | 24 (8.5%) | 45 (15.6%) |
| 10 to 14 Minutes | 31 (11.0%) | 65 (22.6%) |
| 15 to 19 Minutes | 55 (19.6%) | 56 (19.4%) |
| 20 to 24 Minutes | 16 (5.7%) | 35 (12.1%) |
| 25 to 29 Minutes | 8 (2.9%) | 18 (6.2%) |
| 30 to 34 Minutes | 24 (8.5%) | 11 (3.8%) |
| 35 to 39 Minutes | 9 (3.2%) | 4 (1.4%) |
| 40 to 44 Minutes | 0 (0.0%) | 0 (0.0%) |
| 45 to 59 Minutes | 32 (11.4%) | 4 (1.4%) |
| 60 to 89 Minutes | 53 (18.9%) | 8 (2.8%) |
| 90 or more Minutes | 21 (7.5%) | 8 (2.8%) |
Time of Departure to Work by Sex in Sandstone
The most frequent times of departure to work in Sandstone are 5:30 AM to 5:59 AM (49, 17.4%) for males and 12:00 PM to 3:59 PM (84, 29.2%) for females.
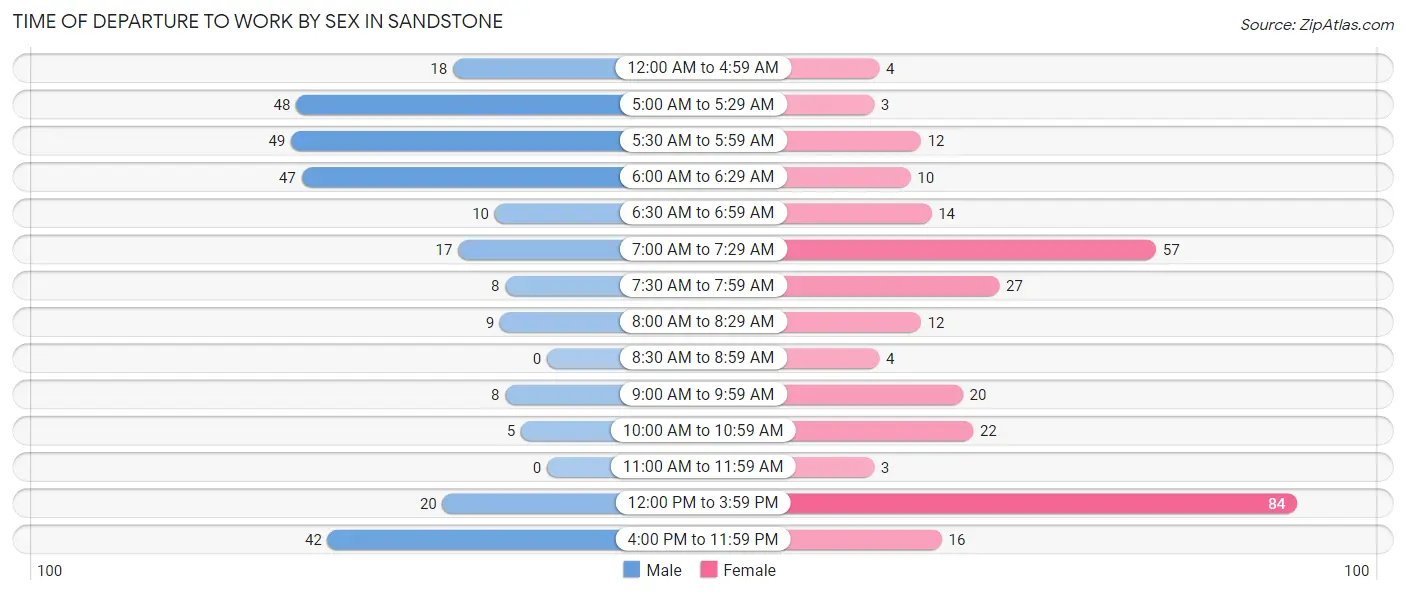
| Time of Departure | Male | Female |
| 12:00 AM to 4:59 AM | 18 (6.4%) | 4 (1.4%) |
| 5:00 AM to 5:29 AM | 48 (17.1%) | 3 (1.0%) |
| 5:30 AM to 5:59 AM | 49 (17.4%) | 12 (4.2%) |
| 6:00 AM to 6:29 AM | 47 (16.7%) | 10 (3.5%) |
| 6:30 AM to 6:59 AM | 10 (3.6%) | 14 (4.9%) |
| 7:00 AM to 7:29 AM | 17 (6.0%) | 57 (19.8%) |
| 7:30 AM to 7:59 AM | 8 (2.9%) | 27 (9.4%) |
| 8:00 AM to 8:29 AM | 9 (3.2%) | 12 (4.2%) |
| 8:30 AM to 8:59 AM | 0 (0.0%) | 4 (1.4%) |
| 9:00 AM to 9:59 AM | 8 (2.9%) | 20 (6.9%) |
| 10:00 AM to 10:59 AM | 5 (1.8%) | 22 (7.6%) |
| 11:00 AM to 11:59 AM | 0 (0.0%) | 3 (1.0%) |
| 12:00 PM to 3:59 PM | 20 (7.1%) | 84 (29.2%) |
| 4:00 PM to 11:59 PM | 42 (14.9%) | 16 (5.6%) |
| Total | 281 (100.0%) | 288 (100.0%) |
Housing Occupancy in Sandstone
Occupancy by Ownership in Sandstone
Of the total 661 dwellings in Sandstone, owner-occupied units account for 359 (54.3%), while renter-occupied units make up 302 (45.7%).
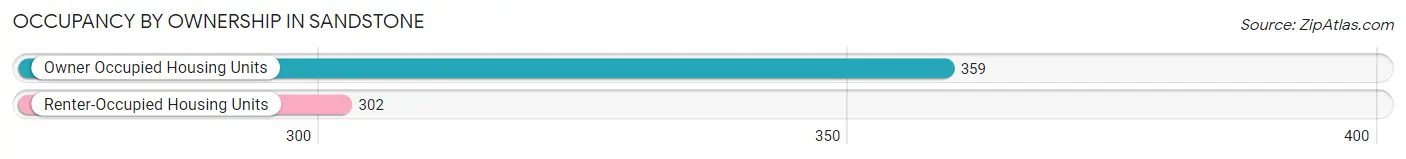
| Occupancy | # Housing Units | % Housing Units |
| Owner Occupied Housing Units | 359 | 54.3% |
| Renter-Occupied Housing Units | 302 | 45.7% |
| Total Occupied Housing Units | 661 | 100.0% |
Occupancy by Household Size in Sandstone
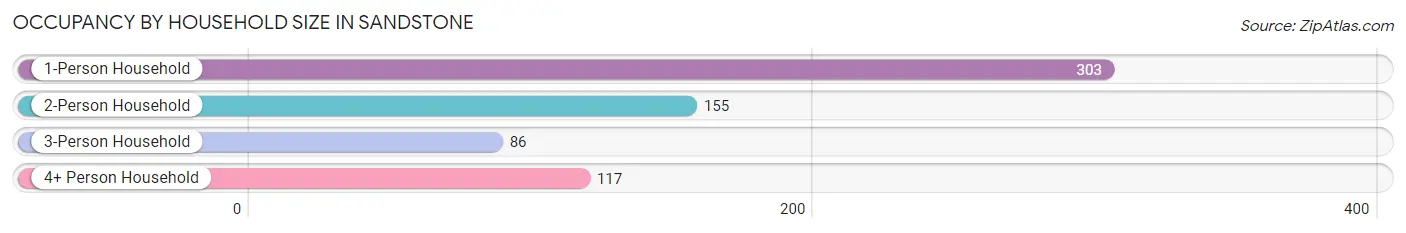
| Household Size | # Housing Units | % Housing Units |
| 1-Person Household | 303 | 45.8% |
| 2-Person Household | 155 | 23.4% |
| 3-Person Household | 86 | 13.0% |
| 4+ Person Household | 117 | 17.7% |
| Total Housing Units | 661 | 100.0% |
Occupancy by Ownership by Household Size in Sandstone
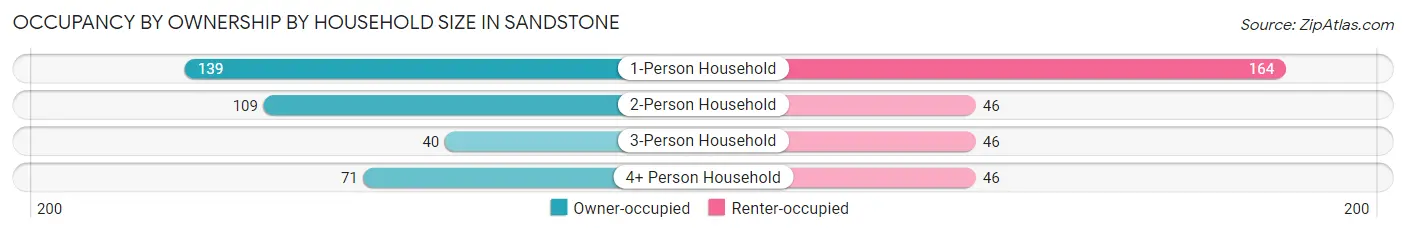
| Household Size | Owner-occupied | Renter-occupied |
| 1-Person Household | 139 (45.9%) | 164 (54.1%) |
| 2-Person Household | 109 (70.3%) | 46 (29.7%) |
| 3-Person Household | 40 (46.5%) | 46 (53.5%) |
| 4+ Person Household | 71 (60.7%) | 46 (39.3%) |
| Total Housing Units | 359 (54.3%) | 302 (45.7%) |
Occupancy by Educational Attainment in Sandstone
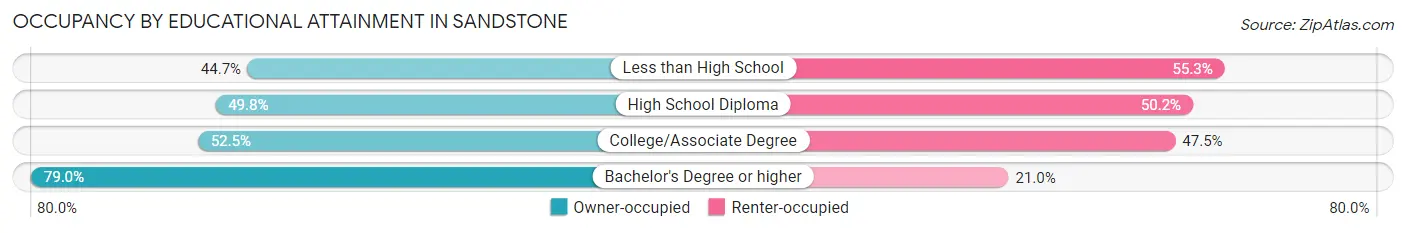
| Household Size | Owner-occupied | Renter-occupied |
| Less than High School | 51 (44.7%) | 63 (55.3%) |
| High School Diploma | 105 (49.8%) | 106 (50.2%) |
| College/Associate Degree | 124 (52.5%) | 112 (47.5%) |
| Bachelor's Degree or higher | 79 (79.0%) | 21 (21.0%) |
Occupancy by Age of Householder in Sandstone
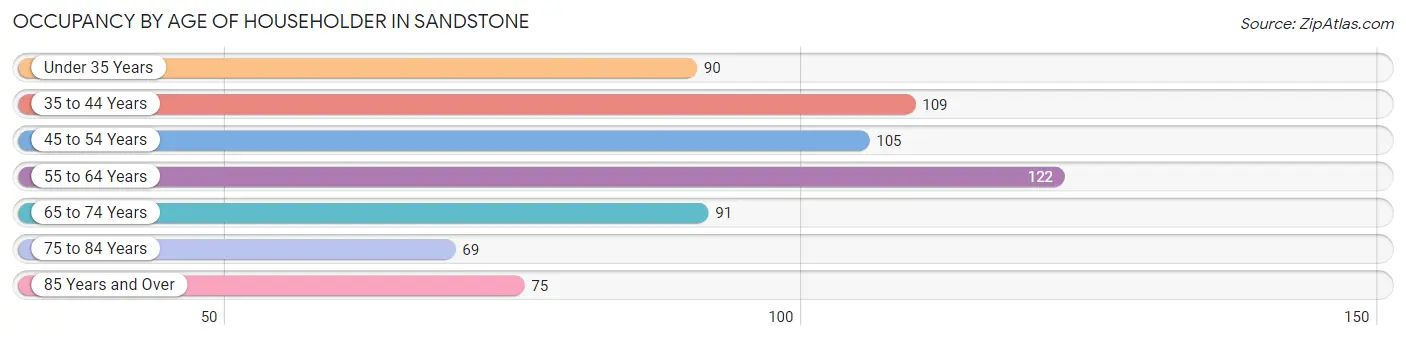
| Age Bracket | # Households | % Households |
| Under 35 Years | 90 | 13.6% |
| 35 to 44 Years | 109 | 16.5% |
| 45 to 54 Years | 105 | 15.9% |
| 55 to 64 Years | 122 | 18.5% |
| 65 to 74 Years | 91 | 13.8% |
| 75 to 84 Years | 69 | 10.4% |
| 85 Years and Over | 75 | 11.4% |
| Total | 661 | 100.0% |
Housing Finances in Sandstone
Median Income by Occupancy in Sandstone
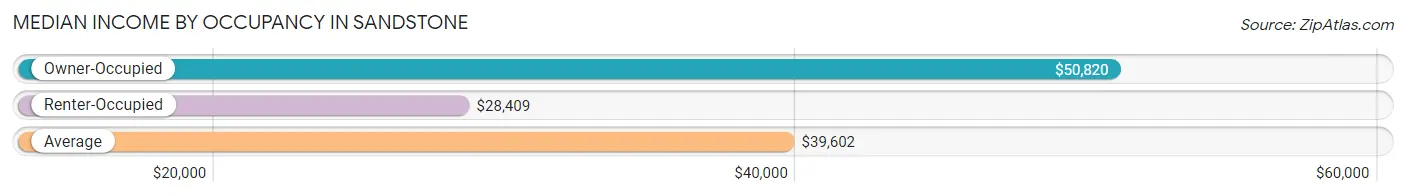
| Occupancy Type | # Households | Median Income |
| Owner-Occupied | 359 (54.3%) | $50,820 |
| Renter-Occupied | 302 (45.7%) | $28,409 |
| Average | 661 (100.0%) | $39,602 |
Occupancy by Householder Income Bracket in Sandstone
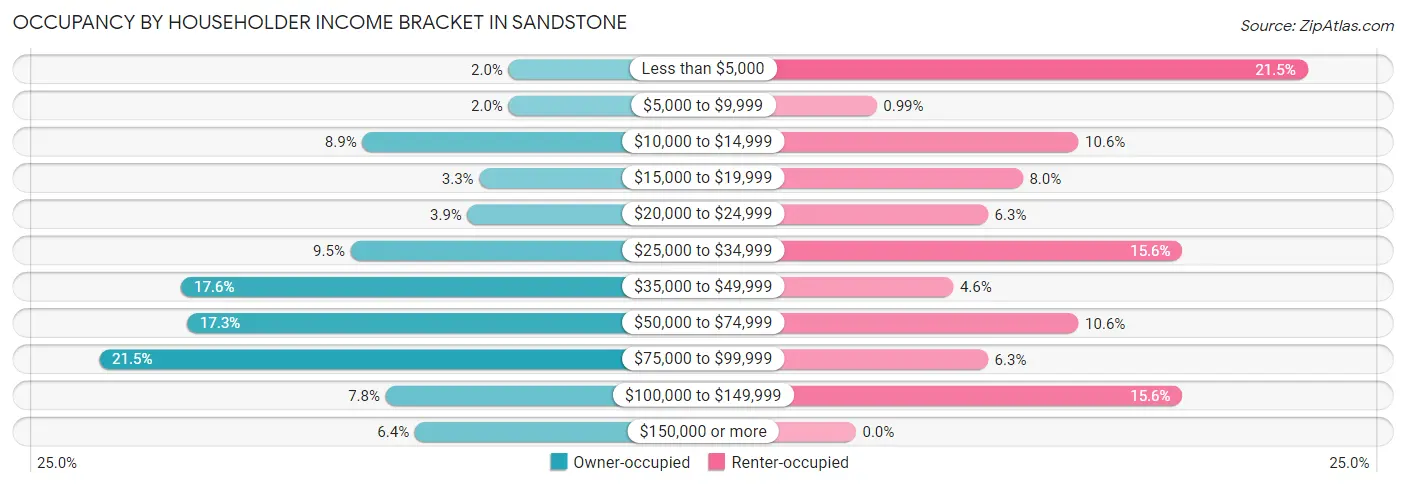
| Income Bracket | Owner-occupied | Renter-occupied |
| Less than $5,000 | 7 (1.9%) | 65 (21.5%) |
| $5,000 to $9,999 | 7 (1.9%) | 3 (1.0%) |
| $10,000 to $14,999 | 32 (8.9%) | 32 (10.6%) |
| $15,000 to $19,999 | 12 (3.3%) | 24 (8.0%) |
| $20,000 to $24,999 | 14 (3.9%) | 19 (6.3%) |
| $25,000 to $34,999 | 34 (9.5%) | 47 (15.6%) |
| $35,000 to $49,999 | 63 (17.5%) | 14 (4.6%) |
| $50,000 to $74,999 | 62 (17.3%) | 32 (10.6%) |
| $75,000 to $99,999 | 77 (21.4%) | 19 (6.3%) |
| $100,000 to $149,999 | 28 (7.8%) | 47 (15.6%) |
| $150,000 or more | 23 (6.4%) | 0 (0.0%) |
| Total | 359 (100.0%) | 302 (100.0%) |
Monthly Housing Cost Tiers in Sandstone
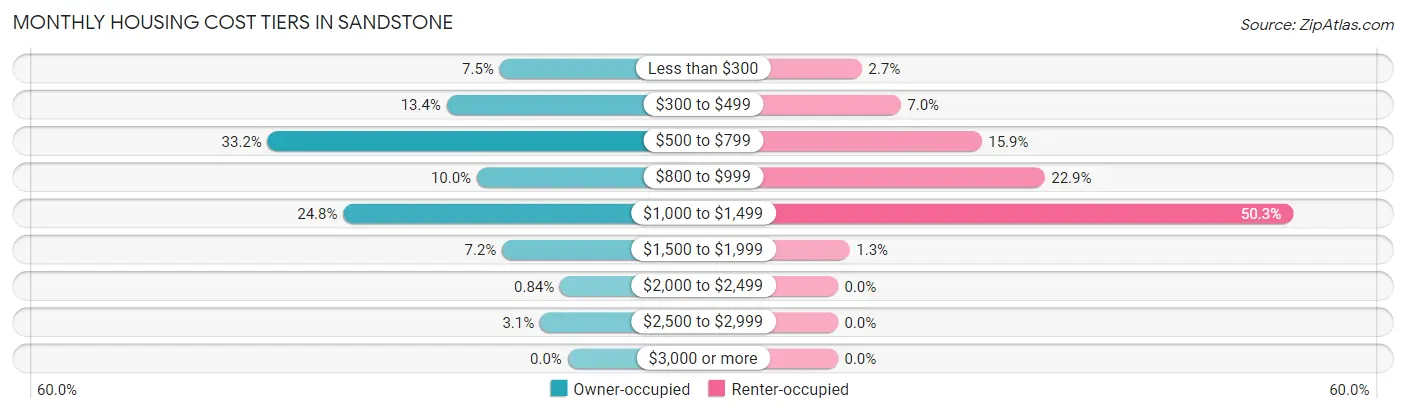
| Monthly Cost | Owner-occupied | Renter-occupied |
| Less than $300 | 27 (7.5%) | 8 (2.6%) |
| $300 to $499 | 48 (13.4%) | 21 (7.0%) |
| $500 to $799 | 119 (33.2%) | 48 (15.9%) |
| $800 to $999 | 36 (10.0%) | 69 (22.9%) |
| $1,000 to $1,499 | 89 (24.8%) | 152 (50.3%) |
| $1,500 to $1,999 | 26 (7.2%) | 4 (1.3%) |
| $2,000 to $2,499 | 3 (0.8%) | 0 (0.0%) |
| $2,500 to $2,999 | 11 (3.1%) | 0 (0.0%) |
| $3,000 or more | 0 (0.0%) | 0 (0.0%) |
| Total | 359 (100.0%) | 302 (100.0%) |
Physical Housing Characteristics in Sandstone
Housing Structures in Sandstone
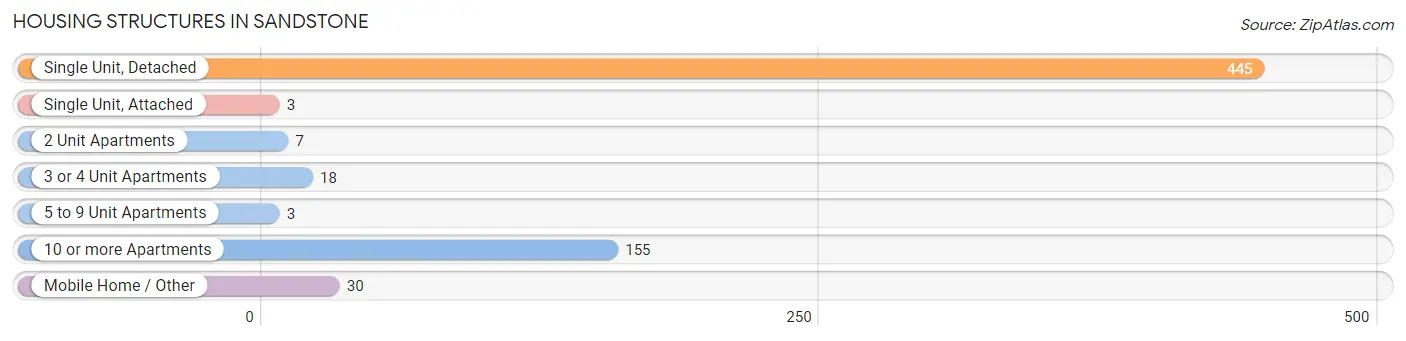
| Structure Type | # Housing Units | % Housing Units |
| Single Unit, Detached | 445 | 67.3% |
| Single Unit, Attached | 3 | 0.4% |
| 2 Unit Apartments | 7 | 1.1% |
| 3 or 4 Unit Apartments | 18 | 2.7% |
| 5 to 9 Unit Apartments | 3 | 0.4% |
| 10 or more Apartments | 155 | 23.4% |
| Mobile Home / Other | 30 | 4.5% |
| Total | 661 | 100.0% |
Housing Structures by Occupancy in Sandstone
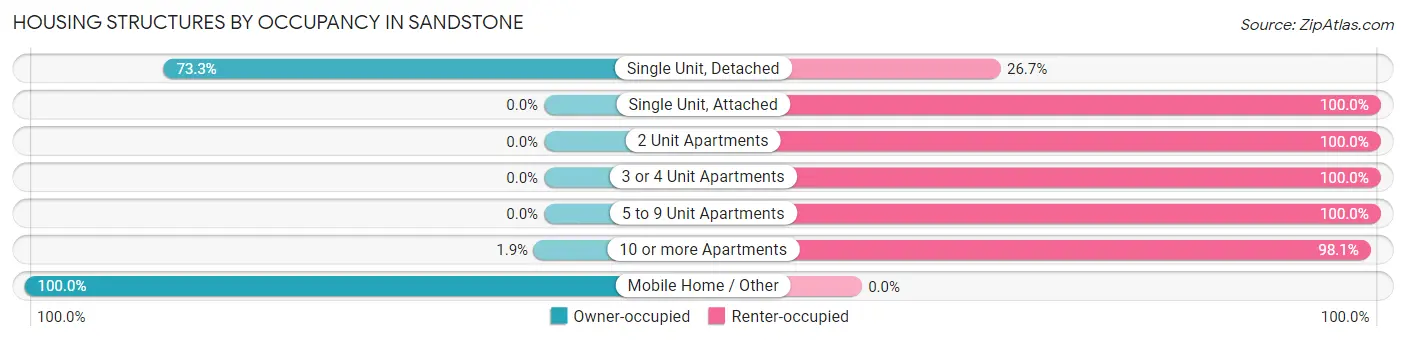
| Structure Type | Owner-occupied | Renter-occupied |
| Single Unit, Detached | 326 (73.3%) | 119 (26.7%) |
| Single Unit, Attached | 0 (0.0%) | 3 (100.0%) |
| 2 Unit Apartments | 0 (0.0%) | 7 (100.0%) |
| 3 or 4 Unit Apartments | 0 (0.0%) | 18 (100.0%) |
| 5 to 9 Unit Apartments | 0 (0.0%) | 3 (100.0%) |
| 10 or more Apartments | 3 (1.9%) | 152 (98.1%) |
| Mobile Home / Other | 30 (100.0%) | 0 (0.0%) |
| Total | 359 (54.3%) | 302 (45.7%) |
Housing Structures by Number of Rooms in Sandstone
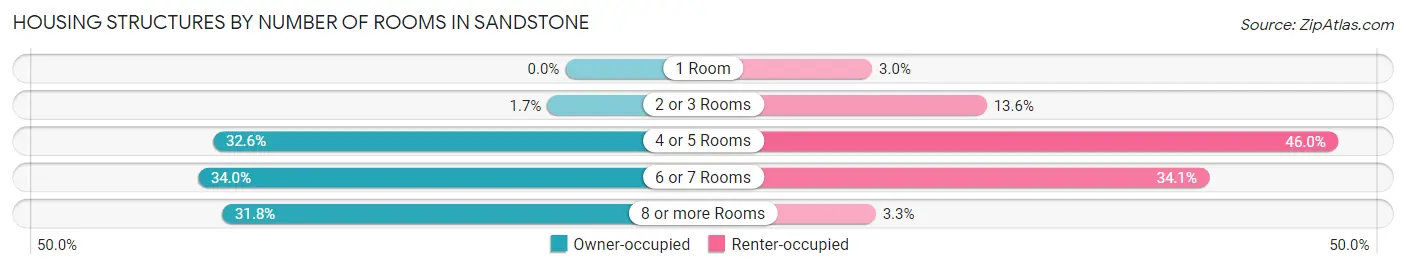
| Number of Rooms | Owner-occupied | Renter-occupied |
| 1 Room | 0 (0.0%) | 9 (3.0%) |
| 2 or 3 Rooms | 6 (1.7%) | 41 (13.6%) |
| 4 or 5 Rooms | 117 (32.6%) | 139 (46.0%) |
| 6 or 7 Rooms | 122 (34.0%) | 103 (34.1%) |
| 8 or more Rooms | 114 (31.8%) | 10 (3.3%) |
| Total | 359 (100.0%) | 302 (100.0%) |
Housing Structure by Heating Type in Sandstone
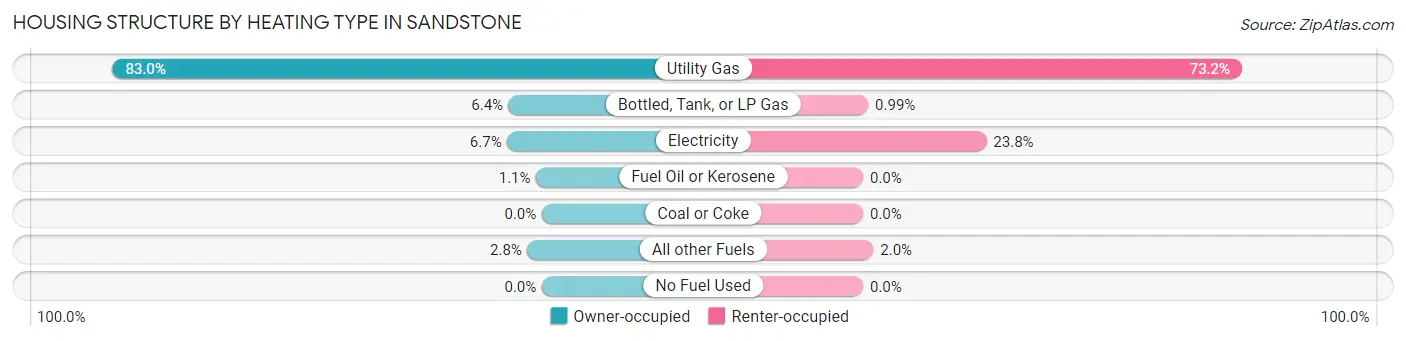
| Heating Type | Owner-occupied | Renter-occupied |
| Utility Gas | 298 (83.0%) | 221 (73.2%) |
| Bottled, Tank, or LP Gas | 23 (6.4%) | 3 (1.0%) |
| Electricity | 24 (6.7%) | 72 (23.8%) |
| Fuel Oil or Kerosene | 4 (1.1%) | 0 (0.0%) |
| Coal or Coke | 0 (0.0%) | 0 (0.0%) |
| All other Fuels | 10 (2.8%) | 6 (2.0%) |
| No Fuel Used | 0 (0.0%) | 0 (0.0%) |
| Total | 359 (100.0%) | 302 (100.0%) |
Household Vehicle Usage in Sandstone
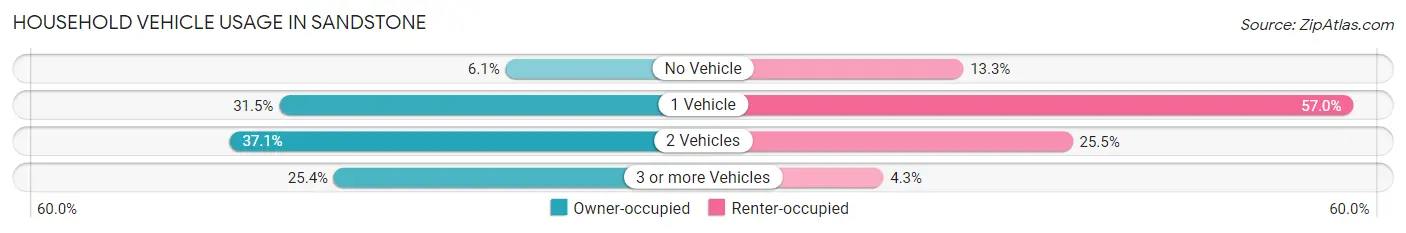
| Vehicles per Household | Owner-occupied | Renter-occupied |
| No Vehicle | 22 (6.1%) | 40 (13.3%) |
| 1 Vehicle | 113 (31.5%) | 172 (57.0%) |
| 2 Vehicles | 133 (37.0%) | 77 (25.5%) |
| 3 or more Vehicles | 91 (25.4%) | 13 (4.3%) |
| Total | 359 (100.0%) | 302 (100.0%) |
Real Estate & Mortgages in Sandstone
Real Estate and Mortgage Overview in Sandstone
| Characteristic | Without Mortgage | With Mortgage |
| Housing Units | 126 | 233 |
| Median Property Value | $133,300 | $115,700 |
| Median Household Income | $40,000 | $23 |
| Monthly Housing Costs | $470 | $0 |
| Real Estate Taxes | $1,150 | $10 |
Property Value by Mortgage Status in Sandstone
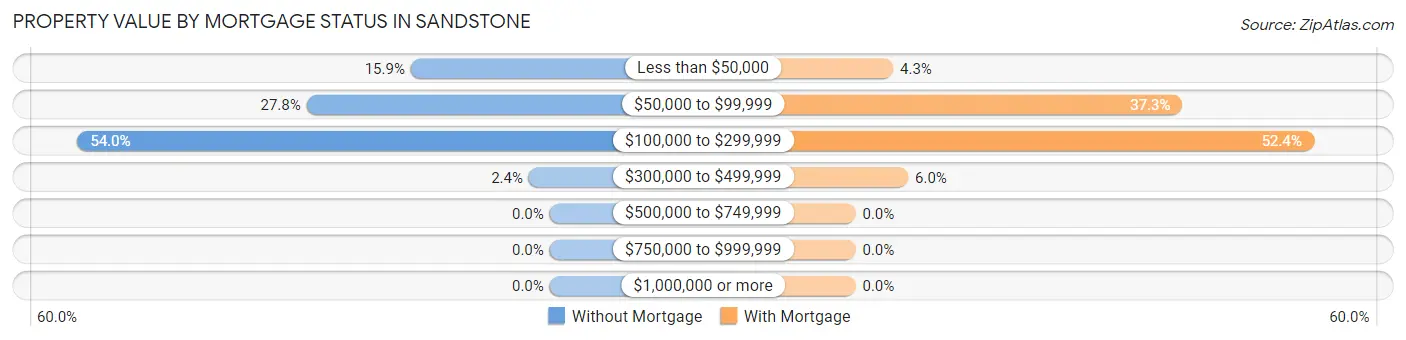
| Property Value | Without Mortgage | With Mortgage |
| Less than $50,000 | 20 (15.9%) | 10 (4.3%) |
| $50,000 to $99,999 | 35 (27.8%) | 87 (37.3%) |
| $100,000 to $299,999 | 68 (54.0%) | 122 (52.4%) |
| $300,000 to $499,999 | 3 (2.4%) | 14 (6.0%) |
| $500,000 to $749,999 | 0 (0.0%) | 0 (0.0%) |
| $750,000 to $999,999 | 0 (0.0%) | 0 (0.0%) |
| $1,000,000 or more | 0 (0.0%) | 0 (0.0%) |
| Total | 126 (100.0%) | 233 (100.0%) |
Household Income by Mortgage Status in Sandstone
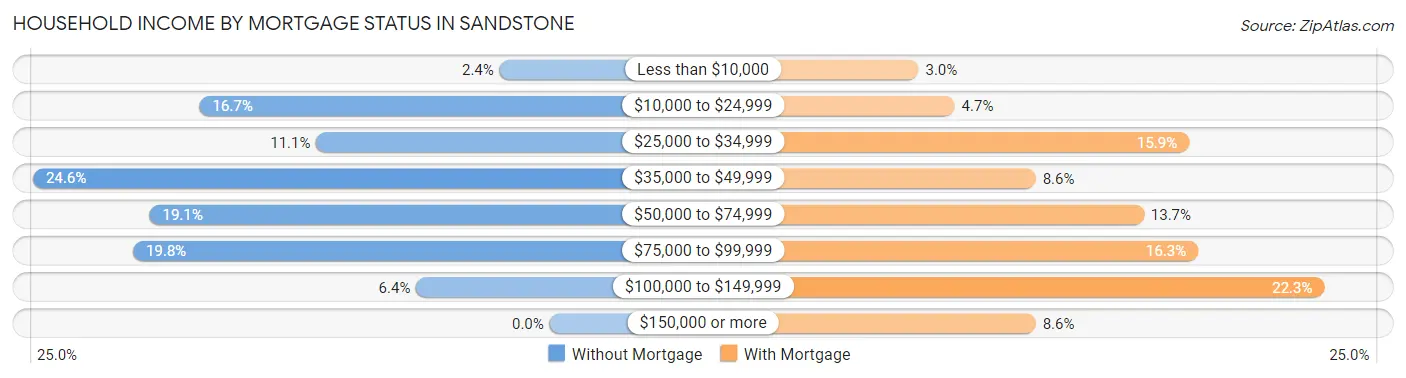
| Household Income | Without Mortgage | With Mortgage |
| Less than $10,000 | 3 (2.4%) | 7 (3.0%) |
| $10,000 to $24,999 | 21 (16.7%) | 11 (4.7%) |
| $25,000 to $34,999 | 14 (11.1%) | 37 (15.9%) |
| $35,000 to $49,999 | 31 (24.6%) | 20 (8.6%) |
| $50,000 to $74,999 | 24 (19.1%) | 32 (13.7%) |
| $75,000 to $99,999 | 25 (19.8%) | 38 (16.3%) |
| $100,000 to $149,999 | 8 (6.4%) | 52 (22.3%) |
| $150,000 or more | 0 (0.0%) | 20 (8.6%) |
| Total | 126 (100.0%) | 233 (100.0%) |
Property Value to Household Income Ratio in Sandstone
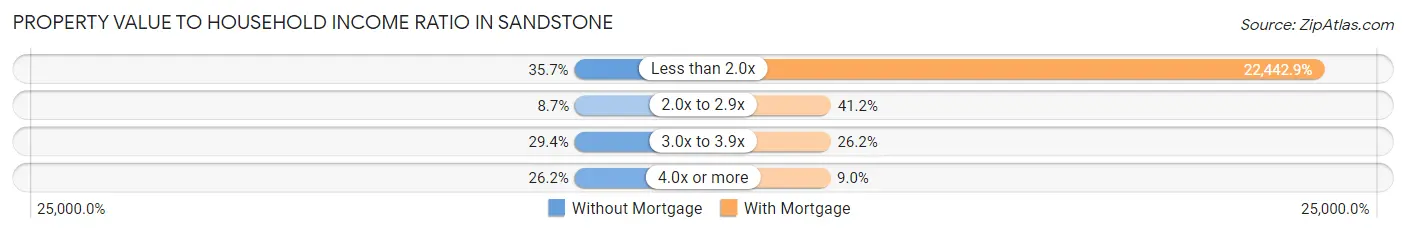
| Value-to-Income Ratio | Without Mortgage | With Mortgage |
| Less than 2.0x | 45 (35.7%) | 52,292 (22,442.9%) |
| 2.0x to 2.9x | 11 (8.7%) | 96 (41.2%) |
| 3.0x to 3.9x | 37 (29.4%) | 61 (26.2%) |
| 4.0x or more | 33 (26.2%) | 21 (9.0%) |
| Total | 126 (100.0%) | 233 (100.0%) |
Real Estate Taxes by Mortgage Status in Sandstone
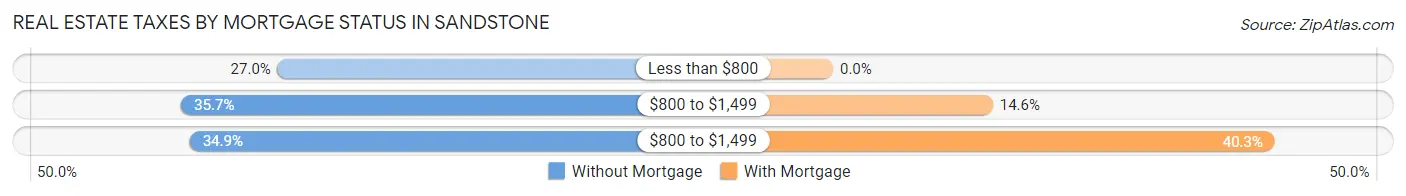
| Property Taxes | Without Mortgage | With Mortgage |
| Less than $800 | 34 (27.0%) | 0 (0.0%) |
| $800 to $1,499 | 45 (35.7%) | 34 (14.6%) |
| $800 to $1,499 | 44 (34.9%) | 94 (40.3%) |
| Total | 126 (100.0%) | 233 (100.0%) |
Health & Disability in Sandstone
Health Insurance Coverage by Age in Sandstone
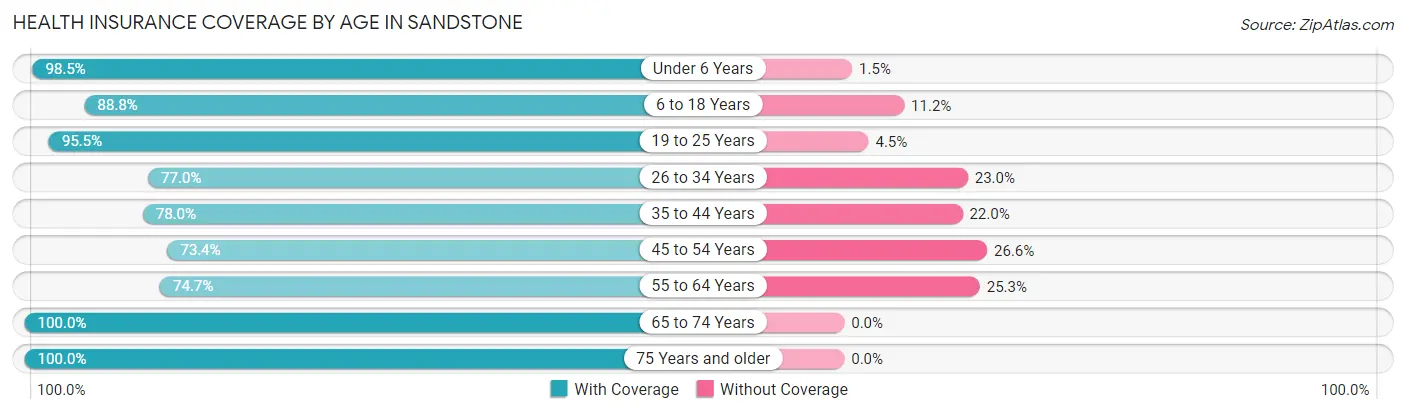
| Age Bracket | With Coverage | Without Coverage |
| Under 6 Years | 134 (98.5%) | 2 (1.5%) |
| 6 to 18 Years | 215 (88.8%) | 27 (11.2%) |
| 19 to 25 Years | 190 (95.5%) | 9 (4.5%) |
| 26 to 34 Years | 137 (77.0%) | 41 (23.0%) |
| 35 to 44 Years | 145 (78.0%) | 41 (22.0%) |
| 45 to 54 Years | 124 (73.4%) | 45 (26.6%) |
| 55 to 64 Years | 139 (74.7%) | 47 (25.3%) |
| 65 to 74 Years | 124 (100.0%) | 0 (0.0%) |
| 75 Years and older | 172 (100.0%) | 0 (0.0%) |
| Total | 1,380 (86.7%) | 212 (13.3%) |
Health Insurance Coverage by Citizenship Status in Sandstone
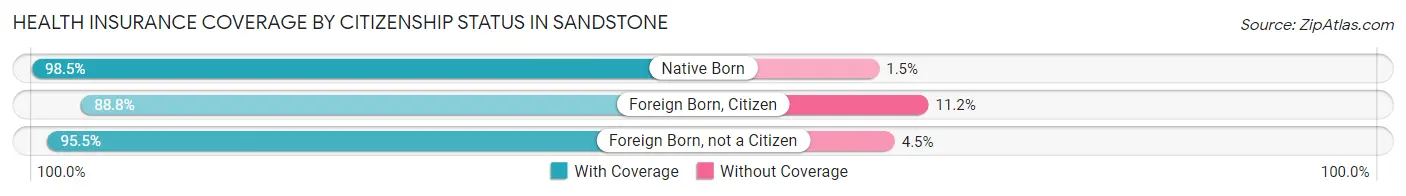
| Citizenship Status | With Coverage | Without Coverage |
| Native Born | 134 (98.5%) | 2 (1.5%) |
| Foreign Born, Citizen | 215 (88.8%) | 27 (11.2%) |
| Foreign Born, not a Citizen | 190 (95.5%) | 9 (4.5%) |
Health Insurance Coverage by Household Income in Sandstone
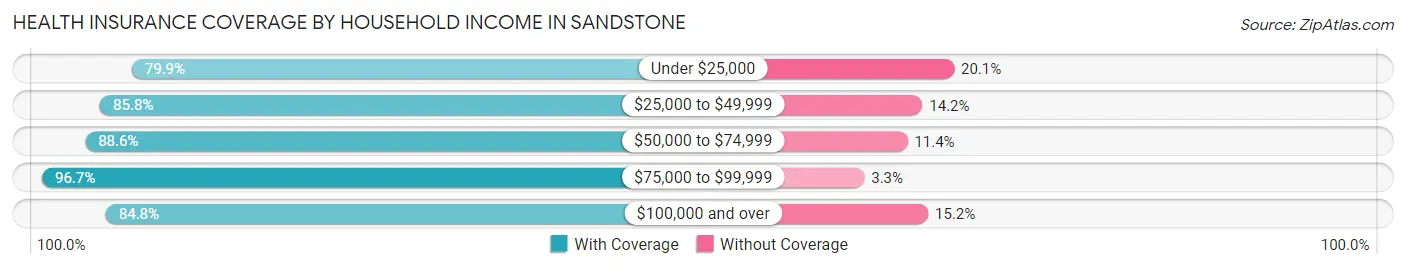
| Household Income | With Coverage | Without Coverage |
| Under $25,000 | 306 (79.9%) | 77 (20.1%) |
| $25,000 to $49,999 | 291 (85.8%) | 48 (14.2%) |
| $50,000 to $74,999 | 195 (88.6%) | 25 (11.4%) |
| $75,000 to $99,999 | 265 (96.7%) | 9 (3.3%) |
| $100,000 and over | 295 (84.8%) | 53 (15.2%) |
Public vs Private Health Insurance Coverage by Age in Sandstone
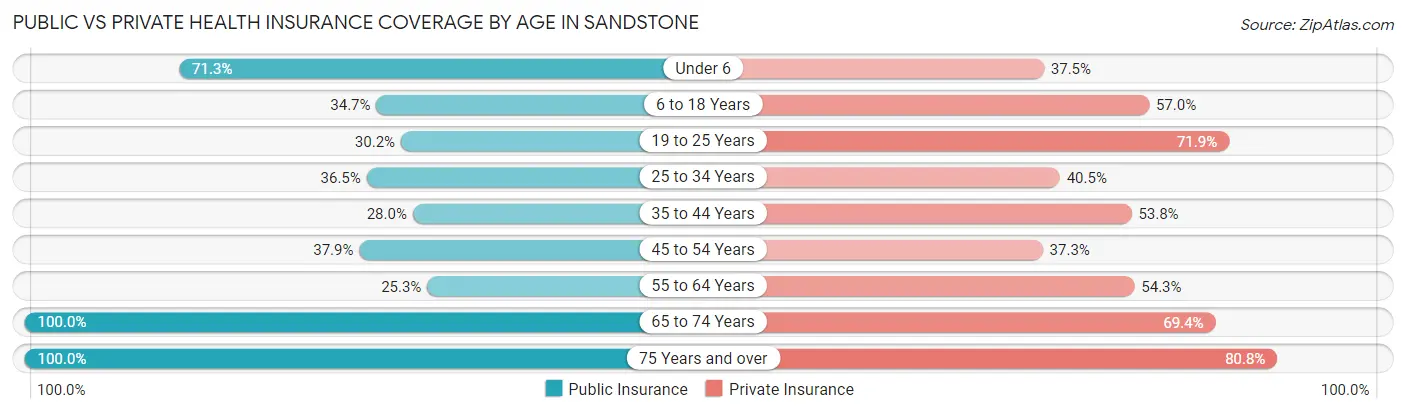
| Age Bracket | Public Insurance | Private Insurance |
| Under 6 | 97 (71.3%) | 51 (37.5%) |
| 6 to 18 Years | 84 (34.7%) | 138 (57.0%) |
| 19 to 25 Years | 60 (30.1%) | 143 (71.9%) |
| 25 to 34 Years | 65 (36.5%) | 72 (40.5%) |
| 35 to 44 Years | 52 (28.0%) | 100 (53.8%) |
| 45 to 54 Years | 64 (37.9%) | 63 (37.3%) |
| 55 to 64 Years | 47 (25.3%) | 101 (54.3%) |
| 65 to 74 Years | 124 (100.0%) | 86 (69.4%) |
| 75 Years and over | 172 (100.0%) | 139 (80.8%) |
| Total | 765 (48.0%) | 893 (56.1%) |
Disability Status by Sex by Age in Sandstone
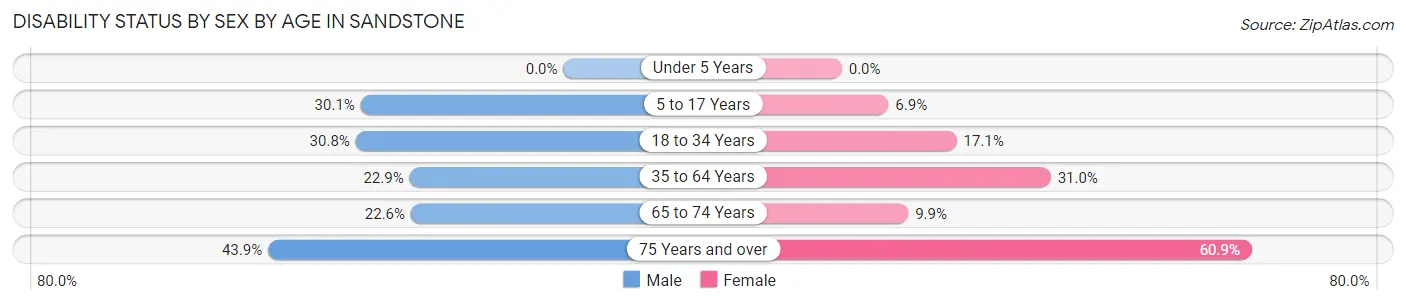
| Age Bracket | Male | Female |
| Under 5 Years | 0 (0.0%) | 0 (0.0%) |
| 5 to 17 Years | 31 (30.1%) | 9 (6.9%) |
| 18 to 34 Years | 70 (30.8%) | 30 (17.1%) |
| 35 to 64 Years | 61 (22.9%) | 85 (31.0%) |
| 65 to 74 Years | 12 (22.6%) | 7 (9.9%) |
| 75 Years and over | 25 (43.9%) | 70 (60.9%) |
Disability Class by Sex by Age in Sandstone
Disability Class: Hearing Difficulty
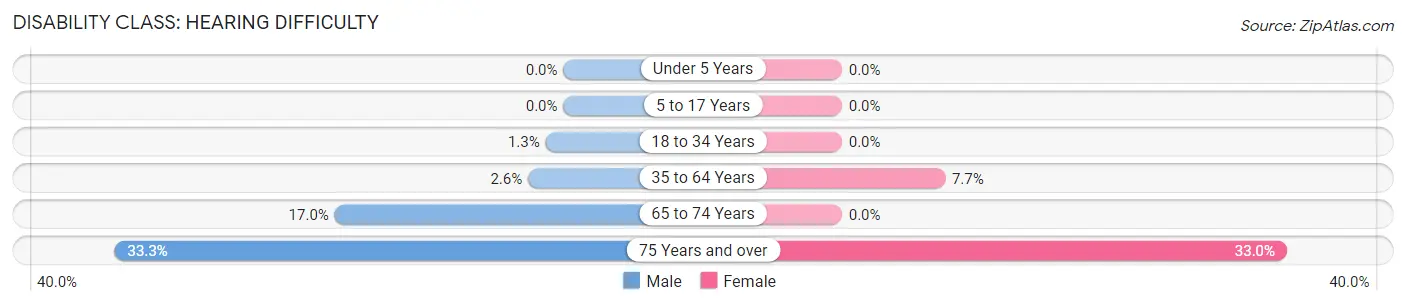
| Age Bracket | Male | Female |
| Under 5 Years | 0 (0.0%) | 0 (0.0%) |
| 5 to 17 Years | 0 (0.0%) | 0 (0.0%) |
| 18 to 34 Years | 3 (1.3%) | 0 (0.0%) |
| 35 to 64 Years | 7 (2.6%) | 21 (7.7%) |
| 65 to 74 Years | 9 (17.0%) | 0 (0.0%) |
| 75 Years and over | 19 (33.3%) | 38 (33.0%) |
Disability Class: Vision Difficulty
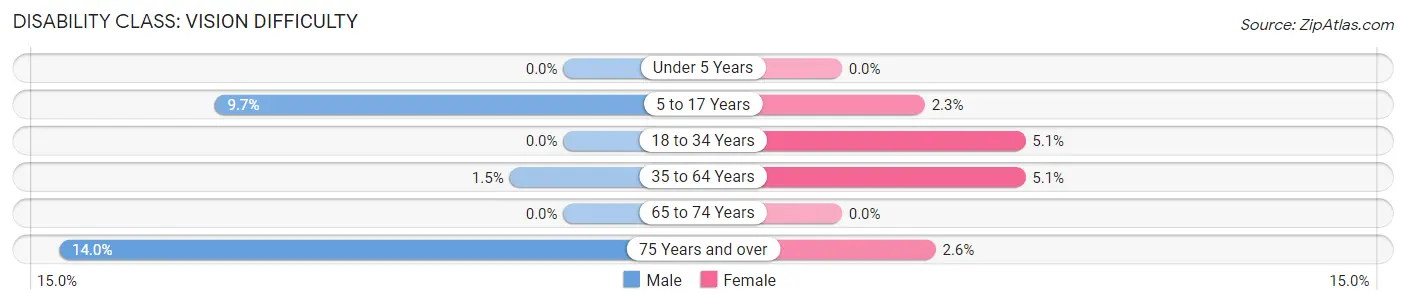
| Age Bracket | Male | Female |
| Under 5 Years | 0 (0.0%) | 0 (0.0%) |
| 5 to 17 Years | 10 (9.7%) | 3 (2.3%) |
| 18 to 34 Years | 0 (0.0%) | 9 (5.1%) |
| 35 to 64 Years | 4 (1.5%) | 14 (5.1%) |
| 65 to 74 Years | 0 (0.0%) | 0 (0.0%) |
| 75 Years and over | 8 (14.0%) | 3 (2.6%) |
Disability Class: Cognitive Difficulty
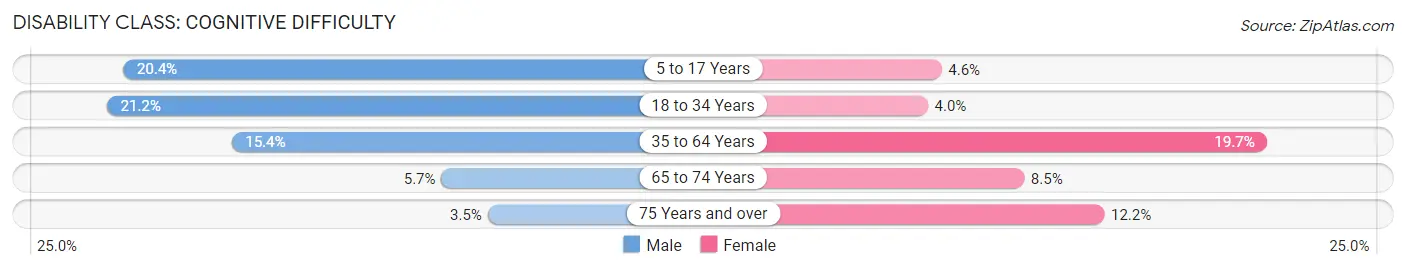
| Age Bracket | Male | Female |
| 5 to 17 Years | 21 (20.4%) | 6 (4.6%) |
| 18 to 34 Years | 48 (21.1%) | 7 (4.0%) |
| 35 to 64 Years | 41 (15.4%) | 54 (19.7%) |
| 65 to 74 Years | 3 (5.7%) | 6 (8.5%) |
| 75 Years and over | 2 (3.5%) | 14 (12.2%) |
Disability Class: Ambulatory Difficulty
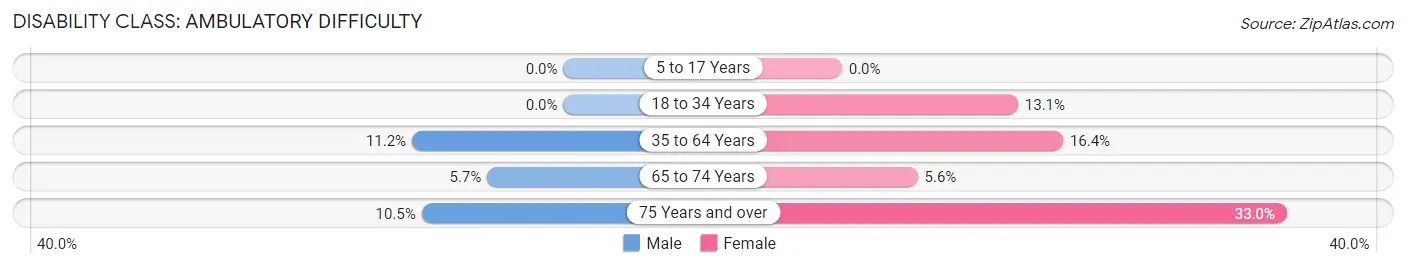
| Age Bracket | Male | Female |
| 5 to 17 Years | 0 (0.0%) | 0 (0.0%) |
| 18 to 34 Years | 0 (0.0%) | 23 (13.1%) |
| 35 to 64 Years | 30 (11.2%) | 45 (16.4%) |
| 65 to 74 Years | 3 (5.7%) | 4 (5.6%) |
| 75 Years and over | 6 (10.5%) | 38 (33.0%) |
Disability Class: Self-Care Difficulty
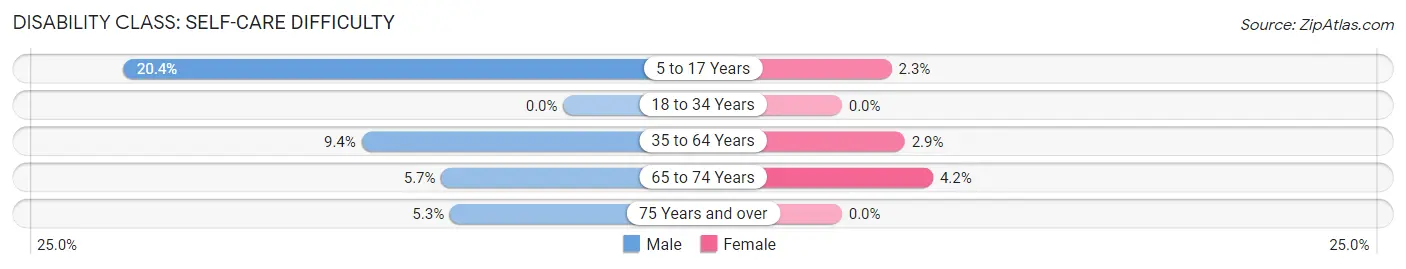
| Age Bracket | Male | Female |
| 5 to 17 Years | 21 (20.4%) | 3 (2.3%) |
| 18 to 34 Years | 0 (0.0%) | 0 (0.0%) |
| 35 to 64 Years | 25 (9.4%) | 8 (2.9%) |
| 65 to 74 Years | 3 (5.7%) | 3 (4.2%) |
| 75 Years and over | 3 (5.3%) | 0 (0.0%) |
Technology Access in Sandstone
Computing Device Access in Sandstone
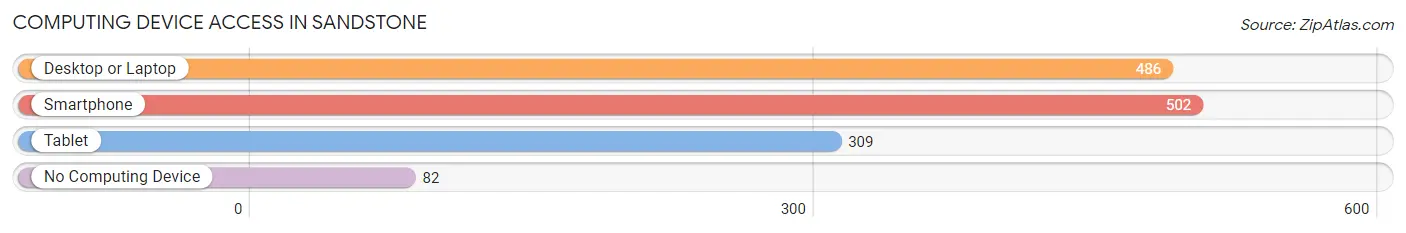
| Device Type | # Households | % Households |
| Desktop or Laptop | 486 | 73.5% |
| Smartphone | 502 | 75.9% |
| Tablet | 309 | 46.8% |
| No Computing Device | 82 | 12.4% |
| Total | 661 | 100.0% |
Internet Access in Sandstone
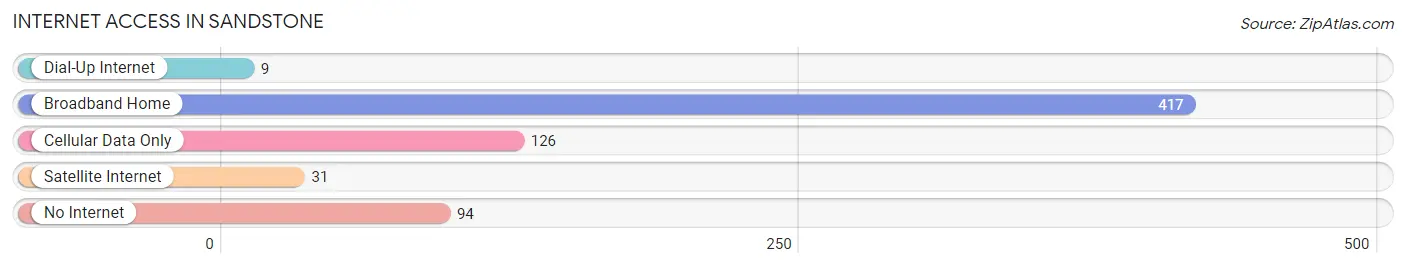
| Internet Type | # Households | % Households |
| Dial-Up Internet | 9 | 1.4% |
| Broadband Home | 417 | 63.1% |
| Cellular Data Only | 126 | 19.1% |
| Satellite Internet | 31 | 4.7% |
| No Internet | 94 | 14.2% |
| Total | 661 | 100.0% |
Sandstone Summary
Sandstone, Minnesota is a small city located in Pine County, Minnesota. It is situated on the banks of the Kettle River, and is the county seat of Pine County. The city has a population of approximately 2,000 people, and is located about 70 miles north of Minneapolis.
History
The area that is now Sandstone was first settled in the late 1800s by a group of Finnish immigrants. The immigrants were attracted to the area due to its abundance of natural resources, including timber and iron ore. The first permanent settlement in the area was established in 1887, and the town was officially incorporated in 1891.
The town was named after the sandstone formations that are found in the area. The sandstone was used to build many of the early buildings in the town, including the courthouse and the jail.
The town grew rapidly in the early 1900s, and by 1910, the population had grown to over 1,000 people. The town was a major center for the logging industry, and the local economy was largely based on the timber industry.
In the 1920s, the town began to decline as the timber industry began to decline. The population dropped to just over 500 people by 1930. The town was able to survive the Great Depression, and the population began to slowly increase in the 1940s.
The town experienced a major economic boom in the 1950s and 1960s, as the iron ore industry began to expand. The population of the town grew to over 2,000 people by 1970.
Geography
Sandstone is located in the northern part of Minnesota, in Pine County. The city is situated on the banks of the Kettle River, and is surrounded by rolling hills and forests. The city is located about 70 miles north of Minneapolis.
The climate in Sandstone is typical of the northern Midwest, with cold winters and warm summers. The average temperature in the winter is around 20 degrees Fahrenheit, and the average temperature in the summer is around 70 degrees Fahrenheit.
Economy
The economy of Sandstone is largely based on the timber and iron ore industries. The timber industry is still a major employer in the area, and the iron ore industry is also a major contributor to the local economy.
The city also has a number of small businesses, including restaurants, retail stores, and service providers. The city also has a number of tourist attractions, including the Kettle River State Park and the Sandstone Historical Society Museum.
Demographics
As of the 2010 census, the population of Sandstone was 2,053 people. The racial makeup of the city was 97.3% White, 0.7% African American, 0.3% Native American, 0.2% Asian, 0.1% Pacific Islander, and 1.4% from other races.
The median household income in Sandstone was $37,917, and the median family income was $45,938. The per capita income in the city was $19,945. About 11.3% of the population was below the poverty line.
The population of Sandstone is largely made up of people of Finnish descent. The city also has a large number of people of German, Irish, and Swedish descent. The city also has a small population of Native Americans, including members of the Ojibwe tribe.
Common Questions
What is Per Capita Income in Sandstone?
Per Capita income in Sandstone is $16,701.
What is the Median Family Income in Sandstone?
Median Family Income in Sandstone is $50,833.
What is the Median Household income in Sandstone?
Median Household Income in Sandstone is $39,602.
What is Income or Wage Gap in Sandstone?
Income or Wage Gap in Sandstone is 32.0%.
Women in Sandstone earn 68.0 cents for every dollar earned by a man.
What is Inequality or Gini Index in Sandstone?
Inequality or Gini Index in Sandstone is 0.46.
What is the Total Population of Sandstone?
Total Population of Sandstone is 2,566.
What is the Total Male Population of Sandstone?
Total Male Population of Sandstone is 1,686.
What is the Total Female Population of Sandstone?
Total Female Population of Sandstone is 880.
What is the Ratio of Males per 100 Females in Sandstone?
There are 191.59 Males per 100 Females in Sandstone.
What is the Ratio of Females per 100 Males in Sandstone?
There are 52.19 Females per 100 Males in Sandstone.
What is the Median Population Age in Sandstone?
Median Population Age in Sandstone is 39.6 Years.
What is the Average Family Size in Sandstone
Average Family Size in Sandstone is 3.1 People.
What is the Average Household Size in Sandstone
Average Household Size in Sandstone is 2.4 People.
How Large is the Labor Force in Sandstone?
There are 662 People in the Labor Forcein in Sandstone.
What is the Percentage of People in the Labor Force in Sandstone?
29.4% of People are in the Labor Force in Sandstone.
What is the Unemployment Rate in Sandstone?
Unemployment Rate in Sandstone is 5.4%.