Hardwick, GA Map & Demographics
Hardwick Map
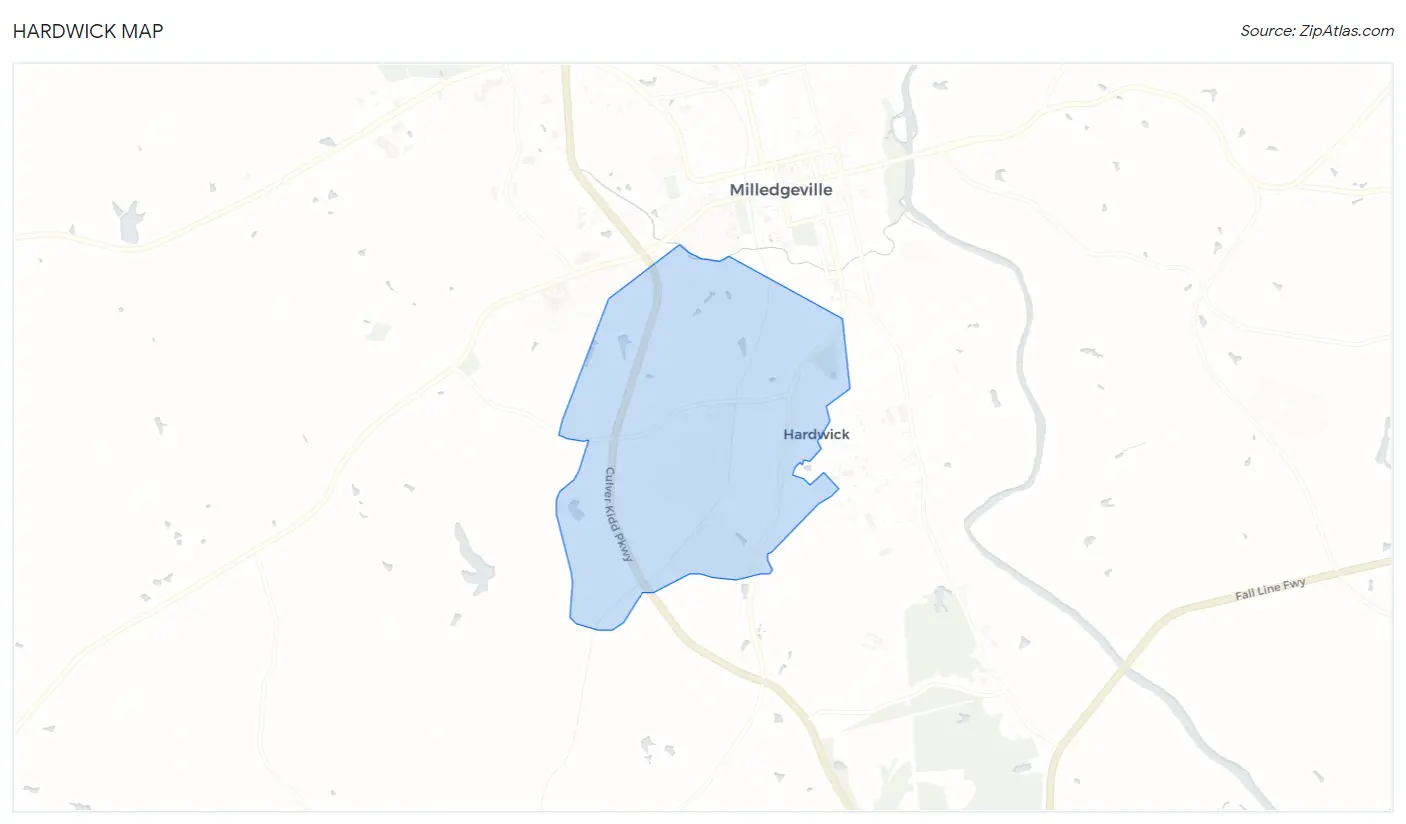
Hardwick Overview
$24,968
PER CAPITA INCOME
$34,300
AVG FAMILY INCOME
$34,587
AVG HOUSEHOLD INCOME
16.3%
WAGE / INCOME GAP [ % ]
83.7¢/ $1
WAGE / INCOME GAP [ $ ]
0.56
INEQUALITY / GINI INDEX
3,202
TOTAL POPULATION
1,463
MALE POPULATION
1,739
FEMALE POPULATION
84.13
MALES / 100 FEMALES
118.87
FEMALES / 100 MALES
48.5
MEDIAN AGE
2.9
AVG FAMILY SIZE
2.1
AVG HOUSEHOLD SIZE
1,248
LABOR FORCE [ PEOPLE ]
47.2%
PERCENT IN LABOR FORCE
4.9%
UNEMPLOYMENT RATE
Hardwick Zip Codes
Hardwick Area Codes
Income in Hardwick
Income Overview in Hardwick
Per Capita Income in Hardwick is $24,968, while median incomes of families and households are $34,300 and $34,587 respectively.
| Characteristic | Number | Measure |
| Per Capita Income | 3,202 | $24,968 |
| Median Family Income | 705 | $34,300 |
| Mean Family Income | 705 | $66,729 |
| Median Household Income | 1,430 | $34,587 |
| Mean Household Income | 1,430 | $53,002 |
| Income Deficit | 705 | $0 |
| Wage / Income Gap (%) | 3,202 | 16.28% |
| Wage / Income Gap ($) | 3,202 | 83.72¢ per $1 |
| Gini / Inequality Index | 3,202 | 0.56 |
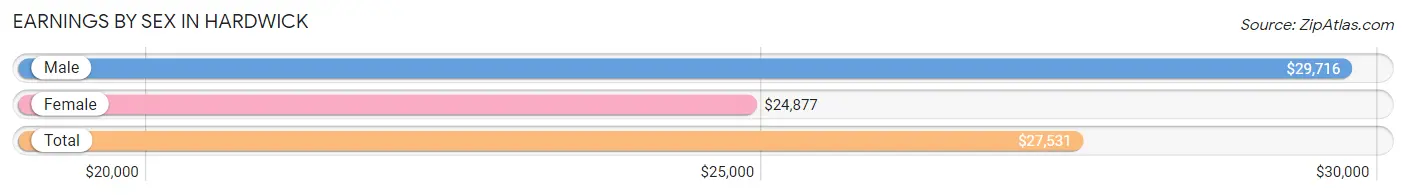
Earnings by Sex in Hardwick
Average Earnings in Hardwick are $27,531, $29,716 for men and $24,877 for women, a difference of 16.3%.
| Sex | Number | Average Earnings |
| Male | 643 (49.0%) | $29,716 |
| Female | 669 (51.0%) | $24,877 |
| Total | 1,312 (100.0%) | $27,531 |
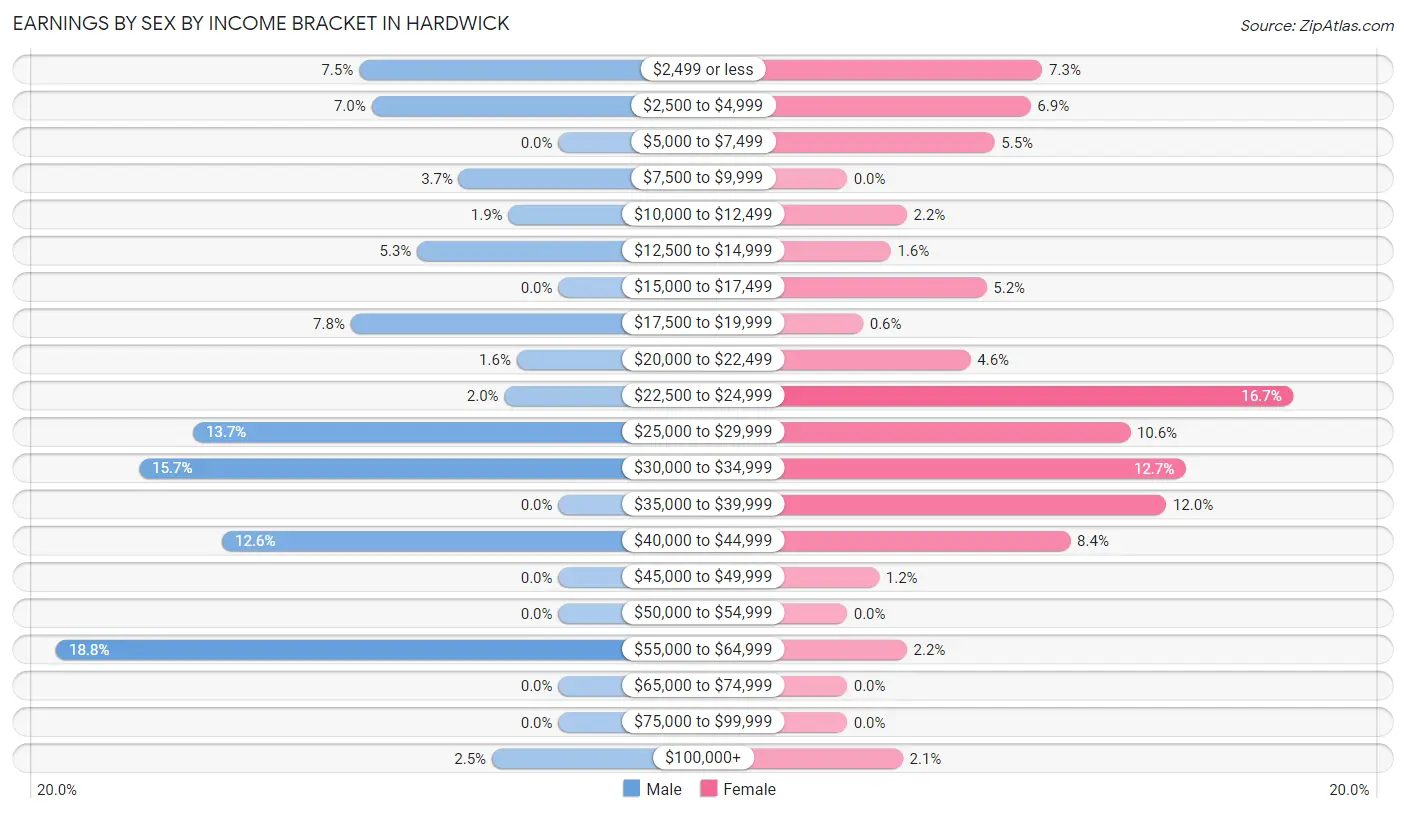
Earnings by Sex by Income Bracket in Hardwick
The most common earnings brackets in Hardwick are $55,000 to $64,999 for men (121 | 18.8%) and $22,500 to $24,999 for women (112 | 16.7%).
| Income | Male | Female |
| $2,499 or less | 48 (7.5%) | 49 (7.3%) |
| $2,500 to $4,999 | 45 (7.0%) | 46 (6.9%) |
| $5,000 to $7,499 | 0 (0.0%) | 37 (5.5%) |
| $7,500 to $9,999 | 24 (3.7%) | 0 (0.0%) |
| $10,000 to $12,499 | 12 (1.9%) | 15 (2.2%) |
| $12,500 to $14,999 | 34 (5.3%) | 11 (1.6%) |
| $15,000 to $17,499 | 0 (0.0%) | 35 (5.2%) |
| $17,500 to $19,999 | 50 (7.8%) | 4 (0.6%) |
| $20,000 to $22,499 | 10 (1.6%) | 31 (4.6%) |
| $22,500 to $24,999 | 13 (2.0%) | 112 (16.7%) |
| $25,000 to $29,999 | 88 (13.7%) | 71 (10.6%) |
| $30,000 to $34,999 | 101 (15.7%) | 85 (12.7%) |
| $35,000 to $39,999 | 0 (0.0%) | 80 (12.0%) |
| $40,000 to $44,999 | 81 (12.6%) | 56 (8.4%) |
| $45,000 to $49,999 | 0 (0.0%) | 8 (1.2%) |
| $50,000 to $54,999 | 0 (0.0%) | 0 (0.0%) |
| $55,000 to $64,999 | 121 (18.8%) | 15 (2.2%) |
| $65,000 to $74,999 | 0 (0.0%) | 0 (0.0%) |
| $75,000 to $99,999 | 0 (0.0%) | 0 (0.0%) |
| $100,000+ | 16 (2.5%) | 14 (2.1%) |
| Total | 643 (100.0%) | 669 (100.0%) |
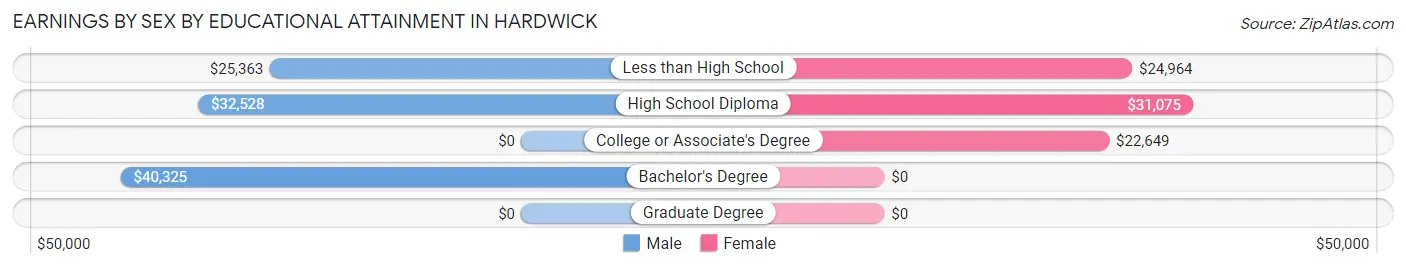
Earnings by Sex by Educational Attainment in Hardwick
Average earnings in Hardwick are $31,786 for men and $27,404 for women, a difference of 13.8%. Men with an educational attainment of bachelor's degree enjoy the highest average annual earnings of $40,325, while those with less than high school education earn the least with $25,363. Women with an educational attainment of high school diploma earn the most with the average annual earnings of $31,075, while those with college or associate's degree education have the smallest earnings of $22,649.
| Educational Attainment | Male Income | Female Income |
| Less than High School | $25,363 | $24,964 |
| High School Diploma | $32,528 | $31,075 |
| College or Associate's Degree | - | - |
| Bachelor's Degree | $40,325 | $0 |
| Graduate Degree | - | - |
| Total | $31,786 | $27,404 |
Family Income in Hardwick
Family Income Brackets in Hardwick
According to the Hardwick family income data, there are 171 families falling into the $25,000 to $34,999 income range, which is the most common income bracket and makes up 24.3% of all families.
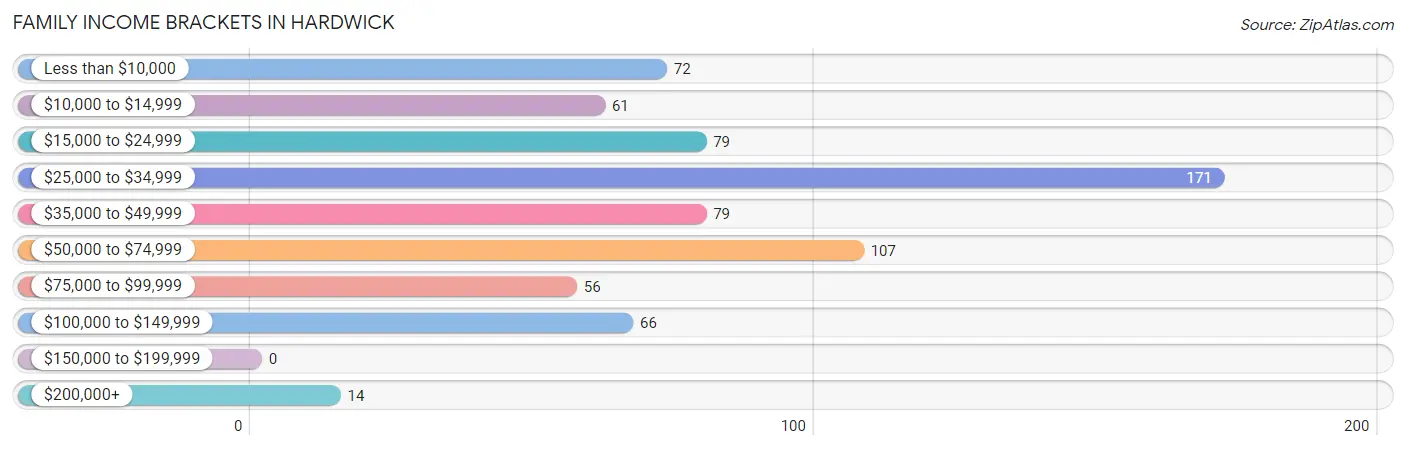
| Income Bracket | # Families | % Families |
| Less than $10,000 | 72 | 10.2% |
| $10,000 to $14,999 | 61 | 8.7% |
| $15,000 to $24,999 | 79 | 11.2% |
| $25,000 to $34,999 | 171 | 24.3% |
| $35,000 to $49,999 | 79 | 11.2% |
| $50,000 to $74,999 | 107 | 15.2% |
| $75,000 to $99,999 | 56 | 7.9% |
| $100,000 to $149,999 | 66 | 9.4% |
| $150,000 to $199,999 | 0 | 0.0% |
| $200,000+ | 14 | 2.0% |
Family Income by Famaliy Size in Hardwick
4-person families (123 | 17.4%) account for the highest median family income in Hardwick with $69,625 per family, while 4-person families (123 | 17.4%) have the highest median income of $17,406 per family member.
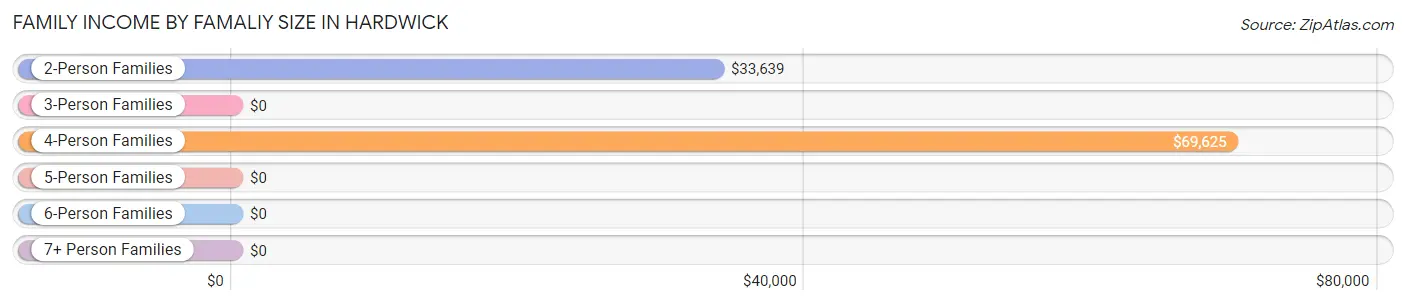
| Income Bracket | # Families | Median Income |
| 2-Person Families | 446 (63.3%) | $33,639 |
| 3-Person Families | 112 (15.9%) | $0 |
| 4-Person Families | 123 (17.4%) | $69,625 |
| 5-Person Families | 12 (1.7%) | $0 |
| 6-Person Families | 0 (0.0%) | $0 |
| 7+ Person Families | 12 (1.7%) | $0 |
| Total | 705 (100.0%) | $34,300 |
Family Income by Number of Earners in Hardwick
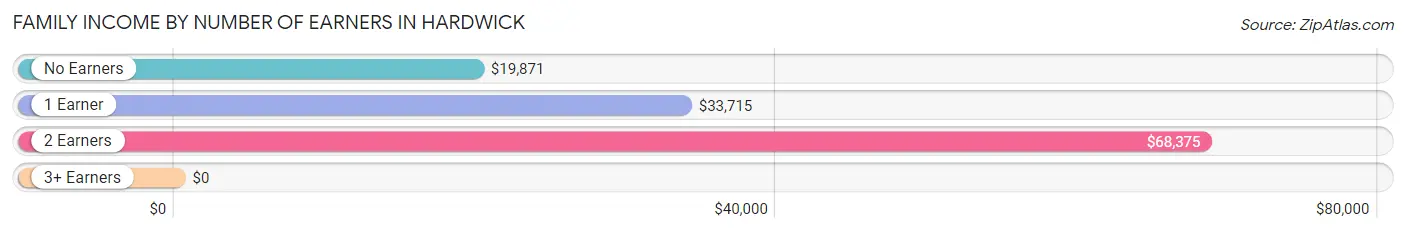
| Number of Earners | # Families | Median Income |
| No Earners | 229 (32.5%) | $19,871 |
| 1 Earner | 317 (45.0%) | $33,715 |
| 2 Earners | 145 (20.6%) | $68,375 |
| 3+ Earners | 14 (2.0%) | $0 |
| Total | 705 (100.0%) | $34,300 |
Household Income in Hardwick
Household Income Brackets in Hardwick
With 309 households falling in the category, the $50,000 to $74,999 income range is the most frequent in Hardwick, accounting for 21.6% of all households.
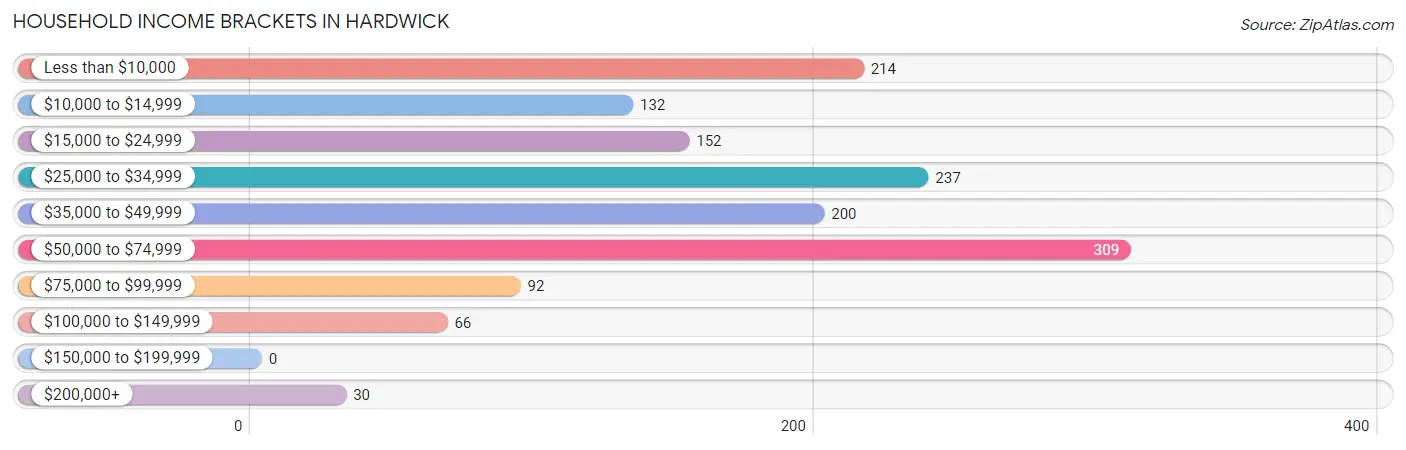
| Income Bracket | # Households | % Households |
| Less than $10,000 | 214 | 15.0% |
| $10,000 to $14,999 | 132 | 9.2% |
| $15,000 to $24,999 | 152 | 10.6% |
| $25,000 to $34,999 | 237 | 16.6% |
| $35,000 to $49,999 | 200 | 14.0% |
| $50,000 to $74,999 | 309 | 21.6% |
| $75,000 to $99,999 | 92 | 6.4% |
| $100,000 to $149,999 | 66 | 4.6% |
| $150,000 to $199,999 | 0 | 0.0% |
| $200,000+ | 30 | 2.1% |
Household Income by Householder Age in Hardwick
The median household income in Hardwick is $34,587, with the highest median household income of $36,336 found in the 65+ years age bracket for the primary householder. A total of 301 households (21.0%) fall into this category. Meanwhile, the 15 to 24 years age bracket for the primary householder has the lowest median household income of $0, with 34 households (2.4%) in this group.
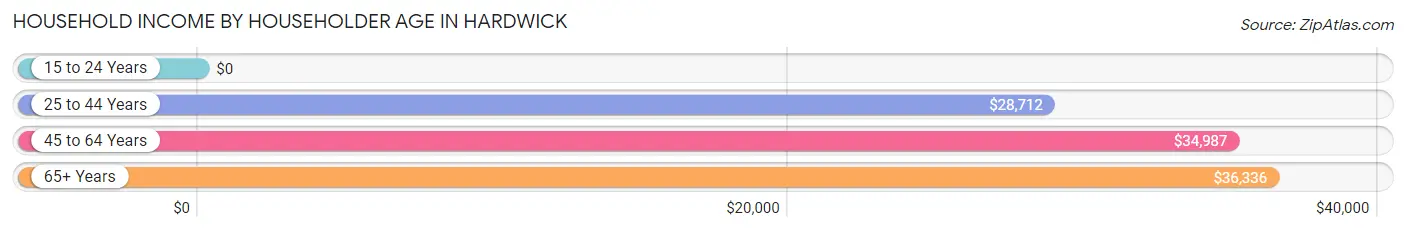
| Income Bracket | # Households | Median Income |
| 15 to 24 Years | 34 (2.4%) | $0 |
| 25 to 44 Years | 312 (21.8%) | $28,712 |
| 45 to 64 Years | 783 (54.8%) | $34,987 |
| 65+ Years | 301 (21.0%) | $36,336 |
| Total | 1,430 (100.0%) | $34,587 |
Poverty in Hardwick
Income Below Poverty by Sex and Age in Hardwick
With 34.9% poverty level for males and 27.5% for females among the residents of Hardwick, under 5 year old males and under 5 year old females are the most vulnerable to poverty, with 57 males (100.0%) and 50 females (54.9%) in their respective age groups living below the poverty level.
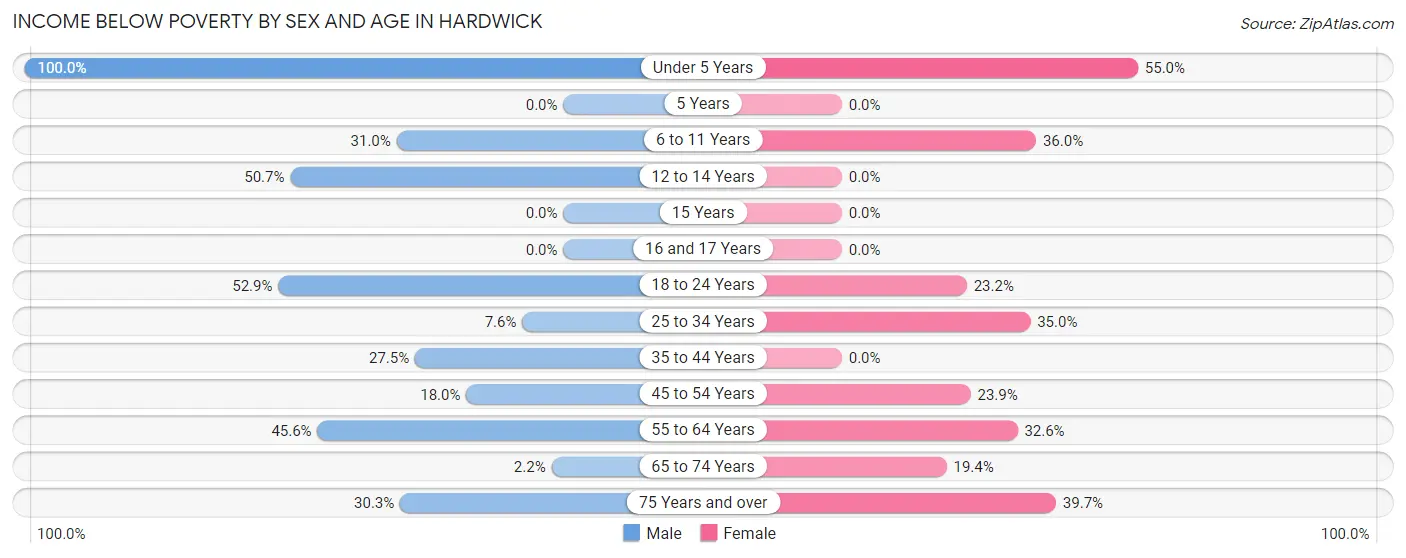
| Age Bracket | Male | Female |
| Under 5 Years | 57 (100.0%) | 50 (54.9%) |
| 5 Years | 0 (0.0%) | 0 (0.0%) |
| 6 to 11 Years | 52 (30.9%) | 40 (36.0%) |
| 12 to 14 Years | 37 (50.7%) | 0 (0.0%) |
| 15 Years | 0 (0.0%) | 0 (0.0%) |
| 16 and 17 Years | 0 (0.0%) | 0 (0.0%) |
| 18 to 24 Years | 100 (52.9%) | 16 (23.2%) |
| 25 to 34 Years | 8 (7.6%) | 71 (35.0%) |
| 35 to 44 Years | 41 (27.5%) | 0 (0.0%) |
| 45 to 54 Years | 38 (18.0%) | 65 (23.9%) |
| 55 to 64 Years | 136 (45.6%) | 104 (32.6%) |
| 65 to 74 Years | 2 (2.2%) | 35 (19.4%) |
| 75 Years and over | 20 (30.3%) | 62 (39.7%) |
| Total | 491 (34.9%) | 443 (27.5%) |
Income Above Poverty by Sex and Age in Hardwick
According to the poverty statistics in Hardwick, males aged 65 to 74 years and females aged 12 to 14 years are the age groups that are most secure financially, with 97.8% of males and 100.0% of females in these age groups living above the poverty line.
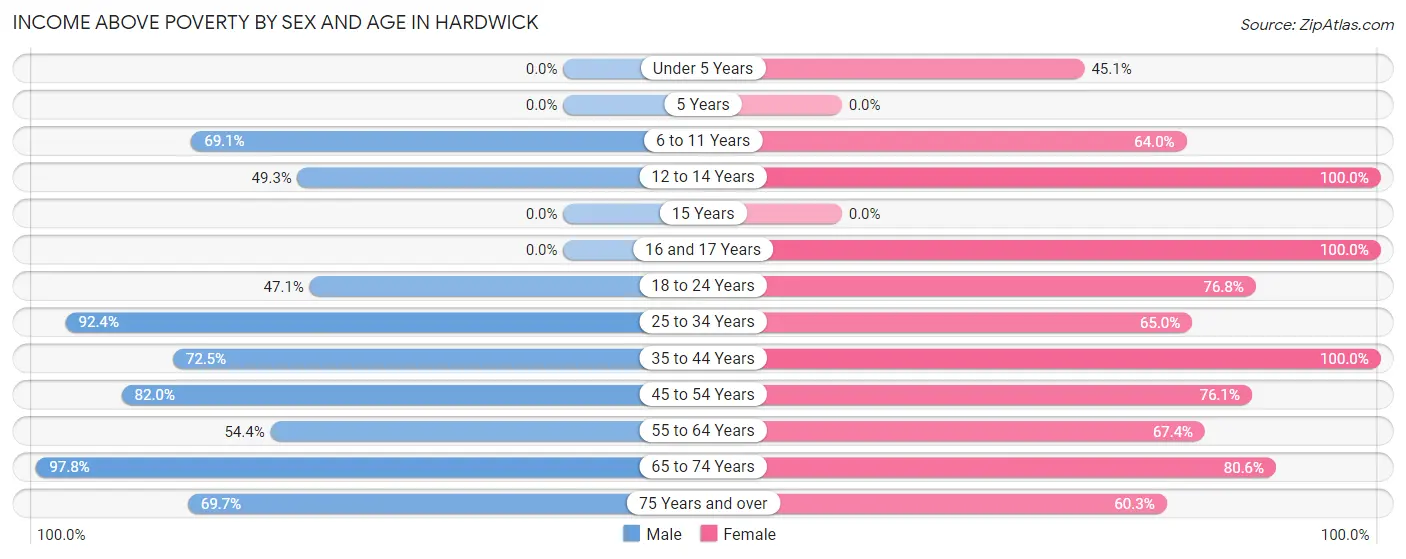
| Age Bracket | Male | Female |
| Under 5 Years | 0 (0.0%) | 41 (45.1%) |
| 5 Years | 0 (0.0%) | 0 (0.0%) |
| 6 to 11 Years | 116 (69.1%) | 71 (64.0%) |
| 12 to 14 Years | 36 (49.3%) | 57 (100.0%) |
| 15 Years | 0 (0.0%) | 0 (0.0%) |
| 16 and 17 Years | 0 (0.0%) | 5 (100.0%) |
| 18 to 24 Years | 89 (47.1%) | 53 (76.8%) |
| 25 to 34 Years | 97 (92.4%) | 132 (65.0%) |
| 35 to 44 Years | 108 (72.5%) | 150 (100.0%) |
| 45 to 54 Years | 173 (82.0%) | 207 (76.1%) |
| 55 to 64 Years | 162 (54.4%) | 215 (67.4%) |
| 65 to 74 Years | 89 (97.8%) | 145 (80.6%) |
| 75 Years and over | 46 (69.7%) | 94 (60.3%) |
| Total | 916 (65.1%) | 1,170 (72.5%) |
Income Below Poverty Among Married-Couple Families in Hardwick
The poverty statistics for married-couple families in Hardwick show that 9.2% or 22 of the total 238 families live below the poverty line. Families with no children have the highest poverty rate of 12.5%, comprising of 22 families. On the other hand, families with 1 or 2 children have the lowest poverty rate of 0.0%, which includes 0 families.
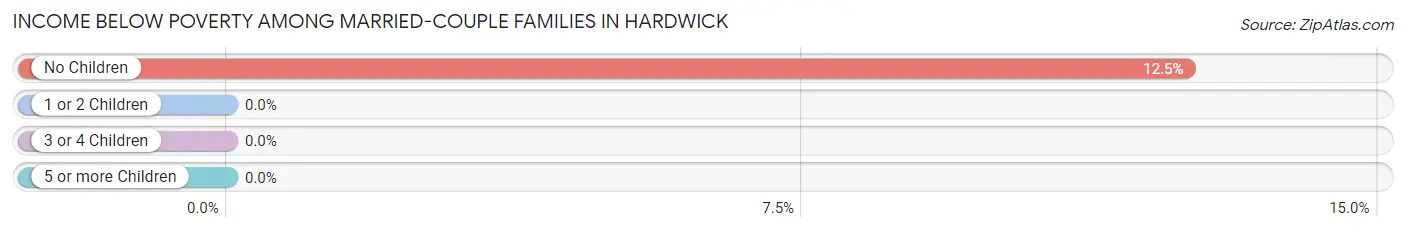
| Children | Above Poverty | Below Poverty |
| No Children | 154 (87.5%) | 22 (12.5%) |
| 1 or 2 Children | 62 (100.0%) | 0 (0.0%) |
| 3 or 4 Children | 0 (0.0%) | 0 (0.0%) |
| 5 or more Children | 0 (0.0%) | 0 (0.0%) |
| Total | 216 (90.8%) | 22 (9.2%) |
Income Below Poverty Among Single-Parent Households in Hardwick
According to the poverty data in Hardwick, 55.6% or 55 single-father households and 26.1% or 96 single-mother households are living below the poverty line. Among single-father households, those with no children have the highest poverty rate, with 29 households (100.0%) experiencing poverty. Likewise, among single-mother households, those with 5 or more children have the highest poverty rate, with 12 households (100.0%) falling below the poverty line.
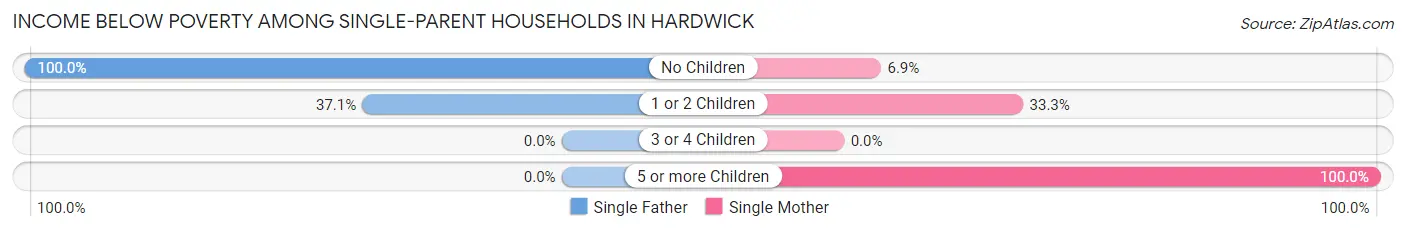
| Children | Single Father | Single Mother |
| No Children | 29 (100.0%) | 9 (6.9%) |
| 1 or 2 Children | 26 (37.1%) | 75 (33.3%) |
| 3 or 4 Children | 0 (0.0%) | 0 (0.0%) |
| 5 or more Children | 0 (0.0%) | 12 (100.0%) |
| Total | 55 (55.6%) | 96 (26.1%) |
Income Below Poverty Among Married-Couple vs Single-Parent Households in Hardwick
The poverty data for Hardwick shows that 22 of the married-couple family households (9.2%) and 151 of the single-parent households (32.3%) are living below the poverty level. Within the married-couple family households, those with no children have the highest poverty rate, with 22 households (12.5%) falling below the poverty line. Among the single-parent households, those with 5 or more children have the highest poverty rate, with 12 household (100.0%) living below poverty.
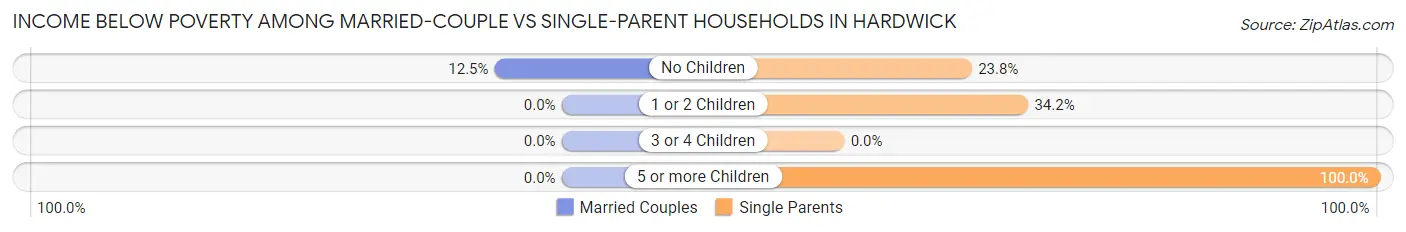
| Children | Married-Couple Families | Single-Parent Households |
| No Children | 22 (12.5%) | 38 (23.7%) |
| 1 or 2 Children | 0 (0.0%) | 101 (34.2%) |
| 3 or 4 Children | 0 (0.0%) | 0 (0.0%) |
| 5 or more Children | 0 (0.0%) | 12 (100.0%) |
| Total | 22 (9.2%) | 151 (32.3%) |
Race in Hardwick
The most populous races in Hardwick are Black / African American (2,040 | 63.7%), White / Caucasian (795 | 24.8%), and Two or more Races (352 | 11.0%).
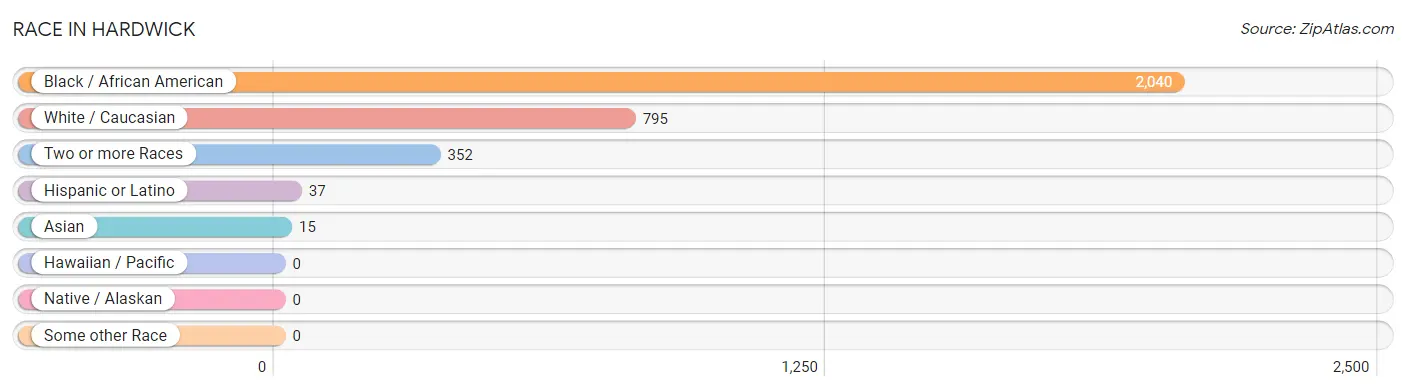
| Race | # Population | % Population |
| Asian | 15 | 0.5% |
| Black / African American | 2,040 | 63.7% |
| Hawaiian / Pacific | 0 | 0.0% |
| Hispanic or Latino | 37 | 1.2% |
| Native / Alaskan | 0 | 0.0% |
| White / Caucasian | 795 | 24.8% |
| Two or more Races | 352 | 11.0% |
| Some other Race | 0 | 0.0% |
| Total | 3,202 | 100.0% |
Ancestry in Hardwick
The most populous ancestries reported in Hardwick are English (440 | 13.7%), American (188 | 5.9%), Irish (159 | 5.0%), German (141 | 4.4%), and Thai (139 | 4.3%), together accounting for 33.3% of all Hardwick residents.
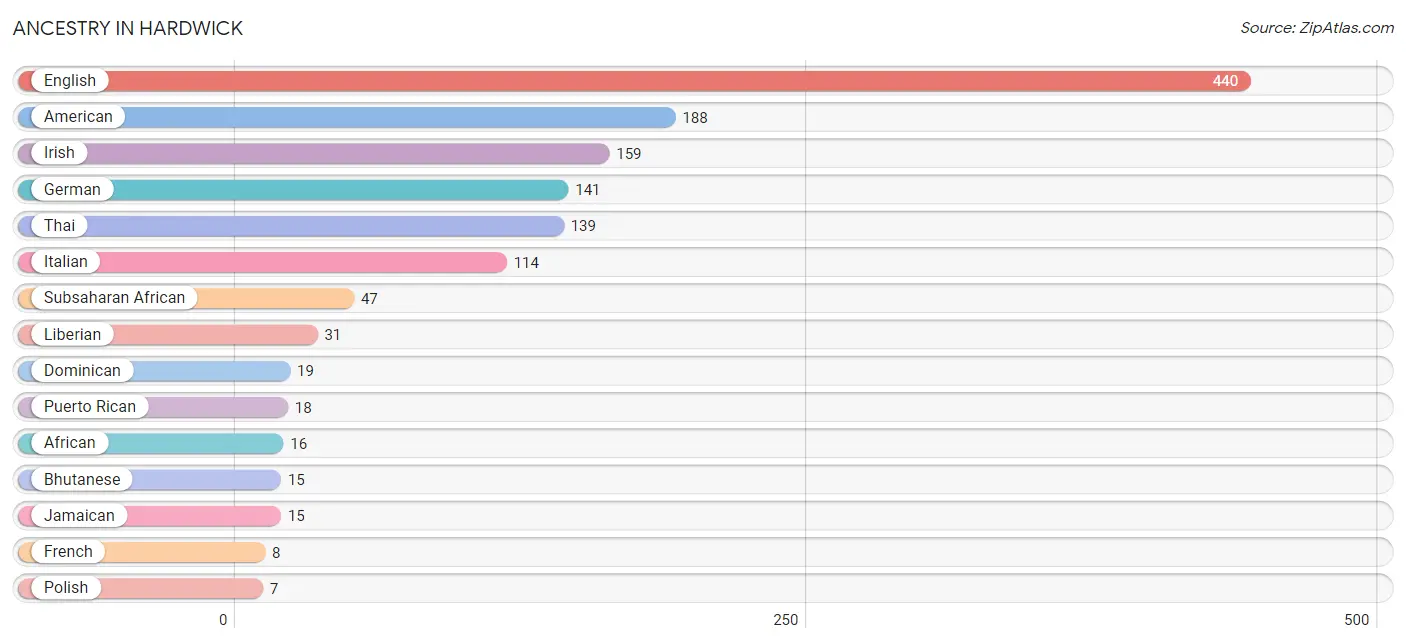
| Ancestry | # Population | % Population |
| African | 16 | 0.5% |
| American | 188 | 5.9% |
| Bhutanese | 15 | 0.5% |
| Dominican | 19 | 0.6% |
| English | 440 | 13.7% |
| French | 8 | 0.3% |
| German | 141 | 4.4% |
| Irish | 159 | 5.0% |
| Italian | 114 | 3.6% |
| Jamaican | 15 | 0.5% |
| Liberian | 31 | 1.0% |
| Polish | 7 | 0.2% |
| Puerto Rican | 18 | 0.6% |
| Scottish | 4 | 0.1% |
| Subsaharan African | 47 | 1.5% |
| Thai | 139 | 4.3% | View All 16 Rows |
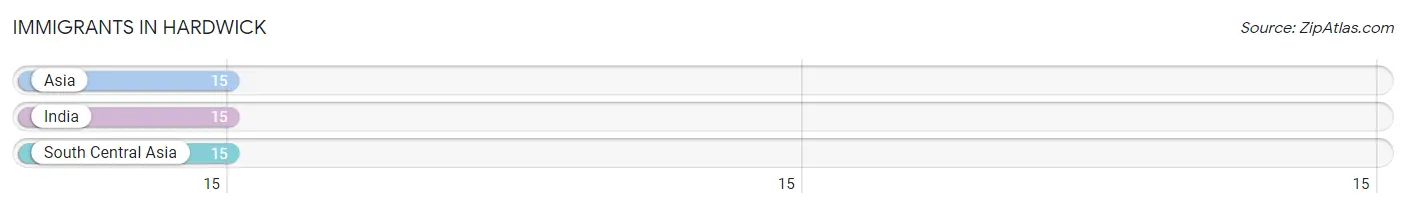
Immigrants in Hardwick
The most numerous immigrant groups reported in Hardwick came from Asia (15 | 0.5%), India (15 | 0.5%), and South Central Asia (15 | 0.5%), together accounting for 1.4% of all Hardwick residents.
| Immigration Origin | # Population | % Population |
| Asia | 15 | 0.5% |
| India | 15 | 0.5% |
| South Central Asia | 15 | 0.5% | View All 3 Rows |
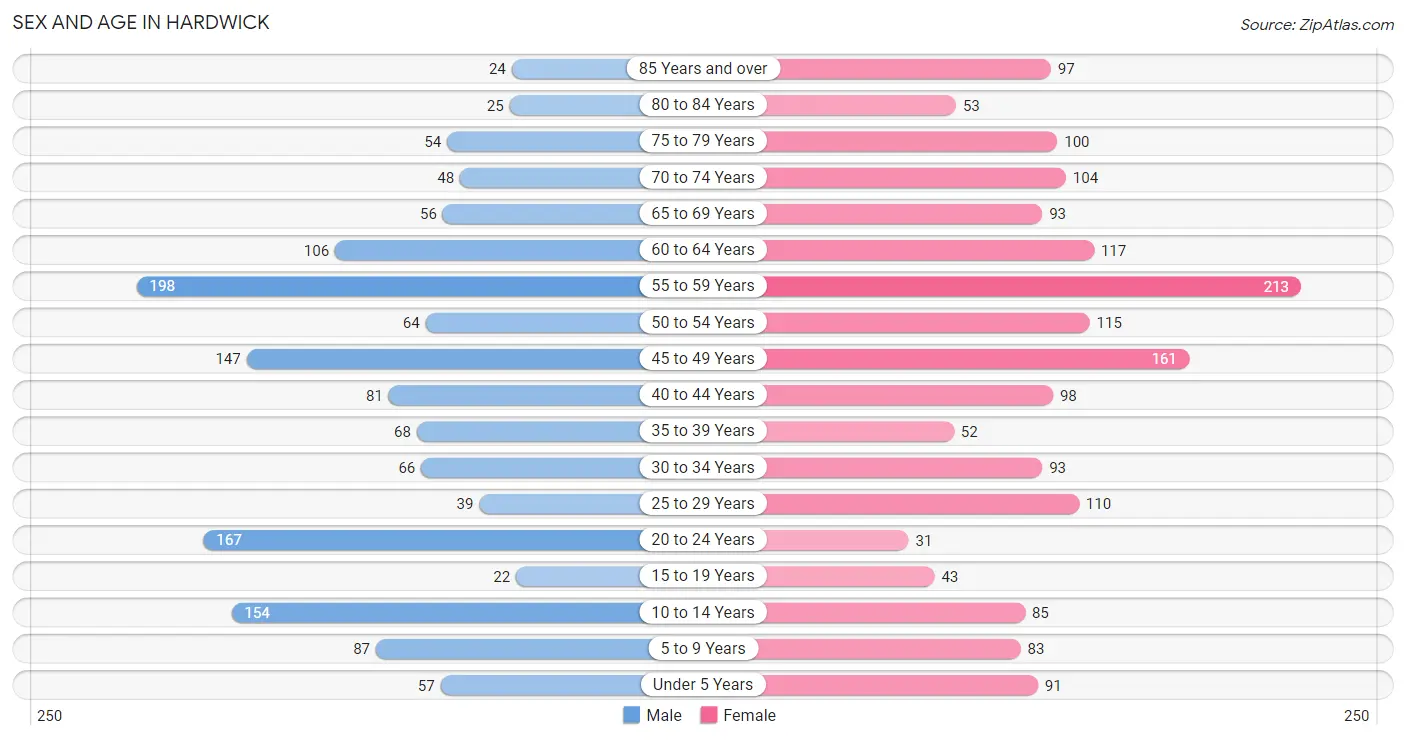
Sex and Age in Hardwick
Sex and Age in Hardwick
The most populous age groups in Hardwick are 55 to 59 Years (198 | 13.5%) for men and 55 to 59 Years (213 | 12.2%) for women.
| Age Bracket | Male | Female |
| Under 5 Years | 57 (3.9%) | 91 (5.2%) |
| 5 to 9 Years | 87 (5.9%) | 83 (4.8%) |
| 10 to 14 Years | 154 (10.5%) | 85 (4.9%) |
| 15 to 19 Years | 22 (1.5%) | 43 (2.5%) |
| 20 to 24 Years | 167 (11.4%) | 31 (1.8%) |
| 25 to 29 Years | 39 (2.7%) | 110 (6.3%) |
| 30 to 34 Years | 66 (4.5%) | 93 (5.3%) |
| 35 to 39 Years | 68 (4.6%) | 52 (3.0%) |
| 40 to 44 Years | 81 (5.5%) | 98 (5.6%) |
| 45 to 49 Years | 147 (10.1%) | 161 (9.3%) |
| 50 to 54 Years | 64 (4.4%) | 115 (6.6%) |
| 55 to 59 Years | 198 (13.5%) | 213 (12.2%) |
| 60 to 64 Years | 106 (7.2%) | 117 (6.7%) |
| 65 to 69 Years | 56 (3.8%) | 93 (5.3%) |
| 70 to 74 Years | 48 (3.3%) | 104 (6.0%) |
| 75 to 79 Years | 54 (3.7%) | 100 (5.8%) |
| 80 to 84 Years | 25 (1.7%) | 53 (3.0%) |
| 85 Years and over | 24 (1.6%) | 97 (5.6%) |
| Total | 1,463 (100.0%) | 1,739 (100.0%) |
Families and Households in Hardwick
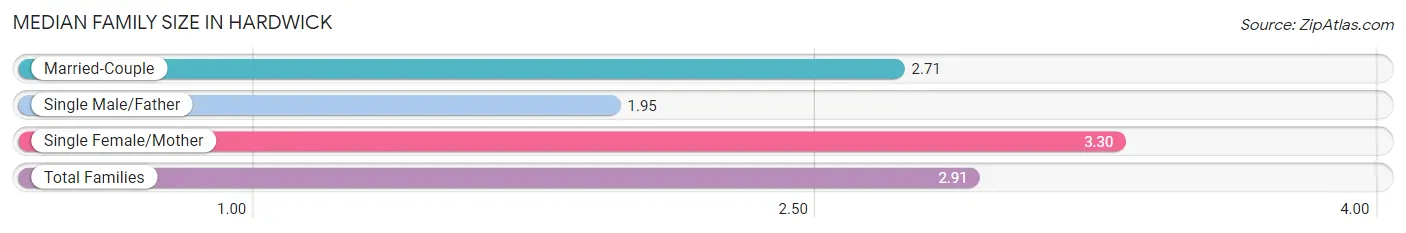
Median Family Size in Hardwick
The median family size in Hardwick is 2.91 persons per family, with single female/mother families (368 | 52.2%) accounting for the largest median family size of 3.3 persons per family. On the other hand, single male/father families (99 | 14.0%) represent the smallest median family size with 1.95 persons per family.
| Family Type | # Families | Family Size |
| Married-Couple | 238 (33.8%) | 2.71 |
| Single Male/Father | 99 (14.0%) | 1.95 |
| Single Female/Mother | 368 (52.2%) | 3.30 |
| Total Families | 705 (100.0%) | 2.91 |
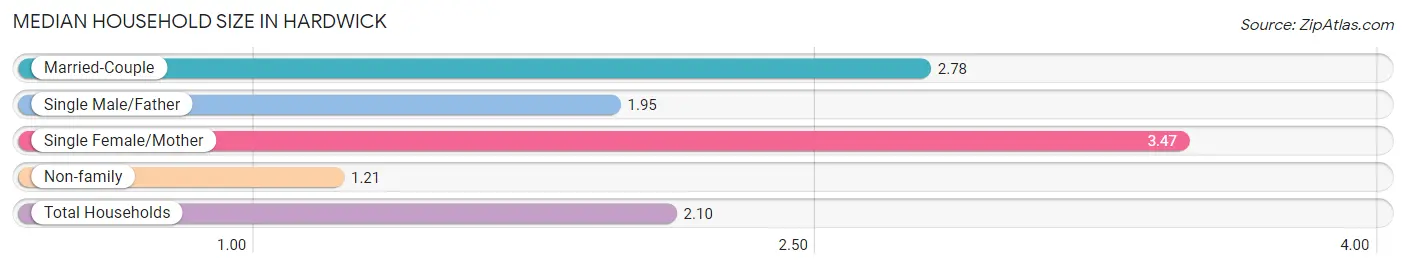
Median Household Size in Hardwick
The median household size in Hardwick is 2.10 persons per household, with single female/mother households (368 | 25.7%) accounting for the largest median household size of 3.47 persons per household. non-family households (725 | 50.7%) represent the smallest median household size with 1.21 persons per household.
| Household Type | # Households | Household Size |
| Married-Couple | 238 (16.6%) | 2.78 |
| Single Male/Father | 99 (6.9%) | 1.95 |
| Single Female/Mother | 368 (25.7%) | 3.47 |
| Non-family | 725 (50.7%) | 1.21 |
| Total Households | 1,430 (100.0%) | 2.10 |
Household Size by Marriage Status in Hardwick
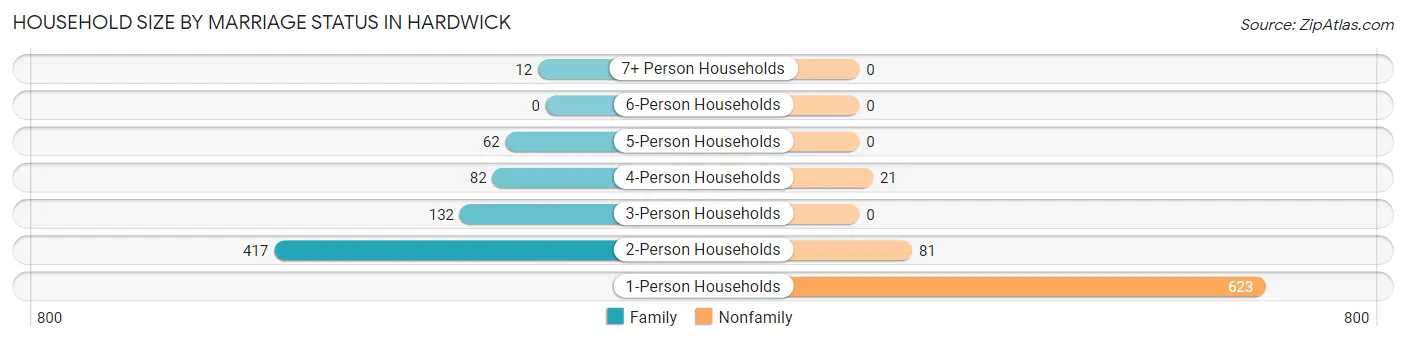
Out of a total of 1,430 households in Hardwick, 705 (49.3%) are family households, while 725 (50.7%) are nonfamily households. The most numerous type of family households are 2-person households, comprising 417, and the most common type of nonfamily households are 1-person households, comprising 623.
| Household Size | Family Households | Nonfamily Households |
| 1-Person Households | - | 623 (43.6%) |
| 2-Person Households | 417 (29.2%) | 81 (5.7%) |
| 3-Person Households | 132 (9.2%) | 0 (0.0%) |
| 4-Person Households | 82 (5.7%) | 21 (1.5%) |
| 5-Person Households | 62 (4.3%) | 0 (0.0%) |
| 6-Person Households | 0 (0.0%) | 0 (0.0%) |
| 7+ Person Households | 12 (0.8%) | 0 (0.0%) |
| Total | 705 (49.3%) | 725 (50.7%) |
Female Fertility in Hardwick
Fertility by Age in Hardwick
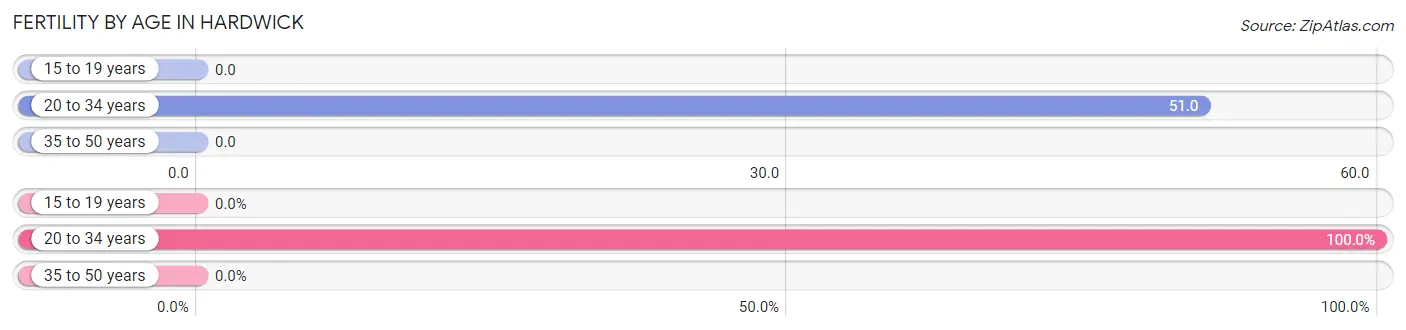
Average fertility rate in Hardwick is 20.0 births per 1,000 women. Women in the age bracket of 20 to 34 years have the highest fertility rate with 51.0 births per 1,000 women. Women in the age bracket of 20 to 34 years acount for 100.0% of all women with births.
| Age Bracket | Women with Births | Births / 1,000 Women |
| 15 to 19 years | 0 (0.0%) | 0.0 |
| 20 to 34 years | 12 (100.0%) | 51.0 |
| 35 to 50 years | 0 (0.0%) | 0.0 |
| Total | 12 (100.0%) | 20.0 |
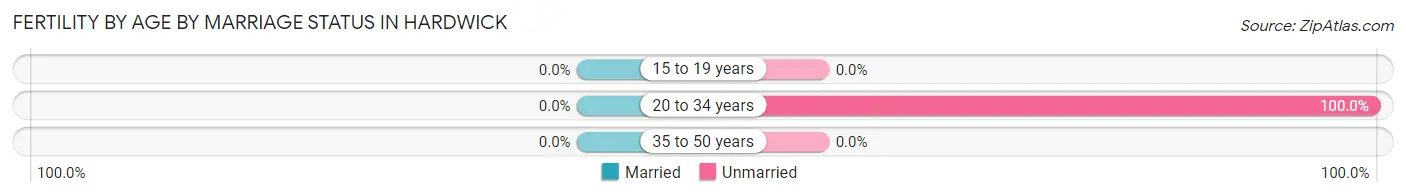
Fertility by Age by Marriage Status in Hardwick
| Age Bracket | Married | Unmarried |
| 15 to 19 years | 0 (0.0%) | 0 (0.0%) |
| 20 to 34 years | 0 (0.0%) | 12 (100.0%) |
| 35 to 50 years | 0 (0.0%) | 0 (0.0%) |
| Total | 0 (0.0%) | 12 (100.0%) |
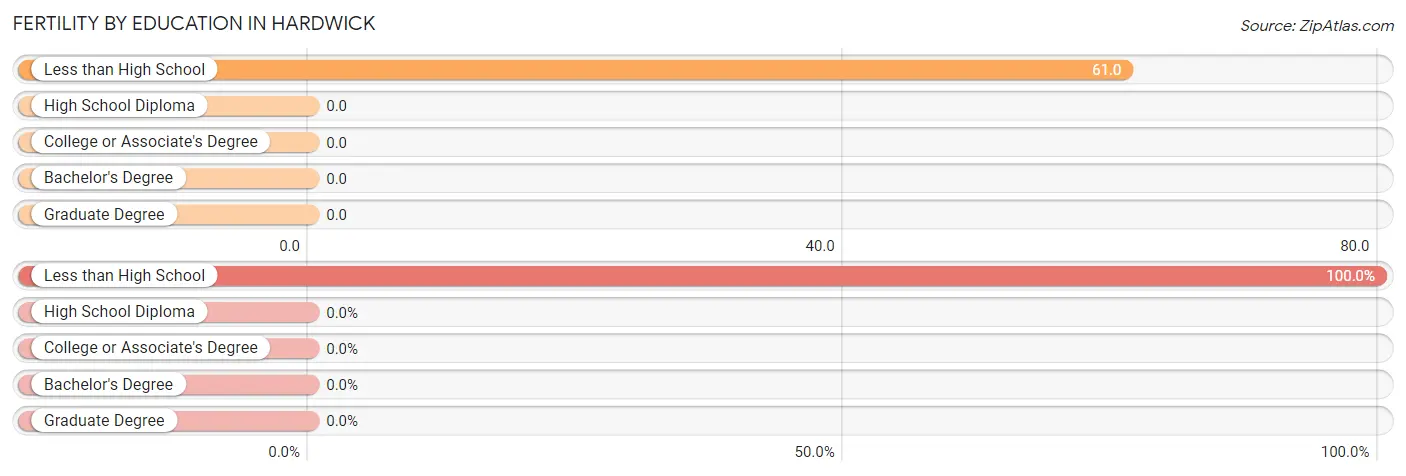
Fertility by Education in Hardwick
| Educational Attainment | Women with Births | Births / 1,000 Women |
| Less than High School | 12 (100.0%) | 61.0 |
| High School Diploma | 0 (0.0%) | 0.0 |
| College or Associate's Degree | 0 (0.0%) | 0.0 |
| Bachelor's Degree | 0 (0.0%) | 0.0 |
| Graduate Degree | 0 (0.0%) | 0.0 |
| Total | 12 (100.0%) | 20.0 |
Fertility by Education by Marriage Status in Hardwick
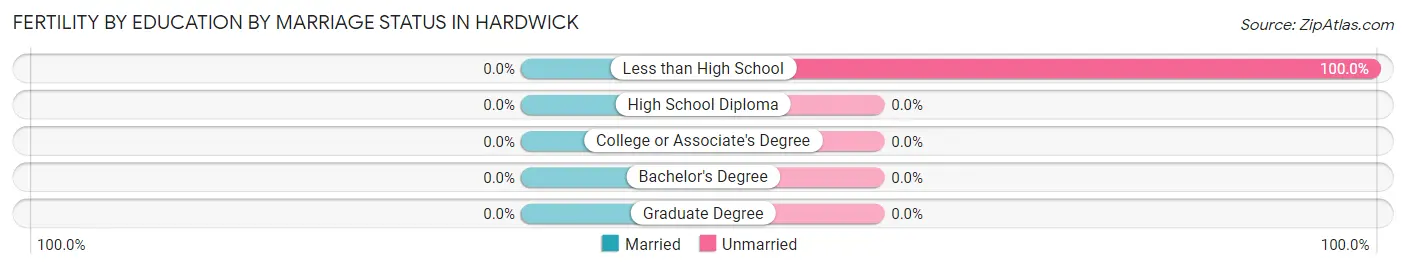
| Educational Attainment | Married | Unmarried |
| Less than High School | 0 (0.0%) | 12 (100.0%) |
| High School Diploma | 0 (0.0%) | 0 (0.0%) |
| College or Associate's Degree | 0 (0.0%) | 0 (0.0%) |
| Bachelor's Degree | 0 (0.0%) | 0 (0.0%) |
| Graduate Degree | 0 (0.0%) | 0 (0.0%) |
| Total | 0 (0.0%) | 12 (100.0%) |
Employment Characteristics in Hardwick
Employment by Class of Employer in Hardwick
Among the 1,163 employed individuals in Hardwick, private company employees (693 | 59.6%), state government employees (191 | 16.4%), and not-for-profit organizations (135 | 11.6%) make up the most common classes of employment.
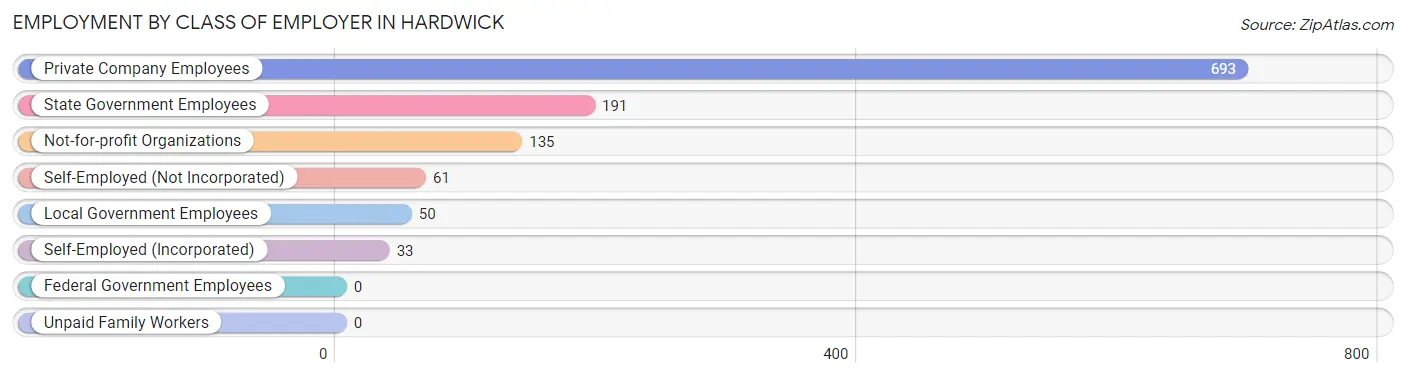
| Employer Class | # Employees | % Employees |
| Private Company Employees | 693 | 59.6% |
| Self-Employed (Incorporated) | 33 | 2.8% |
| Self-Employed (Not Incorporated) | 61 | 5.2% |
| Not-for-profit Organizations | 135 | 11.6% |
| Local Government Employees | 50 | 4.3% |
| State Government Employees | 191 | 16.4% |
| Federal Government Employees | 0 | 0.0% |
| Unpaid Family Workers | 0 | 0.0% |
| Total | 1,163 | 100.0% |
Employment Status by Age in Hardwick
According to the labor force statistics for Hardwick, out of the total population over 16 years of age (2,645), 47.2% or 1,248 individuals are in the labor force, with 4.9% or 61 of them unemployed. The age group with the highest labor force participation rate is 25 to 29 years, with 100.0% or 149 individuals in the labor force. Within the labor force, the 16 to 19 years age range has the highest percentage of unemployed individuals, with 100.0% or 12 of them being unemployed.
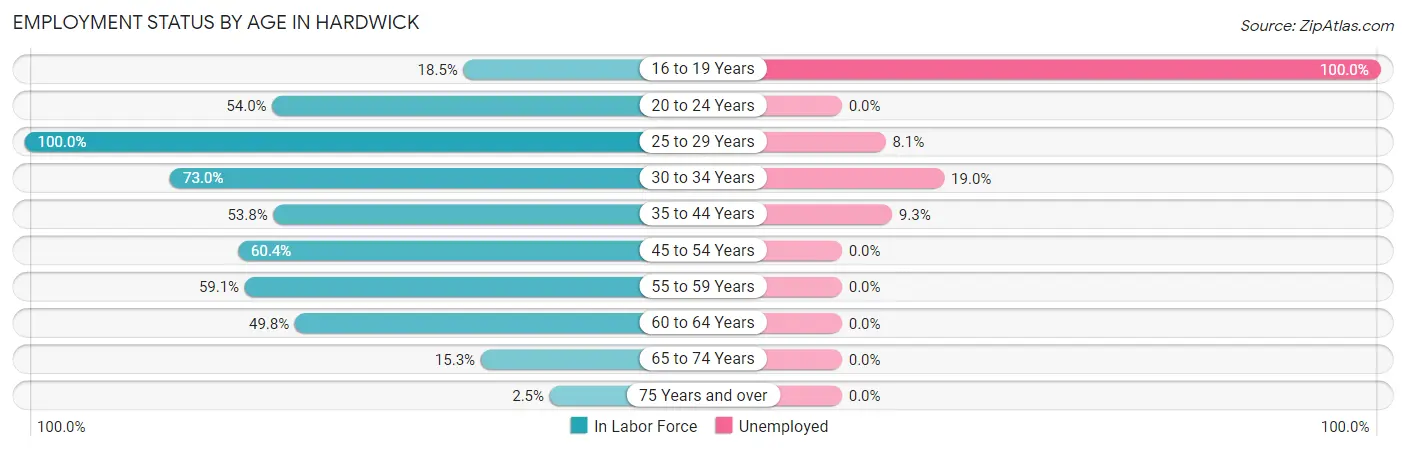
| Age Bracket | In Labor Force | Unemployed |
| 16 to 19 Years | 12 (18.5%) | 12 (100.0%) |
| 20 to 24 Years | 107 (54.0%) | 0 (0.0%) |
| 25 to 29 Years | 149 (100.0%) | 12 (8.1%) |
| 30 to 34 Years | 116 (73.0%) | 22 (19.0%) |
| 35 to 44 Years | 161 (53.8%) | 15 (9.3%) |
| 45 to 54 Years | 294 (60.4%) | 0 (0.0%) |
| 55 to 59 Years | 243 (59.1%) | 0 (0.0%) |
| 60 to 64 Years | 111 (49.8%) | 0 (0.0%) |
| 65 to 74 Years | 46 (15.3%) | 0 (0.0%) |
| 75 Years and over | 9 (2.5%) | 0 (0.0%) |
| Total | 1,248 (47.2%) | 61 (4.9%) |
Employment Status by Educational Attainment in Hardwick
According to labor force statistics for Hardwick, 62.2% of individuals (1,075) out of the total population between 25 and 64 years of age (1,728) are in the labor force, with 4.6% or 49 of them being unemployed. The group with the highest labor force participation rate are those with the educational attainment of college / associate degree, with 68.5% or 424 individuals in the labor force. Within the labor force, individuals with college / associate degree education have the highest percentage of unemployment, with 8.7% or 37 of them being unemployed.
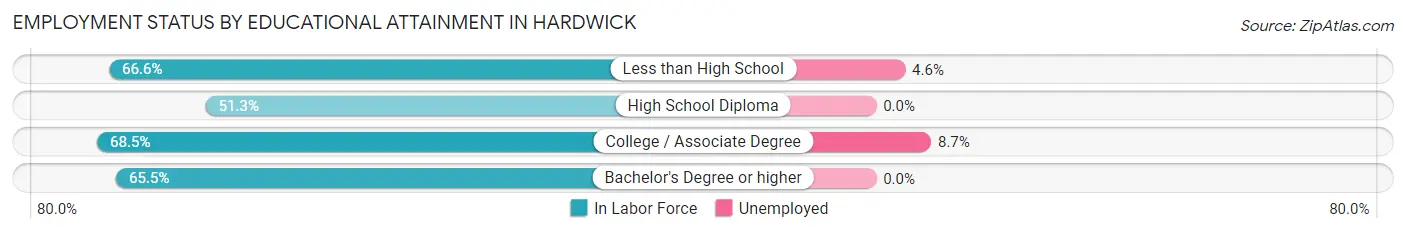
| Educational Attainment | In Labor Force | Unemployed |
| Less than High School | 263 (66.6%) | 18 (4.6%) |
| High School Diploma | 292 (51.3%) | 0 (0.0%) |
| College / Associate Degree | 424 (68.5%) | 54 (8.7%) |
| Bachelor's Degree or higher | 95 (65.5%) | 0 (0.0%) |
| Total | 1,075 (62.2%) | 79 (4.6%) |
Employment Occupations by Sex in Hardwick
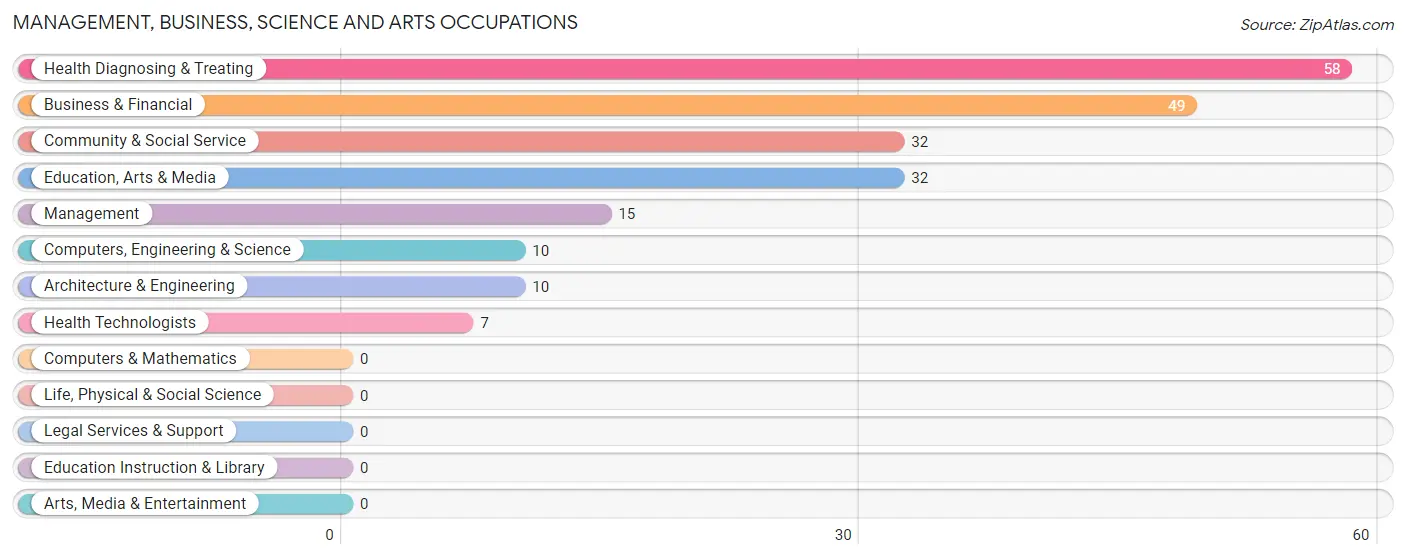
Management, Business, Science and Arts Occupations
The most common Management, Business, Science and Arts occupations in Hardwick are Health Diagnosing & Treating (58 | 4.9%), Business & Financial (49 | 4.1%), Community & Social Service (32 | 2.7%), Education, Arts & Media (32 | 2.7%), and Management (15 | 1.3%).
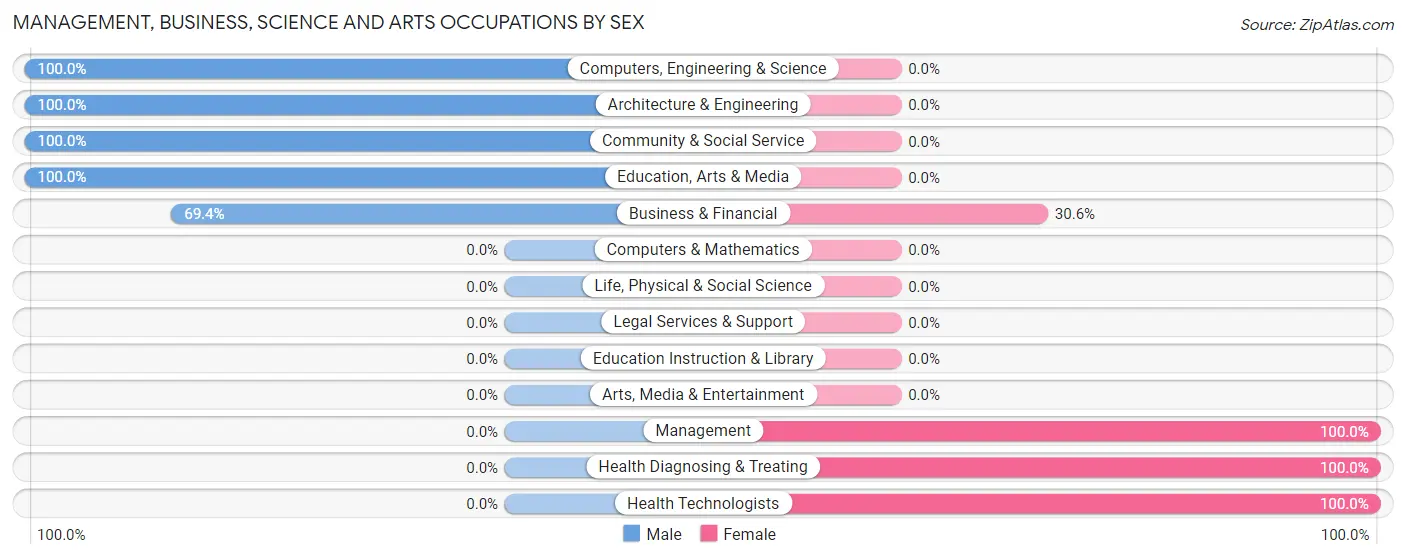
Management, Business, Science and Arts Occupations by Sex
Within the Management, Business, Science and Arts occupations in Hardwick, the most male-oriented occupations are Computers, Engineering & Science (100.0%), Architecture & Engineering (100.0%), and Community & Social Service (100.0%), while the most female-oriented occupations are Management (100.0%), Health Diagnosing & Treating (100.0%), and Health Technologists (100.0%).
| Occupation | Male | Female |
| Management | 0 (0.0%) | 15 (100.0%) |
| Business & Financial | 34 (69.4%) | 15 (30.6%) |
| Computers, Engineering & Science | 10 (100.0%) | 0 (0.0%) |
| Computers & Mathematics | 0 (0.0%) | 0 (0.0%) |
| Architecture & Engineering | 10 (100.0%) | 0 (0.0%) |
| Life, Physical & Social Science | 0 (0.0%) | 0 (0.0%) |
| Community & Social Service | 32 (100.0%) | 0 (0.0%) |
| Education, Arts & Media | 32 (100.0%) | 0 (0.0%) |
| Legal Services & Support | 0 (0.0%) | 0 (0.0%) |
| Education Instruction & Library | 0 (0.0%) | 0 (0.0%) |
| Arts, Media & Entertainment | 0 (0.0%) | 0 (0.0%) |
| Health Diagnosing & Treating | 0 (0.0%) | 58 (100.0%) |
| Health Technologists | 0 (0.0%) | 7 (100.0%) |
| Total (Category) | 76 (46.3%) | 88 (53.7%) |
| Total (Overall) | 622 (52.4%) | 565 (47.6%) |
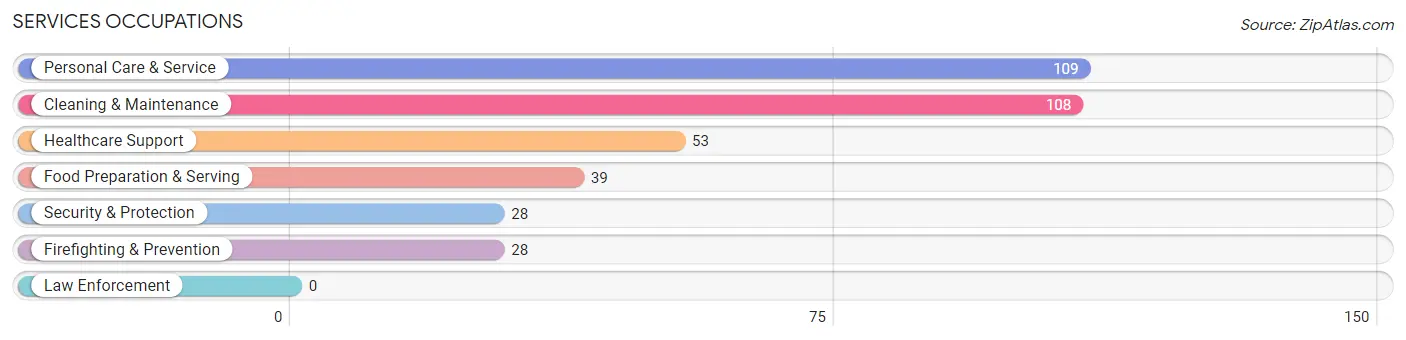
Services Occupations
The most common Services occupations in Hardwick are Personal Care & Service (109 | 9.2%), Cleaning & Maintenance (108 | 9.1%), Healthcare Support (53 | 4.5%), Food Preparation & Serving (39 | 3.3%), and Security & Protection (28 | 2.4%).
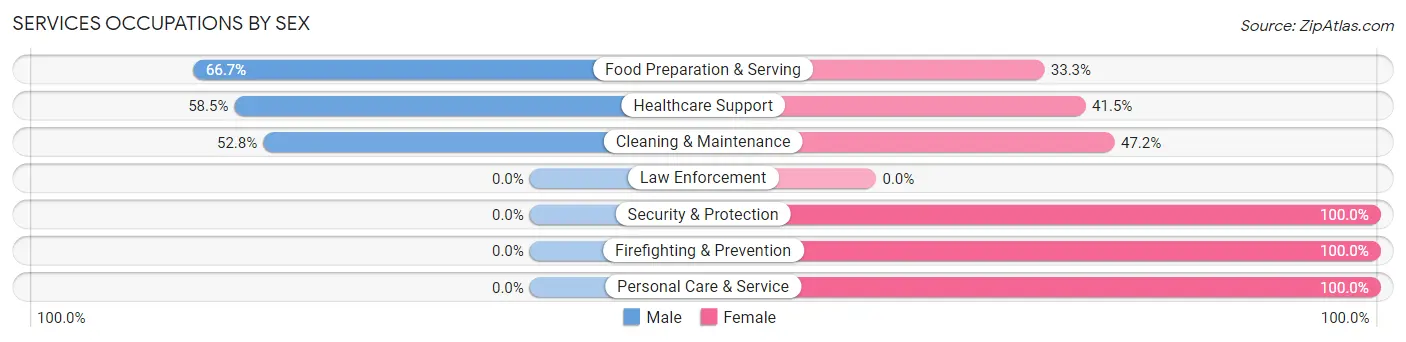
Services Occupations by Sex
Within the Services occupations in Hardwick, the most male-oriented occupations are Food Preparation & Serving (66.7%), Healthcare Support (58.5%), and Cleaning & Maintenance (52.8%), while the most female-oriented occupations are Security & Protection (100.0%), Firefighting & Prevention (100.0%), and Personal Care & Service (100.0%).
| Occupation | Male | Female |
| Healthcare Support | 31 (58.5%) | 22 (41.5%) |
| Security & Protection | 0 (0.0%) | 28 (100.0%) |
| Firefighting & Prevention | 0 (0.0%) | 28 (100.0%) |
| Law Enforcement | 0 (0.0%) | 0 (0.0%) |
| Food Preparation & Serving | 26 (66.7%) | 13 (33.3%) |
| Cleaning & Maintenance | 57 (52.8%) | 51 (47.2%) |
| Personal Care & Service | 0 (0.0%) | 109 (100.0%) |
| Total (Category) | 114 (33.8%) | 223 (66.2%) |
| Total (Overall) | 622 (52.4%) | 565 (47.6%) |
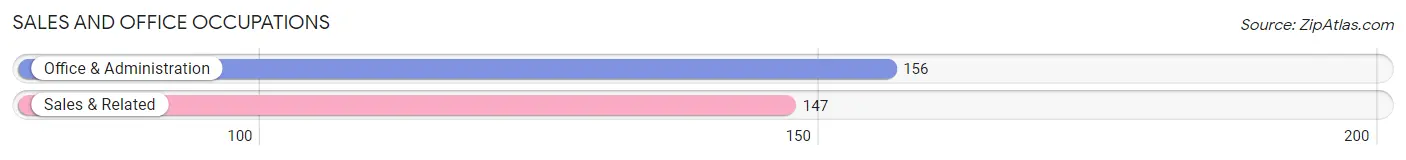
Sales and Office Occupations
The most common Sales and Office occupations in Hardwick are Office & Administration (156 | 13.1%), and Sales & Related (147 | 12.4%).
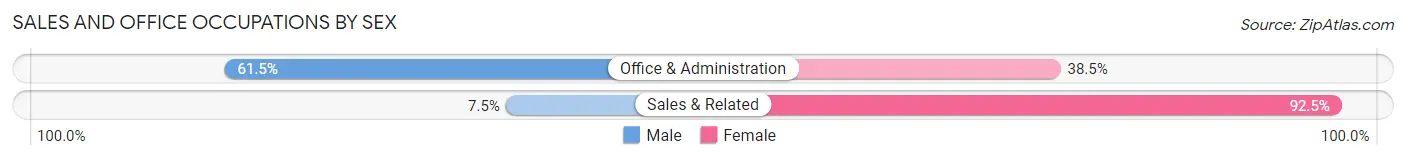
Sales and Office Occupations by Sex
| Occupation | Male | Female |
| Sales & Related | 11 (7.5%) | 136 (92.5%) |
| Office & Administration | 96 (61.5%) | 60 (38.5%) |
| Total (Category) | 107 (35.3%) | 196 (64.7%) |
| Total (Overall) | 622 (52.4%) | 565 (47.6%) |
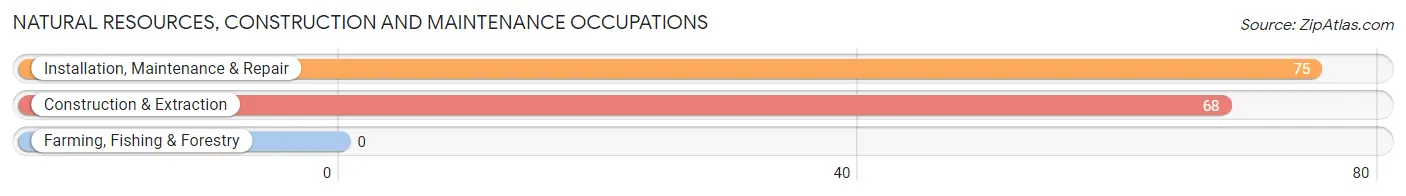
Natural Resources, Construction and Maintenance Occupations
The most common Natural Resources, Construction and Maintenance occupations in Hardwick are Installation, Maintenance & Repair (75 | 6.3%), and Construction & Extraction (68 | 5.7%).
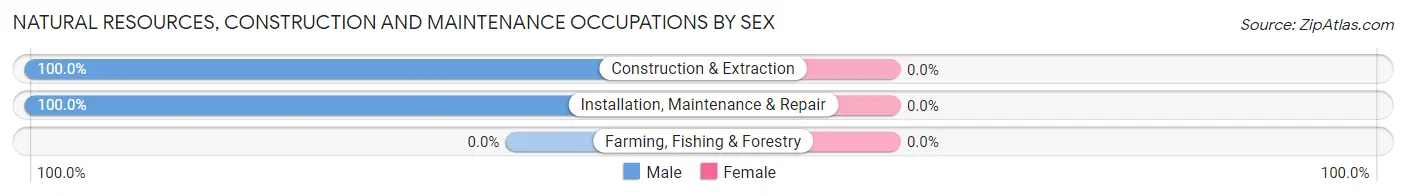
Natural Resources, Construction and Maintenance Occupations by Sex
| Occupation | Male | Female |
| Farming, Fishing & Forestry | 0 (0.0%) | 0 (0.0%) |
| Construction & Extraction | 68 (100.0%) | 0 (0.0%) |
| Installation, Maintenance & Repair | 75 (100.0%) | 0 (0.0%) |
| Total (Category) | 143 (100.0%) | 0 (0.0%) |
| Total (Overall) | 622 (52.4%) | 565 (47.6%) |
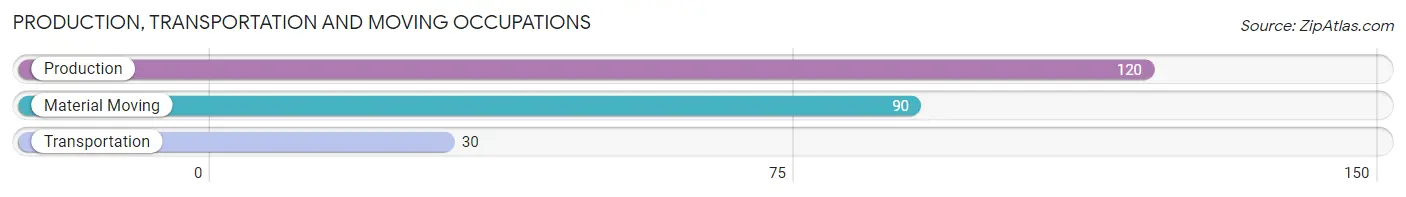
Production, Transportation and Moving Occupations
The most common Production, Transportation and Moving occupations in Hardwick are Production (120 | 10.1%), Material Moving (90 | 7.6%), and Transportation (30 | 2.5%).
Production, Transportation and Moving Occupations by Sex
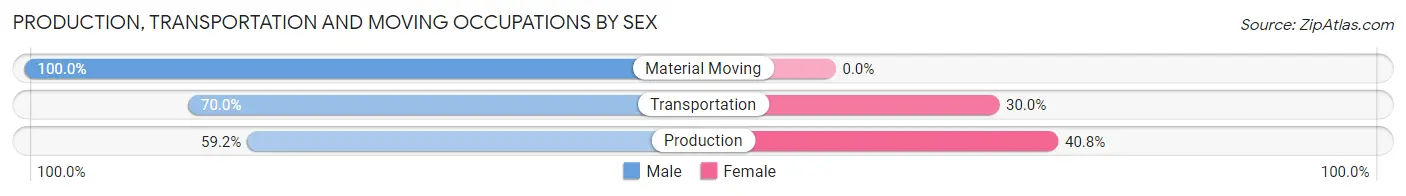
| Occupation | Male | Female |
| Production | 71 (59.2%) | 49 (40.8%) |
| Transportation | 21 (70.0%) | 9 (30.0%) |
| Material Moving | 90 (100.0%) | 0 (0.0%) |
| Total (Category) | 182 (75.8%) | 58 (24.2%) |
| Total (Overall) | 622 (52.4%) | 565 (47.6%) |
Employment Industries by Sex in Hardwick
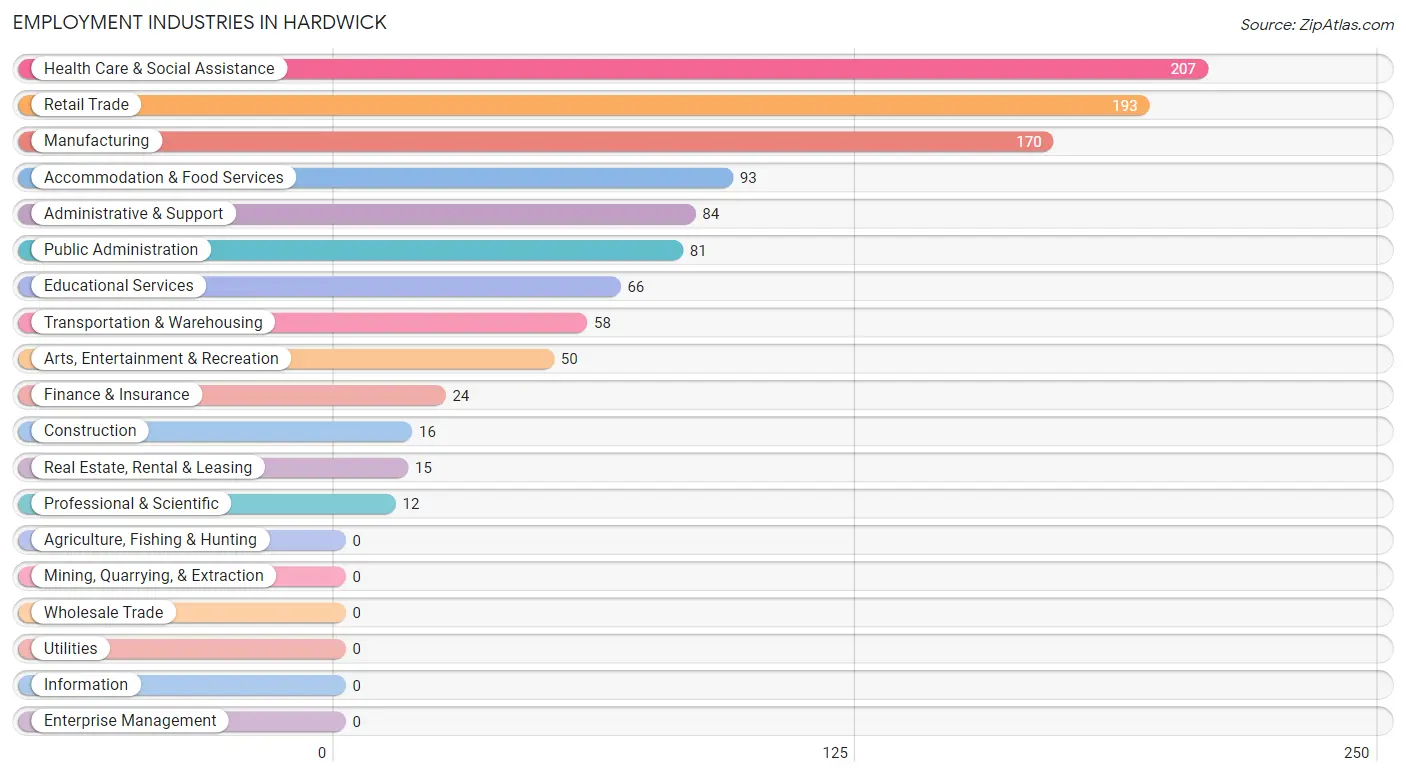
Employment Industries in Hardwick
The major employment industries in Hardwick include Health Care & Social Assistance (207 | 17.4%), Retail Trade (193 | 16.3%), Manufacturing (170 | 14.3%), Accommodation & Food Services (93 | 7.8%), and Administrative & Support (84 | 7.1%).
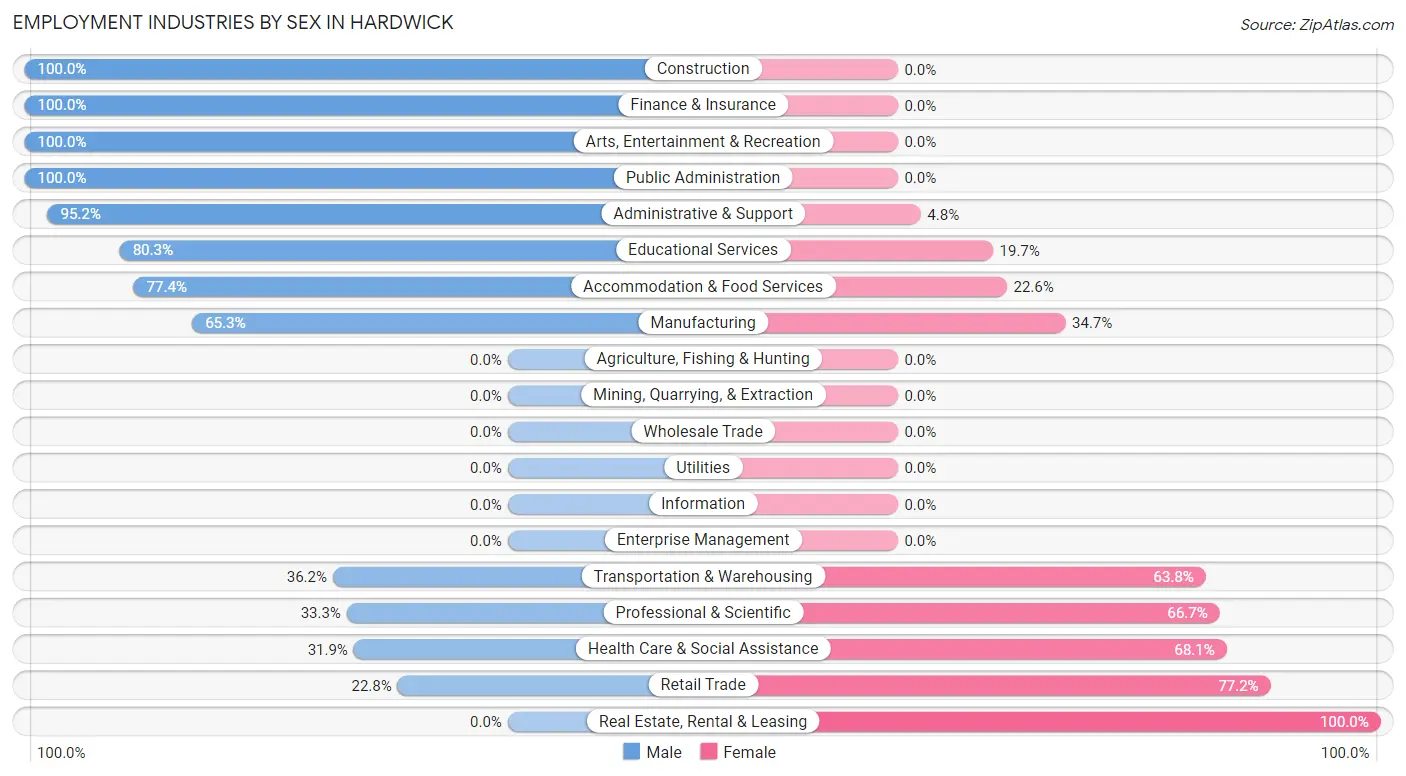
Employment Industries by Sex in Hardwick
The Hardwick industries that see more men than women are Construction (100.0%), Finance & Insurance (100.0%), and Arts, Entertainment & Recreation (100.0%), whereas the industries that tend to have a higher number of women are Real Estate, Rental & Leasing (100.0%), Retail Trade (77.2%), and Health Care & Social Assistance (68.1%).
| Industry | Male | Female |
| Agriculture, Fishing & Hunting | 0 (0.0%) | 0 (0.0%) |
| Mining, Quarrying, & Extraction | 0 (0.0%) | 0 (0.0%) |
| Construction | 16 (100.0%) | 0 (0.0%) |
| Manufacturing | 111 (65.3%) | 59 (34.7%) |
| Wholesale Trade | 0 (0.0%) | 0 (0.0%) |
| Retail Trade | 44 (22.8%) | 149 (77.2%) |
| Transportation & Warehousing | 21 (36.2%) | 37 (63.8%) |
| Utilities | 0 (0.0%) | 0 (0.0%) |
| Information | 0 (0.0%) | 0 (0.0%) |
| Finance & Insurance | 24 (100.0%) | 0 (0.0%) |
| Real Estate, Rental & Leasing | 0 (0.0%) | 15 (100.0%) |
| Professional & Scientific | 4 (33.3%) | 8 (66.7%) |
| Enterprise Management | 0 (0.0%) | 0 (0.0%) |
| Administrative & Support | 80 (95.2%) | 4 (4.8%) |
| Educational Services | 53 (80.3%) | 13 (19.7%) |
| Health Care & Social Assistance | 66 (31.9%) | 141 (68.1%) |
| Arts, Entertainment & Recreation | 50 (100.0%) | 0 (0.0%) |
| Accommodation & Food Services | 72 (77.4%) | 21 (22.6%) |
| Public Administration | 81 (100.0%) | 0 (0.0%) |
| Total | 622 (52.4%) | 565 (47.6%) |
Education in Hardwick
School Enrollment in Hardwick
The most common levels of schooling among the 590 students in Hardwick are middle school (224 | 38.0%), elementary school (170 | 28.8%), and college / undergraduate (161 | 27.3%).
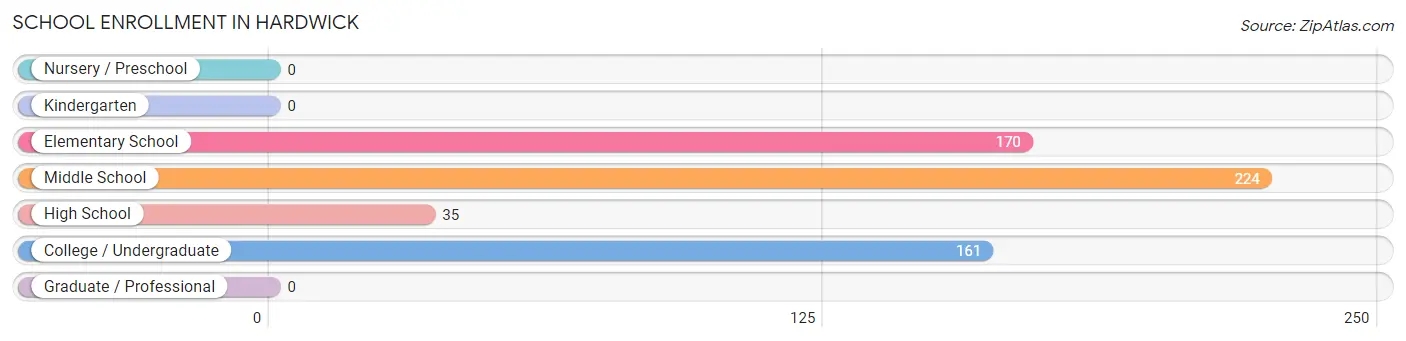
| School Level | # Students | % Students |
| Nursery / Preschool | 0 | 0.0% |
| Kindergarten | 0 | 0.0% |
| Elementary School | 170 | 28.8% |
| Middle School | 224 | 38.0% |
| High School | 35 | 5.9% |
| College / Undergraduate | 161 | 27.3% |
| Graduate / Professional | 0 | 0.0% |
| Total | 590 | 100.0% |
School Enrollment by Age by Funding Source in Hardwick
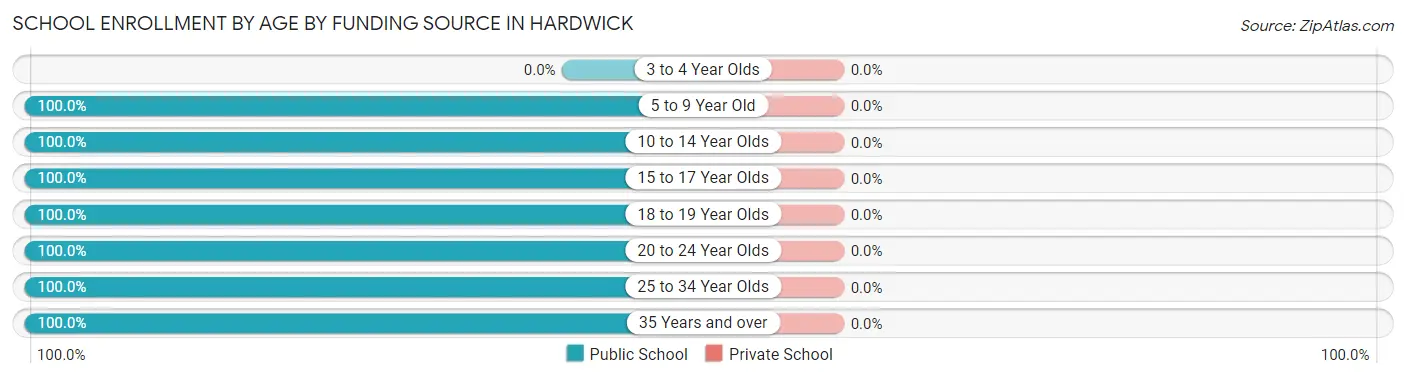
| Age Bracket | Public School | Private School |
| 3 to 4 Year Olds | 0 (0.0%) | 0 (0.0%) |
| 5 to 9 Year Old | 170 (100.0%) | 0 (0.0%) |
| 10 to 14 Year Olds | 239 (100.0%) | 0 (0.0%) |
| 15 to 17 Year Olds | 5 (100.0%) | 0 (0.0%) |
| 18 to 19 Year Olds | 53 (100.0%) | 0 (0.0%) |
| 20 to 24 Year Olds | 85 (100.0%) | 0 (0.0%) |
| 25 to 34 Year Olds | 12 (100.0%) | 0 (0.0%) |
| 35 Years and over | 26 (100.0%) | 0 (0.0%) |
| Total | 590 (100.0%) | 0 (0.0%) |
Educational Attainment by Field of Study in Hardwick
Business (68 | 30.2%), arts & humanities (63 | 28.0%), education (45 | 20.0%), bio, nature & agricultural (23 | 10.2%), and visual & performing arts (10 | 4.4%) are the most common fields of study among 225 individuals in Hardwick who have obtained a bachelor's degree or higher.
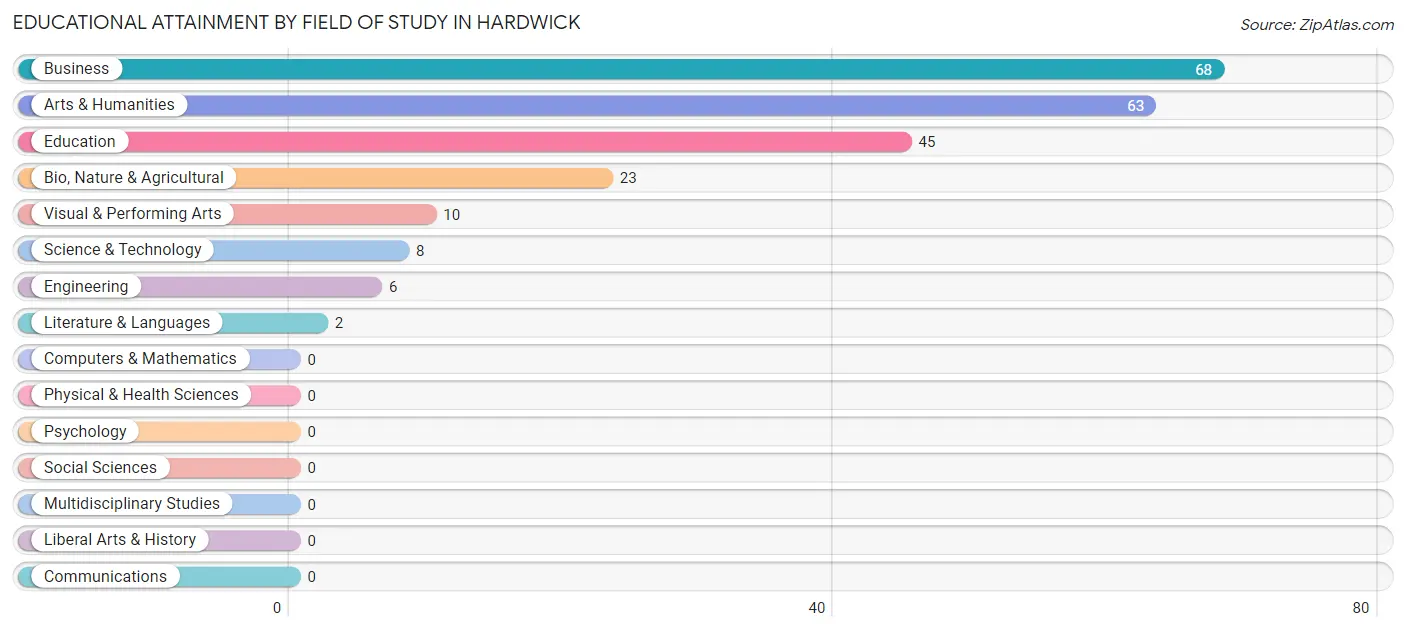
| Field of Study | # Graduates | % Graduates |
| Computers & Mathematics | 0 | 0.0% |
| Bio, Nature & Agricultural | 23 | 10.2% |
| Physical & Health Sciences | 0 | 0.0% |
| Psychology | 0 | 0.0% |
| Social Sciences | 0 | 0.0% |
| Engineering | 6 | 2.7% |
| Multidisciplinary Studies | 0 | 0.0% |
| Science & Technology | 8 | 3.6% |
| Business | 68 | 30.2% |
| Education | 45 | 20.0% |
| Literature & Languages | 2 | 0.9% |
| Liberal Arts & History | 0 | 0.0% |
| Visual & Performing Arts | 10 | 4.4% |
| Communications | 0 | 0.0% |
| Arts & Humanities | 63 | 28.0% |
| Total | 225 | 100.0% |
Transportation & Commute in Hardwick
Vehicle Availability by Sex in Hardwick
The most prevalent vehicle ownership categories in Hardwick are males with 1 vehicle (225, accounting for 38.1%) and females with 1 vehicle (151, making up 39.8%).
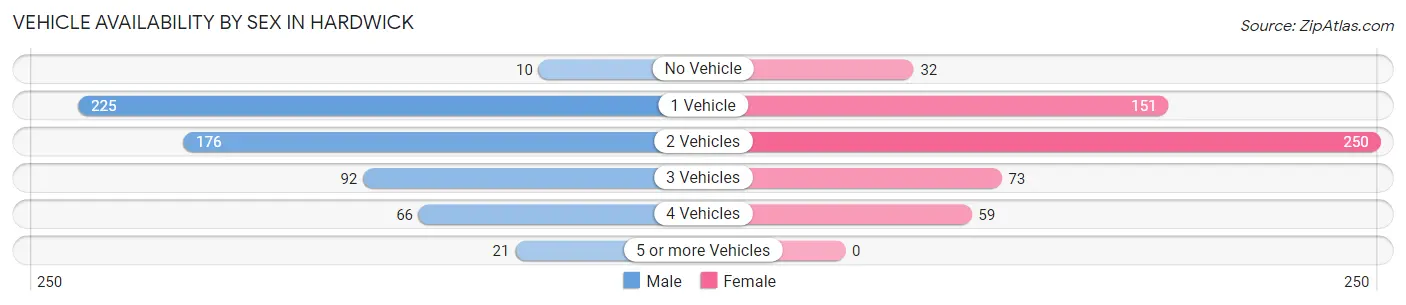
| Vehicles Available | Male | Female |
| No Vehicle | 10 (1.7%) | 32 (5.7%) |
| 1 Vehicle | 225 (38.1%) | 151 (26.7%) |
| 2 Vehicles | 176 (29.8%) | 250 (44.3%) |
| 3 Vehicles | 92 (15.6%) | 73 (12.9%) |
| 4 Vehicles | 66 (11.2%) | 59 (10.4%) |
| 5 or more Vehicles | 21 (3.6%) | 0 (0.0%) |
| Total | 590 (100.0%) | 565 (100.0%) |
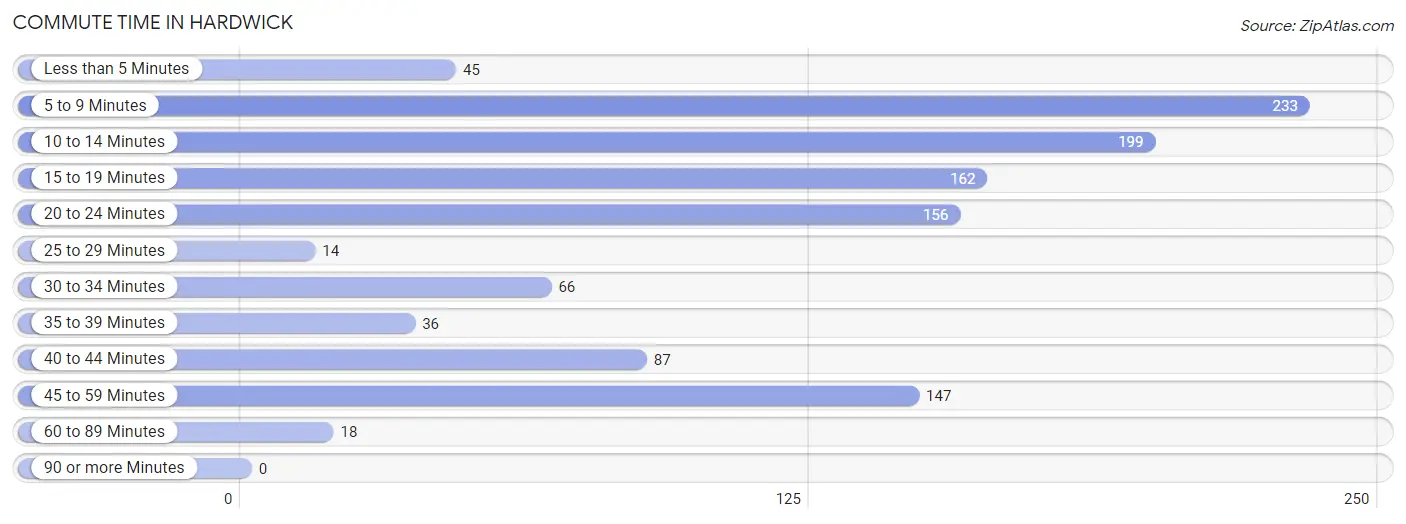
Commute Time in Hardwick
The most frequently occuring commute durations in Hardwick are 5 to 9 minutes (233 commuters, 20.0%), 10 to 14 minutes (199 commuters, 17.1%), and 15 to 19 minutes (162 commuters, 13.9%).
| Commute Time | # Commuters | % Commuters |
| Less than 5 Minutes | 45 | 3.9% |
| 5 to 9 Minutes | 233 | 20.0% |
| 10 to 14 Minutes | 199 | 17.1% |
| 15 to 19 Minutes | 162 | 13.9% |
| 20 to 24 Minutes | 156 | 13.4% |
| 25 to 29 Minutes | 14 | 1.2% |
| 30 to 34 Minutes | 66 | 5.7% |
| 35 to 39 Minutes | 36 | 3.1% |
| 40 to 44 Minutes | 87 | 7.5% |
| 45 to 59 Minutes | 147 | 12.6% |
| 60 to 89 Minutes | 18 | 1.5% |
| 90 or more Minutes | 0 | 0.0% |
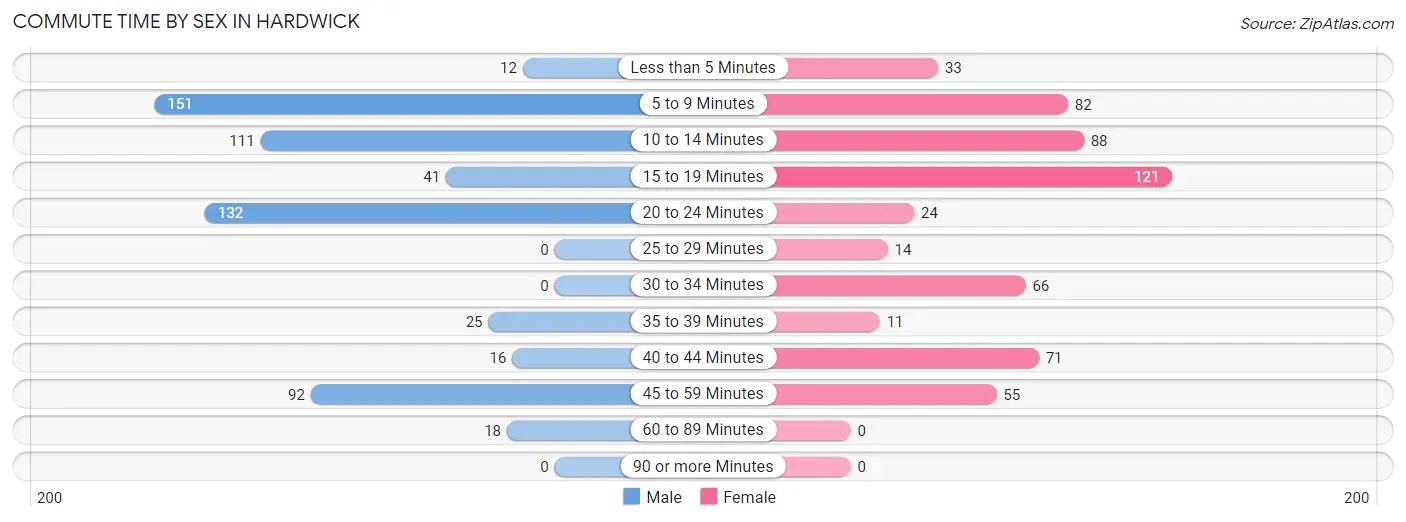
Commute Time by Sex in Hardwick
The most common commute times in Hardwick are 5 to 9 minutes (151 commuters, 25.3%) for males and 15 to 19 minutes (121 commuters, 21.4%) for females.
| Commute Time | Male | Female |
| Less than 5 Minutes | 12 (2.0%) | 33 (5.8%) |
| 5 to 9 Minutes | 151 (25.3%) | 82 (14.5%) |
| 10 to 14 Minutes | 111 (18.6%) | 88 (15.6%) |
| 15 to 19 Minutes | 41 (6.9%) | 121 (21.4%) |
| 20 to 24 Minutes | 132 (22.1%) | 24 (4.3%) |
| 25 to 29 Minutes | 0 (0.0%) | 14 (2.5%) |
| 30 to 34 Minutes | 0 (0.0%) | 66 (11.7%) |
| 35 to 39 Minutes | 25 (4.2%) | 11 (1.9%) |
| 40 to 44 Minutes | 16 (2.7%) | 71 (12.6%) |
| 45 to 59 Minutes | 92 (15.4%) | 55 (9.7%) |
| 60 to 89 Minutes | 18 (3.0%) | 0 (0.0%) |
| 90 or more Minutes | 0 (0.0%) | 0 (0.0%) |
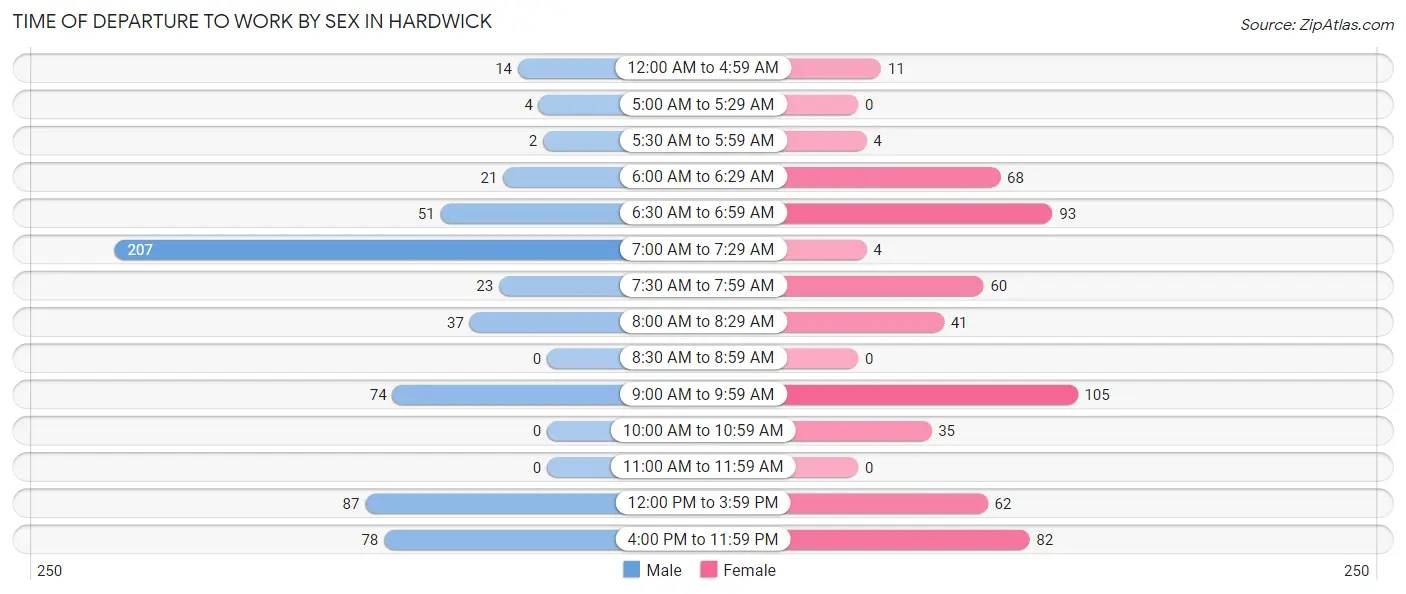
Time of Departure to Work by Sex in Hardwick
The most frequent times of departure to work in Hardwick are 7:00 AM to 7:29 AM (207, 34.6%) for males and 9:00 AM to 9:59 AM (105, 18.6%) for females.
| Time of Departure | Male | Female |
| 12:00 AM to 4:59 AM | 14 (2.3%) | 11 (1.9%) |
| 5:00 AM to 5:29 AM | 4 (0.7%) | 0 (0.0%) |
| 5:30 AM to 5:59 AM | 2 (0.3%) | 4 (0.7%) |
| 6:00 AM to 6:29 AM | 21 (3.5%) | 68 (12.0%) |
| 6:30 AM to 6:59 AM | 51 (8.5%) | 93 (16.5%) |
| 7:00 AM to 7:29 AM | 207 (34.6%) | 4 (0.7%) |
| 7:30 AM to 7:59 AM | 23 (3.8%) | 60 (10.6%) |
| 8:00 AM to 8:29 AM | 37 (6.2%) | 41 (7.3%) |
| 8:30 AM to 8:59 AM | 0 (0.0%) | 0 (0.0%) |
| 9:00 AM to 9:59 AM | 74 (12.4%) | 105 (18.6%) |
| 10:00 AM to 10:59 AM | 0 (0.0%) | 35 (6.2%) |
| 11:00 AM to 11:59 AM | 0 (0.0%) | 0 (0.0%) |
| 12:00 PM to 3:59 PM | 87 (14.5%) | 62 (11.0%) |
| 4:00 PM to 11:59 PM | 78 (13.0%) | 82 (14.5%) |
| Total | 598 (100.0%) | 565 (100.0%) |
Housing Occupancy in Hardwick
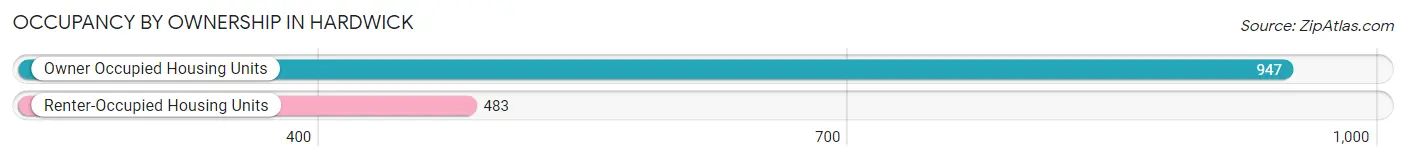
Occupancy by Ownership in Hardwick
Of the total 1,430 dwellings in Hardwick, owner-occupied units account for 947 (66.2%), while renter-occupied units make up 483 (33.8%).
| Occupancy | # Housing Units | % Housing Units |
| Owner Occupied Housing Units | 947 | 66.2% |
| Renter-Occupied Housing Units | 483 | 33.8% |
| Total Occupied Housing Units | 1,430 | 100.0% |
Occupancy by Household Size in Hardwick
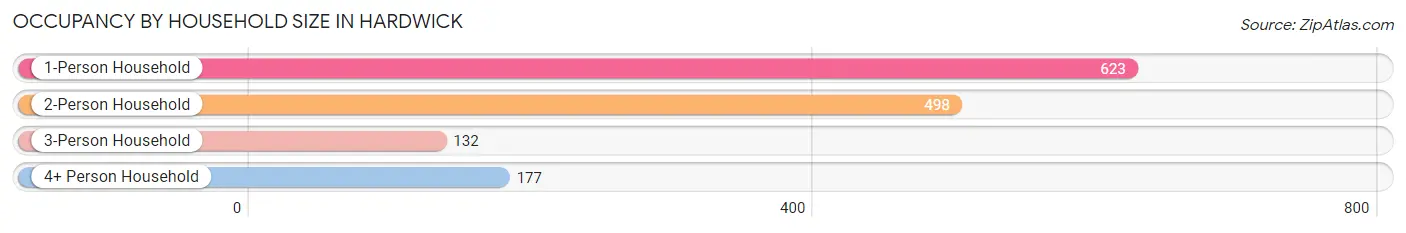
| Household Size | # Housing Units | % Housing Units |
| 1-Person Household | 623 | 43.6% |
| 2-Person Household | 498 | 34.8% |
| 3-Person Household | 132 | 9.2% |
| 4+ Person Household | 177 | 12.4% |
| Total Housing Units | 1,430 | 100.0% |
Occupancy by Ownership by Household Size in Hardwick
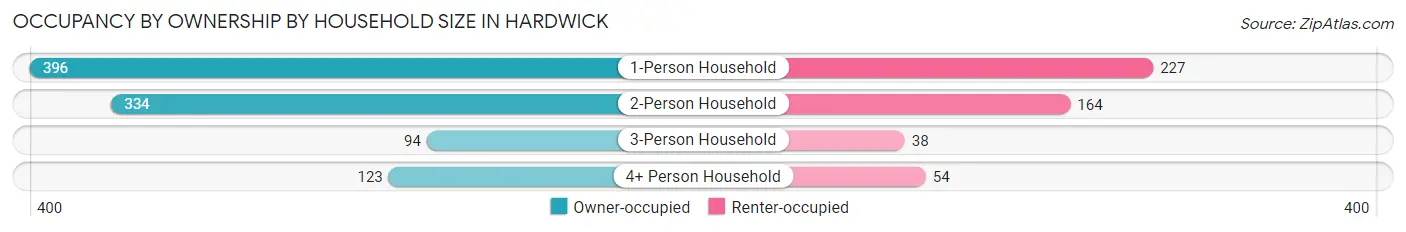
| Household Size | Owner-occupied | Renter-occupied |
| 1-Person Household | 396 (63.6%) | 227 (36.4%) |
| 2-Person Household | 334 (67.1%) | 164 (32.9%) |
| 3-Person Household | 94 (71.2%) | 38 (28.8%) |
| 4+ Person Household | 123 (69.5%) | 54 (30.5%) |
| Total Housing Units | 947 (66.2%) | 483 (33.8%) |
Occupancy by Educational Attainment in Hardwick
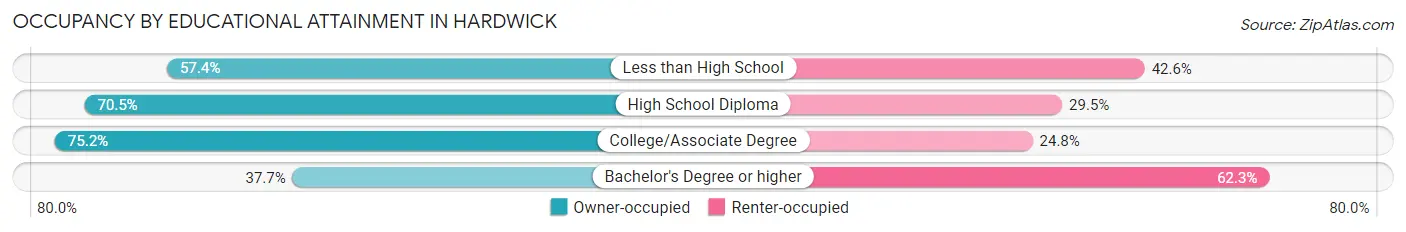
| Household Size | Owner-occupied | Renter-occupied |
| Less than High School | 155 (57.4%) | 115 (42.6%) |
| High School Diploma | 337 (70.5%) | 141 (29.5%) |
| College/Associate Degree | 397 (75.2%) | 131 (24.8%) |
| Bachelor's Degree or higher | 58 (37.7%) | 96 (62.3%) |
Occupancy by Age of Householder in Hardwick
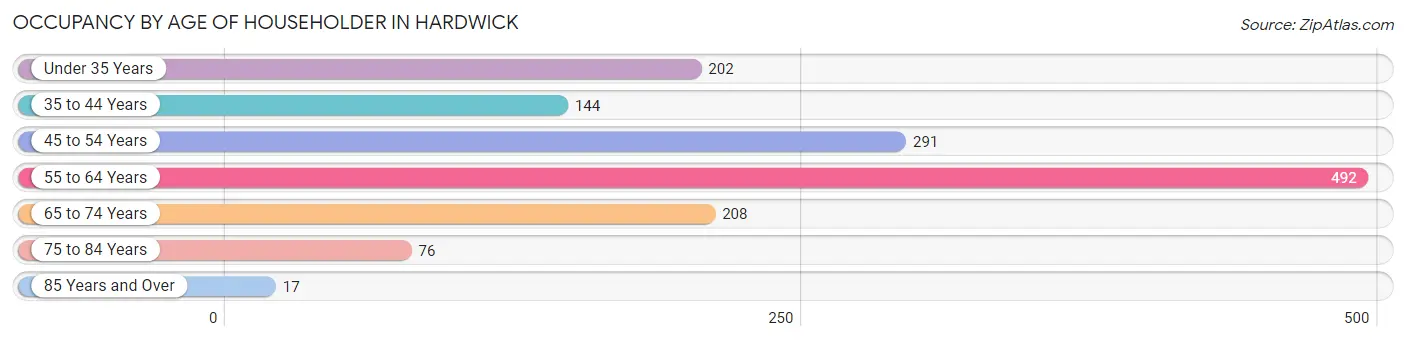
| Age Bracket | # Households | % Households |
| Under 35 Years | 202 | 14.1% |
| 35 to 44 Years | 144 | 10.1% |
| 45 to 54 Years | 291 | 20.3% |
| 55 to 64 Years | 492 | 34.4% |
| 65 to 74 Years | 208 | 14.5% |
| 75 to 84 Years | 76 | 5.3% |
| 85 Years and Over | 17 | 1.2% |
| Total | 1,430 | 100.0% |
Housing Finances in Hardwick
Median Income by Occupancy in Hardwick
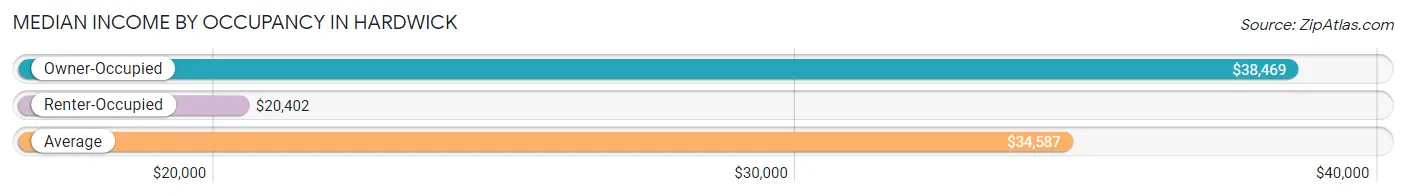
| Occupancy Type | # Households | Median Income |
| Owner-Occupied | 947 (66.2%) | $38,469 |
| Renter-Occupied | 483 (33.8%) | $20,402 |
| Average | 1,430 (100.0%) | $34,587 |
Occupancy by Householder Income Bracket in Hardwick
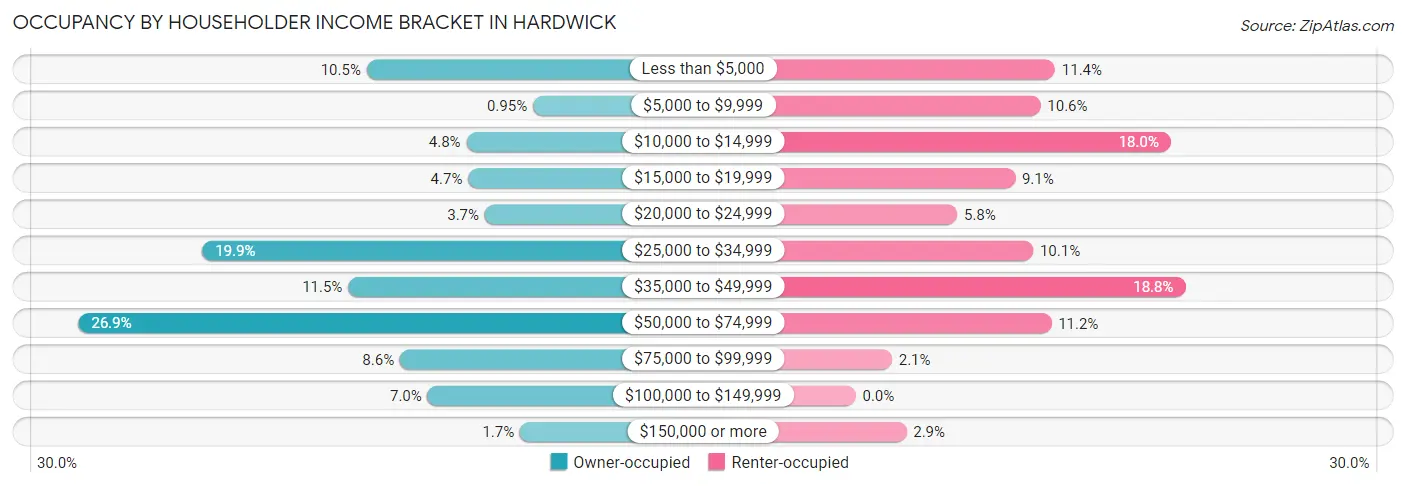
| Income Bracket | Owner-occupied | Renter-occupied |
| Less than $5,000 | 99 (10.4%) | 55 (11.4%) |
| $5,000 to $9,999 | 9 (0.9%) | 51 (10.6%) |
| $10,000 to $14,999 | 45 (4.8%) | 87 (18.0%) |
| $15,000 to $19,999 | 44 (4.6%) | 44 (9.1%) |
| $20,000 to $24,999 | 35 (3.7%) | 28 (5.8%) |
| $25,000 to $34,999 | 188 (19.9%) | 49 (10.1%) |
| $35,000 to $49,999 | 109 (11.5%) | 91 (18.8%) |
| $50,000 to $74,999 | 255 (26.9%) | 54 (11.2%) |
| $75,000 to $99,999 | 81 (8.6%) | 10 (2.1%) |
| $100,000 to $149,999 | 66 (7.0%) | 0 (0.0%) |
| $150,000 or more | 16 (1.7%) | 14 (2.9%) |
| Total | 947 (100.0%) | 483 (100.0%) |
Monthly Housing Cost Tiers in Hardwick
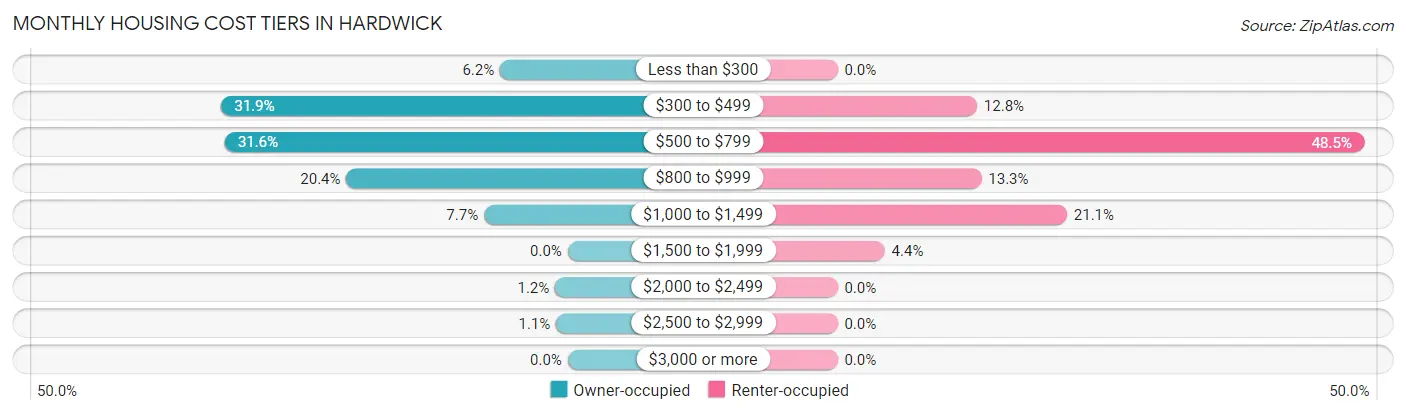
| Monthly Cost | Owner-occupied | Renter-occupied |
| Less than $300 | 59 (6.2%) | 0 (0.0%) |
| $300 to $499 | 302 (31.9%) | 62 (12.8%) |
| $500 to $799 | 299 (31.6%) | 234 (48.4%) |
| $800 to $999 | 193 (20.4%) | 64 (13.3%) |
| $1,000 to $1,499 | 73 (7.7%) | 102 (21.1%) |
| $1,500 to $1,999 | 0 (0.0%) | 21 (4.3%) |
| $2,000 to $2,499 | 11 (1.2%) | 0 (0.0%) |
| $2,500 to $2,999 | 10 (1.1%) | 0 (0.0%) |
| $3,000 or more | 0 (0.0%) | 0 (0.0%) |
| Total | 947 (100.0%) | 483 (100.0%) |
Physical Housing Characteristics in Hardwick
Housing Structures in Hardwick
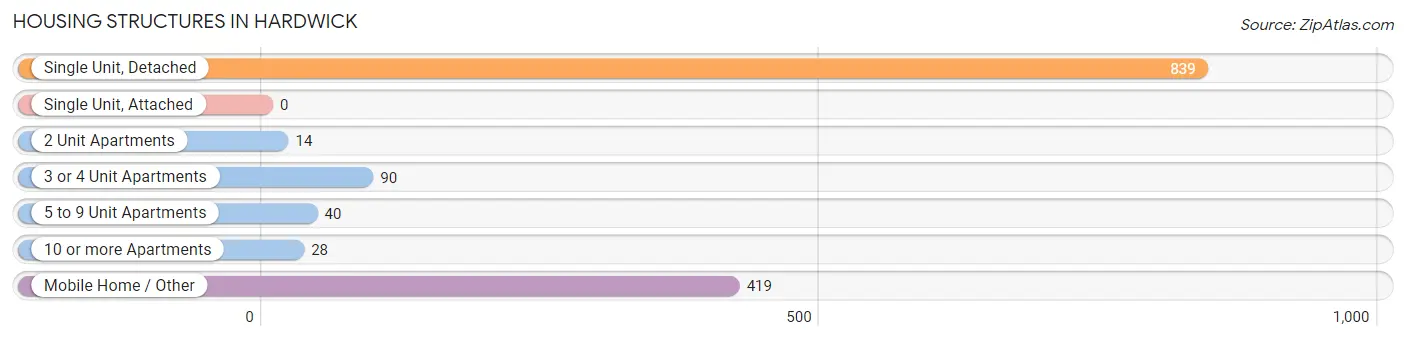
| Structure Type | # Housing Units | % Housing Units |
| Single Unit, Detached | 839 | 58.7% |
| Single Unit, Attached | 0 | 0.0% |
| 2 Unit Apartments | 14 | 1.0% |
| 3 or 4 Unit Apartments | 90 | 6.3% |
| 5 to 9 Unit Apartments | 40 | 2.8% |
| 10 or more Apartments | 28 | 2.0% |
| Mobile Home / Other | 419 | 29.3% |
| Total | 1,430 | 100.0% |
Housing Structures by Occupancy in Hardwick
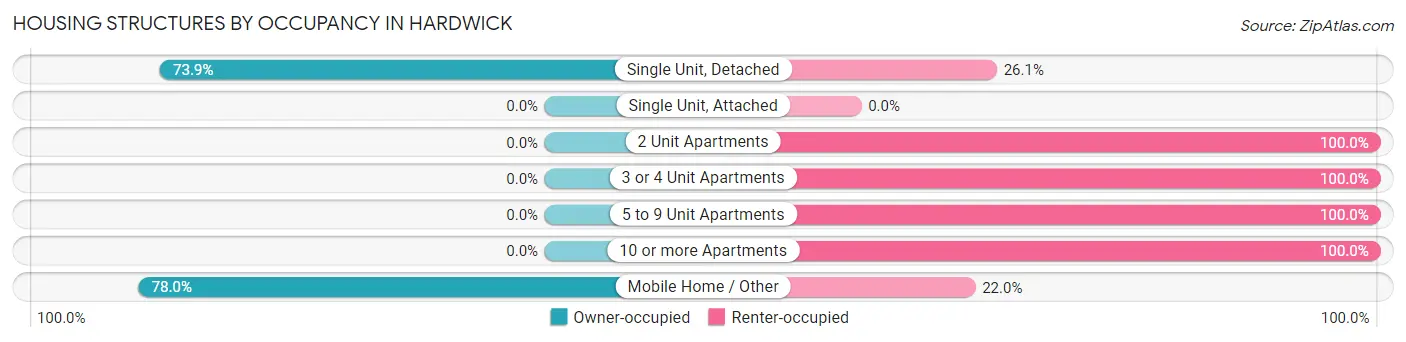
| Structure Type | Owner-occupied | Renter-occupied |
| Single Unit, Detached | 620 (73.9%) | 219 (26.1%) |
| Single Unit, Attached | 0 (0.0%) | 0 (0.0%) |
| 2 Unit Apartments | 0 (0.0%) | 14 (100.0%) |
| 3 or 4 Unit Apartments | 0 (0.0%) | 90 (100.0%) |
| 5 to 9 Unit Apartments | 0 (0.0%) | 40 (100.0%) |
| 10 or more Apartments | 0 (0.0%) | 28 (100.0%) |
| Mobile Home / Other | 327 (78.0%) | 92 (22.0%) |
| Total | 947 (66.2%) | 483 (33.8%) |
Housing Structures by Number of Rooms in Hardwick
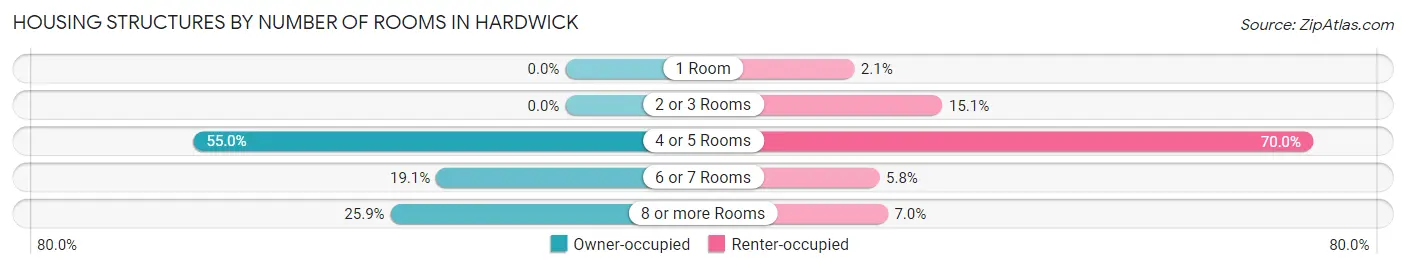
| Number of Rooms | Owner-occupied | Renter-occupied |
| 1 Room | 0 (0.0%) | 10 (2.1%) |
| 2 or 3 Rooms | 0 (0.0%) | 73 (15.1%) |
| 4 or 5 Rooms | 521 (55.0%) | 338 (70.0%) |
| 6 or 7 Rooms | 181 (19.1%) | 28 (5.8%) |
| 8 or more Rooms | 245 (25.9%) | 34 (7.0%) |
| Total | 947 (100.0%) | 483 (100.0%) |
Housing Structure by Heating Type in Hardwick
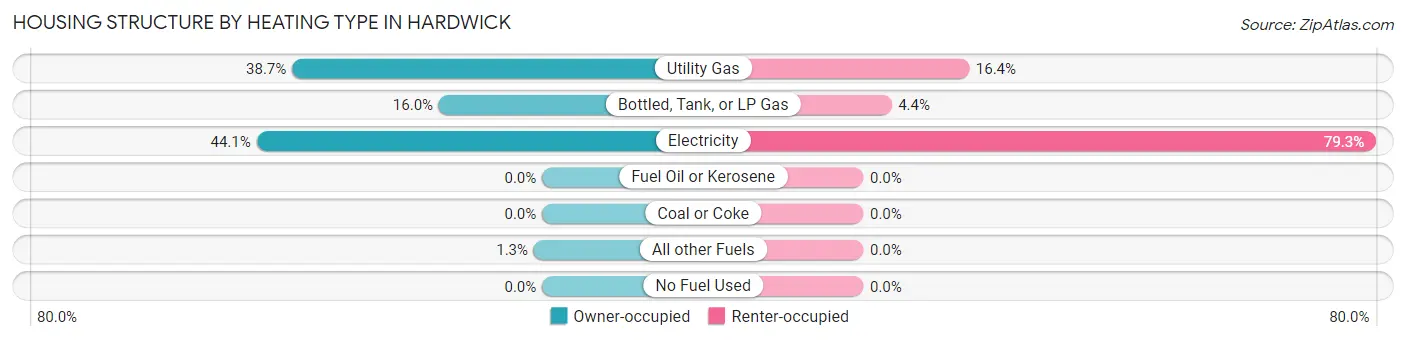
| Heating Type | Owner-occupied | Renter-occupied |
| Utility Gas | 366 (38.7%) | 79 (16.4%) |
| Bottled, Tank, or LP Gas | 151 (16.0%) | 21 (4.3%) |
| Electricity | 418 (44.1%) | 383 (79.3%) |
| Fuel Oil or Kerosene | 0 (0.0%) | 0 (0.0%) |
| Coal or Coke | 0 (0.0%) | 0 (0.0%) |
| All other Fuels | 12 (1.3%) | 0 (0.0%) |
| No Fuel Used | 0 (0.0%) | 0 (0.0%) |
| Total | 947 (100.0%) | 483 (100.0%) |
Household Vehicle Usage in Hardwick
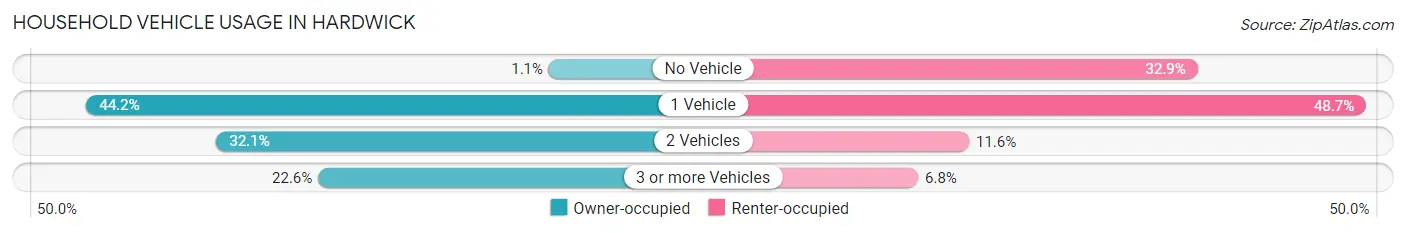
| Vehicles per Household | Owner-occupied | Renter-occupied |
| No Vehicle | 10 (1.1%) | 159 (32.9%) |
| 1 Vehicle | 419 (44.2%) | 235 (48.6%) |
| 2 Vehicles | 304 (32.1%) | 56 (11.6%) |
| 3 or more Vehicles | 214 (22.6%) | 33 (6.8%) |
| Total | 947 (100.0%) | 483 (100.0%) |
Real Estate & Mortgages in Hardwick
Real Estate and Mortgage Overview in Hardwick
| Characteristic | Without Mortgage | With Mortgage |
| Housing Units | 713 | 234 |
| Median Property Value | $76,500 | $134,600 |
| Median Household Income | $55,104 | $0 |
| Monthly Housing Costs | $497 | $0 |
| Real Estate Taxes | $607 | $3 |
Property Value by Mortgage Status in Hardwick
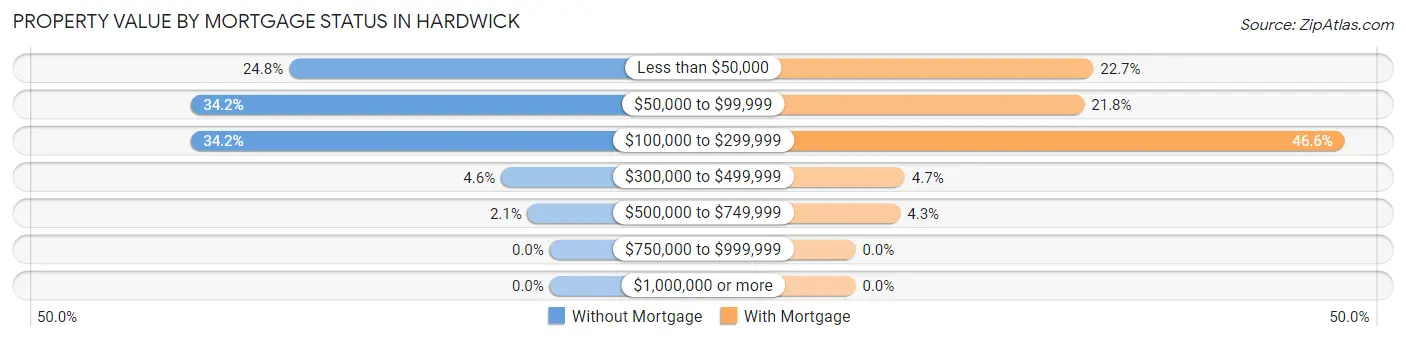
| Property Value | Without Mortgage | With Mortgage |
| Less than $50,000 | 177 (24.8%) | 53 (22.7%) |
| $50,000 to $99,999 | 244 (34.2%) | 51 (21.8%) |
| $100,000 to $299,999 | 244 (34.2%) | 109 (46.6%) |
| $300,000 to $499,999 | 33 (4.6%) | 11 (4.7%) |
| $500,000 to $749,999 | 15 (2.1%) | 10 (4.3%) |
| $750,000 to $999,999 | 0 (0.0%) | 0 (0.0%) |
| $1,000,000 or more | 0 (0.0%) | 0 (0.0%) |
| Total | 713 (100.0%) | 234 (100.0%) |
Household Income by Mortgage Status in Hardwick
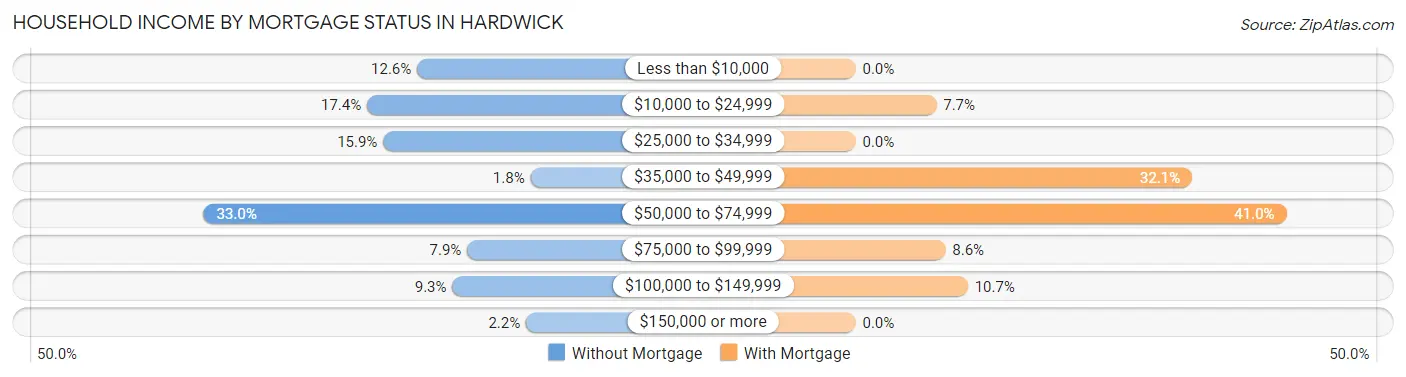
| Household Income | Without Mortgage | With Mortgage |
| Less than $10,000 | 90 (12.6%) | 0 (0.0%) |
| $10,000 to $24,999 | 124 (17.4%) | 18 (7.7%) |
| $25,000 to $34,999 | 113 (15.9%) | 0 (0.0%) |
| $35,000 to $49,999 | 13 (1.8%) | 75 (32.1%) |
| $50,000 to $74,999 | 235 (33.0%) | 96 (41.0%) |
| $75,000 to $99,999 | 56 (7.9%) | 20 (8.6%) |
| $100,000 to $149,999 | 66 (9.3%) | 25 (10.7%) |
| $150,000 or more | 16 (2.2%) | 0 (0.0%) |
| Total | 713 (100.0%) | 234 (100.0%) |
Property Value to Household Income Ratio in Hardwick
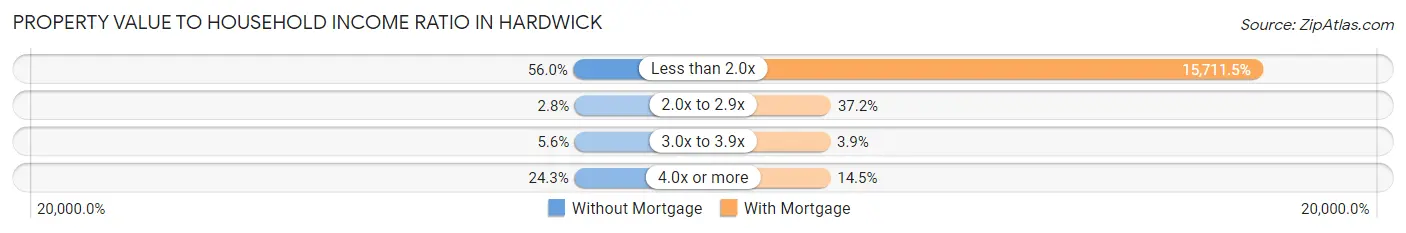
| Value-to-Income Ratio | Without Mortgage | With Mortgage |
| Less than 2.0x | 399 (56.0%) | 36,765 (15,711.5%) |
| 2.0x to 2.9x | 20 (2.8%) | 87 (37.2%) |
| 3.0x to 3.9x | 40 (5.6%) | 9 (3.8%) |
| 4.0x or more | 173 (24.3%) | 34 (14.5%) |
| Total | 713 (100.0%) | 234 (100.0%) |
Real Estate Taxes by Mortgage Status in Hardwick
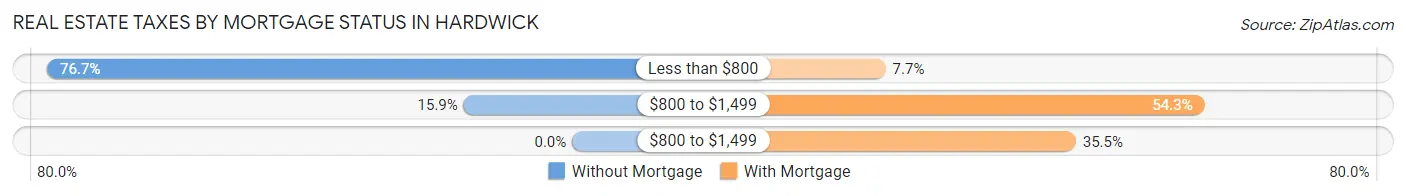
| Property Taxes | Without Mortgage | With Mortgage |
| Less than $800 | 547 (76.7%) | 18 (7.7%) |
| $800 to $1,499 | 113 (15.9%) | 127 (54.3%) |
| $800 to $1,499 | 0 (0.0%) | 83 (35.5%) |
| Total | 713 (100.0%) | 234 (100.0%) |
Health & Disability in Hardwick
Health Insurance Coverage by Age in Hardwick
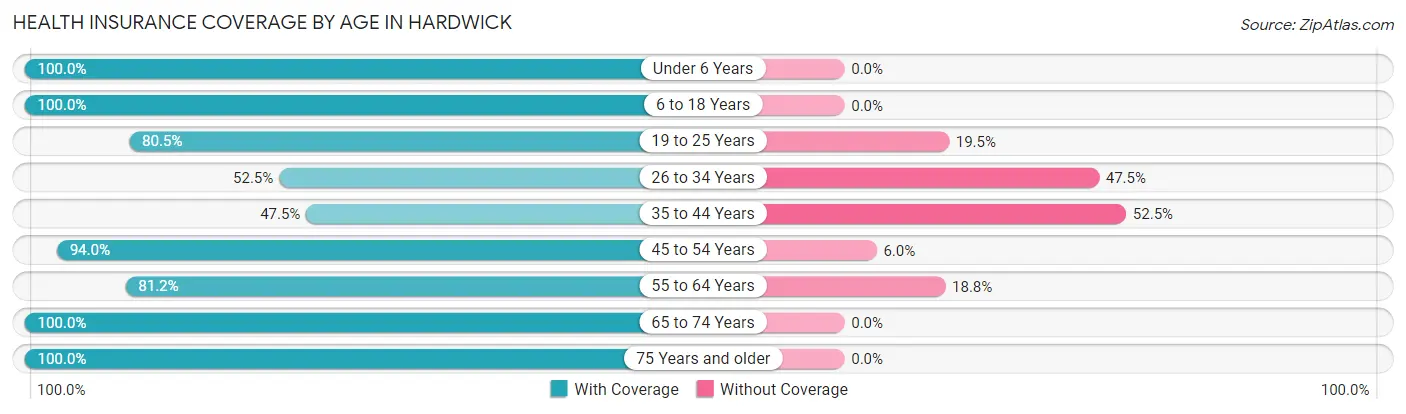
| Age Bracket | With Coverage | Without Coverage |
| Under 6 Years | 148 (100.0%) | 0 (0.0%) |
| 6 to 18 Years | 467 (100.0%) | 0 (0.0%) |
| 19 to 25 Years | 223 (80.5%) | 54 (19.5%) |
| 26 to 34 Years | 124 (52.5%) | 112 (47.5%) |
| 35 to 44 Years | 142 (47.5%) | 157 (52.5%) |
| 45 to 54 Years | 454 (94.0%) | 29 (6.0%) |
| 55 to 64 Years | 501 (81.2%) | 116 (18.8%) |
| 65 to 74 Years | 271 (100.0%) | 0 (0.0%) |
| 75 Years and older | 222 (100.0%) | 0 (0.0%) |
| Total | 2,552 (84.5%) | 468 (15.5%) |
Health Insurance Coverage by Citizenship Status in Hardwick
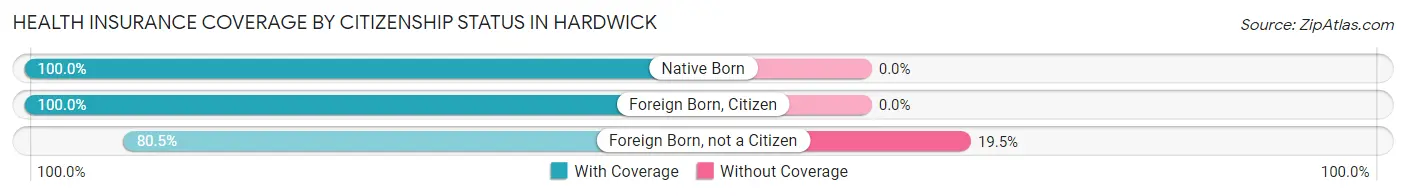
| Citizenship Status | With Coverage | Without Coverage |
| Native Born | 148 (100.0%) | 0 (0.0%) |
| Foreign Born, Citizen | 467 (100.0%) | 0 (0.0%) |
| Foreign Born, not a Citizen | 223 (80.5%) | 54 (19.5%) |
Health Insurance Coverage by Household Income in Hardwick
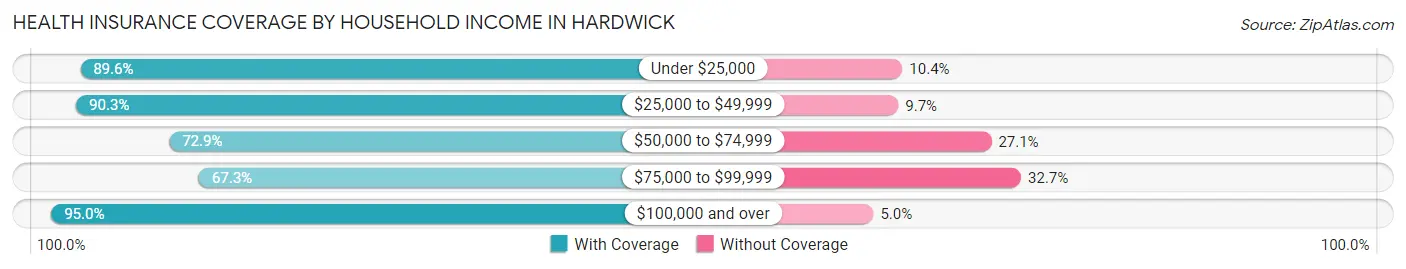
| Household Income | With Coverage | Without Coverage |
| Under $25,000 | 851 (89.6%) | 99 (10.4%) |
| $25,000 to $49,999 | 767 (90.3%) | 82 (9.7%) |
| $50,000 to $74,999 | 495 (72.9%) | 184 (27.1%) |
| $75,000 to $99,999 | 167 (67.3%) | 81 (32.7%) |
| $100,000 and over | 266 (95.0%) | 14 (5.0%) |
Public vs Private Health Insurance Coverage by Age in Hardwick
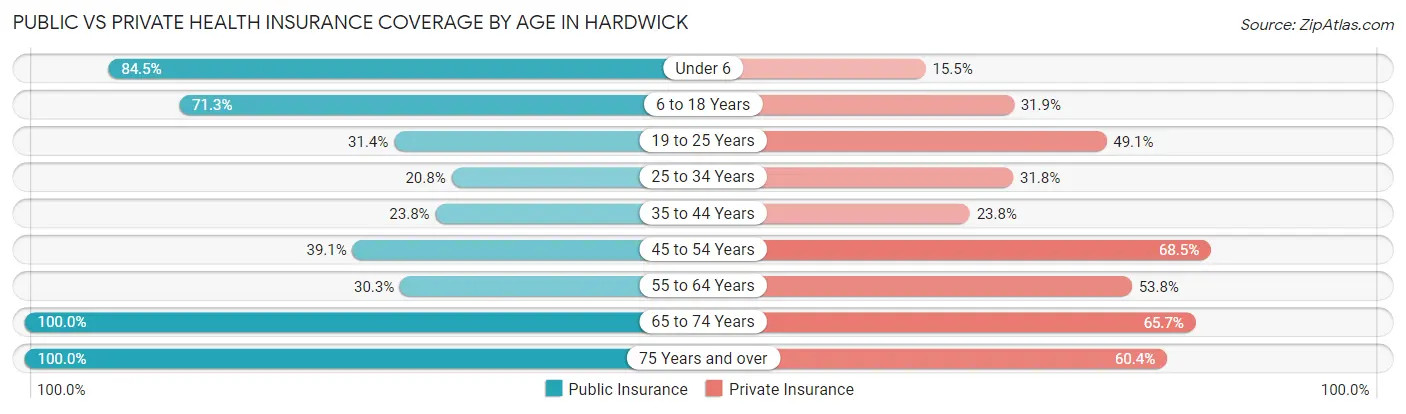
| Age Bracket | Public Insurance | Private Insurance |
| Under 6 | 125 (84.5%) | 23 (15.5%) |
| 6 to 18 Years | 333 (71.3%) | 149 (31.9%) |
| 19 to 25 Years | 87 (31.4%) | 136 (49.1%) |
| 25 to 34 Years | 49 (20.8%) | 75 (31.8%) |
| 35 to 44 Years | 71 (23.7%) | 71 (23.7%) |
| 45 to 54 Years | 189 (39.1%) | 331 (68.5%) |
| 55 to 64 Years | 187 (30.3%) | 332 (53.8%) |
| 65 to 74 Years | 271 (100.0%) | 178 (65.7%) |
| 75 Years and over | 222 (100.0%) | 134 (60.4%) |
| Total | 1,534 (50.8%) | 1,429 (47.3%) |
Disability Status by Sex by Age in Hardwick
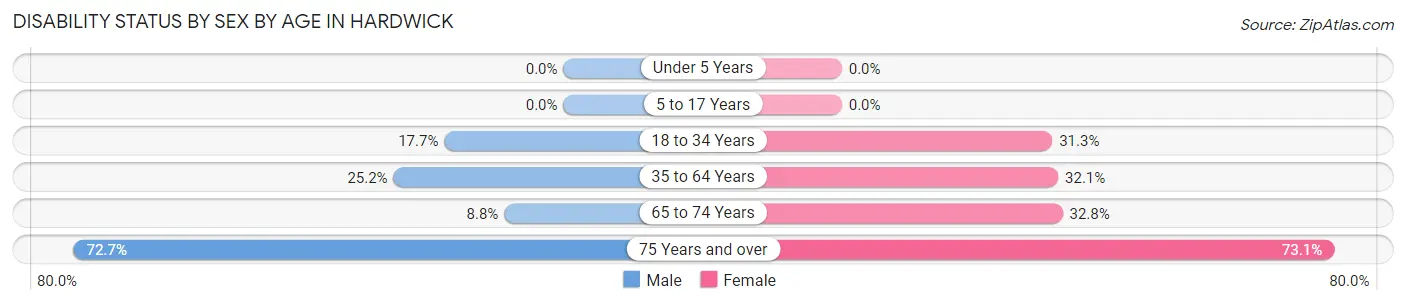
| Age Bracket | Male | Female |
| Under 5 Years | 0 (0.0%) | 0 (0.0%) |
| 5 to 17 Years | 0 (0.0%) | 0 (0.0%) |
| 18 to 34 Years | 52 (17.7%) | 85 (31.2%) |
| 35 to 64 Years | 166 (25.2%) | 238 (32.1%) |
| 65 to 74 Years | 8 (8.8%) | 59 (32.8%) |
| 75 Years and over | 48 (72.7%) | 114 (73.1%) |
Disability Class by Sex by Age in Hardwick
Disability Class: Hearing Difficulty
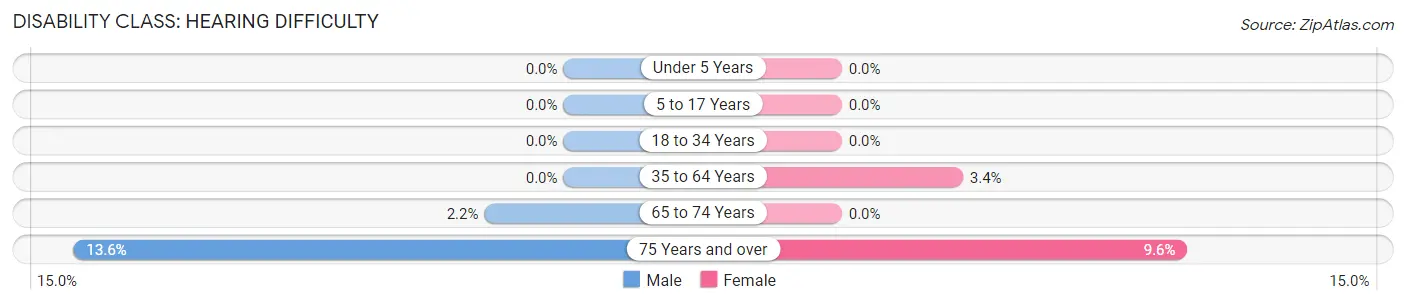
| Age Bracket | Male | Female |
| Under 5 Years | 0 (0.0%) | 0 (0.0%) |
| 5 to 17 Years | 0 (0.0%) | 0 (0.0%) |
| 18 to 34 Years | 0 (0.0%) | 0 (0.0%) |
| 35 to 64 Years | 0 (0.0%) | 25 (3.4%) |
| 65 to 74 Years | 2 (2.2%) | 0 (0.0%) |
| 75 Years and over | 9 (13.6%) | 15 (9.6%) |
Disability Class: Vision Difficulty
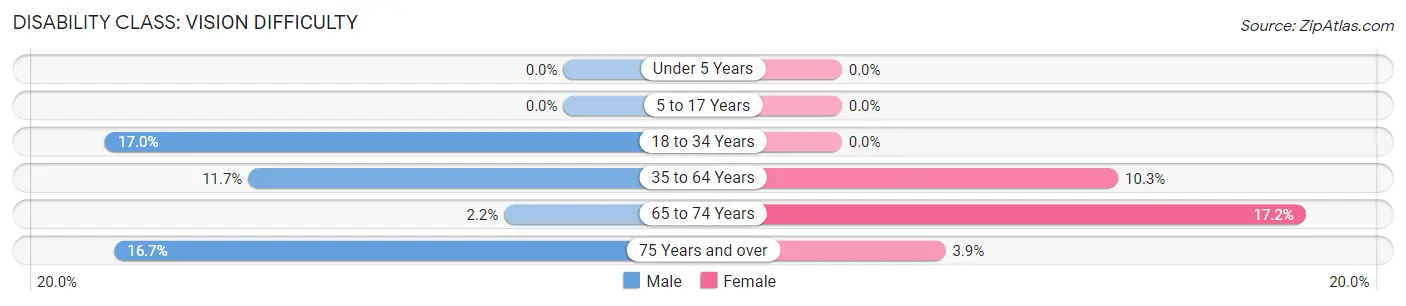
| Age Bracket | Male | Female |
| Under 5 Years | 0 (0.0%) | 0 (0.0%) |
| 5 to 17 Years | 0 (0.0%) | 0 (0.0%) |
| 18 to 34 Years | 50 (17.0%) | 0 (0.0%) |
| 35 to 64 Years | 77 (11.7%) | 76 (10.3%) |
| 65 to 74 Years | 2 (2.2%) | 31 (17.2%) |
| 75 Years and over | 11 (16.7%) | 6 (3.8%) |
Disability Class: Cognitive Difficulty
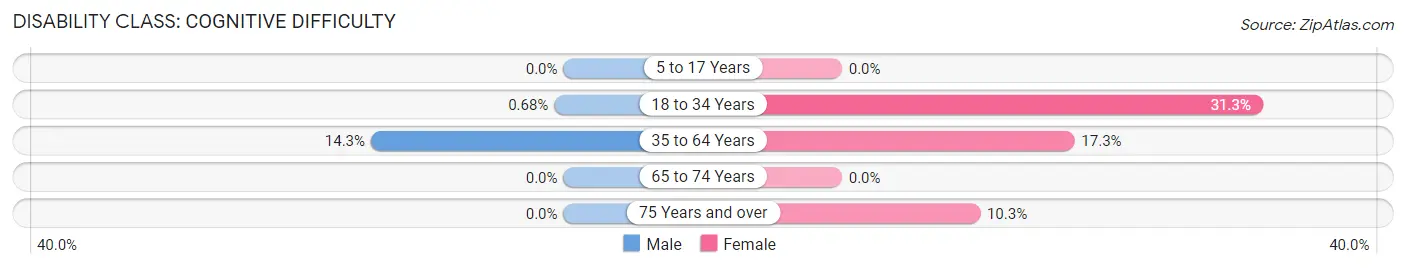
| Age Bracket | Male | Female |
| 5 to 17 Years | 0 (0.0%) | 0 (0.0%) |
| 18 to 34 Years | 2 (0.7%) | 85 (31.2%) |
| 35 to 64 Years | 94 (14.3%) | 128 (17.3%) |
| 65 to 74 Years | 0 (0.0%) | 0 (0.0%) |
| 75 Years and over | 0 (0.0%) | 16 (10.3%) |
Disability Class: Ambulatory Difficulty
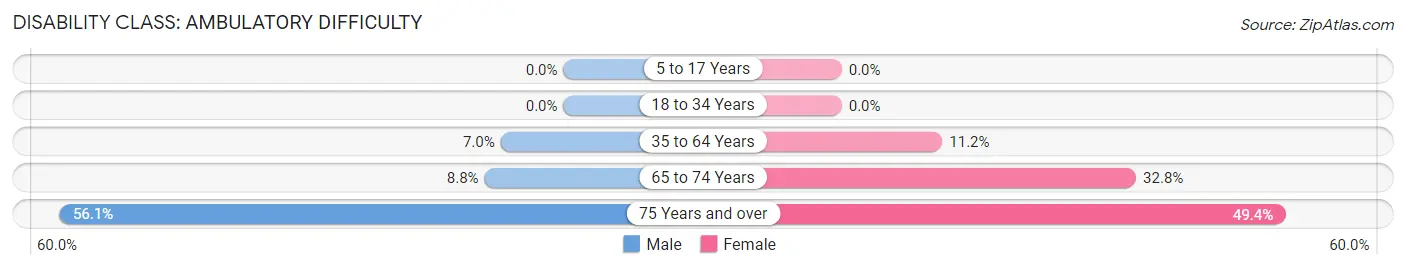
| Age Bracket | Male | Female |
| 5 to 17 Years | 0 (0.0%) | 0 (0.0%) |
| 18 to 34 Years | 0 (0.0%) | 0 (0.0%) |
| 35 to 64 Years | 46 (7.0%) | 83 (11.2%) |
| 65 to 74 Years | 8 (8.8%) | 59 (32.8%) |
| 75 Years and over | 37 (56.1%) | 77 (49.4%) |
Disability Class: Self-Care Difficulty
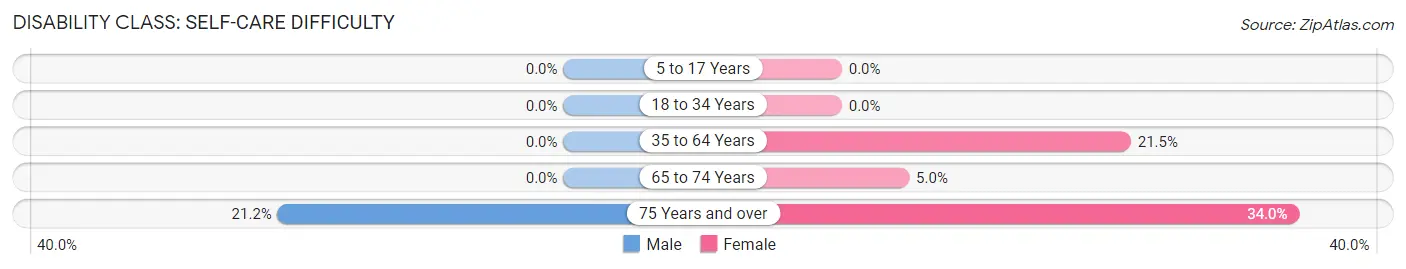
| Age Bracket | Male | Female |
| 5 to 17 Years | 0 (0.0%) | 0 (0.0%) |
| 18 to 34 Years | 0 (0.0%) | 0 (0.0%) |
| 35 to 64 Years | 0 (0.0%) | 159 (21.5%) |
| 65 to 74 Years | 0 (0.0%) | 9 (5.0%) |
| 75 Years and over | 14 (21.2%) | 53 (34.0%) |
Technology Access in Hardwick
Computing Device Access in Hardwick
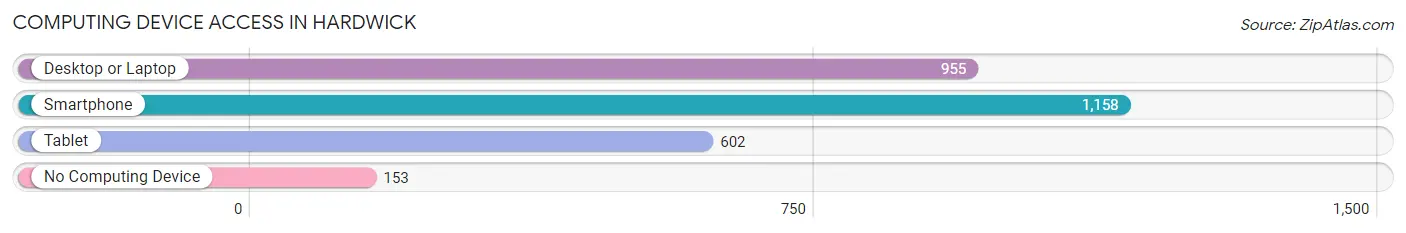
| Device Type | # Households | % Households |
| Desktop or Laptop | 955 | 66.8% |
| Smartphone | 1,158 | 81.0% |
| Tablet | 602 | 42.1% |
| No Computing Device | 153 | 10.7% |
| Total | 1,430 | 100.0% |
Internet Access in Hardwick
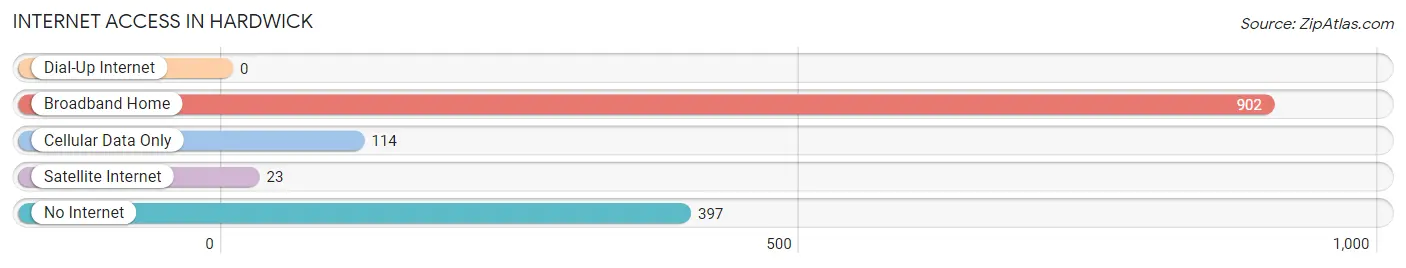
| Internet Type | # Households | % Households |
| Dial-Up Internet | 0 | 0.0% |
| Broadband Home | 902 | 63.1% |
| Cellular Data Only | 114 | 8.0% |
| Satellite Internet | 23 | 1.6% |
| No Internet | 397 | 27.8% |
| Total | 1,430 | 100.0% |
Hardwick Summary
History
Hardwick, Georgia is a small town located in the southeastern part of the state. It is situated in the heart of the Oconee National Forest and is surrounded by the Chattahoochee National Forest. The town was founded in 1820 by a group of settlers from North Carolina. The town was named after the Hardwick family, who were among the first settlers.
The town was originally a farming community, but in the late 19th century, the town began to grow and develop. The railroad came to Hardwick in 1883, and the town soon became a hub for the timber industry. The town also became a center for the production of cotton and other agricultural products.
In the early 20th century, Hardwick began to experience a period of growth and prosperity. The town was home to several businesses, including a cotton mill, a sawmill, and a brick factory. The town also had a number of churches, schools, and other civic organizations.
In the 1950s, Hardwick began to experience a decline in population and economic activity. The town was hit hard by the Great Depression and the decline of the timber industry. In the 1970s, the town began to experience a resurgence in population and economic activity. The town was revitalized by the construction of a new highway, which connected Hardwick to the nearby cities of Athens and Macon.
Geography
Hardwick is located in the southeastern part of Georgia, in the heart of the Oconee National Forest. The town is situated in a valley surrounded by the Chattahoochee National Forest. The town is located at an elevation of 890 feet above sea level.
The town is located in a humid subtropical climate zone, with hot summers and mild winters. The average annual temperature is around 70 degrees Fahrenheit. The average annual precipitation is around 50 inches.
Economy
The economy of Hardwick is largely based on agriculture and forestry. The town is home to several farms, which produce a variety of crops, including cotton, corn, soybeans, and peanuts. The town is also home to several timber companies, which harvest timber from the surrounding forests.
The town is also home to several small businesses, including restaurants, retail stores, and service providers. The town is also home to a number of manufacturing companies, which produce a variety of products, including furniture, clothing, and textiles.
Demographics
As of the 2010 census, the population of Hardwick was 1,845. The town has a population density of 5.3 people per square mile. The median age of the population is 39.7 years. The median household income is $37,941.
The racial makeup of the town is 87.3% White, 8.2% African American, 0.3% Native American, 0.7% Asian, 0.1% Pacific Islander, 1.2% from other races, and 2.4% from two or more races. The town has a Hispanic or Latino population of 4.2%.
Conclusion
Hardwick, Georgia is a small town located in the southeastern part of the state. It is situated in the heart of the Oconee National Forest and is surrounded by the Chattahoochee National Forest. The town was founded in 1820 by a group of settlers from North Carolina. The town was originally a farming community, but in the late 19th century, the town began to grow and develop. The town is now home to several businesses, including a cotton mill, a sawmill, and a brick factory. The town is also home to several farms, which produce a variety of crops, including cotton, corn, soybeans, and peanuts. The town is also home to several timber companies, which harvest timber from the surrounding forests. As of the 2010 census, the population of Hardwick was 1,845. The town has a population density of 5.3 people per square mile. The median age of the population is 39.7 years. The median household income is $37,941.
Common Questions
What is Per Capita Income in Hardwick?
Per Capita income in Hardwick is $24,968.
What is the Median Family Income in Hardwick?
Median Family Income in Hardwick is $34,300.
What is the Median Household income in Hardwick?
Median Household Income in Hardwick is $34,587.
What is Income or Wage Gap in Hardwick?
Income or Wage Gap in Hardwick is 16.3%.
Women in Hardwick earn 83.7 cents for every dollar earned by a man.
What is Inequality or Gini Index in Hardwick?
Inequality or Gini Index in Hardwick is 0.56.
What is the Total Population of Hardwick?
Total Population of Hardwick is 3,202.
What is the Total Male Population of Hardwick?
Total Male Population of Hardwick is 1,463.
What is the Total Female Population of Hardwick?
Total Female Population of Hardwick is 1,739.
What is the Ratio of Males per 100 Females in Hardwick?
There are 84.13 Males per 100 Females in Hardwick.
What is the Ratio of Females per 100 Males in Hardwick?
There are 118.87 Females per 100 Males in Hardwick.
What is the Median Population Age in Hardwick?
Median Population Age in Hardwick is 48.5 Years.
What is the Average Family Size in Hardwick
Average Family Size in Hardwick is 2.9 People.
What is the Average Household Size in Hardwick
Average Household Size in Hardwick is 2.1 People.
How Large is the Labor Force in Hardwick?
There are 1,248 People in the Labor Forcein in Hardwick.
What is the Percentage of People in the Labor Force in Hardwick?
47.2% of People are in the Labor Force in Hardwick.
What is the Unemployment Rate in Hardwick?
Unemployment Rate in Hardwick is 4.9%.