Diboll, TX Map & Demographics
Diboll Map
Diboll Overview
$20,247
PER CAPITA INCOME
$56,538
AVG FAMILY INCOME
$55,399
AVG HOUSEHOLD INCOME
23.7%
WAGE / INCOME GAP [ % ]
76.3¢/ $1
WAGE / INCOME GAP [ $ ]
0.42
INEQUALITY / GINI INDEX
4,546
TOTAL POPULATION
2,359
MALE POPULATION
2,187
FEMALE POPULATION
107.86
MALES / 100 FEMALES
92.71
FEMALES / 100 MALES
36.8
MEDIAN AGE
3.0
AVG FAMILY SIZE
2.8
AVG HOUSEHOLD SIZE
1,797
LABOR FORCE [ PEOPLE ]
54.2%
PERCENT IN LABOR FORCE
6.9%
UNEMPLOYMENT RATE
Diboll Zip Codes
Diboll Area Codes
Income in Diboll
Income Overview in Diboll
Per Capita Income in Diboll is $20,247, while median incomes of families and households are $56,538 and $55,399 respectively.
| Characteristic | Number | Measure |
| Per Capita Income | 4,546 | $20,247 |
| Median Family Income | 1,300 | $56,538 |
| Mean Family Income | 1,300 | $61,161 |
| Median Household Income | 1,457 | $55,399 |
| Mean Household Income | 1,457 | $61,704 |
| Income Deficit | 1,300 | $0 |
| Wage / Income Gap (%) | 4,546 | 23.66% |
| Wage / Income Gap ($) | 4,546 | 76.34¢ per $1 |
| Gini / Inequality Index | 4,546 | 0.42 |
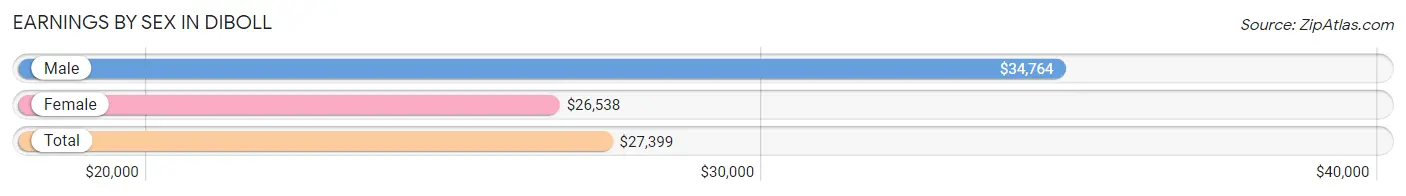
Earnings by Sex in Diboll
Average Earnings in Diboll are $27,399, $34,764 for men and $26,538 for women, a difference of 23.7%.
| Sex | Number | Average Earnings |
| Male | 791 (39.1%) | $34,764 |
| Female | 1,230 (60.9%) | $26,538 |
| Total | 2,021 (100.0%) | $27,399 |
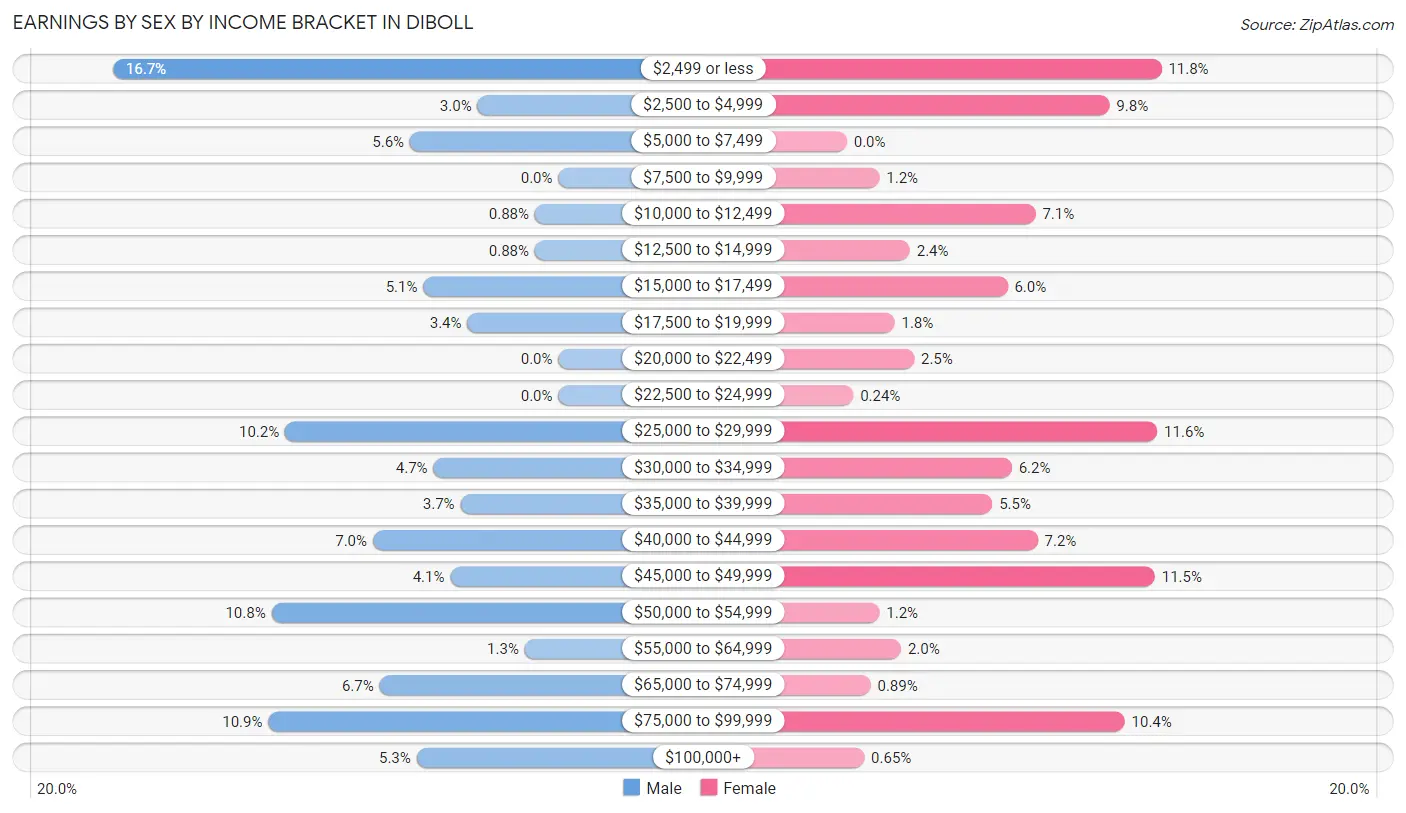
Earnings by Sex by Income Bracket in Diboll
The most common earnings brackets in Diboll are $2,499 or less for men (132 | 16.7%) and $2,499 or less for women (145 | 11.8%).
| Income | Male | Female |
| $2,499 or less | 132 (16.7%) | 145 (11.8%) |
| $2,500 to $4,999 | 24 (3.0%) | 121 (9.8%) |
| $5,000 to $7,499 | 44 (5.6%) | 0 (0.0%) |
| $7,500 to $9,999 | 0 (0.0%) | 15 (1.2%) |
| $10,000 to $12,499 | 7 (0.9%) | 87 (7.1%) |
| $12,500 to $14,999 | 7 (0.9%) | 29 (2.4%) |
| $15,000 to $17,499 | 40 (5.1%) | 74 (6.0%) |
| $17,500 to $19,999 | 27 (3.4%) | 22 (1.8%) |
| $20,000 to $22,499 | 0 (0.0%) | 31 (2.5%) |
| $22,500 to $24,999 | 0 (0.0%) | 3 (0.2%) |
| $25,000 to $29,999 | 81 (10.2%) | 143 (11.6%) |
| $30,000 to $34,999 | 37 (4.7%) | 76 (6.2%) |
| $35,000 to $39,999 | 29 (3.7%) | 67 (5.4%) |
| $40,000 to $44,999 | 55 (7.0%) | 88 (7.1%) |
| $45,000 to $49,999 | 32 (4.1%) | 142 (11.5%) |
| $50,000 to $54,999 | 85 (10.7%) | 15 (1.2%) |
| $55,000 to $64,999 | 10 (1.3%) | 25 (2.0%) |
| $65,000 to $74,999 | 53 (6.7%) | 11 (0.9%) |
| $75,000 to $99,999 | 86 (10.9%) | 128 (10.4%) |
| $100,000+ | 42 (5.3%) | 8 (0.6%) |
| Total | 791 (100.0%) | 1,230 (100.0%) |
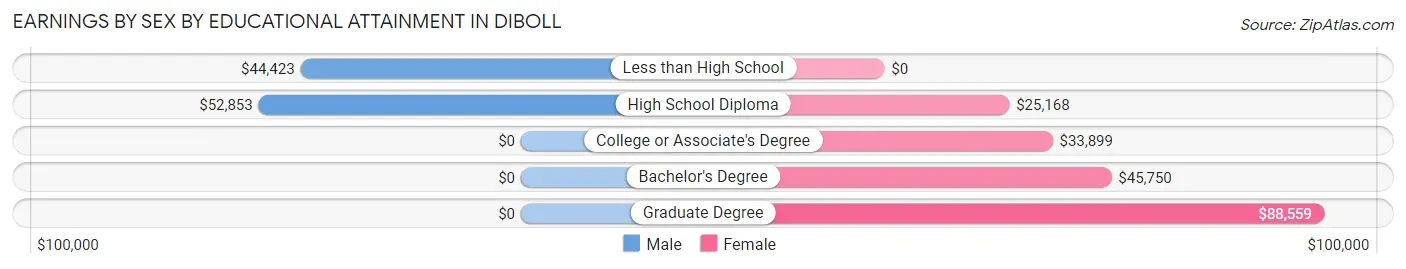
Earnings by Sex by Educational Attainment in Diboll
Average earnings in Diboll are $44,804 for men and $33,986 for women, a difference of 24.1%. Men with an educational attainment of high school diploma enjoy the highest average annual earnings of $52,853, while those with less than high school education earn the least with $44,423. Women with an educational attainment of graduate degree earn the most with the average annual earnings of $88,559, while those with high school diploma education have the smallest earnings of $25,168.
| Educational Attainment | Male Income | Female Income |
| Less than High School | $44,423 | $0 |
| High School Diploma | $52,853 | $25,168 |
| College or Associate's Degree | - | - |
| Bachelor's Degree | - | - |
| Graduate Degree | - | - |
| Total | $44,804 | $33,986 |
Family Income in Diboll
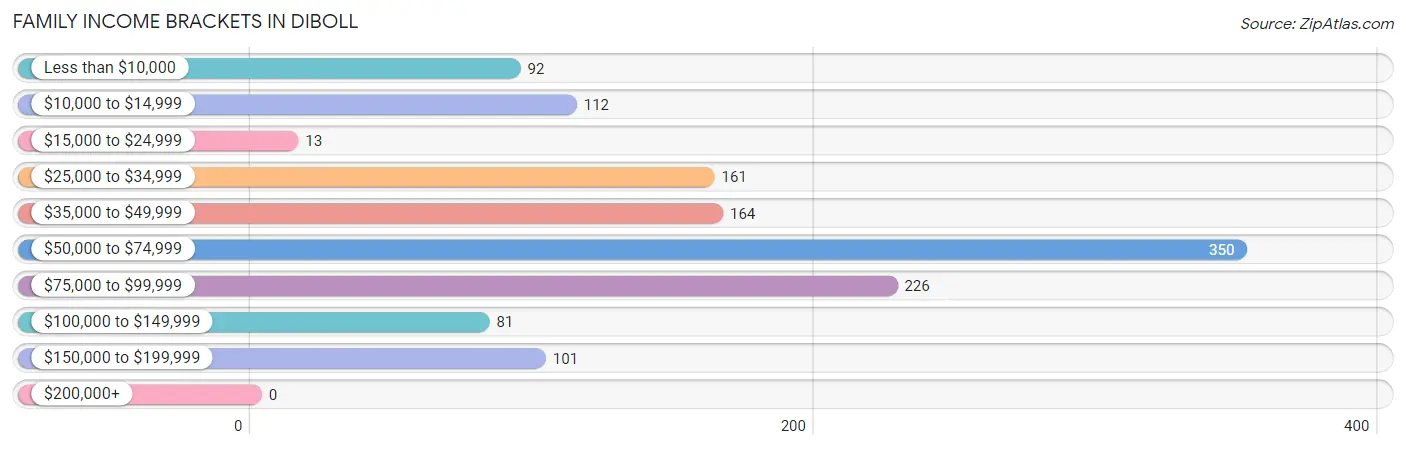
Family Income Brackets in Diboll
According to the Diboll family income data, there are 350 families falling into the $50,000 to $74,999 income range, which is the most common income bracket and makes up 26.9% of all families.
| Income Bracket | # Families | % Families |
| Less than $10,000 | 92 | 7.1% |
| $10,000 to $14,999 | 112 | 8.6% |
| $15,000 to $24,999 | 13 | 1.0% |
| $25,000 to $34,999 | 161 | 12.4% |
| $35,000 to $49,999 | 164 | 12.6% |
| $50,000 to $74,999 | 350 | 26.9% |
| $75,000 to $99,999 | 226 | 17.4% |
| $100,000 to $149,999 | 81 | 6.2% |
| $150,000 to $199,999 | 101 | 7.8% |
| $200,000+ | 0 | 0.0% |
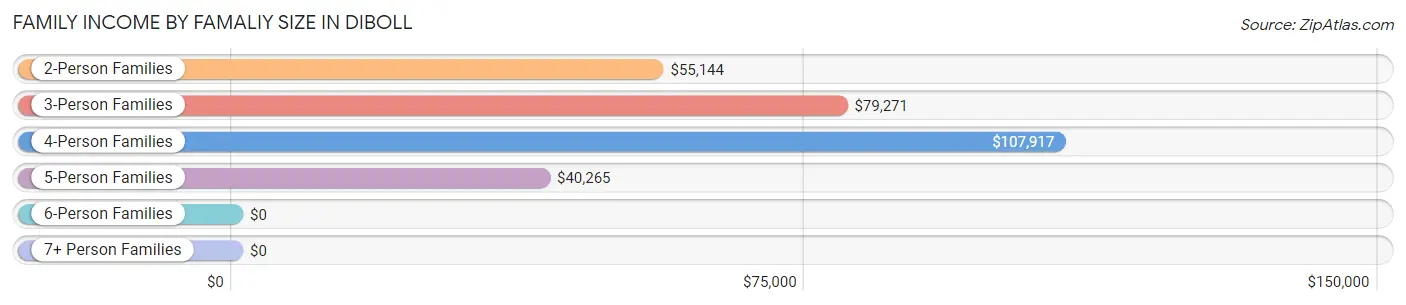
Family Income by Famaliy Size in Diboll
4-person families (168 | 12.9%) account for the highest median family income in Diboll with $107,917 per family, while 2-person families (683 | 52.5%) have the highest median income of $27,572 per family member.
| Income Bracket | # Families | Median Income |
| 2-Person Families | 683 (52.5%) | $55,144 |
| 3-Person Families | 313 (24.1%) | $79,271 |
| 4-Person Families | 168 (12.9%) | $107,917 |
| 5-Person Families | 59 (4.5%) | $40,265 |
| 6-Person Families | 49 (3.8%) | $0 |
| 7+ Person Families | 28 (2.1%) | $0 |
| Total | 1,300 (100.0%) | $56,538 |
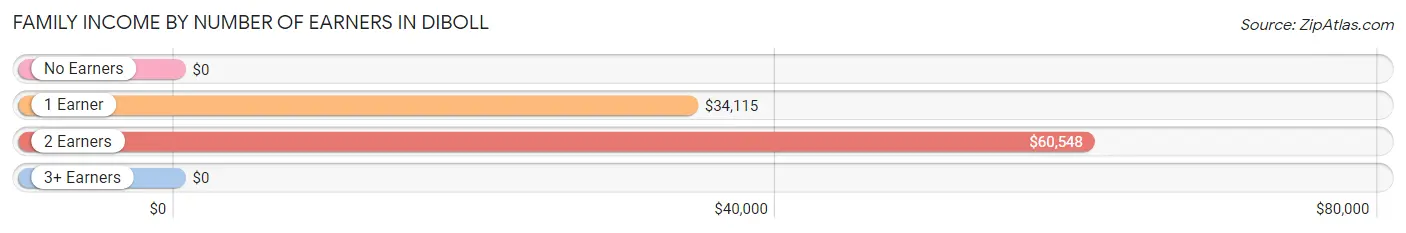
Family Income by Number of Earners in Diboll
| Number of Earners | # Families | Median Income |
| No Earners | 125 (9.6%) | $0 |
| 1 Earner | 474 (36.5%) | $34,115 |
| 2 Earners | 692 (53.2%) | $60,548 |
| 3+ Earners | 9 (0.7%) | $0 |
| Total | 1,300 (100.0%) | $56,538 |
Household Income in Diboll
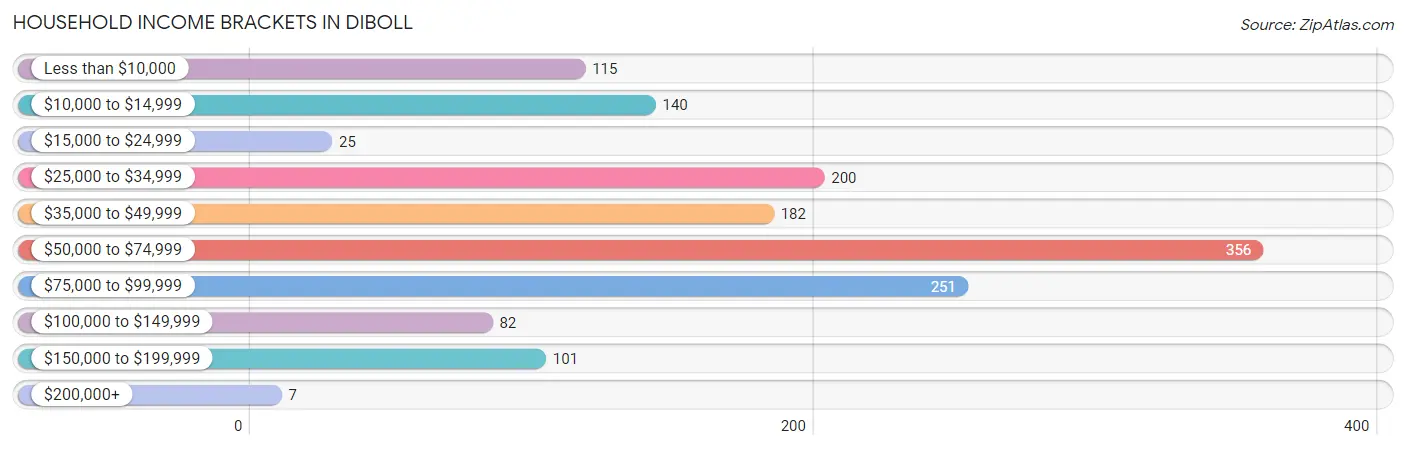
Household Income Brackets in Diboll
With 356 households falling in the category, the $50,000 to $74,999 income range is the most frequent in Diboll, accounting for 24.4% of all households. In contrast, only 7 households (0.5%) fall into the $200,000+ income bracket, making it the least populous group.
| Income Bracket | # Households | % Households |
| Less than $10,000 | 115 | 7.9% |
| $10,000 to $14,999 | 140 | 9.6% |
| $15,000 to $24,999 | 25 | 1.7% |
| $25,000 to $34,999 | 200 | 13.7% |
| $35,000 to $49,999 | 182 | 12.5% |
| $50,000 to $74,999 | 356 | 24.4% |
| $75,000 to $99,999 | 251 | 17.2% |
| $100,000 to $149,999 | 82 | 5.6% |
| $150,000 to $199,999 | 101 | 6.9% |
| $200,000+ | 7 | 0.5% |
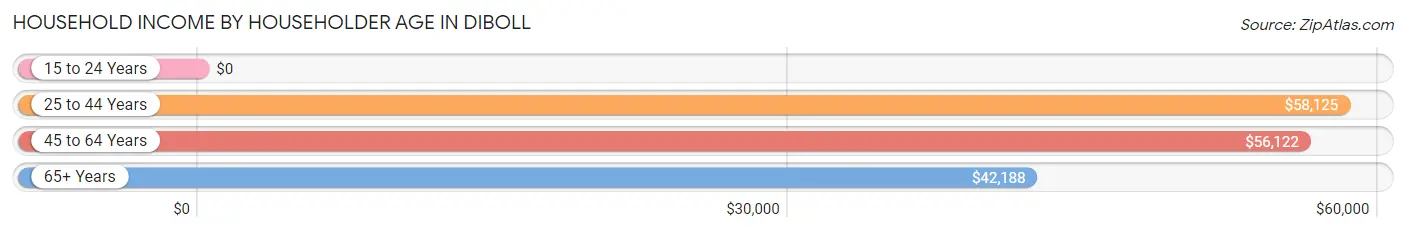
Household Income by Householder Age in Diboll
The median household income in Diboll is $55,399, with the highest median household income of $58,125 found in the 25 to 44 years age bracket for the primary householder. A total of 387 households (26.6%) fall into this category. Meanwhile, the 15 to 24 years age bracket for the primary householder has the lowest median household income of $0, with 42 households (2.9%) in this group.
| Income Bracket | # Households | Median Income |
| 15 to 24 Years | 42 (2.9%) | $0 |
| 25 to 44 Years | 387 (26.6%) | $58,125 |
| 45 to 64 Years | 728 (50.0%) | $56,122 |
| 65+ Years | 300 (20.6%) | $42,188 |
| Total | 1,457 (100.0%) | $55,399 |
Poverty in Diboll
Income Below Poverty by Sex and Age in Diboll
With 25.0% poverty level for males and 26.8% for females among the residents of Diboll, 6 to 11 year old males and 12 to 14 year old females are the most vulnerable to poverty, with 151 males (56.6%) and 52 females (100.0%) in their respective age groups living below the poverty level.
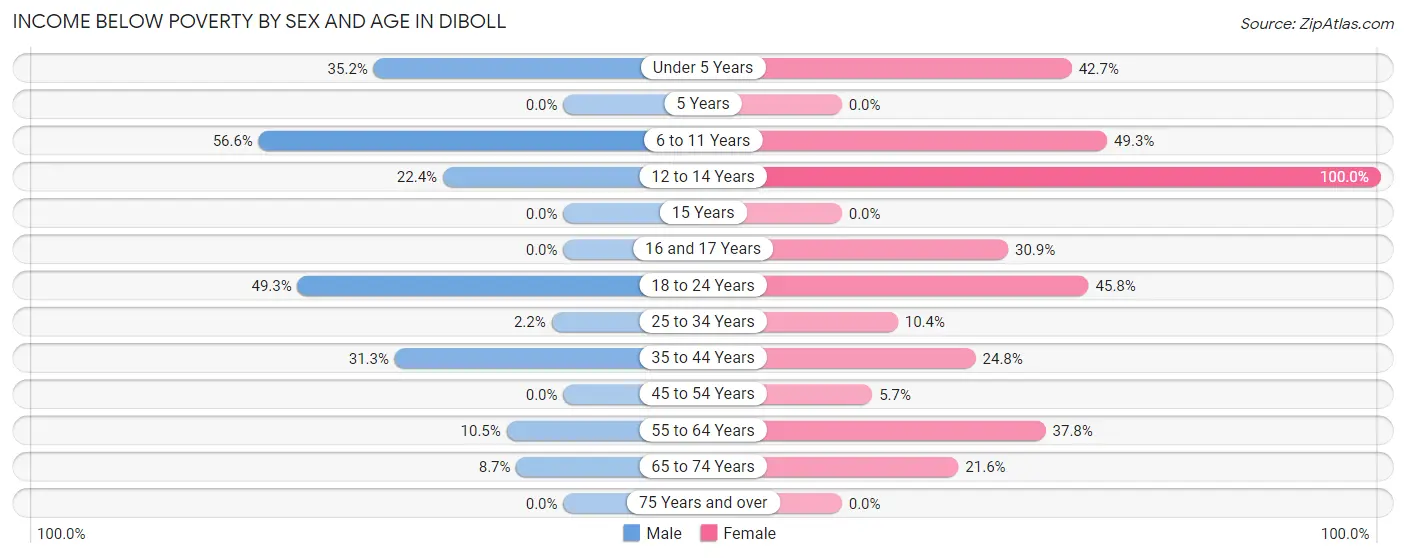
| Age Bracket | Male | Female |
| Under 5 Years | 94 (35.2%) | 35 (42.7%) |
| 5 Years | 0 (0.0%) | 0 (0.0%) |
| 6 to 11 Years | 151 (56.6%) | 133 (49.3%) |
| 12 to 14 Years | 36 (22.4%) | 52 (100.0%) |
| 15 Years | 0 (0.0%) | 0 (0.0%) |
| 16 and 17 Years | 0 (0.0%) | 25 (30.9%) |
| 18 to 24 Years | 111 (49.3%) | 82 (45.8%) |
| 25 to 34 Years | 3 (2.2%) | 18 (10.4%) |
| 35 to 44 Years | 56 (31.3%) | 79 (24.8%) |
| 45 to 54 Years | 0 (0.0%) | 27 (5.7%) |
| 55 to 64 Years | 26 (10.5%) | 87 (37.8%) |
| 65 to 74 Years | 13 (8.7%) | 37 (21.6%) |
| 75 Years and over | 0 (0.0%) | 0 (0.0%) |
| Total | 490 (25.0%) | 575 (26.8%) |
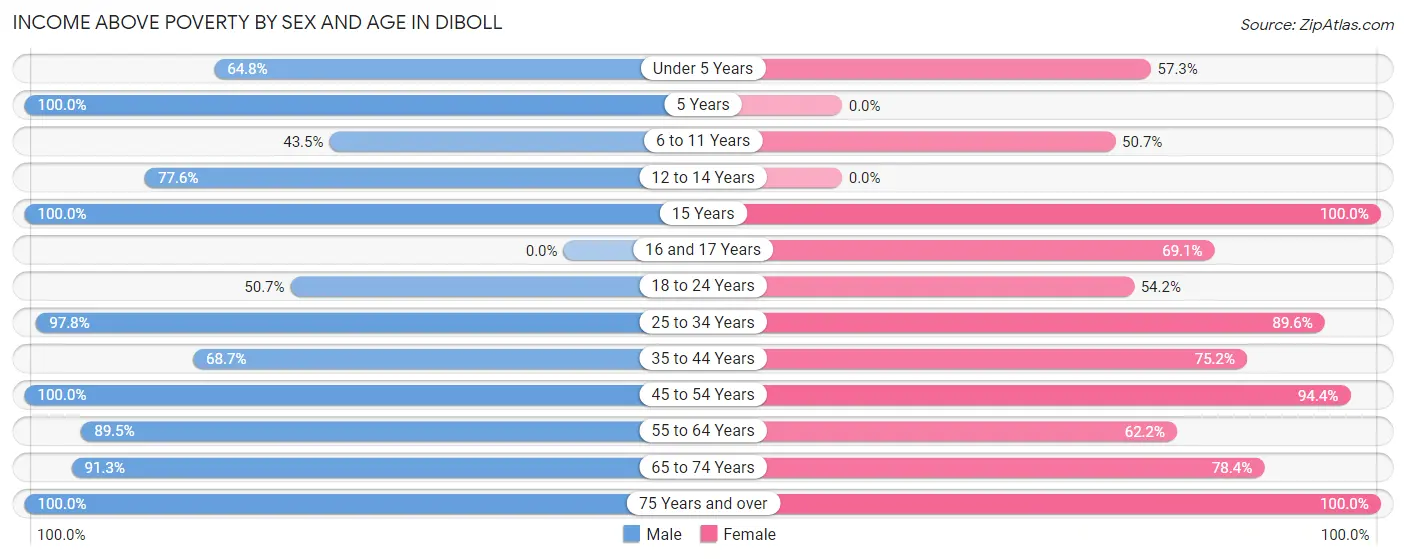
Income Above Poverty by Sex and Age in Diboll
According to the poverty statistics in Diboll, males aged 5 years and females aged 15 years are the age groups that are most secure financially, with 100.0% of males and 100.0% of females in these age groups living above the poverty line.
| Age Bracket | Male | Female |
| Under 5 Years | 173 (64.8%) | 47 (57.3%) |
| 5 Years | 14 (100.0%) | 0 (0.0%) |
| 6 to 11 Years | 116 (43.4%) | 137 (50.7%) |
| 12 to 14 Years | 125 (77.6%) | 0 (0.0%) |
| 15 Years | 66 (100.0%) | 51 (100.0%) |
| 16 and 17 Years | 0 (0.0%) | 56 (69.1%) |
| 18 to 24 Years | 114 (50.7%) | 97 (54.2%) |
| 25 to 34 Years | 134 (97.8%) | 155 (89.6%) |
| 35 to 44 Years | 123 (68.7%) | 239 (75.2%) |
| 45 to 54 Years | 207 (100.0%) | 451 (94.4%) |
| 55 to 64 Years | 221 (89.5%) | 143 (62.2%) |
| 65 to 74 Years | 136 (91.3%) | 134 (78.4%) |
| 75 Years and over | 39 (100.0%) | 60 (100.0%) |
| Total | 1,468 (75.0%) | 1,570 (73.2%) |
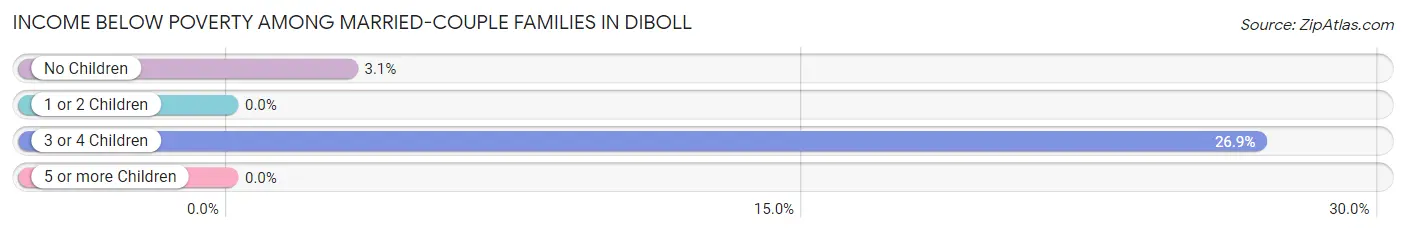
Income Below Poverty Among Married-Couple Families in Diboll
The poverty statistics for married-couple families in Diboll show that 5.3% or 31 of the total 583 families live below the poverty line. Families with 3 or 4 children have the highest poverty rate of 26.9%, comprising of 18 families. On the other hand, families with 1 or 2 children have the lowest poverty rate of 0.0%, which includes 0 families.
| Children | Above Poverty | Below Poverty |
| No Children | 403 (96.9%) | 13 (3.1%) |
| 1 or 2 Children | 100 (100.0%) | 0 (0.0%) |
| 3 or 4 Children | 49 (73.1%) | 18 (26.9%) |
| 5 or more Children | 0 (0.0%) | 0 (0.0%) |
| Total | 552 (94.7%) | 31 (5.3%) |
Income Below Poverty Among Single-Parent Households in Diboll
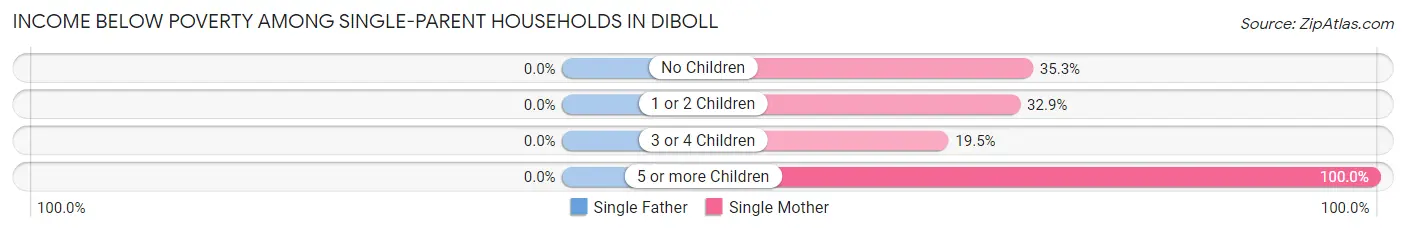
| Children | Single Father | Single Mother |
| No Children | 0 (0.0%) | 49 (35.2%) |
| 1 or 2 Children | 0 (0.0%) | 142 (32.9%) |
| 3 or 4 Children | 0 (0.0%) | 8 (19.5%) |
| 5 or more Children | 0 (0.0%) | 28 (100.0%) |
| Total | 0 (0.0%) | 227 (35.5%) |
Income Below Poverty Among Married-Couple vs Single-Parent Households in Diboll
The poverty data for Diboll shows that 31 of the married-couple family households (5.3%) and 227 of the single-parent households (31.7%) are living below the poverty level. Within the married-couple family households, those with 3 or 4 children have the highest poverty rate, with 18 households (26.9%) falling below the poverty line. Among the single-parent households, those with 5 or more children have the highest poverty rate, with 28 household (100.0%) living below poverty.
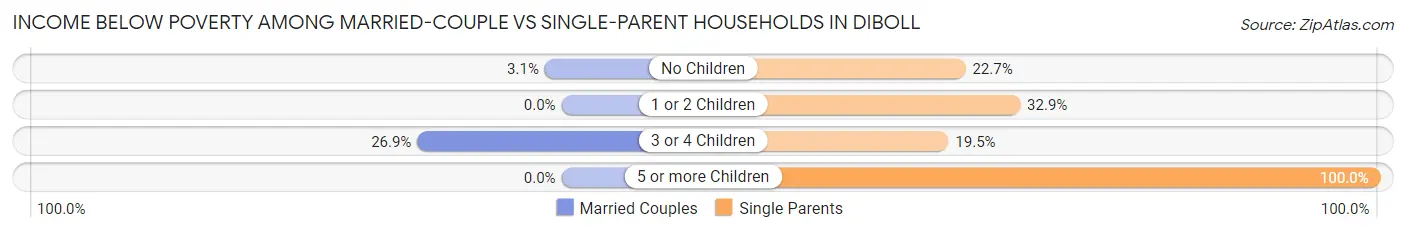
| Children | Married-Couple Families | Single-Parent Households |
| No Children | 13 (3.1%) | 49 (22.7%) |
| 1 or 2 Children | 0 (0.0%) | 142 (32.9%) |
| 3 or 4 Children | 18 (26.9%) | 8 (19.5%) |
| 5 or more Children | 0 (0.0%) | 28 (100.0%) |
| Total | 31 (5.3%) | 227 (31.7%) |
Race in Diboll
The most populous races in Diboll are White / Caucasian (1,988 | 43.7%), Hispanic or Latino (1,926 | 42.4%), and Black / African American (1,408 | 31.0%).
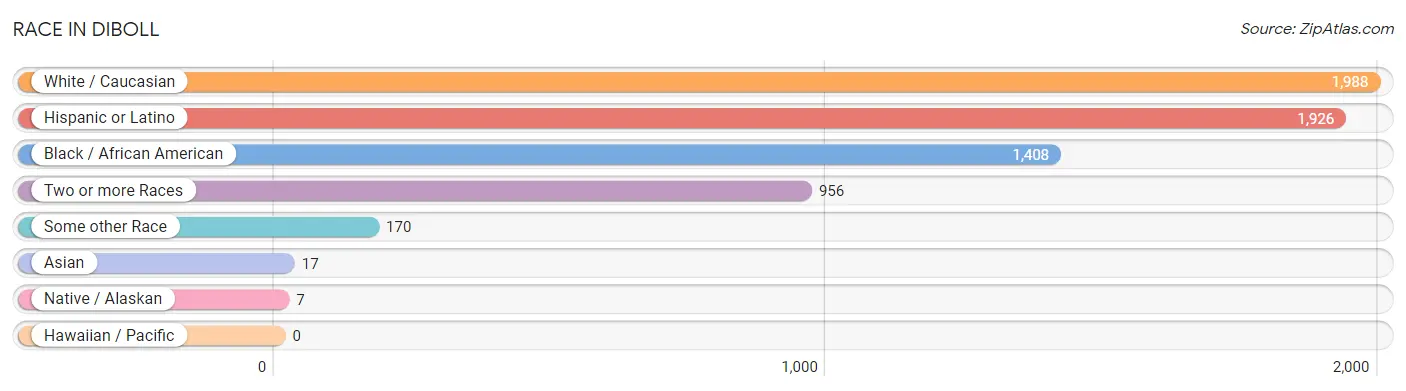
| Race | # Population | % Population |
| Asian | 17 | 0.4% |
| Black / African American | 1,408 | 31.0% |
| Hawaiian / Pacific | 0 | 0.0% |
| Hispanic or Latino | 1,926 | 42.4% |
| Native / Alaskan | 7 | 0.2% |
| White / Caucasian | 1,988 | 43.7% |
| Two or more Races | 956 | 21.0% |
| Some other Race | 170 | 3.7% |
| Total | 4,546 | 100.0% |
Ancestry in Diboll
The most populous ancestries reported in Diboll are Mexican (1,802 | 39.6%), American (594 | 13.1%), English (205 | 4.5%), German (195 | 4.3%), and Irish (138 | 3.0%), together accounting for 64.6% of all Diboll residents.
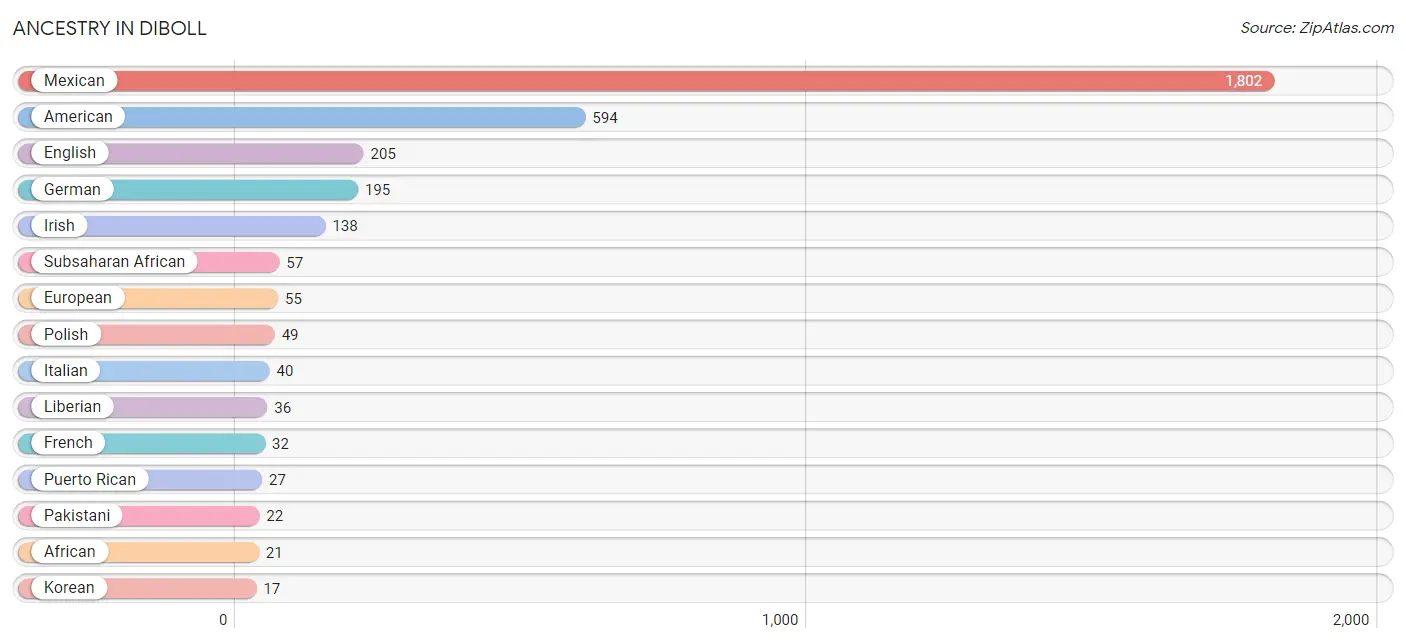
| Ancestry | # Population | % Population |
| African | 21 | 0.5% |
| American | 594 | 13.1% |
| Apache | 2 | 0.0% |
| British | 3 | 0.1% |
| Central American | 10 | 0.2% |
| Cherokee | 4 | 0.1% |
| Cuban | 6 | 0.1% |
| English | 205 | 4.5% |
| European | 55 | 1.2% |
| French | 32 | 0.7% |
| German | 195 | 4.3% |
| Honduran | 10 | 0.2% |
| Irish | 138 | 3.0% |
| Italian | 40 | 0.9% |
| Korean | 17 | 0.4% |
| Liberian | 36 | 0.8% |
| Mexican | 1,802 | 39.6% |
| Pakistani | 22 | 0.5% |
| Peruvian | 7 | 0.2% |
| Polish | 49 | 1.1% |
| Puerto Rican | 27 | 0.6% |
| Scotch-Irish | 11 | 0.2% |
| Scottish | 17 | 0.4% |
| South American | 7 | 0.2% |
| Spanish | 4 | 0.1% |
| Subsaharan African | 57 | 1.3% |
| Swiss | 4 | 0.1% |
| Ukrainian | 5 | 0.1% | View All 28 Rows |
Immigrants in Diboll
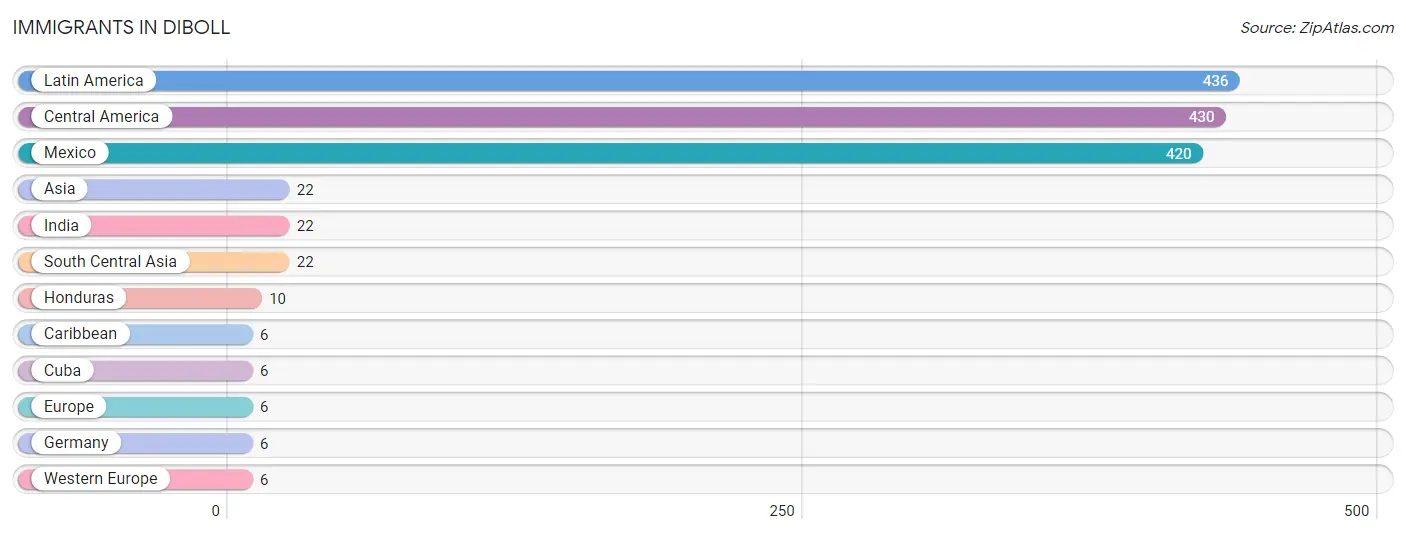
The most numerous immigrant groups reported in Diboll came from Latin America (436 | 9.6%), Central America (430 | 9.5%), Mexico (420 | 9.2%), Asia (22 | 0.5%), and India (22 | 0.5%), together accounting for 29.3% of all Diboll residents.
| Immigration Origin | # Population | % Population |
| Asia | 22 | 0.5% |
| Caribbean | 6 | 0.1% |
| Central America | 430 | 9.5% |
| Cuba | 6 | 0.1% |
| Europe | 6 | 0.1% |
| Germany | 6 | 0.1% |
| Honduras | 10 | 0.2% |
| India | 22 | 0.5% |
| Latin America | 436 | 9.6% |
| Mexico | 420 | 9.2% |
| South Central Asia | 22 | 0.5% |
| Western Europe | 6 | 0.1% | View All 12 Rows |
Sex and Age in Diboll
Sex and Age in Diboll
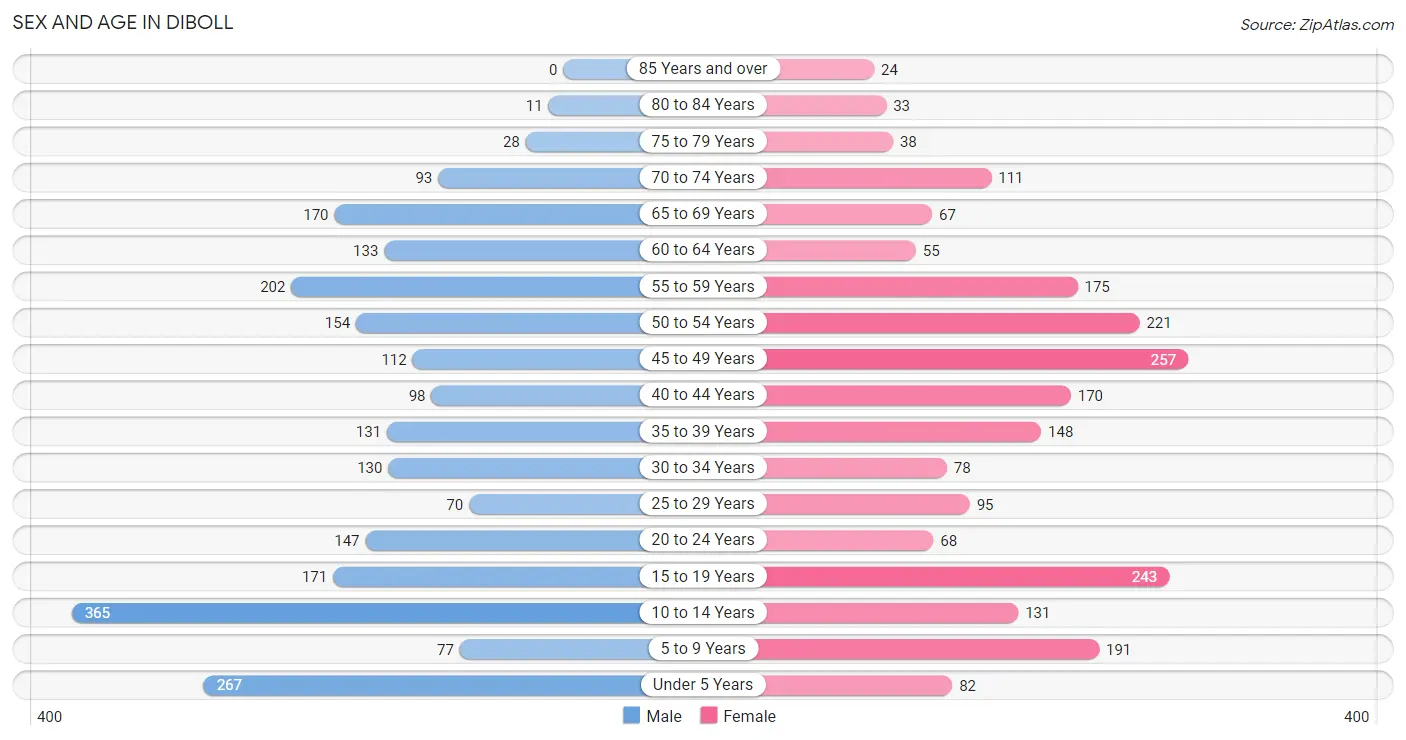
The most populous age groups in Diboll are 10 to 14 Years (365 | 15.5%) for men and 45 to 49 Years (257 | 11.7%) for women.
| Age Bracket | Male | Female |
| Under 5 Years | 267 (11.3%) | 82 (3.7%) |
| 5 to 9 Years | 77 (3.3%) | 191 (8.7%) |
| 10 to 14 Years | 365 (15.5%) | 131 (6.0%) |
| 15 to 19 Years | 171 (7.2%) | 243 (11.1%) |
| 20 to 24 Years | 147 (6.2%) | 68 (3.1%) |
| 25 to 29 Years | 70 (3.0%) | 95 (4.3%) |
| 30 to 34 Years | 130 (5.5%) | 78 (3.6%) |
| 35 to 39 Years | 131 (5.6%) | 148 (6.8%) |
| 40 to 44 Years | 98 (4.2%) | 170 (7.8%) |
| 45 to 49 Years | 112 (4.8%) | 257 (11.7%) |
| 50 to 54 Years | 154 (6.5%) | 221 (10.1%) |
| 55 to 59 Years | 202 (8.6%) | 175 (8.0%) |
| 60 to 64 Years | 133 (5.6%) | 55 (2.5%) |
| 65 to 69 Years | 170 (7.2%) | 67 (3.1%) |
| 70 to 74 Years | 93 (3.9%) | 111 (5.1%) |
| 75 to 79 Years | 28 (1.2%) | 38 (1.7%) |
| 80 to 84 Years | 11 (0.5%) | 33 (1.5%) |
| 85 Years and over | 0 (0.0%) | 24 (1.1%) |
| Total | 2,359 (100.0%) | 2,187 (100.0%) |
Families and Households in Diboll
Median Family Size in Diboll
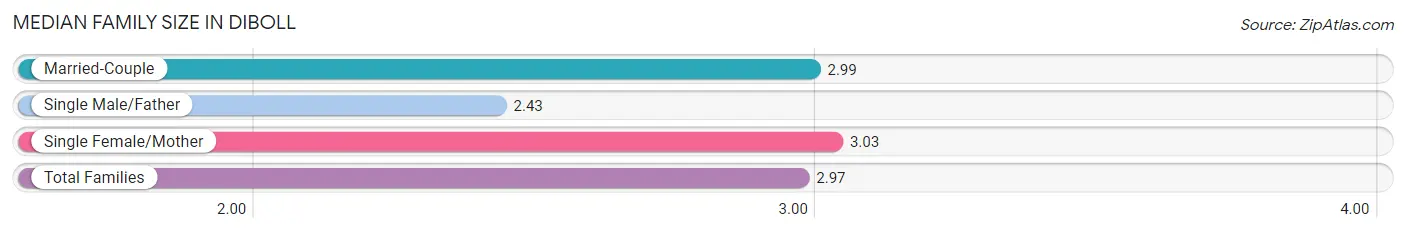
The median family size in Diboll is 2.97 persons per family, with single female/mother families (640 | 49.2%) accounting for the largest median family size of 3.03 persons per family. On the other hand, single male/father families (77 | 5.9%) represent the smallest median family size with 2.43 persons per family.
| Family Type | # Families | Family Size |
| Married-Couple | 583 (44.9%) | 2.99 |
| Single Male/Father | 77 (5.9%) | 2.43 |
| Single Female/Mother | 640 (49.2%) | 3.03 |
| Total Families | 1,300 (100.0%) | 2.97 |
Median Household Size in Diboll
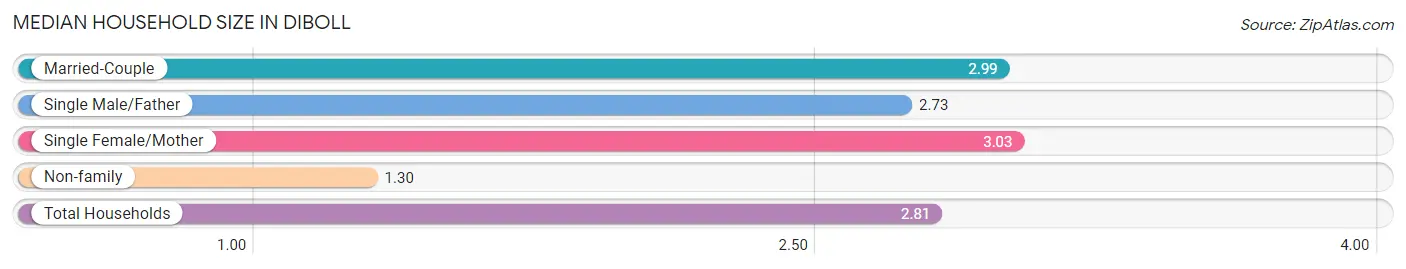
The median household size in Diboll is 2.81 persons per household, with single female/mother households (640 | 43.9%) accounting for the largest median household size of 3.03 persons per household. non-family households (157 | 10.8%) represent the smallest median household size with 1.30 persons per household.
| Household Type | # Households | Household Size |
| Married-Couple | 583 (40.0%) | 2.99 |
| Single Male/Father | 77 (5.3%) | 2.73 |
| Single Female/Mother | 640 (43.9%) | 3.03 |
| Non-family | 157 (10.8%) | 1.30 |
| Total Households | 1,457 (100.0%) | 2.81 |
Household Size by Marriage Status in Diboll
Out of a total of 1,457 households in Diboll, 1,300 (89.2%) are family households, while 157 (10.8%) are nonfamily households. The most numerous type of family households are 2-person households, comprising 654, and the most common type of nonfamily households are 1-person households, comprising 133.
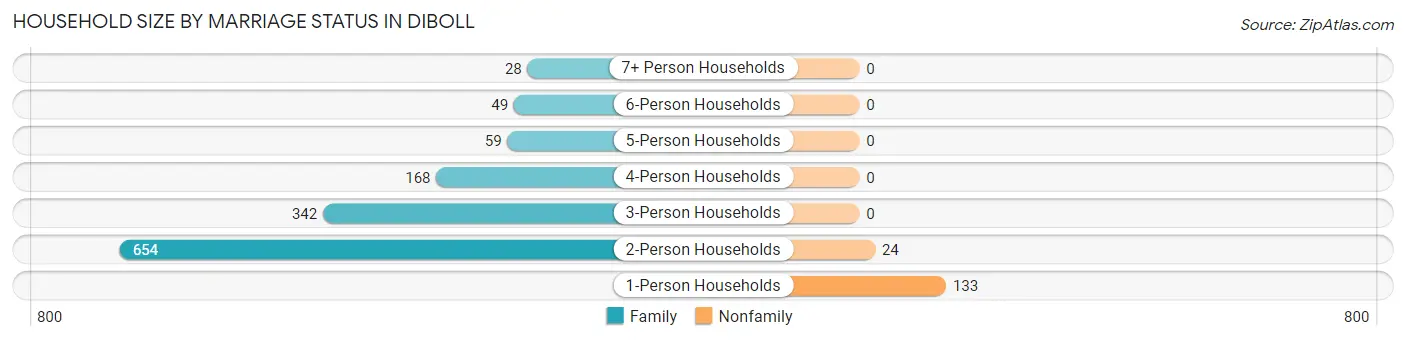
| Household Size | Family Households | Nonfamily Households |
| 1-Person Households | - | 133 (9.1%) |
| 2-Person Households | 654 (44.9%) | 24 (1.7%) |
| 3-Person Households | 342 (23.5%) | 0 (0.0%) |
| 4-Person Households | 168 (11.5%) | 0 (0.0%) |
| 5-Person Households | 59 (4.1%) | 0 (0.0%) |
| 6-Person Households | 49 (3.4%) | 0 (0.0%) |
| 7+ Person Households | 28 (1.9%) | 0 (0.0%) |
| Total | 1,300 (89.2%) | 157 (10.8%) |
Female Fertility in Diboll
Fertility by Age in Diboll
Average fertility rate in Diboll is 49.0 births per 1,000 women. Women in the age bracket of 20 to 34 years have the highest fertility rate with 224.0 births per 1,000 women. Women in the age bracket of 20 to 34 years acount for 100.0% of all women with births.
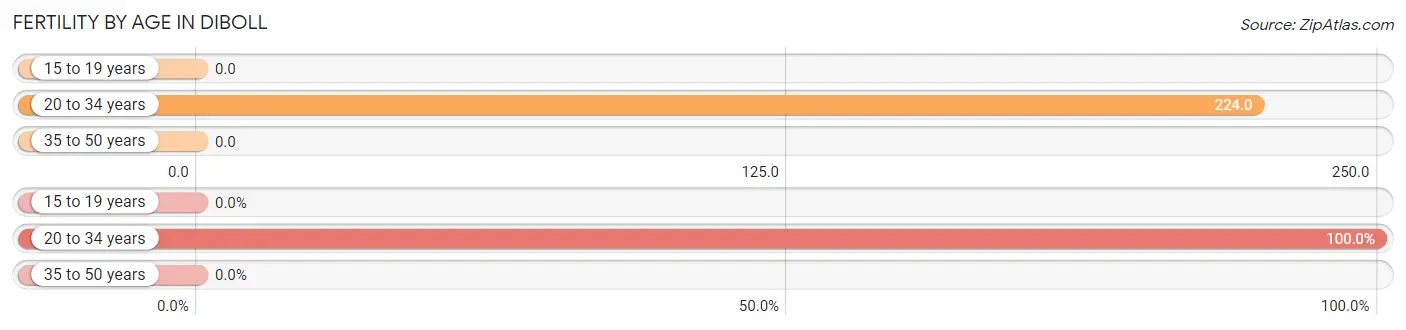
| Age Bracket | Women with Births | Births / 1,000 Women |
| 15 to 19 years | 0 (0.0%) | 0.0 |
| 20 to 34 years | 54 (100.0%) | 224.0 |
| 35 to 50 years | 0 (0.0%) | 0.0 |
| Total | 54 (100.0%) | 49.0 |
Fertility by Age by Marriage Status in Diboll
33.3% of women with births (54) in Diboll are married. The highest percentage of unmarried women with births falls into 20 to 34 years age bracket with 66.7% of them unmarried at the time of birth, while the lowest percentage of unmarried women with births belong to 20 to 34 years age bracket with 66.7% of them unmarried.
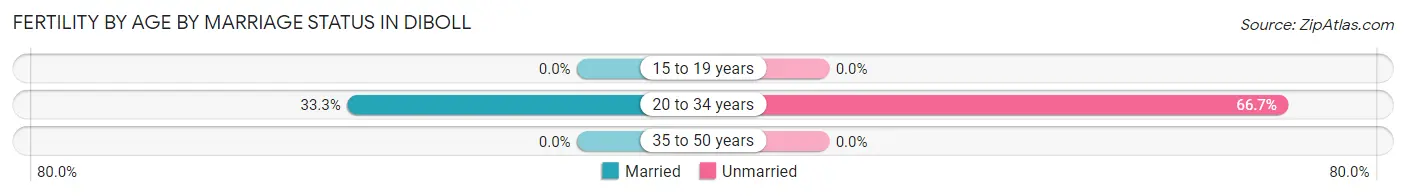
| Age Bracket | Married | Unmarried |
| 15 to 19 years | 0 (0.0%) | 0 (0.0%) |
| 20 to 34 years | 18 (33.3%) | 36 (66.7%) |
| 35 to 50 years | 0 (0.0%) | 0 (0.0%) |
| Total | 18 (33.3%) | 36 (66.7%) |
Fertility by Education in Diboll
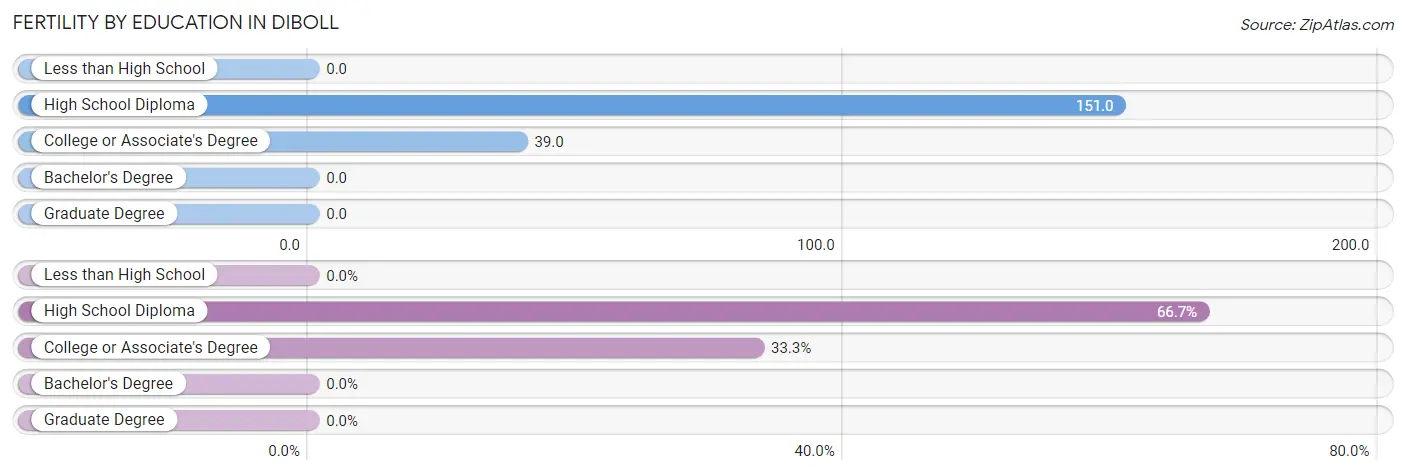
| Educational Attainment | Women with Births | Births / 1,000 Women |
| Less than High School | 0 (0.0%) | 0.0 |
| High School Diploma | 36 (66.7%) | 151.0 |
| College or Associate's Degree | 18 (33.3%) | 39.0 |
| Bachelor's Degree | 0 (0.0%) | 0.0 |
| Graduate Degree | 0 (0.0%) | 0.0 |
| Total | 54 (100.0%) | 49.0 |
Fertility by Education by Marriage Status in Diboll
66.7% of women with births in Diboll are unmarried. Women with the educational attainment of college or associate's degree are most likely to be married with 100.0% of them married at childbirth, while women with the educational attainment of high school diploma are least likely to be married with 100.0% of them unmarried at childbirth.
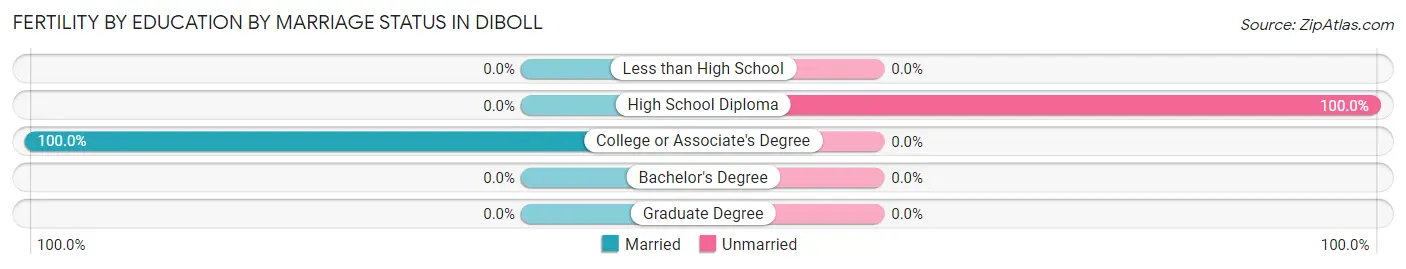
| Educational Attainment | Married | Unmarried |
| Less than High School | 0 (0.0%) | 0 (0.0%) |
| High School Diploma | 0 (0.0%) | 36 (100.0%) |
| College or Associate's Degree | 18 (100.0%) | 0 (0.0%) |
| Bachelor's Degree | 0 (0.0%) | 0 (0.0%) |
| Graduate Degree | 0 (0.0%) | 0 (0.0%) |
| Total | 18 (33.3%) | 36 (66.7%) |
Employment Characteristics in Diboll
Employment by Class of Employer in Diboll
Among the 1,630 employed individuals in Diboll, private company employees (1,062 | 65.1%), federal government employees (169 | 10.4%), and local government employees (139 | 8.5%) make up the most common classes of employment.
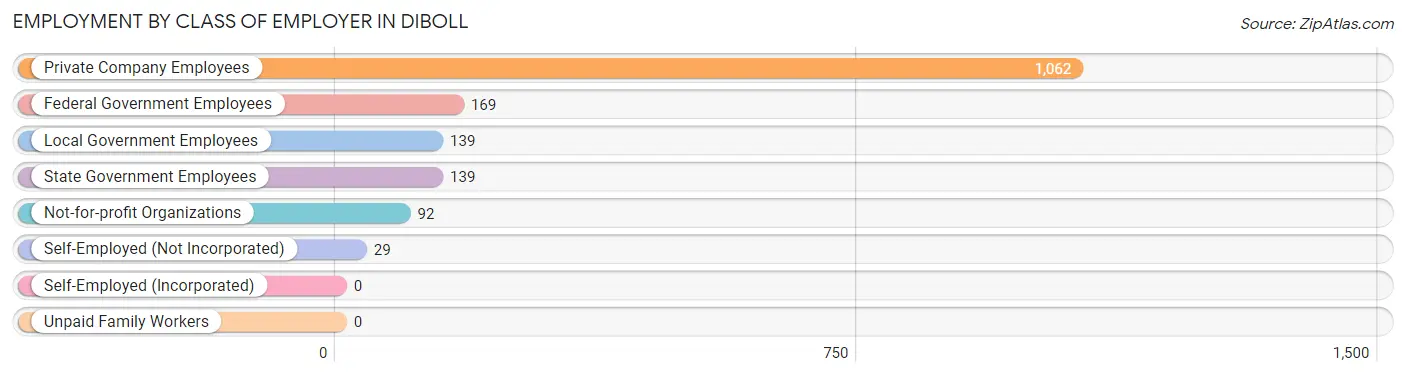
| Employer Class | # Employees | % Employees |
| Private Company Employees | 1,062 | 65.1% |
| Self-Employed (Incorporated) | 0 | 0.0% |
| Self-Employed (Not Incorporated) | 29 | 1.8% |
| Not-for-profit Organizations | 92 | 5.6% |
| Local Government Employees | 139 | 8.5% |
| State Government Employees | 139 | 8.5% |
| Federal Government Employees | 169 | 10.4% |
| Unpaid Family Workers | 0 | 0.0% |
| Total | 1,630 | 100.0% |
Employment Status by Age in Diboll
According to the labor force statistics for Diboll, out of the total population over 16 years of age (3,316), 54.2% or 1,797 individuals are in the labor force, with 6.9% or 124 of them unemployed. The age group with the highest labor force participation rate is 20 to 24 years, with 79.1% or 170 individuals in the labor force. Within the labor force, the 30 to 34 years age range has the highest percentage of unemployed individuals, with 20.7% or 34 of them being unemployed.
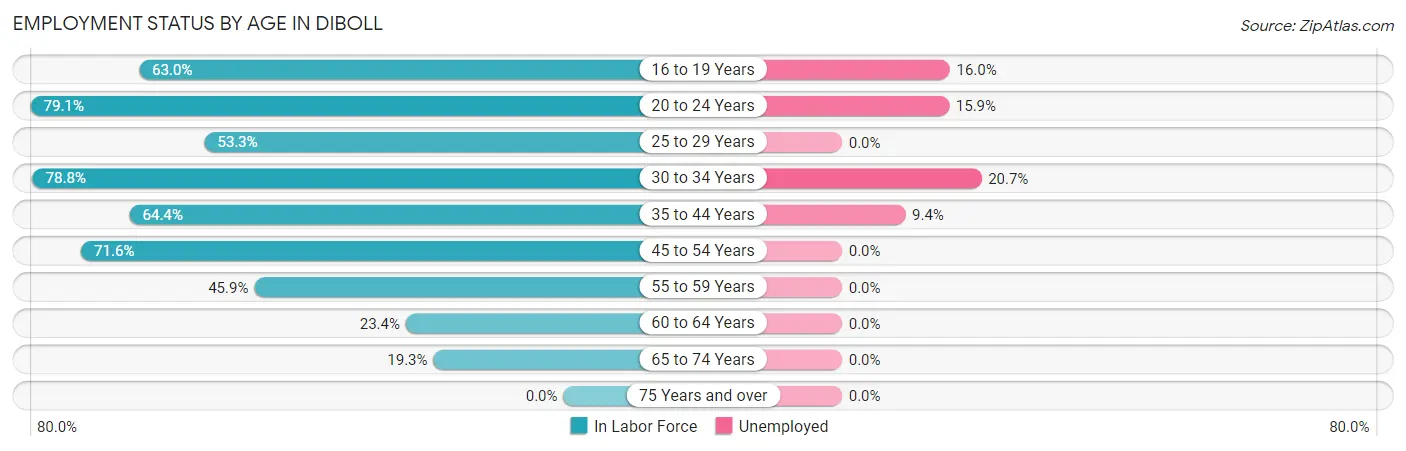
| Age Bracket | In Labor Force | Unemployed |
| 16 to 19 Years | 187 (63.0%) | 30 (16.0%) |
| 20 to 24 Years | 170 (79.1%) | 27 (15.9%) |
| 25 to 29 Years | 88 (53.3%) | 0 (0.0%) |
| 30 to 34 Years | 164 (78.8%) | 34 (20.7%) |
| 35 to 44 Years | 352 (64.4%) | 33 (9.4%) |
| 45 to 54 Years | 533 (71.6%) | 0 (0.0%) |
| 55 to 59 Years | 173 (45.9%) | 0 (0.0%) |
| 60 to 64 Years | 44 (23.4%) | 0 (0.0%) |
| 65 to 74 Years | 85 (19.3%) | 0 (0.0%) |
| 75 Years and over | 0 (0.0%) | 0 (0.0%) |
| Total | 1,797 (54.2%) | 124 (6.9%) |
Employment Status by Educational Attainment in Diboll
According to labor force statistics for Diboll, 60.7% of individuals (1,353) out of the total population between 25 and 64 years of age (2,229) are in the labor force, with 4.9% or 66 of them being unemployed. The group with the highest labor force participation rate are those with the educational attainment of bachelor's degree or higher, with 82.2% or 333 individuals in the labor force. Within the labor force, individuals with high school diploma education have the highest percentage of unemployment, with 8.4% or 33 of them being unemployed.
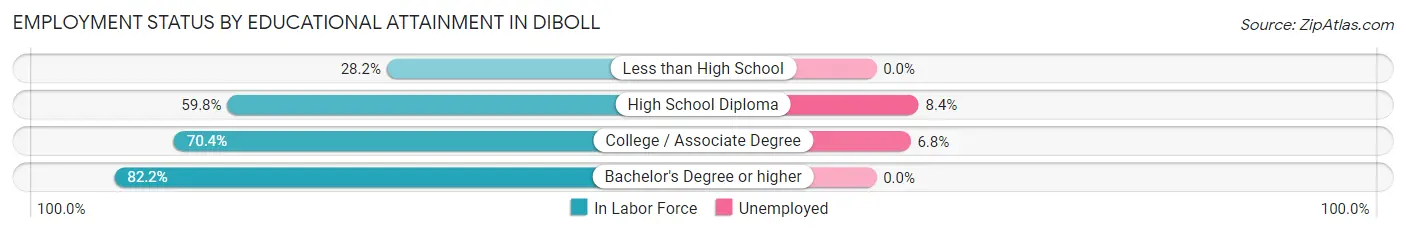
| Educational Attainment | In Labor Force | Unemployed |
| Less than High School | 129 (28.2%) | 0 (0.0%) |
| High School Diploma | 392 (59.8%) | 55 (8.4%) |
| College / Associate Degree | 500 (70.4%) | 48 (6.8%) |
| Bachelor's Degree or higher | 333 (82.2%) | 0 (0.0%) |
| Total | 1,353 (60.7%) | 109 (4.9%) |
Employment Occupations by Sex in Diboll
Management, Business, Science and Arts Occupations
The most common Management, Business, Science and Arts occupations in Diboll are Management (121 | 7.2%), Community & Social Service (115 | 6.9%), Business & Financial (110 | 6.6%), Education Instruction & Library (102 | 6.1%), and Health Diagnosing & Treating (61 | 3.6%).
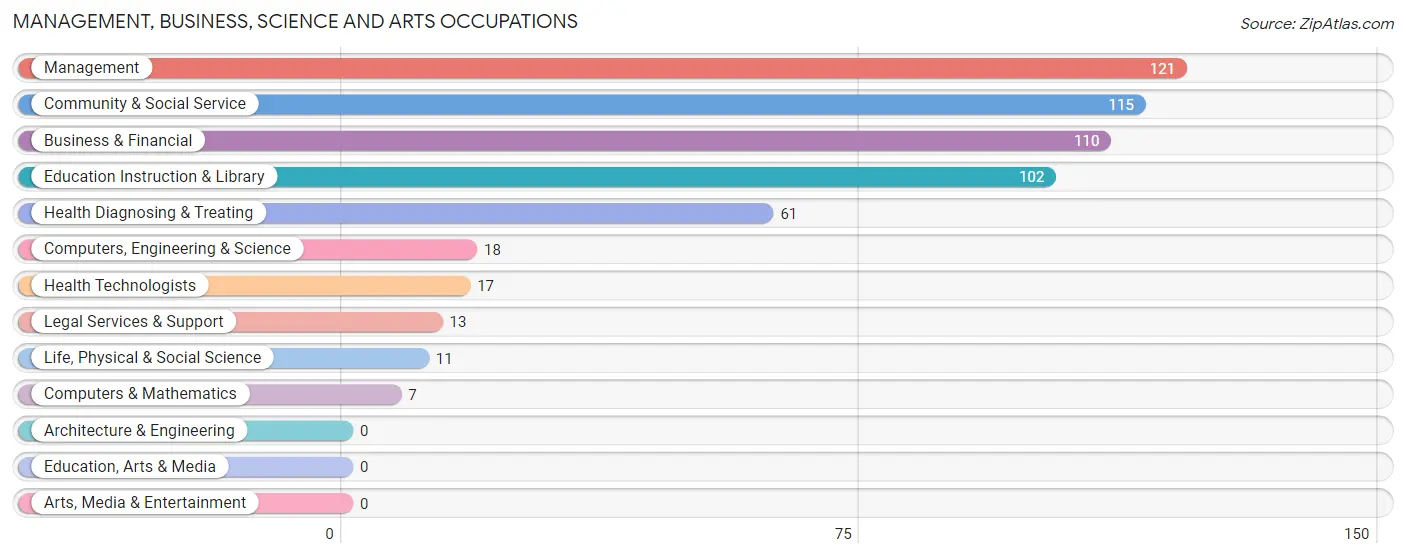
Management, Business, Science and Arts Occupations by Sex
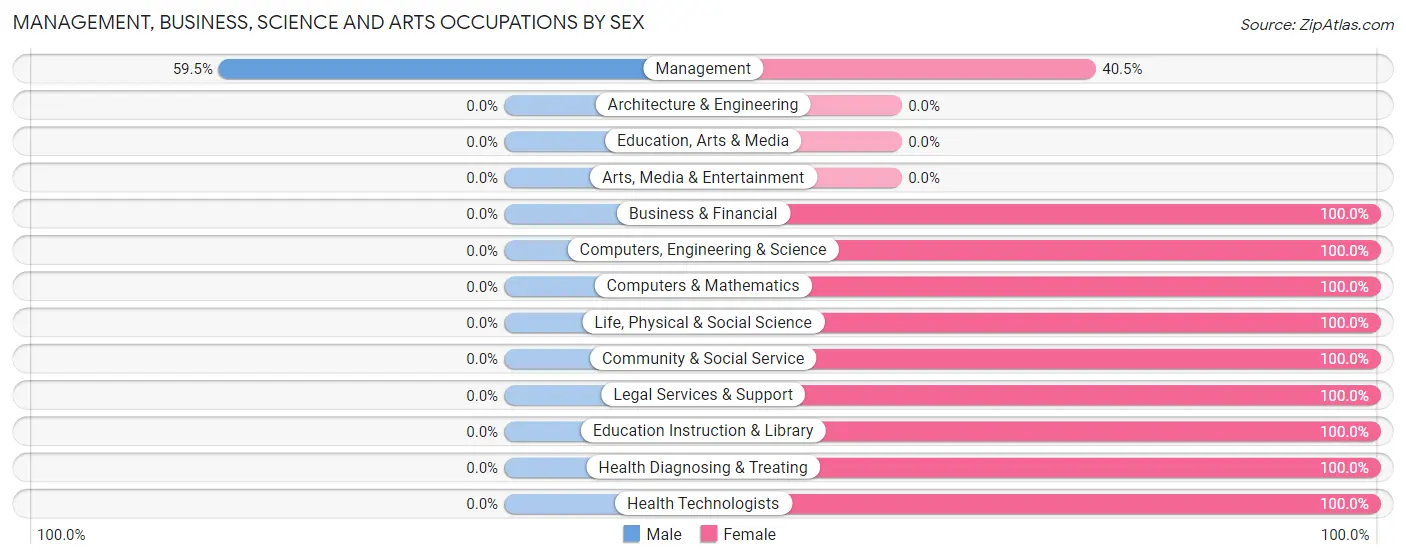
| Occupation | Male | Female |
| Management | 72 (59.5%) | 49 (40.5%) |
| Business & Financial | 0 (0.0%) | 110 (100.0%) |
| Computers, Engineering & Science | 0 (0.0%) | 18 (100.0%) |
| Computers & Mathematics | 0 (0.0%) | 7 (100.0%) |
| Architecture & Engineering | 0 (0.0%) | 0 (0.0%) |
| Life, Physical & Social Science | 0 (0.0%) | 11 (100.0%) |
| Community & Social Service | 0 (0.0%) | 115 (100.0%) |
| Education, Arts & Media | 0 (0.0%) | 0 (0.0%) |
| Legal Services & Support | 0 (0.0%) | 13 (100.0%) |
| Education Instruction & Library | 0 (0.0%) | 102 (100.0%) |
| Arts, Media & Entertainment | 0 (0.0%) | 0 (0.0%) |
| Health Diagnosing & Treating | 0 (0.0%) | 61 (100.0%) |
| Health Technologists | 0 (0.0%) | 17 (100.0%) |
| Total (Category) | 72 (16.9%) | 353 (83.1%) |
| Total (Overall) | 673 (40.3%) | 999 (59.8%) |
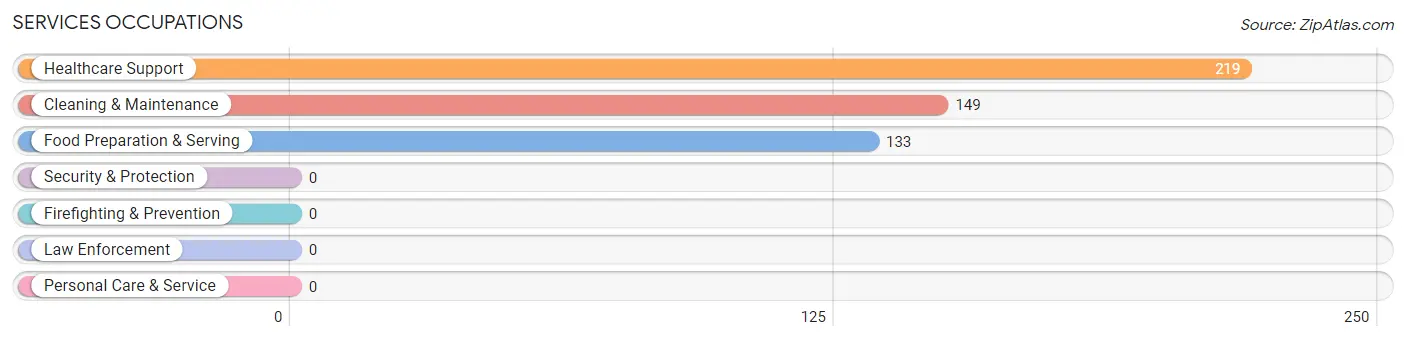
Services Occupations
The most common Services occupations in Diboll are Healthcare Support (219 | 13.1%), Cleaning & Maintenance (149 | 8.9%), and Food Preparation & Serving (133 | 8.0%).
Services Occupations by Sex
Within the Services occupations in Diboll, the most male-oriented occupations are Cleaning & Maintenance (81.2%), and Food Preparation & Serving (78.9%), while the most female-oriented occupations are Healthcare Support (100.0%), Food Preparation & Serving (21.0%), and Cleaning & Maintenance (18.8%).
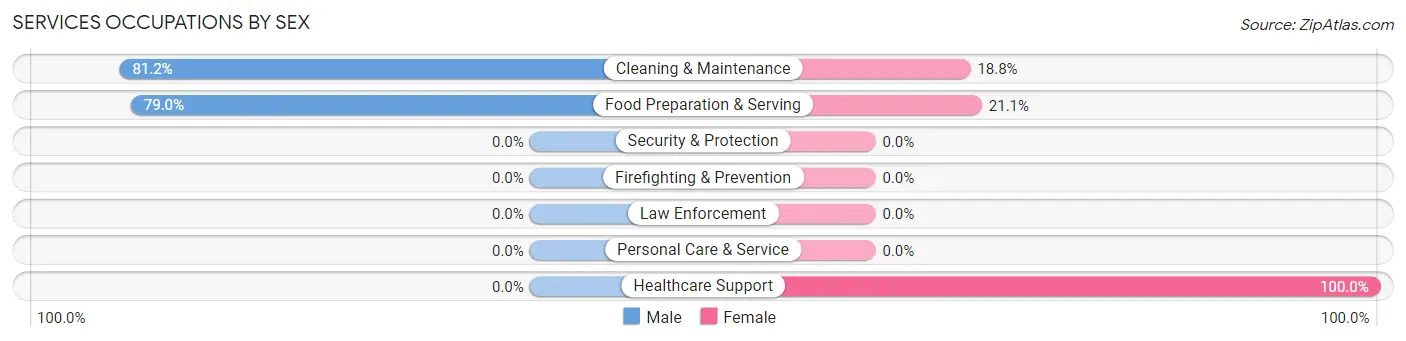
| Occupation | Male | Female |
| Healthcare Support | 0 (0.0%) | 219 (100.0%) |
| Security & Protection | 0 (0.0%) | 0 (0.0%) |
| Firefighting & Prevention | 0 (0.0%) | 0 (0.0%) |
| Law Enforcement | 0 (0.0%) | 0 (0.0%) |
| Food Preparation & Serving | 105 (78.9%) | 28 (21.0%) |
| Cleaning & Maintenance | 121 (81.2%) | 28 (18.8%) |
| Personal Care & Service | 0 (0.0%) | 0 (0.0%) |
| Total (Category) | 226 (45.1%) | 275 (54.9%) |
| Total (Overall) | 673 (40.3%) | 999 (59.8%) |
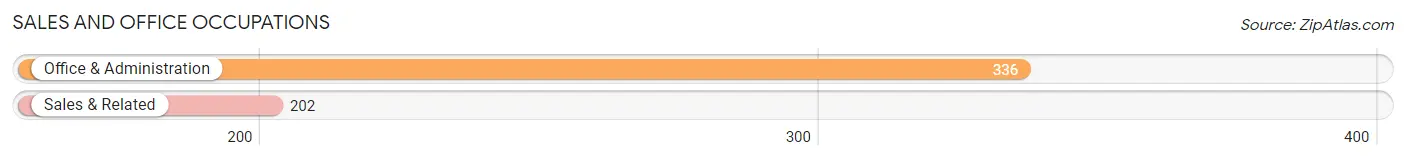
Sales and Office Occupations
The most common Sales and Office occupations in Diboll are Office & Administration (336 | 20.1%), and Sales & Related (202 | 12.1%).
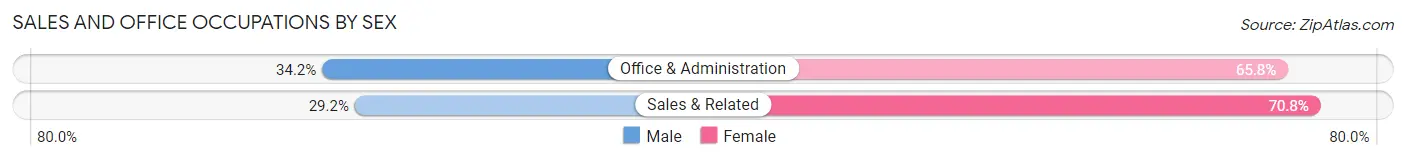
Sales and Office Occupations by Sex
| Occupation | Male | Female |
| Sales & Related | 59 (29.2%) | 143 (70.8%) |
| Office & Administration | 115 (34.2%) | 221 (65.8%) |
| Total (Category) | 174 (32.3%) | 364 (67.7%) |
| Total (Overall) | 673 (40.3%) | 999 (59.8%) |
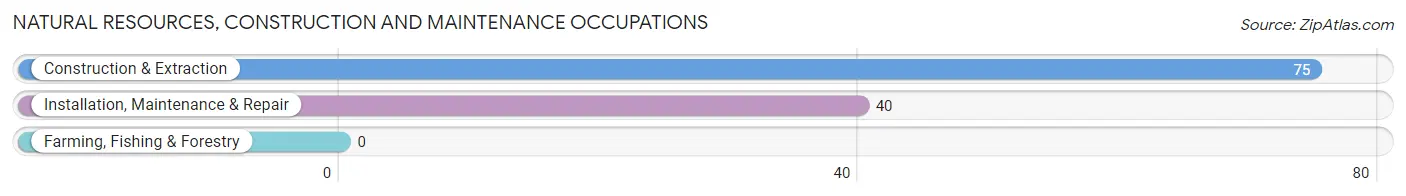
Natural Resources, Construction and Maintenance Occupations
The most common Natural Resources, Construction and Maintenance occupations in Diboll are Construction & Extraction (75 | 4.5%), and Installation, Maintenance & Repair (40 | 2.4%).
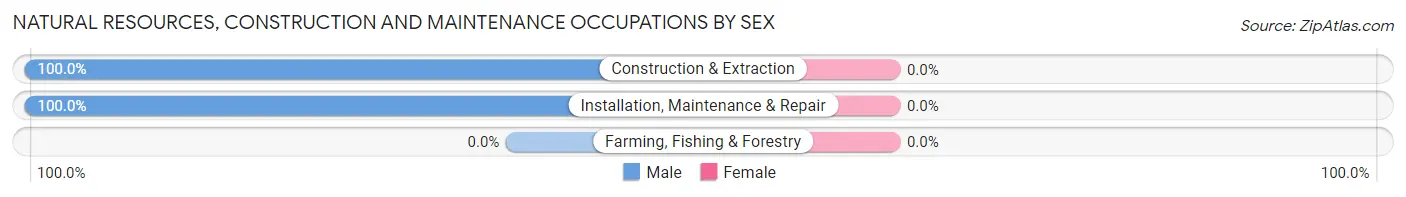
Natural Resources, Construction and Maintenance Occupations by Sex
| Occupation | Male | Female |
| Farming, Fishing & Forestry | 0 (0.0%) | 0 (0.0%) |
| Construction & Extraction | 75 (100.0%) | 0 (0.0%) |
| Installation, Maintenance & Repair | 40 (100.0%) | 0 (0.0%) |
| Total (Category) | 115 (100.0%) | 0 (0.0%) |
| Total (Overall) | 673 (40.3%) | 999 (59.8%) |
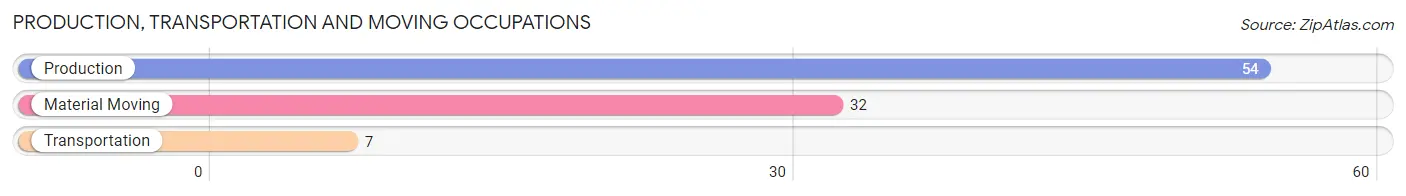
Production, Transportation and Moving Occupations
The most common Production, Transportation and Moving occupations in Diboll are Production (54 | 3.2%), Material Moving (32 | 1.9%), and Transportation (7 | 0.4%).
Production, Transportation and Moving Occupations by Sex
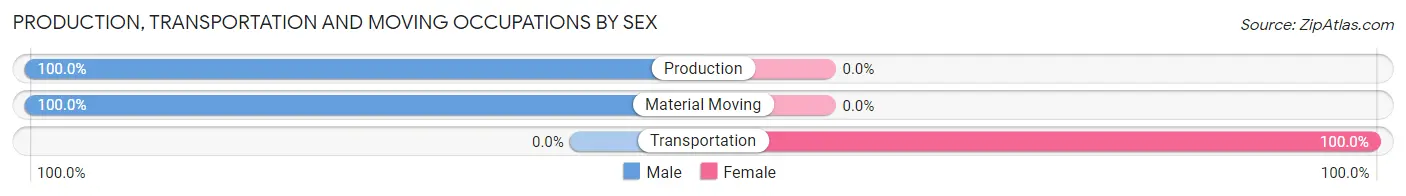
| Occupation | Male | Female |
| Production | 54 (100.0%) | 0 (0.0%) |
| Transportation | 0 (0.0%) | 7 (100.0%) |
| Material Moving | 32 (100.0%) | 0 (0.0%) |
| Total (Category) | 86 (92.5%) | 7 (7.5%) |
| Total (Overall) | 673 (40.3%) | 999 (59.8%) |
Employment Industries by Sex in Diboll
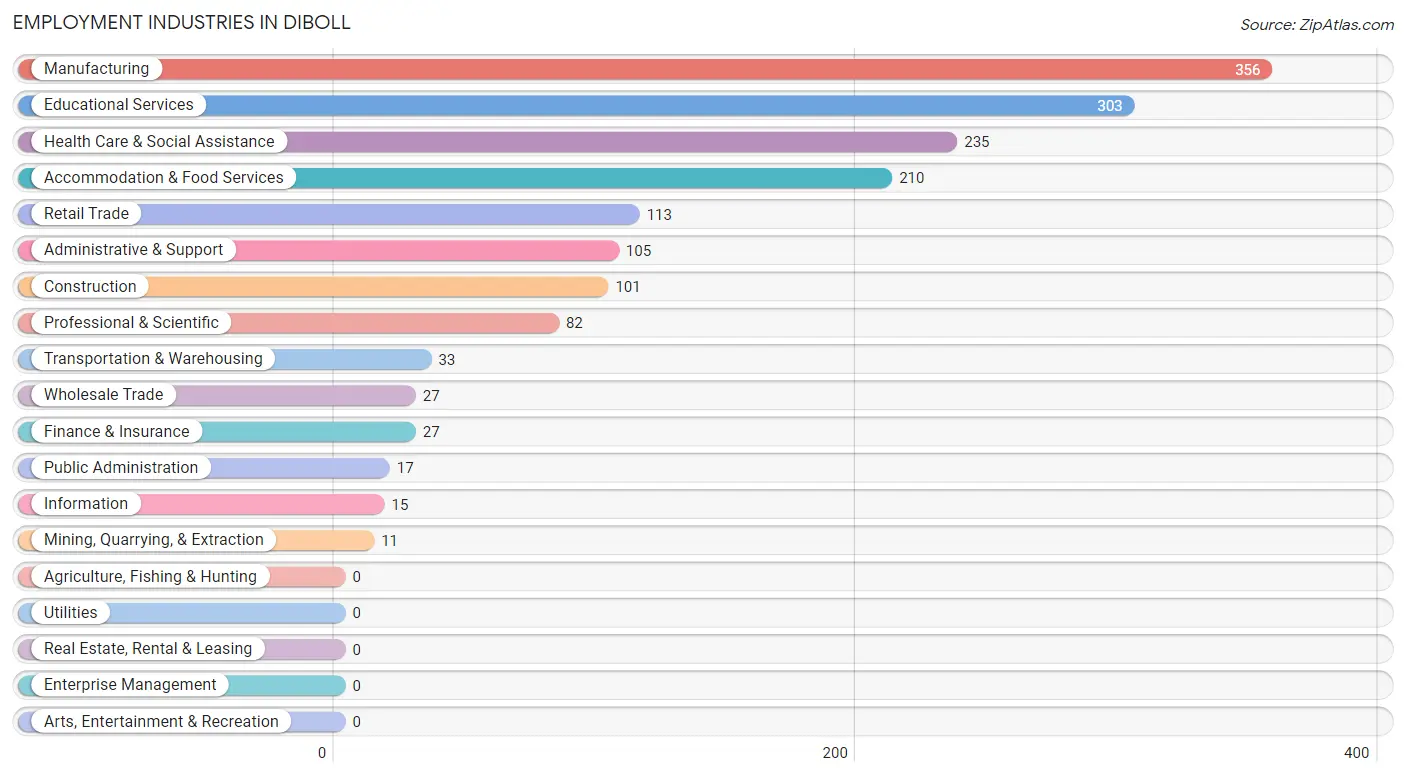
Employment Industries in Diboll
The major employment industries in Diboll include Manufacturing (356 | 21.3%), Educational Services (303 | 18.1%), Health Care & Social Assistance (235 | 14.1%), Accommodation & Food Services (210 | 12.6%), and Retail Trade (113 | 6.8%).
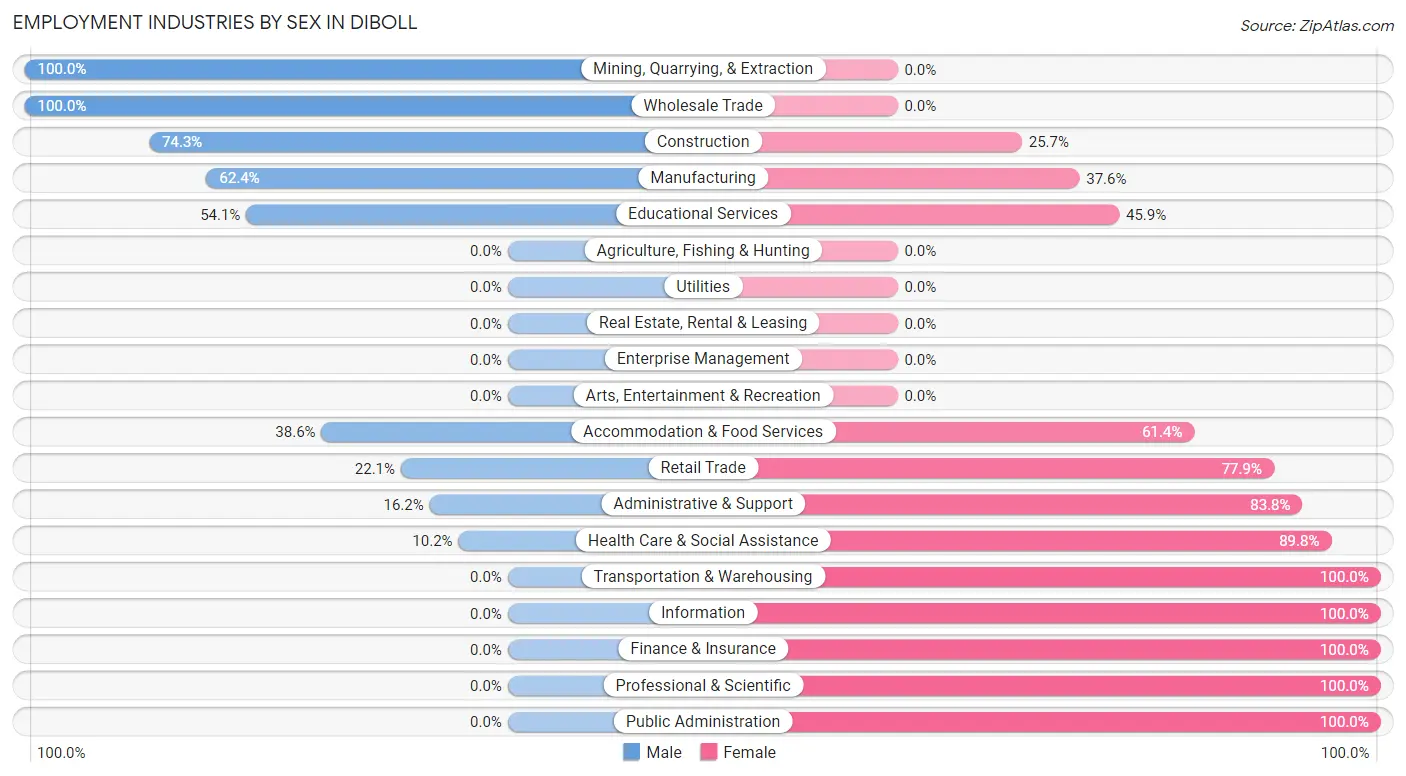
Employment Industries by Sex in Diboll
The Diboll industries that see more men than women are Mining, Quarrying, & Extraction (100.0%), Wholesale Trade (100.0%), and Construction (74.3%), whereas the industries that tend to have a higher number of women are Transportation & Warehousing (100.0%), Information (100.0%), and Finance & Insurance (100.0%).
| Industry | Male | Female |
| Agriculture, Fishing & Hunting | 0 (0.0%) | 0 (0.0%) |
| Mining, Quarrying, & Extraction | 11 (100.0%) | 0 (0.0%) |
| Construction | 75 (74.3%) | 26 (25.7%) |
| Manufacturing | 222 (62.4%) | 134 (37.6%) |
| Wholesale Trade | 27 (100.0%) | 0 (0.0%) |
| Retail Trade | 25 (22.1%) | 88 (77.9%) |
| Transportation & Warehousing | 0 (0.0%) | 33 (100.0%) |
| Utilities | 0 (0.0%) | 0 (0.0%) |
| Information | 0 (0.0%) | 15 (100.0%) |
| Finance & Insurance | 0 (0.0%) | 27 (100.0%) |
| Real Estate, Rental & Leasing | 0 (0.0%) | 0 (0.0%) |
| Professional & Scientific | 0 (0.0%) | 82 (100.0%) |
| Enterprise Management | 0 (0.0%) | 0 (0.0%) |
| Administrative & Support | 17 (16.2%) | 88 (83.8%) |
| Educational Services | 164 (54.1%) | 139 (45.9%) |
| Health Care & Social Assistance | 24 (10.2%) | 211 (89.8%) |
| Arts, Entertainment & Recreation | 0 (0.0%) | 0 (0.0%) |
| Accommodation & Food Services | 81 (38.6%) | 129 (61.4%) |
| Public Administration | 0 (0.0%) | 17 (100.0%) |
| Total | 673 (40.3%) | 999 (59.8%) |
Education in Diboll
School Enrollment in Diboll
The most common levels of schooling among the 1,266 students in Diboll are high school (349 | 27.6%), elementary school (337 | 26.6%), and middle school (285 | 22.5%).
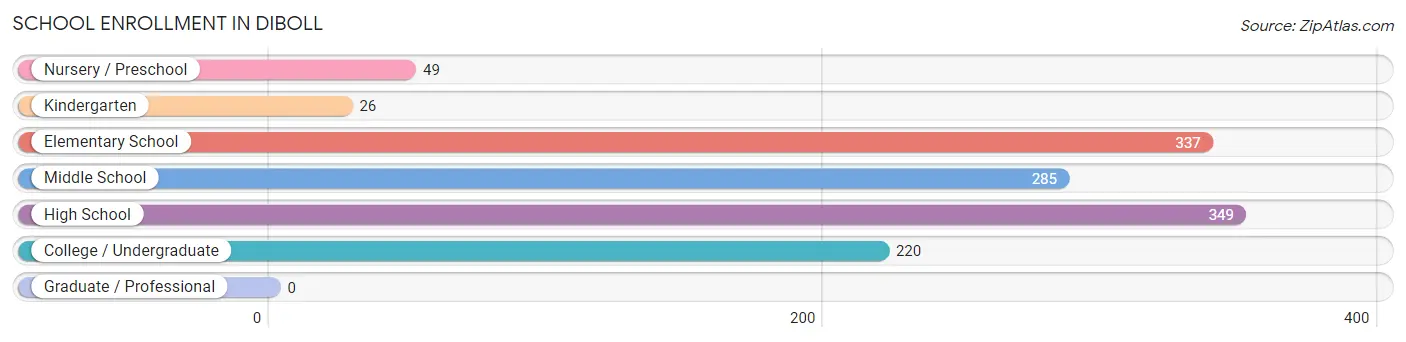
| School Level | # Students | % Students |
| Nursery / Preschool | 49 | 3.9% |
| Kindergarten | 26 | 2.1% |
| Elementary School | 337 | 26.6% |
| Middle School | 285 | 22.5% |
| High School | 349 | 27.6% |
| College / Undergraduate | 220 | 17.4% |
| Graduate / Professional | 0 | 0.0% |
| Total | 1,266 | 100.0% |
School Enrollment by Age by Funding Source in Diboll
Out of a total of 1,266 students who are enrolled in schools in Diboll, 52 (4.1%) attend a private institution, while the remaining 1,214 (95.9%) are enrolled in public schools. The age group of 35 years and over has the highest likelihood of being enrolled in private schools, with 13 (33.3% in the age bracket) enrolled. Conversely, the age group of 3 to 4 year olds has the lowest likelihood of being enrolled in a private school, with 35 (100.0% in the age bracket) attending a public institution.
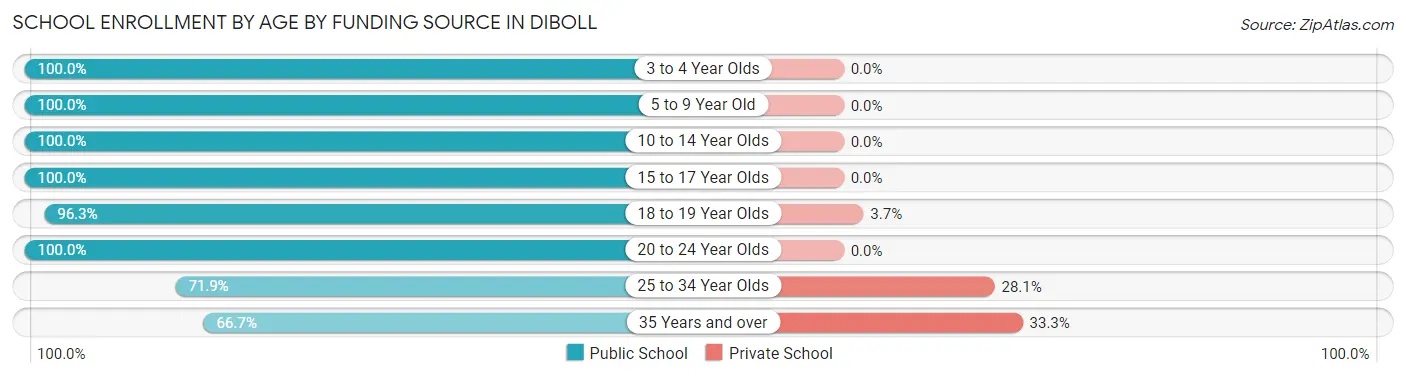
| Age Bracket | Public School | Private School |
| 3 to 4 Year Olds | 35 (100.0%) | 0 (0.0%) |
| 5 to 9 Year Old | 236 (100.0%) | 0 (0.0%) |
| 10 to 14 Year Olds | 471 (100.0%) | 0 (0.0%) |
| 15 to 17 Year Olds | 198 (100.0%) | 0 (0.0%) |
| 18 to 19 Year Olds | 131 (96.3%) | 5 (3.7%) |
| 20 to 24 Year Olds | 30 (100.0%) | 0 (0.0%) |
| 25 to 34 Year Olds | 87 (71.9%) | 34 (28.1%) |
| 35 Years and over | 26 (66.7%) | 13 (33.3%) |
| Total | 1,214 (95.9%) | 52 (4.1%) |
Educational Attainment by Field of Study in Diboll
Business (216 | 45.2%), education (83 | 17.4%), arts & humanities (57 | 11.9%), science & technology (38 | 8.0%), and bio, nature & agricultural (29 | 6.1%) are the most common fields of study among 478 individuals in Diboll who have obtained a bachelor's degree or higher.
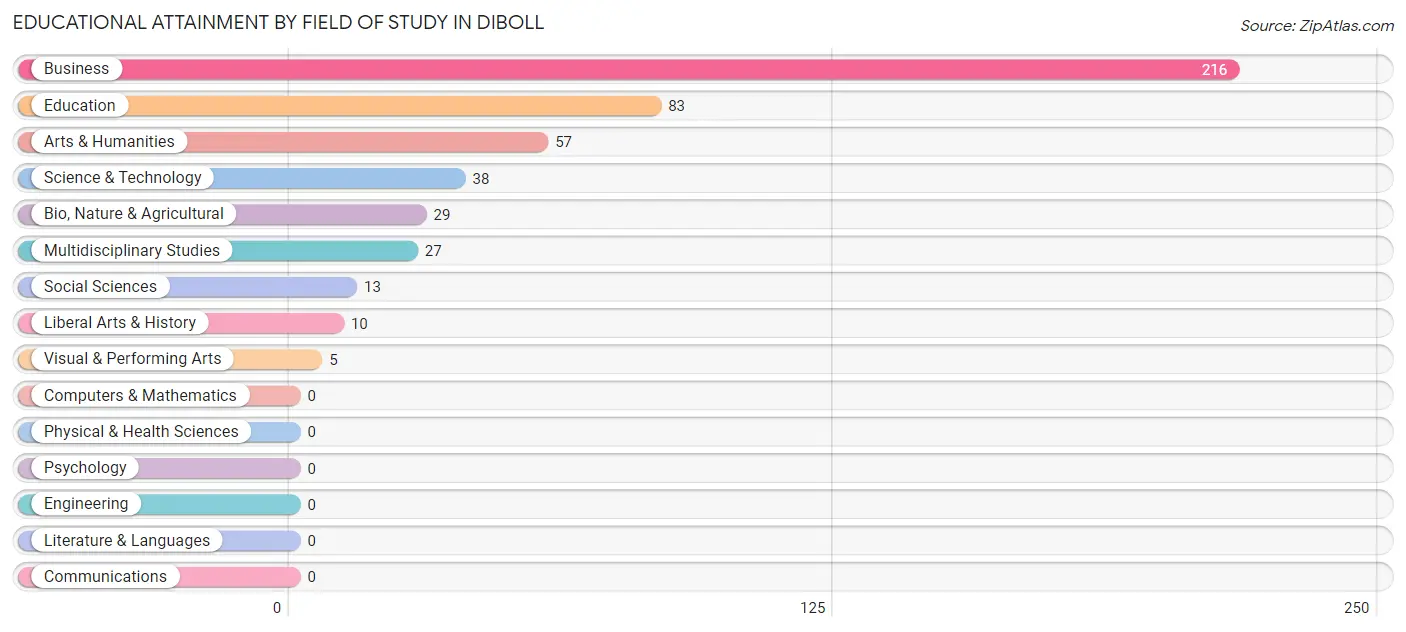
| Field of Study | # Graduates | % Graduates |
| Computers & Mathematics | 0 | 0.0% |
| Bio, Nature & Agricultural | 29 | 6.1% |
| Physical & Health Sciences | 0 | 0.0% |
| Psychology | 0 | 0.0% |
| Social Sciences | 13 | 2.7% |
| Engineering | 0 | 0.0% |
| Multidisciplinary Studies | 27 | 5.7% |
| Science & Technology | 38 | 8.0% |
| Business | 216 | 45.2% |
| Education | 83 | 17.4% |
| Literature & Languages | 0 | 0.0% |
| Liberal Arts & History | 10 | 2.1% |
| Visual & Performing Arts | 5 | 1.1% |
| Communications | 0 | 0.0% |
| Arts & Humanities | 57 | 11.9% |
| Total | 478 | 100.0% |
Transportation & Commute in Diboll
Vehicle Availability by Sex in Diboll
The most prevalent vehicle ownership categories in Diboll are males with 2 vehicles (316, accounting for 49.4%) and females with 2 vehicles (400, making up 31.9%).
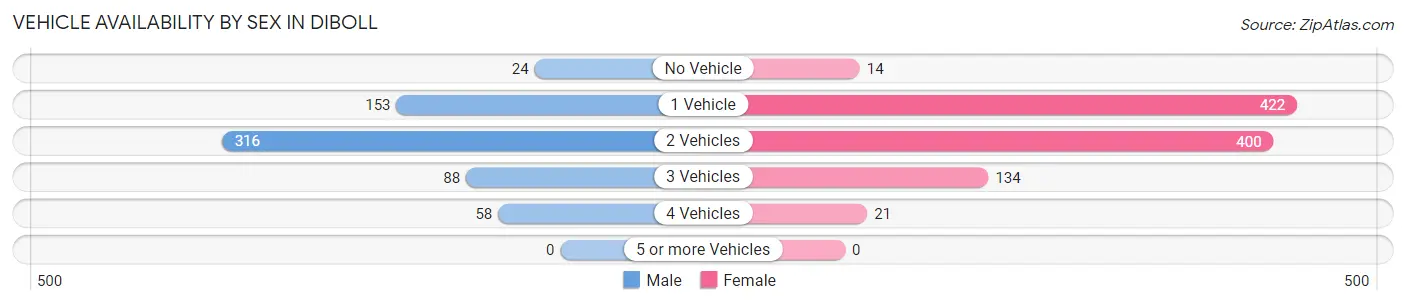
| Vehicles Available | Male | Female |
| No Vehicle | 24 (3.8%) | 14 (1.4%) |
| 1 Vehicle | 153 (23.9%) | 422 (42.6%) |
| 2 Vehicles | 316 (49.4%) | 400 (40.4%) |
| 3 Vehicles | 88 (13.8%) | 134 (13.5%) |
| 4 Vehicles | 58 (9.1%) | 21 (2.1%) |
| 5 or more Vehicles | 0 (0.0%) | 0 (0.0%) |
| Total | 639 (100.0%) | 991 (100.0%) |
Commute Time in Diboll
The most frequently occuring commute durations in Diboll are 10 to 14 minutes (507 commuters, 32.1%), 20 to 24 minutes (300 commuters, 19.0%), and 35 to 39 minutes (180 commuters, 11.4%).
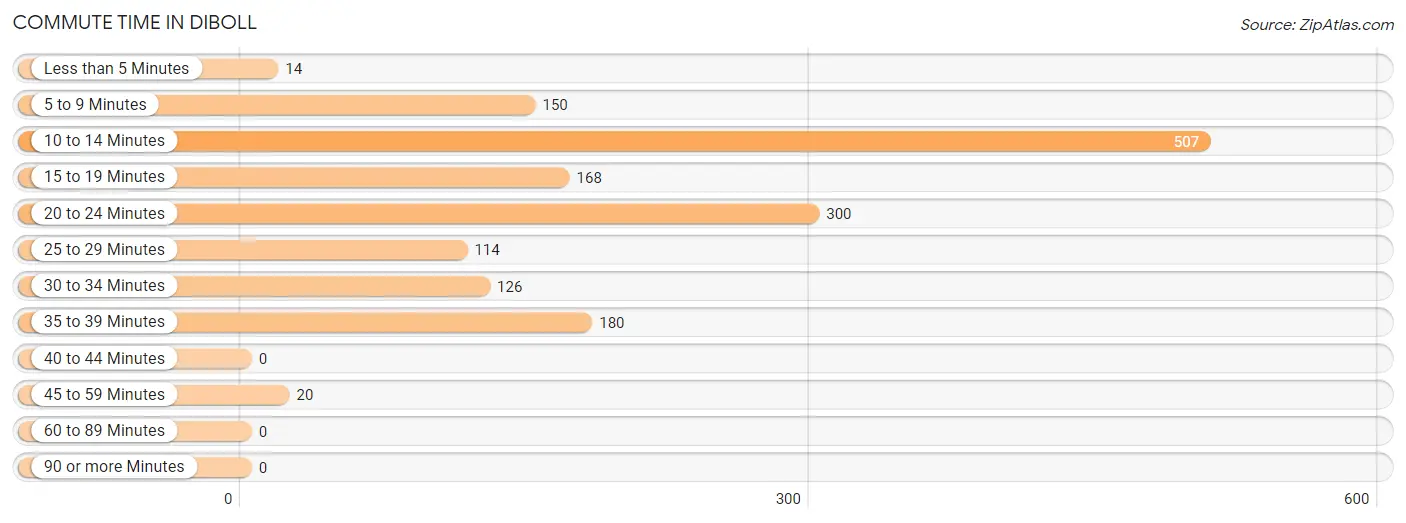
| Commute Time | # Commuters | % Commuters |
| Less than 5 Minutes | 14 | 0.9% |
| 5 to 9 Minutes | 150 | 9.5% |
| 10 to 14 Minutes | 507 | 32.1% |
| 15 to 19 Minutes | 168 | 10.6% |
| 20 to 24 Minutes | 300 | 19.0% |
| 25 to 29 Minutes | 114 | 7.2% |
| 30 to 34 Minutes | 126 | 8.0% |
| 35 to 39 Minutes | 180 | 11.4% |
| 40 to 44 Minutes | 0 | 0.0% |
| 45 to 59 Minutes | 20 | 1.3% |
| 60 to 89 Minutes | 0 | 0.0% |
| 90 or more Minutes | 0 | 0.0% |
Commute Time by Sex in Diboll
The most common commute times in Diboll are 10 to 14 minutes (199 commuters, 31.1%) for males and 10 to 14 minutes (308 commuters, 32.8%) for females.
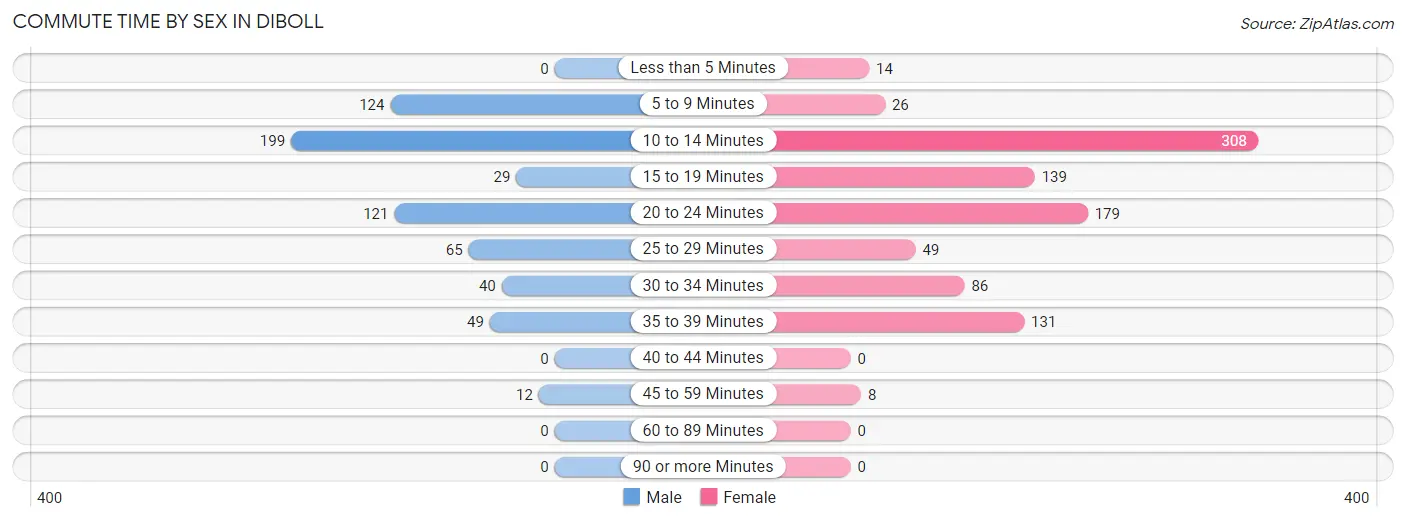
| Commute Time | Male | Female |
| Less than 5 Minutes | 0 (0.0%) | 14 (1.5%) |
| 5 to 9 Minutes | 124 (19.4%) | 26 (2.8%) |
| 10 to 14 Minutes | 199 (31.1%) | 308 (32.8%) |
| 15 to 19 Minutes | 29 (4.5%) | 139 (14.8%) |
| 20 to 24 Minutes | 121 (18.9%) | 179 (19.0%) |
| 25 to 29 Minutes | 65 (10.2%) | 49 (5.2%) |
| 30 to 34 Minutes | 40 (6.3%) | 86 (9.1%) |
| 35 to 39 Minutes | 49 (7.7%) | 131 (13.9%) |
| 40 to 44 Minutes | 0 (0.0%) | 0 (0.0%) |
| 45 to 59 Minutes | 12 (1.9%) | 8 (0.9%) |
| 60 to 89 Minutes | 0 (0.0%) | 0 (0.0%) |
| 90 or more Minutes | 0 (0.0%) | 0 (0.0%) |
Time of Departure to Work by Sex in Diboll
The most frequent times of departure to work in Diboll are 6:30 AM to 6:59 AM (158, 24.7%) for males and 7:30 AM to 7:59 AM (224, 23.8%) for females.
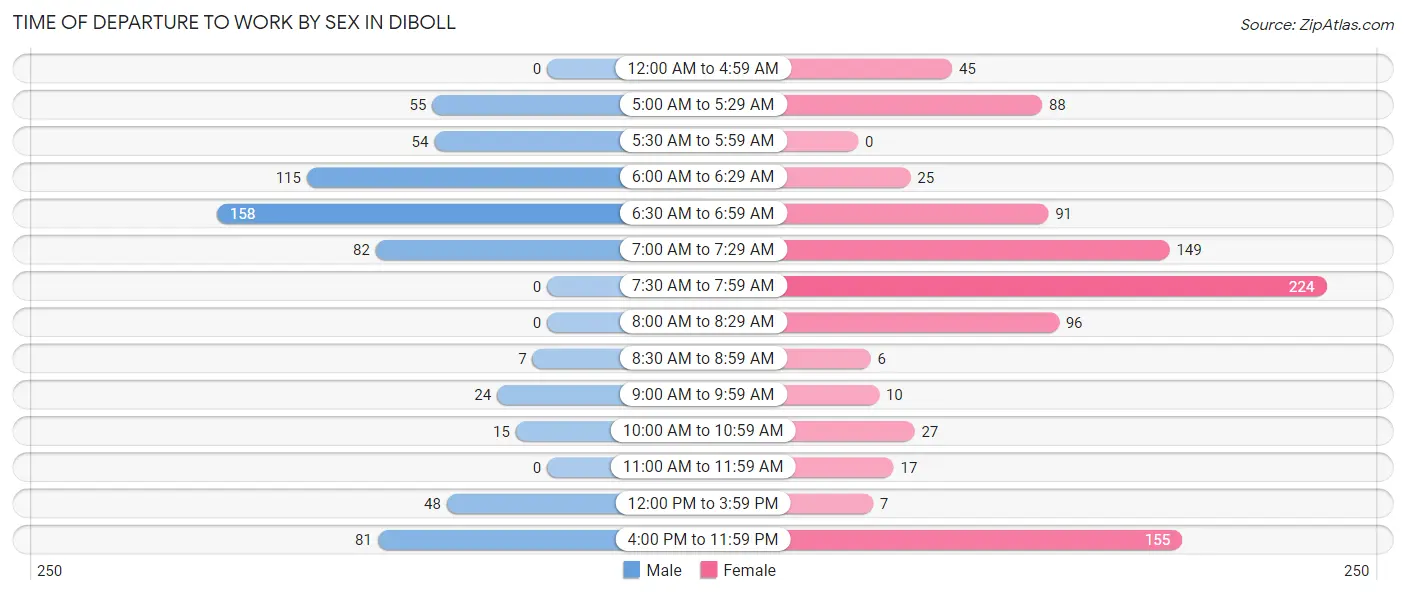
| Time of Departure | Male | Female |
| 12:00 AM to 4:59 AM | 0 (0.0%) | 45 (4.8%) |
| 5:00 AM to 5:29 AM | 55 (8.6%) | 88 (9.4%) |
| 5:30 AM to 5:59 AM | 54 (8.5%) | 0 (0.0%) |
| 6:00 AM to 6:29 AM | 115 (18.0%) | 25 (2.7%) |
| 6:30 AM to 6:59 AM | 158 (24.7%) | 91 (9.7%) |
| 7:00 AM to 7:29 AM | 82 (12.8%) | 149 (15.9%) |
| 7:30 AM to 7:59 AM | 0 (0.0%) | 224 (23.8%) |
| 8:00 AM to 8:29 AM | 0 (0.0%) | 96 (10.2%) |
| 8:30 AM to 8:59 AM | 7 (1.1%) | 6 (0.6%) |
| 9:00 AM to 9:59 AM | 24 (3.8%) | 10 (1.1%) |
| 10:00 AM to 10:59 AM | 15 (2.4%) | 27 (2.9%) |
| 11:00 AM to 11:59 AM | 0 (0.0%) | 17 (1.8%) |
| 12:00 PM to 3:59 PM | 48 (7.5%) | 7 (0.7%) |
| 4:00 PM to 11:59 PM | 81 (12.7%) | 155 (16.5%) |
| Total | 639 (100.0%) | 940 (100.0%) |
Housing Occupancy in Diboll
Occupancy by Ownership in Diboll
Of the total 1,457 dwellings in Diboll, owner-occupied units account for 1,001 (68.7%), while renter-occupied units make up 456 (31.3%).
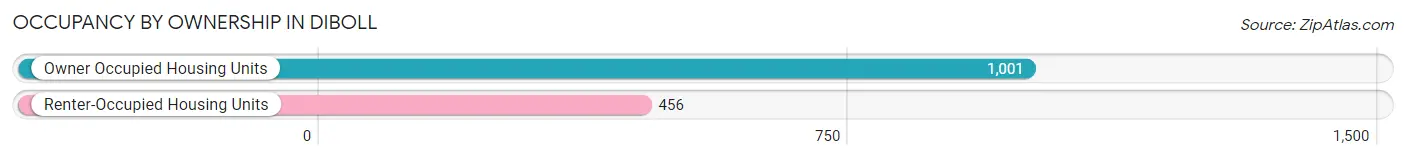
| Occupancy | # Housing Units | % Housing Units |
| Owner Occupied Housing Units | 1,001 | 68.7% |
| Renter-Occupied Housing Units | 456 | 31.3% |
| Total Occupied Housing Units | 1,457 | 100.0% |
Occupancy by Household Size in Diboll
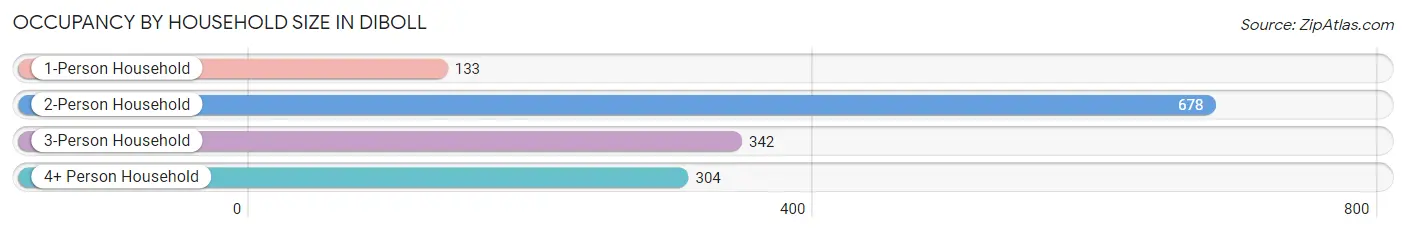
| Household Size | # Housing Units | % Housing Units |
| 1-Person Household | 133 | 9.1% |
| 2-Person Household | 678 | 46.5% |
| 3-Person Household | 342 | 23.5% |
| 4+ Person Household | 304 | 20.9% |
| Total Housing Units | 1,457 | 100.0% |
Occupancy by Ownership by Household Size in Diboll
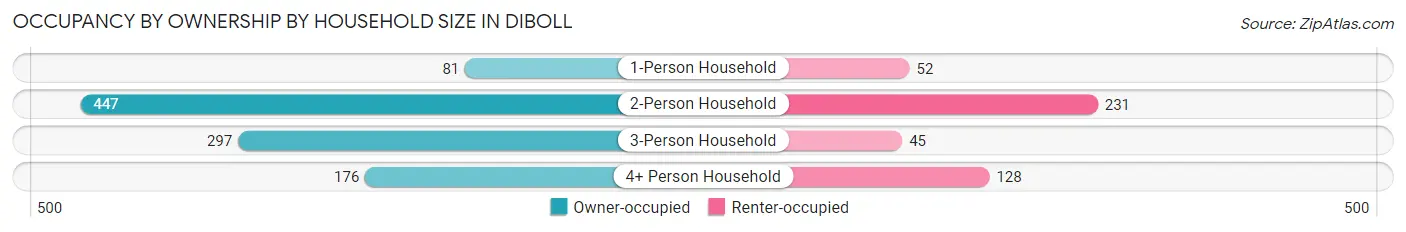
| Household Size | Owner-occupied | Renter-occupied |
| 1-Person Household | 81 (60.9%) | 52 (39.1%) |
| 2-Person Household | 447 (65.9%) | 231 (34.1%) |
| 3-Person Household | 297 (86.8%) | 45 (13.2%) |
| 4+ Person Household | 176 (57.9%) | 128 (42.1%) |
| Total Housing Units | 1,001 (68.7%) | 456 (31.3%) |
Occupancy by Educational Attainment in Diboll
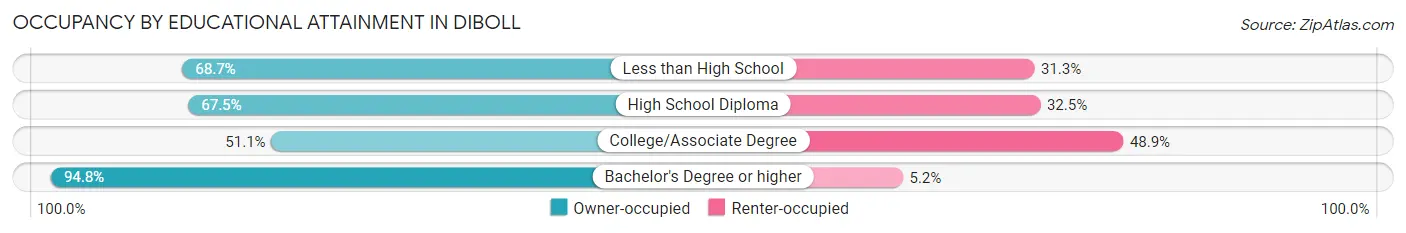
| Household Size | Owner-occupied | Renter-occupied |
| Less than High School | 180 (68.7%) | 82 (31.3%) |
| High School Diploma | 316 (67.5%) | 152 (32.5%) |
| College/Associate Degree | 215 (51.1%) | 206 (48.9%) |
| Bachelor's Degree or higher | 290 (94.8%) | 16 (5.2%) |
Occupancy by Age of Householder in Diboll
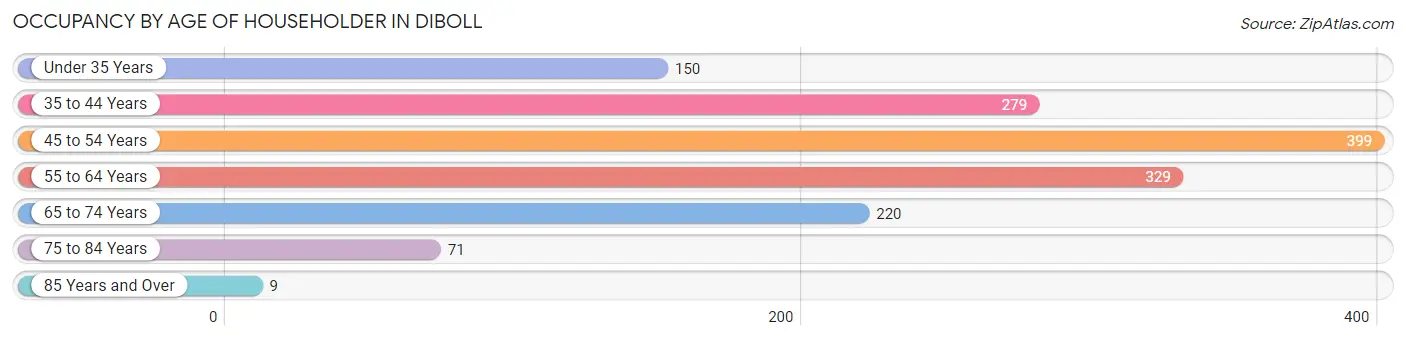
| Age Bracket | # Households | % Households |
| Under 35 Years | 150 | 10.3% |
| 35 to 44 Years | 279 | 19.2% |
| 45 to 54 Years | 399 | 27.4% |
| 55 to 64 Years | 329 | 22.6% |
| 65 to 74 Years | 220 | 15.1% |
| 75 to 84 Years | 71 | 4.9% |
| 85 Years and Over | 9 | 0.6% |
| Total | 1,457 | 100.0% |
Housing Finances in Diboll
Median Income by Occupancy in Diboll
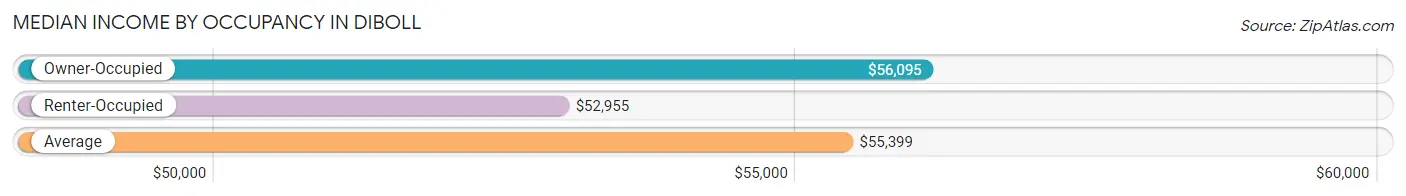
| Occupancy Type | # Households | Median Income |
| Owner-Occupied | 1,001 (68.7%) | $56,095 |
| Renter-Occupied | 456 (31.3%) | $52,955 |
| Average | 1,457 (100.0%) | $55,399 |
Occupancy by Householder Income Bracket in Diboll
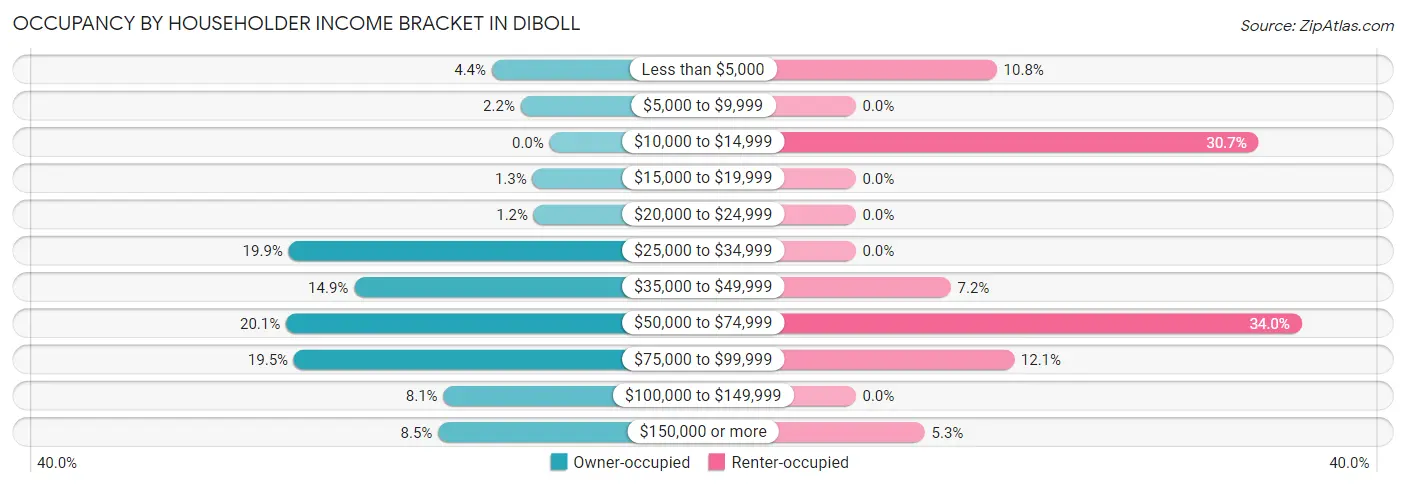
| Income Bracket | Owner-occupied | Renter-occupied |
| Less than $5,000 | 44 (4.4%) | 49 (10.7%) |
| $5,000 to $9,999 | 22 (2.2%) | 0 (0.0%) |
| $10,000 to $14,999 | 0 (0.0%) | 140 (30.7%) |
| $15,000 to $19,999 | 13 (1.3%) | 0 (0.0%) |
| $20,000 to $24,999 | 12 (1.2%) | 0 (0.0%) |
| $25,000 to $34,999 | 199 (19.9%) | 0 (0.0%) |
| $35,000 to $49,999 | 149 (14.9%) | 33 (7.2%) |
| $50,000 to $74,999 | 201 (20.1%) | 155 (34.0%) |
| $75,000 to $99,999 | 195 (19.5%) | 55 (12.1%) |
| $100,000 to $149,999 | 81 (8.1%) | 0 (0.0%) |
| $150,000 or more | 85 (8.5%) | 24 (5.3%) |
| Total | 1,001 (100.0%) | 456 (100.0%) |
Monthly Housing Cost Tiers in Diboll
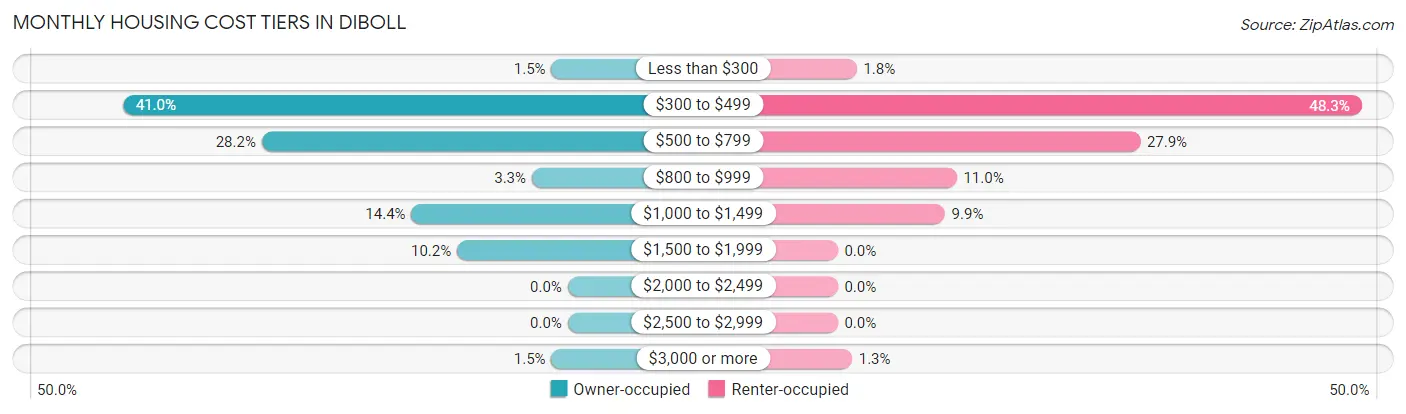
| Monthly Cost | Owner-occupied | Renter-occupied |
| Less than $300 | 15 (1.5%) | 8 (1.8%) |
| $300 to $499 | 410 (41.0%) | 220 (48.2%) |
| $500 to $799 | 282 (28.2%) | 127 (27.9%) |
| $800 to $999 | 33 (3.3%) | 50 (11.0%) |
| $1,000 to $1,499 | 144 (14.4%) | 45 (9.9%) |
| $1,500 to $1,999 | 102 (10.2%) | 0 (0.0%) |
| $2,000 to $2,499 | 0 (0.0%) | 0 (0.0%) |
| $2,500 to $2,999 | 0 (0.0%) | 0 (0.0%) |
| $3,000 or more | 15 (1.5%) | 6 (1.3%) |
| Total | 1,001 (100.0%) | 456 (100.0%) |
Physical Housing Characteristics in Diboll
Housing Structures in Diboll
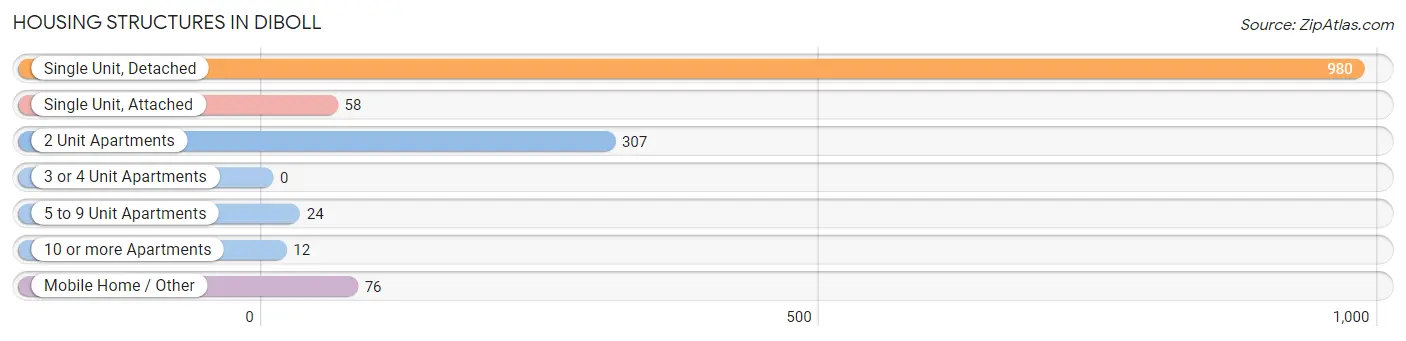
| Structure Type | # Housing Units | % Housing Units |
| Single Unit, Detached | 980 | 67.3% |
| Single Unit, Attached | 58 | 4.0% |
| 2 Unit Apartments | 307 | 21.1% |
| 3 or 4 Unit Apartments | 0 | 0.0% |
| 5 to 9 Unit Apartments | 24 | 1.7% |
| 10 or more Apartments | 12 | 0.8% |
| Mobile Home / Other | 76 | 5.2% |
| Total | 1,457 | 100.0% |
Housing Structures by Occupancy in Diboll
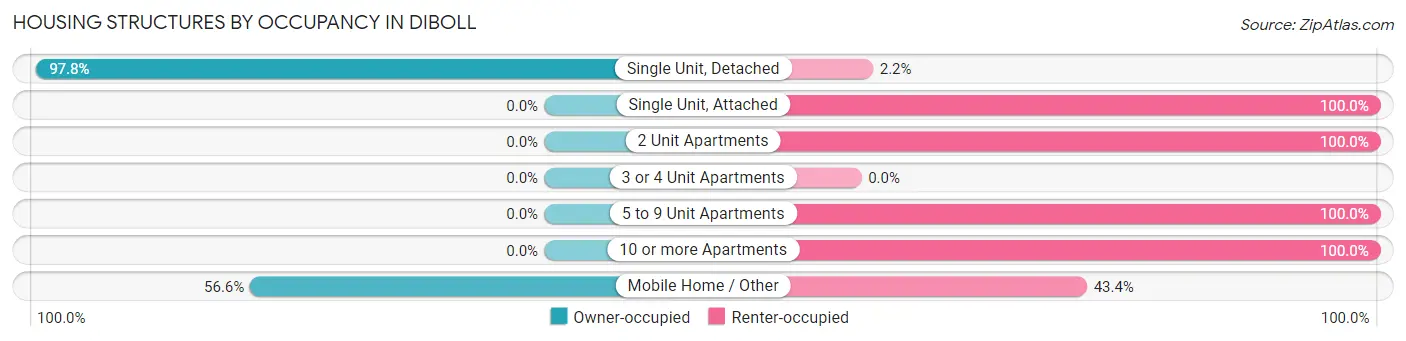
| Structure Type | Owner-occupied | Renter-occupied |
| Single Unit, Detached | 958 (97.8%) | 22 (2.2%) |
| Single Unit, Attached | 0 (0.0%) | 58 (100.0%) |
| 2 Unit Apartments | 0 (0.0%) | 307 (100.0%) |
| 3 or 4 Unit Apartments | 0 (0.0%) | 0 (0.0%) |
| 5 to 9 Unit Apartments | 0 (0.0%) | 24 (100.0%) |
| 10 or more Apartments | 0 (0.0%) | 12 (100.0%) |
| Mobile Home / Other | 43 (56.6%) | 33 (43.4%) |
| Total | 1,001 (68.7%) | 456 (31.3%) |
Housing Structures by Number of Rooms in Diboll
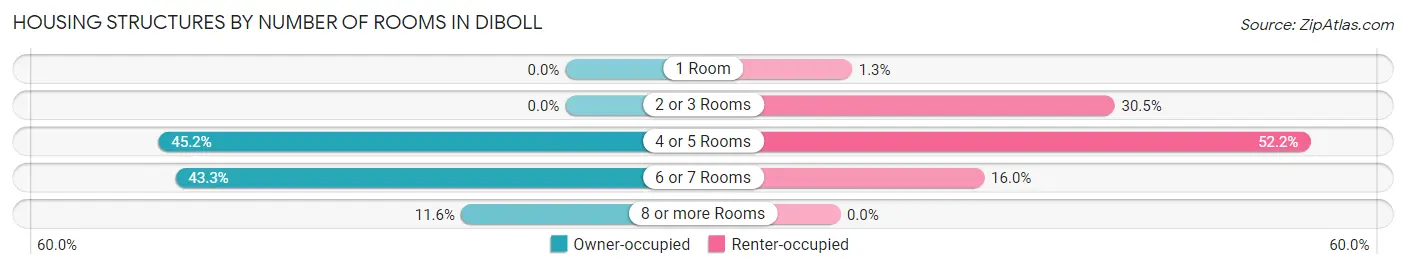
| Number of Rooms | Owner-occupied | Renter-occupied |
| 1 Room | 0 (0.0%) | 6 (1.3%) |
| 2 or 3 Rooms | 0 (0.0%) | 139 (30.5%) |
| 4 or 5 Rooms | 452 (45.2%) | 238 (52.2%) |
| 6 or 7 Rooms | 433 (43.3%) | 73 (16.0%) |
| 8 or more Rooms | 116 (11.6%) | 0 (0.0%) |
| Total | 1,001 (100.0%) | 456 (100.0%) |
Housing Structure by Heating Type in Diboll
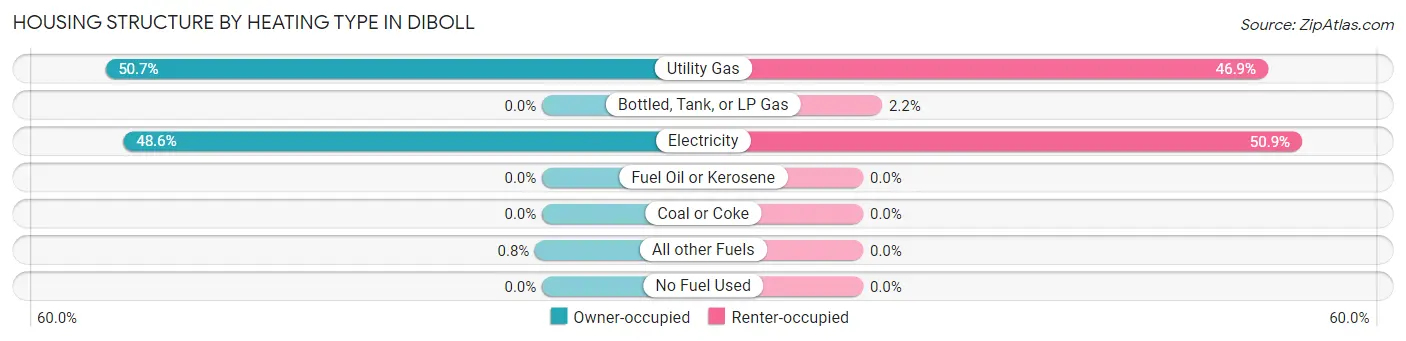
| Heating Type | Owner-occupied | Renter-occupied |
| Utility Gas | 507 (50.6%) | 214 (46.9%) |
| Bottled, Tank, or LP Gas | 0 (0.0%) | 10 (2.2%) |
| Electricity | 486 (48.5%) | 232 (50.9%) |
| Fuel Oil or Kerosene | 0 (0.0%) | 0 (0.0%) |
| Coal or Coke | 0 (0.0%) | 0 (0.0%) |
| All other Fuels | 8 (0.8%) | 0 (0.0%) |
| No Fuel Used | 0 (0.0%) | 0 (0.0%) |
| Total | 1,001 (100.0%) | 456 (100.0%) |
Household Vehicle Usage in Diboll
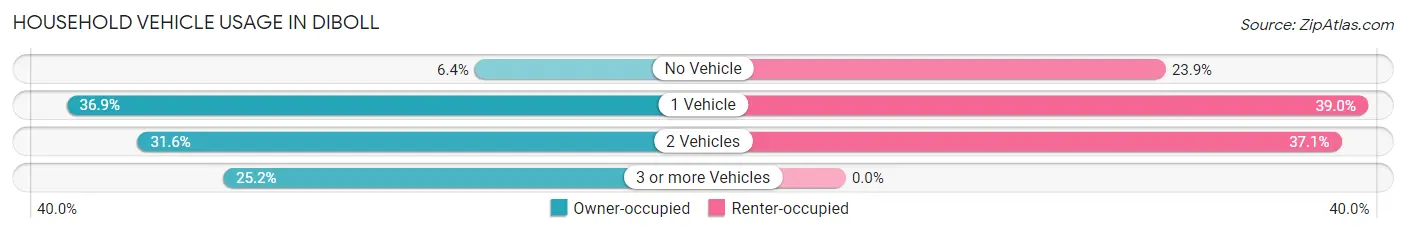
| Vehicles per Household | Owner-occupied | Renter-occupied |
| No Vehicle | 64 (6.4%) | 109 (23.9%) |
| 1 Vehicle | 369 (36.9%) | 178 (39.0%) |
| 2 Vehicles | 316 (31.6%) | 169 (37.1%) |
| 3 or more Vehicles | 252 (25.2%) | 0 (0.0%) |
| Total | 1,001 (100.0%) | 456 (100.0%) |
Real Estate & Mortgages in Diboll
Real Estate and Mortgage Overview in Diboll
| Characteristic | Without Mortgage | With Mortgage |
| Housing Units | 667 | 334 |
| Median Property Value | $73,600 | $183,000 |
| Median Household Income | $55,261 | $35 |
| Monthly Housing Costs | $460 | $15 |
| Real Estate Taxes | $917 | $7 |
Property Value by Mortgage Status in Diboll
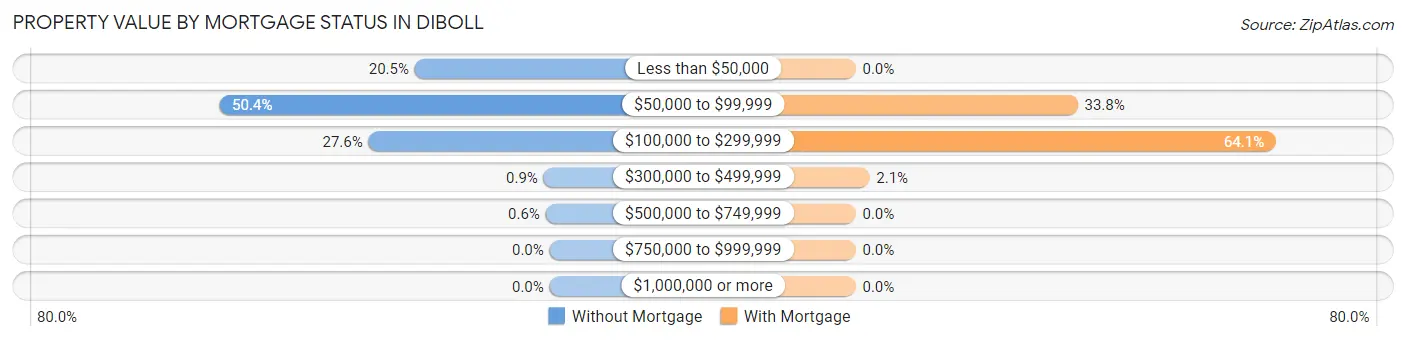
| Property Value | Without Mortgage | With Mortgage |
| Less than $50,000 | 137 (20.5%) | 0 (0.0%) |
| $50,000 to $99,999 | 336 (50.4%) | 113 (33.8%) |
| $100,000 to $299,999 | 184 (27.6%) | 214 (64.1%) |
| $300,000 to $499,999 | 6 (0.9%) | 7 (2.1%) |
| $500,000 to $749,999 | 4 (0.6%) | 0 (0.0%) |
| $750,000 to $999,999 | 0 (0.0%) | 0 (0.0%) |
| $1,000,000 or more | 0 (0.0%) | 0 (0.0%) |
| Total | 667 (100.0%) | 334 (100.0%) |
Household Income by Mortgage Status in Diboll
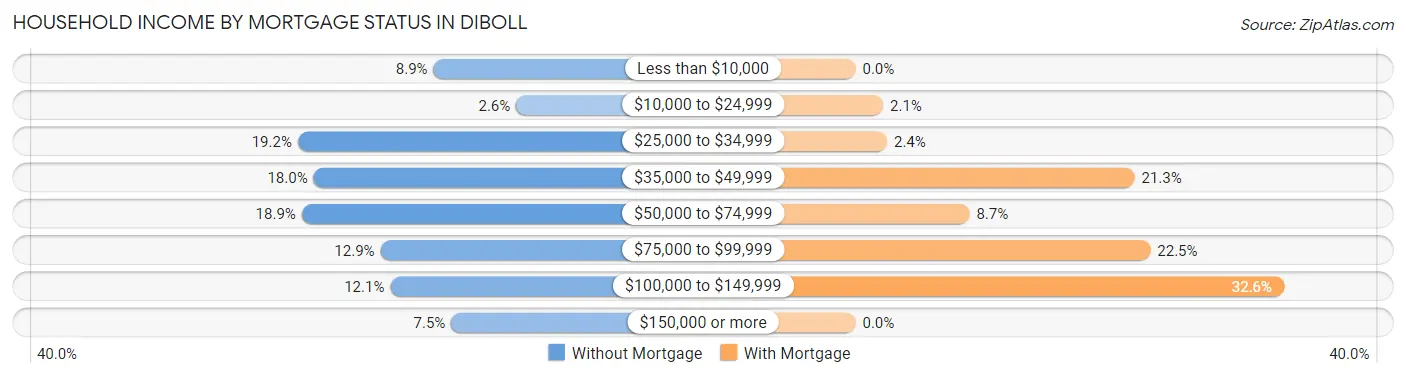
| Household Income | Without Mortgage | With Mortgage |
| Less than $10,000 | 59 (8.8%) | 0 (0.0%) |
| $10,000 to $24,999 | 17 (2.5%) | 7 (2.1%) |
| $25,000 to $34,999 | 128 (19.2%) | 8 (2.4%) |
| $35,000 to $49,999 | 120 (18.0%) | 71 (21.3%) |
| $50,000 to $74,999 | 126 (18.9%) | 29 (8.7%) |
| $75,000 to $99,999 | 86 (12.9%) | 75 (22.5%) |
| $100,000 to $149,999 | 81 (12.1%) | 109 (32.6%) |
| $150,000 or more | 50 (7.5%) | 0 (0.0%) |
| Total | 667 (100.0%) | 334 (100.0%) |
Property Value to Household Income Ratio in Diboll
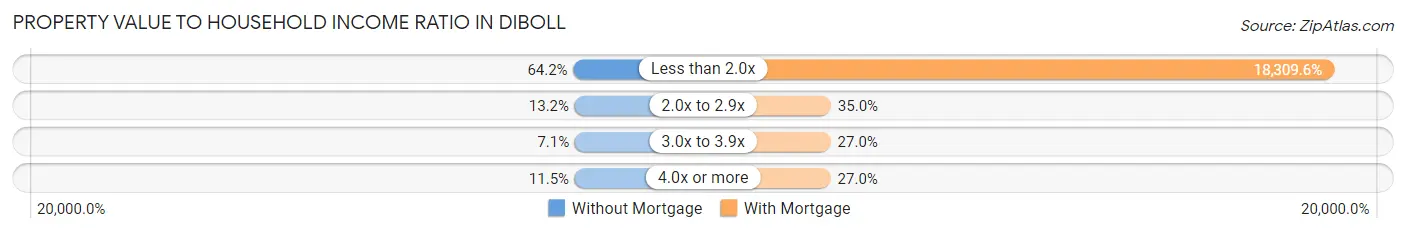
| Value-to-Income Ratio | Without Mortgage | With Mortgage |
| Less than 2.0x | 428 (64.2%) | 61,154 (18,309.6%) |
| 2.0x to 2.9x | 88 (13.2%) | 117 (35.0%) |
| 3.0x to 3.9x | 47 (7.0%) | 90 (27.0%) |
| 4.0x or more | 77 (11.5%) | 90 (27.0%) |
| Total | 667 (100.0%) | 334 (100.0%) |
Real Estate Taxes by Mortgage Status in Diboll
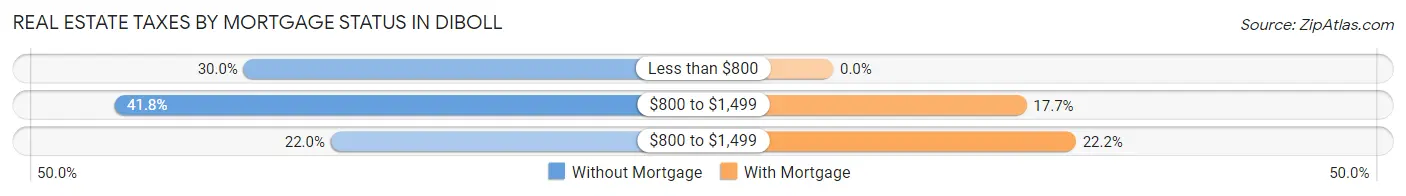
| Property Taxes | Without Mortgage | With Mortgage |
| Less than $800 | 200 (30.0%) | 0 (0.0%) |
| $800 to $1,499 | 279 (41.8%) | 59 (17.7%) |
| $800 to $1,499 | 147 (22.0%) | 74 (22.2%) |
| Total | 667 (100.0%) | 334 (100.0%) |
Health & Disability in Diboll
Health Insurance Coverage by Age in Diboll
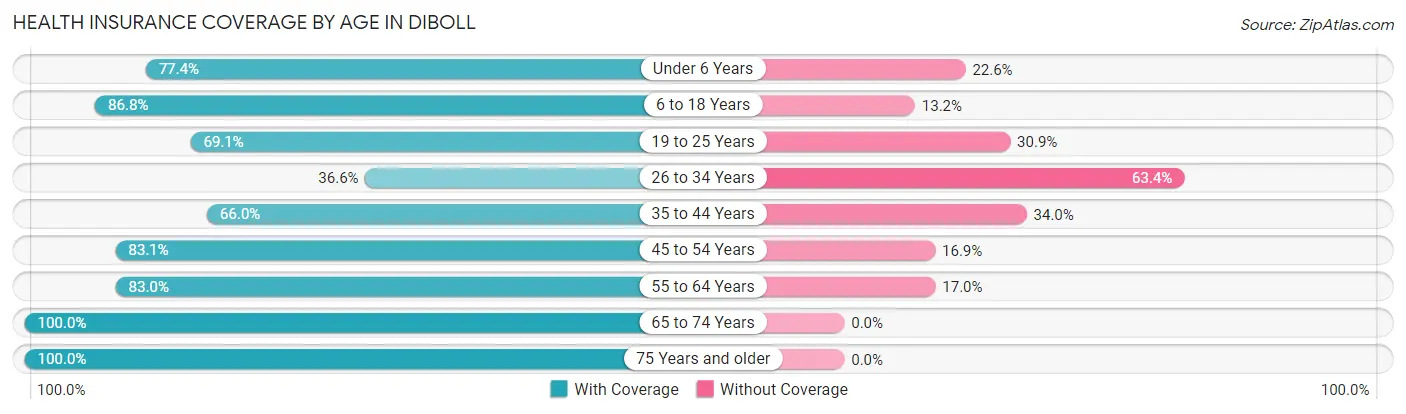
| Age Bracket | With Coverage | Without Coverage |
| Under 6 Years | 281 (77.4%) | 82 (22.6%) |
| 6 to 18 Years | 917 (86.8%) | 139 (13.2%) |
| 19 to 25 Years | 230 (69.1%) | 103 (30.9%) |
| 26 to 34 Years | 100 (36.6%) | 173 (63.4%) |
| 35 to 44 Years | 328 (66.0%) | 169 (34.0%) |
| 45 to 54 Years | 569 (83.1%) | 116 (16.9%) |
| 55 to 64 Years | 396 (83.0%) | 81 (17.0%) |
| 65 to 74 Years | 320 (100.0%) | 0 (0.0%) |
| 75 Years and older | 99 (100.0%) | 0 (0.0%) |
| Total | 3,240 (79.0%) | 863 (21.0%) |
Health Insurance Coverage by Citizenship Status in Diboll
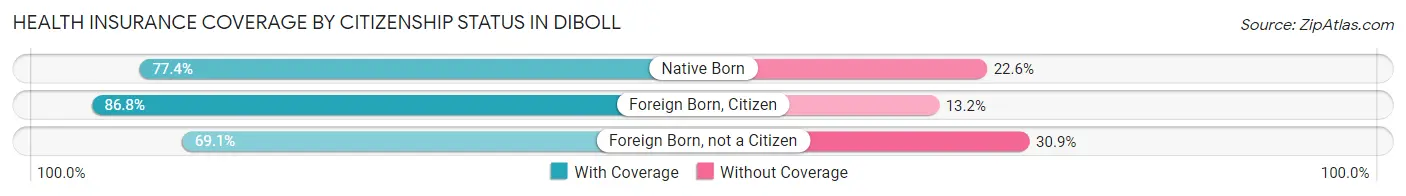
| Citizenship Status | With Coverage | Without Coverage |
| Native Born | 281 (77.4%) | 82 (22.6%) |
| Foreign Born, Citizen | 917 (86.8%) | 139 (13.2%) |
| Foreign Born, not a Citizen | 230 (69.1%) | 103 (30.9%) |
Health Insurance Coverage by Household Income in Diboll
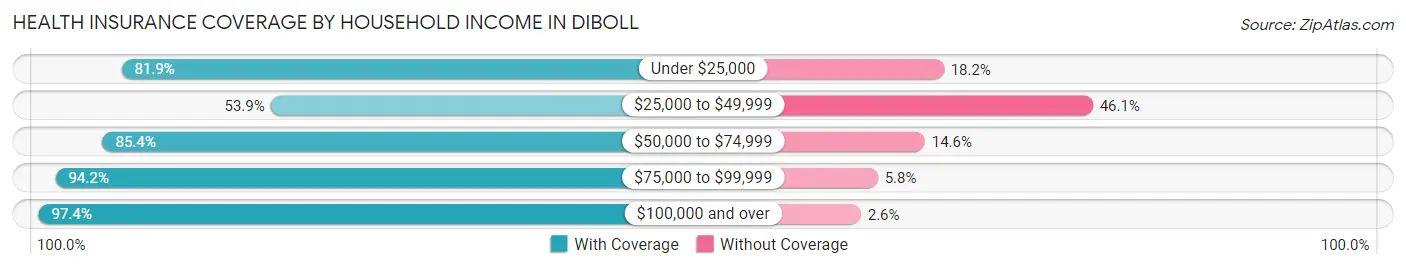
| Household Income | With Coverage | Without Coverage |
| Under $25,000 | 654 (81.9%) | 145 (18.1%) |
| $25,000 to $49,999 | 618 (53.9%) | 528 (46.1%) |
| $50,000 to $74,999 | 801 (85.4%) | 137 (14.6%) |
| $75,000 to $99,999 | 635 (94.2%) | 39 (5.8%) |
| $100,000 and over | 521 (97.4%) | 14 (2.6%) |
Public vs Private Health Insurance Coverage by Age in Diboll
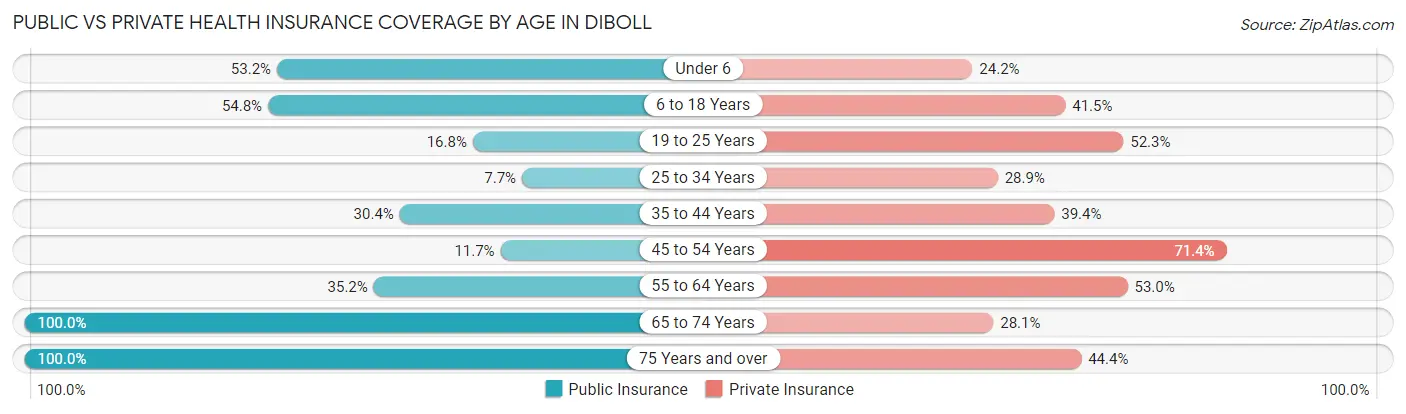
| Age Bracket | Public Insurance | Private Insurance |
| Under 6 | 193 (53.2%) | 88 (24.2%) |
| 6 to 18 Years | 579 (54.8%) | 438 (41.5%) |
| 19 to 25 Years | 56 (16.8%) | 174 (52.2%) |
| 25 to 34 Years | 21 (7.7%) | 79 (28.9%) |
| 35 to 44 Years | 151 (30.4%) | 196 (39.4%) |
| 45 to 54 Years | 80 (11.7%) | 489 (71.4%) |
| 55 to 64 Years | 168 (35.2%) | 253 (53.0%) |
| 65 to 74 Years | 320 (100.0%) | 90 (28.1%) |
| 75 Years and over | 99 (100.0%) | 44 (44.4%) |
| Total | 1,667 (40.6%) | 1,851 (45.1%) |
Disability Status by Sex by Age in Diboll
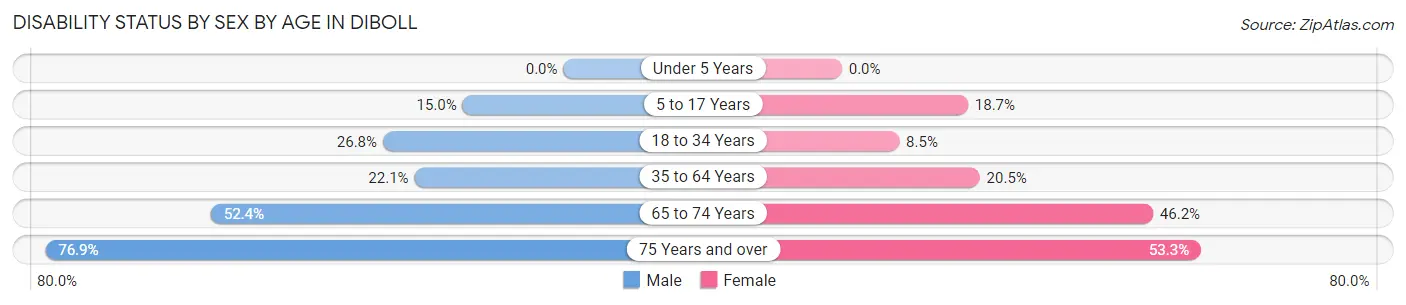
| Age Bracket | Male | Female |
| Under 5 Years | 0 (0.0%) | 0 (0.0%) |
| 5 to 17 Years | 76 (15.0%) | 85 (18.7%) |
| 18 to 34 Years | 97 (26.8%) | 30 (8.5%) |
| 35 to 64 Years | 140 (22.1%) | 210 (20.5%) |
| 65 to 74 Years | 78 (52.3%) | 79 (46.2%) |
| 75 Years and over | 30 (76.9%) | 32 (53.3%) |
Disability Class by Sex by Age in Diboll
Disability Class: Hearing Difficulty
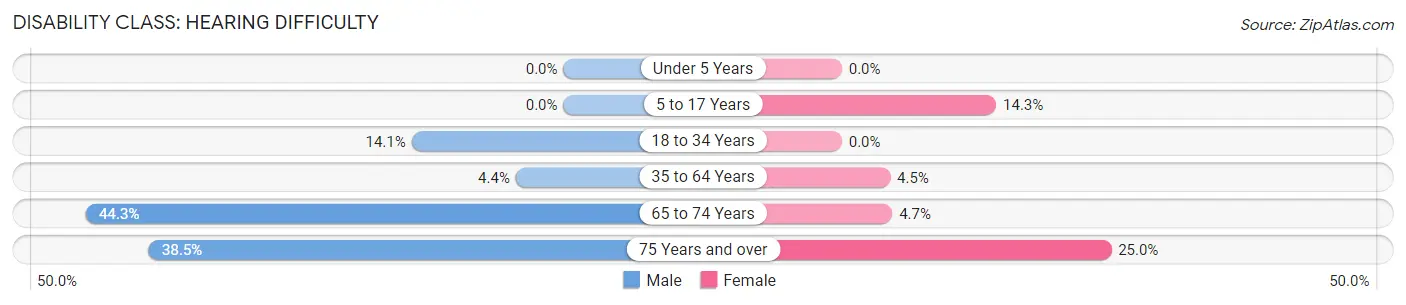
| Age Bracket | Male | Female |
| Under 5 Years | 0 (0.0%) | 0 (0.0%) |
| 5 to 17 Years | 0 (0.0%) | 65 (14.3%) |
| 18 to 34 Years | 51 (14.1%) | 0 (0.0%) |
| 35 to 64 Years | 28 (4.4%) | 46 (4.5%) |
| 65 to 74 Years | 66 (44.3%) | 8 (4.7%) |
| 75 Years and over | 15 (38.5%) | 15 (25.0%) |
Disability Class: Vision Difficulty
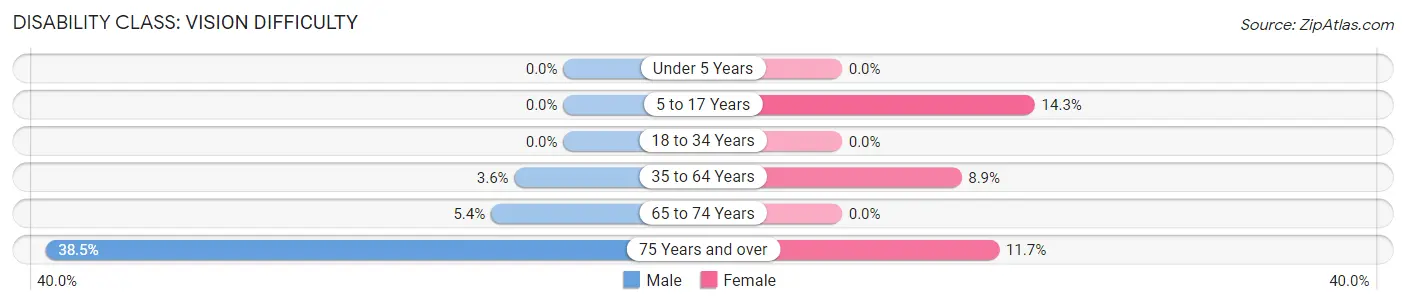
| Age Bracket | Male | Female |
| Under 5 Years | 0 (0.0%) | 0 (0.0%) |
| 5 to 17 Years | 0 (0.0%) | 65 (14.3%) |
| 18 to 34 Years | 0 (0.0%) | 0 (0.0%) |
| 35 to 64 Years | 23 (3.6%) | 91 (8.9%) |
| 65 to 74 Years | 8 (5.4%) | 0 (0.0%) |
| 75 Years and over | 15 (38.5%) | 7 (11.7%) |
Disability Class: Cognitive Difficulty
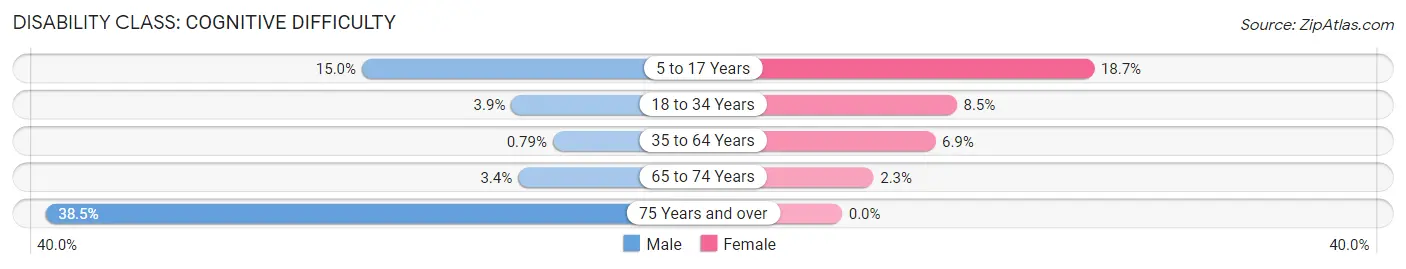
| Age Bracket | Male | Female |
| 5 to 17 Years | 76 (15.0%) | 85 (18.7%) |
| 18 to 34 Years | 14 (3.9%) | 30 (8.5%) |
| 35 to 64 Years | 5 (0.8%) | 71 (6.9%) |
| 65 to 74 Years | 5 (3.4%) | 4 (2.3%) |
| 75 Years and over | 15 (38.5%) | 0 (0.0%) |
Disability Class: Ambulatory Difficulty
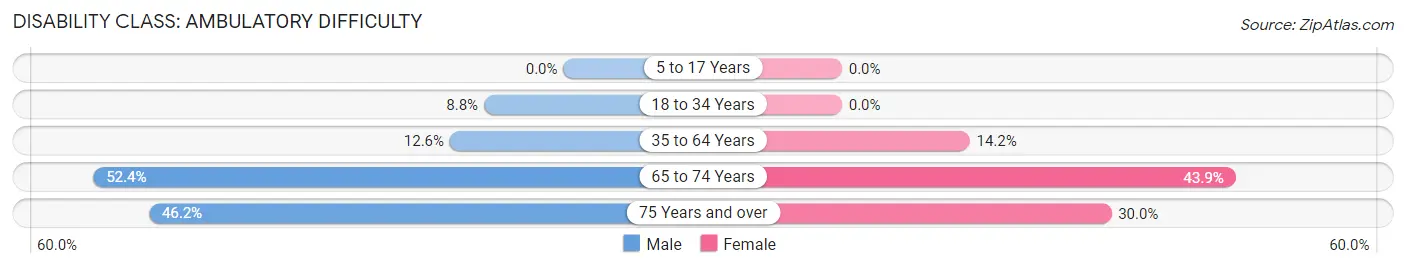
| Age Bracket | Male | Female |
| 5 to 17 Years | 0 (0.0%) | 0 (0.0%) |
| 18 to 34 Years | 32 (8.8%) | 0 (0.0%) |
| 35 to 64 Years | 80 (12.6%) | 146 (14.2%) |
| 65 to 74 Years | 78 (52.3%) | 75 (43.9%) |
| 75 Years and over | 18 (46.2%) | 18 (30.0%) |
Disability Class: Self-Care Difficulty

| Age Bracket | Male | Female |
| 5 to 17 Years | 0 (0.0%) | 0 (0.0%) |
| 18 to 34 Years | 0 (0.0%) | 0 (0.0%) |
| 35 to 64 Years | 29 (4.6%) | 139 (13.6%) |
| 65 to 74 Years | 5 (3.4%) | 22 (12.9%) |
| 75 Years and over | 0 (0.0%) | 0 (0.0%) |
Technology Access in Diboll
Computing Device Access in Diboll
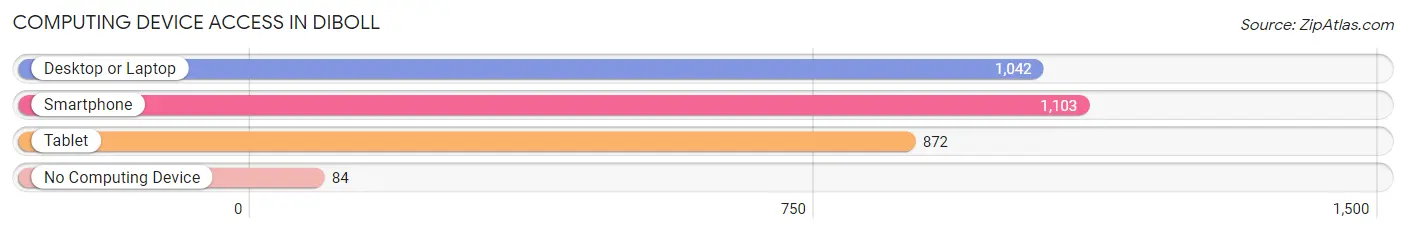
| Device Type | # Households | % Households |
| Desktop or Laptop | 1,042 | 71.5% |
| Smartphone | 1,103 | 75.7% |
| Tablet | 872 | 59.9% |
| No Computing Device | 84 | 5.8% |
| Total | 1,457 | 100.0% |
Internet Access in Diboll
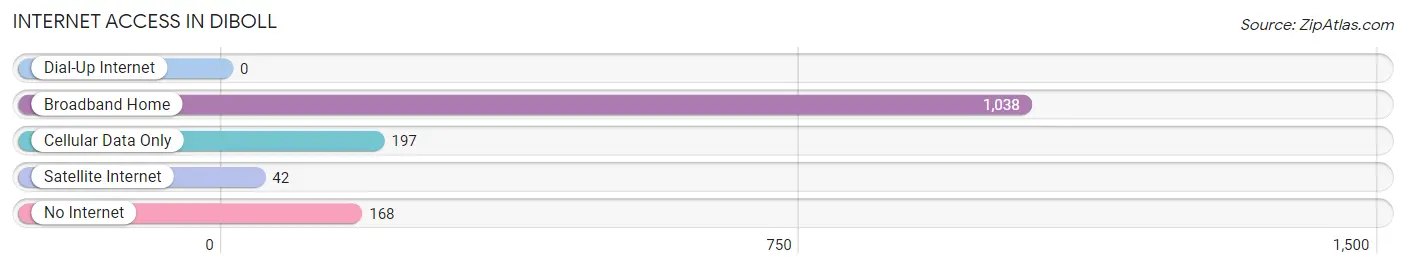
| Internet Type | # Households | % Households |
| Dial-Up Internet | 0 | 0.0% |
| Broadband Home | 1,038 | 71.2% |
| Cellular Data Only | 197 | 13.5% |
| Satellite Internet | 42 | 2.9% |
| No Internet | 168 | 11.5% |
| Total | 1,457 | 100.0% |
Diboll Summary
Diboll is a small city located in Angelina County, Texas, United States. It is situated in the East Texas Piney Woods region, approximately 8 miles (13 km) south of Lufkin, the county seat. The population of Diboll was 5,244 at the 2010 census.
History
Diboll was founded in 1894 by the Southern Pine Lumber Company, which was owned by the Diboll family. The town was named after Thomas L. Diboll, the company's founder. The company was the first to use the double-band sawmill, which allowed for the mass production of lumber. The town grew rapidly, and by the early 1900s, it had become a major lumber center.
In the 1920s, the Southern Pine Lumber Company began to diversify its operations, and it began to produce paper products, such as cardboard boxes and paper bags. The company also began to produce other products, such as furniture and clothing.
In the 1950s, the company began to diversify even further, and it began to produce chemicals, plastics, and other products. The company also began to produce electrical components, such as switches and circuit breakers.
In the 1960s, the company began to diversify even further, and it began to produce a variety of products, including automotive parts, medical supplies, and industrial equipment.
In the 1970s, the company began to diversify even further, and it began to produce a variety of products, including electronics, computer components, and telecommunications equipment.
In the 1980s, the company began to diversify even further, and it began to produce a variety of products, including computer software, medical equipment, and industrial machinery.
In the 1990s, the company began to diversify even further, and it began to produce a variety of products, including computer hardware, medical devices, and industrial equipment.
In the 2000s, the company began to diversify even further, and it began to produce a variety of products, including computer software, medical devices, and industrial equipment.
Geography
Diboll is located at 31 14 25 North 94 45 17 West 31 240278 94 754722
According to the United States Census Bureau, the city has a total area of 4.3 square miles (11.2 km2), all of it land.
Economy
Diboll is home to the Southern Pine Lumber Company, which is the largest employer in the city. The company produces a variety of products, including lumber, paper products, furniture, clothing, chemicals, plastics, electrical components, automotive parts, medical supplies, industrial equipment, electronics, computer components, telecommunications equipment, computer software, medical devices, and industrial machinery.
The city is also home to several other businesses, including a variety of retail stores, restaurants, and other services.
Demographics
As of the census of 2000, there were 5,244 people, 1,945 households, and 1,372 families residing in the city. The population density was 1,213.2 people per square mile (468.9/km2). There were 2,093 housing units at an average density of 484.2 per square mile (186.7/km2). The racial makeup of the city was 68.45% White, 24.45% African American, 0.37% Native American, 0.37% Asian, 0.02% Pacific Islander, 4.90% from other races, and 1.44% from two or more races. Hispanic or Latino of any race were 8.45% of the population.
There were 1,945 households, out of which 33.2% had children under the age of 18 living with them, 48.2% were married couples living together, 17.2% had a female householder with no husband present, and 29.2% were non-families. 25.2% of all households were made up of individuals, and 11.7% had someone living alone who was 65 years of age or older. The average household size was 2.63 and the average family size was 3.14.
In the city, the population was spread out, with 28.2% under the age of 18, 9.2% from 18 to 24, 26.2% from 25 to 44, 21.2% from 45 to 64, and 15.2% who were 65 years of age or older. The median age was 35 years. For every 100 females, there were 91.2 males. For every 100 females age 18 and over, there were 86.2 males.
The median income for a household in the city was $27,917, and the median income for a family was $32,917. Males had a median income of $27,917 versus $20,917 for females. The per capita income for the city was $13,917. About 17.2% of families and 20.2% of the population were below the poverty line, including 25.2% of those under age 18 and 16.2% of those age 65 or over.
Common Questions
What is Per Capita Income in Diboll?
Per Capita income in Diboll is $20,247.
What is the Median Family Income in Diboll?
Median Family Income in Diboll is $56,538.
What is the Median Household income in Diboll?
Median Household Income in Diboll is $55,399.
What is Income or Wage Gap in Diboll?
Income or Wage Gap in Diboll is 23.7%.
Women in Diboll earn 76.3 cents for every dollar earned by a man.
What is Inequality or Gini Index in Diboll?
Inequality or Gini Index in Diboll is 0.42.
What is the Total Population of Diboll?
Total Population of Diboll is 4,546.
What is the Total Male Population of Diboll?
Total Male Population of Diboll is 2,359.
What is the Total Female Population of Diboll?
Total Female Population of Diboll is 2,187.
What is the Ratio of Males per 100 Females in Diboll?
There are 107.86 Males per 100 Females in Diboll.
What is the Ratio of Females per 100 Males in Diboll?
There are 92.71 Females per 100 Males in Diboll.
What is the Median Population Age in Diboll?
Median Population Age in Diboll is 36.8 Years.
What is the Average Family Size in Diboll
Average Family Size in Diboll is 3.0 People.
What is the Average Household Size in Diboll
Average Household Size in Diboll is 2.8 People.
How Large is the Labor Force in Diboll?
There are 1,797 People in the Labor Forcein in Diboll.
What is the Percentage of People in the Labor Force in Diboll?
54.2% of People are in the Labor Force in Diboll.
What is the Unemployment Rate in Diboll?
Unemployment Rate in Diboll is 6.9%.