Lilburn, GA Map & Demographics
Lilburn Map
Lilburn Overview
$29,244
PER CAPITA INCOME
$76,168
AVG FAMILY INCOME
$61,347
AVG HOUSEHOLD INCOME
22.1%
WAGE / INCOME GAP [ % ]
77.9¢/ $1
WAGE / INCOME GAP [ $ ]
0.47
INEQUALITY / GINI INDEX
14,741
TOTAL POPULATION
8,170
MALE POPULATION
6,571
FEMALE POPULATION
124.33
MALES / 100 FEMALES
80.43
FEMALES / 100 MALES
36.1
MEDIAN AGE
4.0
AVG FAMILY SIZE
3.0
AVG HOUSEHOLD SIZE
6,597
LABOR FORCE [ PEOPLE ]
62.5%
PERCENT IN LABOR FORCE
4.6%
UNEMPLOYMENT RATE
Lilburn Zip Codes
Income in Lilburn
Income Overview in Lilburn
Per Capita Income in Lilburn is $29,244, while median incomes of families and households are $76,168 and $61,347 respectively.
| Characteristic | Number | Measure |
| Per Capita Income | 14,741 | $29,244 |
| Median Family Income | 2,985 | $76,168 |
| Mean Family Income | 2,985 | $111,479 |
| Median Household Income | 4,791 | $61,347 |
| Mean Household Income | 4,791 | $88,675 |
| Income Deficit | 2,985 | $0 |
| Wage / Income Gap (%) | 14,741 | 22.09% |
| Wage / Income Gap ($) | 14,741 | 77.91¢ per $1 |
| Gini / Inequality Index | 14,741 | 0.47 |
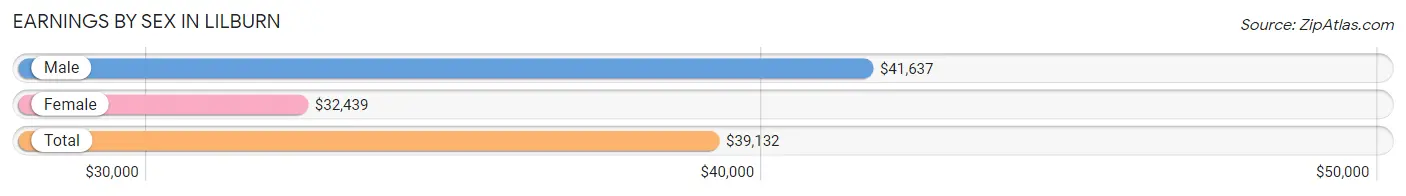
Earnings by Sex in Lilburn
Average Earnings in Lilburn are $39,132, $41,637 for men and $32,439 for women, a difference of 22.1%.
| Sex | Number | Average Earnings |
| Male | 4,110 (62.4%) | $41,637 |
| Female | 2,482 (37.7%) | $32,439 |
| Total | 6,592 (100.0%) | $39,132 |
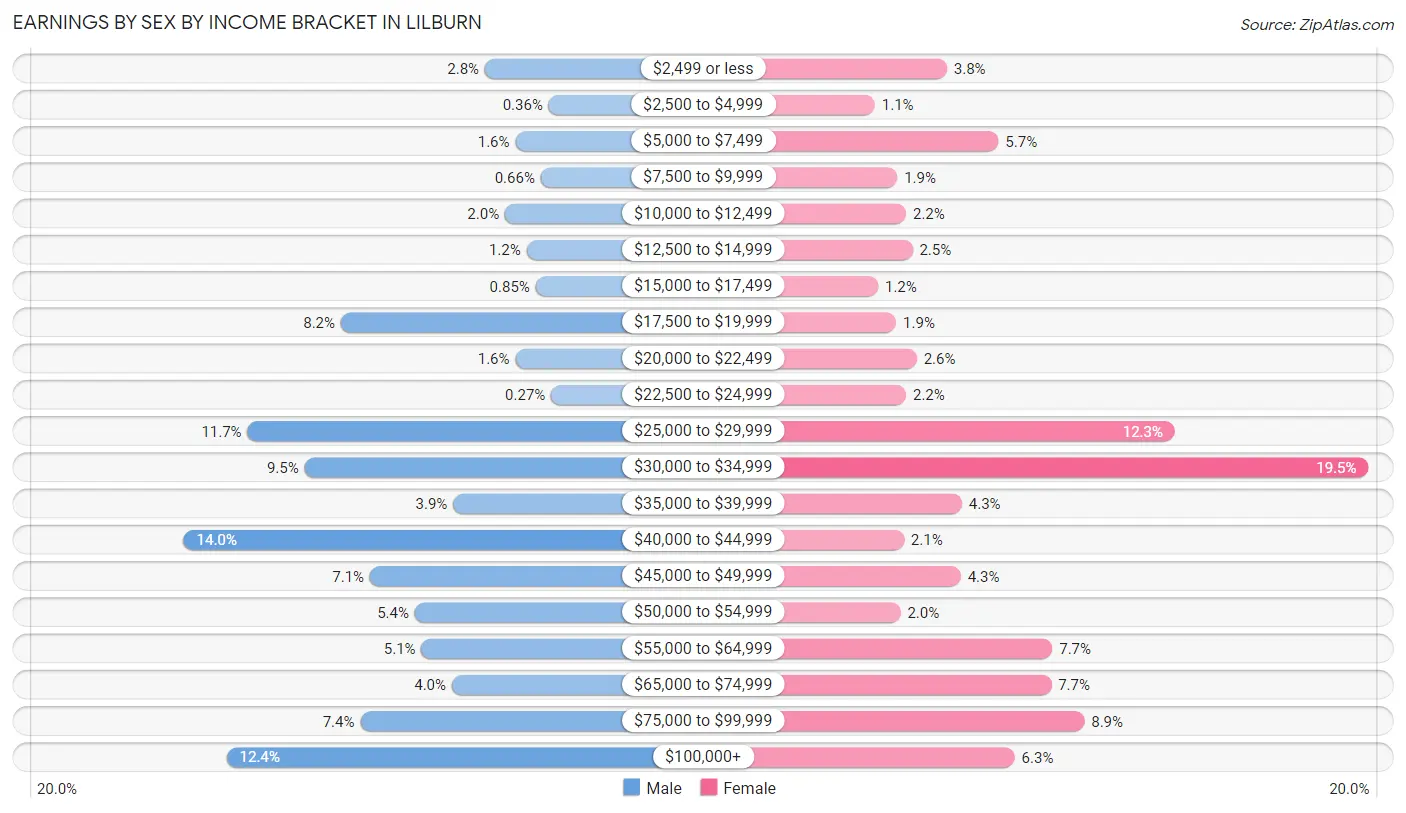
Earnings by Sex by Income Bracket in Lilburn
The most common earnings brackets in Lilburn are $40,000 to $44,999 for men (577 | 14.0%) and $30,000 to $34,999 for women (485 | 19.5%).
| Income | Male | Female |
| $2,499 or less | 113 (2.8%) | 93 (3.7%) |
| $2,500 to $4,999 | 15 (0.4%) | 26 (1.1%) |
| $5,000 to $7,499 | 66 (1.6%) | 141 (5.7%) |
| $7,500 to $9,999 | 27 (0.7%) | 47 (1.9%) |
| $10,000 to $12,499 | 82 (2.0%) | 55 (2.2%) |
| $12,500 to $14,999 | 49 (1.2%) | 61 (2.5%) |
| $15,000 to $17,499 | 35 (0.9%) | 29 (1.2%) |
| $17,500 to $19,999 | 335 (8.2%) | 46 (1.8%) |
| $20,000 to $22,499 | 66 (1.6%) | 65 (2.6%) |
| $22,500 to $24,999 | 11 (0.3%) | 55 (2.2%) |
| $25,000 to $29,999 | 479 (11.7%) | 305 (12.3%) |
| $30,000 to $34,999 | 391 (9.5%) | 485 (19.5%) |
| $35,000 to $39,999 | 162 (3.9%) | 107 (4.3%) |
| $40,000 to $44,999 | 577 (14.0%) | 53 (2.1%) |
| $45,000 to $49,999 | 290 (7.1%) | 106 (4.3%) |
| $50,000 to $54,999 | 221 (5.4%) | 50 (2.0%) |
| $55,000 to $64,999 | 211 (5.1%) | 191 (7.7%) |
| $65,000 to $74,999 | 164 (4.0%) | 190 (7.7%) |
| $75,000 to $99,999 | 305 (7.4%) | 221 (8.9%) |
| $100,000+ | 511 (12.4%) | 156 (6.3%) |
| Total | 4,110 (100.0%) | 2,482 (100.0%) |
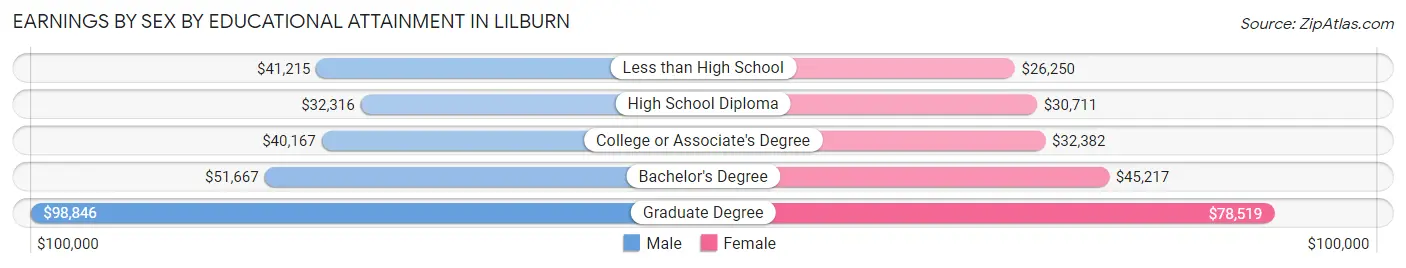
Earnings by Sex by Educational Attainment in Lilburn
Average earnings in Lilburn are $42,594 for men and $33,223 for women, a difference of 22.0%. Men with an educational attainment of graduate degree enjoy the highest average annual earnings of $98,846, while those with high school diploma education earn the least with $32,316. Women with an educational attainment of graduate degree earn the most with the average annual earnings of $78,519, while those with less than high school education have the smallest earnings of $26,250.
| Educational Attainment | Male Income | Female Income |
| Less than High School | $41,215 | $26,250 |
| High School Diploma | $32,316 | $30,711 |
| College or Associate's Degree | $40,167 | $32,382 |
| Bachelor's Degree | $51,667 | $45,217 |
| Graduate Degree | $98,846 | $78,519 |
| Total | $42,594 | $33,223 |
Family Income in Lilburn
Family Income Brackets in Lilburn
According to the Lilburn family income data, there are 597 families falling into the $50,000 to $74,999 income range, which is the most common income bracket and makes up 20.0% of all families. Conversely, the less than $10,000 income bracket is the least frequent group with only 42 families (1.4%) belonging to this category.
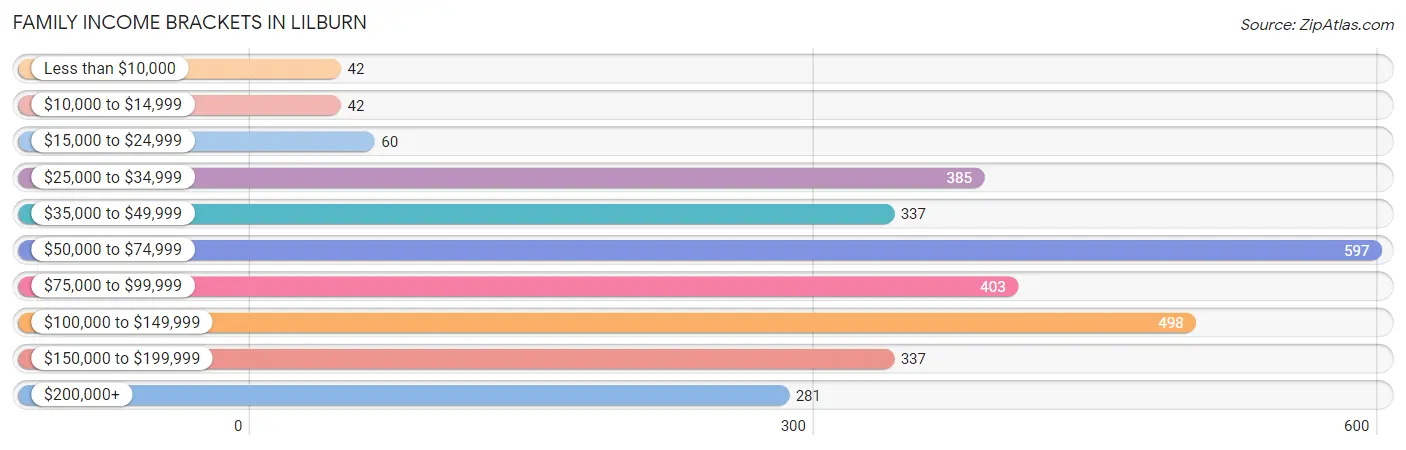
| Income Bracket | # Families | % Families |
| Less than $10,000 | 42 | 1.4% |
| $10,000 to $14,999 | 42 | 1.4% |
| $15,000 to $24,999 | 60 | 2.0% |
| $25,000 to $34,999 | 385 | 12.9% |
| $35,000 to $49,999 | 337 | 11.3% |
| $50,000 to $74,999 | 597 | 20.0% |
| $75,000 to $99,999 | 403 | 13.5% |
| $100,000 to $149,999 | 498 | 16.7% |
| $150,000 to $199,999 | 337 | 11.3% |
| $200,000+ | 281 | 9.4% |
Family Income by Famaliy Size in Lilburn
6-person families (204 | 6.8%) account for the highest median family income in Lilburn with $148,214 per family, while 2-person families (957 | 32.1%) have the highest median income of $37,396 per family member.
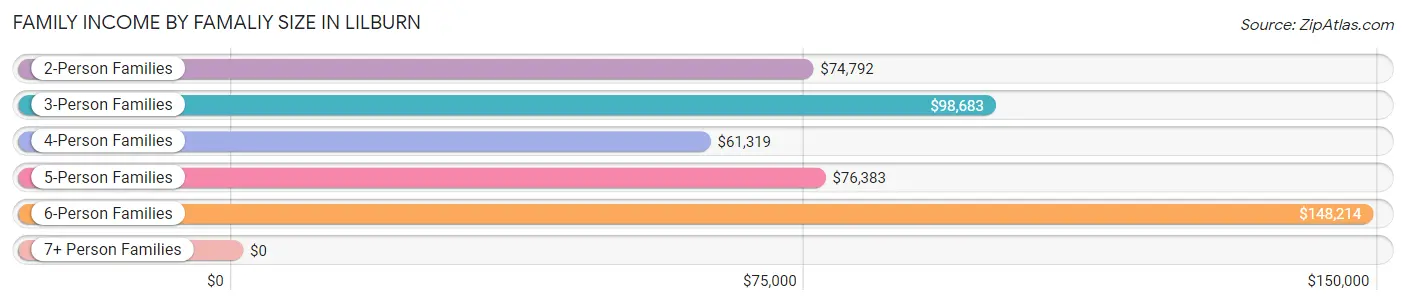
| Income Bracket | # Families | Median Income |
| 2-Person Families | 957 (32.1%) | $74,792 |
| 3-Person Families | 578 (19.4%) | $98,683 |
| 4-Person Families | 659 (22.1%) | $61,319 |
| 5-Person Families | 344 (11.5%) | $76,383 |
| 6-Person Families | 204 (6.8%) | $148,214 |
| 7+ Person Families | 243 (8.1%) | $0 |
| Total | 2,985 (100.0%) | $76,168 |
Family Income by Number of Earners in Lilburn
The median family income in Lilburn is $76,168, with families comprising 3+ earners (506) having the highest median family income of $147,768, while families with 1 earner (1,184) have the lowest median family income of $48,958, accounting for 17.0% and 39.7% of families, respectively.
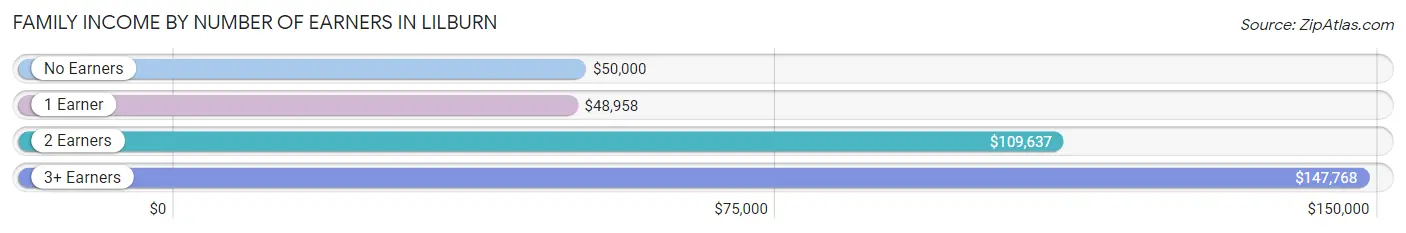
| Number of Earners | # Families | Median Income |
| No Earners | 328 (11.0%) | $50,000 |
| 1 Earner | 1,184 (39.7%) | $48,958 |
| 2 Earners | 967 (32.4%) | $109,637 |
| 3+ Earners | 506 (17.0%) | $147,768 |
| Total | 2,985 (100.0%) | $76,168 |
Household Income in Lilburn
Household Income Brackets in Lilburn
With 853 households falling in the category, the $50,000 to $74,999 income range is the most frequent in Lilburn, accounting for 17.8% of all households. In contrast, only 120 households (2.5%) fall into the less than $10,000 income bracket, making it the least populous group.
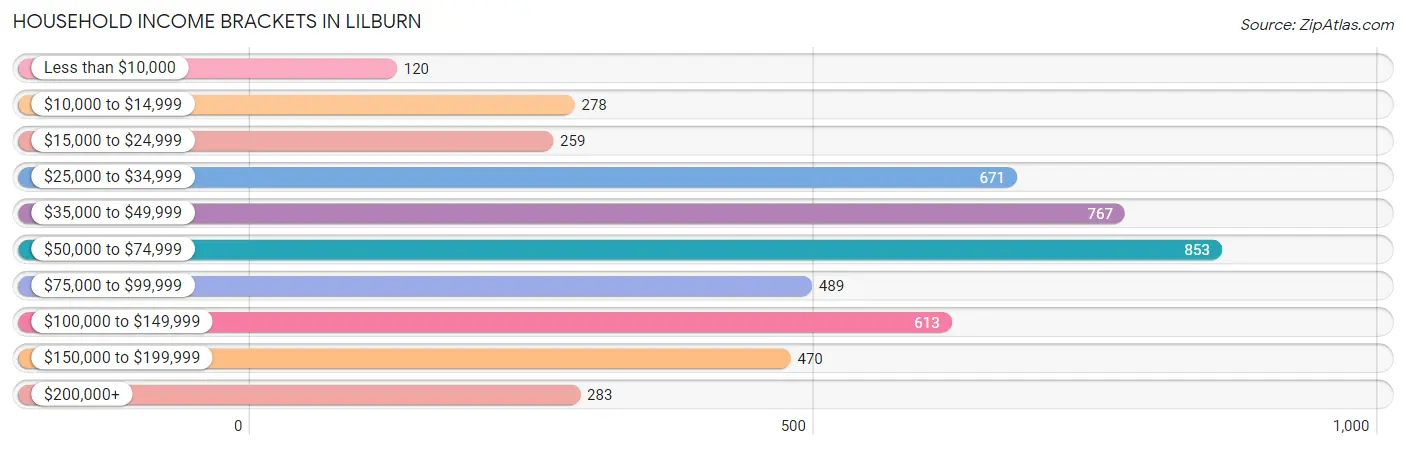
| Income Bracket | # Households | % Households |
| Less than $10,000 | 120 | 2.5% |
| $10,000 to $14,999 | 278 | 5.8% |
| $15,000 to $24,999 | 259 | 5.4% |
| $25,000 to $34,999 | 671 | 14.0% |
| $35,000 to $49,999 | 767 | 16.0% |
| $50,000 to $74,999 | 853 | 17.8% |
| $75,000 to $99,999 | 489 | 10.2% |
| $100,000 to $149,999 | 613 | 12.8% |
| $150,000 to $199,999 | 470 | 9.8% |
| $200,000+ | 283 | 5.9% |
Household Income by Householder Age in Lilburn
The median household income in Lilburn is $61,347, with the highest median household income of $76,318 found in the 45 to 64 years age bracket for the primary householder. A total of 1,590 households (33.2%) fall into this category. Meanwhile, the 15 to 24 years age bracket for the primary householder has the lowest median household income of $0, with 21 households (0.4%) in this group.
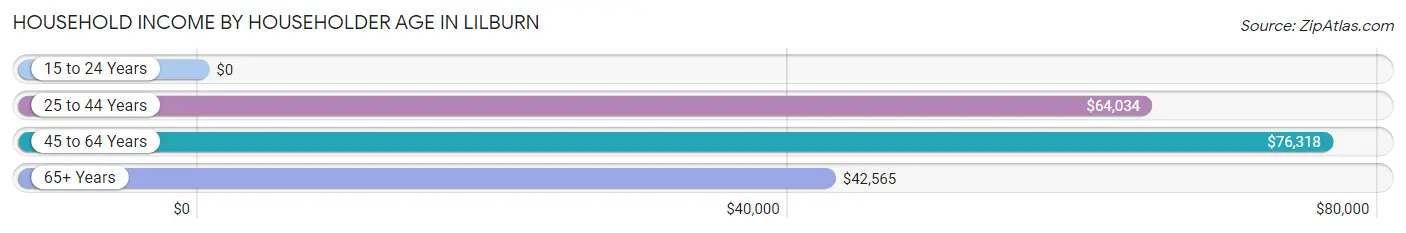
| Income Bracket | # Households | Median Income |
| 15 to 24 Years | 21 (0.4%) | $0 |
| 25 to 44 Years | 1,673 (34.9%) | $64,034 |
| 45 to 64 Years | 1,590 (33.2%) | $76,318 |
| 65+ Years | 1,507 (31.5%) | $42,565 |
| Total | 4,791 (100.0%) | $61,347 |
Poverty in Lilburn
Income Below Poverty by Sex and Age in Lilburn
With 22.2% poverty level for males and 15.8% for females among the residents of Lilburn, 5 year old males and 15 year old females are the most vulnerable to poverty, with 368 males (87.4%) and 23 females (37.1%) in their respective age groups living below the poverty level.
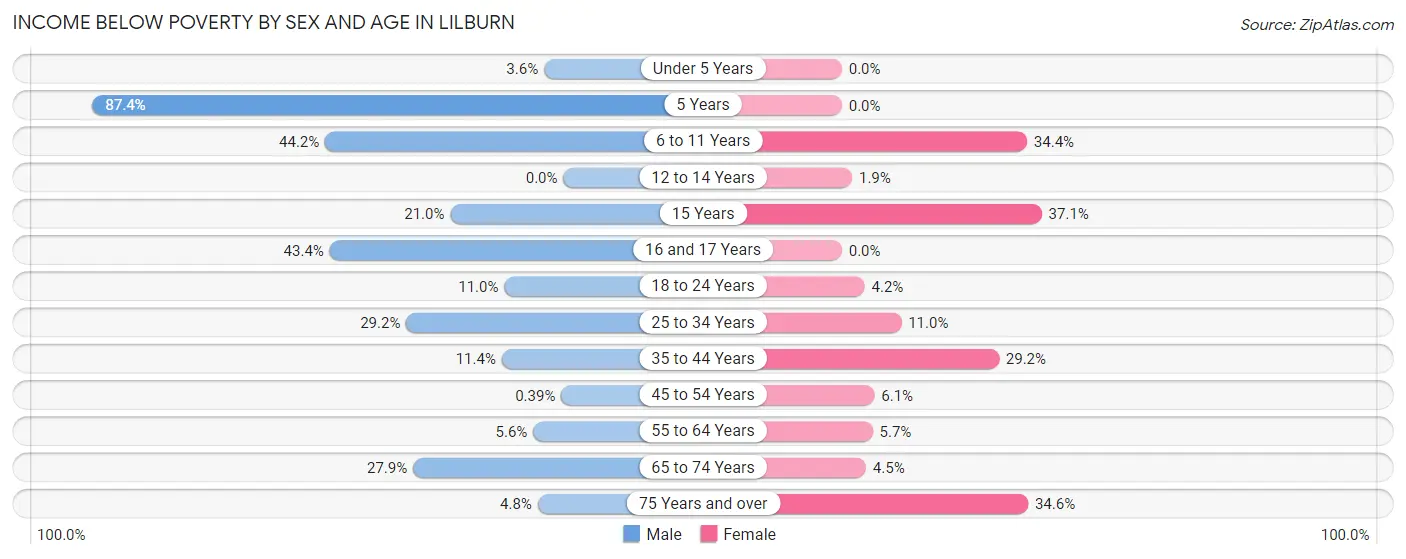
| Age Bracket | Male | Female |
| Under 5 Years | 17 (3.6%) | 0 (0.0%) |
| 5 Years | 368 (87.4%) | 0 (0.0%) |
| 6 to 11 Years | 578 (44.2%) | 256 (34.4%) |
| 12 to 14 Years | 0 (0.0%) | 4 (1.9%) |
| 15 Years | 17 (21.0%) | 23 (37.1%) |
| 16 and 17 Years | 154 (43.4%) | 0 (0.0%) |
| 18 to 24 Years | 57 (11.0%) | 21 (4.2%) |
| 25 to 34 Years | 268 (29.2%) | 64 (11.0%) |
| 35 to 44 Years | 131 (11.4%) | 365 (29.1%) |
| 45 to 54 Years | 4 (0.4%) | 44 (6.0%) |
| 55 to 64 Years | 28 (5.6%) | 29 (5.7%) |
| 65 to 74 Years | 161 (27.9%) | 33 (4.5%) |
| 75 Years and over | 26 (4.8%) | 150 (34.6%) |
| Total | 1,809 (22.2%) | 989 (15.8%) |
Income Above Poverty by Sex and Age in Lilburn
According to the poverty statistics in Lilburn, males aged 12 to 14 years and females aged under 5 years are the age groups that are most secure financially, with 100.0% of males and 100.0% of females in these age groups living above the poverty line.
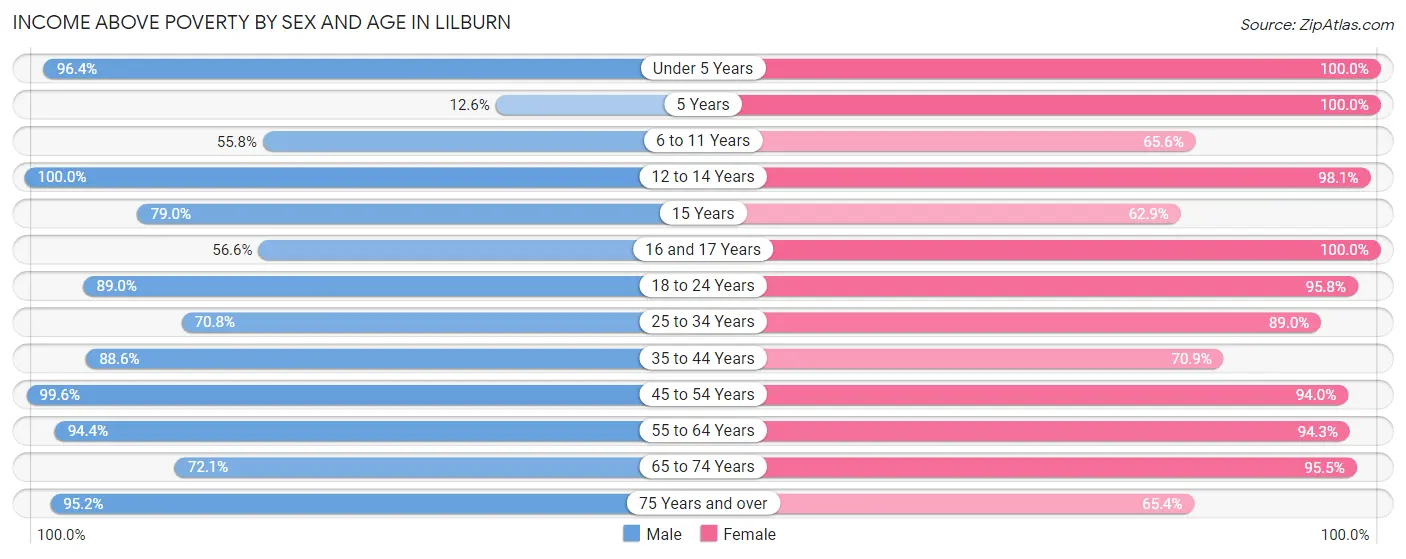
| Age Bracket | Male | Female |
| Under 5 Years | 456 (96.4%) | 350 (100.0%) |
| 5 Years | 53 (12.6%) | 48 (100.0%) |
| 6 to 11 Years | 729 (55.8%) | 489 (65.6%) |
| 12 to 14 Years | 267 (100.0%) | 207 (98.1%) |
| 15 Years | 64 (79.0%) | 39 (62.9%) |
| 16 and 17 Years | 201 (56.6%) | 93 (100.0%) |
| 18 to 24 Years | 463 (89.0%) | 476 (95.8%) |
| 25 to 34 Years | 651 (70.8%) | 516 (89.0%) |
| 35 to 44 Years | 1,014 (88.6%) | 887 (70.9%) |
| 45 to 54 Years | 1,022 (99.6%) | 683 (94.0%) |
| 55 to 64 Years | 472 (94.4%) | 479 (94.3%) |
| 65 to 74 Years | 416 (72.1%) | 706 (95.5%) |
| 75 Years and over | 520 (95.2%) | 284 (65.4%) |
| Total | 6,328 (77.8%) | 5,257 (84.2%) |
Income Below Poverty Among Married-Couple Families in Lilburn
The poverty statistics for married-couple families in Lilburn show that 10.5% or 256 of the total 2,441 families live below the poverty line. Families with 5 or more children have the highest poverty rate of 76.2%, comprising of 147 families. On the other hand, families with no children have the lowest poverty rate of 4.0%, which includes 43 families.
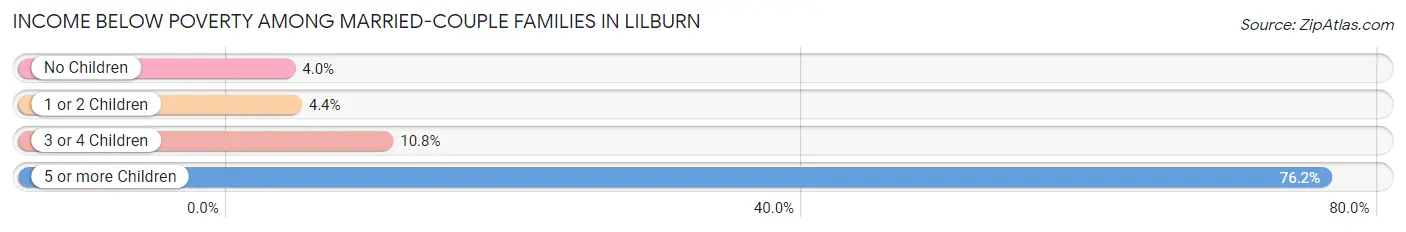
| Children | Above Poverty | Below Poverty |
| No Children | 1,036 (96.0%) | 43 (4.0%) |
| 1 or 2 Children | 905 (95.6%) | 42 (4.4%) |
| 3 or 4 Children | 198 (89.2%) | 24 (10.8%) |
| 5 or more Children | 46 (23.8%) | 147 (76.2%) |
| Total | 2,185 (89.5%) | 256 (10.5%) |
Income Below Poverty Among Single-Parent Households in Lilburn
According to the poverty data in Lilburn, 0.4% or 1 single-father households and 6.2% or 20 single-mother households are living below the poverty line. Among single-father households, those with 3 or 4 children have the highest poverty rate, with 1 households (2.1%) experiencing poverty. Likewise, among single-mother households, those with 1 or 2 children have the highest poverty rate, with 20 households (10.4%) falling below the poverty line.
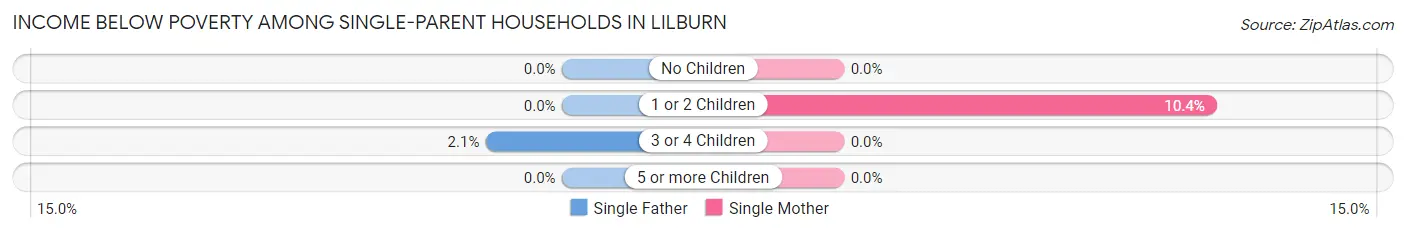
| Children | Single Father | Single Mother |
| No Children | 0 (0.0%) | 0 (0.0%) |
| 1 or 2 Children | 0 (0.0%) | 20 (10.4%) |
| 3 or 4 Children | 1 (2.1%) | 0 (0.0%) |
| 5 or more Children | 0 (0.0%) | 0 (0.0%) |
| Total | 1 (0.4%) | 20 (6.2%) |
Income Below Poverty Among Married-Couple vs Single-Parent Households in Lilburn
The poverty data for Lilburn shows that 256 of the married-couple family households (10.5%) and 21 of the single-parent households (3.9%) are living below the poverty level. Within the married-couple family households, those with 5 or more children have the highest poverty rate, with 147 households (76.2%) falling below the poverty line. Among the single-parent households, those with 1 or 2 children have the highest poverty rate, with 20 household (7.4%) living below poverty.
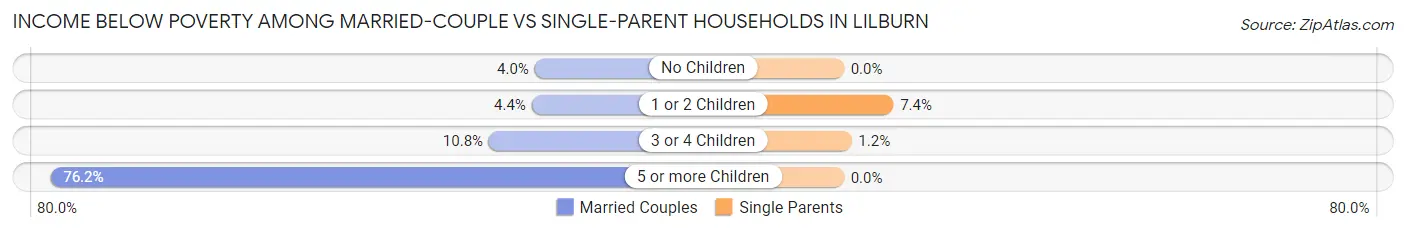
| Children | Married-Couple Families | Single-Parent Households |
| No Children | 43 (4.0%) | 0 (0.0%) |
| 1 or 2 Children | 42 (4.4%) | 20 (7.4%) |
| 3 or 4 Children | 24 (10.8%) | 1 (1.1%) |
| 5 or more Children | 147 (76.2%) | 0 (0.0%) |
| Total | 256 (10.5%) | 21 (3.9%) |
Race in Lilburn
The most populous races in Lilburn are Hispanic or Latino (6,589 | 44.7%), White / Caucasian (3,947 | 26.8%), and Some other Race (2,952 | 20.0%).
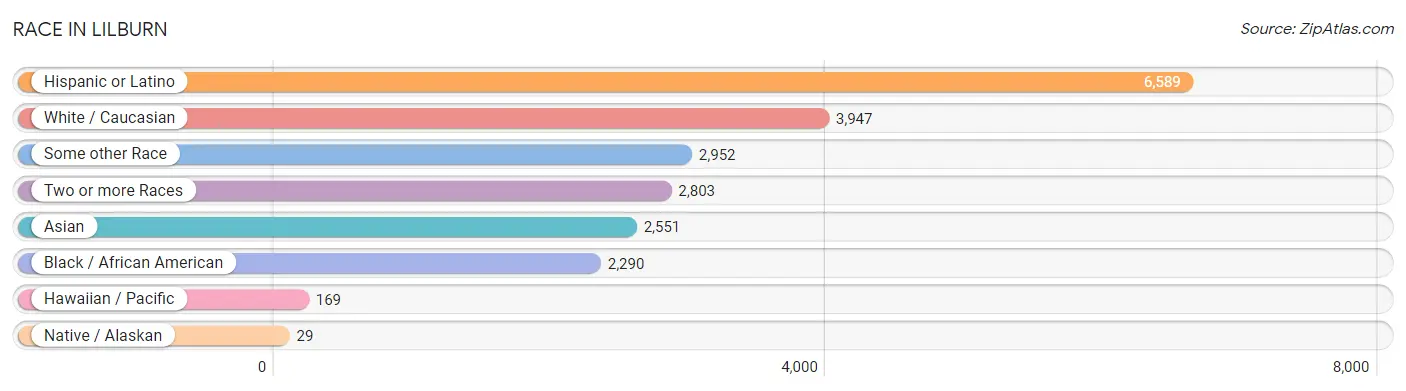
| Race | # Population | % Population |
| Asian | 2,551 | 17.3% |
| Black / African American | 2,290 | 15.5% |
| Hawaiian / Pacific | 169 | 1.1% |
| Hispanic or Latino | 6,589 | 44.7% |
| Native / Alaskan | 29 | 0.2% |
| White / Caucasian | 3,947 | 26.8% |
| Two or more Races | 2,803 | 19.0% |
| Some other Race | 2,952 | 20.0% |
| Total | 14,741 | 100.0% |
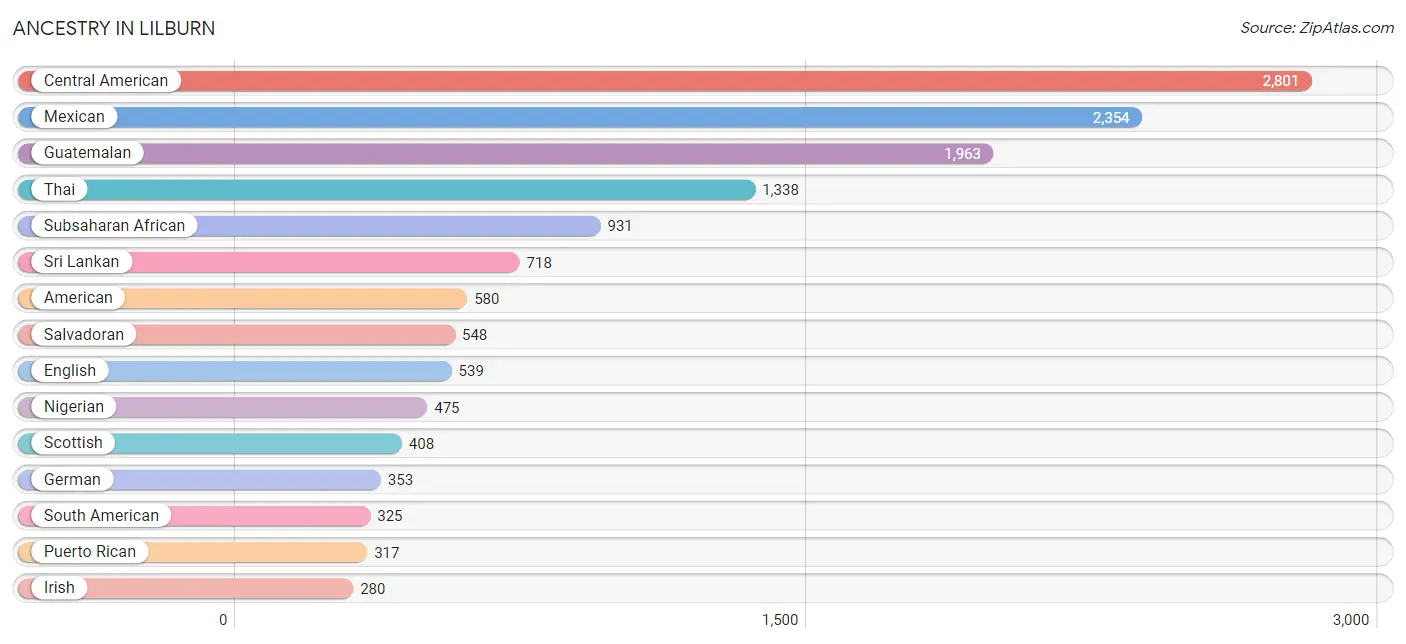
Ancestry in Lilburn
The most populous ancestries reported in Lilburn are Central American (2,801 | 19.0%), Mexican (2,354 | 16.0%), Guatemalan (1,963 | 13.3%), Thai (1,338 | 9.1%), and Subsaharan African (931 | 6.3%), together accounting for 63.7% of all Lilburn residents.
| Ancestry | # Population | % Population |
| Afghan | 103 | 0.7% |
| African | 44 | 0.3% |
| American | 580 | 3.9% |
| Arab | 76 | 0.5% |
| Argentinean | 73 | 0.5% |
| Bhutanese | 11 | 0.1% |
| British | 10 | 0.1% |
| Bulgarian | 4 | 0.0% |
| Burmese | 91 | 0.6% |
| Central American | 2,801 | 19.0% |
| Cherokee | 10 | 0.1% |
| Colombian | 73 | 0.5% |
| Cuban | 142 | 1.0% |
| Czech | 43 | 0.3% |
| Czechoslovakian | 9 | 0.1% |
| Dutch | 33 | 0.2% |
| Eastern European | 7 | 0.1% |
| English | 539 | 3.7% |
| Ethiopian | 80 | 0.5% |
| European | 115 | 0.8% |
| Filipino | 13 | 0.1% |
| Finnish | 21 | 0.1% |
| French | 70 | 0.5% |
| French Canadian | 18 | 0.1% |
| German | 353 | 2.4% |
| Greek | 8 | 0.1% |
| Guatemalan | 1,963 | 13.3% |
| Haitian | 35 | 0.2% |
| Honduran | 269 | 1.8% |
| Indian (Asian) | 133 | 0.9% |
| Iraqi | 30 | 0.2% |
| Irish | 280 | 1.9% |
| Italian | 120 | 0.8% |
| Korean | 110 | 0.7% |
| Laotian | 17 | 0.1% |
| Liberian | 175 | 1.2% |
| Mexican | 2,354 | 16.0% |
| Mexican American Indian | 10 | 0.1% |
| Nigerian | 475 | 3.2% |
| Norwegian | 50 | 0.3% |
| Pakistani | 7 | 0.1% |
| Palestinian | 30 | 0.2% |
| Panamanian | 21 | 0.1% |
| Peruvian | 83 | 0.6% |
| Polish | 23 | 0.2% |
| Puerto Rican | 317 | 2.1% |
| Romanian | 15 | 0.1% |
| Russian | 173 | 1.2% |
| Salvadoran | 548 | 3.7% |
| Samoan | 16 | 0.1% |
| Scandinavian | 10 | 0.1% |
| Scotch-Irish | 42 | 0.3% |
| Scottish | 408 | 2.8% |
| Shoshone | 16 | 0.1% |
| Slovak | 13 | 0.1% |
| South American | 325 | 2.2% |
| South American Indian | 3 | 0.0% |
| Sri Lankan | 718 | 4.9% |
| Subsaharan African | 931 | 6.3% |
| Swedish | 20 | 0.1% |
| Swiss | 9 | 0.1% |
| Thai | 1,338 | 9.1% |
| Trinidadian and Tobagonian | 25 | 0.2% |
| U.S. Virgin Islander | 144 | 1.0% |
| Ukrainian | 15 | 0.1% |
| Uruguayan | 13 | 0.1% |
| Venezuelan | 83 | 0.6% |
| Vietnamese | 25 | 0.2% |
| Welsh | 10 | 0.1% |
| West Indian | 29 | 0.2% | View All 70 Rows |
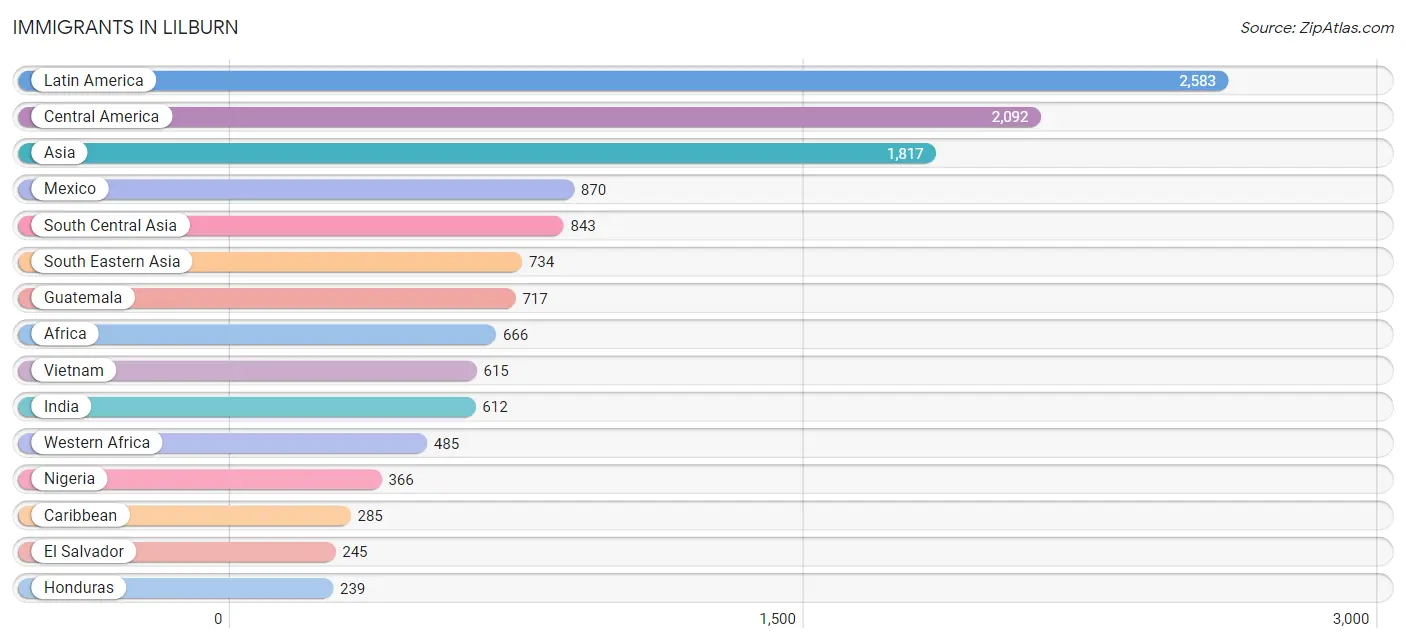
Immigrants in Lilburn
The most numerous immigrant groups reported in Lilburn came from Latin America (2,583 | 17.5%), Central America (2,092 | 14.2%), Asia (1,817 | 12.3%), Mexico (870 | 5.9%), and South Central Asia (843 | 5.7%), together accounting for 55.7% of all Lilburn residents.
| Immigration Origin | # Population | % Population |
| Afghanistan | 51 | 0.4% |
| Africa | 666 | 4.5% |
| Argentina | 28 | 0.2% |
| Asia | 1,817 | 12.3% |
| Bahamas | 25 | 0.2% |
| Bangladesh | 106 | 0.7% |
| Bosnia and Herzegovina | 4 | 0.0% |
| Bulgaria | 4 | 0.0% |
| Cambodia | 35 | 0.2% |
| Cameroon | 91 | 0.6% |
| Canada | 12 | 0.1% |
| Caribbean | 285 | 1.9% |
| Central America | 2,092 | 14.2% |
| China | 90 | 0.6% |
| Colombia | 29 | 0.2% |
| Cuba | 113 | 0.8% |
| Czechoslovakia | 35 | 0.2% |
| Eastern Africa | 78 | 0.5% |
| Eastern Asia | 173 | 1.2% |
| Eastern Europe | 129 | 0.9% |
| El Salvador | 245 | 1.7% |
| England | 12 | 0.1% |
| Ethiopia | 41 | 0.3% |
| Europe | 169 | 1.1% |
| Germany | 9 | 0.1% |
| Guatemala | 717 | 4.9% |
| Haiti | 15 | 0.1% |
| Honduras | 239 | 1.6% |
| India | 612 | 4.2% |
| Indonesia | 17 | 0.1% |
| Iraq | 29 | 0.2% |
| Jamaica | 20 | 0.1% |
| Kenya | 28 | 0.2% |
| Korea | 83 | 0.6% |
| Latin America | 2,583 | 17.5% |
| Liberia | 119 | 0.8% |
| Mexico | 870 | 5.9% |
| Micronesia | 34 | 0.2% |
| Middle Africa | 91 | 0.6% |
| Morocco | 12 | 0.1% |
| Nigeria | 366 | 2.5% |
| Northern Africa | 12 | 0.1% |
| Northern Europe | 31 | 0.2% |
| Oceania | 34 | 0.2% |
| Panama | 21 | 0.1% |
| Peru | 54 | 0.4% |
| Philippines | 24 | 0.2% |
| Romania | 15 | 0.1% |
| Russia | 71 | 0.5% |
| South America | 206 | 1.4% |
| South Central Asia | 843 | 5.7% |
| South Eastern Asia | 734 | 5.0% |
| Syria | 8 | 0.1% |
| Taiwan | 45 | 0.3% |
| Thailand | 16 | 0.1% |
| Trinidad and Tobago | 25 | 0.2% |
| Uruguay | 35 | 0.2% |
| Venezuela | 60 | 0.4% |
| Vietnam | 615 | 4.2% |
| Western Africa | 485 | 3.3% |
| Western Asia | 37 | 0.3% |
| Western Europe | 9 | 0.1% |
| Zimbabwe | 5 | 0.0% | View All 63 Rows |
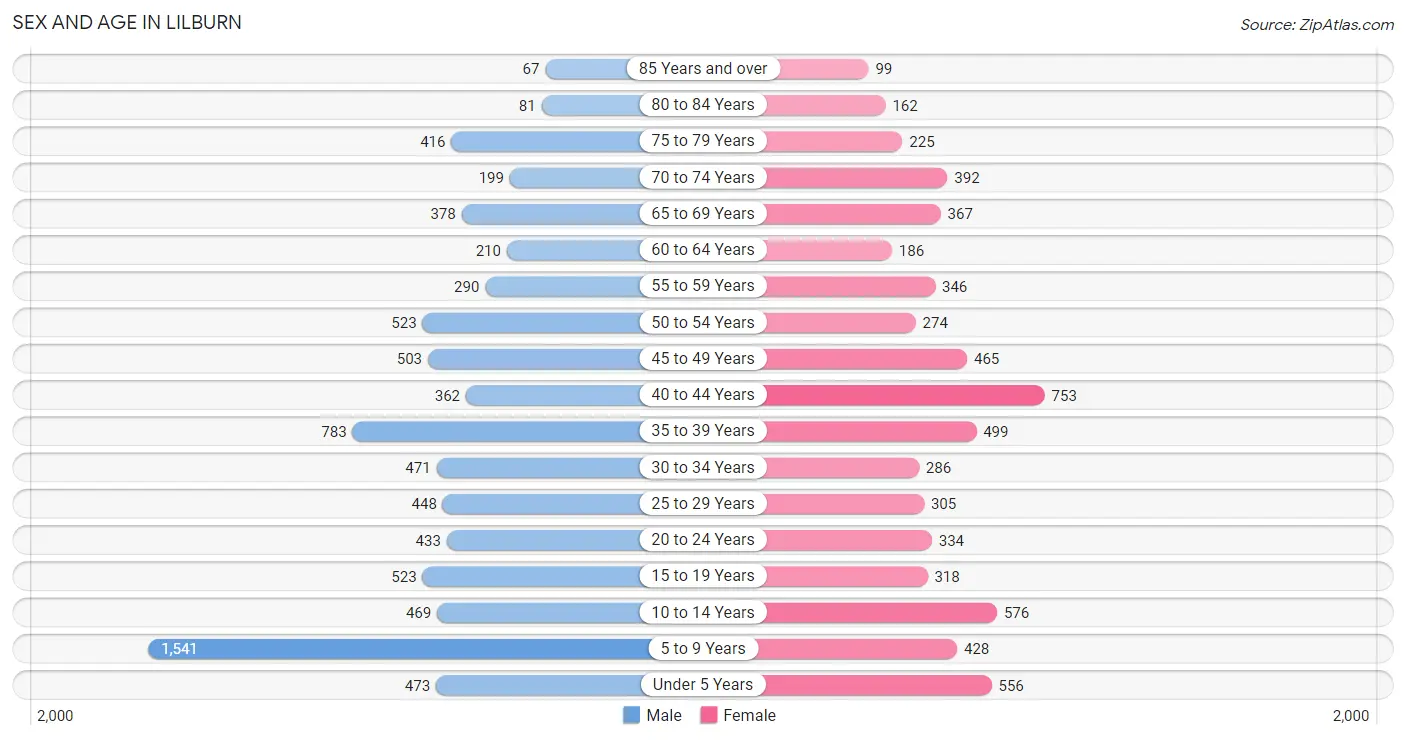
Sex and Age in Lilburn
Sex and Age in Lilburn
The most populous age groups in Lilburn are 5 to 9 Years (1,541 | 18.9%) for men and 40 to 44 Years (753 | 11.5%) for women.
| Age Bracket | Male | Female |
| Under 5 Years | 473 (5.8%) | 556 (8.5%) |
| 5 to 9 Years | 1,541 (18.9%) | 428 (6.5%) |
| 10 to 14 Years | 469 (5.7%) | 576 (8.8%) |
| 15 to 19 Years | 523 (6.4%) | 318 (4.8%) |
| 20 to 24 Years | 433 (5.3%) | 334 (5.1%) |
| 25 to 29 Years | 448 (5.5%) | 305 (4.6%) |
| 30 to 34 Years | 471 (5.8%) | 286 (4.3%) |
| 35 to 39 Years | 783 (9.6%) | 499 (7.6%) |
| 40 to 44 Years | 362 (4.4%) | 753 (11.5%) |
| 45 to 49 Years | 503 (6.2%) | 465 (7.1%) |
| 50 to 54 Years | 523 (6.4%) | 274 (4.2%) |
| 55 to 59 Years | 290 (3.5%) | 346 (5.3%) |
| 60 to 64 Years | 210 (2.6%) | 186 (2.8%) |
| 65 to 69 Years | 378 (4.6%) | 367 (5.6%) |
| 70 to 74 Years | 199 (2.4%) | 392 (6.0%) |
| 75 to 79 Years | 416 (5.1%) | 225 (3.4%) |
| 80 to 84 Years | 81 (1.0%) | 162 (2.5%) |
| 85 Years and over | 67 (0.8%) | 99 (1.5%) |
| Total | 8,170 (100.0%) | 6,571 (100.0%) |
Families and Households in Lilburn
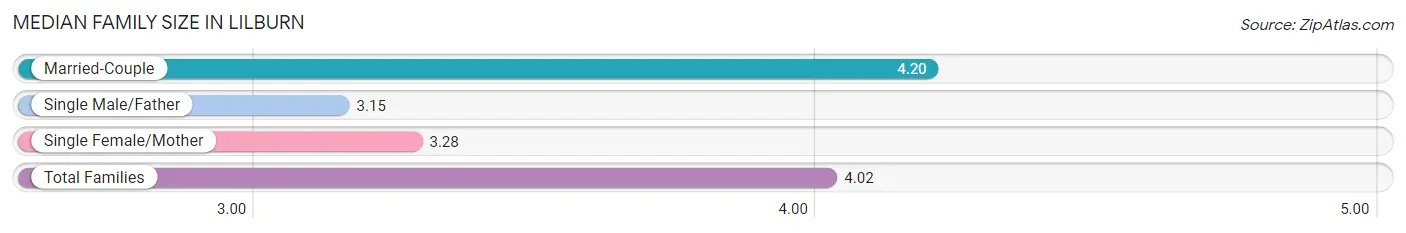
Median Family Size in Lilburn
The median family size in Lilburn is 4.02 persons per family, with married-couple families (2,441 | 81.8%) accounting for the largest median family size of 4.2 persons per family. On the other hand, single male/father families (220 | 7.4%) represent the smallest median family size with 3.15 persons per family.
| Family Type | # Families | Family Size |
| Married-Couple | 2,441 (81.8%) | 4.20 |
| Single Male/Father | 220 (7.4%) | 3.15 |
| Single Female/Mother | 324 (10.8%) | 3.28 |
| Total Families | 2,985 (100.0%) | 4.02 |
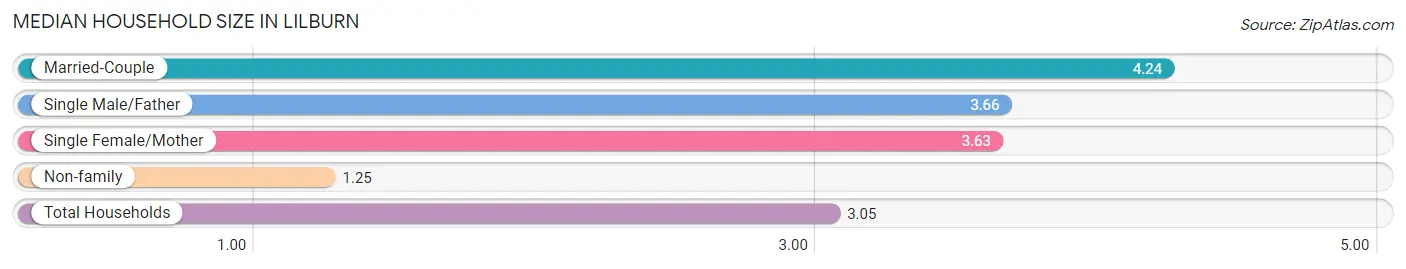
Median Household Size in Lilburn
The median household size in Lilburn is 3.05 persons per household, with married-couple households (2,441 | 50.9%) accounting for the largest median household size of 4.24 persons per household. non-family households (1,806 | 37.7%) represent the smallest median household size with 1.25 persons per household.
| Household Type | # Households | Household Size |
| Married-Couple | 2,441 (50.9%) | 4.24 |
| Single Male/Father | 220 (4.6%) | 3.66 |
| Single Female/Mother | 324 (6.8%) | 3.63 |
| Non-family | 1,806 (37.7%) | 1.25 |
| Total Households | 4,791 (100.0%) | 3.05 |
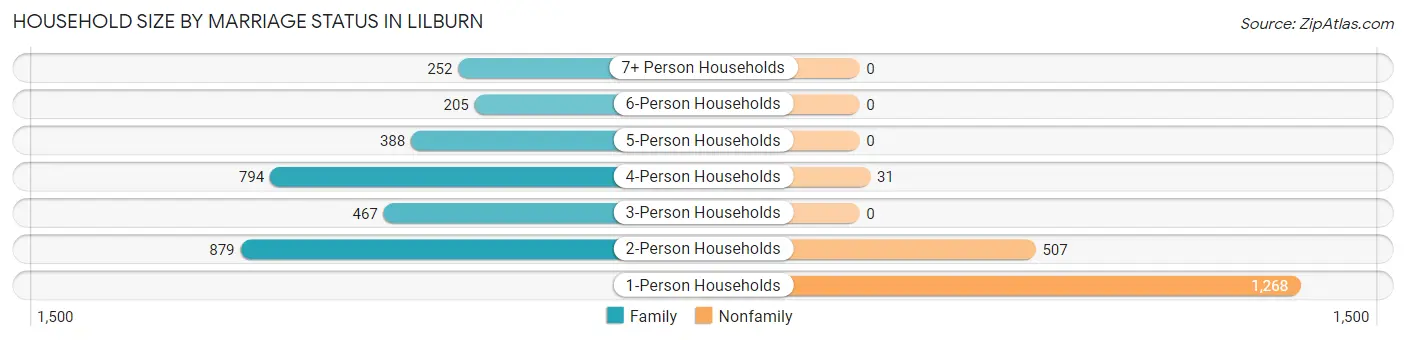
Household Size by Marriage Status in Lilburn
Out of a total of 4,791 households in Lilburn, 2,985 (62.3%) are family households, while 1,806 (37.7%) are nonfamily households. The most numerous type of family households are 2-person households, comprising 879, and the most common type of nonfamily households are 1-person households, comprising 1,268.
| Household Size | Family Households | Nonfamily Households |
| 1-Person Households | - | 1,268 (26.5%) |
| 2-Person Households | 879 (18.3%) | 507 (10.6%) |
| 3-Person Households | 467 (9.8%) | 0 (0.0%) |
| 4-Person Households | 794 (16.6%) | 31 (0.6%) |
| 5-Person Households | 388 (8.1%) | 0 (0.0%) |
| 6-Person Households | 205 (4.3%) | 0 (0.0%) |
| 7+ Person Households | 252 (5.3%) | 0 (0.0%) |
| Total | 2,985 (62.3%) | 1,806 (37.7%) |
Female Fertility in Lilburn
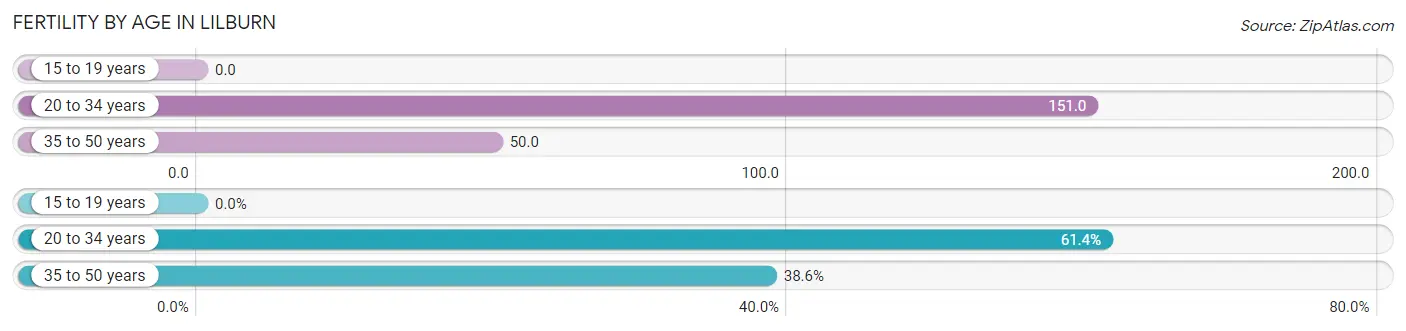
Fertility by Age in Lilburn
Average fertility rate in Lilburn is 76.0 births per 1,000 women. Women in the age bracket of 20 to 34 years have the highest fertility rate with 151.0 births per 1,000 women. Women in the age bracket of 20 to 34 years acount for 61.4% of all women with births.
| Age Bracket | Women with Births | Births / 1,000 Women |
| 15 to 19 years | 0 (0.0%) | 0.0 |
| 20 to 34 years | 140 (61.4%) | 151.0 |
| 35 to 50 years | 88 (38.6%) | 50.0 |
| Total | 228 (100.0%) | 76.0 |
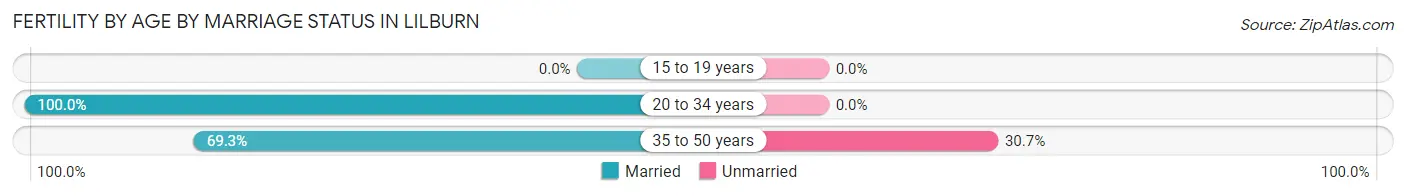
Fertility by Age by Marriage Status in Lilburn
88.2% of women with births (228) in Lilburn are married. The highest percentage of unmarried women with births falls into 35 to 50 years age bracket with 30.7% of them unmarried at the time of birth, while the lowest percentage of unmarried women with births belong to 20 to 34 years age bracket with 0.0% of them unmarried.
| Age Bracket | Married | Unmarried |
| 15 to 19 years | 0 (0.0%) | 0 (0.0%) |
| 20 to 34 years | 140 (100.0%) | 0 (0.0%) |
| 35 to 50 years | 61 (69.3%) | 27 (30.7%) |
| Total | 201 (88.2%) | 27 (11.8%) |
Fertility by Education in Lilburn
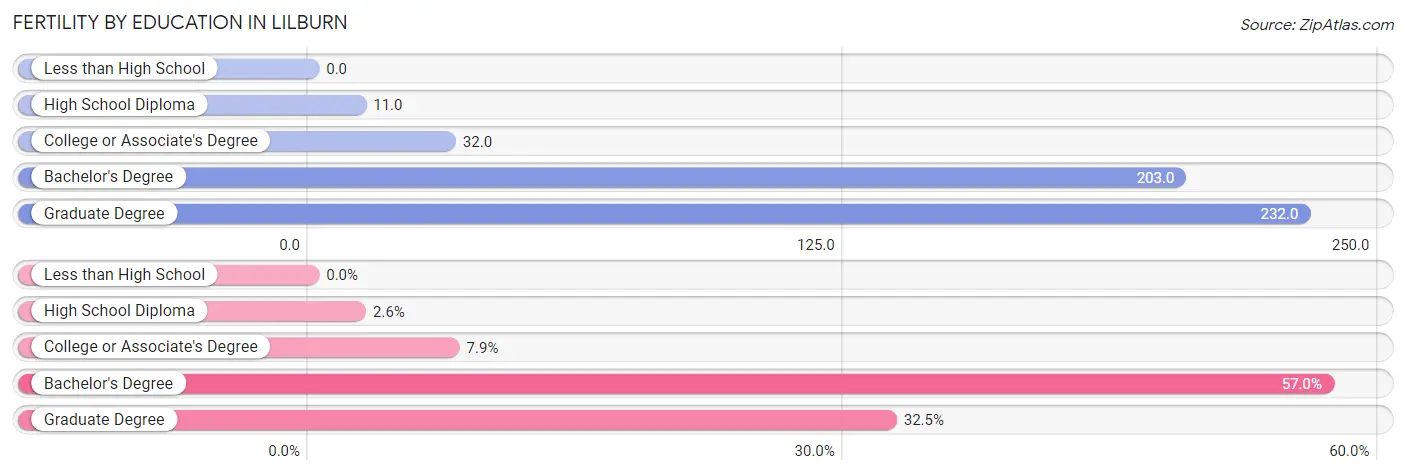
| Educational Attainment | Women with Births | Births / 1,000 Women |
| Less than High School | 0 (0.0%) | 0.0 |
| High School Diploma | 6 (2.6%) | 11.0 |
| College or Associate's Degree | 18 (7.9%) | 32.0 |
| Bachelor's Degree | 130 (57.0%) | 203.0 |
| Graduate Degree | 74 (32.5%) | 232.0 |
| Total | 228 (100.0%) | 76.0 |
Fertility by Education by Marriage Status in Lilburn
11.8% of women with births in Lilburn are unmarried. Women with the educational attainment of high school diploma are most likely to be married with 100.0% of them married at childbirth, while women with the educational attainment of college or associate's degree are least likely to be married with 100.0% of them unmarried at childbirth.
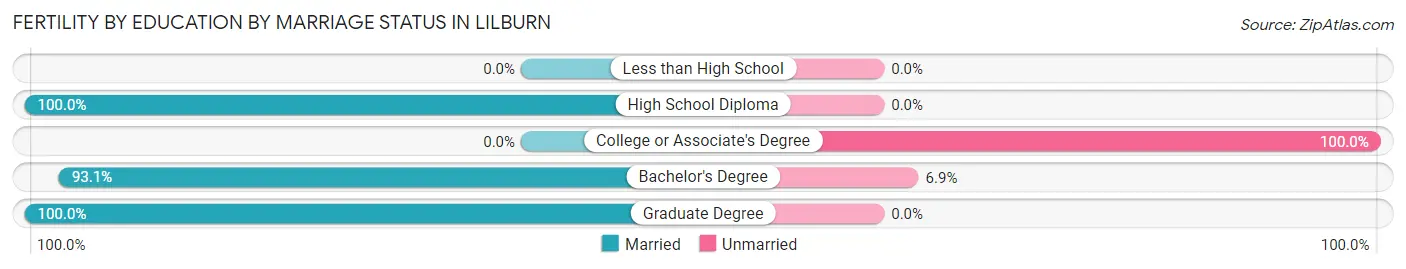
| Educational Attainment | Married | Unmarried |
| Less than High School | 0 (0.0%) | 0 (0.0%) |
| High School Diploma | 6 (100.0%) | 0 (0.0%) |
| College or Associate's Degree | 0 (0.0%) | 18 (100.0%) |
| Bachelor's Degree | 121 (93.1%) | 9 (6.9%) |
| Graduate Degree | 74 (100.0%) | 0 (0.0%) |
| Total | 201 (88.2%) | 27 (11.8%) |
Employment Characteristics in Lilburn
Employment by Class of Employer in Lilburn
Among the 5,813 employed individuals in Lilburn, private company employees (4,446 | 76.5%), not-for-profit organizations (351 | 6.0%), and self-employed (incorporated) (335 | 5.8%) make up the most common classes of employment.
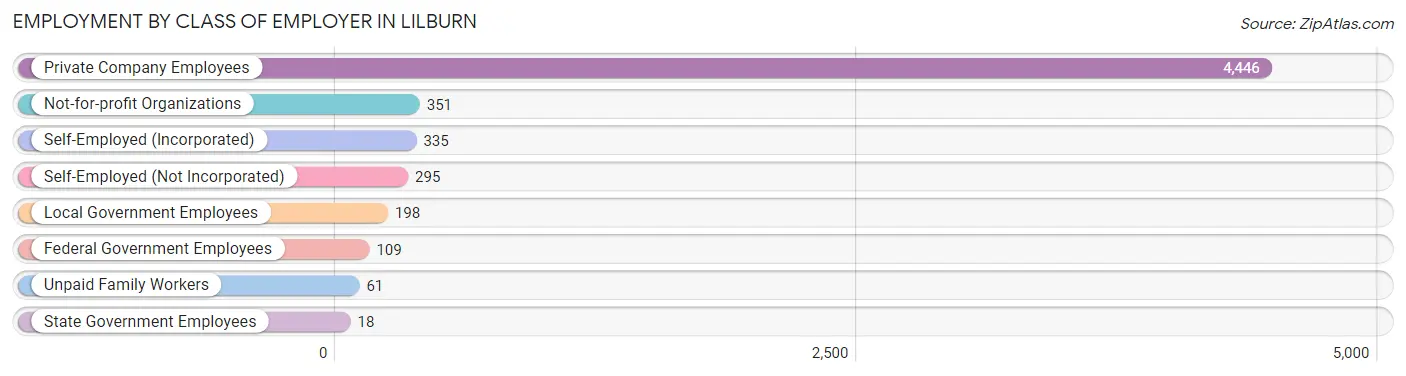
| Employer Class | # Employees | % Employees |
| Private Company Employees | 4,446 | 76.5% |
| Self-Employed (Incorporated) | 335 | 5.8% |
| Self-Employed (Not Incorporated) | 295 | 5.1% |
| Not-for-profit Organizations | 351 | 6.0% |
| Local Government Employees | 198 | 3.4% |
| State Government Employees | 18 | 0.3% |
| Federal Government Employees | 109 | 1.9% |
| Unpaid Family Workers | 61 | 1.1% |
| Total | 5,813 | 100.0% |
Employment Status by Age in Lilburn
According to the labor force statistics for Lilburn, out of the total population over 16 years of age (10,555), 62.5% or 6,597 individuals are in the labor force, with 4.6% or 303 of them unemployed. The age group with the highest labor force participation rate is 45 to 54 years, with 83.4% or 1,472 individuals in the labor force. Within the labor force, the 25 to 29 years age range has the highest percentage of unemployed individuals, with 11.5% or 72 of them being unemployed.
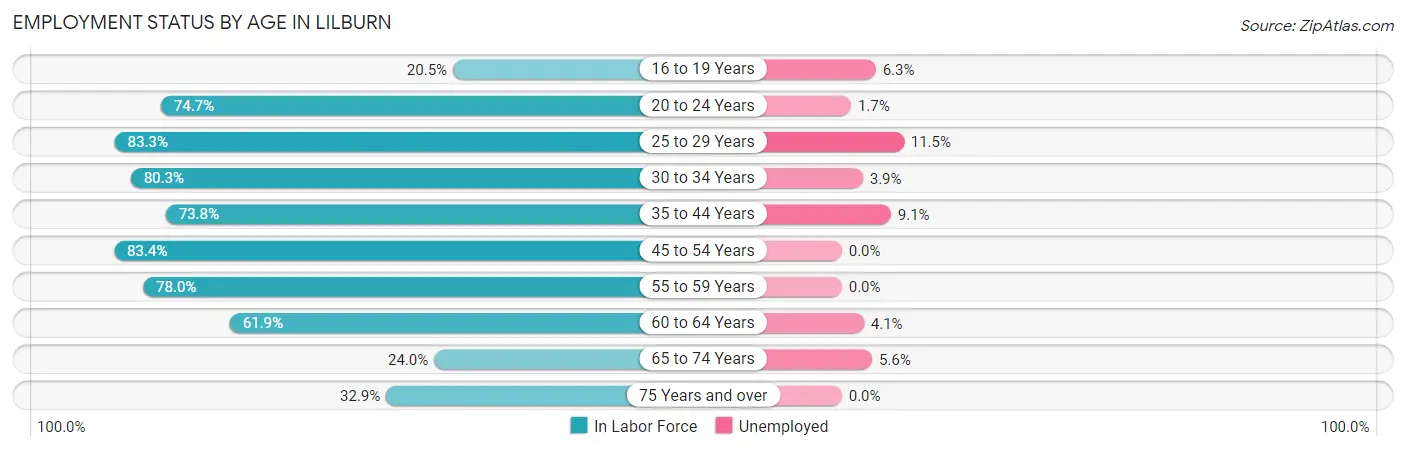
| Age Bracket | In Labor Force | Unemployed |
| 16 to 19 Years | 143 (20.5%) | 9 (6.3%) |
| 20 to 24 Years | 573 (74.7%) | 10 (1.7%) |
| 25 to 29 Years | 627 (83.3%) | 72 (11.5%) |
| 30 to 34 Years | 608 (80.3%) | 24 (3.9%) |
| 35 to 44 Years | 1,769 (73.8%) | 161 (9.1%) |
| 45 to 54 Years | 1,472 (83.4%) | 0 (0.0%) |
| 55 to 59 Years | 496 (78.0%) | 0 (0.0%) |
| 60 to 64 Years | 245 (61.9%) | 10 (4.1%) |
| 65 to 74 Years | 321 (24.0%) | 18 (5.6%) |
| 75 Years and over | 345 (32.9%) | 0 (0.0%) |
| Total | 6,597 (62.5%) | 303 (4.6%) |
Employment Status by Educational Attainment in Lilburn
According to labor force statistics for Lilburn, 77.8% of individuals (5,216) out of the total population between 25 and 64 years of age (6,704) are in the labor force, with 5.1% or 266 of them being unemployed. The group with the highest labor force participation rate are those with the educational attainment of bachelor's degree or higher, with 88.0% or 1,731 individuals in the labor force. Within the labor force, individuals with college / associate degree education have the highest percentage of unemployment, with 8.6% or 103 of them being unemployed.
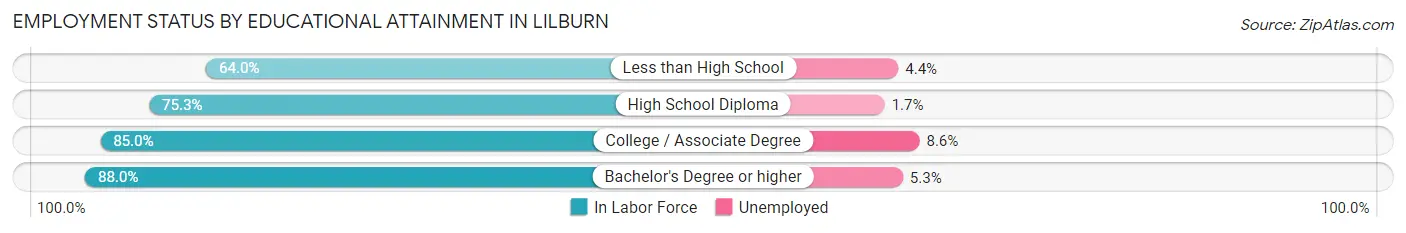
| Educational Attainment | In Labor Force | Unemployed |
| Less than High School | 1,241 (64.0%) | 85 (4.4%) |
| High School Diploma | 1,041 (75.3%) | 24 (1.7%) |
| College / Associate Degree | 1,203 (85.0%) | 122 (8.6%) |
| Bachelor's Degree or higher | 1,731 (88.0%) | 104 (5.3%) |
| Total | 5,216 (77.8%) | 342 (5.1%) |
Employment Occupations by Sex in Lilburn
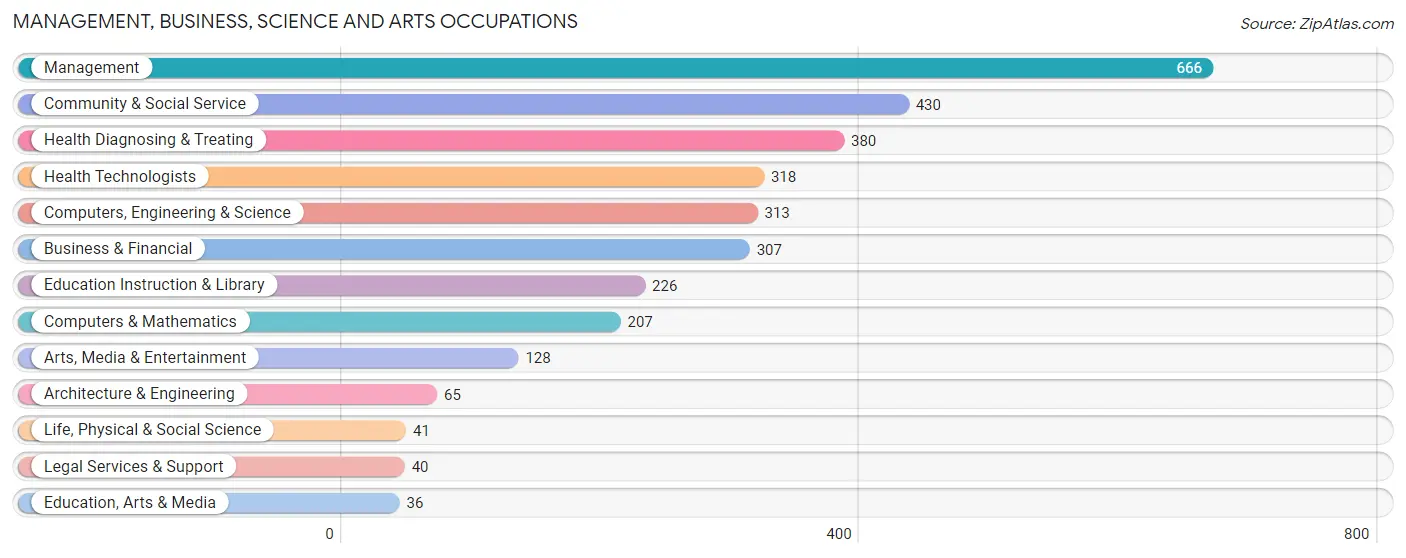
Management, Business, Science and Arts Occupations
The most common Management, Business, Science and Arts occupations in Lilburn are Management (666 | 10.6%), Community & Social Service (430 | 6.8%), Health Diagnosing & Treating (380 | 6.0%), Health Technologists (318 | 5.1%), and Computers, Engineering & Science (313 | 5.0%).
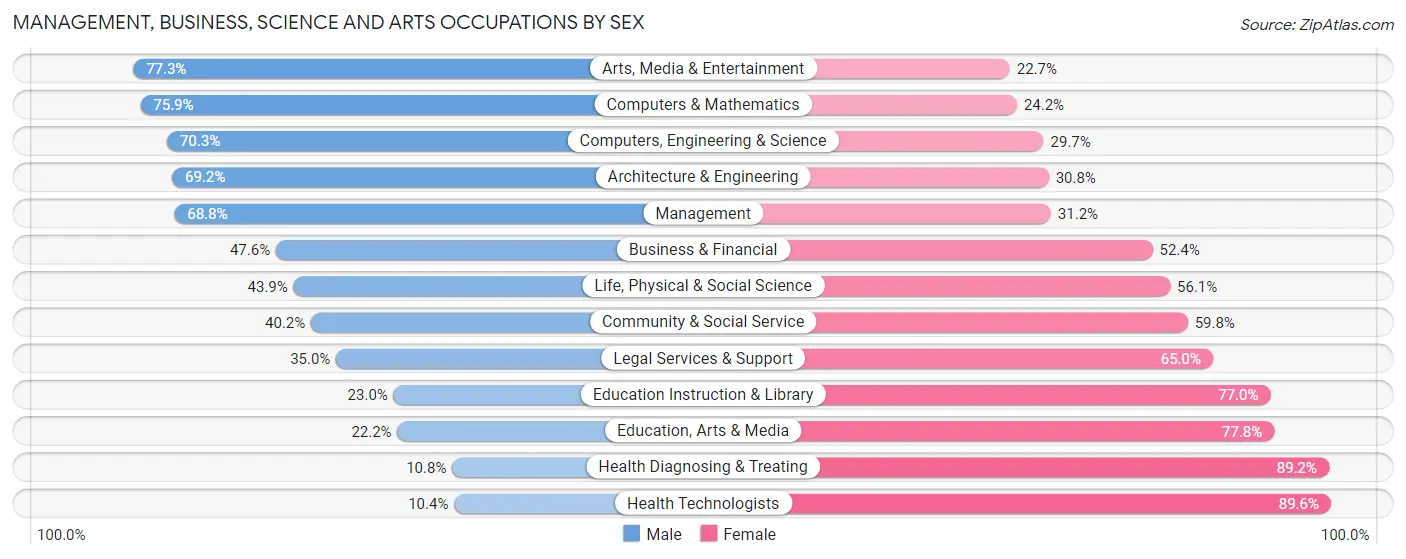
Management, Business, Science and Arts Occupations by Sex
Within the Management, Business, Science and Arts occupations in Lilburn, the most male-oriented occupations are Arts, Media & Entertainment (77.3%), Computers & Mathematics (75.8%), and Computers, Engineering & Science (70.3%), while the most female-oriented occupations are Health Technologists (89.6%), Health Diagnosing & Treating (89.2%), and Education, Arts & Media (77.8%).
| Occupation | Male | Female |
| Management | 458 (68.8%) | 208 (31.2%) |
| Business & Financial | 146 (47.6%) | 161 (52.4%) |
| Computers, Engineering & Science | 220 (70.3%) | 93 (29.7%) |
| Computers & Mathematics | 157 (75.8%) | 50 (24.1%) |
| Architecture & Engineering | 45 (69.2%) | 20 (30.8%) |
| Life, Physical & Social Science | 18 (43.9%) | 23 (56.1%) |
| Community & Social Service | 173 (40.2%) | 257 (59.8%) |
| Education, Arts & Media | 8 (22.2%) | 28 (77.8%) |
| Legal Services & Support | 14 (35.0%) | 26 (65.0%) |
| Education Instruction & Library | 52 (23.0%) | 174 (77.0%) |
| Arts, Media & Entertainment | 99 (77.3%) | 29 (22.7%) |
| Health Diagnosing & Treating | 41 (10.8%) | 339 (89.2%) |
| Health Technologists | 33 (10.4%) | 285 (89.6%) |
| Total (Category) | 1,038 (49.5%) | 1,058 (50.5%) |
| Total (Overall) | 3,984 (63.3%) | 2,310 (36.7%) |
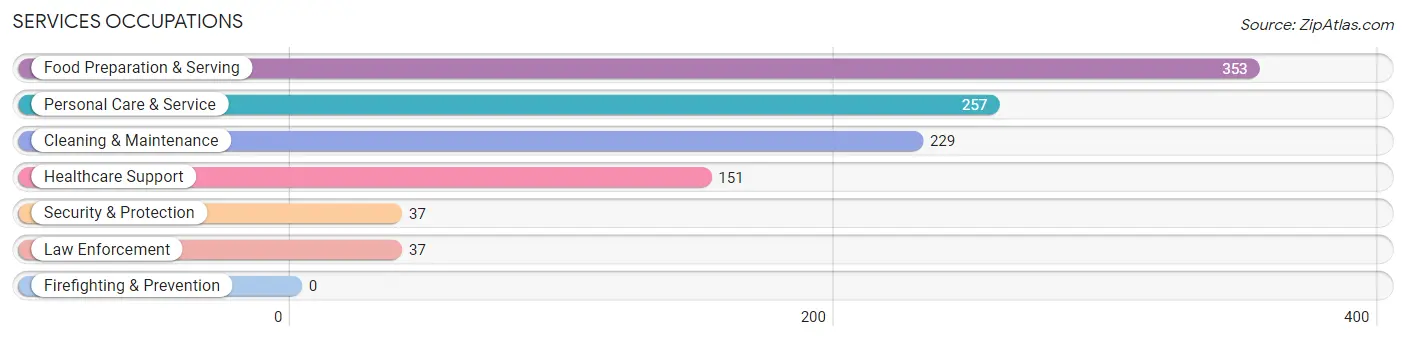
Services Occupations
The most common Services occupations in Lilburn are Food Preparation & Serving (353 | 5.6%), Personal Care & Service (257 | 4.1%), Cleaning & Maintenance (229 | 3.6%), Healthcare Support (151 | 2.4%), and Security & Protection (37 | 0.6%).
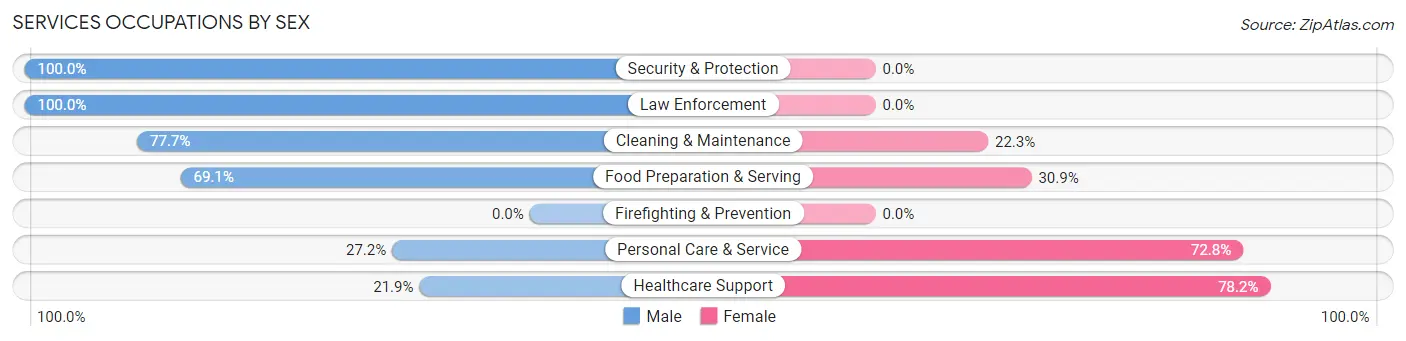
Services Occupations by Sex
Within the Services occupations in Lilburn, the most male-oriented occupations are Security & Protection (100.0%), Law Enforcement (100.0%), and Cleaning & Maintenance (77.7%), while the most female-oriented occupations are Healthcare Support (78.1%), Personal Care & Service (72.8%), and Food Preparation & Serving (30.9%).
| Occupation | Male | Female |
| Healthcare Support | 33 (21.8%) | 118 (78.1%) |
| Security & Protection | 37 (100.0%) | 0 (0.0%) |
| Firefighting & Prevention | 0 (0.0%) | 0 (0.0%) |
| Law Enforcement | 37 (100.0%) | 0 (0.0%) |
| Food Preparation & Serving | 244 (69.1%) | 109 (30.9%) |
| Cleaning & Maintenance | 178 (77.7%) | 51 (22.3%) |
| Personal Care & Service | 70 (27.2%) | 187 (72.8%) |
| Total (Category) | 562 (54.7%) | 465 (45.3%) |
| Total (Overall) | 3,984 (63.3%) | 2,310 (36.7%) |
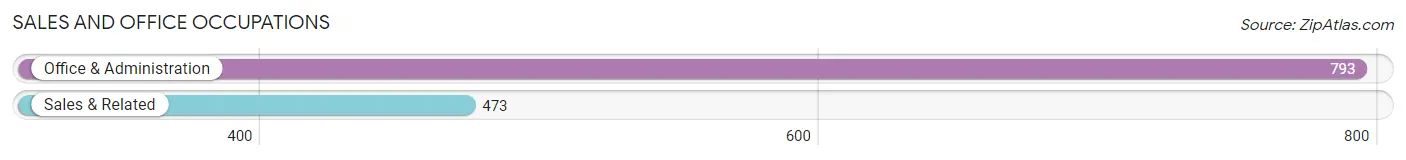
Sales and Office Occupations
The most common Sales and Office occupations in Lilburn are Office & Administration (793 | 12.6%), and Sales & Related (473 | 7.5%).
Sales and Office Occupations by Sex
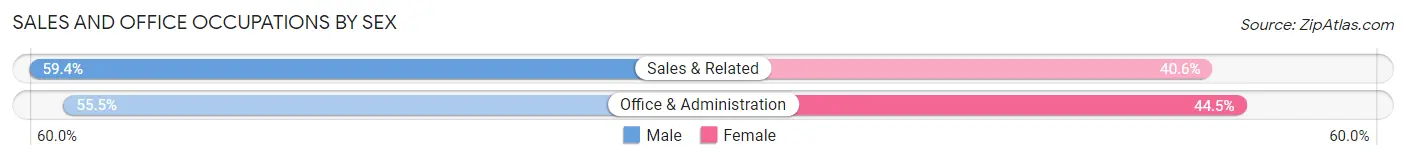
| Occupation | Male | Female |
| Sales & Related | 281 (59.4%) | 192 (40.6%) |
| Office & Administration | 440 (55.5%) | 353 (44.5%) |
| Total (Category) | 721 (57.0%) | 545 (43.0%) |
| Total (Overall) | 3,984 (63.3%) | 2,310 (36.7%) |
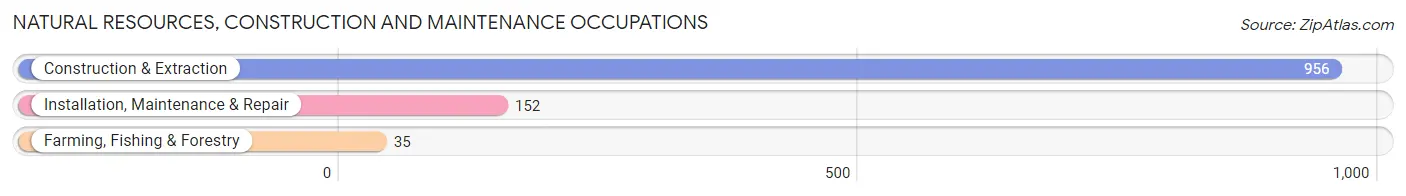
Natural Resources, Construction and Maintenance Occupations
The most common Natural Resources, Construction and Maintenance occupations in Lilburn are Construction & Extraction (956 | 15.2%), Installation, Maintenance & Repair (152 | 2.4%), and Farming, Fishing & Forestry (35 | 0.6%).
Natural Resources, Construction and Maintenance Occupations by Sex
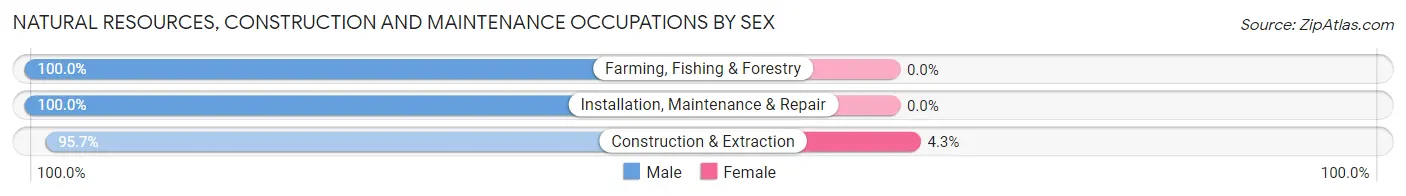
| Occupation | Male | Female |
| Farming, Fishing & Forestry | 35 (100.0%) | 0 (0.0%) |
| Construction & Extraction | 915 (95.7%) | 41 (4.3%) |
| Installation, Maintenance & Repair | 152 (100.0%) | 0 (0.0%) |
| Total (Category) | 1,102 (96.4%) | 41 (3.6%) |
| Total (Overall) | 3,984 (63.3%) | 2,310 (36.7%) |
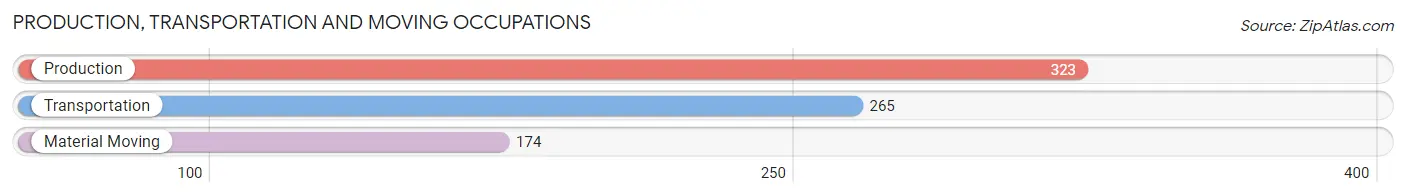
Production, Transportation and Moving Occupations
The most common Production, Transportation and Moving occupations in Lilburn are Production (323 | 5.1%), Transportation (265 | 4.2%), and Material Moving (174 | 2.8%).
Production, Transportation and Moving Occupations by Sex
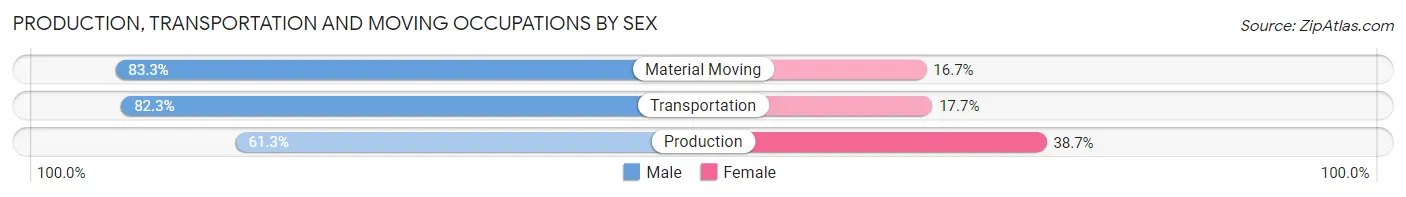
| Occupation | Male | Female |
| Production | 198 (61.3%) | 125 (38.7%) |
| Transportation | 218 (82.3%) | 47 (17.7%) |
| Material Moving | 145 (83.3%) | 29 (16.7%) |
| Total (Category) | 561 (73.6%) | 201 (26.4%) |
| Total (Overall) | 3,984 (63.3%) | 2,310 (36.7%) |
Employment Industries by Sex in Lilburn
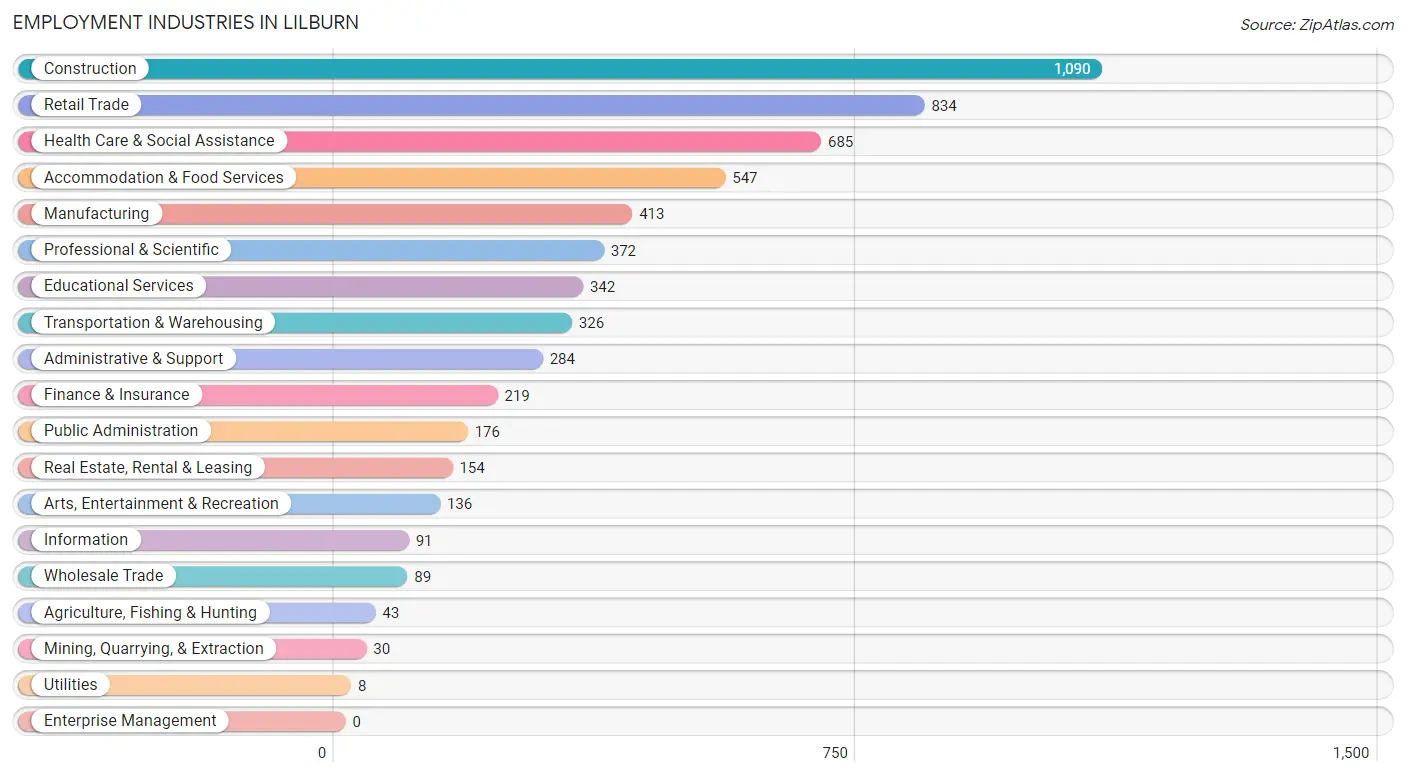
Employment Industries in Lilburn
The major employment industries in Lilburn include Construction (1,090 | 17.3%), Retail Trade (834 | 13.3%), Health Care & Social Assistance (685 | 10.9%), Accommodation & Food Services (547 | 8.7%), and Manufacturing (413 | 6.6%).
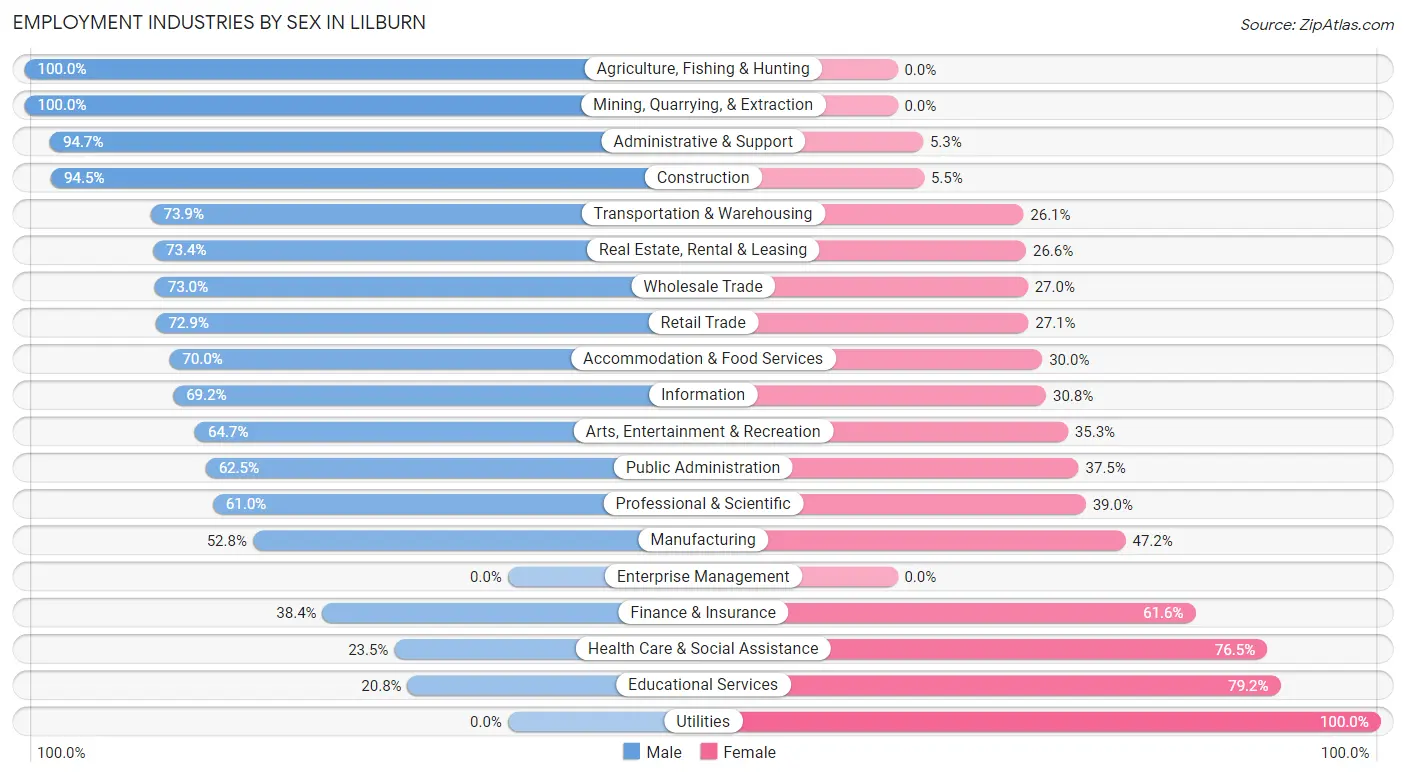
Employment Industries by Sex in Lilburn
The Lilburn industries that see more men than women are Agriculture, Fishing & Hunting (100.0%), Mining, Quarrying, & Extraction (100.0%), and Administrative & Support (94.7%), whereas the industries that tend to have a higher number of women are Utilities (100.0%), Educational Services (79.2%), and Health Care & Social Assistance (76.5%).
| Industry | Male | Female |
| Agriculture, Fishing & Hunting | 43 (100.0%) | 0 (0.0%) |
| Mining, Quarrying, & Extraction | 30 (100.0%) | 0 (0.0%) |
| Construction | 1,030 (94.5%) | 60 (5.5%) |
| Manufacturing | 218 (52.8%) | 195 (47.2%) |
| Wholesale Trade | 65 (73.0%) | 24 (27.0%) |
| Retail Trade | 608 (72.9%) | 226 (27.1%) |
| Transportation & Warehousing | 241 (73.9%) | 85 (26.1%) |
| Utilities | 0 (0.0%) | 8 (100.0%) |
| Information | 63 (69.2%) | 28 (30.8%) |
| Finance & Insurance | 84 (38.4%) | 135 (61.6%) |
| Real Estate, Rental & Leasing | 113 (73.4%) | 41 (26.6%) |
| Professional & Scientific | 227 (61.0%) | 145 (39.0%) |
| Enterprise Management | 0 (0.0%) | 0 (0.0%) |
| Administrative & Support | 269 (94.7%) | 15 (5.3%) |
| Educational Services | 71 (20.8%) | 271 (79.2%) |
| Health Care & Social Assistance | 161 (23.5%) | 524 (76.5%) |
| Arts, Entertainment & Recreation | 88 (64.7%) | 48 (35.3%) |
| Accommodation & Food Services | 383 (70.0%) | 164 (30.0%) |
| Public Administration | 110 (62.5%) | 66 (37.5%) |
| Total | 3,984 (63.3%) | 2,310 (36.7%) |
Education in Lilburn
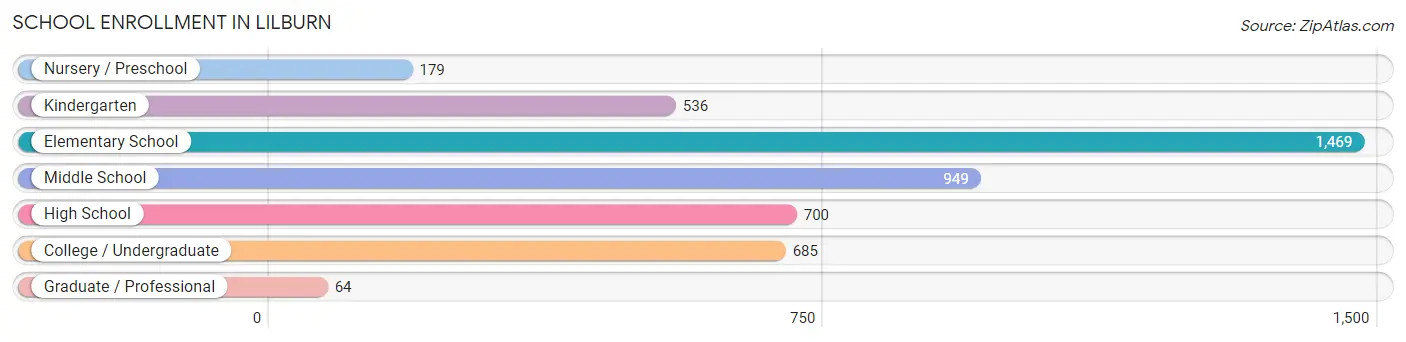
School Enrollment in Lilburn
The most common levels of schooling among the 4,582 students in Lilburn are elementary school (1,469 | 32.1%), middle school (949 | 20.7%), and high school (700 | 15.3%).
| School Level | # Students | % Students |
| Nursery / Preschool | 179 | 3.9% |
| Kindergarten | 536 | 11.7% |
| Elementary School | 1,469 | 32.1% |
| Middle School | 949 | 20.7% |
| High School | 700 | 15.3% |
| College / Undergraduate | 685 | 14.9% |
| Graduate / Professional | 64 | 1.4% |
| Total | 4,582 | 100.0% |
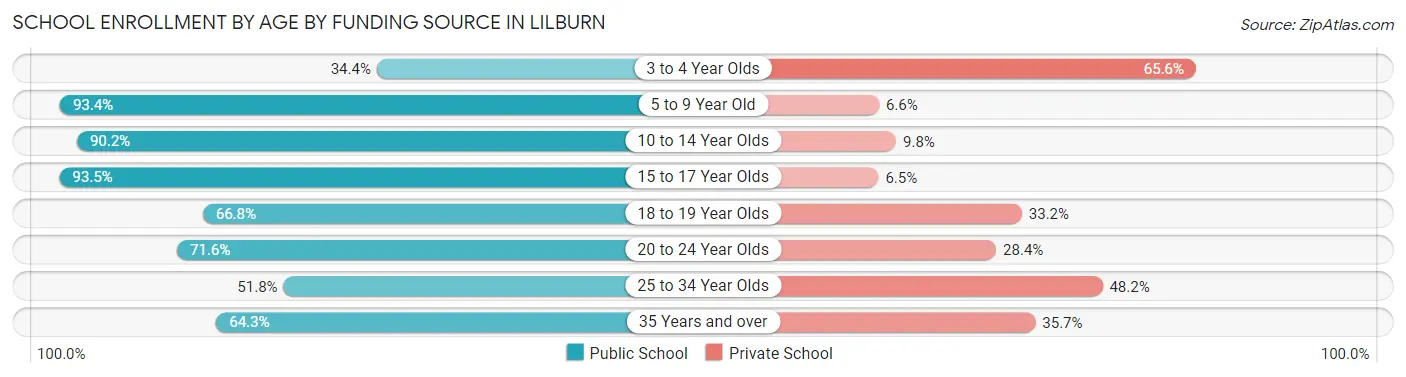
School Enrollment by Age by Funding Source in Lilburn
Out of a total of 4,582 students who are enrolled in schools in Lilburn, 687 (15.0%) attend a private institution, while the remaining 3,895 (85.0%) are enrolled in public schools. The age group of 3 to 4 year olds has the highest likelihood of being enrolled in private schools, with 122 (65.6% in the age bracket) enrolled. Conversely, the age group of 15 to 17 year olds has the lowest likelihood of being enrolled in a private school, with 533 (93.5% in the age bracket) attending a public institution.
| Age Bracket | Public School | Private School |
| 3 to 4 Year Olds | 64 (34.4%) | 122 (65.6%) |
| 5 to 9 Year Old | 1,787 (93.4%) | 126 (6.6%) |
| 10 to 14 Year Olds | 943 (90.2%) | 102 (9.8%) |
| 15 to 17 Year Olds | 533 (93.5%) | 37 (6.5%) |
| 18 to 19 Year Olds | 151 (66.8%) | 75 (33.2%) |
| 20 to 24 Year Olds | 179 (71.6%) | 71 (28.4%) |
| 25 to 34 Year Olds | 58 (51.8%) | 54 (48.2%) |
| 35 Years and over | 180 (64.3%) | 100 (35.7%) |
| Total | 3,895 (85.0%) | 687 (15.0%) |
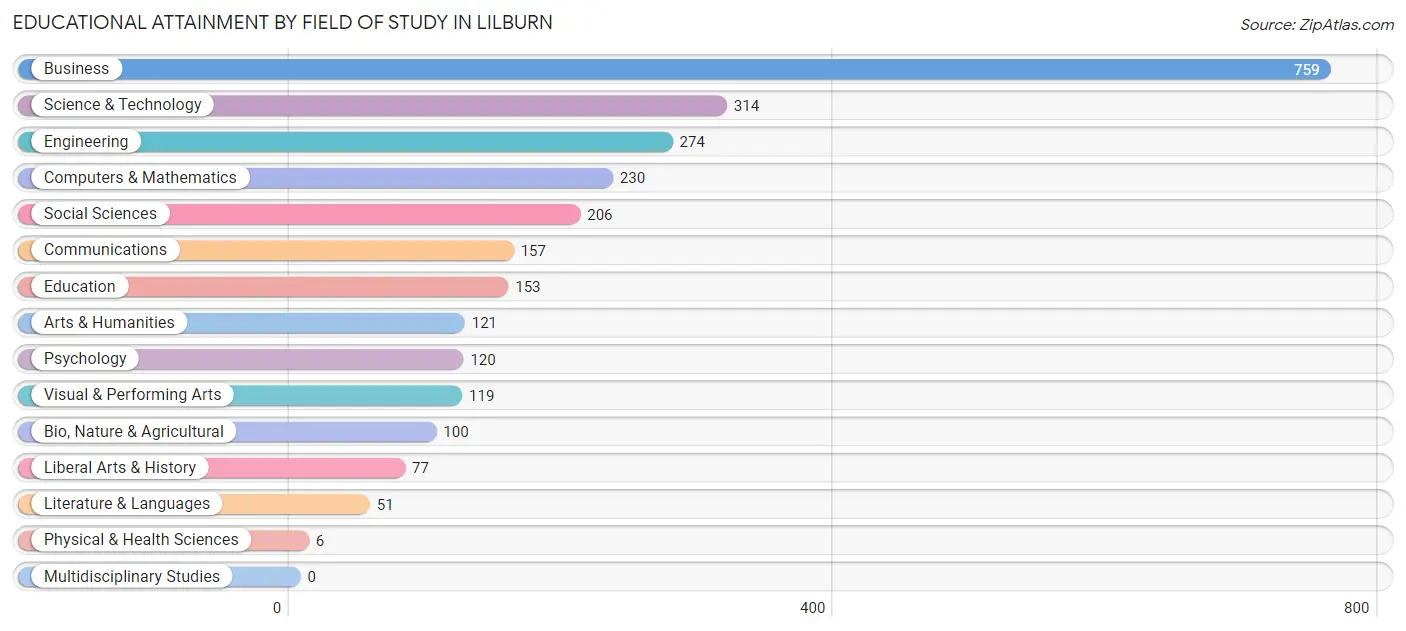
Educational Attainment by Field of Study in Lilburn
Business (759 | 28.2%), science & technology (314 | 11.7%), engineering (274 | 10.2%), computers & mathematics (230 | 8.6%), and social sciences (206 | 7.7%) are the most common fields of study among 2,687 individuals in Lilburn who have obtained a bachelor's degree or higher.
| Field of Study | # Graduates | % Graduates |
| Computers & Mathematics | 230 | 8.6% |
| Bio, Nature & Agricultural | 100 | 3.7% |
| Physical & Health Sciences | 6 | 0.2% |
| Psychology | 120 | 4.5% |
| Social Sciences | 206 | 7.7% |
| Engineering | 274 | 10.2% |
| Multidisciplinary Studies | 0 | 0.0% |
| Science & Technology | 314 | 11.7% |
| Business | 759 | 28.2% |
| Education | 153 | 5.7% |
| Literature & Languages | 51 | 1.9% |
| Liberal Arts & History | 77 | 2.9% |
| Visual & Performing Arts | 119 | 4.4% |
| Communications | 157 | 5.8% |
| Arts & Humanities | 121 | 4.5% |
| Total | 2,687 | 100.0% |
Transportation & Commute in Lilburn
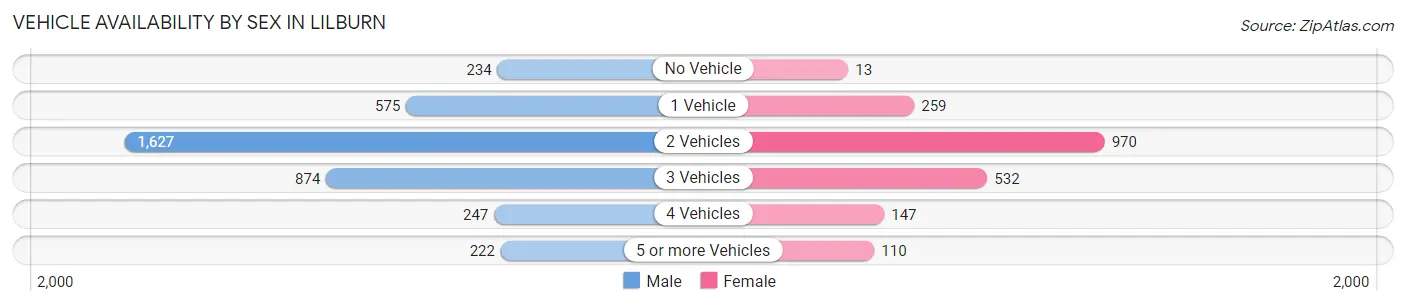
Vehicle Availability by Sex in Lilburn
The most prevalent vehicle ownership categories in Lilburn are males with 2 vehicles (1,627, accounting for 43.0%) and females with 2 vehicles (970, making up 80.1%).
| Vehicles Available | Male | Female |
| No Vehicle | 234 (6.2%) | 13 (0.6%) |
| 1 Vehicle | 575 (15.2%) | 259 (12.8%) |
| 2 Vehicles | 1,627 (43.0%) | 970 (47.8%) |
| 3 Vehicles | 874 (23.1%) | 532 (26.2%) |
| 4 Vehicles | 247 (6.5%) | 147 (7.2%) |
| 5 or more Vehicles | 222 (5.9%) | 110 (5.4%) |
| Total | 3,779 (100.0%) | 2,031 (100.0%) |
Commute Time in Lilburn
The most frequently occuring commute durations in Lilburn are 30 to 34 minutes (1,311 commuters, 24.2%), 15 to 19 minutes (787 commuters, 14.5%), and 60 to 89 minutes (586 commuters, 10.8%).
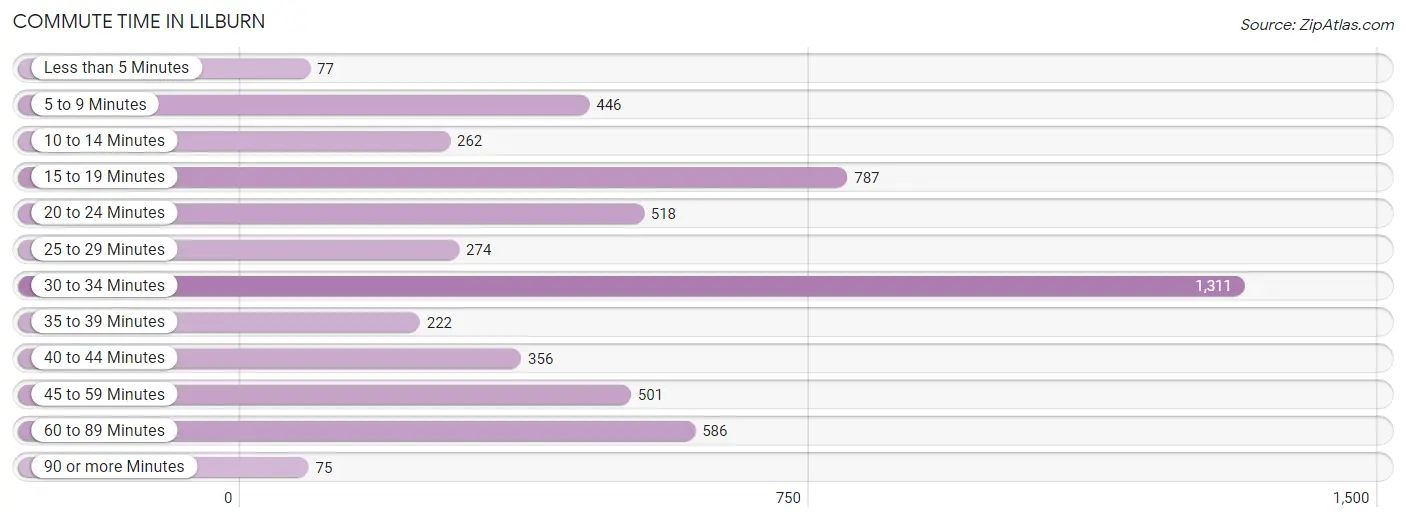
| Commute Time | # Commuters | % Commuters |
| Less than 5 Minutes | 77 | 1.4% |
| 5 to 9 Minutes | 446 | 8.2% |
| 10 to 14 Minutes | 262 | 4.8% |
| 15 to 19 Minutes | 787 | 14.5% |
| 20 to 24 Minutes | 518 | 9.6% |
| 25 to 29 Minutes | 274 | 5.1% |
| 30 to 34 Minutes | 1,311 | 24.2% |
| 35 to 39 Minutes | 222 | 4.1% |
| 40 to 44 Minutes | 356 | 6.6% |
| 45 to 59 Minutes | 501 | 9.2% |
| 60 to 89 Minutes | 586 | 10.8% |
| 90 or more Minutes | 75 | 1.4% |
Commute Time by Sex in Lilburn
The most common commute times in Lilburn are 30 to 34 minutes (767 commuters, 21.5%) for males and 30 to 34 minutes (544 commuters, 29.5%) for females.
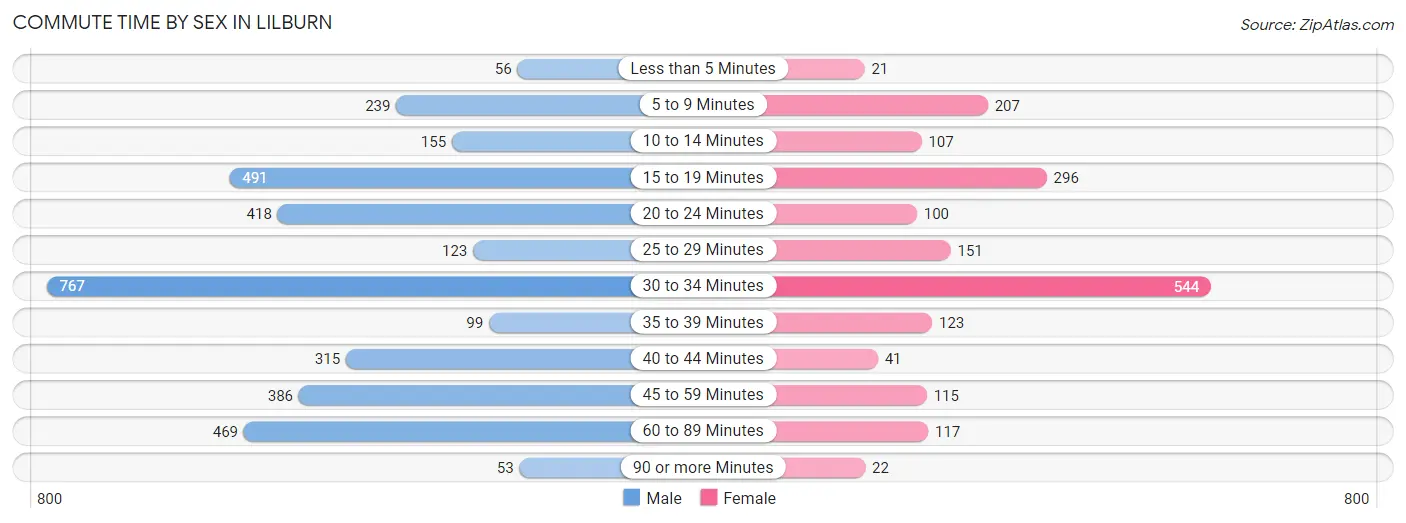
| Commute Time | Male | Female |
| Less than 5 Minutes | 56 (1.6%) | 21 (1.1%) |
| 5 to 9 Minutes | 239 (6.7%) | 207 (11.2%) |
| 10 to 14 Minutes | 155 (4.3%) | 107 (5.8%) |
| 15 to 19 Minutes | 491 (13.8%) | 296 (16.1%) |
| 20 to 24 Minutes | 418 (11.7%) | 100 (5.4%) |
| 25 to 29 Minutes | 123 (3.4%) | 151 (8.2%) |
| 30 to 34 Minutes | 767 (21.5%) | 544 (29.5%) |
| 35 to 39 Minutes | 99 (2.8%) | 123 (6.7%) |
| 40 to 44 Minutes | 315 (8.8%) | 41 (2.2%) |
| 45 to 59 Minutes | 386 (10.8%) | 115 (6.2%) |
| 60 to 89 Minutes | 469 (13.1%) | 117 (6.3%) |
| 90 or more Minutes | 53 (1.5%) | 22 (1.2%) |
Time of Departure to Work by Sex in Lilburn
The most frequent times of departure to work in Lilburn are 7:30 AM to 7:59 AM (804, 22.5%) for males and 8:00 AM to 8:29 AM (390, 21.1%) for females.
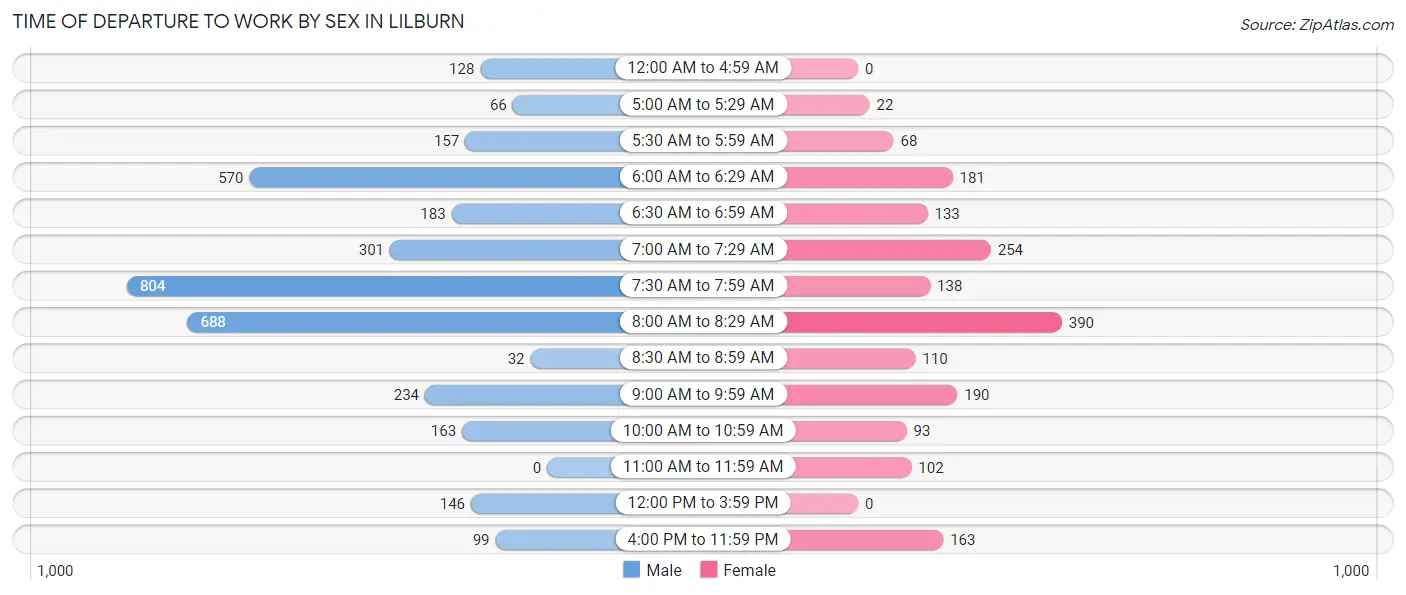
| Time of Departure | Male | Female |
| 12:00 AM to 4:59 AM | 128 (3.6%) | 0 (0.0%) |
| 5:00 AM to 5:29 AM | 66 (1.8%) | 22 (1.2%) |
| 5:30 AM to 5:59 AM | 157 (4.4%) | 68 (3.7%) |
| 6:00 AM to 6:29 AM | 570 (16.0%) | 181 (9.8%) |
| 6:30 AM to 6:59 AM | 183 (5.1%) | 133 (7.2%) |
| 7:00 AM to 7:29 AM | 301 (8.4%) | 254 (13.8%) |
| 7:30 AM to 7:59 AM | 804 (22.5%) | 138 (7.5%) |
| 8:00 AM to 8:29 AM | 688 (19.3%) | 390 (21.1%) |
| 8:30 AM to 8:59 AM | 32 (0.9%) | 110 (6.0%) |
| 9:00 AM to 9:59 AM | 234 (6.6%) | 190 (10.3%) |
| 10:00 AM to 10:59 AM | 163 (4.6%) | 93 (5.0%) |
| 11:00 AM to 11:59 AM | 0 (0.0%) | 102 (5.5%) |
| 12:00 PM to 3:59 PM | 146 (4.1%) | 0 (0.0%) |
| 4:00 PM to 11:59 PM | 99 (2.8%) | 163 (8.8%) |
| Total | 3,571 (100.0%) | 1,844 (100.0%) |
Housing Occupancy in Lilburn
Occupancy by Ownership in Lilburn
Of the total 4,791 dwellings in Lilburn, owner-occupied units account for 2,807 (58.6%), while renter-occupied units make up 1,984 (41.4%).
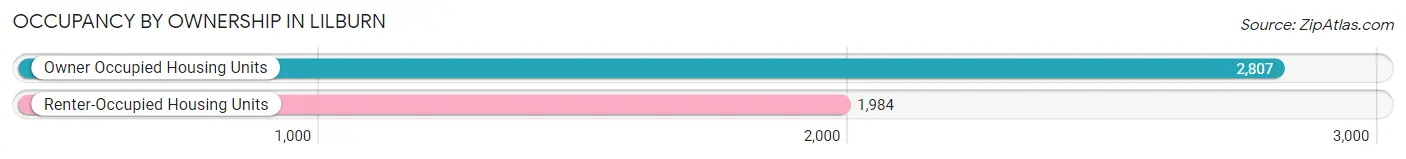
| Occupancy | # Housing Units | % Housing Units |
| Owner Occupied Housing Units | 2,807 | 58.6% |
| Renter-Occupied Housing Units | 1,984 | 41.4% |
| Total Occupied Housing Units | 4,791 | 100.0% |
Occupancy by Household Size in Lilburn
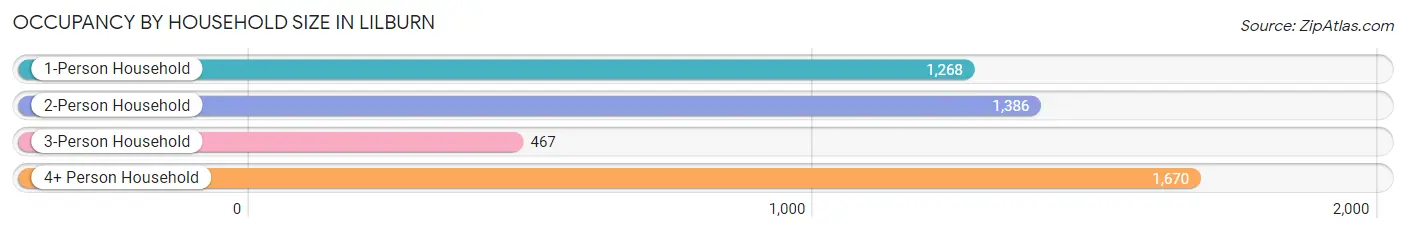
| Household Size | # Housing Units | % Housing Units |
| 1-Person Household | 1,268 | 26.5% |
| 2-Person Household | 1,386 | 28.9% |
| 3-Person Household | 467 | 9.8% |
| 4+ Person Household | 1,670 | 34.9% |
| Total Housing Units | 4,791 | 100.0% |
Occupancy by Ownership by Household Size in Lilburn
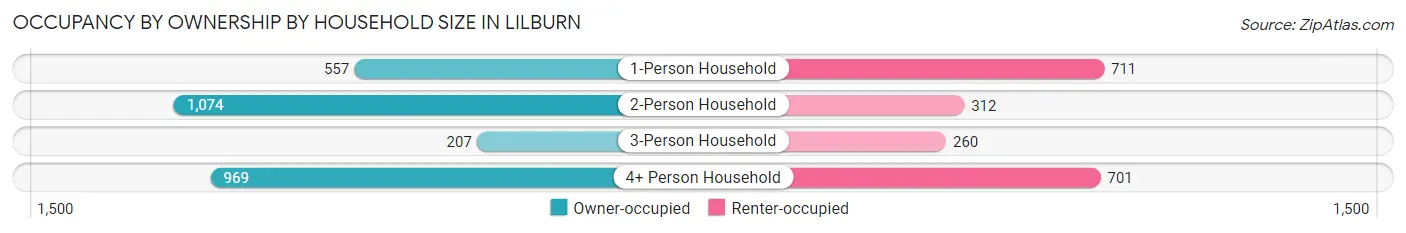
| Household Size | Owner-occupied | Renter-occupied |
| 1-Person Household | 557 (43.9%) | 711 (56.1%) |
| 2-Person Household | 1,074 (77.5%) | 312 (22.5%) |
| 3-Person Household | 207 (44.3%) | 260 (55.7%) |
| 4+ Person Household | 969 (58.0%) | 701 (42.0%) |
| Total Housing Units | 2,807 (58.6%) | 1,984 (41.4%) |
Occupancy by Educational Attainment in Lilburn

| Household Size | Owner-occupied | Renter-occupied |
| Less than High School | 353 (34.1%) | 681 (65.9%) |
| High School Diploma | 666 (49.6%) | 676 (50.4%) |
| College/Associate Degree | 702 (65.1%) | 376 (34.9%) |
| Bachelor's Degree or higher | 1,086 (81.2%) | 251 (18.8%) |
Occupancy by Age of Householder in Lilburn
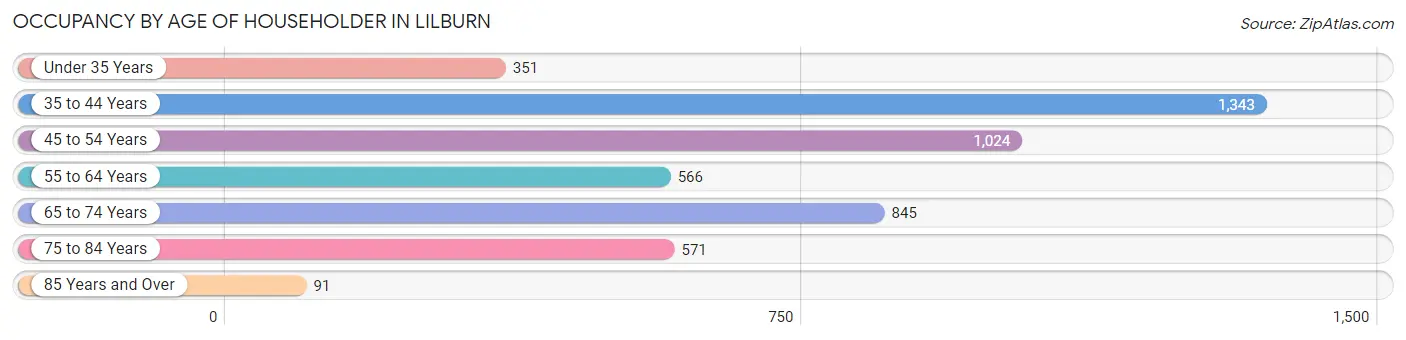
| Age Bracket | # Households | % Households |
| Under 35 Years | 351 | 7.3% |
| 35 to 44 Years | 1,343 | 28.0% |
| 45 to 54 Years | 1,024 | 21.4% |
| 55 to 64 Years | 566 | 11.8% |
| 65 to 74 Years | 845 | 17.6% |
| 75 to 84 Years | 571 | 11.9% |
| 85 Years and Over | 91 | 1.9% |
| Total | 4,791 | 100.0% |
Housing Finances in Lilburn
Median Income by Occupancy in Lilburn
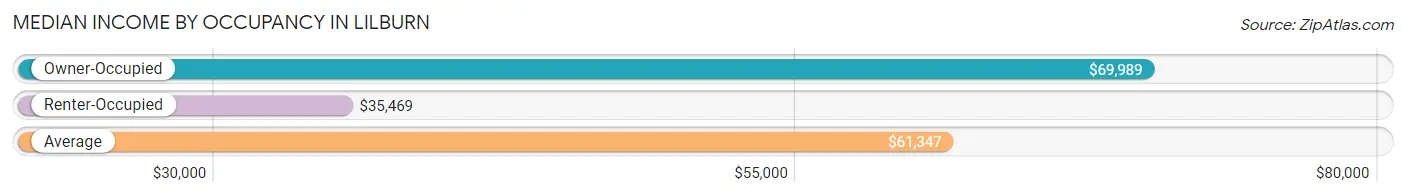
| Occupancy Type | # Households | Median Income |
| Owner-Occupied | 2,807 (58.6%) | $69,989 |
| Renter-Occupied | 1,984 (41.4%) | $35,469 |
| Average | 4,791 (100.0%) | $61,347 |
Occupancy by Householder Income Bracket in Lilburn
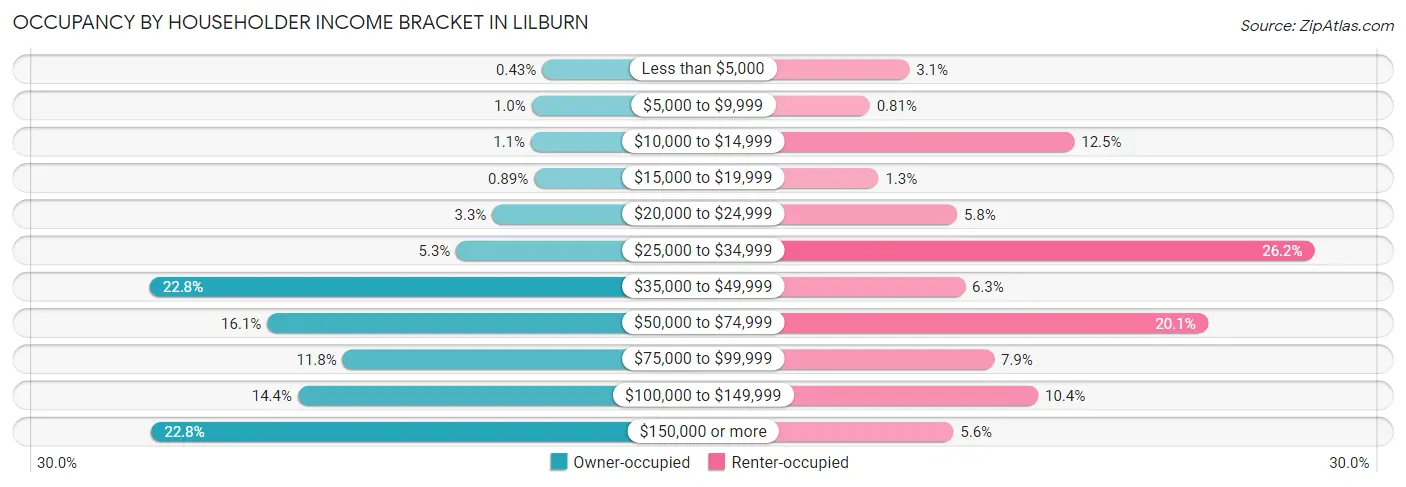
| Income Bracket | Owner-occupied | Renter-occupied |
| Less than $5,000 | 12 (0.4%) | 61 (3.1%) |
| $5,000 to $9,999 | 29 (1.0%) | 16 (0.8%) |
| $10,000 to $14,999 | 30 (1.1%) | 248 (12.5%) |
| $15,000 to $19,999 | 25 (0.9%) | 26 (1.3%) |
| $20,000 to $24,999 | 92 (3.3%) | 115 (5.8%) |
| $25,000 to $34,999 | 150 (5.3%) | 520 (26.2%) |
| $35,000 to $49,999 | 641 (22.8%) | 124 (6.2%) |
| $50,000 to $74,999 | 453 (16.1%) | 399 (20.1%) |
| $75,000 to $99,999 | 332 (11.8%) | 157 (7.9%) |
| $100,000 to $149,999 | 404 (14.4%) | 207 (10.4%) |
| $150,000 or more | 639 (22.8%) | 111 (5.6%) |
| Total | 2,807 (100.0%) | 1,984 (100.0%) |
Monthly Housing Cost Tiers in Lilburn
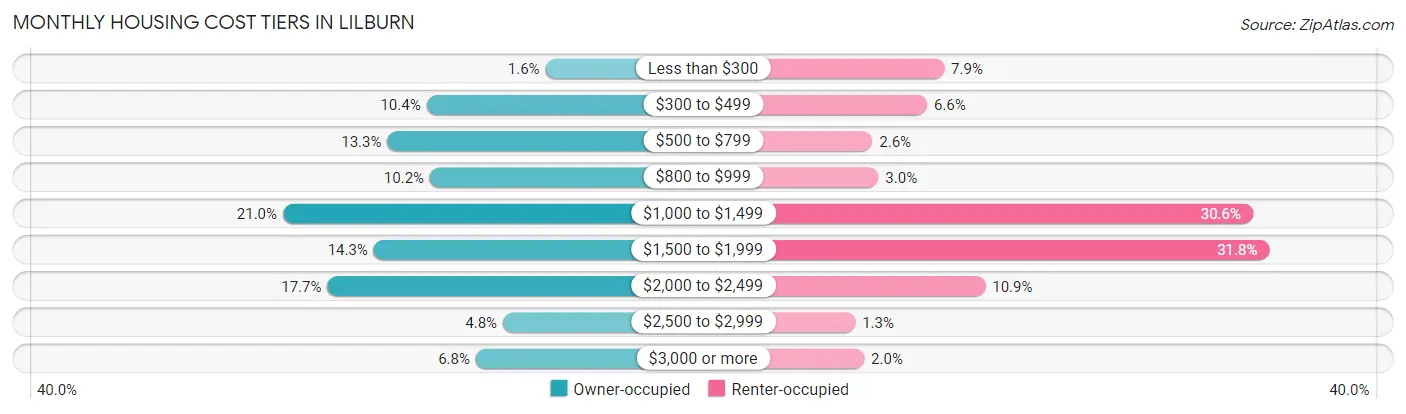
| Monthly Cost | Owner-occupied | Renter-occupied |
| Less than $300 | 46 (1.6%) | 156 (7.9%) |
| $300 to $499 | 292 (10.4%) | 131 (6.6%) |
| $500 to $799 | 373 (13.3%) | 51 (2.6%) |
| $800 to $999 | 285 (10.2%) | 60 (3.0%) |
| $1,000 to $1,499 | 589 (21.0%) | 607 (30.6%) |
| $1,500 to $1,999 | 401 (14.3%) | 631 (31.8%) |
| $2,000 to $2,499 | 497 (17.7%) | 216 (10.9%) |
| $2,500 to $2,999 | 134 (4.8%) | 26 (1.3%) |
| $3,000 or more | 190 (6.8%) | 39 (2.0%) |
| Total | 2,807 (100.0%) | 1,984 (100.0%) |
Physical Housing Characteristics in Lilburn
Housing Structures in Lilburn
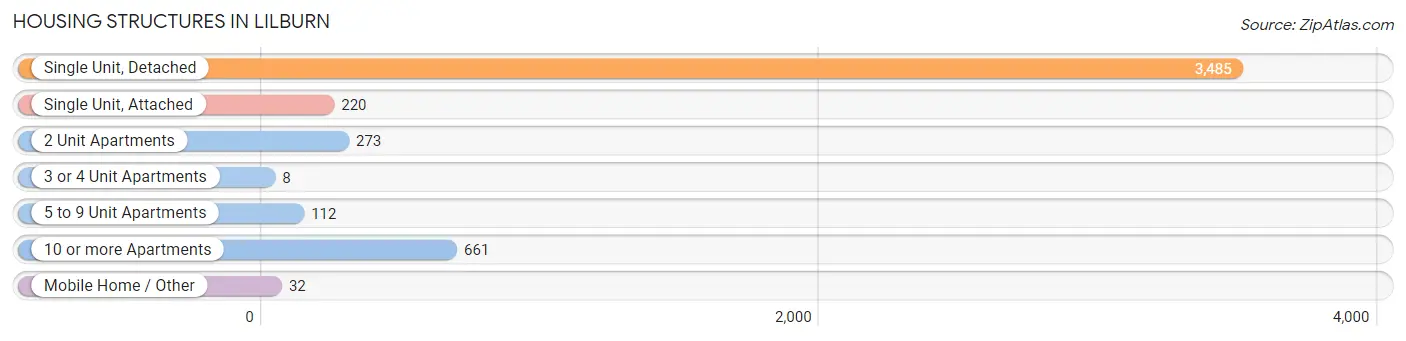
| Structure Type | # Housing Units | % Housing Units |
| Single Unit, Detached | 3,485 | 72.7% |
| Single Unit, Attached | 220 | 4.6% |
| 2 Unit Apartments | 273 | 5.7% |
| 3 or 4 Unit Apartments | 8 | 0.2% |
| 5 to 9 Unit Apartments | 112 | 2.3% |
| 10 or more Apartments | 661 | 13.8% |
| Mobile Home / Other | 32 | 0.7% |
| Total | 4,791 | 100.0% |
Housing Structures by Occupancy in Lilburn
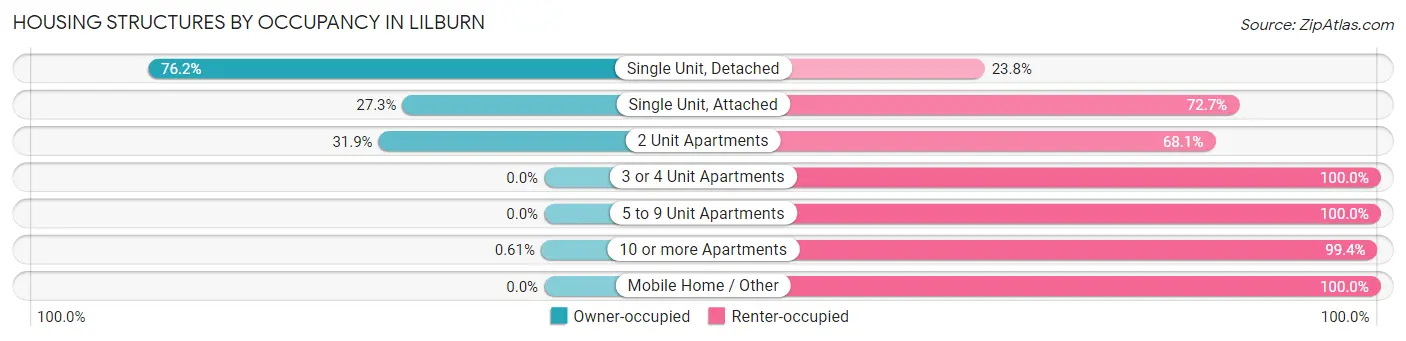
| Structure Type | Owner-occupied | Renter-occupied |
| Single Unit, Detached | 2,656 (76.2%) | 829 (23.8%) |
| Single Unit, Attached | 60 (27.3%) | 160 (72.7%) |
| 2 Unit Apartments | 87 (31.9%) | 186 (68.1%) |
| 3 or 4 Unit Apartments | 0 (0.0%) | 8 (100.0%) |
| 5 to 9 Unit Apartments | 0 (0.0%) | 112 (100.0%) |
| 10 or more Apartments | 4 (0.6%) | 657 (99.4%) |
| Mobile Home / Other | 0 (0.0%) | 32 (100.0%) |
| Total | 2,807 (58.6%) | 1,984 (41.4%) |
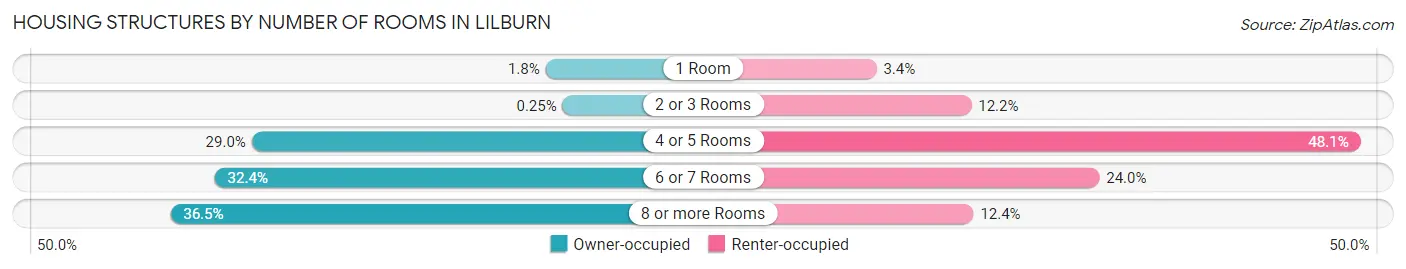
Housing Structures by Number of Rooms in Lilburn
| Number of Rooms | Owner-occupied | Renter-occupied |
| 1 Room | 51 (1.8%) | 67 (3.4%) |
| 2 or 3 Rooms | 7 (0.3%) | 241 (12.1%) |
| 4 or 5 Rooms | 814 (29.0%) | 955 (48.1%) |
| 6 or 7 Rooms | 910 (32.4%) | 476 (24.0%) |
| 8 or more Rooms | 1,025 (36.5%) | 245 (12.3%) |
| Total | 2,807 (100.0%) | 1,984 (100.0%) |
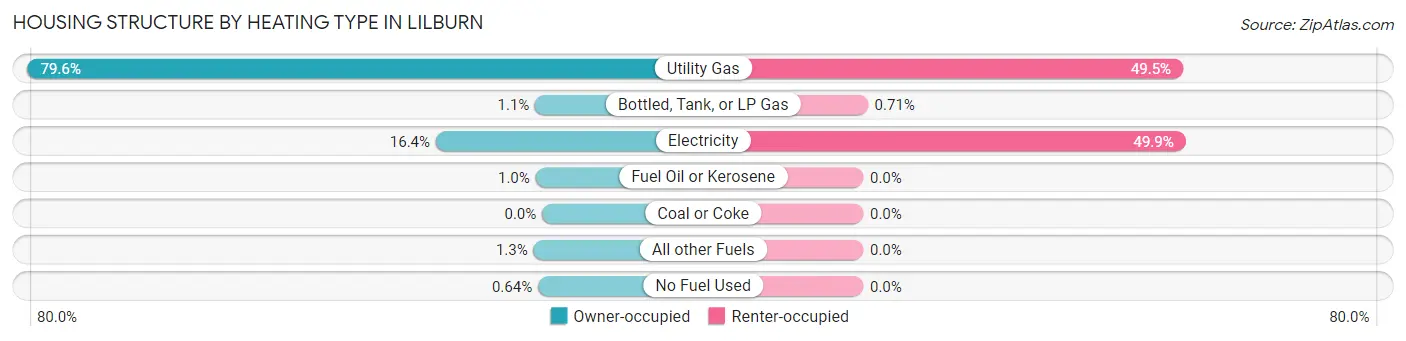
Housing Structure by Heating Type in Lilburn
| Heating Type | Owner-occupied | Renter-occupied |
| Utility Gas | 2,233 (79.5%) | 981 (49.4%) |
| Bottled, Tank, or LP Gas | 30 (1.1%) | 14 (0.7%) |
| Electricity | 461 (16.4%) | 989 (49.8%) |
| Fuel Oil or Kerosene | 28 (1.0%) | 0 (0.0%) |
| Coal or Coke | 0 (0.0%) | 0 (0.0%) |
| All other Fuels | 37 (1.3%) | 0 (0.0%) |
| No Fuel Used | 18 (0.6%) | 0 (0.0%) |
| Total | 2,807 (100.0%) | 1,984 (100.0%) |
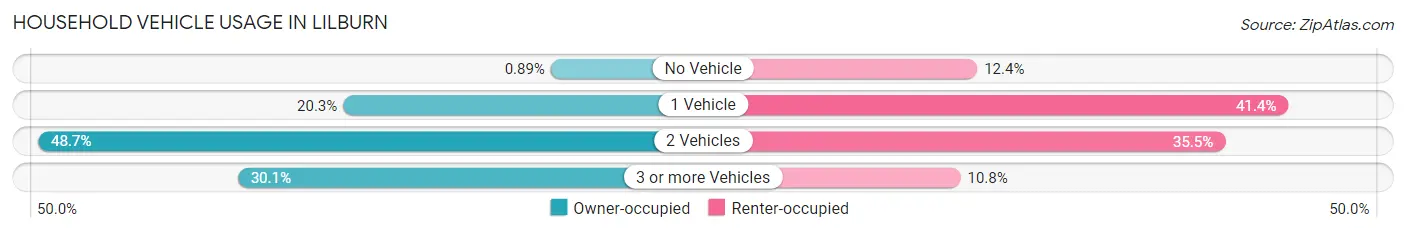
Household Vehicle Usage in Lilburn
| Vehicles per Household | Owner-occupied | Renter-occupied |
| No Vehicle | 25 (0.9%) | 245 (12.3%) |
| 1 Vehicle | 569 (20.3%) | 821 (41.4%) |
| 2 Vehicles | 1,368 (48.7%) | 704 (35.5%) |
| 3 or more Vehicles | 845 (30.1%) | 214 (10.8%) |
| Total | 2,807 (100.0%) | 1,984 (100.0%) |
Real Estate & Mortgages in Lilburn
Real Estate and Mortgage Overview in Lilburn
| Characteristic | Without Mortgage | With Mortgage |
| Housing Units | 839 | 1,968 |
| Median Property Value | $288,800 | $237,200 |
| Median Household Income | $79,821 | $458 |
| Monthly Housing Costs | $612 | $190 |
| Real Estate Taxes | $2,431 | $33 |
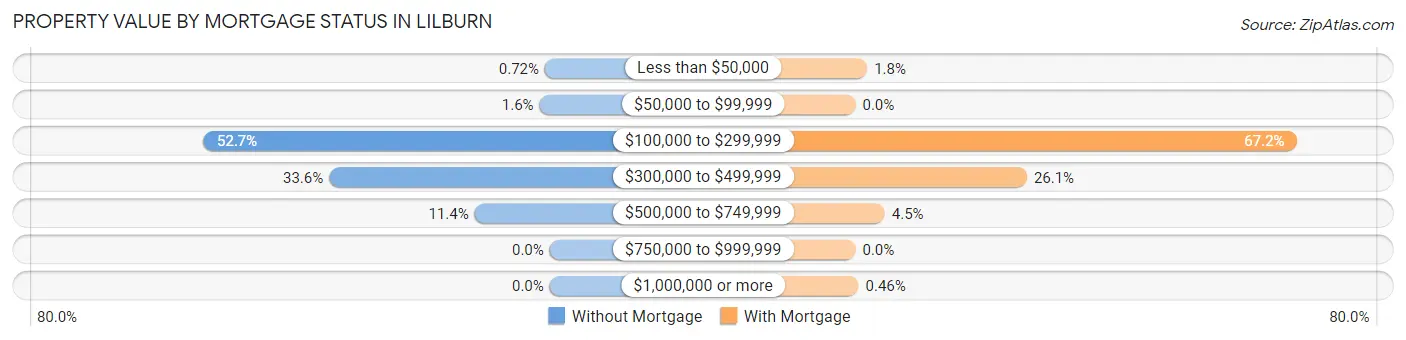
Property Value by Mortgage Status in Lilburn
| Property Value | Without Mortgage | With Mortgage |
| Less than $50,000 | 6 (0.7%) | 35 (1.8%) |
| $50,000 to $99,999 | 13 (1.5%) | 0 (0.0%) |
| $100,000 to $299,999 | 442 (52.7%) | 1,322 (67.2%) |
| $300,000 to $499,999 | 282 (33.6%) | 514 (26.1%) |
| $500,000 to $749,999 | 96 (11.4%) | 88 (4.5%) |
| $750,000 to $999,999 | 0 (0.0%) | 0 (0.0%) |
| $1,000,000 or more | 0 (0.0%) | 9 (0.5%) |
| Total | 839 (100.0%) | 1,968 (100.0%) |
Household Income by Mortgage Status in Lilburn
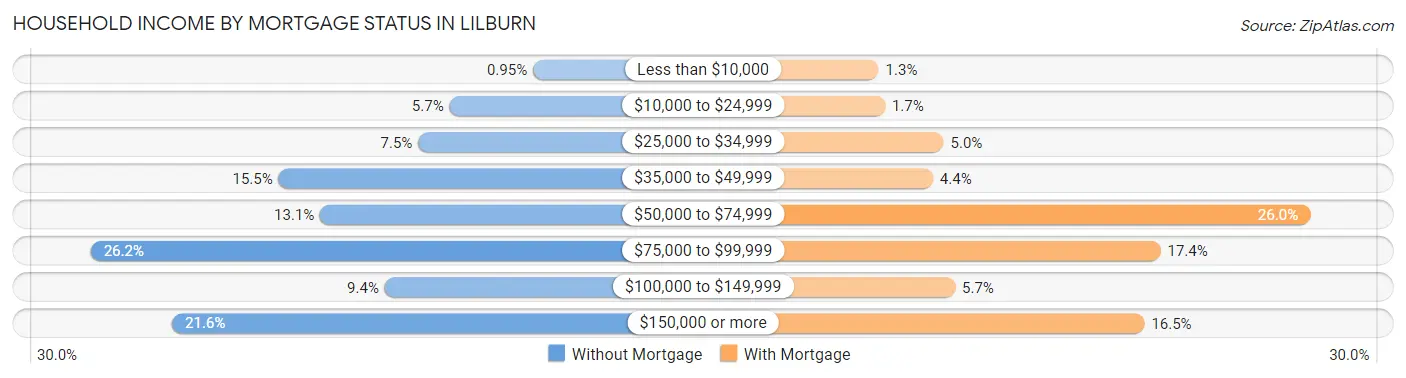
| Household Income | Without Mortgage | With Mortgage |
| Less than $10,000 | 8 (0.9%) | 26 (1.3%) |
| $10,000 to $24,999 | 48 (5.7%) | 33 (1.7%) |
| $25,000 to $34,999 | 63 (7.5%) | 99 (5.0%) |
| $35,000 to $49,999 | 130 (15.5%) | 87 (4.4%) |
| $50,000 to $74,999 | 110 (13.1%) | 511 (26.0%) |
| $75,000 to $99,999 | 220 (26.2%) | 343 (17.4%) |
| $100,000 to $149,999 | 79 (9.4%) | 112 (5.7%) |
| $150,000 or more | 181 (21.6%) | 325 (16.5%) |
| Total | 839 (100.0%) | 1,968 (100.0%) |
Property Value to Household Income Ratio in Lilburn
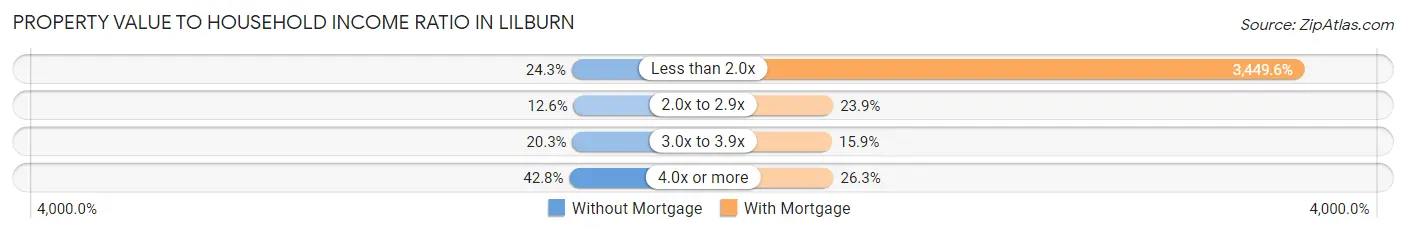
| Value-to-Income Ratio | Without Mortgage | With Mortgage |
| Less than 2.0x | 204 (24.3%) | 67,888 (3,449.6%) |
| 2.0x to 2.9x | 106 (12.6%) | 471 (23.9%) |
| 3.0x to 3.9x | 170 (20.3%) | 313 (15.9%) |
| 4.0x or more | 359 (42.8%) | 518 (26.3%) |
| Total | 839 (100.0%) | 1,968 (100.0%) |
Real Estate Taxes by Mortgage Status in Lilburn
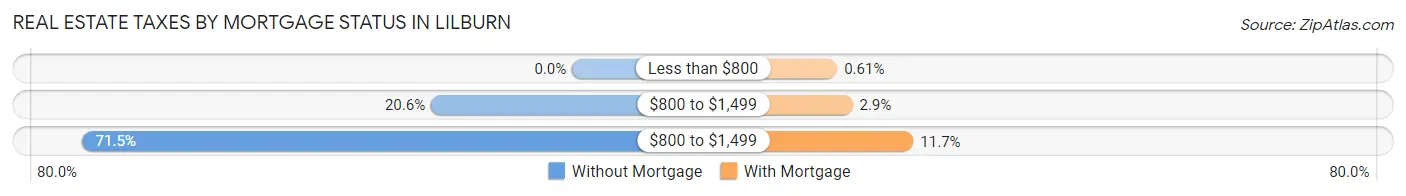
| Property Taxes | Without Mortgage | With Mortgage |
| Less than $800 | 0 (0.0%) | 12 (0.6%) |
| $800 to $1,499 | 173 (20.6%) | 56 (2.9%) |
| $800 to $1,499 | 600 (71.5%) | 231 (11.7%) |
| Total | 839 (100.0%) | 1,968 (100.0%) |
Health & Disability in Lilburn
Health Insurance Coverage by Age in Lilburn
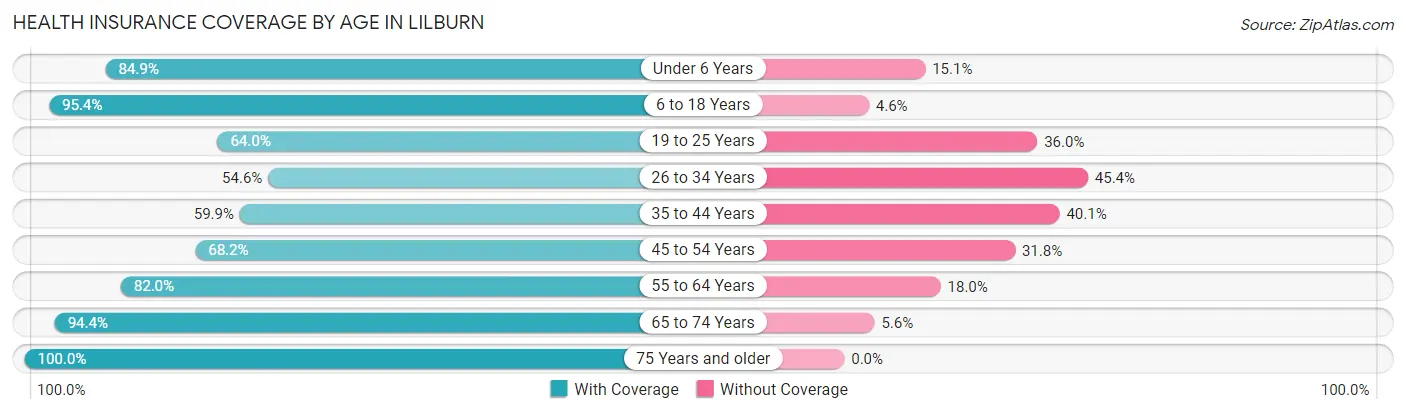
| Age Bracket | With Coverage | Without Coverage |
| Under 6 Years | 1,272 (84.9%) | 226 (15.1%) |
| 6 to 18 Years | 3,062 (95.4%) | 147 (4.6%) |
| 19 to 25 Years | 669 (64.0%) | 376 (36.0%) |
| 26 to 34 Years | 763 (54.6%) | 635 (45.4%) |
| 35 to 44 Years | 1,435 (59.9%) | 962 (40.1%) |
| 45 to 54 Years | 1,195 (68.2%) | 558 (31.8%) |
| 55 to 64 Years | 827 (82.0%) | 181 (18.0%) |
| 65 to 74 Years | 1,242 (94.4%) | 74 (5.6%) |
| 75 Years and older | 980 (100.0%) | 0 (0.0%) |
| Total | 11,445 (78.4%) | 3,159 (21.6%) |
Health Insurance Coverage by Citizenship Status in Lilburn
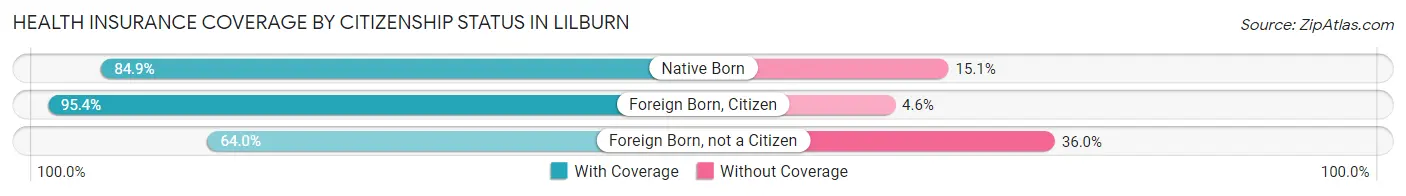
| Citizenship Status | With Coverage | Without Coverage |
| Native Born | 1,272 (84.9%) | 226 (15.1%) |
| Foreign Born, Citizen | 3,062 (95.4%) | 147 (4.6%) |
| Foreign Born, not a Citizen | 669 (64.0%) | 376 (36.0%) |
Health Insurance Coverage by Household Income in Lilburn
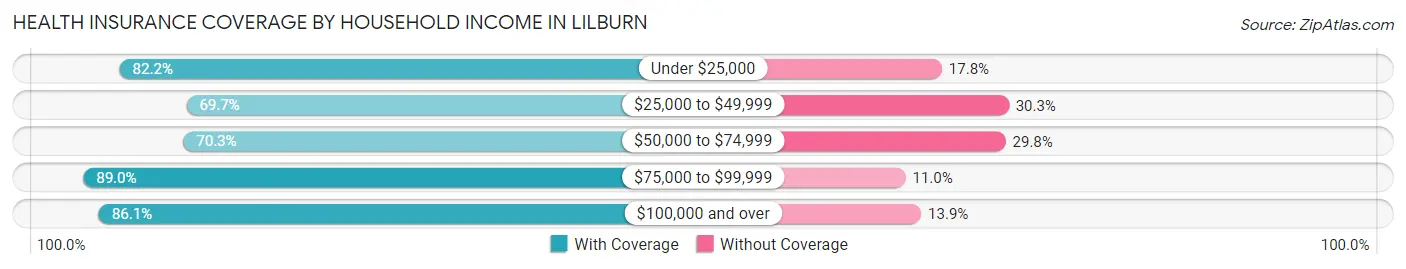
| Household Income | With Coverage | Without Coverage |
| Under $25,000 | 770 (82.2%) | 167 (17.8%) |
| $25,000 to $49,999 | 3,193 (69.7%) | 1,390 (30.3%) |
| $50,000 to $74,999 | 1,698 (70.3%) | 719 (29.7%) |
| $75,000 to $99,999 | 1,464 (89.0%) | 181 (11.0%) |
| $100,000 and over | 4,313 (86.1%) | 698 (13.9%) |
Public vs Private Health Insurance Coverage by Age in Lilburn
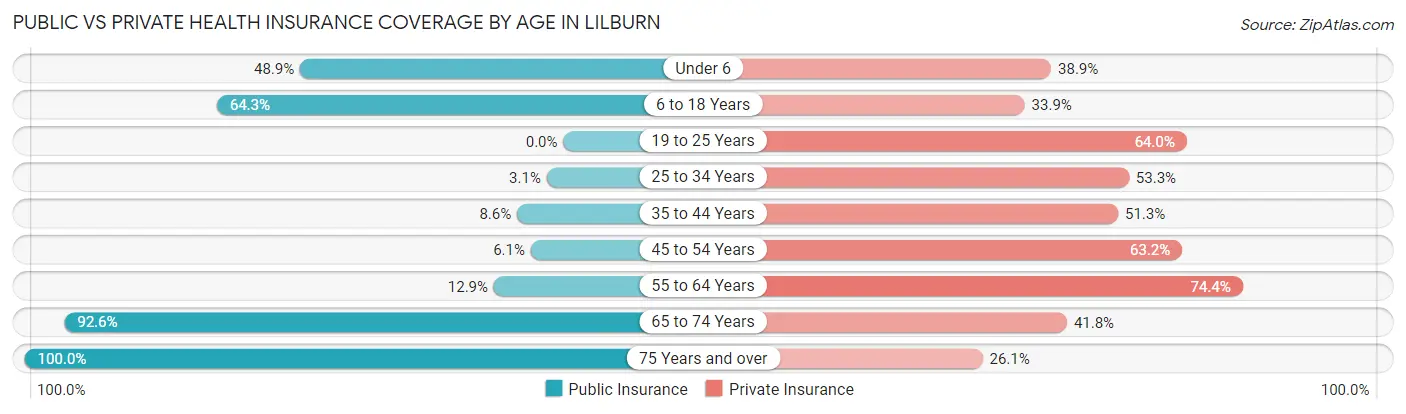
| Age Bracket | Public Insurance | Private Insurance |
| Under 6 | 732 (48.9%) | 582 (38.9%) |
| 6 to 18 Years | 2,064 (64.3%) | 1,089 (33.9%) |
| 19 to 25 Years | 0 (0.0%) | 669 (64.0%) |
| 25 to 34 Years | 43 (3.1%) | 745 (53.3%) |
| 35 to 44 Years | 206 (8.6%) | 1,229 (51.3%) |
| 45 to 54 Years | 106 (6.0%) | 1,107 (63.1%) |
| 55 to 64 Years | 130 (12.9%) | 750 (74.4%) |
| 65 to 74 Years | 1,219 (92.6%) | 550 (41.8%) |
| 75 Years and over | 980 (100.0%) | 256 (26.1%) |
| Total | 5,480 (37.5%) | 6,977 (47.8%) |
Disability Status by Sex by Age in Lilburn
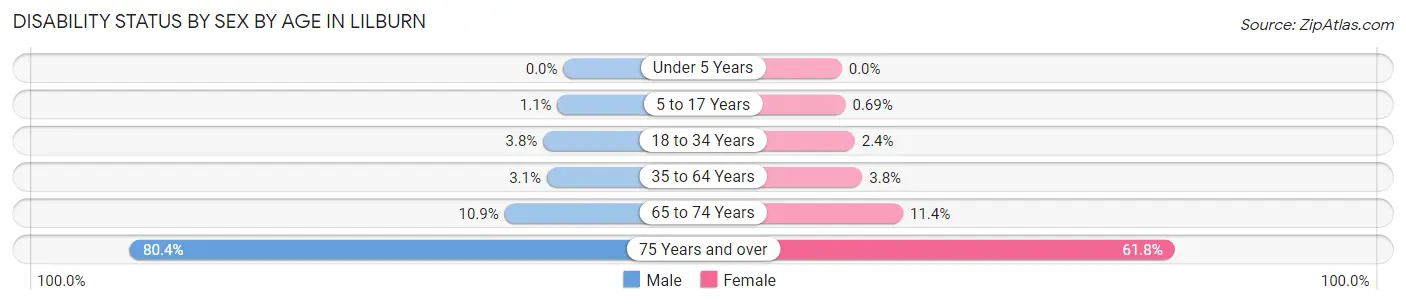
| Age Bracket | Male | Female |
| Under 5 Years | 0 (0.0%) | 0 (0.0%) |
| 5 to 17 Years | 27 (1.1%) | 8 (0.7%) |
| 18 to 34 Years | 54 (3.7%) | 26 (2.4%) |
| 35 to 64 Years | 82 (3.1%) | 95 (3.8%) |
| 65 to 74 Years | 63 (10.9%) | 84 (11.4%) |
| 75 Years and over | 439 (80.4%) | 268 (61.8%) |
Disability Class by Sex by Age in Lilburn
Disability Class: Hearing Difficulty
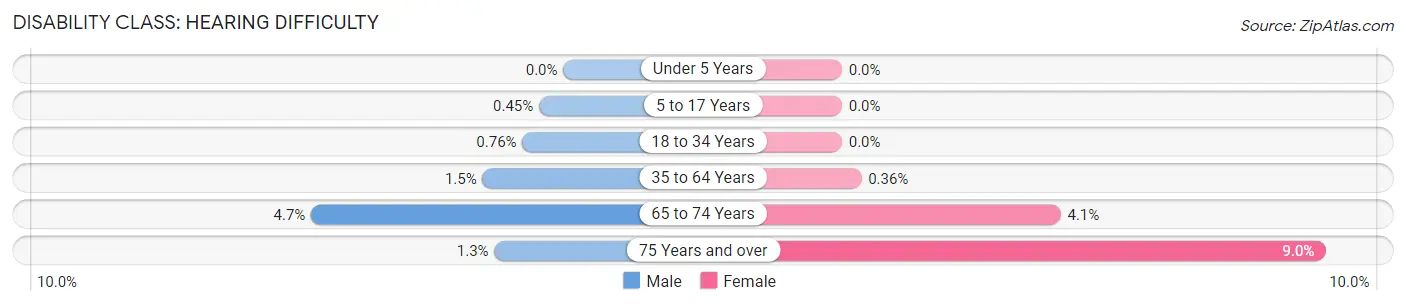
| Age Bracket | Male | Female |
| Under 5 Years | 0 (0.0%) | 0 (0.0%) |
| 5 to 17 Years | 11 (0.4%) | 0 (0.0%) |
| 18 to 34 Years | 11 (0.8%) | 0 (0.0%) |
| 35 to 64 Years | 40 (1.5%) | 9 (0.4%) |
| 65 to 74 Years | 27 (4.7%) | 30 (4.1%) |
| 75 Years and over | 7 (1.3%) | 39 (9.0%) |
Disability Class: Vision Difficulty
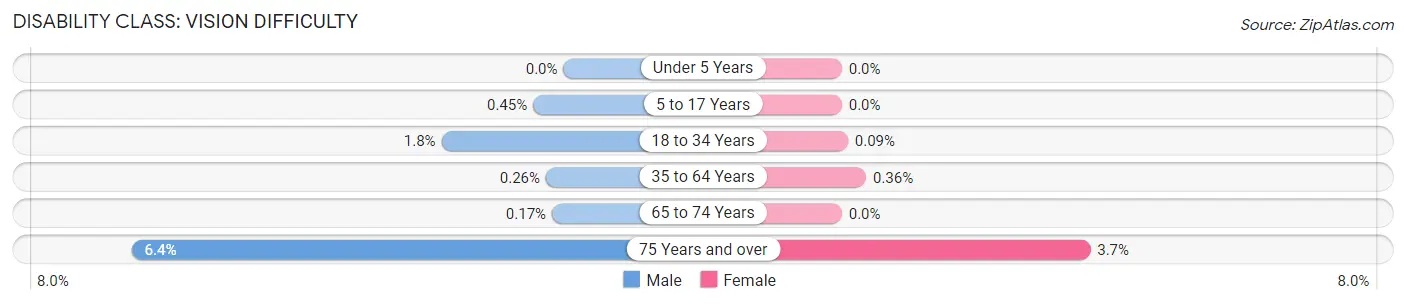
| Age Bracket | Male | Female |
| Under 5 Years | 0 (0.0%) | 0 (0.0%) |
| 5 to 17 Years | 11 (0.4%) | 0 (0.0%) |
| 18 to 34 Years | 26 (1.8%) | 1 (0.1%) |
| 35 to 64 Years | 7 (0.3%) | 9 (0.4%) |
| 65 to 74 Years | 1 (0.2%) | 0 (0.0%) |
| 75 Years and over | 35 (6.4%) | 16 (3.7%) |
Disability Class: Cognitive Difficulty
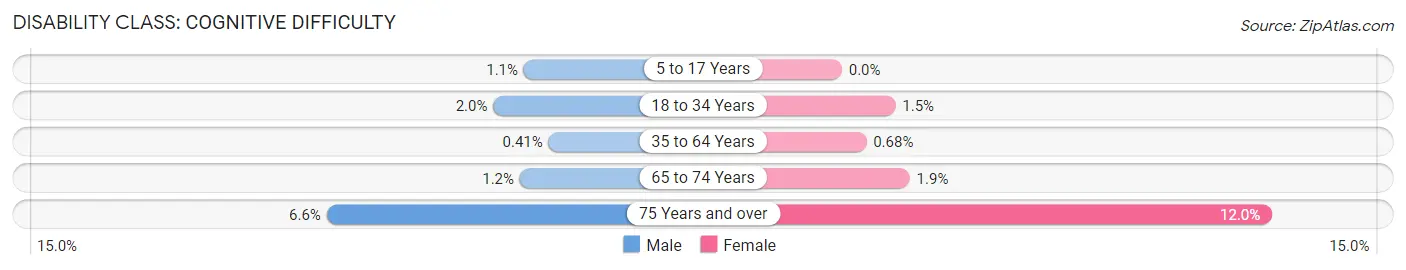
| Age Bracket | Male | Female |
| 5 to 17 Years | 27 (1.1%) | 0 (0.0%) |
| 18 to 34 Years | 28 (1.9%) | 16 (1.5%) |
| 35 to 64 Years | 11 (0.4%) | 17 (0.7%) |
| 65 to 74 Years | 7 (1.2%) | 14 (1.9%) |
| 75 Years and over | 36 (6.6%) | 52 (12.0%) |
Disability Class: Ambulatory Difficulty
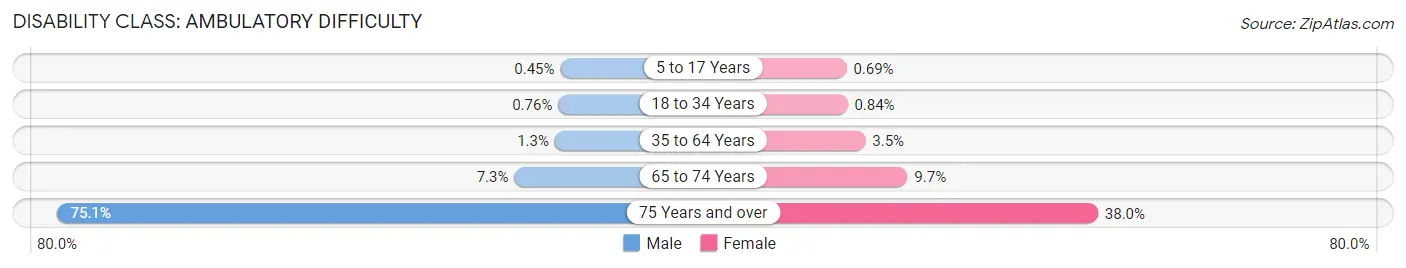
| Age Bracket | Male | Female |
| 5 to 17 Years | 11 (0.4%) | 8 (0.7%) |
| 18 to 34 Years | 11 (0.8%) | 9 (0.8%) |
| 35 to 64 Years | 34 (1.3%) | 87 (3.5%) |
| 65 to 74 Years | 42 (7.3%) | 72 (9.7%) |
| 75 Years and over | 410 (75.1%) | 165 (38.0%) |
Disability Class: Self-Care Difficulty
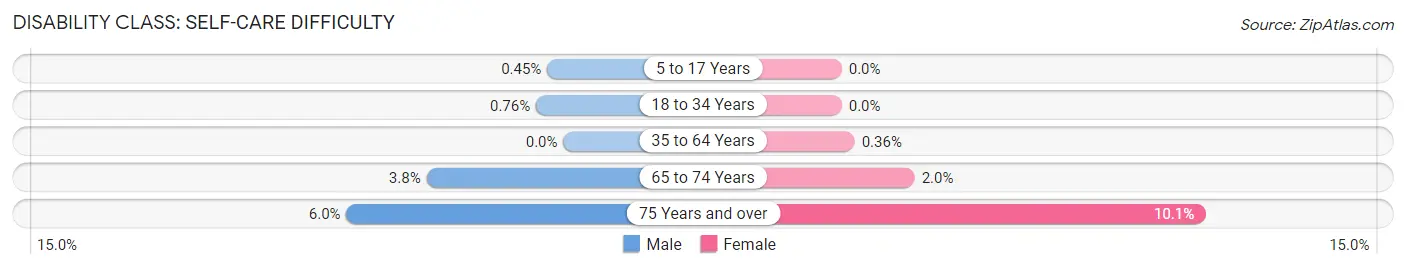
| Age Bracket | Male | Female |
| 5 to 17 Years | 11 (0.4%) | 0 (0.0%) |
| 18 to 34 Years | 11 (0.8%) | 0 (0.0%) |
| 35 to 64 Years | 0 (0.0%) | 9 (0.4%) |
| 65 to 74 Years | 22 (3.8%) | 15 (2.0%) |
| 75 Years and over | 33 (6.0%) | 44 (10.1%) |
Technology Access in Lilburn
Computing Device Access in Lilburn
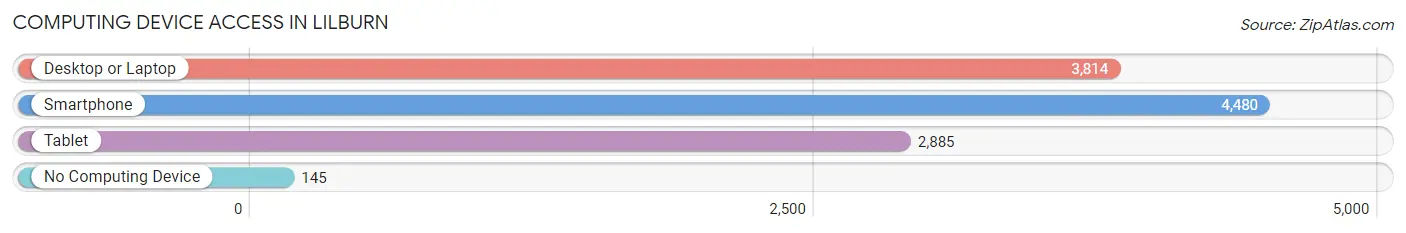
| Device Type | # Households | % Households |
| Desktop or Laptop | 3,814 | 79.6% |
| Smartphone | 4,480 | 93.5% |
| Tablet | 2,885 | 60.2% |
| No Computing Device | 145 | 3.0% |
| Total | 4,791 | 100.0% |
Internet Access in Lilburn
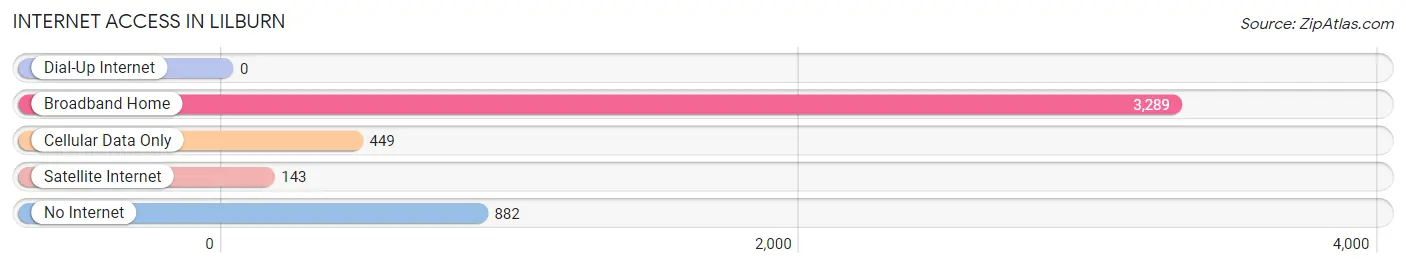
| Internet Type | # Households | % Households |
| Dial-Up Internet | 0 | 0.0% |
| Broadband Home | 3,289 | 68.6% |
| Cellular Data Only | 449 | 9.4% |
| Satellite Internet | 143 | 3.0% |
| No Internet | 882 | 18.4% |
| Total | 4,791 | 100.0% |
Lilburn Summary
Lilburn is a city located in Gwinnett County, Georgia, United States. It is a suburb of Atlanta, located approximately 20 miles northeast of the city. The population was 11,596 at the 2010 census.
History
Lilburn was founded in 1890 by the Seaboard Air Line Railway. The town was named after Lilburn Trigg Myers, a railroad official. The town was incorporated in 1910.
In the early 20th century, Lilburn was a rural farming community. The town was known for its peach orchards and other agricultural products. In the 1950s, the town began to experience rapid growth as Atlanta's suburbs expanded.
Geography
Lilburn is located in northwestern Gwinnett County at 33°53'25" North, 84°7'25" West (33.890, -84.123). It is bordered to the north by the city of Norcross, to the east by unincorporated Berkeley Lake, to the south by unincorporated Snellville, and to the west by unincorporated Lawrenceville.
According to the United States Census Bureau, the city has a total area of 5.2 square miles, of which 5.1 square miles is land and 0.1 square miles (1.45%) is water.
Economy
Lilburn is home to a variety of businesses, including manufacturing, retail, and service industries. The city is also home to several corporate headquarters, including the headquarters of the Georgia-Pacific Corporation.
Demographics
As of the 2010 census, there were 11,596 people, 4,541 households, and 3,072 families residing in the city. The population density was 2,269.2 people per square mile. The racial makeup of the city was 57.2% White, 24.2% African American, 0.4% Native American, 8.2% Asian, 0.1% Pacific Islander, 6.7% from other races, and 3.2% from two or more races. Hispanic or Latino of any race were 14.3% of the population.
The median income for a household in the city was $50,945, and the median income for a family was $60,945. The per capita income for the city was $25,945. About 8.2% of families and 10.2% of the population were below the poverty line, including 14.2% of those under age 18 and 8.2% of those age 65 or over.
Conclusion
Lilburn is a city located in Gwinnett County, Georgia, United States. It is a suburb of Atlanta, located approximately 20 miles northeast of the city. The population was 11,596 at the 2010 census. The city was founded in 1890 by the Seaboard Air Line Railway and was incorporated in 1910. Lilburn is home to a variety of businesses, including manufacturing, retail, and service industries. The racial makeup of the city was 57.2% White, 24.2% African American, 0.4% Native American, 8.2% Asian, 0.1% Pacific Islander, 6.7% from other races, and 3.2% from two or more races. The median income for a household in the city was $50,945, and the median income for a family was $60,945. About 8.2% of families and 10.2% of the population were below the poverty line.
Common Questions
What is Per Capita Income in Lilburn?
Per Capita income in Lilburn is $29,244.
What is the Median Family Income in Lilburn?
Median Family Income in Lilburn is $76,168.
What is the Median Household income in Lilburn?
Median Household Income in Lilburn is $61,347.
What is Income or Wage Gap in Lilburn?
Income or Wage Gap in Lilburn is 22.1%.
Women in Lilburn earn 77.9 cents for every dollar earned by a man.
What is Inequality or Gini Index in Lilburn?
Inequality or Gini Index in Lilburn is 0.47.
What is the Total Population of Lilburn?
Total Population of Lilburn is 14,741.
What is the Total Male Population of Lilburn?
Total Male Population of Lilburn is 8,170.
What is the Total Female Population of Lilburn?
Total Female Population of Lilburn is 6,571.
What is the Ratio of Males per 100 Females in Lilburn?
There are 124.33 Males per 100 Females in Lilburn.
What is the Ratio of Females per 100 Males in Lilburn?
There are 80.43 Females per 100 Males in Lilburn.
What is the Median Population Age in Lilburn?
Median Population Age in Lilburn is 36.1 Years.
What is the Average Family Size in Lilburn
Average Family Size in Lilburn is 4.0 People.
What is the Average Household Size in Lilburn
Average Household Size in Lilburn is 3.0 People.
How Large is the Labor Force in Lilburn?
There are 6,597 People in the Labor Forcein in Lilburn.
What is the Percentage of People in the Labor Force in Lilburn?
62.5% of People are in the Labor Force in Lilburn.
What is the Unemployment Rate in Lilburn?
Unemployment Rate in Lilburn is 4.6%.