Prospect Park borough, PA Map & Demographics
Prospect Park borough Overview
$38,354
PER CAPITA INCOME
$88,684
AVG FAMILY INCOME
$63,015
AVG HOUSEHOLD INCOME
39.1%
WAGE / INCOME GAP [ % ]
60.9¢/ $1
WAGE / INCOME GAP [ $ ]
0.51
INEQUALITY / GINI INDEX
6,411
TOTAL POPULATION
3,268
MALE POPULATION
3,143
FEMALE POPULATION
103.98
MALES / 100 FEMALES
96.18
FEMALES / 100 MALES
36.7
MEDIAN AGE
3.1
AVG FAMILY SIZE
2.4
AVG HOUSEHOLD SIZE
3,978
LABOR FORCE [ PEOPLE ]
76.2%
PERCENT IN LABOR FORCE
5.9%
UNEMPLOYMENT RATE
Income in Prospect Park borough
Income Overview in Prospect Park borough
Per Capita Income in Prospect Park borough is $38,354, while median incomes of families and households are $88,684 and $63,015 respectively.
| Characteristic | Number | Measure |
| Per Capita Income | 6,411 | $38,354 |
| Median Family Income | 1,682 | $88,684 |
| Mean Family Income | 1,682 | $113,483 |
| Median Household Income | 2,567 | $63,015 |
| Mean Household Income | 2,567 | $94,020 |
| Income Deficit | 1,682 | $0 |
| Wage / Income Gap (%) | 6,411 | 39.09% |
| Wage / Income Gap ($) | 6,411 | 60.91¢ per $1 |
| Gini / Inequality Index | 6,411 | 0.51 |
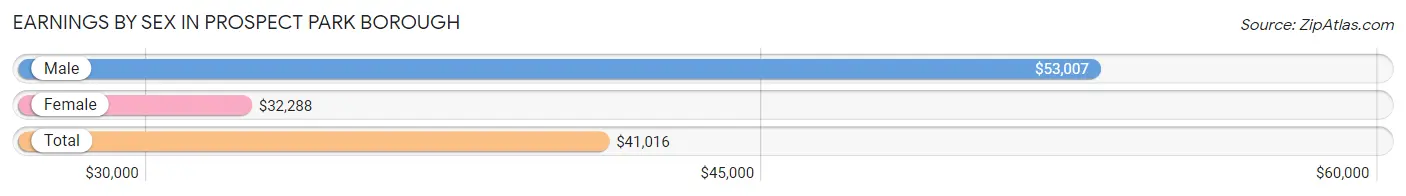
Earnings by Sex in Prospect Park borough
Average Earnings in Prospect Park borough are $41,016, $53,007 for men and $32,288 for women, a difference of 39.1%.
| Sex | Number | Average Earnings |
| Male | 2,094 (53.0%) | $53,007 |
| Female | 1,858 (47.0%) | $32,288 |
| Total | 3,952 (100.0%) | $41,016 |
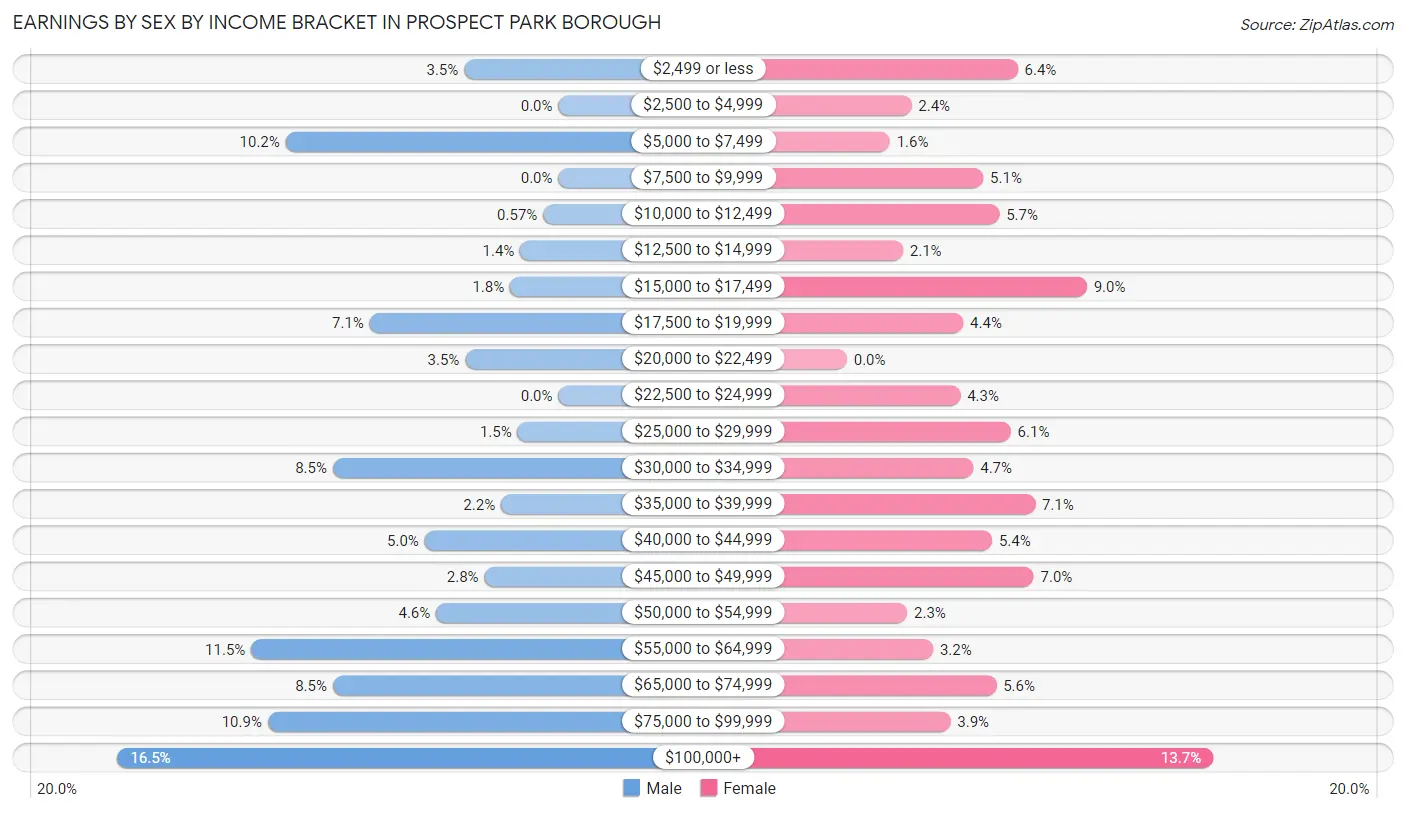
Earnings by Sex by Income Bracket in Prospect Park borough
The most common earnings brackets in Prospect Park borough are $100,000+ for men (346 | 16.5%) and $100,000+ for women (255 | 13.7%).
| Income | Male | Female |
| $2,499 or less | 74 (3.5%) | 119 (6.4%) |
| $2,500 to $4,999 | 0 (0.0%) | 45 (2.4%) |
| $5,000 to $7,499 | 214 (10.2%) | 30 (1.6%) |
| $7,500 to $9,999 | 0 (0.0%) | 95 (5.1%) |
| $10,000 to $12,499 | 12 (0.6%) | 106 (5.7%) |
| $12,500 to $14,999 | 30 (1.4%) | 39 (2.1%) |
| $15,000 to $17,499 | 38 (1.8%) | 167 (9.0%) |
| $17,500 to $19,999 | 148 (7.1%) | 81 (4.4%) |
| $20,000 to $22,499 | 73 (3.5%) | 0 (0.0%) |
| $22,500 to $24,999 | 0 (0.0%) | 79 (4.3%) |
| $25,000 to $29,999 | 32 (1.5%) | 114 (6.1%) |
| $30,000 to $34,999 | 177 (8.5%) | 88 (4.7%) |
| $35,000 to $39,999 | 45 (2.1%) | 131 (7.0%) |
| $40,000 to $44,999 | 105 (5.0%) | 101 (5.4%) |
| $45,000 to $49,999 | 58 (2.8%) | 130 (7.0%) |
| $50,000 to $54,999 | 96 (4.6%) | 42 (2.3%) |
| $55,000 to $64,999 | 241 (11.5%) | 60 (3.2%) |
| $65,000 to $74,999 | 177 (8.5%) | 104 (5.6%) |
| $75,000 to $99,999 | 228 (10.9%) | 72 (3.9%) |
| $100,000+ | 346 (16.5%) | 255 (13.7%) |
| Total | 2,094 (100.0%) | 1,858 (100.0%) |
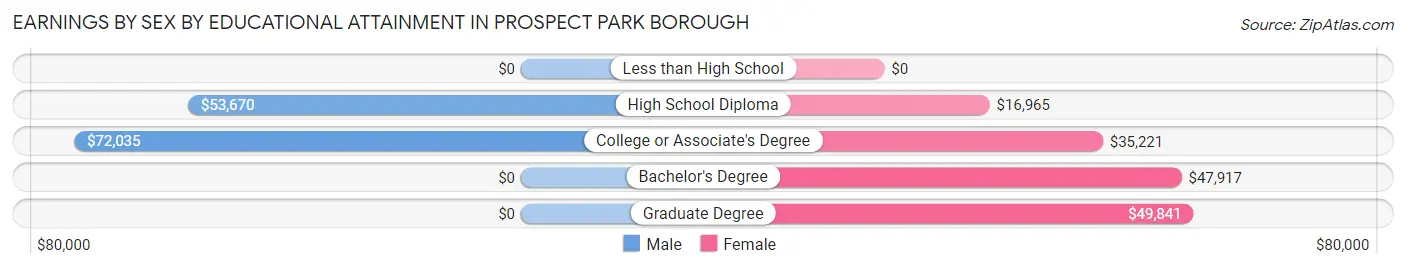
Earnings by Sex by Educational Attainment in Prospect Park borough
Average earnings in Prospect Park borough are $58,894 for men and $35,934 for women, a difference of 39.0%. Men with an educational attainment of college or associate's degree enjoy the highest average annual earnings of $72,035, while those with high school diploma education earn the least with $53,670. Women with an educational attainment of graduate degree earn the most with the average annual earnings of $49,841, while those with high school diploma education have the smallest earnings of $16,965.
| Educational Attainment | Male Income | Female Income |
| Less than High School | - | - |
| High School Diploma | $53,670 | $16,965 |
| College or Associate's Degree | $72,035 | $35,221 |
| Bachelor's Degree | - | - |
| Graduate Degree | - | - |
| Total | $58,894 | $35,934 |
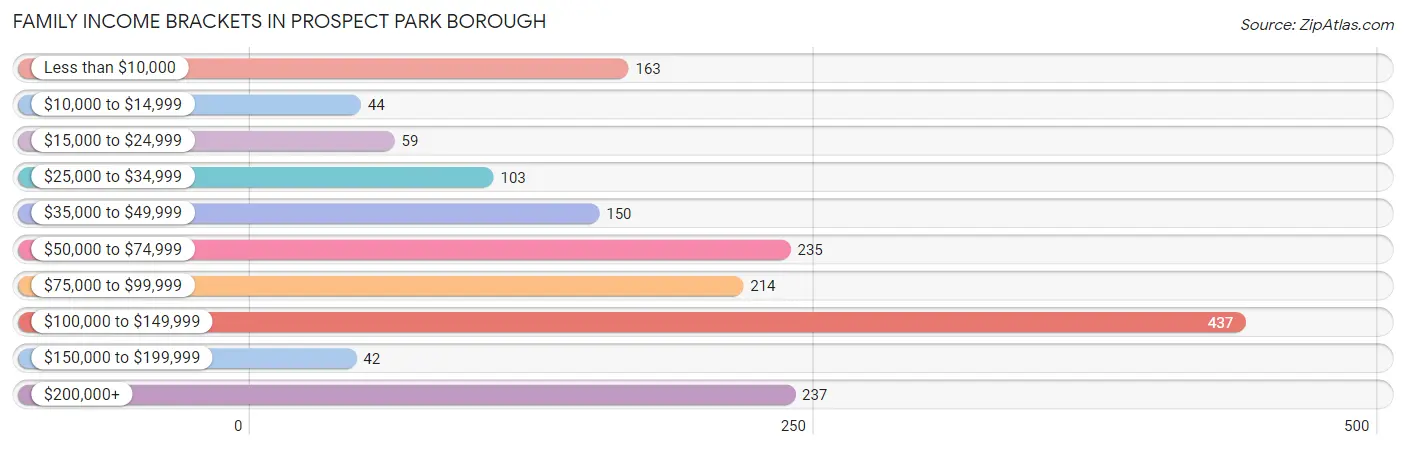
Family Income in Prospect Park borough
Family Income Brackets in Prospect Park borough
According to the Prospect Park borough family income data, there are 437 families falling into the $100,000 to $149,999 income range, which is the most common income bracket and makes up 26.0% of all families. Conversely, the $150,000 to $199,999 income bracket is the least frequent group with only 42 families (2.5%) belonging to this category.
| Income Bracket | # Families | % Families |
| Less than $10,000 | 163 | 9.7% |
| $10,000 to $14,999 | 44 | 2.6% |
| $15,000 to $24,999 | 59 | 3.5% |
| $25,000 to $34,999 | 103 | 6.1% |
| $35,000 to $49,999 | 150 | 8.9% |
| $50,000 to $74,999 | 235 | 14.0% |
| $75,000 to $99,999 | 214 | 12.7% |
| $100,000 to $149,999 | 437 | 26.0% |
| $150,000 to $199,999 | 42 | 2.5% |
| $200,000+ | 237 | 14.1% |
Family Income by Famaliy Size in Prospect Park borough
5-person families (344 | 20.4%) account for the highest median family income in Prospect Park borough with $250,001 per family, while 5-person families (344 | 20.4%) have the highest median income of $50,000 per family member.
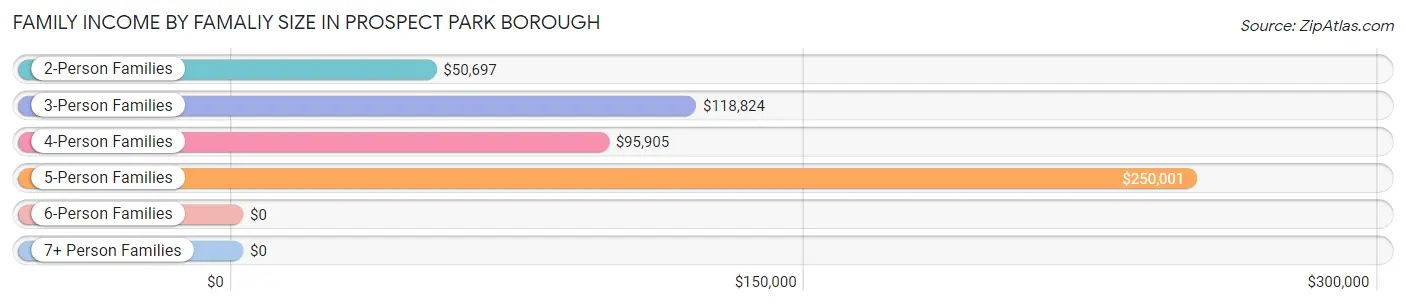
| Income Bracket | # Families | Median Income |
| 2-Person Families | 849 (50.5%) | $50,697 |
| 3-Person Families | 262 (15.6%) | $118,824 |
| 4-Person Families | 208 (12.4%) | $95,905 |
| 5-Person Families | 344 (20.4%) | $250,001 |
| 6-Person Families | 0 (0.0%) | $0 |
| 7+ Person Families | 19 (1.1%) | $0 |
| Total | 1,682 (100.0%) | $88,684 |
Family Income by Number of Earners in Prospect Park borough
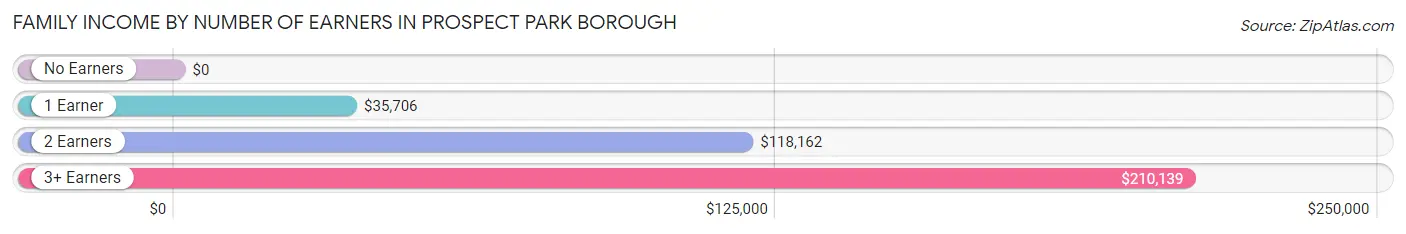
| Number of Earners | # Families | Median Income |
| No Earners | 139 (8.3%) | $0 |
| 1 Earner | 662 (39.4%) | $35,706 |
| 2 Earners | 483 (28.7%) | $118,162 |
| 3+ Earners | 398 (23.7%) | $210,139 |
| Total | 1,682 (100.0%) | $88,684 |
Household Income in Prospect Park borough
Household Income Brackets in Prospect Park borough
With 495 households falling in the category, the $100,000 to $149,999 income range is the most frequent in Prospect Park borough, accounting for 19.3% of all households. In contrast, only 72 households (2.8%) fall into the $150,000 to $199,999 income bracket, making it the least populous group.
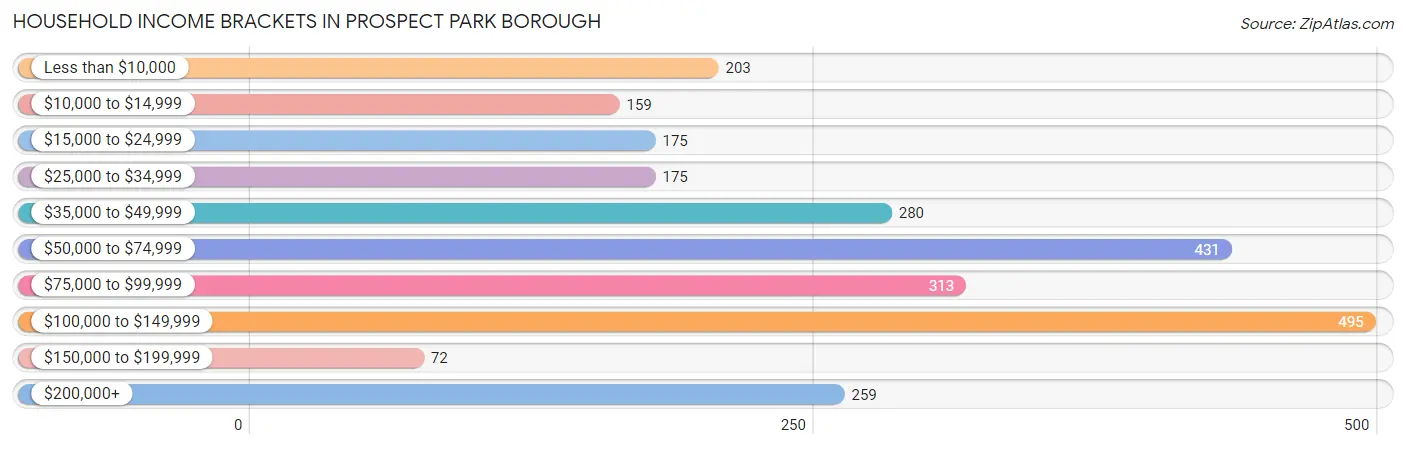
| Income Bracket | # Households | % Households |
| Less than $10,000 | 203 | 7.9% |
| $10,000 to $14,999 | 159 | 6.2% |
| $15,000 to $24,999 | 175 | 6.8% |
| $25,000 to $34,999 | 175 | 6.8% |
| $35,000 to $49,999 | 280 | 10.9% |
| $50,000 to $74,999 | 431 | 16.8% |
| $75,000 to $99,999 | 313 | 12.2% |
| $100,000 to $149,999 | 495 | 19.3% |
| $150,000 to $199,999 | 72 | 2.8% |
| $200,000+ | 259 | 10.1% |
Household Income by Householder Age in Prospect Park borough
The median household income in Prospect Park borough is $63,015, with the highest median household income of $96,961 found in the 45 to 64 years age bracket for the primary householder. A total of 929 households (36.2%) fall into this category.
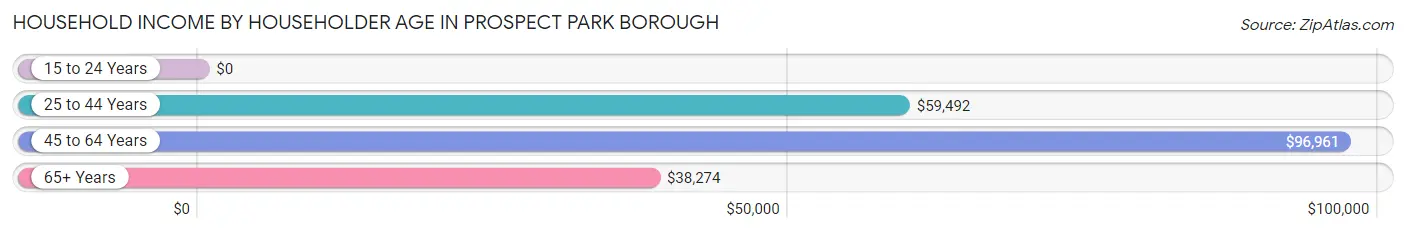
| Income Bracket | # Households | Median Income |
| 15 to 24 Years | 0 (0.0%) | $0 |
| 25 to 44 Years | 1,083 (42.2%) | $59,492 |
| 45 to 64 Years | 929 (36.2%) | $96,961 |
| 65+ Years | 555 (21.6%) | $38,274 |
| Total | 2,567 (100.0%) | $63,015 |
Poverty in Prospect Park borough
Income Below Poverty by Sex and Age in Prospect Park borough
With 11.7% poverty level for males and 19.5% for females among the residents of Prospect Park borough, 12 to 14 year old males and 6 to 11 year old females are the most vulnerable to poverty, with 20 males (50.0%) and 138 females (62.4%) in their respective age groups living below the poverty level.
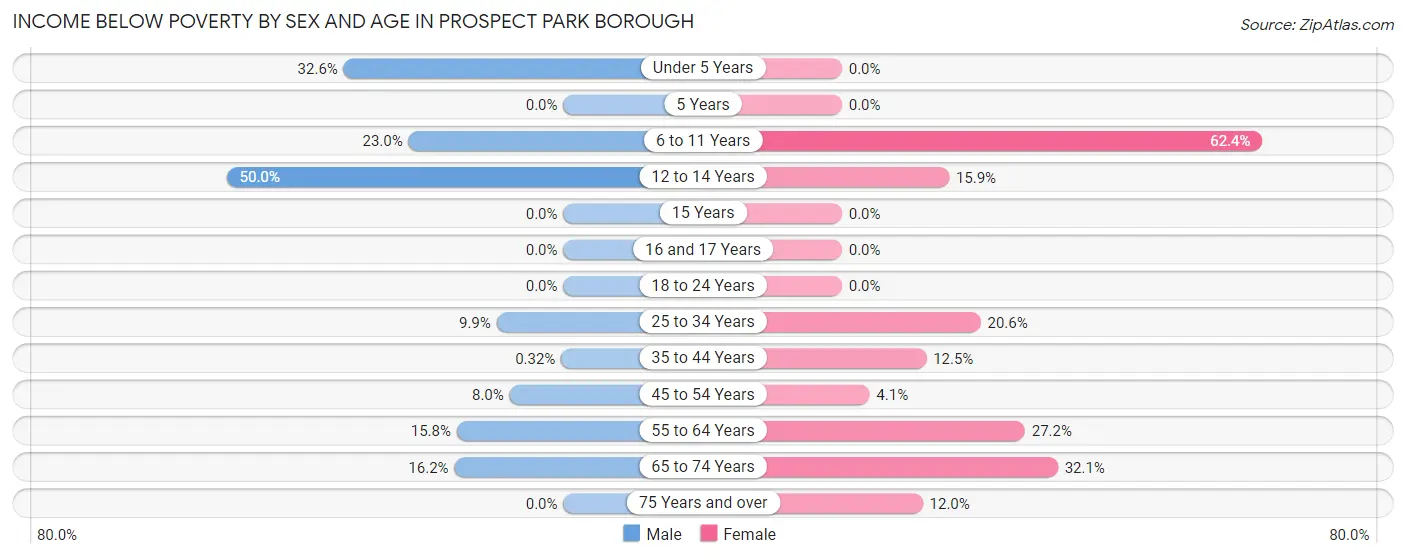
| Age Bracket | Male | Female |
| Under 5 Years | 106 (32.6%) | 0 (0.0%) |
| 5 Years | 0 (0.0%) | 0 (0.0%) |
| 6 to 11 Years | 40 (23.0%) | 138 (62.4%) |
| 12 to 14 Years | 20 (50.0%) | 21 (15.9%) |
| 15 Years | 0 (0.0%) | 0 (0.0%) |
| 16 and 17 Years | 0 (0.0%) | 0 (0.0%) |
| 18 to 24 Years | 0 (0.0%) | 0 (0.0%) |
| 25 to 34 Years | 74 (9.9%) | 110 (20.6%) |
| 35 to 44 Years | 1 (0.3%) | 48 (12.5%) |
| 45 to 54 Years | 21 (8.0%) | 19 (4.1%) |
| 55 to 64 Years | 87 (15.8%) | 112 (27.2%) |
| 65 to 74 Years | 28 (16.2%) | 126 (32.1%) |
| 75 Years and over | 0 (0.0%) | 18 (12.0%) |
| Total | 377 (11.7%) | 592 (19.5%) |
Income Above Poverty by Sex and Age in Prospect Park borough
According to the poverty statistics in Prospect Park borough, males aged 5 years and females aged under 5 years are the age groups that are most secure financially, with 100.0% of males and 100.0% of females in these age groups living above the poverty line.
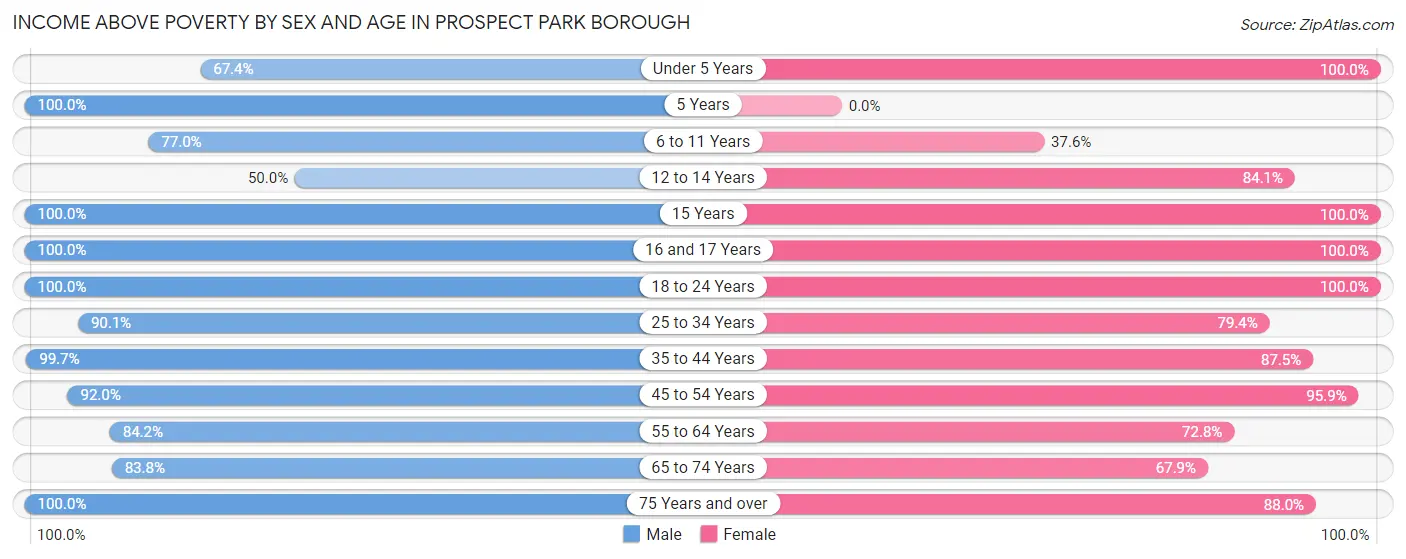
| Age Bracket | Male | Female |
| Under 5 Years | 219 (67.4%) | 165 (100.0%) |
| 5 Years | 41 (100.0%) | 0 (0.0%) |
| 6 to 11 Years | 134 (77.0%) | 83 (37.6%) |
| 12 to 14 Years | 20 (50.0%) | 111 (84.1%) |
| 15 Years | 64 (100.0%) | 29 (100.0%) |
| 16 and 17 Years | 59 (100.0%) | 38 (100.0%) |
| 18 to 24 Years | 408 (100.0%) | 115 (100.0%) |
| 25 to 34 Years | 673 (90.1%) | 424 (79.4%) |
| 35 to 44 Years | 312 (99.7%) | 335 (87.5%) |
| 45 to 54 Years | 242 (92.0%) | 444 (95.9%) |
| 55 to 64 Years | 463 (84.2%) | 300 (72.8%) |
| 65 to 74 Years | 145 (83.8%) | 267 (67.9%) |
| 75 Years and over | 62 (100.0%) | 132 (88.0%) |
| Total | 2,842 (88.3%) | 2,443 (80.5%) |
Income Below Poverty Among Married-Couple Families in Prospect Park borough
The poverty statistics for married-couple families in Prospect Park borough show that 9.9% or 100 of the total 1,009 families live below the poverty line. Families with no children have the highest poverty rate of 13.8%, comprising of 100 families. On the other hand, families with 1 or 2 children have the lowest poverty rate of 0.0%, which includes 0 families.
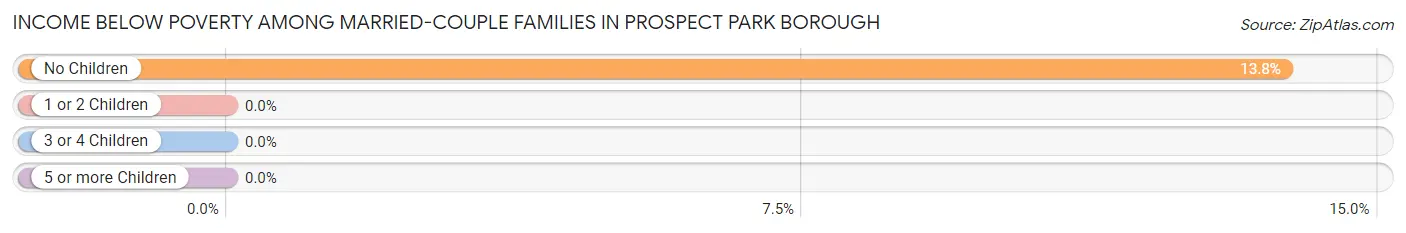
| Children | Above Poverty | Below Poverty |
| No Children | 626 (86.2%) | 100 (13.8%) |
| 1 or 2 Children | 200 (100.0%) | 0 (0.0%) |
| 3 or 4 Children | 83 (100.0%) | 0 (0.0%) |
| 5 or more Children | 0 (0.0%) | 0 (0.0%) |
| Total | 909 (90.1%) | 100 (9.9%) |
Income Below Poverty Among Single-Parent Households in Prospect Park borough
According to the poverty data in Prospect Park borough, 52.9% or 74 single-father households and 20.8% or 111 single-mother households are living below the poverty line. Among single-father households, those with 1 or 2 children have the highest poverty rate, with 74 households (88.1%) experiencing poverty. Likewise, among single-mother households, those with 5 or more children have the highest poverty rate, with 19 households (100.0%) falling below the poverty line.
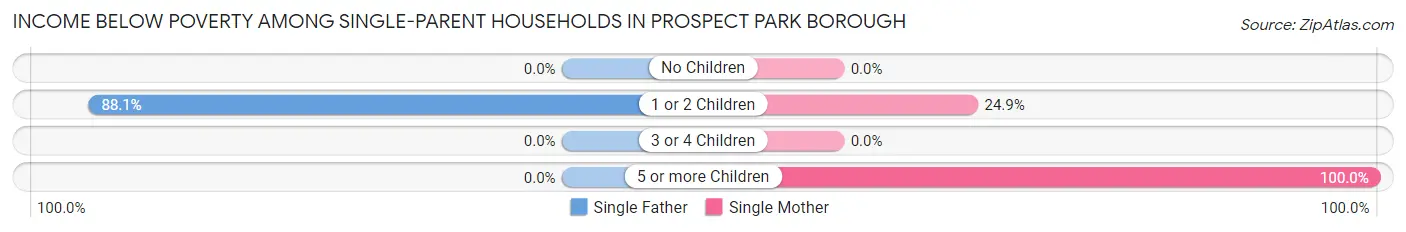
| Children | Single Father | Single Mother |
| No Children | 0 (0.0%) | 0 (0.0%) |
| 1 or 2 Children | 74 (88.1%) | 92 (24.9%) |
| 3 or 4 Children | 0 (0.0%) | 0 (0.0%) |
| 5 or more Children | 0 (0.0%) | 19 (100.0%) |
| Total | 74 (52.9%) | 111 (20.8%) |
Income Below Poverty Among Married-Couple vs Single-Parent Households in Prospect Park borough
The poverty data for Prospect Park borough shows that 100 of the married-couple family households (9.9%) and 185 of the single-parent households (27.5%) are living below the poverty level. Within the married-couple family households, those with no children have the highest poverty rate, with 100 households (13.8%) falling below the poverty line. Among the single-parent households, those with 5 or more children have the highest poverty rate, with 19 household (100.0%) living below poverty.
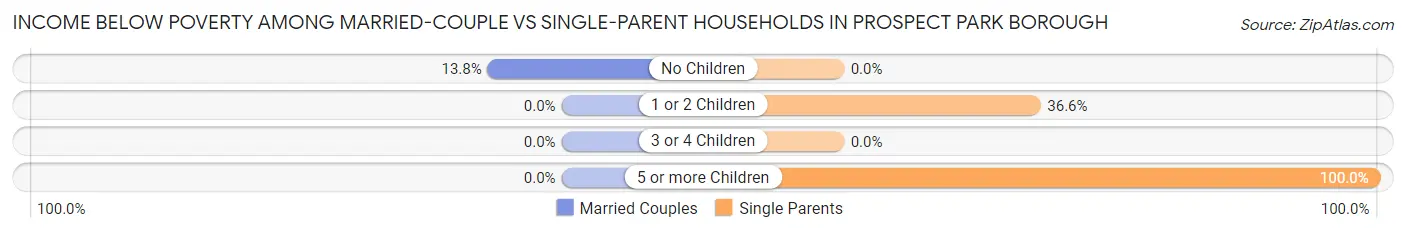
| Children | Married-Couple Families | Single-Parent Households |
| No Children | 100 (13.8%) | 0 (0.0%) |
| 1 or 2 Children | 0 (0.0%) | 166 (36.6%) |
| 3 or 4 Children | 0 (0.0%) | 0 (0.0%) |
| 5 or more Children | 0 (0.0%) | 19 (100.0%) |
| Total | 100 (9.9%) | 185 (27.5%) |
Race in Prospect Park borough
The most populous races in Prospect Park borough are White / Caucasian (4,812 | 75.1%), Black / African American (715 | 11.2%), and Two or more Races (599 | 9.3%).
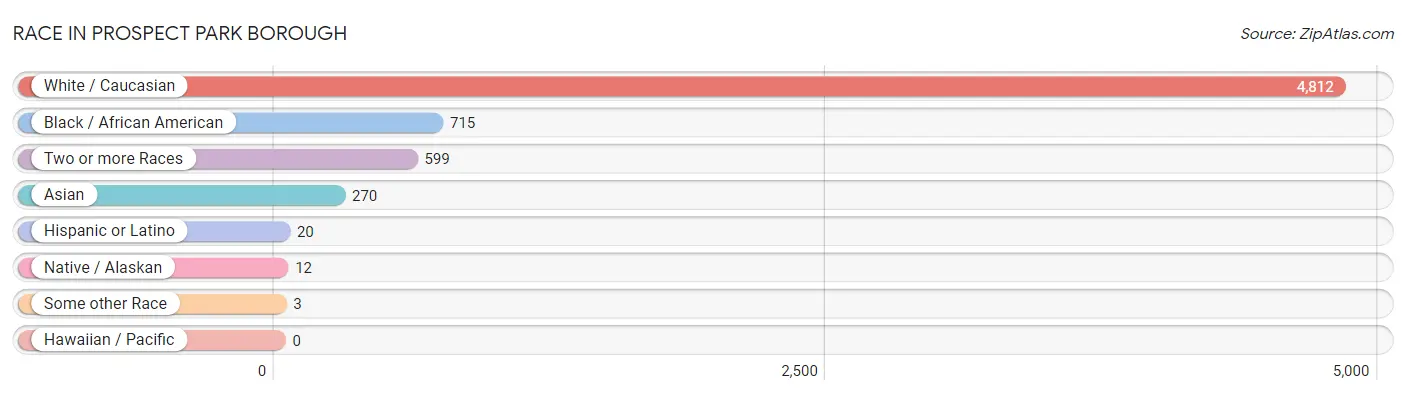
| Race | # Population | % Population |
| Asian | 270 | 4.2% |
| Black / African American | 715 | 11.2% |
| Hawaiian / Pacific | 0 | 0.0% |
| Hispanic or Latino | 20 | 0.3% |
| Native / Alaskan | 12 | 0.2% |
| White / Caucasian | 4,812 | 75.1% |
| Two or more Races | 599 | 9.3% |
| Some other Race | 3 | 0.1% |
| Total | 6,411 | 100.0% |
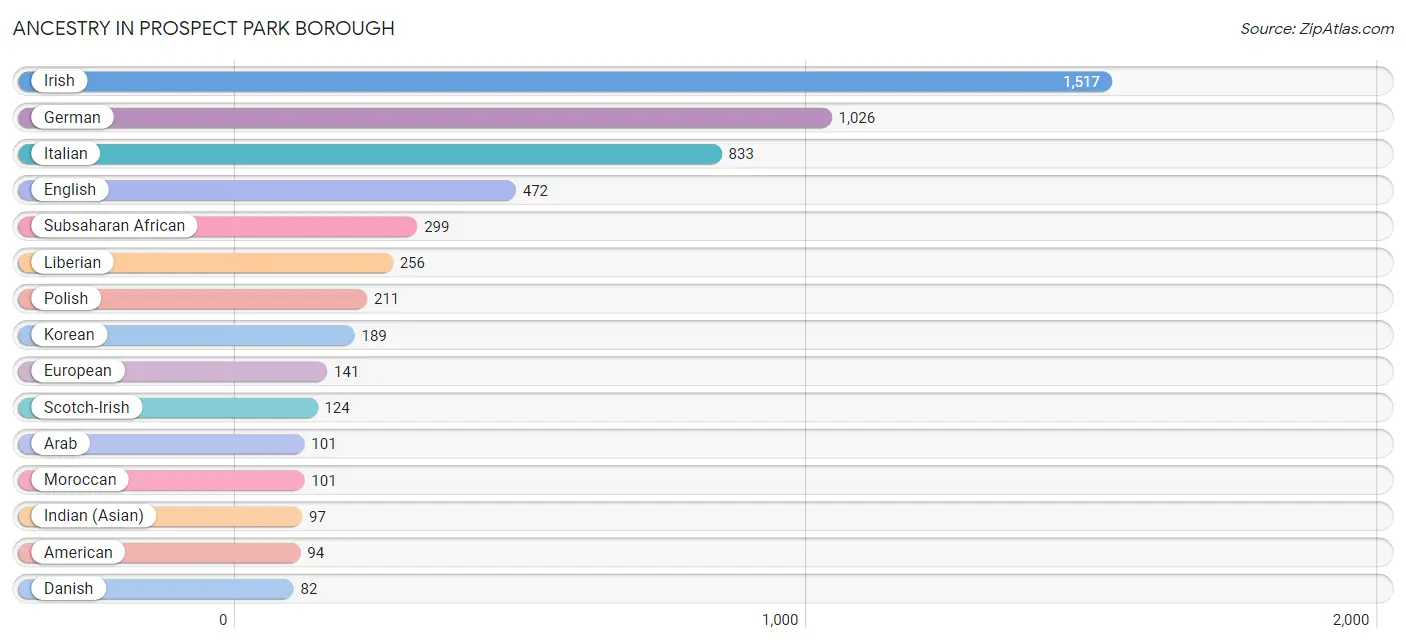
Ancestry in Prospect Park borough
The most populous ancestries reported in Prospect Park borough are Irish (1,517 | 23.7%), German (1,026 | 16.0%), Italian (833 | 13.0%), English (472 | 7.4%), and Subsaharan African (299 | 4.7%), together accounting for 64.7% of all Prospect Park borough residents.
| Ancestry | # Population | % Population |
| African | 43 | 0.7% |
| American | 94 | 1.5% |
| Arab | 101 | 1.6% |
| Belgian | 18 | 0.3% |
| Brazilian | 19 | 0.3% |
| British | 13 | 0.2% |
| Cherokee | 39 | 0.6% |
| Czech | 22 | 0.3% |
| Danish | 82 | 1.3% |
| Dutch | 60 | 0.9% |
| English | 472 | 7.4% |
| European | 141 | 2.2% |
| German | 1,026 | 16.0% |
| Greek | 13 | 0.2% |
| Guyanese | 6 | 0.1% |
| Hungarian | 23 | 0.4% |
| Indian (Asian) | 97 | 1.5% |
| Irish | 1,517 | 23.7% |
| Iroquois | 39 | 0.6% |
| Italian | 833 | 13.0% |
| Korean | 189 | 2.9% |
| Liberian | 256 | 4.0% |
| Lithuanian | 28 | 0.4% |
| Moroccan | 101 | 1.6% |
| Northern European | 49 | 0.8% |
| Norwegian | 36 | 0.6% |
| Pennsylvania German | 2 | 0.0% |
| Polish | 211 | 3.3% |
| Portuguese | 15 | 0.2% |
| Puerto Rican | 20 | 0.3% |
| Russian | 24 | 0.4% |
| Scotch-Irish | 124 | 1.9% |
| Sri Lankan | 49 | 0.8% |
| Subsaharan African | 299 | 4.7% |
| Swedish | 16 | 0.3% |
| Ukrainian | 39 | 0.6% |
| Welsh | 48 | 0.7% | View All 37 Rows |
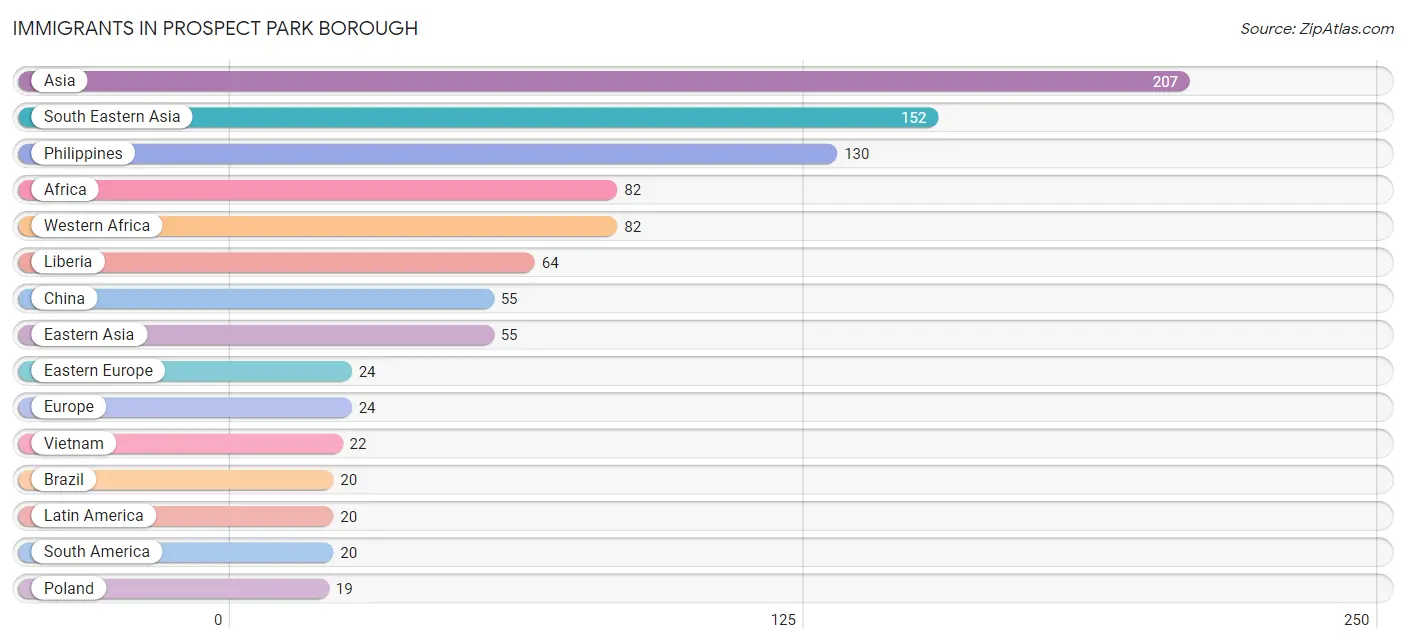
Immigrants in Prospect Park borough
The most numerous immigrant groups reported in Prospect Park borough came from Asia (207 | 3.2%), South Eastern Asia (152 | 2.4%), Philippines (130 | 2.0%), Africa (82 | 1.3%), and Western Africa (82 | 1.3%), together accounting for 10.2% of all Prospect Park borough residents.
| Immigration Origin | # Population | % Population |
| Africa | 82 | 1.3% |
| Asia | 207 | 3.2% |
| Brazil | 20 | 0.3% |
| China | 55 | 0.9% |
| Eastern Asia | 55 | 0.9% |
| Eastern Europe | 24 | 0.4% |
| Europe | 24 | 0.4% |
| Ghana | 6 | 0.1% |
| Latin America | 20 | 0.3% |
| Liberia | 64 | 1.0% |
| Nigeria | 12 | 0.2% |
| Philippines | 130 | 2.0% |
| Poland | 19 | 0.3% |
| South America | 20 | 0.3% |
| South Eastern Asia | 152 | 2.4% |
| Ukraine | 5 | 0.1% |
| Vietnam | 22 | 0.3% |
| Western Africa | 82 | 1.3% | View All 18 Rows |
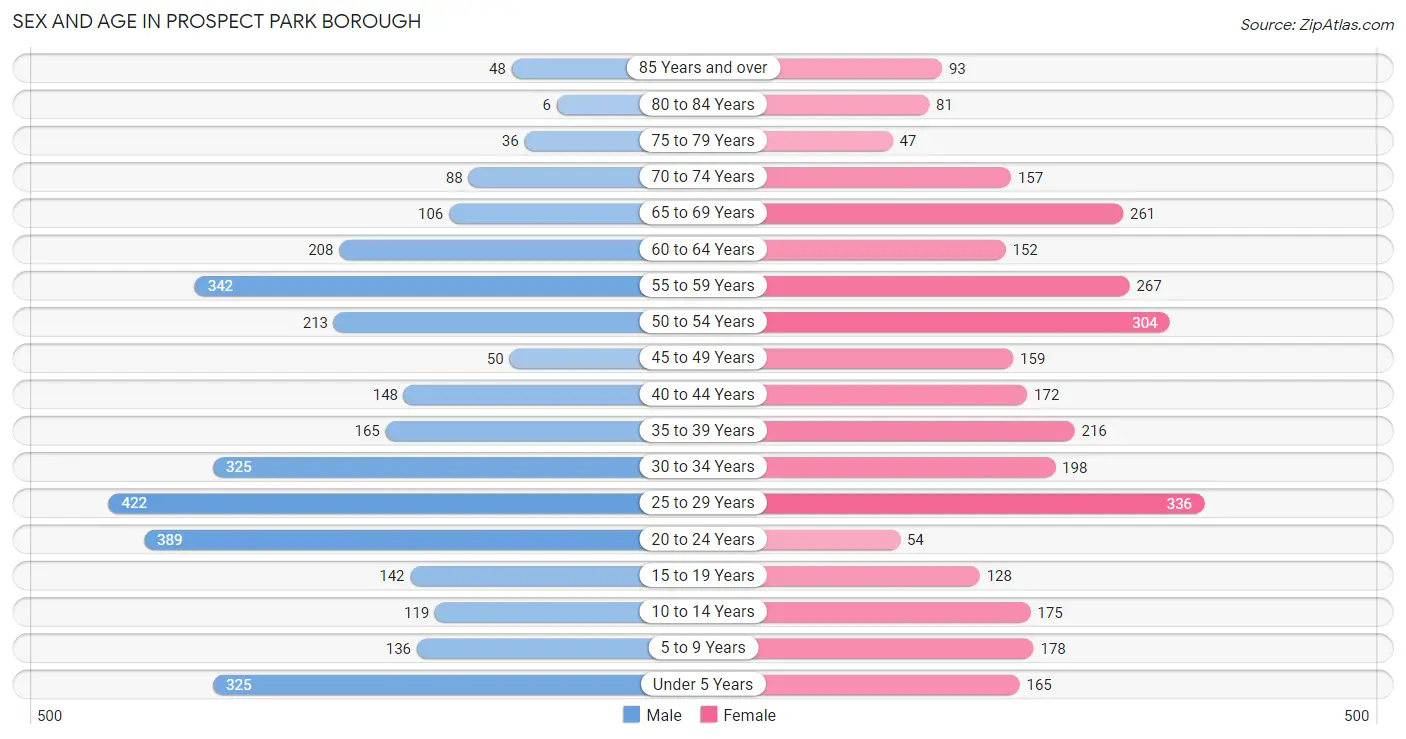
Sex and Age in Prospect Park borough
Sex and Age in Prospect Park borough
The most populous age groups in Prospect Park borough are 25 to 29 Years (422 | 12.9%) for men and 25 to 29 Years (336 | 10.7%) for women.
| Age Bracket | Male | Female |
| Under 5 Years | 325 (9.9%) | 165 (5.2%) |
| 5 to 9 Years | 136 (4.2%) | 178 (5.7%) |
| 10 to 14 Years | 119 (3.6%) | 175 (5.6%) |
| 15 to 19 Years | 142 (4.3%) | 128 (4.1%) |
| 20 to 24 Years | 389 (11.9%) | 54 (1.7%) |
| 25 to 29 Years | 422 (12.9%) | 336 (10.7%) |
| 30 to 34 Years | 325 (9.9%) | 198 (6.3%) |
| 35 to 39 Years | 165 (5.1%) | 216 (6.9%) |
| 40 to 44 Years | 148 (4.5%) | 172 (5.5%) |
| 45 to 49 Years | 50 (1.5%) | 159 (5.1%) |
| 50 to 54 Years | 213 (6.5%) | 304 (9.7%) |
| 55 to 59 Years | 342 (10.5%) | 267 (8.5%) |
| 60 to 64 Years | 208 (6.4%) | 152 (4.8%) |
| 65 to 69 Years | 106 (3.2%) | 261 (8.3%) |
| 70 to 74 Years | 88 (2.7%) | 157 (5.0%) |
| 75 to 79 Years | 36 (1.1%) | 47 (1.5%) |
| 80 to 84 Years | 6 (0.2%) | 81 (2.6%) |
| 85 Years and over | 48 (1.5%) | 93 (3.0%) |
| Total | 3,268 (100.0%) | 3,143 (100.0%) |
Families and Households in Prospect Park borough
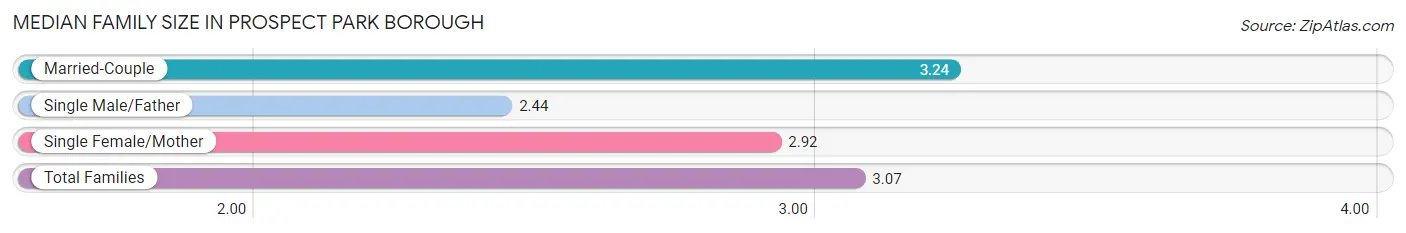
Median Family Size in Prospect Park borough
The median family size in Prospect Park borough is 3.07 persons per family, with married-couple families (1,009 | 60.0%) accounting for the largest median family size of 3.24 persons per family. On the other hand, single male/father families (140 | 8.3%) represent the smallest median family size with 2.44 persons per family.
| Family Type | # Families | Family Size |
| Married-Couple | 1,009 (60.0%) | 3.24 |
| Single Male/Father | 140 (8.3%) | 2.44 |
| Single Female/Mother | 533 (31.7%) | 2.92 |
| Total Families | 1,682 (100.0%) | 3.07 |
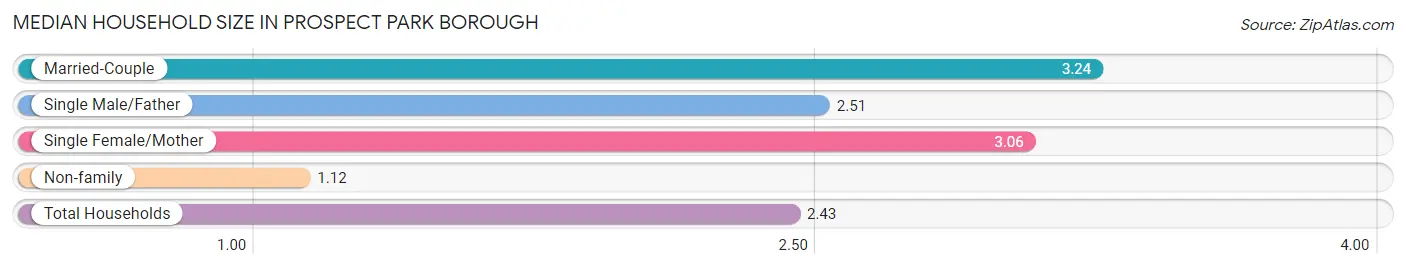
Median Household Size in Prospect Park borough
The median household size in Prospect Park borough is 2.43 persons per household, with married-couple households (1,009 | 39.3%) accounting for the largest median household size of 3.24 persons per household. non-family households (885 | 34.5%) represent the smallest median household size with 1.12 persons per household.
| Household Type | # Households | Household Size |
| Married-Couple | 1,009 (39.3%) | 3.24 |
| Single Male/Father | 140 (5.4%) | 2.51 |
| Single Female/Mother | 533 (20.8%) | 3.06 |
| Non-family | 885 (34.5%) | 1.12 |
| Total Households | 2,567 (100.0%) | 2.43 |
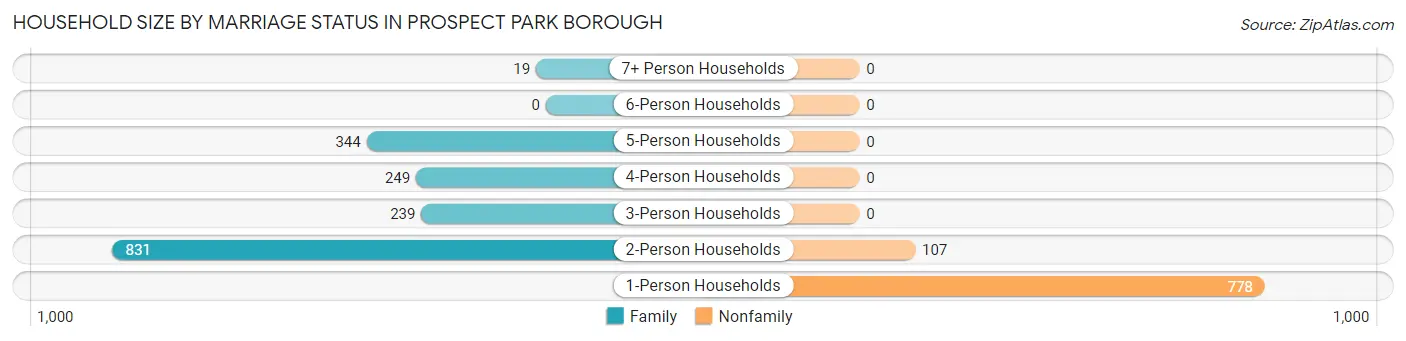
Household Size by Marriage Status in Prospect Park borough
Out of a total of 2,567 households in Prospect Park borough, 1,682 (65.5%) are family households, while 885 (34.5%) are nonfamily households. The most numerous type of family households are 2-person households, comprising 831, and the most common type of nonfamily households are 1-person households, comprising 778.
| Household Size | Family Households | Nonfamily Households |
| 1-Person Households | - | 778 (30.3%) |
| 2-Person Households | 831 (32.4%) | 107 (4.2%) |
| 3-Person Households | 239 (9.3%) | 0 (0.0%) |
| 4-Person Households | 249 (9.7%) | 0 (0.0%) |
| 5-Person Households | 344 (13.4%) | 0 (0.0%) |
| 6-Person Households | 0 (0.0%) | 0 (0.0%) |
| 7+ Person Households | 19 (0.7%) | 0 (0.0%) |
| Total | 1,682 (65.5%) | 885 (34.5%) |
Female Fertility in Prospect Park borough
Fertility by Age in Prospect Park borough
Average fertility rate in Prospect Park borough is 62.0 births per 1,000 women. Women in the age bracket of 20 to 34 years have the highest fertility rate with 139.0 births per 1,000 women. Women in the age bracket of 20 to 34 years acount for 100.0% of all women with births.
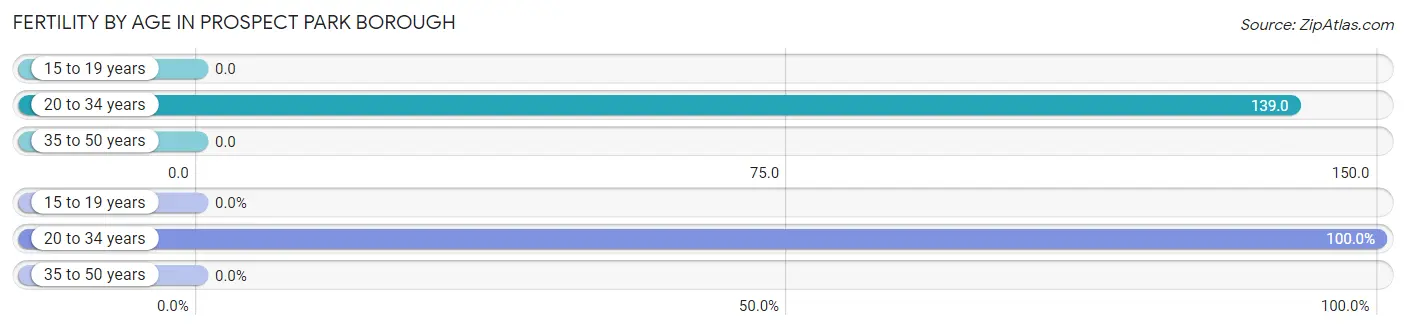
| Age Bracket | Women with Births | Births / 1,000 Women |
| 15 to 19 years | 0 (0.0%) | 0.0 |
| 20 to 34 years | 82 (100.0%) | 139.0 |
| 35 to 50 years | 0 (0.0%) | 0.0 |
| Total | 82 (100.0%) | 62.0 |
Fertility by Age by Marriage Status in Prospect Park borough
46.3% of women with births (82) in Prospect Park borough are married. The highest percentage of unmarried women with births falls into 20 to 34 years age bracket with 53.7% of them unmarried at the time of birth, while the lowest percentage of unmarried women with births belong to 20 to 34 years age bracket with 53.7% of them unmarried.
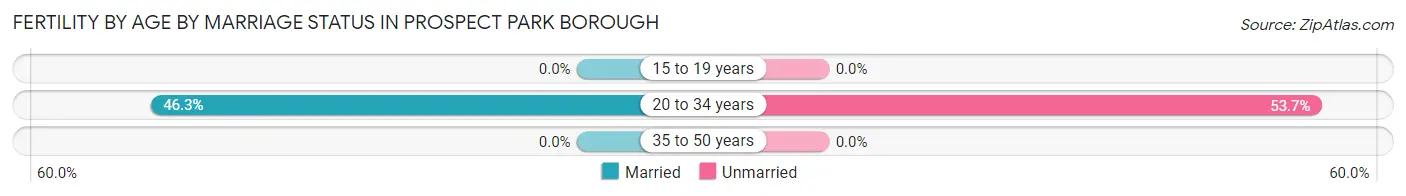
| Age Bracket | Married | Unmarried |
| 15 to 19 years | 0 (0.0%) | 0 (0.0%) |
| 20 to 34 years | 38 (46.3%) | 44 (53.7%) |
| 35 to 50 years | 0 (0.0%) | 0 (0.0%) |
| Total | 38 (46.3%) | 44 (53.7%) |
Fertility by Education in Prospect Park borough
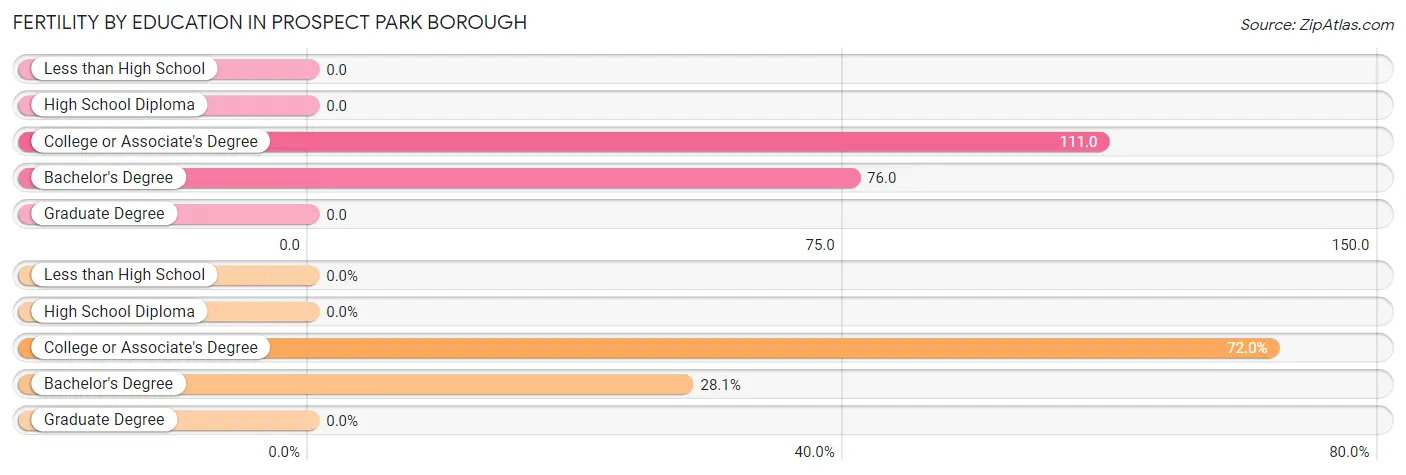
| Educational Attainment | Women with Births | Births / 1,000 Women |
| Less than High School | 0 (0.0%) | 0.0 |
| High School Diploma | 0 (0.0%) | 0.0 |
| College or Associate's Degree | 59 (72.0%) | 111.0 |
| Bachelor's Degree | 23 (28.1%) | 76.0 |
| Graduate Degree | 0 (0.0%) | 0.0 |
| Total | 82 (100.0%) | 62.0 |
Fertility by Education by Marriage Status in Prospect Park borough
53.7% of women with births in Prospect Park borough are unmarried. Women with the educational attainment of bachelor's degree are most likely to be married with 100.0% of them married at childbirth, while women with the educational attainment of college or associate's degree are least likely to be married with 74.6% of them unmarried at childbirth.
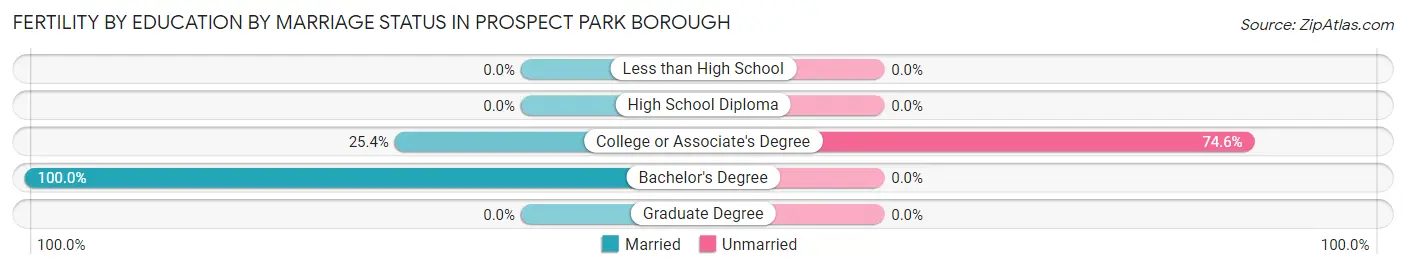
| Educational Attainment | Married | Unmarried |
| Less than High School | 0 (0.0%) | 0 (0.0%) |
| High School Diploma | 0 (0.0%) | 0 (0.0%) |
| College or Associate's Degree | 15 (25.4%) | 44 (74.6%) |
| Bachelor's Degree | 23 (100.0%) | 0 (0.0%) |
| Graduate Degree | 0 (0.0%) | 0 (0.0%) |
| Total | 38 (46.3%) | 44 (53.7%) |
Employment Characteristics in Prospect Park borough
Employment by Class of Employer in Prospect Park borough
Among the 3,687 employed individuals in Prospect Park borough, private company employees (2,900 | 78.6%), not-for-profit organizations (407 | 11.0%), and state government employees (218 | 5.9%) make up the most common classes of employment.
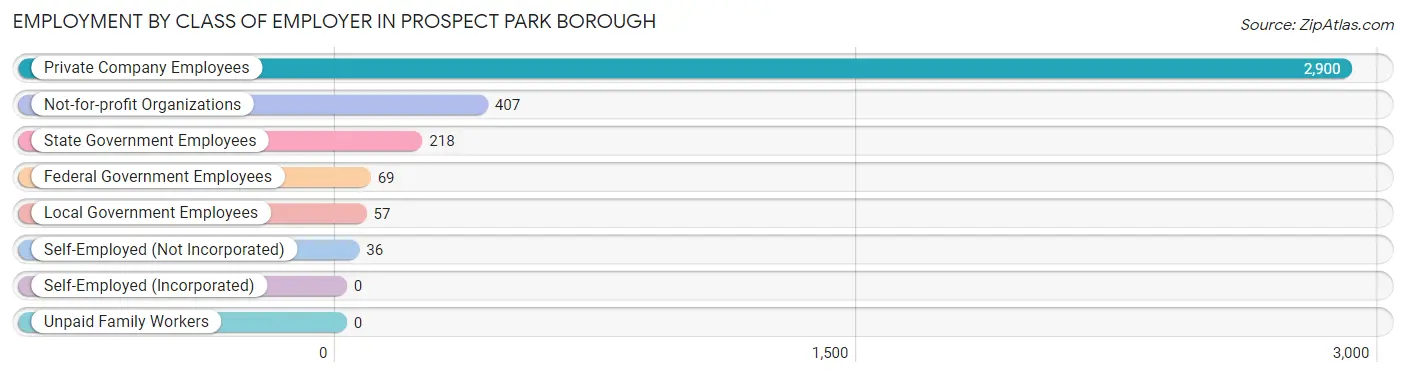
| Employer Class | # Employees | % Employees |
| Private Company Employees | 2,900 | 78.6% |
| Self-Employed (Incorporated) | 0 | 0.0% |
| Self-Employed (Not Incorporated) | 36 | 1.0% |
| Not-for-profit Organizations | 407 | 11.0% |
| Local Government Employees | 57 | 1.5% |
| State Government Employees | 218 | 5.9% |
| Federal Government Employees | 69 | 1.9% |
| Unpaid Family Workers | 0 | 0.0% |
| Total | 3,687 | 100.0% |
Employment Status by Age in Prospect Park borough
According to the labor force statistics for Prospect Park borough, out of the total population over 16 years of age (5,220), 76.2% or 3,978 individuals are in the labor force, with 5.9% or 235 of them unemployed. The age group with the highest labor force participation rate is 30 to 34 years, with 100.0% or 523 individuals in the labor force. Within the labor force, the 55 to 59 years age range has the highest percentage of unemployed individuals, with 13.8% or 75 of them being unemployed.
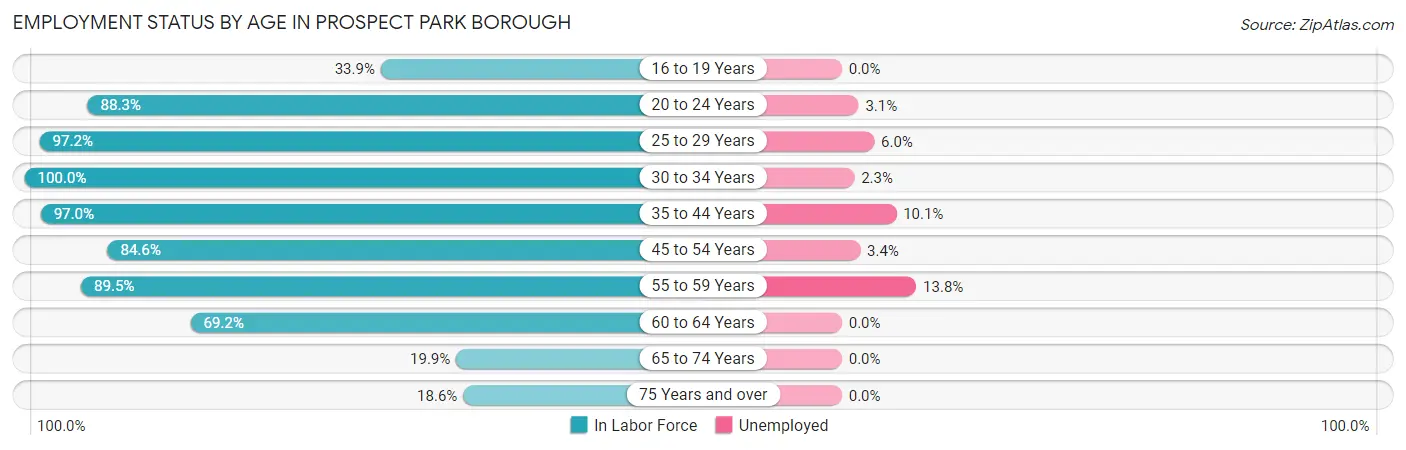
| Age Bracket | In Labor Force | Unemployed |
| 16 to 19 Years | 60 (33.9%) | 0 (0.0%) |
| 20 to 24 Years | 391 (88.3%) | 12 (3.1%) |
| 25 to 29 Years | 737 (97.2%) | 44 (6.0%) |
| 30 to 34 Years | 523 (100.0%) | 12 (2.3%) |
| 35 to 44 Years | 680 (97.0%) | 69 (10.1%) |
| 45 to 54 Years | 614 (84.6%) | 21 (3.4%) |
| 55 to 59 Years | 545 (89.5%) | 75 (13.8%) |
| 60 to 64 Years | 249 (69.2%) | 0 (0.0%) |
| 65 to 74 Years | 122 (19.9%) | 0 (0.0%) |
| 75 Years and over | 58 (18.6%) | 0 (0.0%) |
| Total | 3,978 (76.2%) | 235 (5.9%) |
Employment Status by Educational Attainment in Prospect Park borough
According to labor force statistics for Prospect Park borough, 91.1% of individuals (3,350) out of the total population between 25 and 64 years of age (3,677) are in the labor force, with 6.6% or 221 of them being unemployed. The group with the highest labor force participation rate are those with the educational attainment of bachelor's degree or higher, with 95.6% or 957 individuals in the labor force. Within the labor force, individuals with less than high school education have the highest percentage of unemployment, with 8.2% or 16 of them being unemployed.
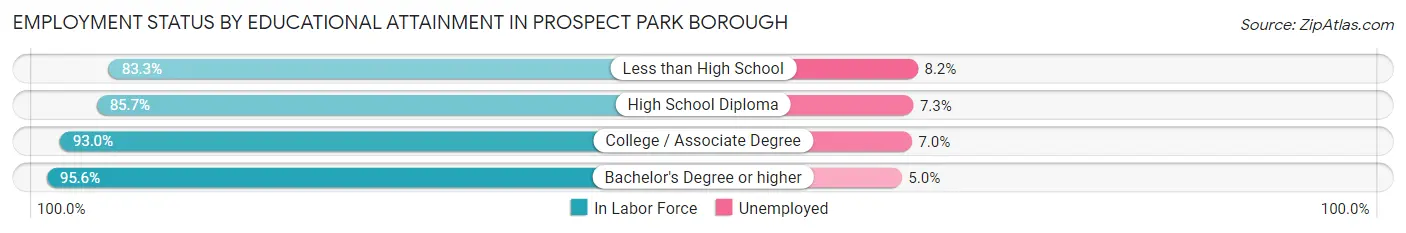
| Educational Attainment | In Labor Force | Unemployed |
| Less than High School | 194 (83.3%) | 19 (8.2%) |
| High School Diploma | 872 (85.7%) | 74 (7.3%) |
| College / Associate Degree | 1,325 (93.0%) | 100 (7.0%) |
| Bachelor's Degree or higher | 957 (95.6%) | 50 (5.0%) |
| Total | 3,350 (91.1%) | 243 (6.6%) |
Employment Occupations by Sex in Prospect Park borough
Management, Business, Science and Arts Occupations
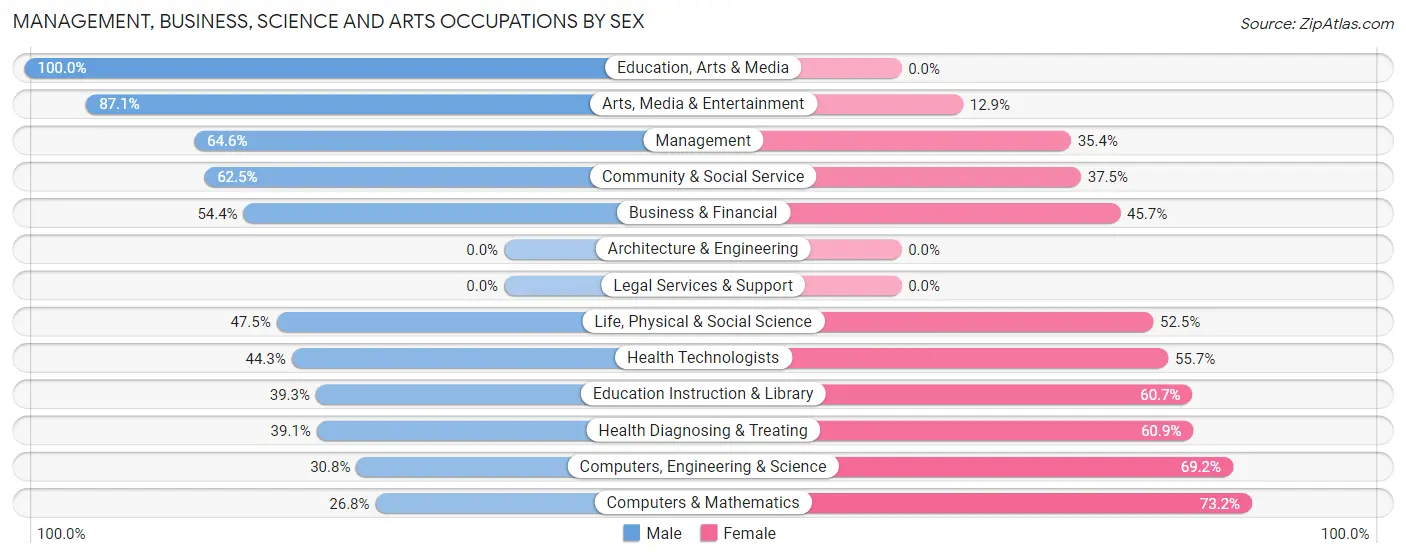
The most common Management, Business, Science and Arts occupations in Prospect Park borough are Management (475 | 12.7%), Community & Social Service (451 | 12.0%), Computers, Engineering & Science (305 | 8.1%), Computers & Mathematics (246 | 6.6%), and Education Instruction & Library (242 | 6.5%).
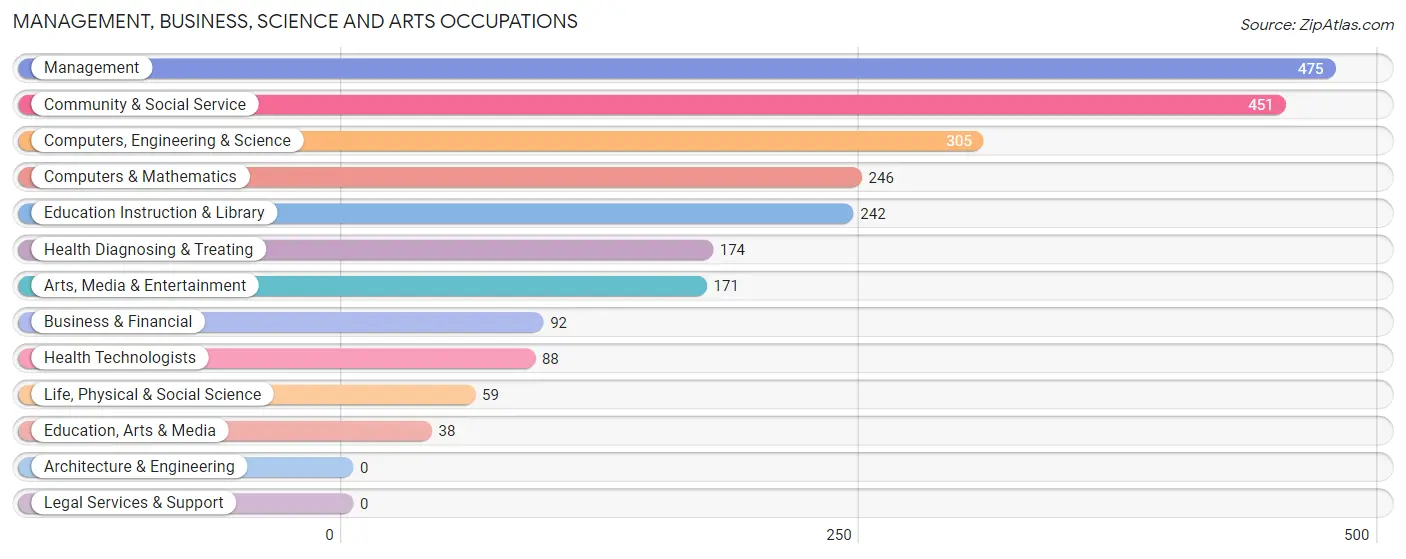
Management, Business, Science and Arts Occupations by Sex
Within the Management, Business, Science and Arts occupations in Prospect Park borough, the most male-oriented occupations are Education, Arts & Media (100.0%), Arts, Media & Entertainment (87.1%), and Management (64.6%), while the most female-oriented occupations are Computers & Mathematics (73.2%), Computers, Engineering & Science (69.2%), and Health Diagnosing & Treating (60.9%).
| Occupation | Male | Female |
| Management | 307 (64.6%) | 168 (35.4%) |
| Business & Financial | 50 (54.3%) | 42 (45.7%) |
| Computers, Engineering & Science | 94 (30.8%) | 211 (69.2%) |
| Computers & Mathematics | 66 (26.8%) | 180 (73.2%) |
| Architecture & Engineering | 0 (0.0%) | 0 (0.0%) |
| Life, Physical & Social Science | 28 (47.5%) | 31 (52.5%) |
| Community & Social Service | 282 (62.5%) | 169 (37.5%) |
| Education, Arts & Media | 38 (100.0%) | 0 (0.0%) |
| Legal Services & Support | 0 (0.0%) | 0 (0.0%) |
| Education Instruction & Library | 95 (39.3%) | 147 (60.7%) |
| Arts, Media & Entertainment | 149 (87.1%) | 22 (12.9%) |
| Health Diagnosing & Treating | 68 (39.1%) | 106 (60.9%) |
| Health Technologists | 39 (44.3%) | 49 (55.7%) |
| Total (Category) | 801 (53.5%) | 696 (46.5%) |
| Total (Overall) | 2,054 (54.8%) | 1,692 (45.2%) |
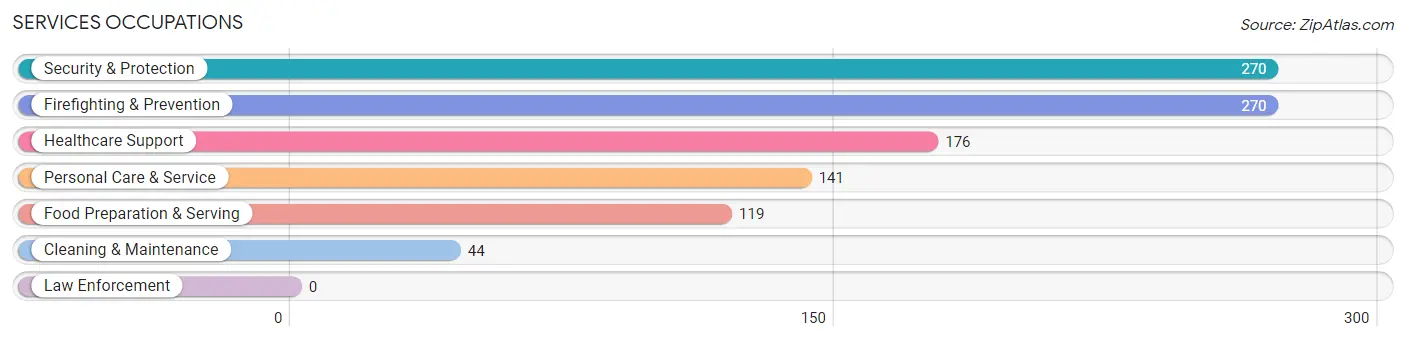
Services Occupations
The most common Services occupations in Prospect Park borough are Security & Protection (270 | 7.2%), Firefighting & Prevention (270 | 7.2%), Healthcare Support (176 | 4.7%), Personal Care & Service (141 | 3.8%), and Food Preparation & Serving (119 | 3.2%).
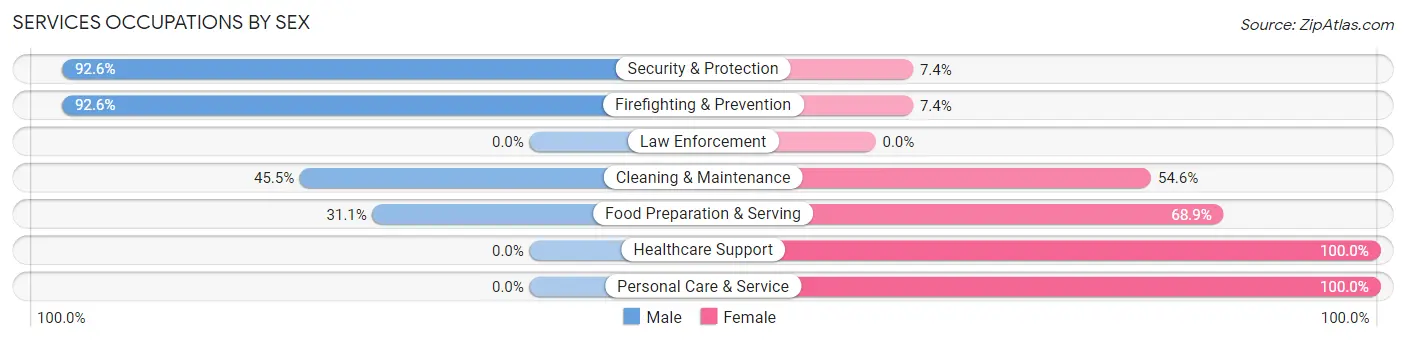
Services Occupations by Sex
Within the Services occupations in Prospect Park borough, the most male-oriented occupations are Security & Protection (92.6%), Firefighting & Prevention (92.6%), and Cleaning & Maintenance (45.5%), while the most female-oriented occupations are Healthcare Support (100.0%), Personal Care & Service (100.0%), and Food Preparation & Serving (68.9%).
| Occupation | Male | Female |
| Healthcare Support | 0 (0.0%) | 176 (100.0%) |
| Security & Protection | 250 (92.6%) | 20 (7.4%) |
| Firefighting & Prevention | 250 (92.6%) | 20 (7.4%) |
| Law Enforcement | 0 (0.0%) | 0 (0.0%) |
| Food Preparation & Serving | 37 (31.1%) | 82 (68.9%) |
| Cleaning & Maintenance | 20 (45.5%) | 24 (54.5%) |
| Personal Care & Service | 0 (0.0%) | 141 (100.0%) |
| Total (Category) | 307 (40.9%) | 443 (59.1%) |
| Total (Overall) | 2,054 (54.8%) | 1,692 (45.2%) |
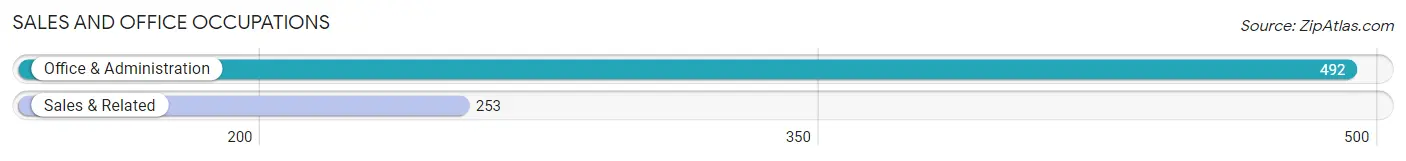
Sales and Office Occupations
The most common Sales and Office occupations in Prospect Park borough are Office & Administration (492 | 13.1%), and Sales & Related (253 | 6.8%).
Sales and Office Occupations by Sex
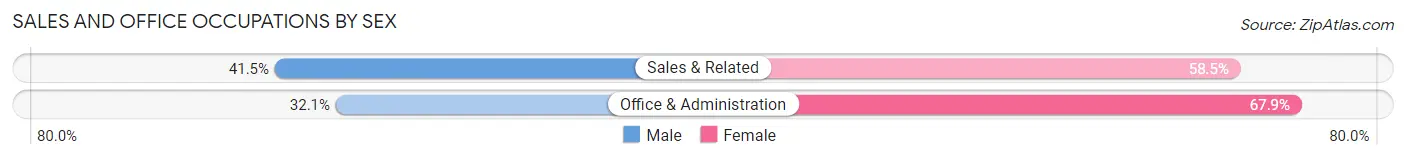
| Occupation | Male | Female |
| Sales & Related | 105 (41.5%) | 148 (58.5%) |
| Office & Administration | 158 (32.1%) | 334 (67.9%) |
| Total (Category) | 263 (35.3%) | 482 (64.7%) |
| Total (Overall) | 2,054 (54.8%) | 1,692 (45.2%) |
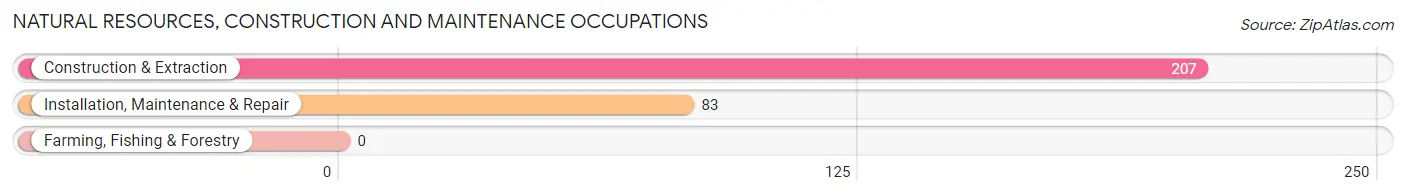
Natural Resources, Construction and Maintenance Occupations
The most common Natural Resources, Construction and Maintenance occupations in Prospect Park borough are Construction & Extraction (207 | 5.5%), and Installation, Maintenance & Repair (83 | 2.2%).
Natural Resources, Construction and Maintenance Occupations by Sex
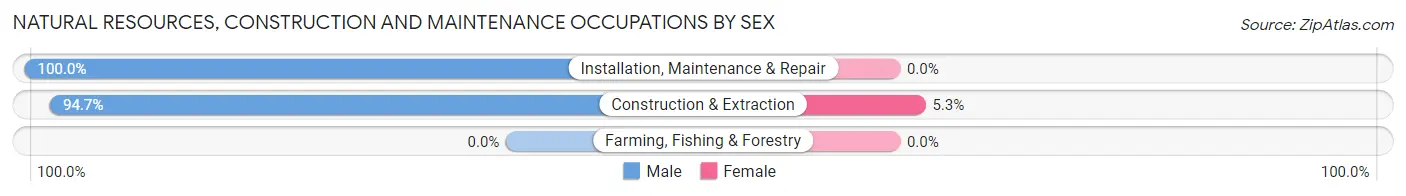
| Occupation | Male | Female |
| Farming, Fishing & Forestry | 0 (0.0%) | 0 (0.0%) |
| Construction & Extraction | 196 (94.7%) | 11 (5.3%) |
| Installation, Maintenance & Repair | 83 (100.0%) | 0 (0.0%) |
| Total (Category) | 279 (96.2%) | 11 (3.8%) |
| Total (Overall) | 2,054 (54.8%) | 1,692 (45.2%) |
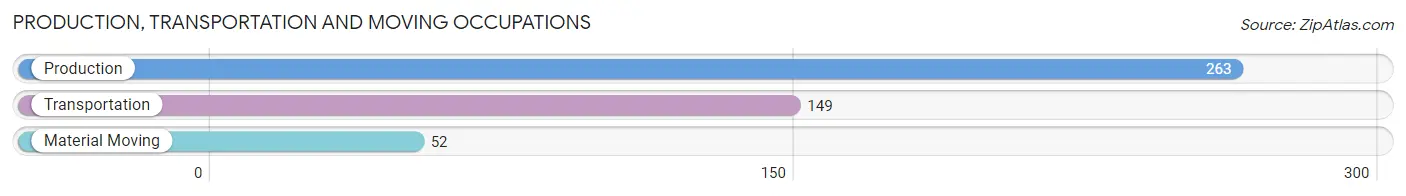
Production, Transportation and Moving Occupations
The most common Production, Transportation and Moving occupations in Prospect Park borough are Production (263 | 7.0%), Transportation (149 | 4.0%), and Material Moving (52 | 1.4%).
Production, Transportation and Moving Occupations by Sex
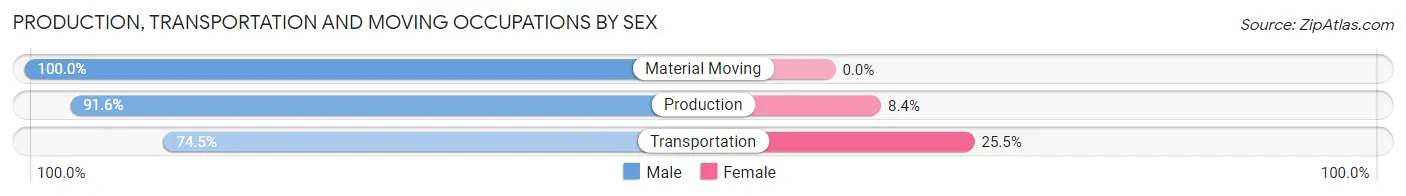
| Occupation | Male | Female |
| Production | 241 (91.6%) | 22 (8.4%) |
| Transportation | 111 (74.5%) | 38 (25.5%) |
| Material Moving | 52 (100.0%) | 0 (0.0%) |
| Total (Category) | 404 (87.1%) | 60 (12.9%) |
| Total (Overall) | 2,054 (54.8%) | 1,692 (45.2%) |
Employment Industries by Sex in Prospect Park borough
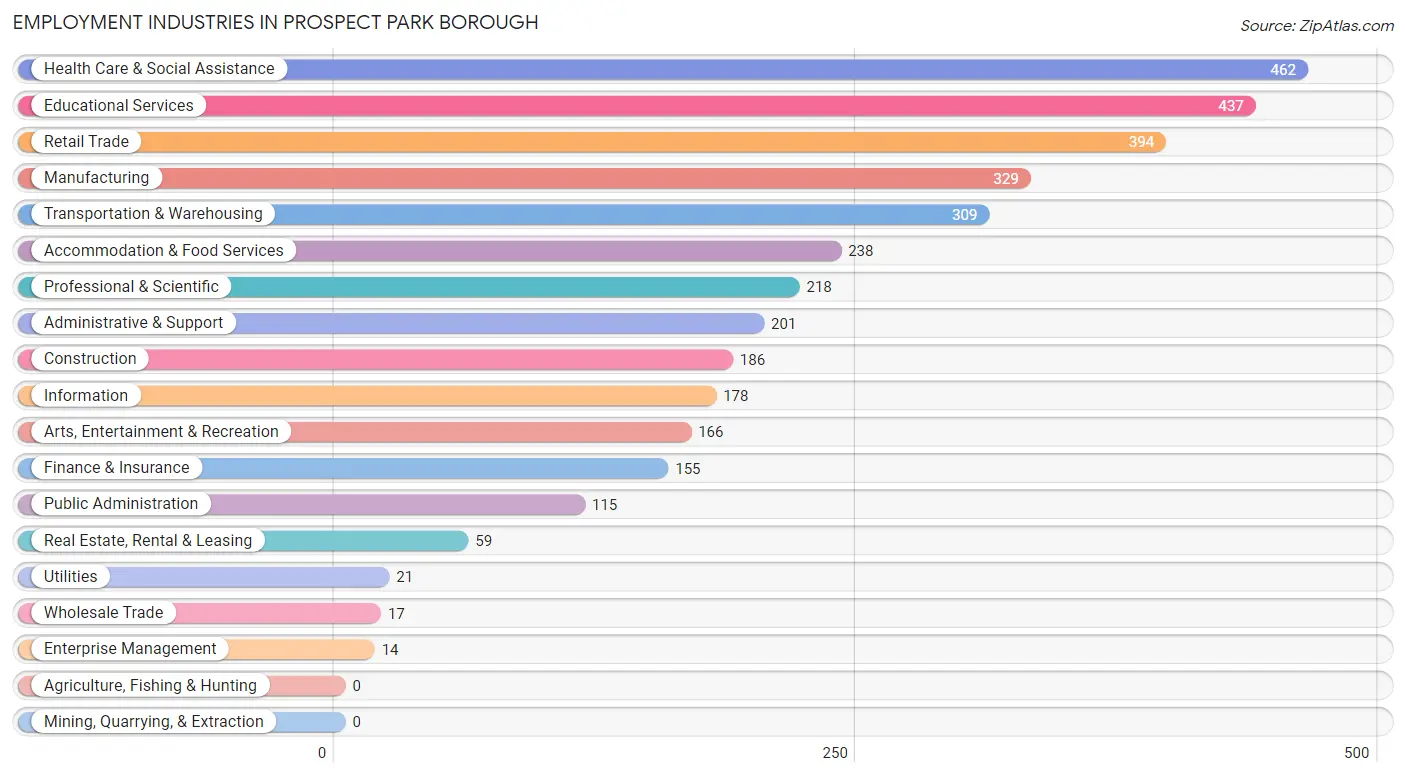
Employment Industries in Prospect Park borough
The major employment industries in Prospect Park borough include Health Care & Social Assistance (462 | 12.3%), Educational Services (437 | 11.7%), Retail Trade (394 | 10.5%), Manufacturing (329 | 8.8%), and Transportation & Warehousing (309 | 8.3%).
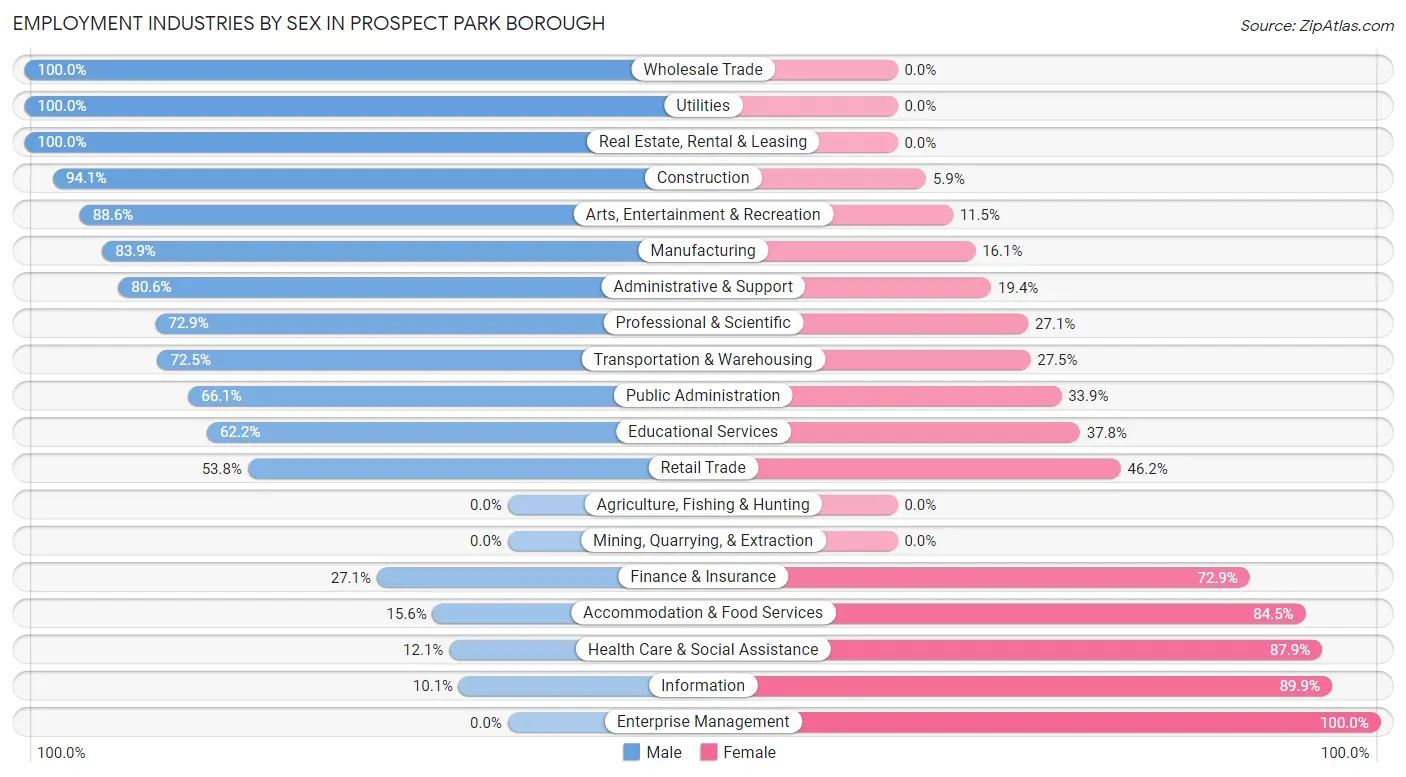
Employment Industries by Sex in Prospect Park borough
The Prospect Park borough industries that see more men than women are Wholesale Trade (100.0%), Utilities (100.0%), and Real Estate, Rental & Leasing (100.0%), whereas the industries that tend to have a higher number of women are Enterprise Management (100.0%), Information (89.9%), and Health Care & Social Assistance (87.9%).
| Industry | Male | Female |
| Agriculture, Fishing & Hunting | 0 (0.0%) | 0 (0.0%) |
| Mining, Quarrying, & Extraction | 0 (0.0%) | 0 (0.0%) |
| Construction | 175 (94.1%) | 11 (5.9%) |
| Manufacturing | 276 (83.9%) | 53 (16.1%) |
| Wholesale Trade | 17 (100.0%) | 0 (0.0%) |
| Retail Trade | 212 (53.8%) | 182 (46.2%) |
| Transportation & Warehousing | 224 (72.5%) | 85 (27.5%) |
| Utilities | 21 (100.0%) | 0 (0.0%) |
| Information | 18 (10.1%) | 160 (89.9%) |
| Finance & Insurance | 42 (27.1%) | 113 (72.9%) |
| Real Estate, Rental & Leasing | 59 (100.0%) | 0 (0.0%) |
| Professional & Scientific | 159 (72.9%) | 59 (27.1%) |
| Enterprise Management | 0 (0.0%) | 14 (100.0%) |
| Administrative & Support | 162 (80.6%) | 39 (19.4%) |
| Educational Services | 272 (62.2%) | 165 (37.8%) |
| Health Care & Social Assistance | 56 (12.1%) | 406 (87.9%) |
| Arts, Entertainment & Recreation | 147 (88.5%) | 19 (11.5%) |
| Accommodation & Food Services | 37 (15.5%) | 201 (84.5%) |
| Public Administration | 76 (66.1%) | 39 (33.9%) |
| Total | 2,054 (54.8%) | 1,692 (45.2%) |
Education in Prospect Park borough
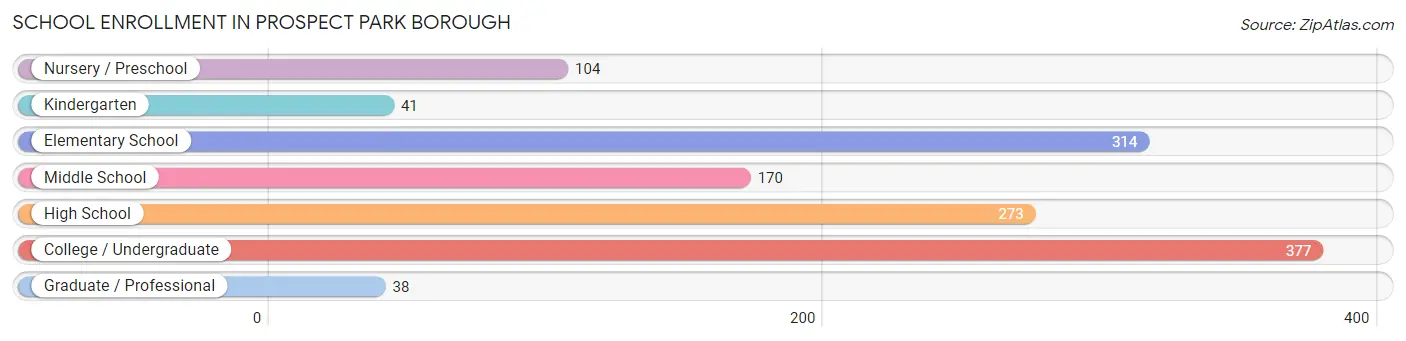
School Enrollment in Prospect Park borough
The most common levels of schooling among the 1,317 students in Prospect Park borough are college / undergraduate (377 | 28.6%), elementary school (314 | 23.8%), and high school (273 | 20.7%).
| School Level | # Students | % Students |
| Nursery / Preschool | 104 | 7.9% |
| Kindergarten | 41 | 3.1% |
| Elementary School | 314 | 23.8% |
| Middle School | 170 | 12.9% |
| High School | 273 | 20.7% |
| College / Undergraduate | 377 | 28.6% |
| Graduate / Professional | 38 | 2.9% |
| Total | 1,317 | 100.0% |
School Enrollment by Age by Funding Source in Prospect Park borough
Out of a total of 1,317 students who are enrolled in schools in Prospect Park borough, 203 (15.4%) attend a private institution, while the remaining 1,114 (84.6%) are enrolled in public schools. The age group of 18 to 19 year olds has the highest likelihood of being enrolled in private schools, with 20 (100.0% in the age bracket) enrolled. Conversely, the age group of 15 to 17 year olds has the lowest likelihood of being enrolled in a private school, with 190 (100.0% in the age bracket) attending a public institution.
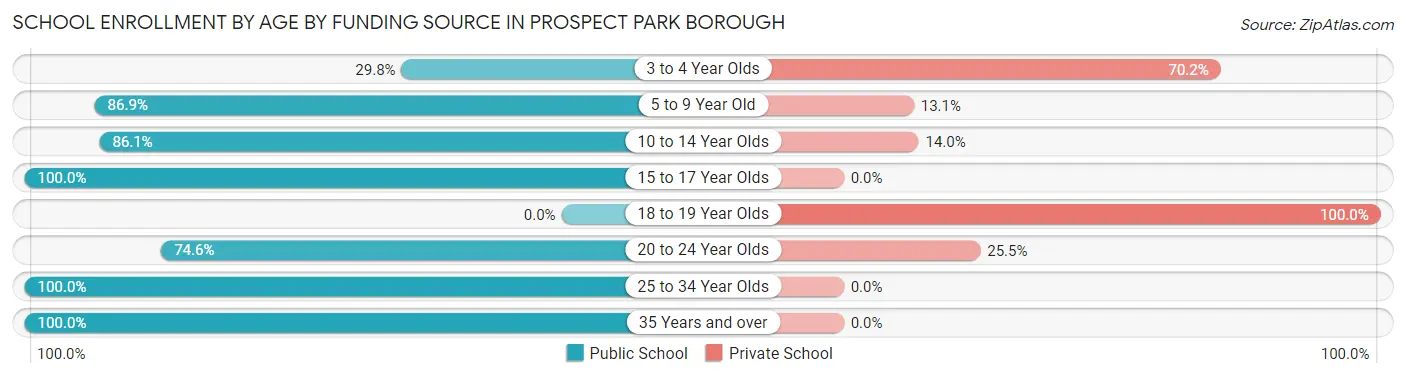
| Age Bracket | Public School | Private School |
| 3 to 4 Year Olds | 31 (29.8%) | 73 (70.2%) |
| 5 to 9 Year Old | 273 (86.9%) | 41 (13.1%) |
| 10 to 14 Year Olds | 253 (86.1%) | 41 (14.0%) |
| 15 to 17 Year Olds | 190 (100.0%) | 0 (0.0%) |
| 18 to 19 Year Olds | 0 (0.0%) | 20 (100.0%) |
| 20 to 24 Year Olds | 82 (74.6%) | 28 (25.5%) |
| 25 to 34 Year Olds | 206 (100.0%) | 0 (0.0%) |
| 35 Years and over | 79 (100.0%) | 0 (0.0%) |
| Total | 1,114 (84.6%) | 203 (15.4%) |
Educational Attainment by Field of Study in Prospect Park borough
Science & technology (222 | 18.5%), arts & humanities (167 | 14.0%), psychology (124 | 10.4%), liberal arts & history (113 | 9.4%), and education (100 | 8.4%) are the most common fields of study among 1,197 individuals in Prospect Park borough who have obtained a bachelor's degree or higher.
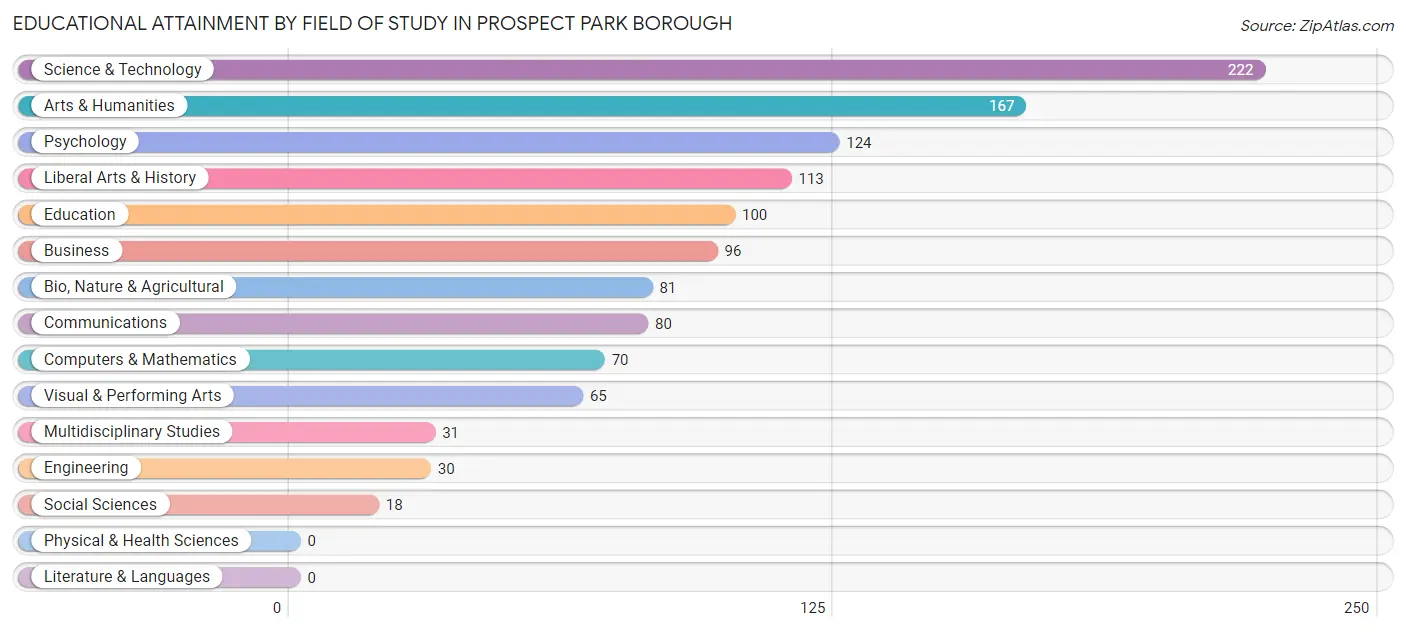
| Field of Study | # Graduates | % Graduates |
| Computers & Mathematics | 70 | 5.9% |
| Bio, Nature & Agricultural | 81 | 6.8% |
| Physical & Health Sciences | 0 | 0.0% |
| Psychology | 124 | 10.4% |
| Social Sciences | 18 | 1.5% |
| Engineering | 30 | 2.5% |
| Multidisciplinary Studies | 31 | 2.6% |
| Science & Technology | 222 | 18.5% |
| Business | 96 | 8.0% |
| Education | 100 | 8.4% |
| Literature & Languages | 0 | 0.0% |
| Liberal Arts & History | 113 | 9.4% |
| Visual & Performing Arts | 65 | 5.4% |
| Communications | 80 | 6.7% |
| Arts & Humanities | 167 | 14.0% |
| Total | 1,197 | 100.0% |
Transportation & Commute in Prospect Park borough
Vehicle Availability by Sex in Prospect Park borough
The most prevalent vehicle ownership categories in Prospect Park borough are males with 2 vehicles (824, accounting for 40.9%) and females with 2 vehicles (665, making up 49.2%).
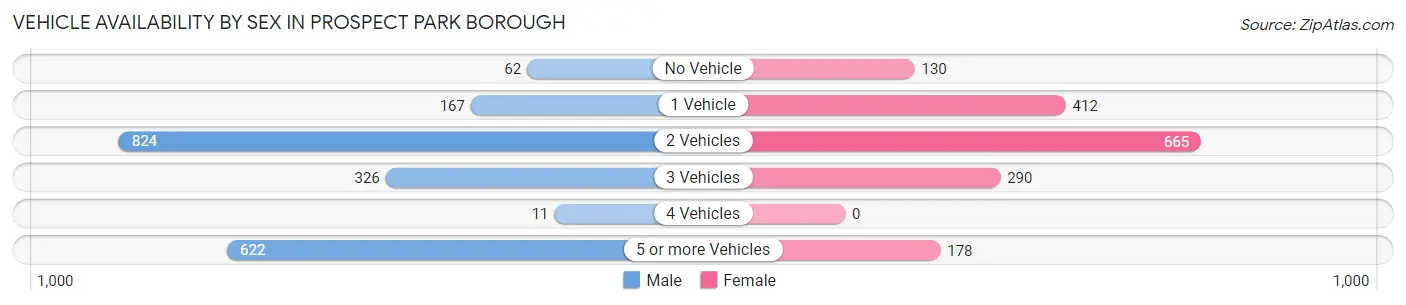
| Vehicles Available | Male | Female |
| No Vehicle | 62 (3.1%) | 130 (7.8%) |
| 1 Vehicle | 167 (8.3%) | 412 (24.6%) |
| 2 Vehicles | 824 (40.9%) | 665 (39.7%) |
| 3 Vehicles | 326 (16.2%) | 290 (17.3%) |
| 4 Vehicles | 11 (0.5%) | 0 (0.0%) |
| 5 or more Vehicles | 622 (30.9%) | 178 (10.6%) |
| Total | 2,012 (100.0%) | 1,675 (100.0%) |
Commute Time in Prospect Park borough
The most frequently occuring commute durations in Prospect Park borough are 5 to 9 minutes (742 commuters, 21.7%), 10 to 14 minutes (467 commuters, 13.7%), and 45 to 59 minutes (391 commuters, 11.4%).
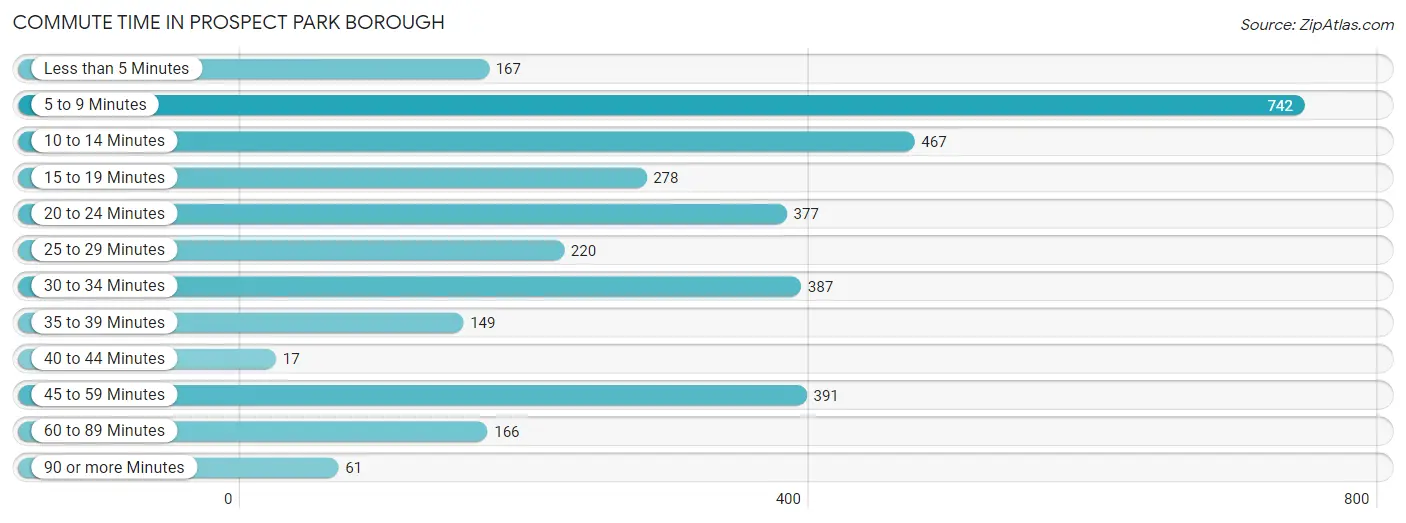
| Commute Time | # Commuters | % Commuters |
| Less than 5 Minutes | 167 | 4.9% |
| 5 to 9 Minutes | 742 | 21.7% |
| 10 to 14 Minutes | 467 | 13.7% |
| 15 to 19 Minutes | 278 | 8.1% |
| 20 to 24 Minutes | 377 | 11.0% |
| 25 to 29 Minutes | 220 | 6.4% |
| 30 to 34 Minutes | 387 | 11.3% |
| 35 to 39 Minutes | 149 | 4.3% |
| 40 to 44 Minutes | 17 | 0.5% |
| 45 to 59 Minutes | 391 | 11.4% |
| 60 to 89 Minutes | 166 | 4.9% |
| 90 or more Minutes | 61 | 1.8% |
Commute Time by Sex in Prospect Park borough
The most common commute times in Prospect Park borough are 5 to 9 minutes (447 commuters, 23.5%) for males and 5 to 9 minutes (295 commuters, 19.4%) for females.
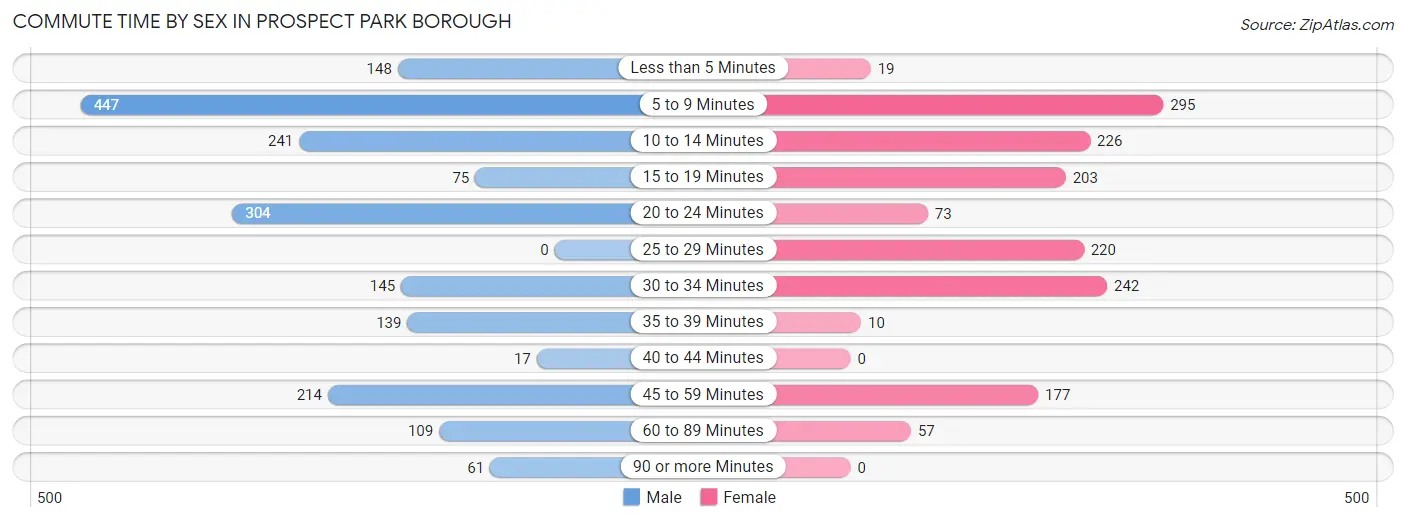
| Commute Time | Male | Female |
| Less than 5 Minutes | 148 (7.8%) | 19 (1.3%) |
| 5 to 9 Minutes | 447 (23.5%) | 295 (19.4%) |
| 10 to 14 Minutes | 241 (12.7%) | 226 (14.8%) |
| 15 to 19 Minutes | 75 (4.0%) | 203 (13.3%) |
| 20 to 24 Minutes | 304 (16.0%) | 73 (4.8%) |
| 25 to 29 Minutes | 0 (0.0%) | 220 (14.4%) |
| 30 to 34 Minutes | 145 (7.6%) | 242 (15.9%) |
| 35 to 39 Minutes | 139 (7.3%) | 10 (0.7%) |
| 40 to 44 Minutes | 17 (0.9%) | 0 (0.0%) |
| 45 to 59 Minutes | 214 (11.3%) | 177 (11.6%) |
| 60 to 89 Minutes | 109 (5.7%) | 57 (3.7%) |
| 90 or more Minutes | 61 (3.2%) | 0 (0.0%) |
Time of Departure to Work by Sex in Prospect Park borough
The most frequent times of departure to work in Prospect Park borough are 6:30 AM to 6:59 AM (508, 26.7%) for males and 8:00 AM to 8:29 AM (373, 24.5%) for females.
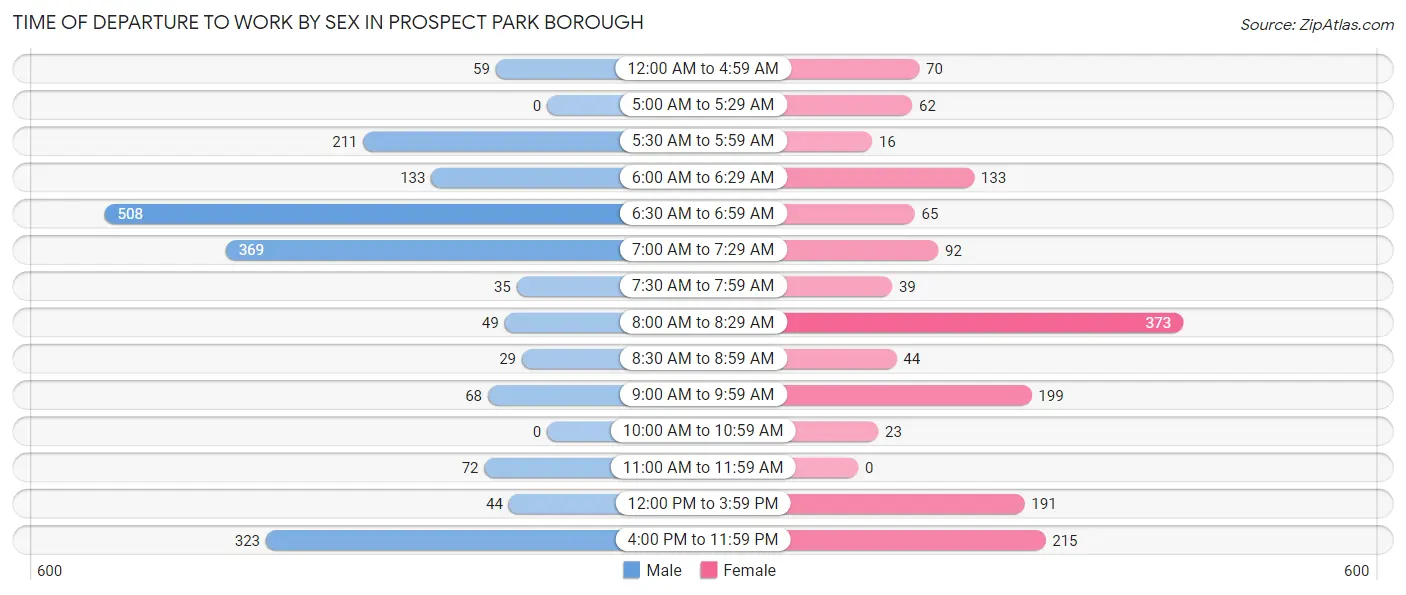
| Time of Departure | Male | Female |
| 12:00 AM to 4:59 AM | 59 (3.1%) | 70 (4.6%) |
| 5:00 AM to 5:29 AM | 0 (0.0%) | 62 (4.1%) |
| 5:30 AM to 5:59 AM | 211 (11.1%) | 16 (1.1%) |
| 6:00 AM to 6:29 AM | 133 (7.0%) | 133 (8.7%) |
| 6:30 AM to 6:59 AM | 508 (26.7%) | 65 (4.3%) |
| 7:00 AM to 7:29 AM | 369 (19.4%) | 92 (6.0%) |
| 7:30 AM to 7:59 AM | 35 (1.8%) | 39 (2.6%) |
| 8:00 AM to 8:29 AM | 49 (2.6%) | 373 (24.5%) |
| 8:30 AM to 8:59 AM | 29 (1.5%) | 44 (2.9%) |
| 9:00 AM to 9:59 AM | 68 (3.6%) | 199 (13.1%) |
| 10:00 AM to 10:59 AM | 0 (0.0%) | 23 (1.5%) |
| 11:00 AM to 11:59 AM | 72 (3.8%) | 0 (0.0%) |
| 12:00 PM to 3:59 PM | 44 (2.3%) | 191 (12.6%) |
| 4:00 PM to 11:59 PM | 323 (17.0%) | 215 (14.1%) |
| Total | 1,900 (100.0%) | 1,522 (100.0%) |
Housing Occupancy in Prospect Park borough
Occupancy by Ownership in Prospect Park borough
Of the total 2,567 dwellings in Prospect Park borough, owner-occupied units account for 1,539 (60.0%), while renter-occupied units make up 1,028 (40.1%).
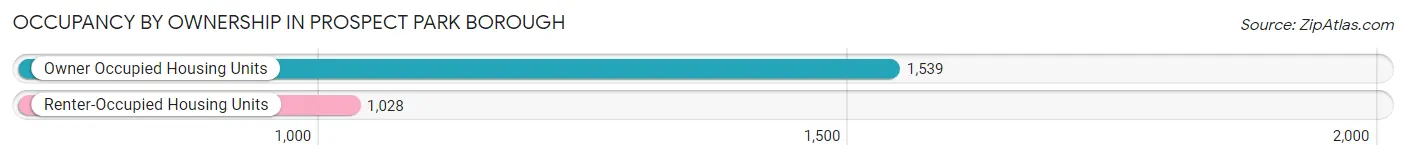
| Occupancy | # Housing Units | % Housing Units |
| Owner Occupied Housing Units | 1,539 | 60.0% |
| Renter-Occupied Housing Units | 1,028 | 40.1% |
| Total Occupied Housing Units | 2,567 | 100.0% |
Occupancy by Household Size in Prospect Park borough
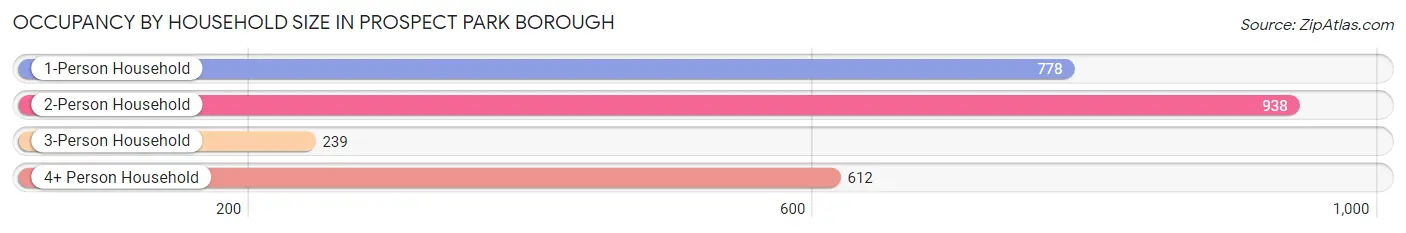
| Household Size | # Housing Units | % Housing Units |
| 1-Person Household | 778 | 30.3% |
| 2-Person Household | 938 | 36.5% |
| 3-Person Household | 239 | 9.3% |
| 4+ Person Household | 612 | 23.8% |
| Total Housing Units | 2,567 | 100.0% |
Occupancy by Ownership by Household Size in Prospect Park borough
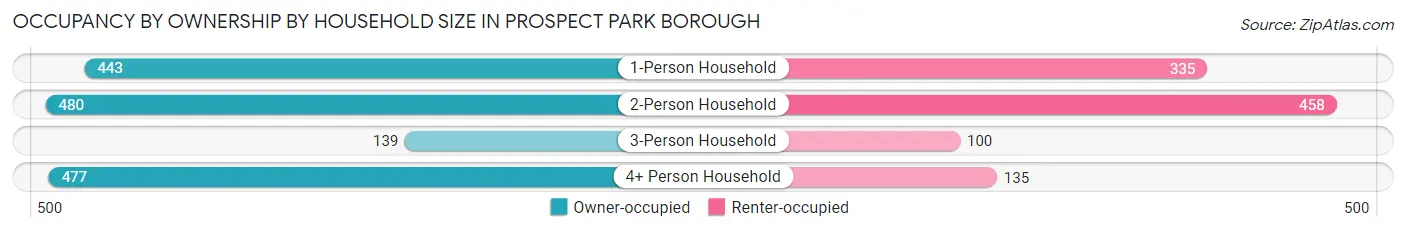
| Household Size | Owner-occupied | Renter-occupied |
| 1-Person Household | 443 (56.9%) | 335 (43.1%) |
| 2-Person Household | 480 (51.2%) | 458 (48.8%) |
| 3-Person Household | 139 (58.2%) | 100 (41.8%) |
| 4+ Person Household | 477 (77.9%) | 135 (22.1%) |
| Total Housing Units | 1,539 (60.0%) | 1,028 (40.1%) |
Occupancy by Educational Attainment in Prospect Park borough
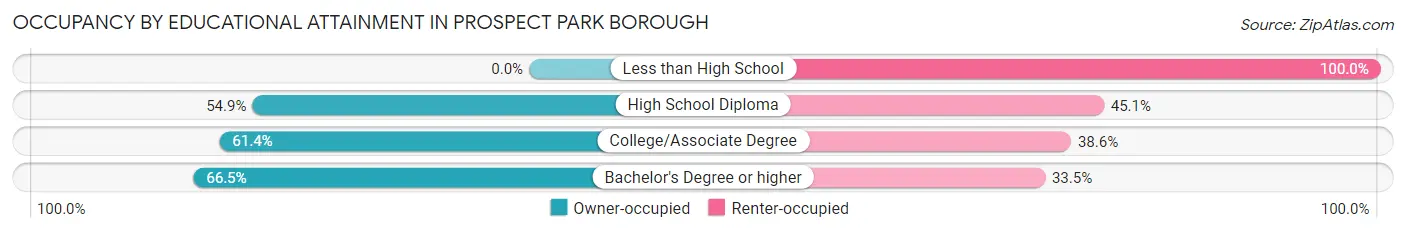
| Household Size | Owner-occupied | Renter-occupied |
| Less than High School | 0 (0.0%) | 15 (100.0%) |
| High School Diploma | 546 (54.9%) | 449 (45.1%) |
| College/Associate Degree | 510 (61.4%) | 321 (38.6%) |
| Bachelor's Degree or higher | 483 (66.5%) | 243 (33.5%) |
Occupancy by Age of Householder in Prospect Park borough
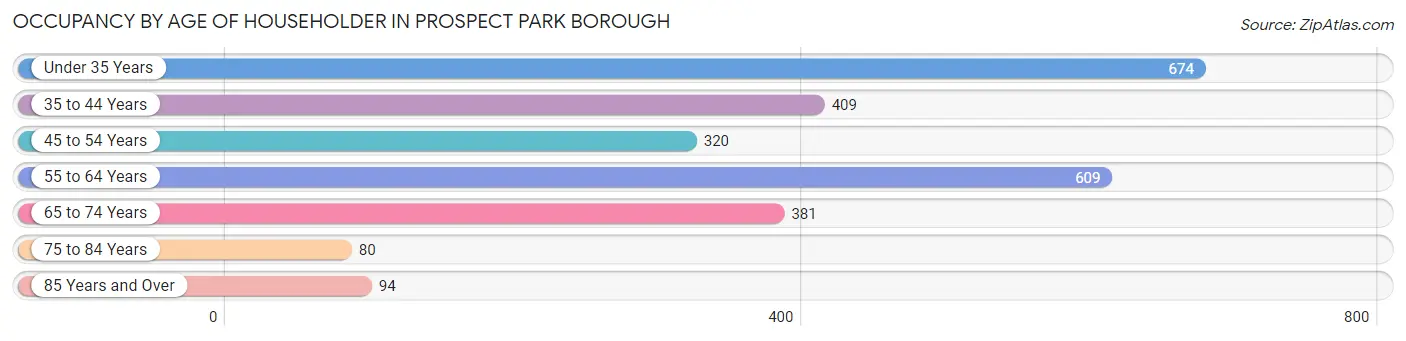
| Age Bracket | # Households | % Households |
| Under 35 Years | 674 | 26.3% |
| 35 to 44 Years | 409 | 15.9% |
| 45 to 54 Years | 320 | 12.5% |
| 55 to 64 Years | 609 | 23.7% |
| 65 to 74 Years | 381 | 14.8% |
| 75 to 84 Years | 80 | 3.1% |
| 85 Years and Over | 94 | 3.7% |
| Total | 2,567 | 100.0% |
Housing Finances in Prospect Park borough
Median Income by Occupancy in Prospect Park borough
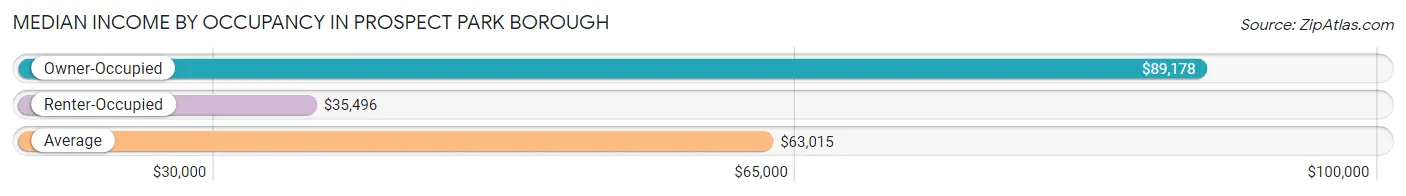
| Occupancy Type | # Households | Median Income |
| Owner-Occupied | 1,539 (60.0%) | $89,178 |
| Renter-Occupied | 1,028 (40.1%) | $35,496 |
| Average | 2,567 (100.0%) | $63,015 |
Occupancy by Householder Income Bracket in Prospect Park borough
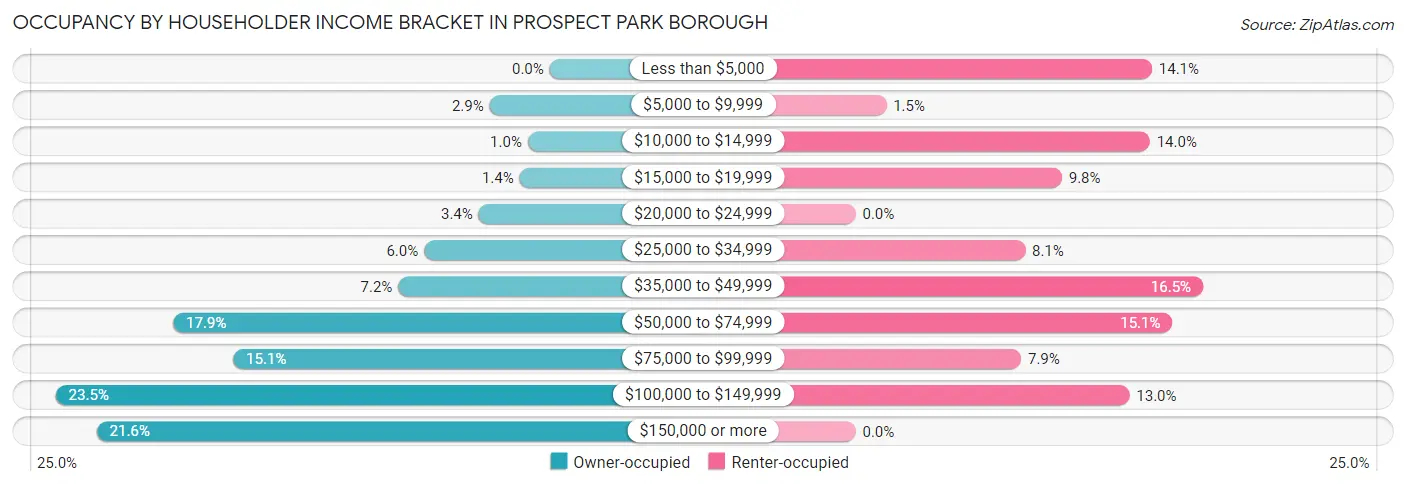
| Income Bracket | Owner-occupied | Renter-occupied |
| Less than $5,000 | 0 (0.0%) | 145 (14.1%) |
| $5,000 to $9,999 | 44 (2.9%) | 15 (1.5%) |
| $10,000 to $14,999 | 16 (1.0%) | 144 (14.0%) |
| $15,000 to $19,999 | 22 (1.4%) | 101 (9.8%) |
| $20,000 to $24,999 | 52 (3.4%) | 0 (0.0%) |
| $25,000 to $34,999 | 92 (6.0%) | 83 (8.1%) |
| $35,000 to $49,999 | 111 (7.2%) | 170 (16.5%) |
| $50,000 to $74,999 | 276 (17.9%) | 155 (15.1%) |
| $75,000 to $99,999 | 232 (15.1%) | 81 (7.9%) |
| $100,000 to $149,999 | 362 (23.5%) | 134 (13.0%) |
| $150,000 or more | 332 (21.6%) | 0 (0.0%) |
| Total | 1,539 (100.0%) | 1,028 (100.0%) |
Monthly Housing Cost Tiers in Prospect Park borough
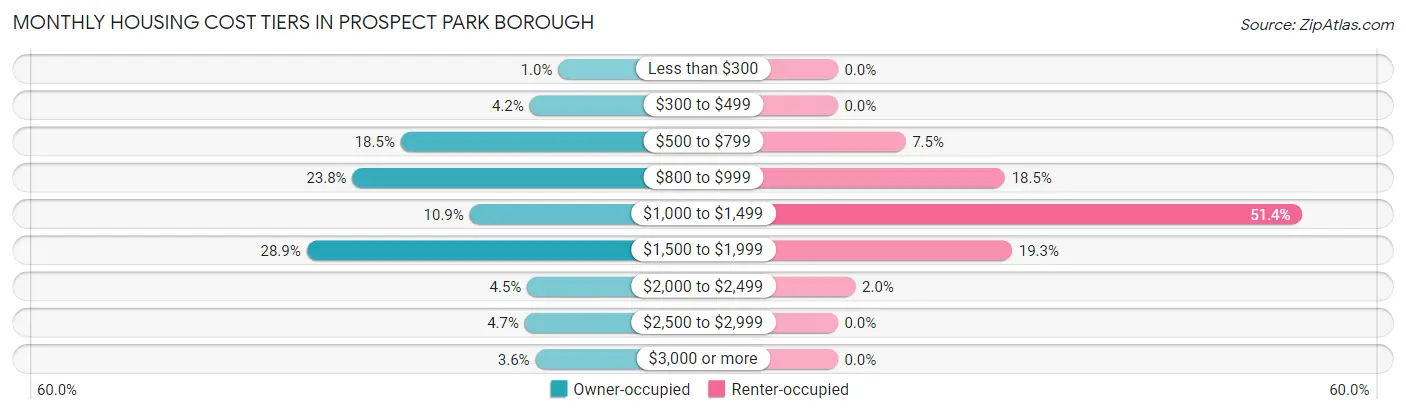
| Monthly Cost | Owner-occupied | Renter-occupied |
| Less than $300 | 16 (1.0%) | 0 (0.0%) |
| $300 to $499 | 65 (4.2%) | 0 (0.0%) |
| $500 to $799 | 284 (18.4%) | 77 (7.5%) |
| $800 to $999 | 366 (23.8%) | 190 (18.5%) |
| $1,000 to $1,499 | 167 (10.8%) | 528 (51.4%) |
| $1,500 to $1,999 | 444 (28.8%) | 198 (19.3%) |
| $2,000 to $2,499 | 69 (4.5%) | 20 (1.9%) |
| $2,500 to $2,999 | 73 (4.7%) | 0 (0.0%) |
| $3,000 or more | 55 (3.6%) | 0 (0.0%) |
| Total | 1,539 (100.0%) | 1,028 (100.0%) |
Physical Housing Characteristics in Prospect Park borough
Housing Structures in Prospect Park borough
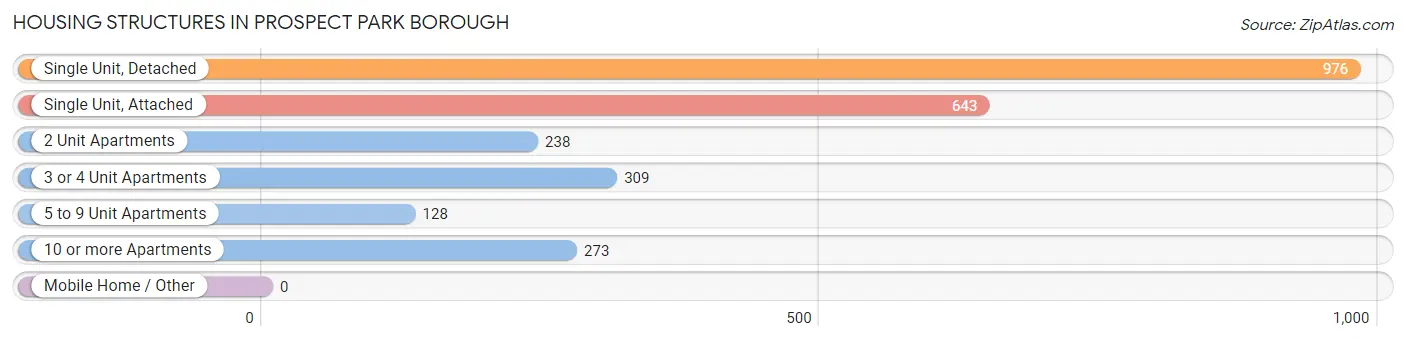
| Structure Type | # Housing Units | % Housing Units |
| Single Unit, Detached | 976 | 38.0% |
| Single Unit, Attached | 643 | 25.1% |
| 2 Unit Apartments | 238 | 9.3% |
| 3 or 4 Unit Apartments | 309 | 12.0% |
| 5 to 9 Unit Apartments | 128 | 5.0% |
| 10 or more Apartments | 273 | 10.6% |
| Mobile Home / Other | 0 | 0.0% |
| Total | 2,567 | 100.0% |
Housing Structures by Occupancy in Prospect Park borough
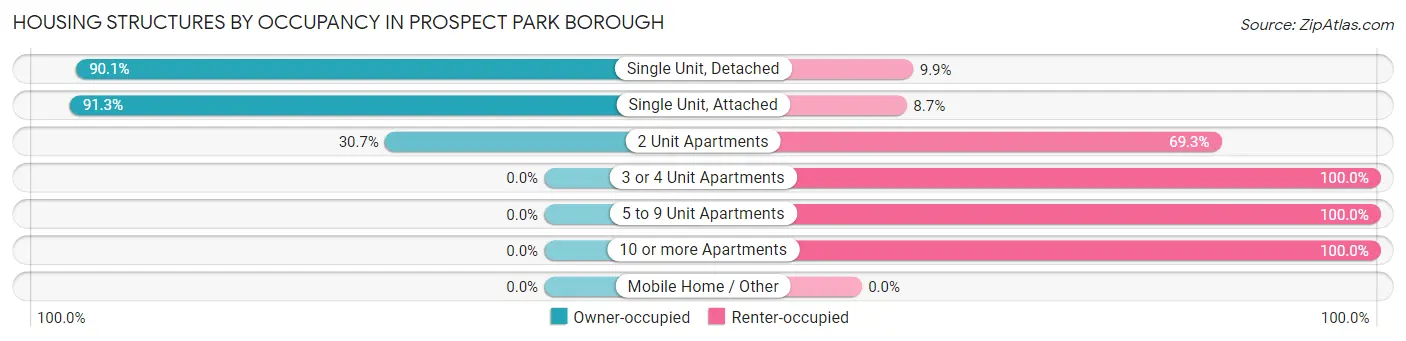
| Structure Type | Owner-occupied | Renter-occupied |
| Single Unit, Detached | 879 (90.1%) | 97 (9.9%) |
| Single Unit, Attached | 587 (91.3%) | 56 (8.7%) |
| 2 Unit Apartments | 73 (30.7%) | 165 (69.3%) |
| 3 or 4 Unit Apartments | 0 (0.0%) | 309 (100.0%) |
| 5 to 9 Unit Apartments | 0 (0.0%) | 128 (100.0%) |
| 10 or more Apartments | 0 (0.0%) | 273 (100.0%) |
| Mobile Home / Other | 0 (0.0%) | 0 (0.0%) |
| Total | 1,539 (60.0%) | 1,028 (40.1%) |
Housing Structures by Number of Rooms in Prospect Park borough
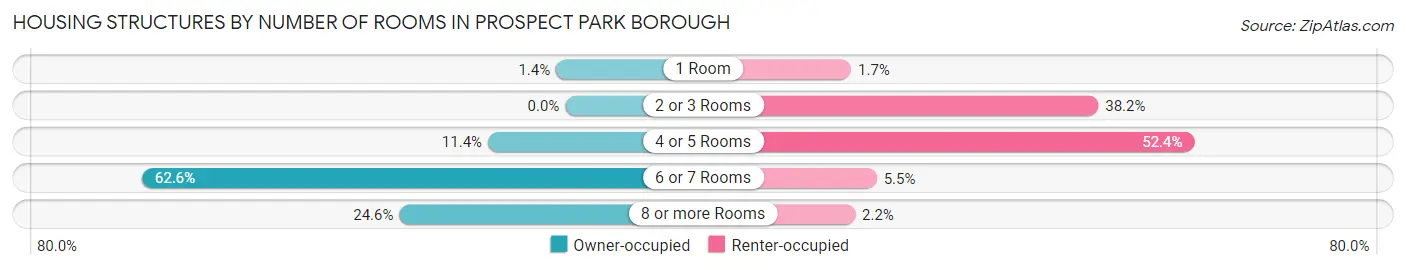
| Number of Rooms | Owner-occupied | Renter-occupied |
| 1 Room | 21 (1.4%) | 17 (1.7%) |
| 2 or 3 Rooms | 0 (0.0%) | 393 (38.2%) |
| 4 or 5 Rooms | 176 (11.4%) | 539 (52.4%) |
| 6 or 7 Rooms | 964 (62.6%) | 56 (5.4%) |
| 8 or more Rooms | 378 (24.6%) | 23 (2.2%) |
| Total | 1,539 (100.0%) | 1,028 (100.0%) |
Housing Structure by Heating Type in Prospect Park borough
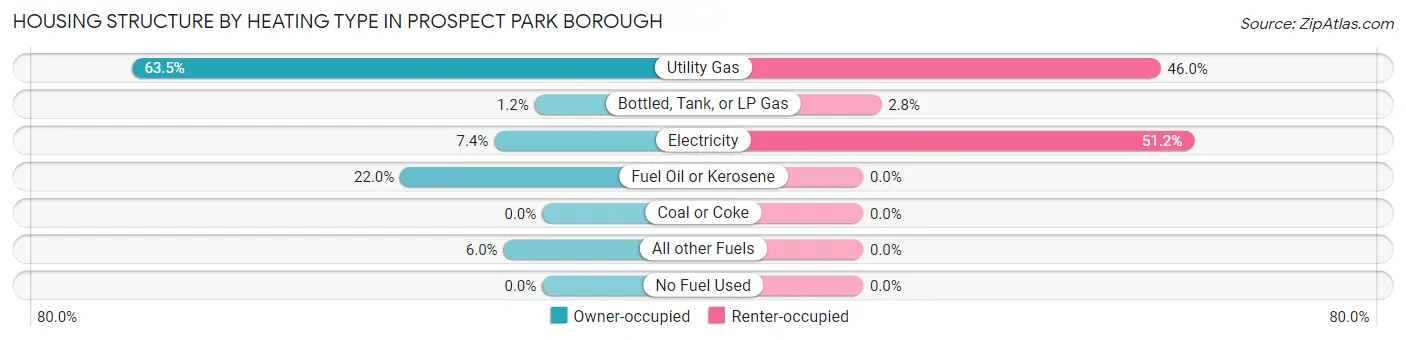
| Heating Type | Owner-occupied | Renter-occupied |
| Utility Gas | 977 (63.5%) | 473 (46.0%) |
| Bottled, Tank, or LP Gas | 18 (1.2%) | 29 (2.8%) |
| Electricity | 114 (7.4%) | 526 (51.2%) |
| Fuel Oil or Kerosene | 338 (22.0%) | 0 (0.0%) |
| Coal or Coke | 0 (0.0%) | 0 (0.0%) |
| All other Fuels | 92 (6.0%) | 0 (0.0%) |
| No Fuel Used | 0 (0.0%) | 0 (0.0%) |
| Total | 1,539 (100.0%) | 1,028 (100.0%) |
Household Vehicle Usage in Prospect Park borough
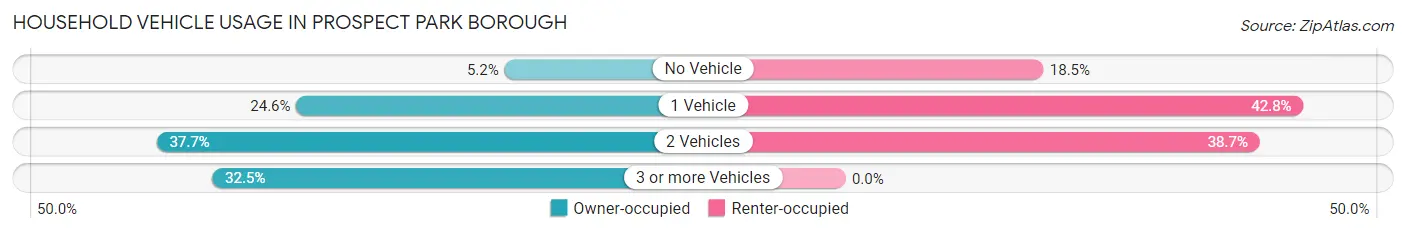
| Vehicles per Household | Owner-occupied | Renter-occupied |
| No Vehicle | 80 (5.2%) | 190 (18.5%) |
| 1 Vehicle | 379 (24.6%) | 440 (42.8%) |
| 2 Vehicles | 580 (37.7%) | 398 (38.7%) |
| 3 or more Vehicles | 500 (32.5%) | 0 (0.0%) |
| Total | 1,539 (100.0%) | 1,028 (100.0%) |
Real Estate & Mortgages in Prospect Park borough
Real Estate and Mortgage Overview in Prospect Park borough
| Characteristic | Without Mortgage | With Mortgage |
| Housing Units | 760 | 779 |
| Median Property Value | $226,000 | $216,300 |
| Median Household Income | $71,650 | $145 |
| Monthly Housing Costs | $809 | $55 |
| Real Estate Taxes | $5,418 | $0 |
Property Value by Mortgage Status in Prospect Park borough
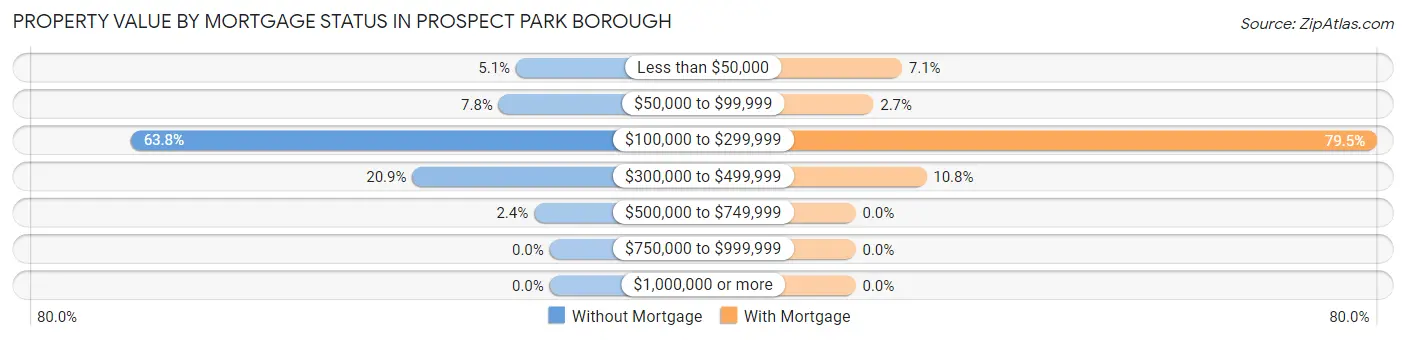
| Property Value | Without Mortgage | With Mortgage |
| Less than $50,000 | 39 (5.1%) | 55 (7.1%) |
| $50,000 to $99,999 | 59 (7.8%) | 21 (2.7%) |
| $100,000 to $299,999 | 485 (63.8%) | 619 (79.5%) |
| $300,000 to $499,999 | 159 (20.9%) | 84 (10.8%) |
| $500,000 to $749,999 | 18 (2.4%) | 0 (0.0%) |
| $750,000 to $999,999 | 0 (0.0%) | 0 (0.0%) |
| $1,000,000 or more | 0 (0.0%) | 0 (0.0%) |
| Total | 760 (100.0%) | 779 (100.0%) |
Household Income by Mortgage Status in Prospect Park borough
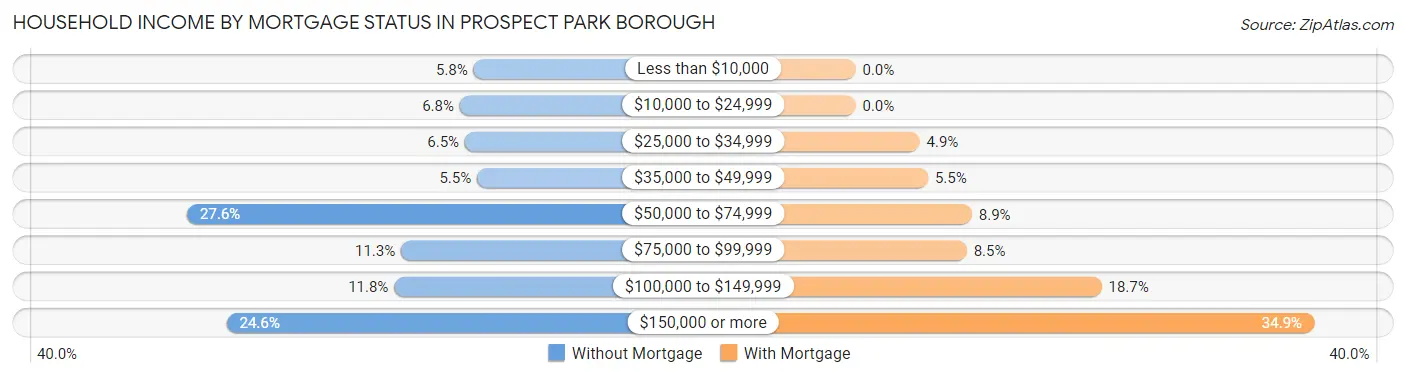
| Household Income | Without Mortgage | With Mortgage |
| Less than $10,000 | 44 (5.8%) | 0 (0.0%) |
| $10,000 to $24,999 | 52 (6.8%) | 0 (0.0%) |
| $25,000 to $34,999 | 49 (6.5%) | 38 (4.9%) |
| $35,000 to $49,999 | 42 (5.5%) | 43 (5.5%) |
| $50,000 to $74,999 | 210 (27.6%) | 69 (8.9%) |
| $75,000 to $99,999 | 86 (11.3%) | 66 (8.5%) |
| $100,000 to $149,999 | 90 (11.8%) | 146 (18.7%) |
| $150,000 or more | 187 (24.6%) | 272 (34.9%) |
| Total | 760 (100.0%) | 779 (100.0%) |
Property Value to Household Income Ratio in Prospect Park borough
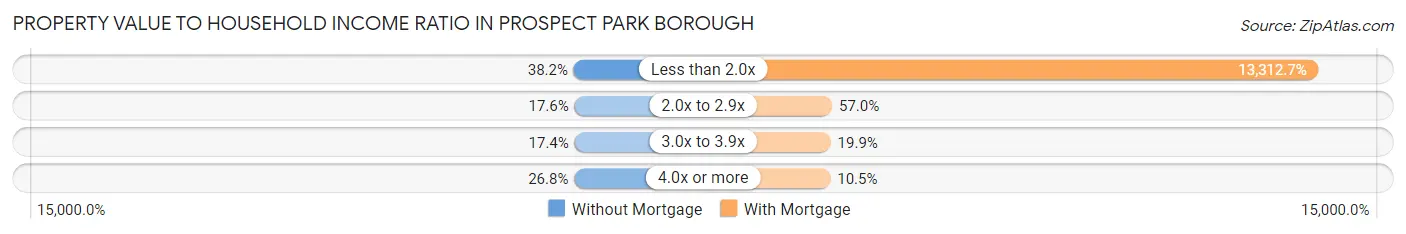
| Value-to-Income Ratio | Without Mortgage | With Mortgage |
| Less than 2.0x | 290 (38.2%) | 103,706 (13,312.7%) |
| 2.0x to 2.9x | 134 (17.6%) | 444 (57.0%) |
| 3.0x to 3.9x | 132 (17.4%) | 155 (19.9%) |
| 4.0x or more | 204 (26.8%) | 82 (10.5%) |
| Total | 760 (100.0%) | 779 (100.0%) |
Real Estate Taxes by Mortgage Status in Prospect Park borough
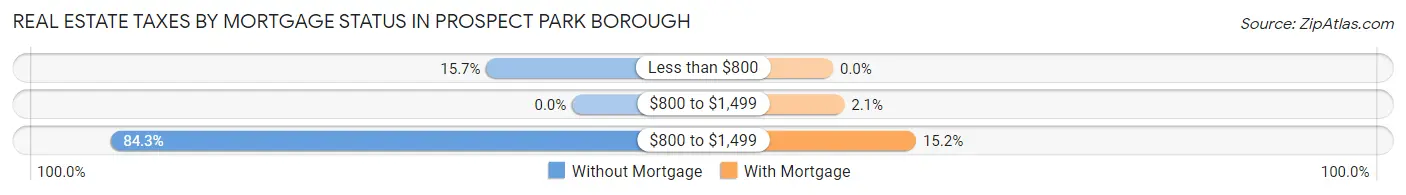
| Property Taxes | Without Mortgage | With Mortgage |
| Less than $800 | 119 (15.7%) | 0 (0.0%) |
| $800 to $1,499 | 0 (0.0%) | 16 (2.1%) |
| $800 to $1,499 | 641 (84.3%) | 118 (15.1%) |
| Total | 760 (100.0%) | 779 (100.0%) |
Health & Disability in Prospect Park borough
Health Insurance Coverage by Age in Prospect Park borough
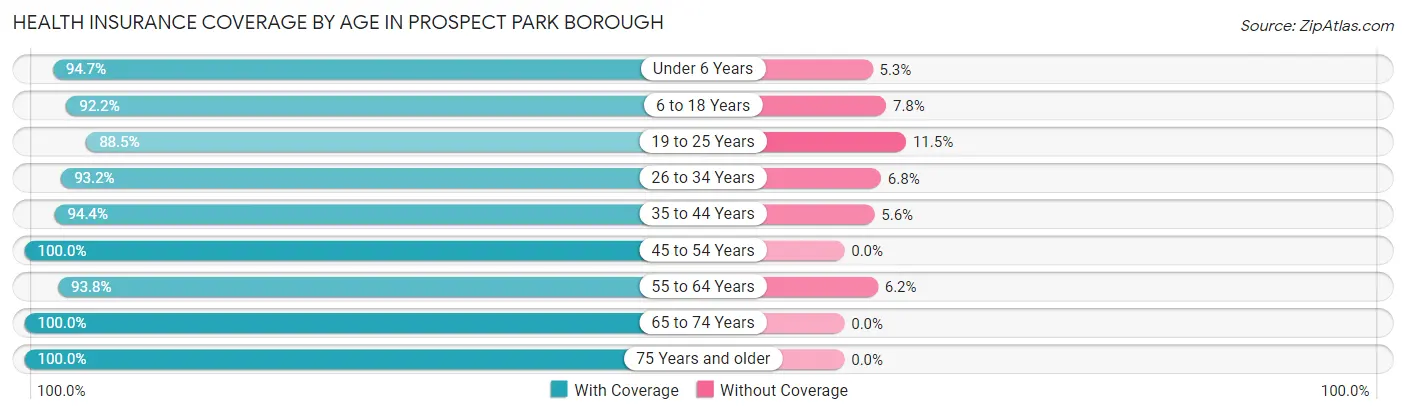
| Age Bracket | With Coverage | Without Coverage |
| Under 6 Years | 503 (94.7%) | 28 (5.3%) |
| 6 to 18 Years | 735 (92.2%) | 62 (7.8%) |
| 19 to 25 Years | 485 (88.5%) | 63 (11.5%) |
| 26 to 34 Years | 1,133 (93.2%) | 83 (6.8%) |
| 35 to 44 Years | 657 (94.4%) | 39 (5.6%) |
| 45 to 54 Years | 726 (100.0%) | 0 (0.0%) |
| 55 to 64 Years | 902 (93.8%) | 60 (6.2%) |
| 65 to 74 Years | 566 (100.0%) | 0 (0.0%) |
| 75 Years and older | 212 (100.0%) | 0 (0.0%) |
| Total | 5,919 (94.6%) | 335 (5.4%) |
Health Insurance Coverage by Citizenship Status in Prospect Park borough
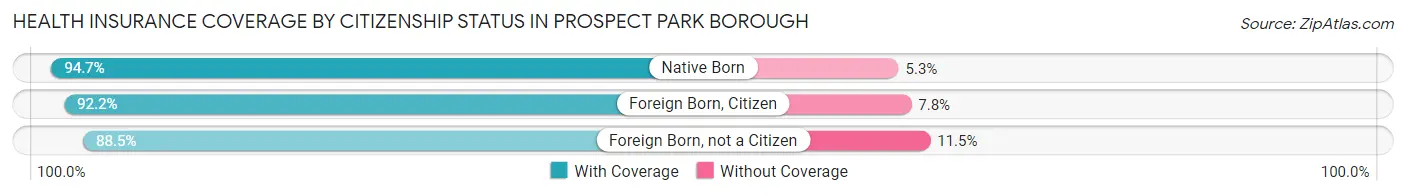
| Citizenship Status | With Coverage | Without Coverage |
| Native Born | 503 (94.7%) | 28 (5.3%) |
| Foreign Born, Citizen | 735 (92.2%) | 62 (7.8%) |
| Foreign Born, not a Citizen | 485 (88.5%) | 63 (11.5%) |
Health Insurance Coverage by Household Income in Prospect Park borough
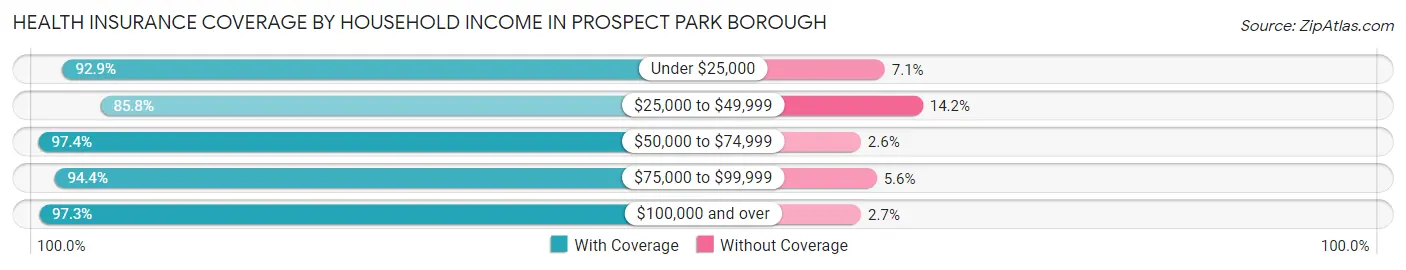
| Household Income | With Coverage | Without Coverage |
| Under $25,000 | 782 (92.9%) | 60 (7.1%) |
| $25,000 to $49,999 | 783 (85.8%) | 130 (14.2%) |
| $50,000 to $74,999 | 811 (97.4%) | 22 (2.6%) |
| $75,000 to $99,999 | 791 (94.4%) | 47 (5.6%) |
| $100,000 and over | 2,746 (97.3%) | 76 (2.7%) |
Public vs Private Health Insurance Coverage by Age in Prospect Park borough
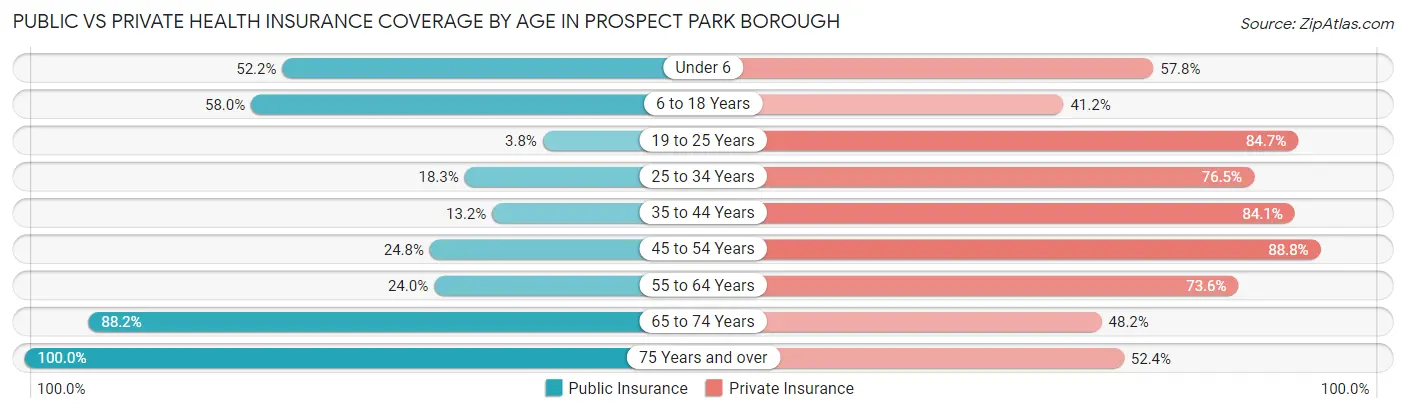
| Age Bracket | Public Insurance | Private Insurance |
| Under 6 | 277 (52.2%) | 307 (57.8%) |
| 6 to 18 Years | 462 (58.0%) | 328 (41.1%) |
| 19 to 25 Years | 21 (3.8%) | 464 (84.7%) |
| 25 to 34 Years | 223 (18.3%) | 930 (76.5%) |
| 35 to 44 Years | 92 (13.2%) | 585 (84.1%) |
| 45 to 54 Years | 180 (24.8%) | 645 (88.8%) |
| 55 to 64 Years | 231 (24.0%) | 708 (73.6%) |
| 65 to 74 Years | 499 (88.2%) | 273 (48.2%) |
| 75 Years and over | 212 (100.0%) | 111 (52.4%) |
| Total | 2,197 (35.1%) | 4,351 (69.6%) |
Disability Status by Sex by Age in Prospect Park borough
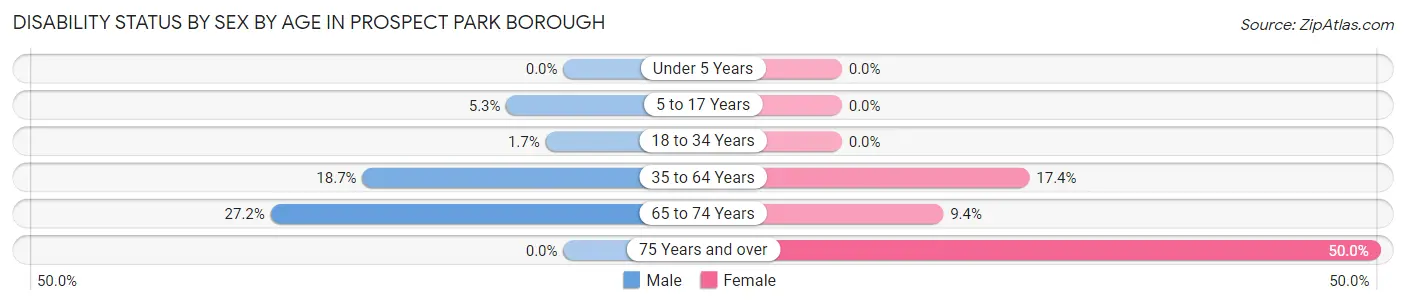
| Age Bracket | Male | Female |
| Under 5 Years | 0 (0.0%) | 0 (0.0%) |
| 5 to 17 Years | 20 (5.3%) | 0 (0.0%) |
| 18 to 34 Years | 19 (1.7%) | 0 (0.0%) |
| 35 to 64 Years | 210 (18.6%) | 219 (17.4%) |
| 65 to 74 Years | 47 (27.2%) | 37 (9.4%) |
| 75 Years and over | 0 (0.0%) | 75 (50.0%) |
Disability Class by Sex by Age in Prospect Park borough
Disability Class: Hearing Difficulty
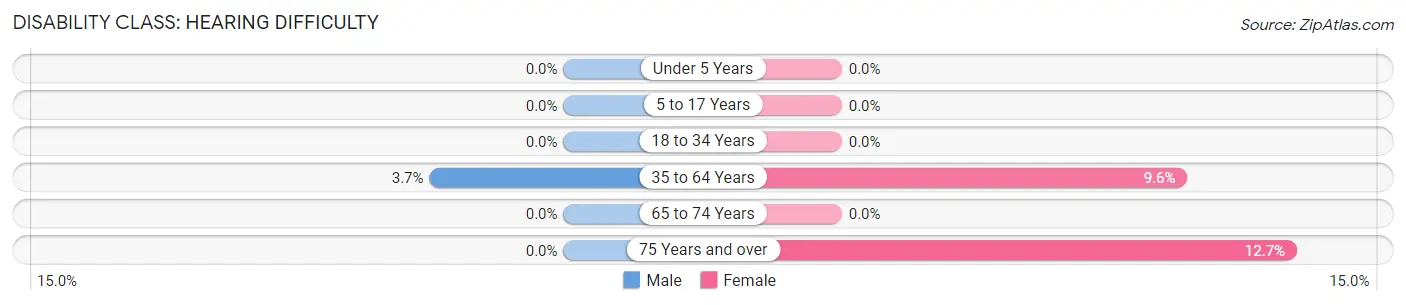
| Age Bracket | Male | Female |
| Under 5 Years | 0 (0.0%) | 0 (0.0%) |
| 5 to 17 Years | 0 (0.0%) | 0 (0.0%) |
| 18 to 34 Years | 0 (0.0%) | 0 (0.0%) |
| 35 to 64 Years | 42 (3.7%) | 121 (9.6%) |
| 65 to 74 Years | 0 (0.0%) | 0 (0.0%) |
| 75 Years and over | 0 (0.0%) | 19 (12.7%) |
Disability Class: Vision Difficulty
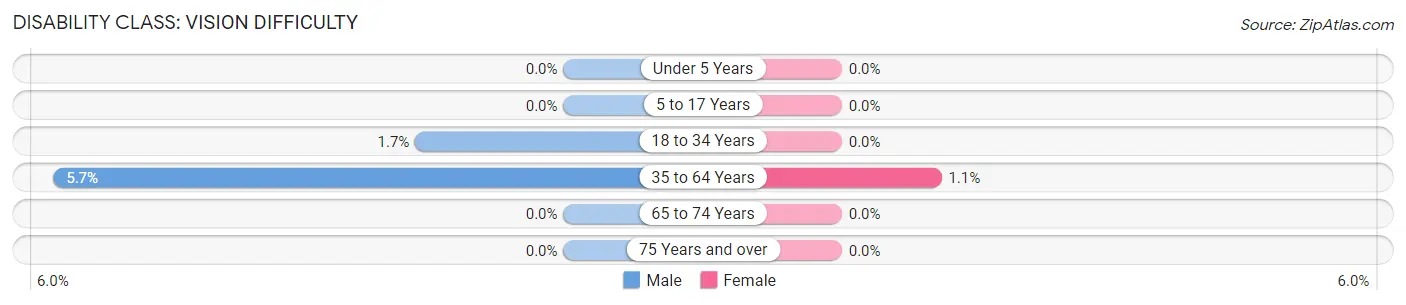
| Age Bracket | Male | Female |
| Under 5 Years | 0 (0.0%) | 0 (0.0%) |
| 5 to 17 Years | 0 (0.0%) | 0 (0.0%) |
| 18 to 34 Years | 19 (1.7%) | 0 (0.0%) |
| 35 to 64 Years | 64 (5.7%) | 14 (1.1%) |
| 65 to 74 Years | 0 (0.0%) | 0 (0.0%) |
| 75 Years and over | 0 (0.0%) | 0 (0.0%) |
Disability Class: Cognitive Difficulty
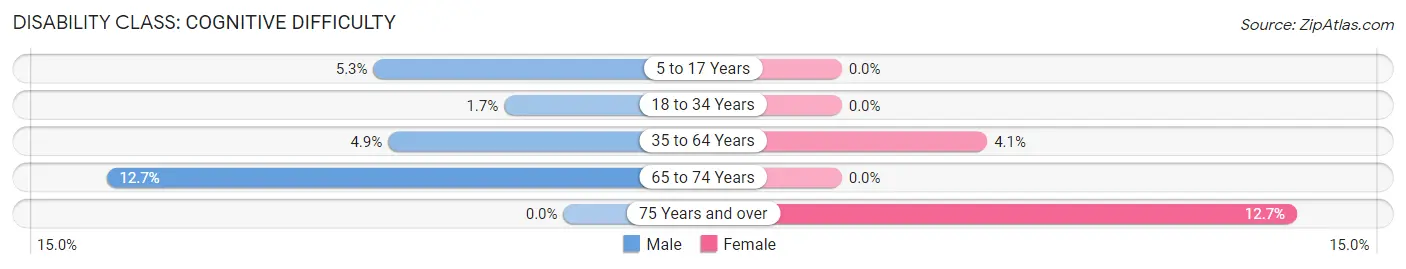
| Age Bracket | Male | Female |
| 5 to 17 Years | 20 (5.3%) | 0 (0.0%) |
| 18 to 34 Years | 19 (1.7%) | 0 (0.0%) |
| 35 to 64 Years | 55 (4.9%) | 51 (4.1%) |
| 65 to 74 Years | 22 (12.7%) | 0 (0.0%) |
| 75 Years and over | 0 (0.0%) | 19 (12.7%) |
Disability Class: Ambulatory Difficulty
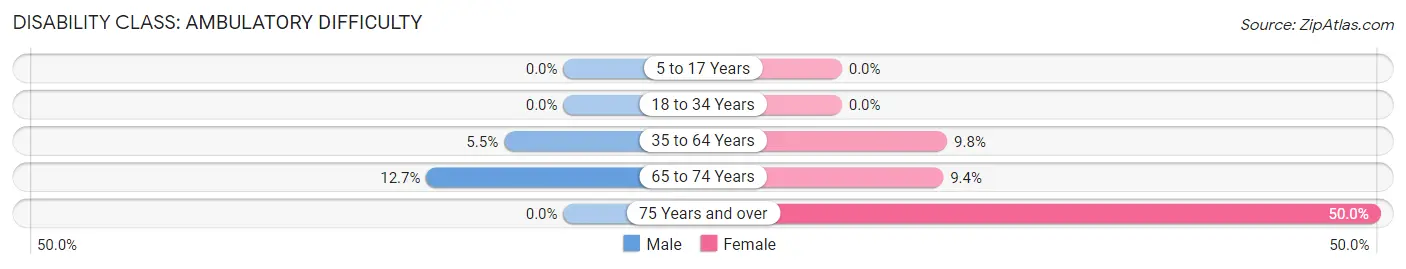
| Age Bracket | Male | Female |
| 5 to 17 Years | 0 (0.0%) | 0 (0.0%) |
| 18 to 34 Years | 0 (0.0%) | 0 (0.0%) |
| 35 to 64 Years | 62 (5.5%) | 123 (9.8%) |
| 65 to 74 Years | 22 (12.7%) | 37 (9.4%) |
| 75 Years and over | 0 (0.0%) | 75 (50.0%) |
Disability Class: Self-Care Difficulty
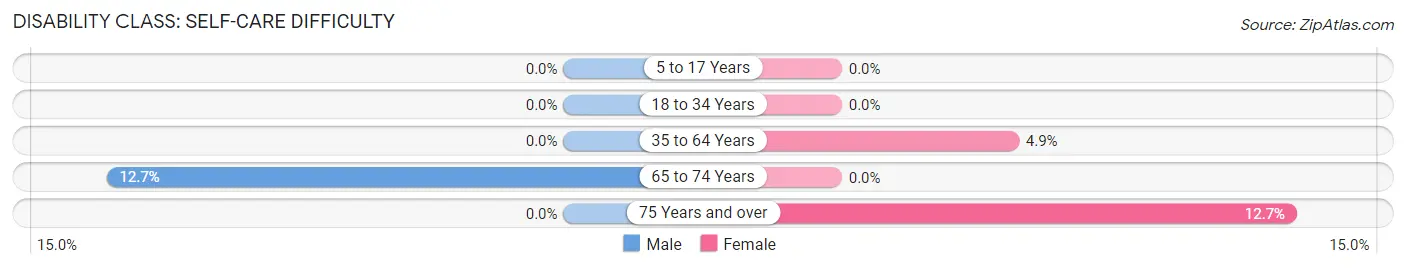
| Age Bracket | Male | Female |
| 5 to 17 Years | 0 (0.0%) | 0 (0.0%) |
| 18 to 34 Years | 0 (0.0%) | 0 (0.0%) |
| 35 to 64 Years | 0 (0.0%) | 62 (4.9%) |
| 65 to 74 Years | 22 (12.7%) | 0 (0.0%) |
| 75 Years and over | 0 (0.0%) | 19 (12.7%) |
Technology Access in Prospect Park borough
Computing Device Access in Prospect Park borough
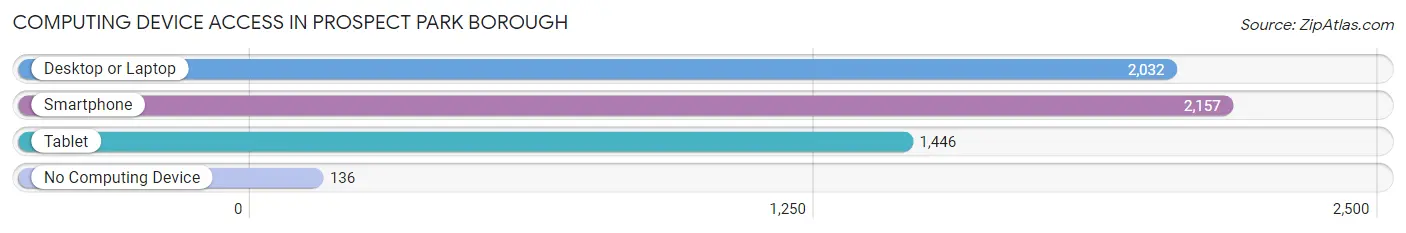
| Device Type | # Households | % Households |
| Desktop or Laptop | 2,032 | 79.2% |
| Smartphone | 2,157 | 84.0% |
| Tablet | 1,446 | 56.3% |
| No Computing Device | 136 | 5.3% |
| Total | 2,567 | 100.0% |
Internet Access in Prospect Park borough
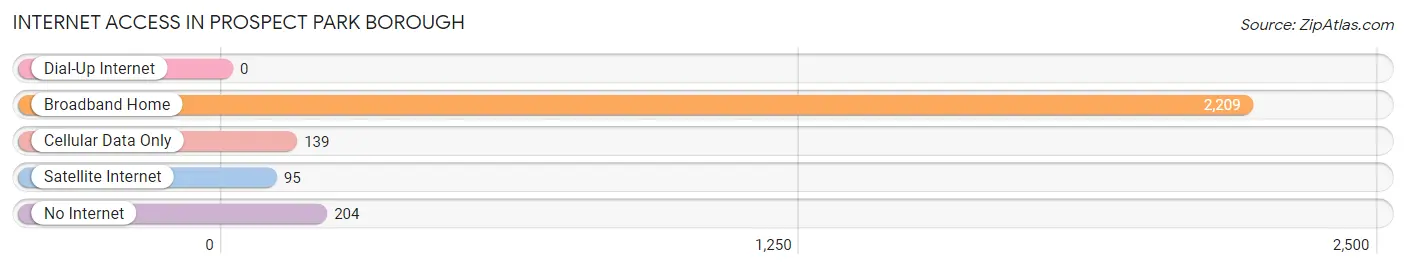
| Internet Type | # Households | % Households |
| Dial-Up Internet | 0 | 0.0% |
| Broadband Home | 2,209 | 86.1% |
| Cellular Data Only | 139 | 5.4% |
| Satellite Internet | 95 | 3.7% |
| No Internet | 204 | 8.0% |
| Total | 2,567 | 100.0% |
Prospect Park borough Summary
Prospect Park Borough is a small borough located in Delaware County, Pennsylvania. It is situated just outside of Philadelphia and is part of the Greater Philadelphia Metropolitan Area. The borough is home to a population of 6,454 people, according to the 2010 census.
History
Prospect Park Borough was founded in 1887 by a group of local businessmen who wanted to create a residential community. The borough was named after Prospect Park, a large park located in the center of the borough. The park was designed by the Olmsted Brothers, a prominent landscape architecture firm.
The borough was originally part of Darby Township, but was incorporated as its own borough in 1887. The borough was home to a variety of industries, including a paper mill, a brickyard, and a tannery. The borough also had a thriving agricultural industry, with many farms located in the area.
Geography
Prospect Park Borough is located in southeastern Pennsylvania, just outside of Philadelphia. It is situated in Delaware County, and is bordered by Darby Township to the north, Ridley Township to the east, and Tinicum Township to the south. The borough is located on the Delaware River, and is part of the Greater Philadelphia Metropolitan Area.
The borough has a total area of 1.2 square miles, all of which is land. The borough is mostly flat, with some rolling hills in the northern part of the borough. The borough is home to Prospect Park, a large park located in the center of the borough. The park is home to a variety of recreational activities, including a playground, a walking path, and a pond.
Economy
The economy of Prospect Park Borough is largely based on the service industry. The borough is home to a variety of restaurants, retail stores, and other businesses. The borough is also home to a number of industrial businesses, including a paper mill, a brickyard, and a tannery.
The borough is also home to a number of educational institutions, including the Prospect Park School District, which serves the borough and the surrounding area. The borough is also home to a number of churches, including the Prospect Park United Methodist Church.
Demographics
According to the 2010 census, the population of Prospect Park Borough was 6,454. The racial makeup of the borough was 79.3% White, 15.2% African American, 0.3% Native American, 1.2% Asian, and 3.9% from other races. Hispanic or Latino of any race were 5.2% of the population.
The median household income in the borough was $45,945, and the median family income was $54,945. The per capita income in the borough was $21,945. About 8.3% of the population was below the poverty line.
Conclusion
Prospect Park Borough is a small borough located in Delaware County, Pennsylvania. It is situated just outside of Philadelphia and is part of the Greater Philadelphia Metropolitan Area. The borough is home to a population of 6,454 people, according to the 2010 census. The borough was founded in 1887 by a group of local businessmen who wanted to create a residential community. The economy of Prospect Park Borough is largely based on the service industry, and the borough is home to a variety of restaurants, retail stores, and other businesses. The racial makeup of the borough was 79.3% White, 15.2% African American, 0.3% Native American, 1.2% Asian, and 3.9% from other races. The median household income in the borough was $45,945, and the median family income was $54,945. Prospect Park Borough is a vibrant community with a rich history and a diverse population.
Common Questions
What is Per Capita Income in Prospect Park borough?
Per Capita income in Prospect Park borough is $38,354.
What is the Median Family Income in Prospect Park borough?
Median Family Income in Prospect Park borough is $88,684.
What is the Median Household income in Prospect Park borough?
Median Household Income in Prospect Park borough is $63,015.
What is Income or Wage Gap in Prospect Park borough?
Income or Wage Gap in Prospect Park borough is 39.1%.
Women in Prospect Park borough earn 60.9 cents for every dollar earned by a man.
What is Inequality or Gini Index in Prospect Park borough?
Inequality or Gini Index in Prospect Park borough is 0.51.
What is the Total Population of Prospect Park borough?
Total Population of Prospect Park borough is 6,411.
What is the Total Male Population of Prospect Park borough?
Total Male Population of Prospect Park borough is 3,268.
What is the Total Female Population of Prospect Park borough?
Total Female Population of Prospect Park borough is 3,143.
What is the Ratio of Males per 100 Females in Prospect Park borough?
There are 103.98 Males per 100 Females in Prospect Park borough.
What is the Ratio of Females per 100 Males in Prospect Park borough?
There are 96.18 Females per 100 Males in Prospect Park borough.
What is the Median Population Age in Prospect Park borough?
Median Population Age in Prospect Park borough is 36.7 Years.
What is the Average Family Size in Prospect Park borough
Average Family Size in Prospect Park borough is 3.1 People.
What is the Average Household Size in Prospect Park borough
Average Household Size in Prospect Park borough is 2.4 People.
How Large is the Labor Force in Prospect Park borough?
There are 3,978 People in the Labor Forcein in Prospect Park borough.
What is the Percentage of People in the Labor Force in Prospect Park borough?
76.2% of People are in the Labor Force in Prospect Park borough.
What is the Unemployment Rate in Prospect Park borough?
Unemployment Rate in Prospect Park borough is 5.9%.