Osseo, MN Map & Demographics
Osseo Map
Osseo Overview
$40,466
PER CAPITA INCOME
$103,750
AVG FAMILY INCOME
$65,463
AVG HOUSEHOLD INCOME
7.5%
WAGE / INCOME GAP [ % ]
92.5¢/ $1
WAGE / INCOME GAP [ $ ]
0.38
INEQUALITY / GINI INDEX
2,634
TOTAL POPULATION
1,250
MALE POPULATION
1,384
FEMALE POPULATION
90.32
MALES / 100 FEMALES
110.72
FEMALES / 100 MALES
46.1
MEDIAN AGE
3.1
AVG FAMILY SIZE
2.1
AVG HOUSEHOLD SIZE
1,528
LABOR FORCE [ PEOPLE ]
65.5%
PERCENT IN LABOR FORCE
6.4%
UNEMPLOYMENT RATE
Osseo Zip Codes
Osseo Area Codes
Income in Osseo
Income Overview in Osseo
Per Capita Income in Osseo is $40,466, while median incomes of families and households are $103,750 and $65,463 respectively.
| Characteristic | Number | Measure |
| Per Capita Income | 2,634 | $40,466 |
| Median Family Income | 516 | $103,750 |
| Mean Family Income | 516 | $117,316 |
| Median Household Income | 1,184 | $65,463 |
| Mean Household Income | 1,184 | $85,045 |
| Income Deficit | 516 | $0 |
| Wage / Income Gap (%) | 2,634 | 7.47% |
| Wage / Income Gap ($) | 2,634 | 92.53¢ per $1 |
| Gini / Inequality Index | 2,634 | 0.38 |
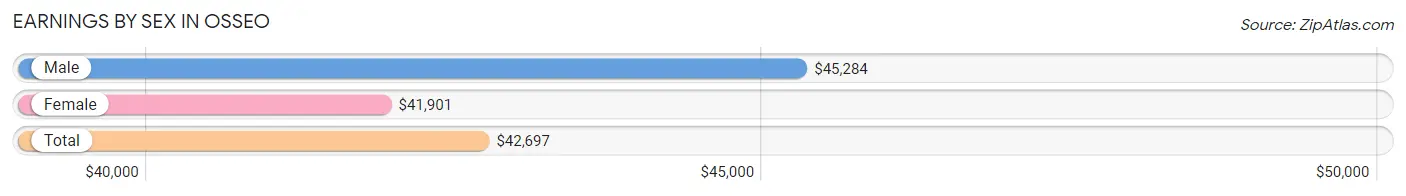
Earnings by Sex in Osseo
Average Earnings in Osseo are $42,697, $45,284 for men and $41,901 for women, a difference of 7.5%.
| Sex | Number | Average Earnings |
| Male | 782 (49.2%) | $45,284 |
| Female | 806 (50.8%) | $41,901 |
| Total | 1,588 (100.0%) | $42,697 |
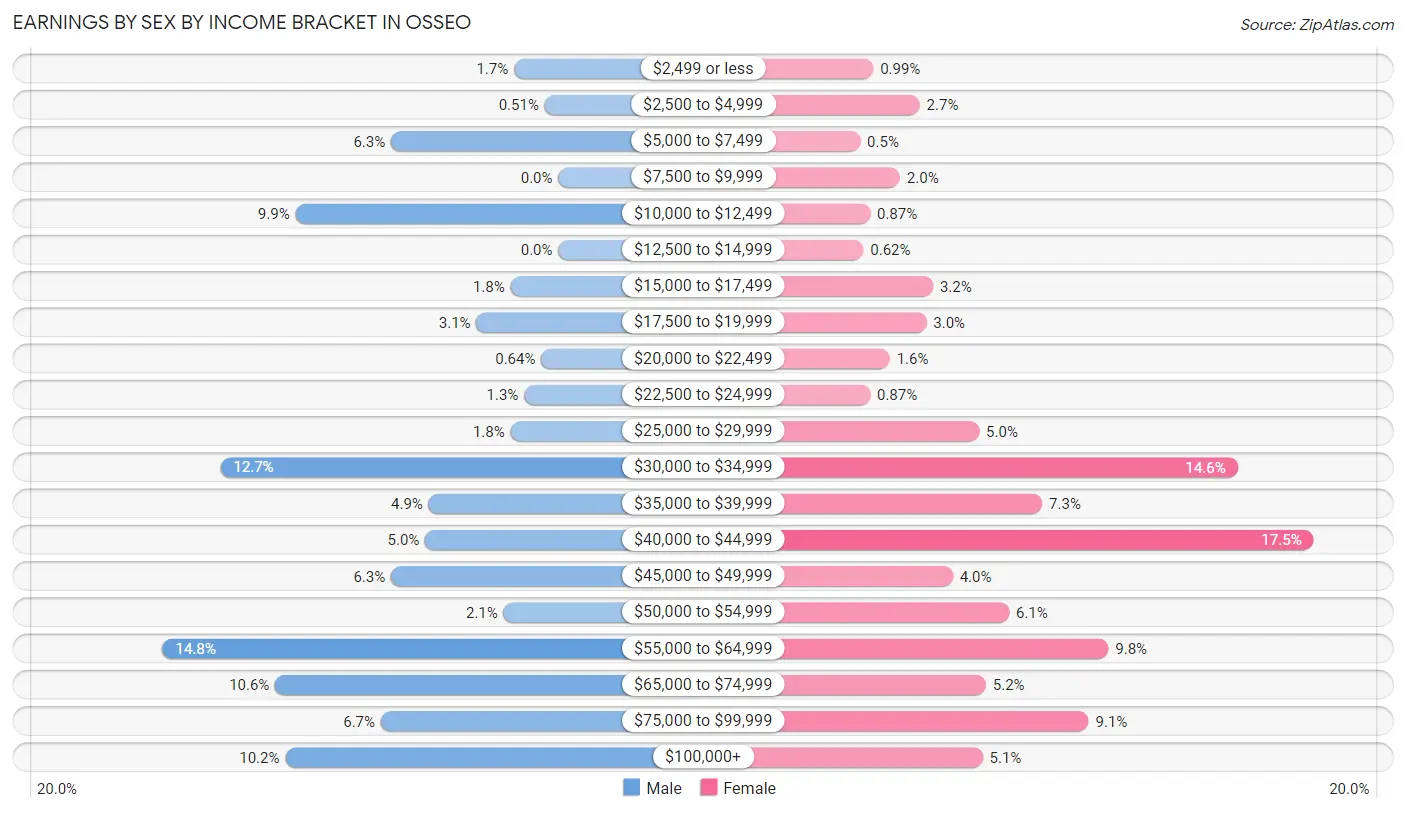
Earnings by Sex by Income Bracket in Osseo
The most common earnings brackets in Osseo are $55,000 to $64,999 for men (116 | 14.8%) and $40,000 to $44,999 for women (141 | 17.5%).
| Income | Male | Female |
| $2,499 or less | 13 (1.7%) | 8 (1.0%) |
| $2,500 to $4,999 | 4 (0.5%) | 22 (2.7%) |
| $5,000 to $7,499 | 49 (6.3%) | 4 (0.5%) |
| $7,500 to $9,999 | 0 (0.0%) | 16 (2.0%) |
| $10,000 to $12,499 | 77 (9.9%) | 7 (0.9%) |
| $12,500 to $14,999 | 0 (0.0%) | 5 (0.6%) |
| $15,000 to $17,499 | 14 (1.8%) | 26 (3.2%) |
| $17,500 to $19,999 | 24 (3.1%) | 24 (3.0%) |
| $20,000 to $22,499 | 5 (0.6%) | 13 (1.6%) |
| $22,500 to $24,999 | 10 (1.3%) | 7 (0.9%) |
| $25,000 to $29,999 | 14 (1.8%) | 40 (5.0%) |
| $30,000 to $34,999 | 99 (12.7%) | 118 (14.6%) |
| $35,000 to $39,999 | 38 (4.9%) | 59 (7.3%) |
| $40,000 to $44,999 | 39 (5.0%) | 141 (17.5%) |
| $45,000 to $49,999 | 49 (6.3%) | 32 (4.0%) |
| $50,000 to $54,999 | 16 (2.1%) | 49 (6.1%) |
| $55,000 to $64,999 | 116 (14.8%) | 79 (9.8%) |
| $65,000 to $74,999 | 83 (10.6%) | 42 (5.2%) |
| $75,000 to $99,999 | 52 (6.7%) | 73 (9.1%) |
| $100,000+ | 80 (10.2%) | 41 (5.1%) |
| Total | 782 (100.0%) | 806 (100.0%) |
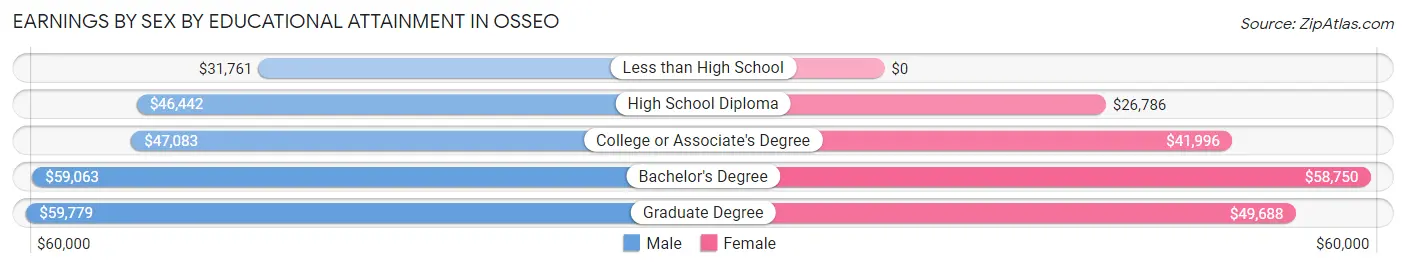
Earnings by Sex by Educational Attainment in Osseo
Average earnings in Osseo are $49,750 for men and $42,762 for women, a difference of 14.1%. Men with an educational attainment of graduate degree enjoy the highest average annual earnings of $59,779, while those with less than high school education earn the least with $31,761. Women with an educational attainment of bachelor's degree earn the most with the average annual earnings of $58,750, while those with high school diploma education have the smallest earnings of $26,786.
| Educational Attainment | Male Income | Female Income |
| Less than High School | $31,761 | $0 |
| High School Diploma | $46,442 | $26,786 |
| College or Associate's Degree | $47,083 | $41,996 |
| Bachelor's Degree | $59,063 | $58,750 |
| Graduate Degree | $59,779 | $49,688 |
| Total | $49,750 | $42,762 |
Family Income in Osseo
Family Income Brackets in Osseo
According to the Osseo family income data, there are 118 families falling into the $100,000 to $149,999 income range, which is the most common income bracket and makes up 22.9% of all families.
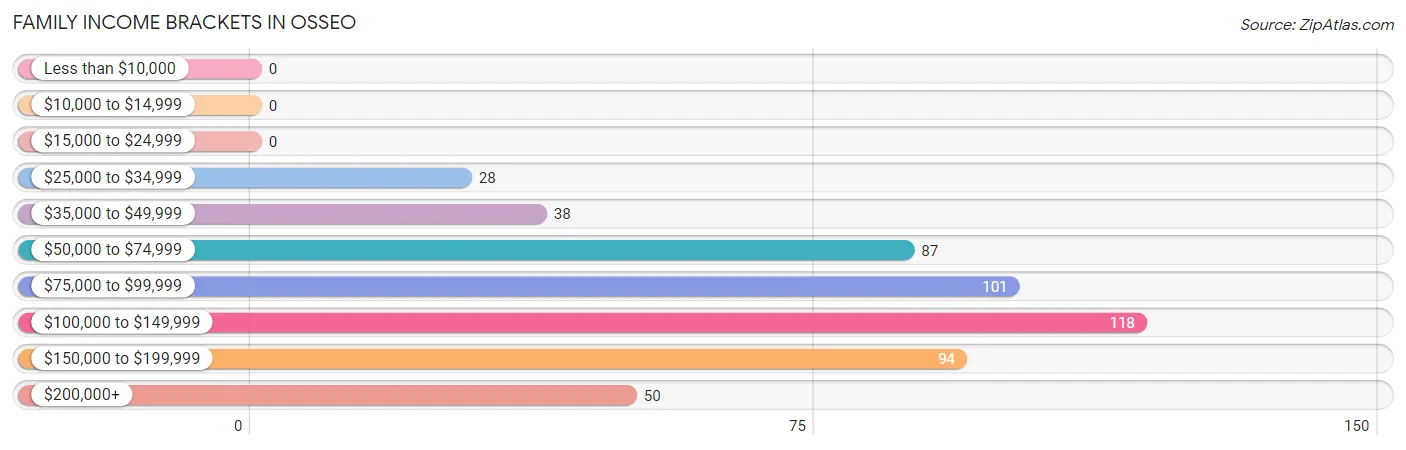
| Income Bracket | # Families | % Families |
| Less than $10,000 | 0 | 0.0% |
| $10,000 to $14,999 | 0 | 0.0% |
| $15,000 to $24,999 | 0 | 0.0% |
| $25,000 to $34,999 | 28 | 5.4% |
| $35,000 to $49,999 | 38 | 7.4% |
| $50,000 to $74,999 | 87 | 16.9% |
| $75,000 to $99,999 | 101 | 19.6% |
| $100,000 to $149,999 | 118 | 22.9% |
| $150,000 to $199,999 | 94 | 18.2% |
| $200,000+ | 50 | 9.7% |
Family Income by Famaliy Size in Osseo
5-person families (40 | 7.7%) account for the highest median family income in Osseo with $168,000 per family, while 2-person families (250 | 48.4%) have the highest median income of $40,782 per family member.
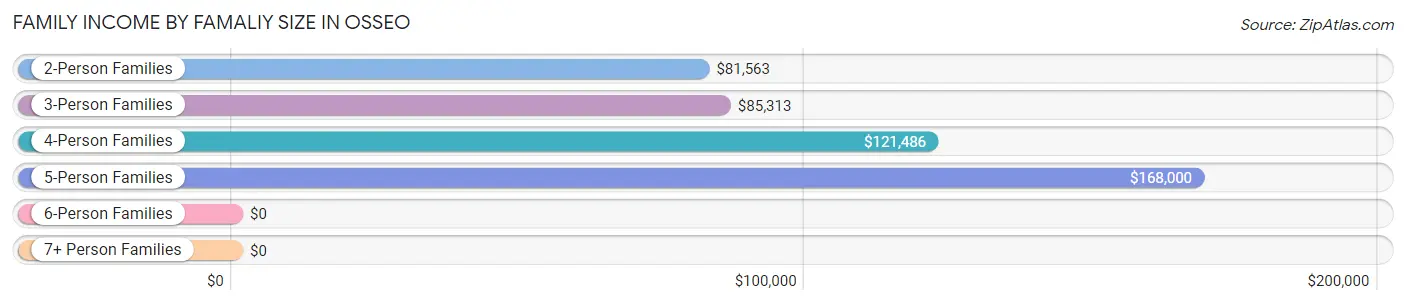
| Income Bracket | # Families | Median Income |
| 2-Person Families | 250 (48.4%) | $81,563 |
| 3-Person Families | 87 (16.9%) | $85,313 |
| 4-Person Families | 137 (26.6%) | $121,486 |
| 5-Person Families | 40 (7.7%) | $168,000 |
| 6-Person Families | 2 (0.4%) | $0 |
| 7+ Person Families | 0 (0.0%) | $0 |
| Total | 516 (100.0%) | $103,750 |
Family Income by Number of Earners in Osseo
The median family income in Osseo is $103,750, with families comprising 3+ earners (134) having the highest median family income of $153,750, while families with no earners (59) have the lowest median family income of $72,656, accounting for 26.0% and 11.4% of families, respectively.
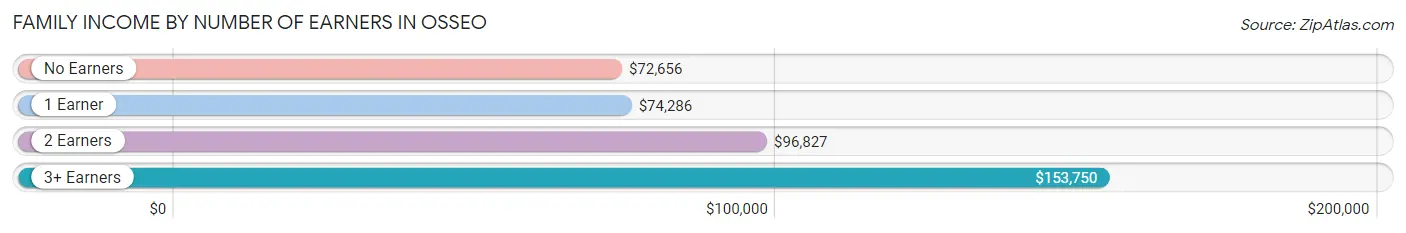
| Number of Earners | # Families | Median Income |
| No Earners | 59 (11.4%) | $72,656 |
| 1 Earner | 144 (27.9%) | $74,286 |
| 2 Earners | 179 (34.7%) | $96,827 |
| 3+ Earners | 134 (26.0%) | $153,750 |
| Total | 516 (100.0%) | $103,750 |
Household Income in Osseo
Household Income Brackets in Osseo
With 310 households falling in the category, the $50,000 to $74,999 income range is the most frequent in Osseo, accounting for 26.2% of all households.
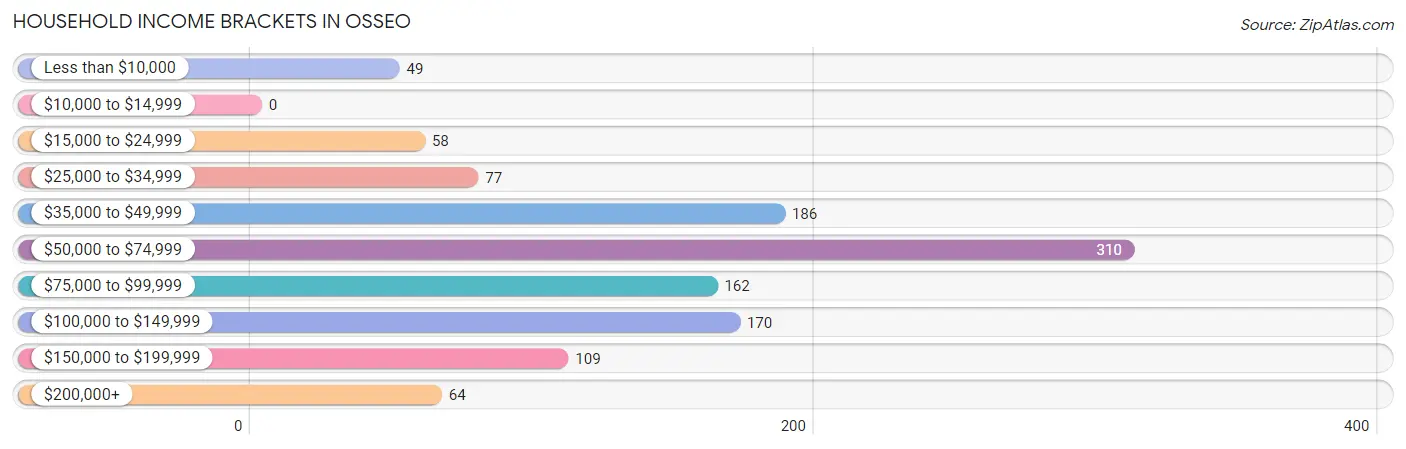
| Income Bracket | # Households | % Households |
| Less than $10,000 | 49 | 4.1% |
| $10,000 to $14,999 | 0 | 0.0% |
| $15,000 to $24,999 | 58 | 4.9% |
| $25,000 to $34,999 | 77 | 6.5% |
| $35,000 to $49,999 | 186 | 15.7% |
| $50,000 to $74,999 | 310 | 26.2% |
| $75,000 to $99,999 | 162 | 13.7% |
| $100,000 to $149,999 | 170 | 14.4% |
| $150,000 to $199,999 | 109 | 9.2% |
| $200,000+ | 64 | 5.4% |
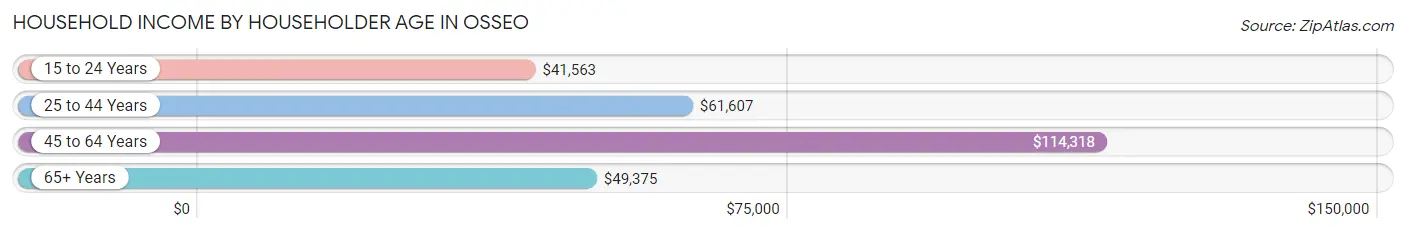
Household Income by Householder Age in Osseo
The median household income in Osseo is $65,463, with the highest median household income of $114,318 found in the 45 to 64 years age bracket for the primary householder. A total of 374 households (31.6%) fall into this category. Meanwhile, the 15 to 24 years age bracket for the primary householder has the lowest median household income of $41,563, with 33 households (2.8%) in this group.
| Income Bracket | # Households | Median Income |
| 15 to 24 Years | 33 (2.8%) | $41,563 |
| 25 to 44 Years | 337 (28.5%) | $61,607 |
| 45 to 64 Years | 374 (31.6%) | $114,318 |
| 65+ Years | 440 (37.2%) | $49,375 |
| Total | 1,184 (100.0%) | $65,463 |
Poverty in Osseo
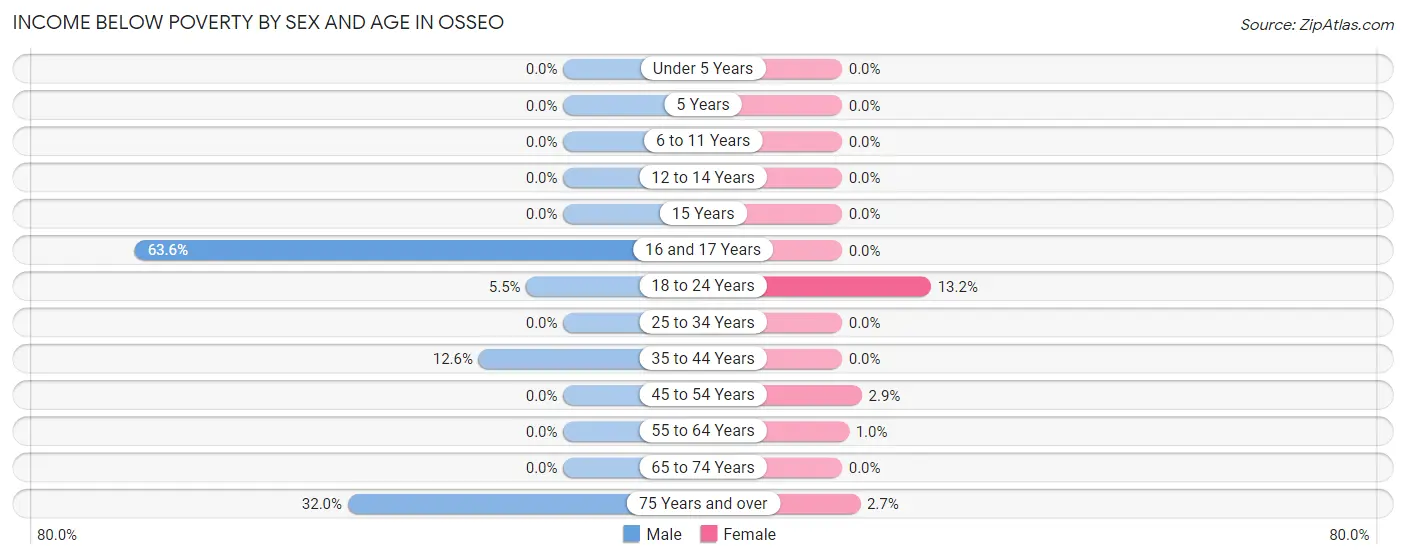
Income Below Poverty by Sex and Age in Osseo
With 8.6% poverty level for males and 1.2% for females among the residents of Osseo, 16 and 17 year old males and 18 to 24 year old females are the most vulnerable to poverty, with 28 males (63.6%) and 7 females (13.2%) in their respective age groups living below the poverty level.
| Age Bracket | Male | Female |
| Under 5 Years | 0 (0.0%) | 0 (0.0%) |
| 5 Years | 0 (0.0%) | 0 (0.0%) |
| 6 to 11 Years | 0 (0.0%) | 0 (0.0%) |
| 12 to 14 Years | 0 (0.0%) | 0 (0.0%) |
| 15 Years | 0 (0.0%) | 0 (0.0%) |
| 16 and 17 Years | 28 (63.6%) | 0 (0.0%) |
| 18 to 24 Years | 4 (5.5%) | 7 (13.2%) |
| 25 to 34 Years | 0 (0.0%) | 0 (0.0%) |
| 35 to 44 Years | 25 (12.6%) | 0 (0.0%) |
| 45 to 54 Years | 0 (0.0%) | 3 (2.9%) |
| 55 to 64 Years | 0 (0.0%) | 2 (1.0%) |
| 65 to 74 Years | 0 (0.0%) | 0 (0.0%) |
| 75 Years and over | 48 (32.0%) | 4 (2.7%) |
| Total | 105 (8.6%) | 16 (1.2%) |
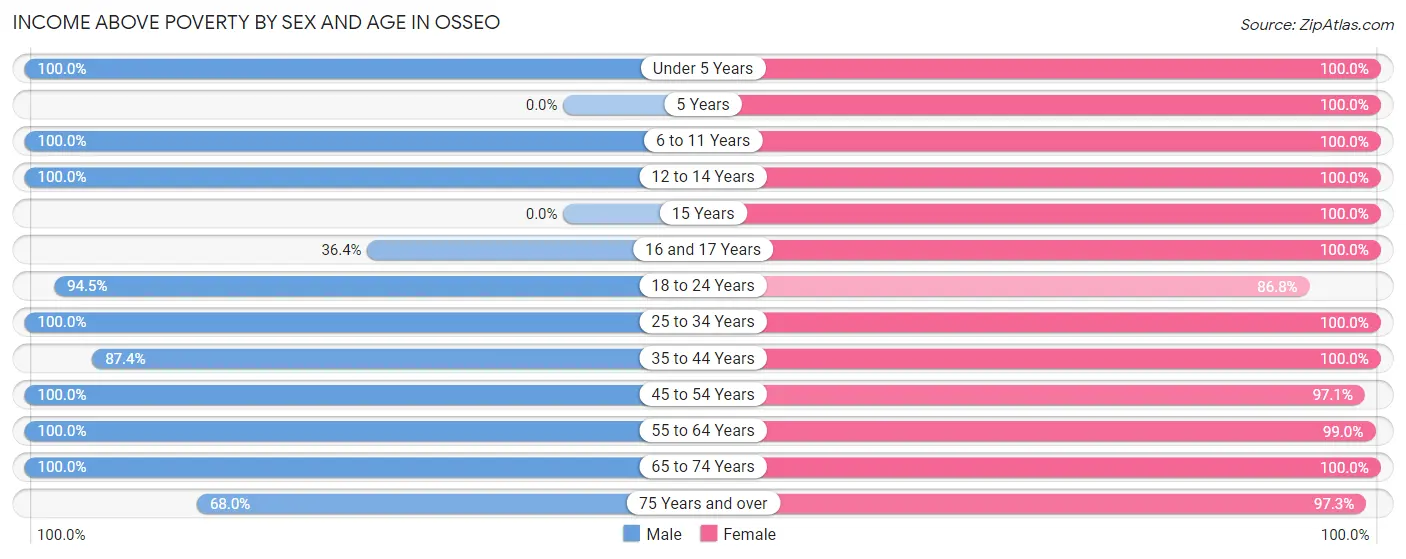
Income Above Poverty by Sex and Age in Osseo
According to the poverty statistics in Osseo, males aged under 5 years and females aged under 5 years are the age groups that are most secure financially, with 100.0% of males and 100.0% of females in these age groups living above the poverty line.
| Age Bracket | Male | Female |
| Under 5 Years | 53 (100.0%) | 61 (100.0%) |
| 5 Years | 0 (0.0%) | 3 (100.0%) |
| 6 to 11 Years | 44 (100.0%) | 95 (100.0%) |
| 12 to 14 Years | 9 (100.0%) | 26 (100.0%) |
| 15 Years | 0 (0.0%) | 3 (100.0%) |
| 16 and 17 Years | 16 (36.4%) | 13 (100.0%) |
| 18 to 24 Years | 69 (94.5%) | 46 (86.8%) |
| 25 to 34 Years | 189 (100.0%) | 302 (100.0%) |
| 35 to 44 Years | 174 (87.4%) | 125 (100.0%) |
| 45 to 54 Years | 152 (100.0%) | 99 (97.1%) |
| 55 to 64 Years | 198 (100.0%) | 193 (99.0%) |
| 65 to 74 Years | 104 (100.0%) | 178 (100.0%) |
| 75 Years and over | 102 (68.0%) | 144 (97.3%) |
| Total | 1,110 (91.4%) | 1,288 (98.8%) |
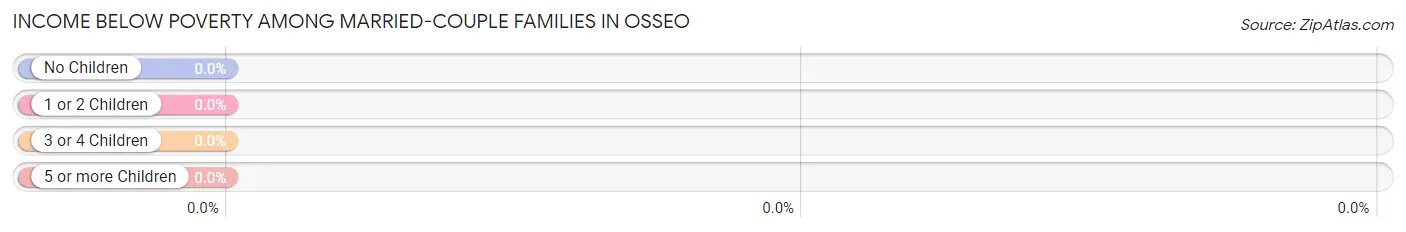
Income Below Poverty Among Married-Couple Families in Osseo
| Children | Above Poverty | Below Poverty |
| No Children | 263 (100.0%) | 0 (0.0%) |
| 1 or 2 Children | 115 (100.0%) | 0 (0.0%) |
| 3 or 4 Children | 14 (100.0%) | 0 (0.0%) |
| 5 or more Children | 0 (0.0%) | 0 (0.0%) |
| Total | 392 (100.0%) | 0 (0.0%) |
Income Below Poverty Among Single-Parent Households in Osseo
| Children | Single Father | Single Mother |
| No Children | 0 (0.0%) | 0 (0.0%) |
| 1 or 2 Children | 0 (0.0%) | 0 (0.0%) |
| 3 or 4 Children | 0 (0.0%) | 0 (0.0%) |
| 5 or more Children | 0 (0.0%) | 0 (0.0%) |
| Total | 0 (0.0%) | 0 (0.0%) |
Income Below Poverty Among Married-Couple vs Single-Parent Households in Osseo
| Children | Married-Couple Families | Single-Parent Households |
| No Children | 0 (0.0%) | 0 (0.0%) |
| 1 or 2 Children | 0 (0.0%) | 0 (0.0%) |
| 3 or 4 Children | 0 (0.0%) | 0 (0.0%) |
| 5 or more Children | 0 (0.0%) | 0 (0.0%) |
| Total | 0 (0.0%) | 0 (0.0%) |
Race in Osseo
The most populous races in Osseo are White / Caucasian (2,161 | 82.0%), Black / African American (183 | 7.0%), and Two or more Races (172 | 6.5%).
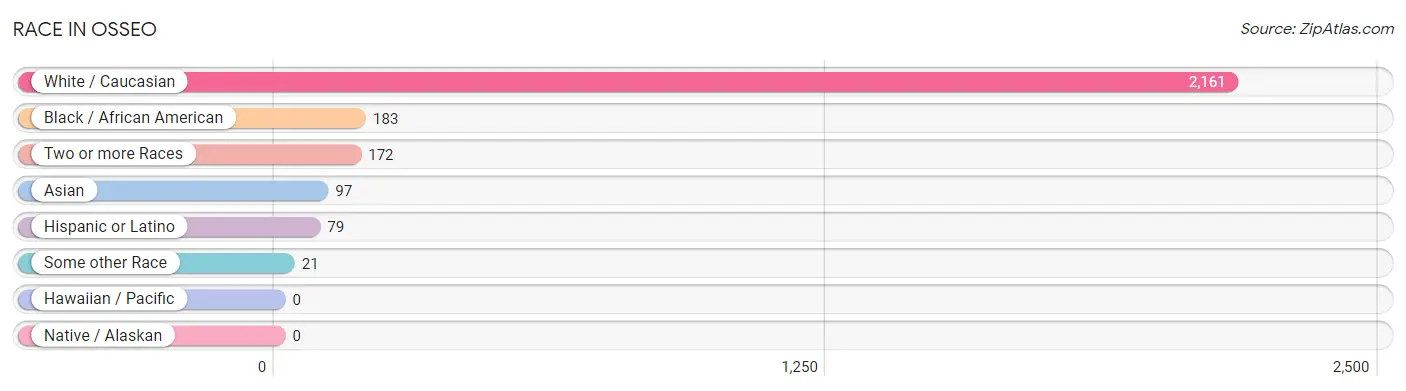
| Race | # Population | % Population |
| Asian | 97 | 3.7% |
| Black / African American | 183 | 7.0% |
| Hawaiian / Pacific | 0 | 0.0% |
| Hispanic or Latino | 79 | 3.0% |
| Native / Alaskan | 0 | 0.0% |
| White / Caucasian | 2,161 | 82.0% |
| Two or more Races | 172 | 6.5% |
| Some other Race | 21 | 0.8% |
| Total | 2,634 | 100.0% |
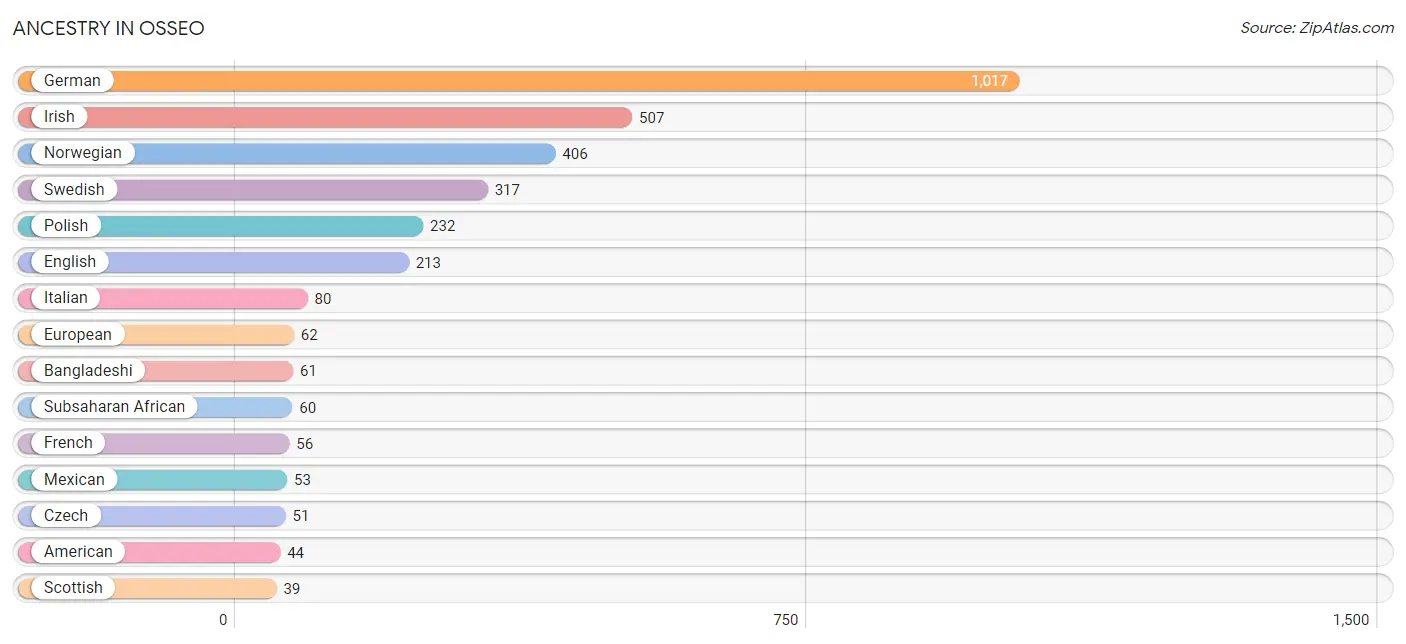
Ancestry in Osseo
The most populous ancestries reported in Osseo are German (1,017 | 38.6%), Irish (507 | 19.3%), Norwegian (406 | 15.4%), Swedish (317 | 12.0%), and Polish (232 | 8.8%), together accounting for 94.1% of all Osseo residents.
| Ancestry | # Population | % Population |
| African | 10 | 0.4% |
| American | 44 | 1.7% |
| Arab | 10 | 0.4% |
| Austrian | 15 | 0.6% |
| Bahamian | 6 | 0.2% |
| Bangladeshi | 61 | 2.3% |
| British | 12 | 0.5% |
| Chickasaw | 30 | 1.1% |
| Colombian | 2 | 0.1% |
| Croatian | 6 | 0.2% |
| Cuban | 9 | 0.3% |
| Czech | 51 | 1.9% |
| Danish | 13 | 0.5% |
| Dutch | 14 | 0.5% |
| Ecuadorian | 15 | 0.6% |
| English | 213 | 8.1% |
| European | 62 | 2.4% |
| Finnish | 12 | 0.5% |
| French | 56 | 2.1% |
| French Canadian | 17 | 0.6% |
| German | 1,017 | 38.6% |
| Greek | 5 | 0.2% |
| Hungarian | 1 | 0.0% |
| Icelander | 3 | 0.1% |
| Indian (Asian) | 4 | 0.2% |
| Irish | 507 | 19.3% |
| Italian | 80 | 3.0% |
| Korean | 14 | 0.5% |
| Liberian | 25 | 0.9% |
| Mexican | 53 | 2.0% |
| Nigerian | 25 | 0.9% |
| Norwegian | 406 | 15.4% |
| Polish | 232 | 8.8% |
| Portuguese | 30 | 1.1% |
| Russian | 14 | 0.5% |
| Scandinavian | 11 | 0.4% |
| Scotch-Irish | 17 | 0.6% |
| Scottish | 39 | 1.5% |
| Slovak | 22 | 0.8% |
| South American | 17 | 0.6% |
| Sri Lankan | 1 | 0.0% |
| Subsaharan African | 60 | 2.3% |
| Swedish | 317 | 12.0% |
| Swiss | 27 | 1.0% |
| Thai | 30 | 1.1% |
| Welsh | 9 | 0.3% |
| West Indian | 6 | 0.2% | View All 47 Rows |
Immigrants in Osseo
The most numerous immigrant groups reported in Osseo came from Latin America (41 | 1.6%), Africa (36 | 1.4%), Western Africa (36 | 1.4%), South America (31 | 1.2%), and Liberia (21 | 0.8%), together accounting for 6.3% of all Osseo residents.
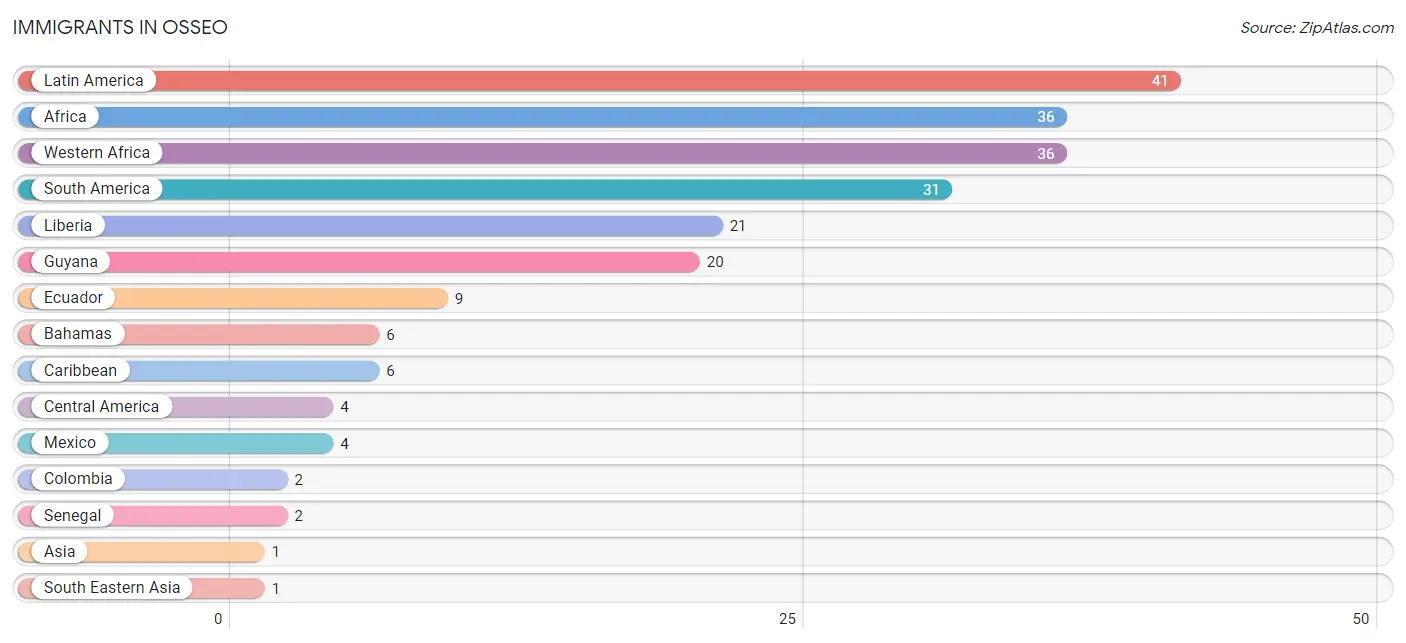
| Immigration Origin | # Population | % Population |
| Africa | 36 | 1.4% |
| Asia | 1 | 0.0% |
| Bahamas | 6 | 0.2% |
| Caribbean | 6 | 0.2% |
| Central America | 4 | 0.2% |
| Colombia | 2 | 0.1% |
| Ecuador | 9 | 0.3% |
| Guyana | 20 | 0.8% |
| Latin America | 41 | 1.6% |
| Liberia | 21 | 0.8% |
| Mexico | 4 | 0.2% |
| Senegal | 2 | 0.1% |
| South America | 31 | 1.2% |
| South Eastern Asia | 1 | 0.0% |
| Vietnam | 1 | 0.0% |
| Western Africa | 36 | 1.4% | View All 16 Rows |
Sex and Age in Osseo
Sex and Age in Osseo
The most populous age groups in Osseo are 60 to 64 Years (139 | 11.1%) for men and 25 to 29 Years (177 | 12.8%) for women.
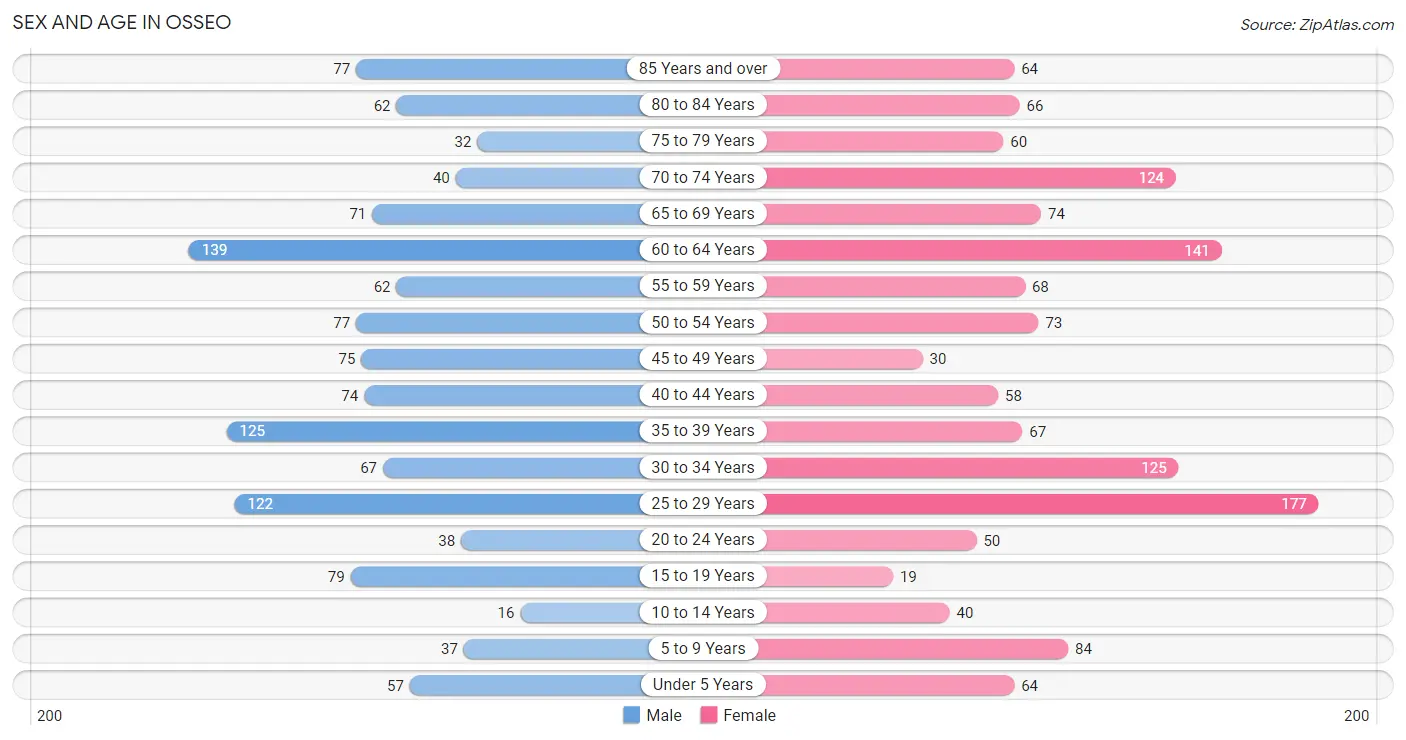
| Age Bracket | Male | Female |
| Under 5 Years | 57 (4.6%) | 64 (4.6%) |
| 5 to 9 Years | 37 (3.0%) | 84 (6.1%) |
| 10 to 14 Years | 16 (1.3%) | 40 (2.9%) |
| 15 to 19 Years | 79 (6.3%) | 19 (1.4%) |
| 20 to 24 Years | 38 (3.0%) | 50 (3.6%) |
| 25 to 29 Years | 122 (9.8%) | 177 (12.8%) |
| 30 to 34 Years | 67 (5.4%) | 125 (9.0%) |
| 35 to 39 Years | 125 (10.0%) | 67 (4.8%) |
| 40 to 44 Years | 74 (5.9%) | 58 (4.2%) |
| 45 to 49 Years | 75 (6.0%) | 30 (2.2%) |
| 50 to 54 Years | 77 (6.2%) | 73 (5.3%) |
| 55 to 59 Years | 62 (5.0%) | 68 (4.9%) |
| 60 to 64 Years | 139 (11.1%) | 141 (10.2%) |
| 65 to 69 Years | 71 (5.7%) | 74 (5.3%) |
| 70 to 74 Years | 40 (3.2%) | 124 (9.0%) |
| 75 to 79 Years | 32 (2.6%) | 60 (4.3%) |
| 80 to 84 Years | 62 (5.0%) | 66 (4.8%) |
| 85 Years and over | 77 (6.2%) | 64 (4.6%) |
| Total | 1,250 (100.0%) | 1,384 (100.0%) |
Families and Households in Osseo
Median Family Size in Osseo
The median family size in Osseo is 3.15 persons per family, with married-couple families (392 | 76.0%) accounting for the largest median family size of 3.34 persons per family. On the other hand, single male/father families (5 | 1.0%) represent the smallest median family size with 1.80 persons per family.
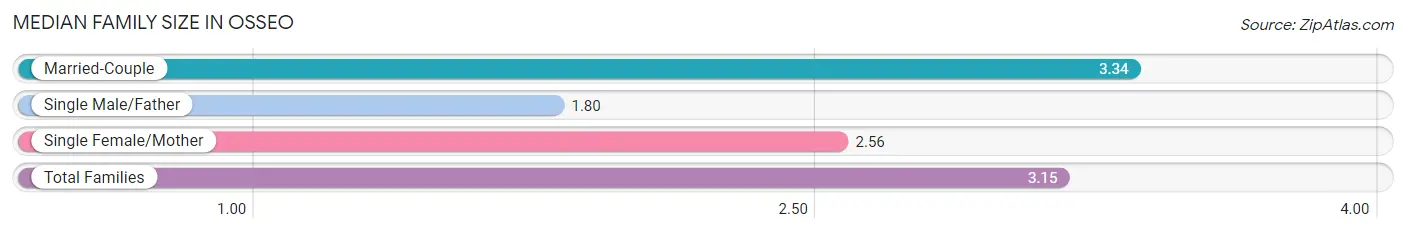
| Family Type | # Families | Family Size |
| Married-Couple | 392 (76.0%) | 3.34 |
| Single Male/Father | 5 (1.0%) | 1.80 |
| Single Female/Mother | 119 (23.1%) | 2.56 |
| Total Families | 516 (100.0%) | 3.15 |
Median Household Size in Osseo
The median household size in Osseo is 2.13 persons per household, with married-couple households (392 | 33.1%) accounting for the largest median household size of 3.51 persons per household. non-family households (668 | 56.4%) represent the smallest median household size with 1.17 persons per household.
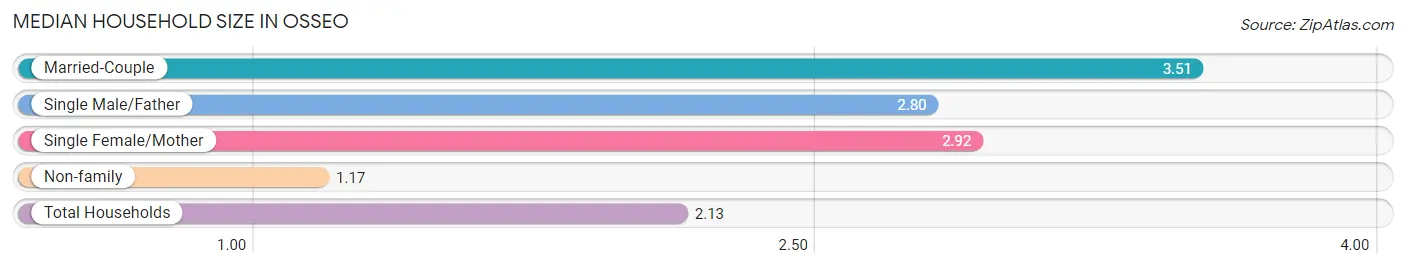
| Household Type | # Households | Household Size |
| Married-Couple | 392 (33.1%) | 3.51 |
| Single Male/Father | 5 (0.4%) | 2.80 |
| Single Female/Mother | 119 (10.1%) | 2.92 |
| Non-family | 668 (56.4%) | 1.17 |
| Total Households | 1,184 (100.0%) | 2.13 |
Household Size by Marriage Status in Osseo
Out of a total of 1,184 households in Osseo, 516 (43.6%) are family households, while 668 (56.4%) are nonfamily households. The most numerous type of family households are 2-person households, comprising 238, and the most common type of nonfamily households are 1-person households, comprising 565.
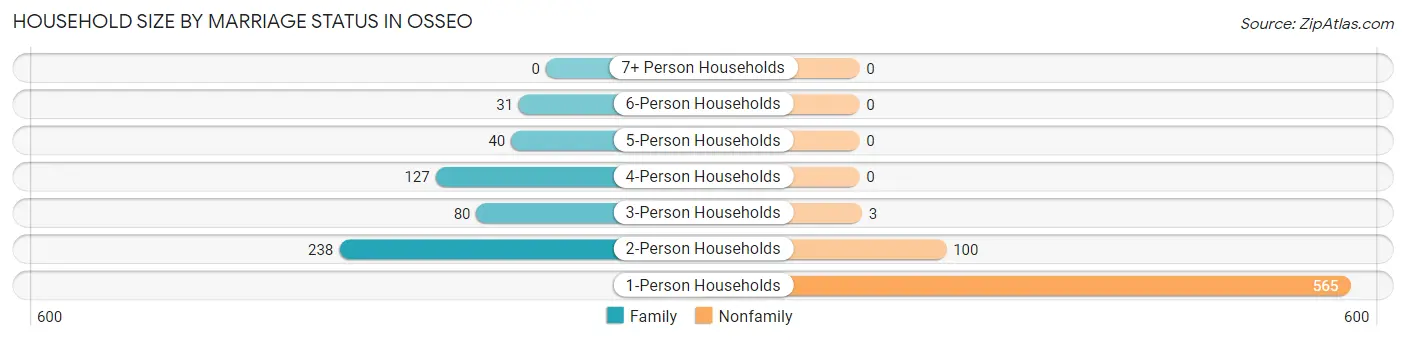
| Household Size | Family Households | Nonfamily Households |
| 1-Person Households | - | 565 (47.7%) |
| 2-Person Households | 238 (20.1%) | 100 (8.5%) |
| 3-Person Households | 80 (6.8%) | 3 (0.3%) |
| 4-Person Households | 127 (10.7%) | 0 (0.0%) |
| 5-Person Households | 40 (3.4%) | 0 (0.0%) |
| 6-Person Households | 31 (2.6%) | 0 (0.0%) |
| 7+ Person Households | 0 (0.0%) | 0 (0.0%) |
| Total | 516 (43.6%) | 668 (56.4%) |
Female Fertility in Osseo
Fertility by Age in Osseo
Average fertility rate in Osseo is 65.0 births per 1,000 women. Women in the age bracket of 15 to 19 years have the highest fertility rate with 158.0 births per 1,000 women. Women in the age bracket of 20 to 34 years acount for 91.2% of all women with births.
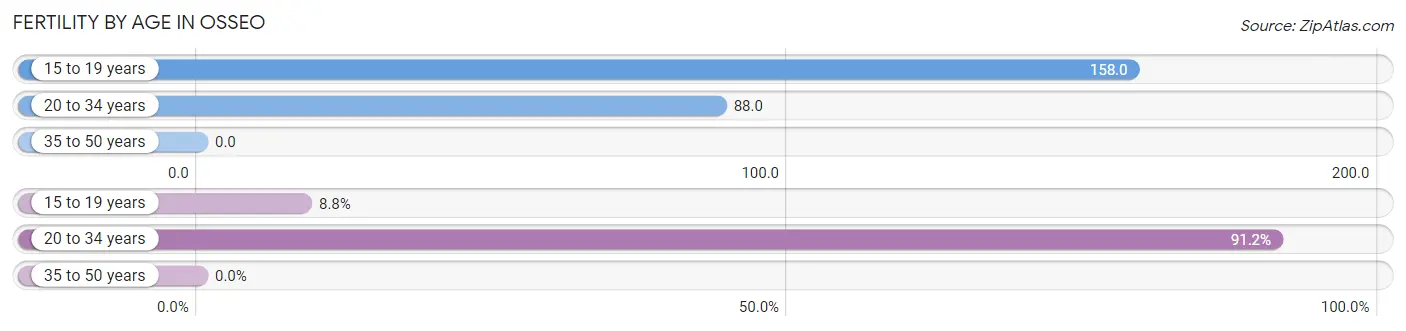
| Age Bracket | Women with Births | Births / 1,000 Women |
| 15 to 19 years | 3 (8.8%) | 158.0 |
| 20 to 34 years | 31 (91.2%) | 88.0 |
| 35 to 50 years | 0 (0.0%) | 0.0 |
| Total | 34 (100.0%) | 65.0 |
Fertility by Age by Marriage Status in Osseo
44.1% of women with births (34) in Osseo are married. The highest percentage of unmarried women with births falls into 15 to 19 years age bracket with 100.0% of them unmarried at the time of birth, while the lowest percentage of unmarried women with births belong to 20 to 34 years age bracket with 51.6% of them unmarried.
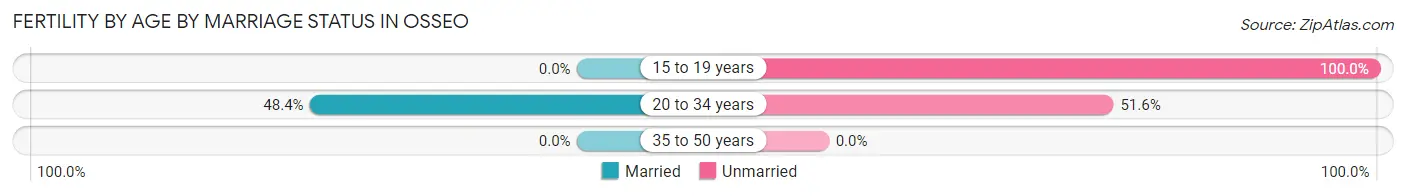
| Age Bracket | Married | Unmarried |
| 15 to 19 years | 0 (0.0%) | 3 (100.0%) |
| 20 to 34 years | 15 (48.4%) | 16 (51.6%) |
| 35 to 50 years | 0 (0.0%) | 0 (0.0%) |
| Total | 15 (44.1%) | 19 (55.9%) |
Fertility by Education in Osseo
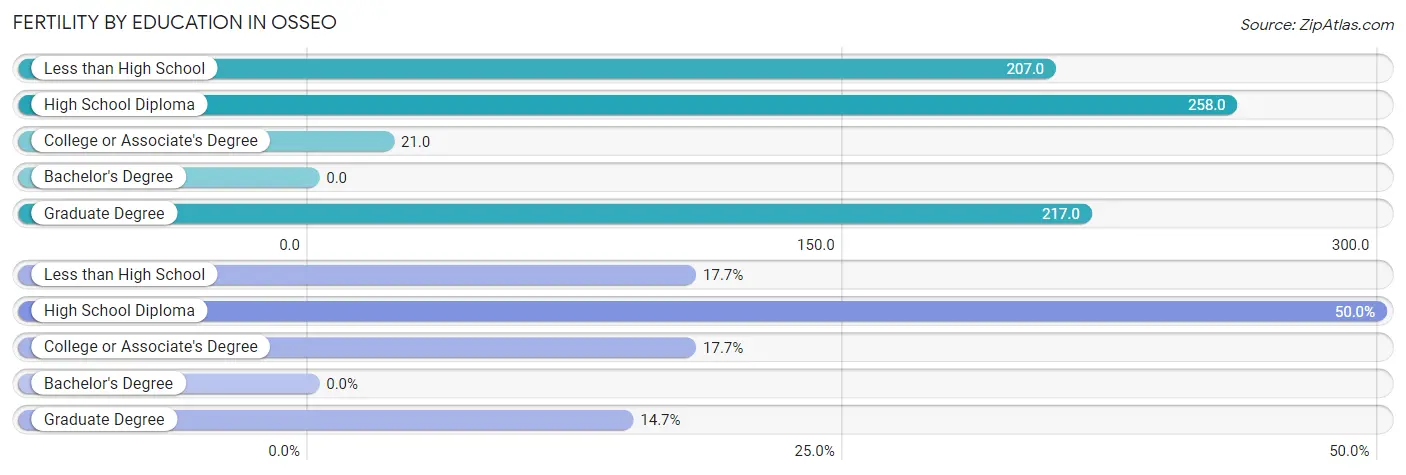
| Educational Attainment | Women with Births | Births / 1,000 Women |
| Less than High School | 6 (17.6%) | 207.0 |
| High School Diploma | 17 (50.0%) | 258.0 |
| College or Associate's Degree | 6 (17.6%) | 21.0 |
| Bachelor's Degree | 0 (0.0%) | 0.0 |
| Graduate Degree | 5 (14.7%) | 217.0 |
| Total | 34 (100.0%) | 65.0 |
Fertility by Education by Marriage Status in Osseo
55.9% of women with births in Osseo are unmarried. Women with the educational attainment of less than high school are most likely to be married with 100.0% of them married at childbirth, while women with the educational attainment of high school diploma are least likely to be married with 100.0% of them unmarried at childbirth.
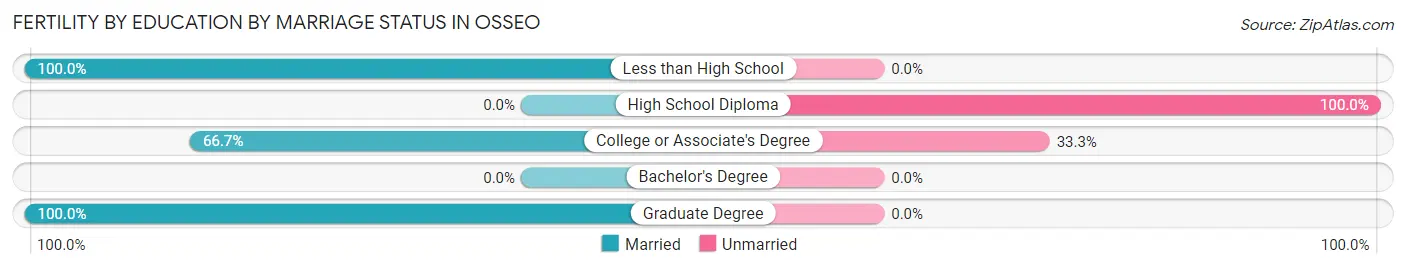
| Educational Attainment | Married | Unmarried |
| Less than High School | 6 (100.0%) | 0 (0.0%) |
| High School Diploma | 0 (0.0%) | 17 (100.0%) |
| College or Associate's Degree | 4 (66.7%) | 2 (33.3%) |
| Bachelor's Degree | 0 (0.0%) | 0 (0.0%) |
| Graduate Degree | 5 (100.0%) | 0 (0.0%) |
| Total | 15 (44.1%) | 19 (55.9%) |
Employment Characteristics in Osseo
Employment by Class of Employer in Osseo
Among the 1,421 employed individuals in Osseo, private company employees (1,161 | 81.7%), not-for-profit organizations (86 | 6.0%), and self-employed (incorporated) (56 | 3.9%) make up the most common classes of employment.
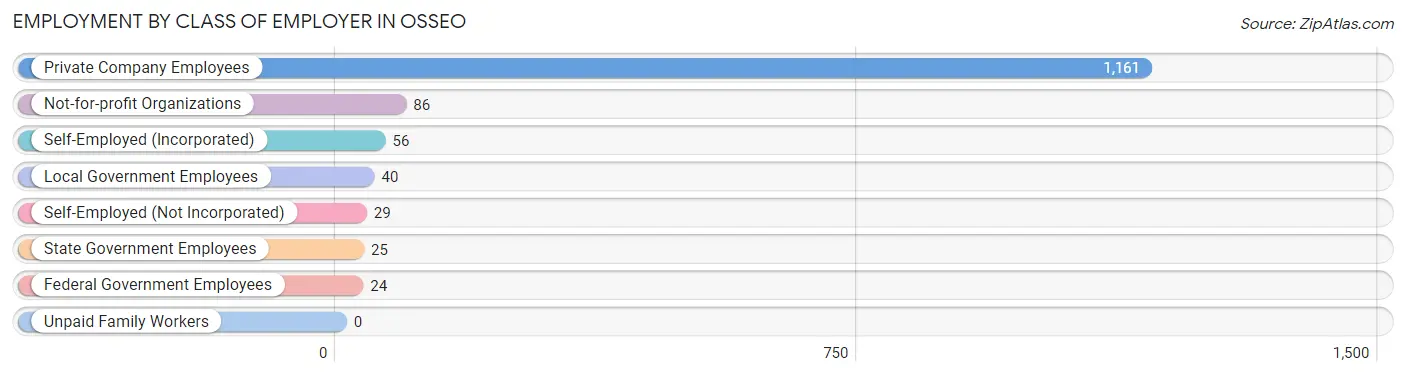
| Employer Class | # Employees | % Employees |
| Private Company Employees | 1,161 | 81.7% |
| Self-Employed (Incorporated) | 56 | 3.9% |
| Self-Employed (Not Incorporated) | 29 | 2.0% |
| Not-for-profit Organizations | 86 | 6.0% |
| Local Government Employees | 40 | 2.8% |
| State Government Employees | 25 | 1.8% |
| Federal Government Employees | 24 | 1.7% |
| Unpaid Family Workers | 0 | 0.0% |
| Total | 1,421 | 100.0% |
Employment Status by Age in Osseo
According to the labor force statistics for Osseo, out of the total population over 16 years of age (2,333), 65.5% or 1,528 individuals are in the labor force, with 6.4% or 98 of them unemployed. The age group with the highest labor force participation rate is 20 to 24 years, with 100.0% or 88 individuals in the labor force. Within the labor force, the 25 to 29 years age range has the highest percentage of unemployed individuals, with 28.0% or 77 of them being unemployed.
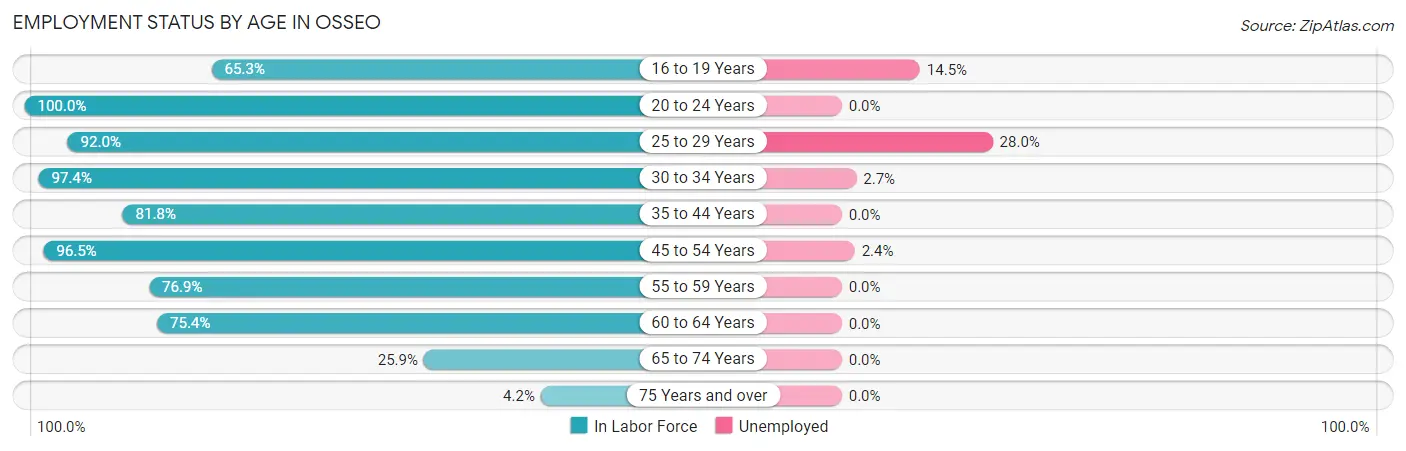
| Age Bracket | In Labor Force | Unemployed |
| 16 to 19 Years | 62 (65.3%) | 9 (14.5%) |
| 20 to 24 Years | 88 (100.0%) | 0 (0.0%) |
| 25 to 29 Years | 275 (92.0%) | 77 (28.0%) |
| 30 to 34 Years | 187 (97.4%) | 5 (2.7%) |
| 35 to 44 Years | 265 (81.8%) | 0 (0.0%) |
| 45 to 54 Years | 246 (96.5%) | 6 (2.4%) |
| 55 to 59 Years | 100 (76.9%) | 0 (0.0%) |
| 60 to 64 Years | 211 (75.4%) | 0 (0.0%) |
| 65 to 74 Years | 80 (25.9%) | 0 (0.0%) |
| 75 Years and over | 15 (4.2%) | 0 (0.0%) |
| Total | 1,528 (65.5%) | 98 (6.4%) |
Employment Status by Educational Attainment in Osseo
According to labor force statistics for Osseo, 86.8% of individuals (1,285) out of the total population between 25 and 64 years of age (1,480) are in the labor force, with 6.9% or 89 of them being unemployed. The group with the highest labor force participation rate are those with the educational attainment of college / associate degree, with 93.4% or 740 individuals in the labor force. Within the labor force, individuals with college / associate degree education have the highest percentage of unemployment, with 11.4% or 84 of them being unemployed.
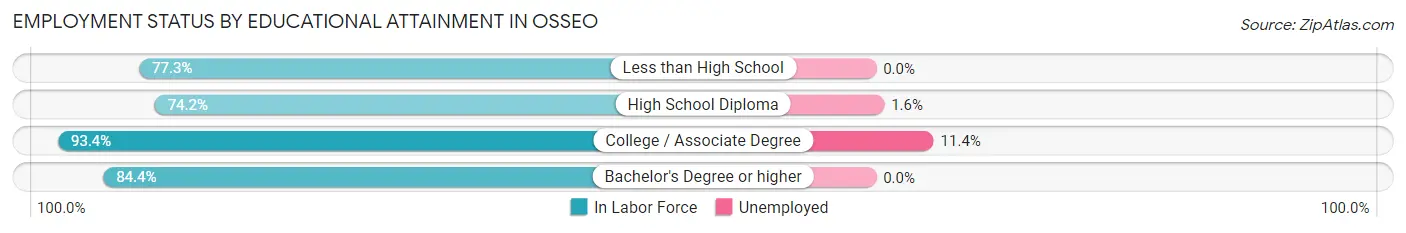
| Educational Attainment | In Labor Force | Unemployed |
| Less than High School | 34 (77.3%) | 0 (0.0%) |
| High School Diploma | 244 (74.2%) | 5 (1.6%) |
| College / Associate Degree | 740 (93.4%) | 90 (11.4%) |
| Bachelor's Degree or higher | 266 (84.4%) | 0 (0.0%) |
| Total | 1,285 (86.8%) | 102 (6.9%) |
Employment Occupations by Sex in Osseo
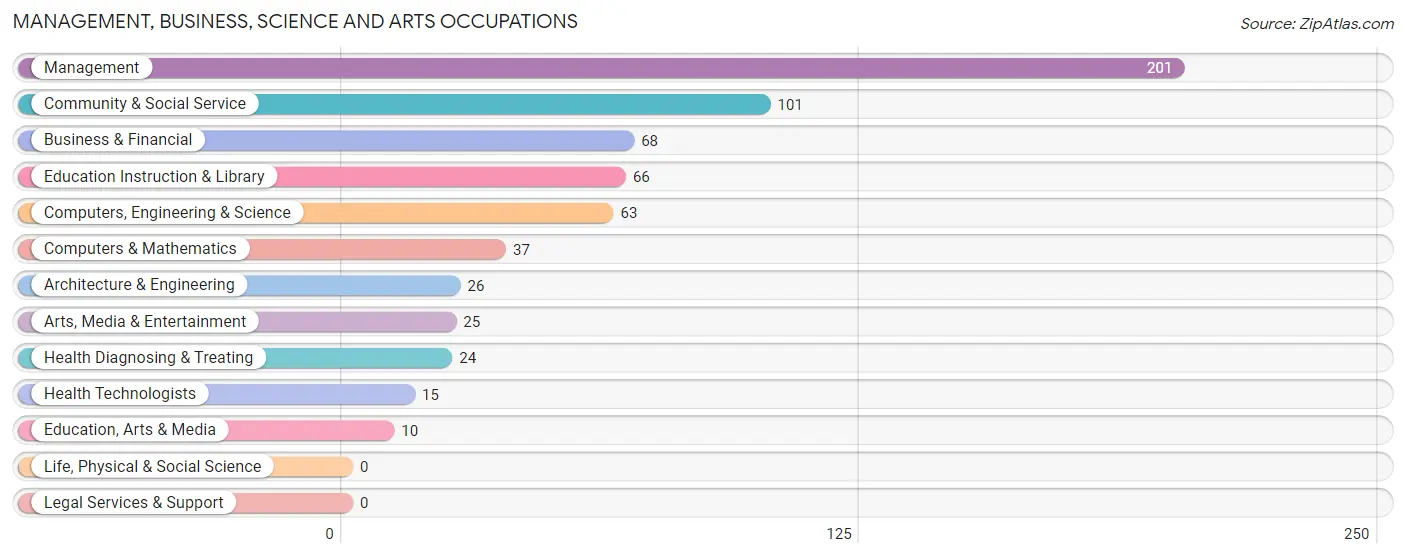
Management, Business, Science and Arts Occupations
The most common Management, Business, Science and Arts occupations in Osseo are Management (201 | 14.1%), Community & Social Service (101 | 7.1%), Business & Financial (68 | 4.8%), Education Instruction & Library (66 | 4.6%), and Computers, Engineering & Science (63 | 4.4%).
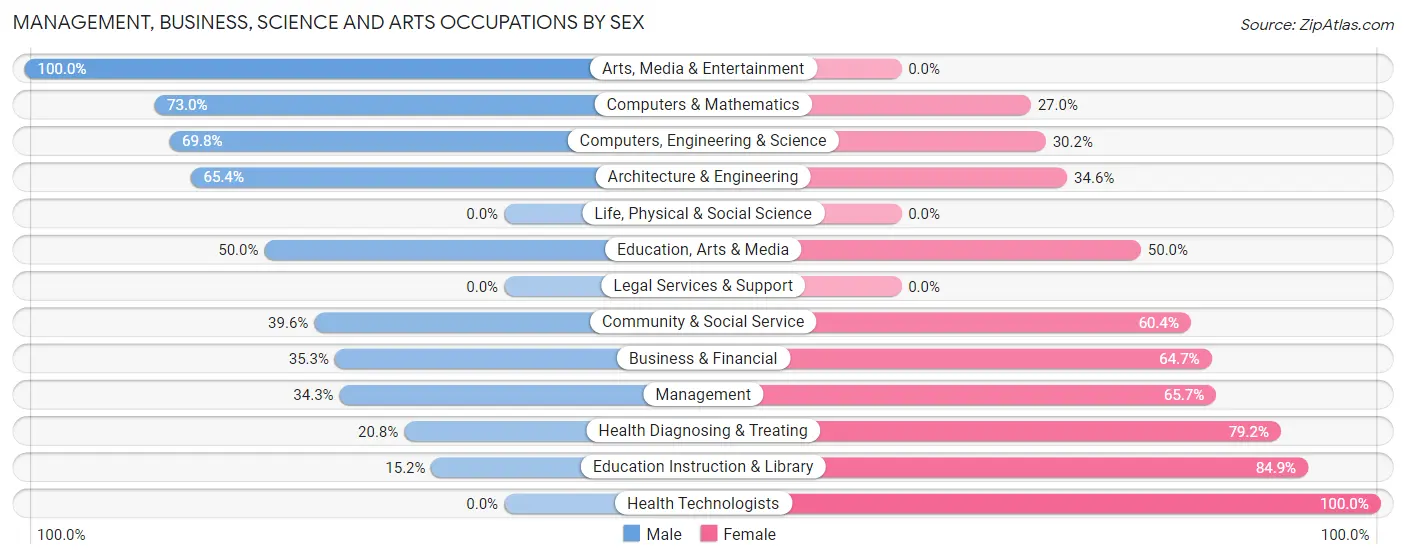
Management, Business, Science and Arts Occupations by Sex
Within the Management, Business, Science and Arts occupations in Osseo, the most male-oriented occupations are Arts, Media & Entertainment (100.0%), Computers & Mathematics (73.0%), and Computers, Engineering & Science (69.8%), while the most female-oriented occupations are Health Technologists (100.0%), Education Instruction & Library (84.9%), and Health Diagnosing & Treating (79.2%).
| Occupation | Male | Female |
| Management | 69 (34.3%) | 132 (65.7%) |
| Business & Financial | 24 (35.3%) | 44 (64.7%) |
| Computers, Engineering & Science | 44 (69.8%) | 19 (30.2%) |
| Computers & Mathematics | 27 (73.0%) | 10 (27.0%) |
| Architecture & Engineering | 17 (65.4%) | 9 (34.6%) |
| Life, Physical & Social Science | 0 (0.0%) | 0 (0.0%) |
| Community & Social Service | 40 (39.6%) | 61 (60.4%) |
| Education, Arts & Media | 5 (50.0%) | 5 (50.0%) |
| Legal Services & Support | 0 (0.0%) | 0 (0.0%) |
| Education Instruction & Library | 10 (15.1%) | 56 (84.9%) |
| Arts, Media & Entertainment | 25 (100.0%) | 0 (0.0%) |
| Health Diagnosing & Treating | 5 (20.8%) | 19 (79.2%) |
| Health Technologists | 0 (0.0%) | 15 (100.0%) |
| Total (Category) | 182 (39.8%) | 275 (60.2%) |
| Total (Overall) | 648 (45.4%) | 780 (54.6%) |
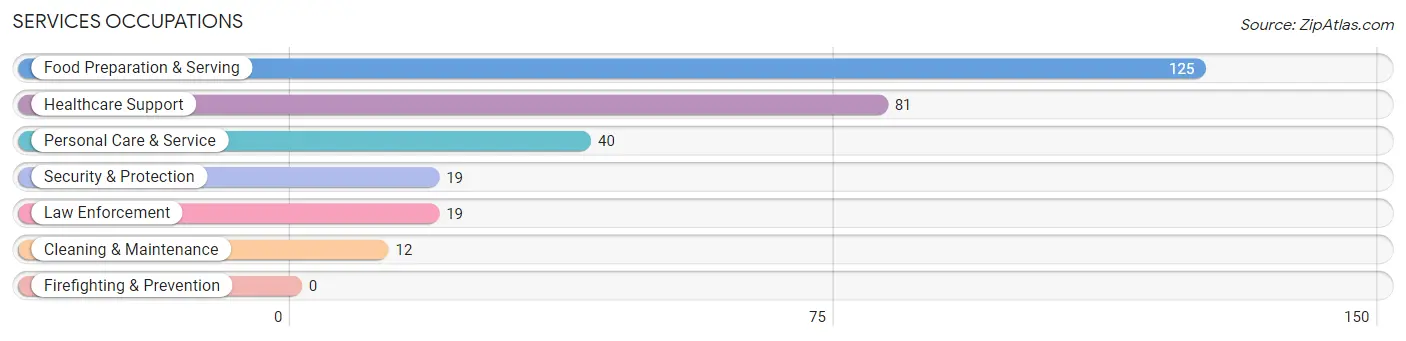
Services Occupations
The most common Services occupations in Osseo are Food Preparation & Serving (125 | 8.7%), Healthcare Support (81 | 5.7%), Personal Care & Service (40 | 2.8%), Security & Protection (19 | 1.3%), and Law Enforcement (19 | 1.3%).
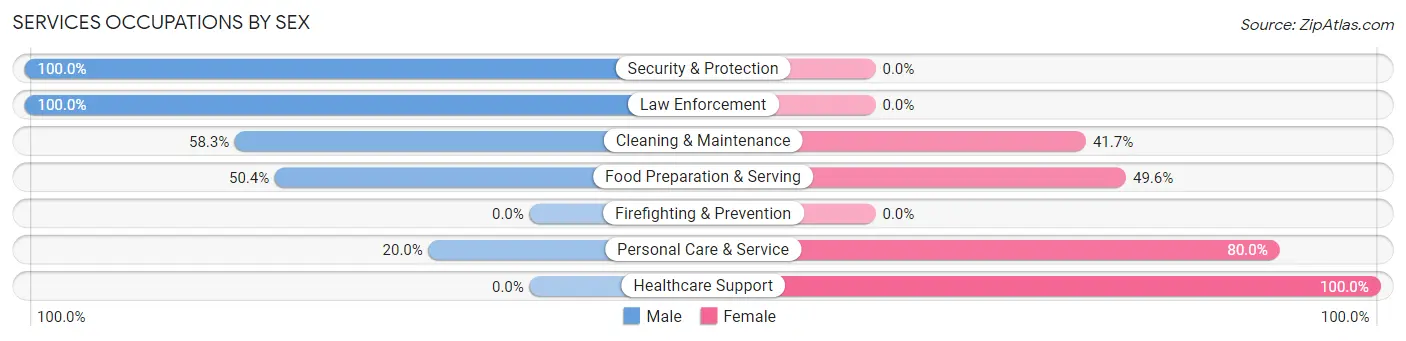
Services Occupations by Sex
Within the Services occupations in Osseo, the most male-oriented occupations are Security & Protection (100.0%), Law Enforcement (100.0%), and Cleaning & Maintenance (58.3%), while the most female-oriented occupations are Healthcare Support (100.0%), Personal Care & Service (80.0%), and Food Preparation & Serving (49.6%).
| Occupation | Male | Female |
| Healthcare Support | 0 (0.0%) | 81 (100.0%) |
| Security & Protection | 19 (100.0%) | 0 (0.0%) |
| Firefighting & Prevention | 0 (0.0%) | 0 (0.0%) |
| Law Enforcement | 19 (100.0%) | 0 (0.0%) |
| Food Preparation & Serving | 63 (50.4%) | 62 (49.6%) |
| Cleaning & Maintenance | 7 (58.3%) | 5 (41.7%) |
| Personal Care & Service | 8 (20.0%) | 32 (80.0%) |
| Total (Category) | 97 (35.0%) | 180 (65.0%) |
| Total (Overall) | 648 (45.4%) | 780 (54.6%) |
Sales and Office Occupations
The most common Sales and Office occupations in Osseo are Office & Administration (239 | 16.7%), and Sales & Related (148 | 10.4%).
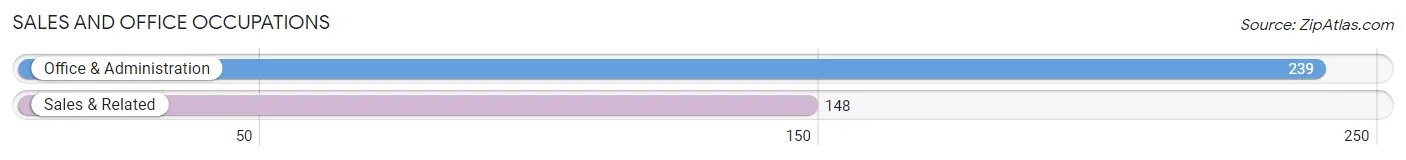
Sales and Office Occupations by Sex

| Occupation | Male | Female |
| Sales & Related | 85 (57.4%) | 63 (42.6%) |
| Office & Administration | 44 (18.4%) | 195 (81.6%) |
| Total (Category) | 129 (33.3%) | 258 (66.7%) |
| Total (Overall) | 648 (45.4%) | 780 (54.6%) |
Natural Resources, Construction and Maintenance Occupations
The most common Natural Resources, Construction and Maintenance occupations in Osseo are Installation, Maintenance & Repair (62 | 4.3%), and Construction & Extraction (28 | 2.0%).
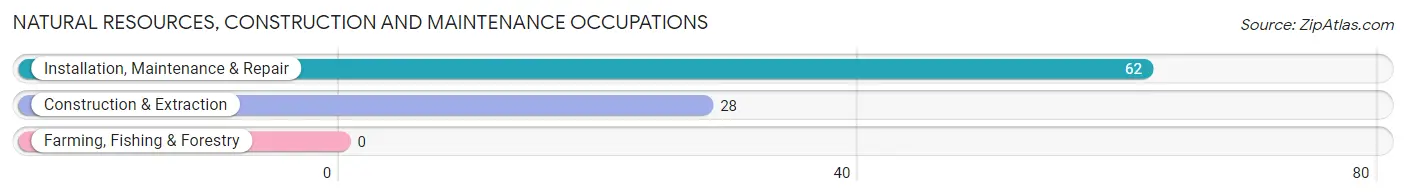
Natural Resources, Construction and Maintenance Occupations by Sex
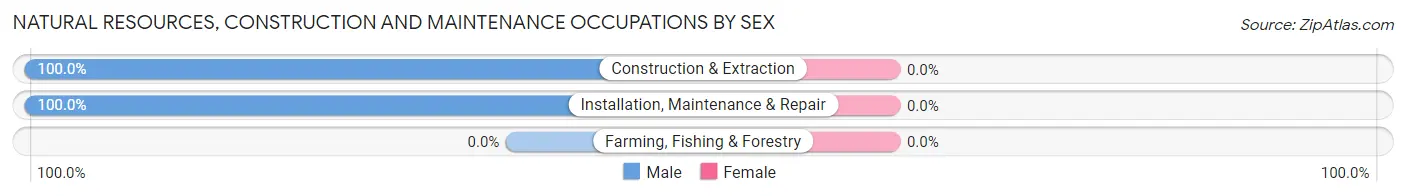
| Occupation | Male | Female |
| Farming, Fishing & Forestry | 0 (0.0%) | 0 (0.0%) |
| Construction & Extraction | 28 (100.0%) | 0 (0.0%) |
| Installation, Maintenance & Repair | 62 (100.0%) | 0 (0.0%) |
| Total (Category) | 90 (100.0%) | 0 (0.0%) |
| Total (Overall) | 648 (45.4%) | 780 (54.6%) |
Production, Transportation and Moving Occupations
The most common Production, Transportation and Moving occupations in Osseo are Material Moving (92 | 6.4%), Production (70 | 4.9%), and Transportation (55 | 3.8%).
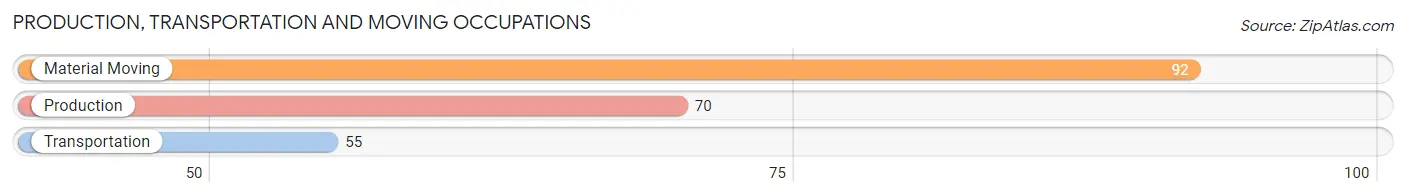
Production, Transportation and Moving Occupations by Sex
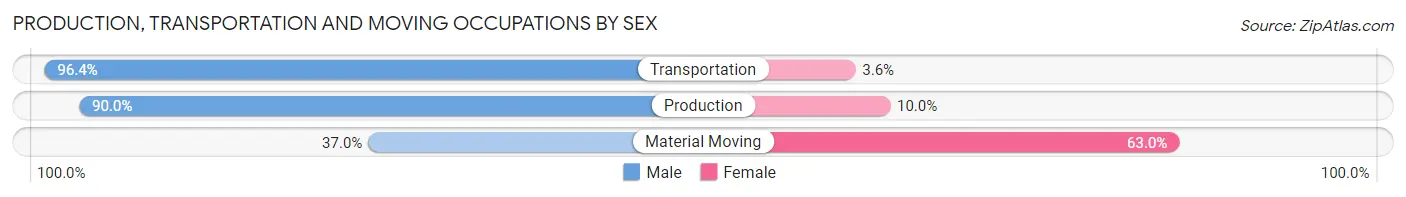
| Occupation | Male | Female |
| Production | 63 (90.0%) | 7 (10.0%) |
| Transportation | 53 (96.4%) | 2 (3.6%) |
| Material Moving | 34 (37.0%) | 58 (63.0%) |
| Total (Category) | 150 (69.1%) | 67 (30.9%) |
| Total (Overall) | 648 (45.4%) | 780 (54.6%) |
Employment Industries by Sex in Osseo
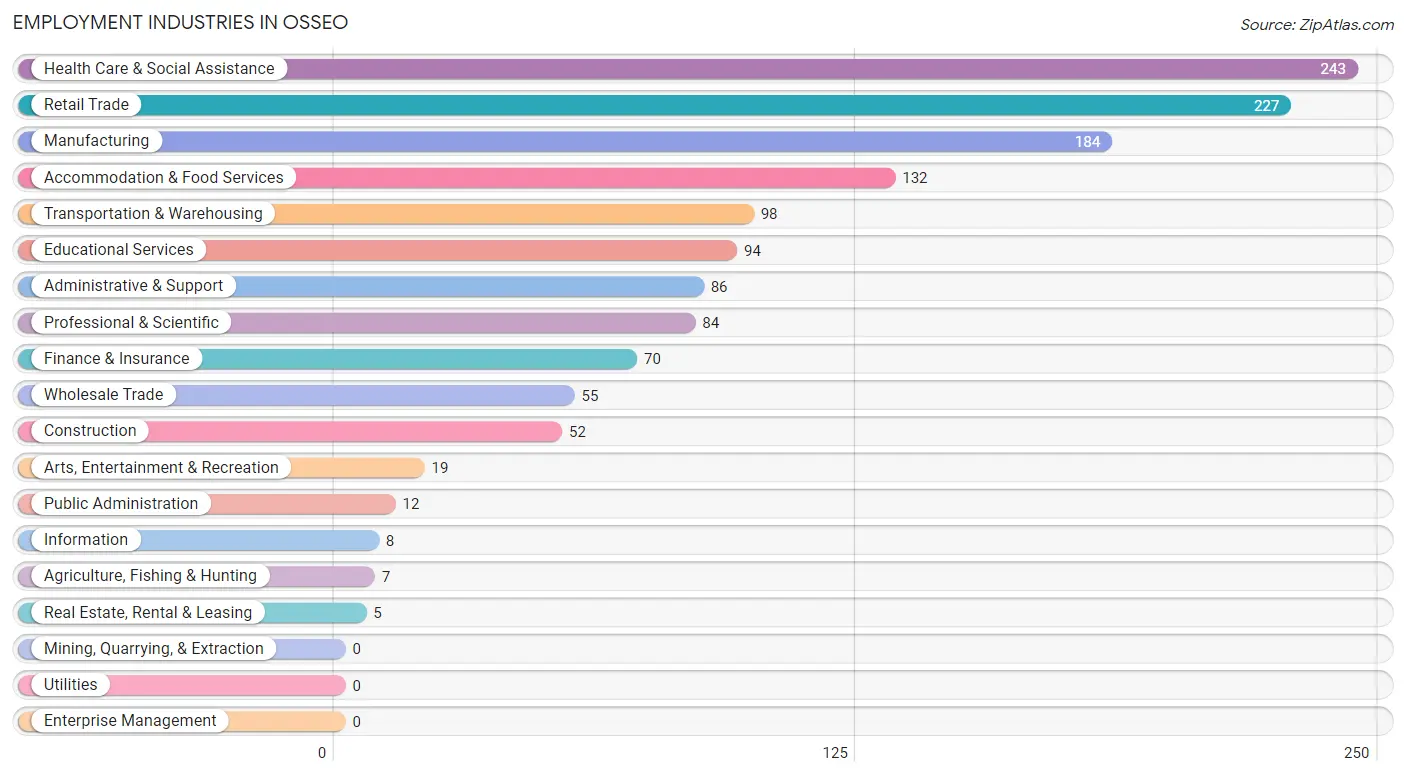
Employment Industries in Osseo
The major employment industries in Osseo include Health Care & Social Assistance (243 | 17.0%), Retail Trade (227 | 15.9%), Manufacturing (184 | 12.9%), Accommodation & Food Services (132 | 9.2%), and Transportation & Warehousing (98 | 6.9%).
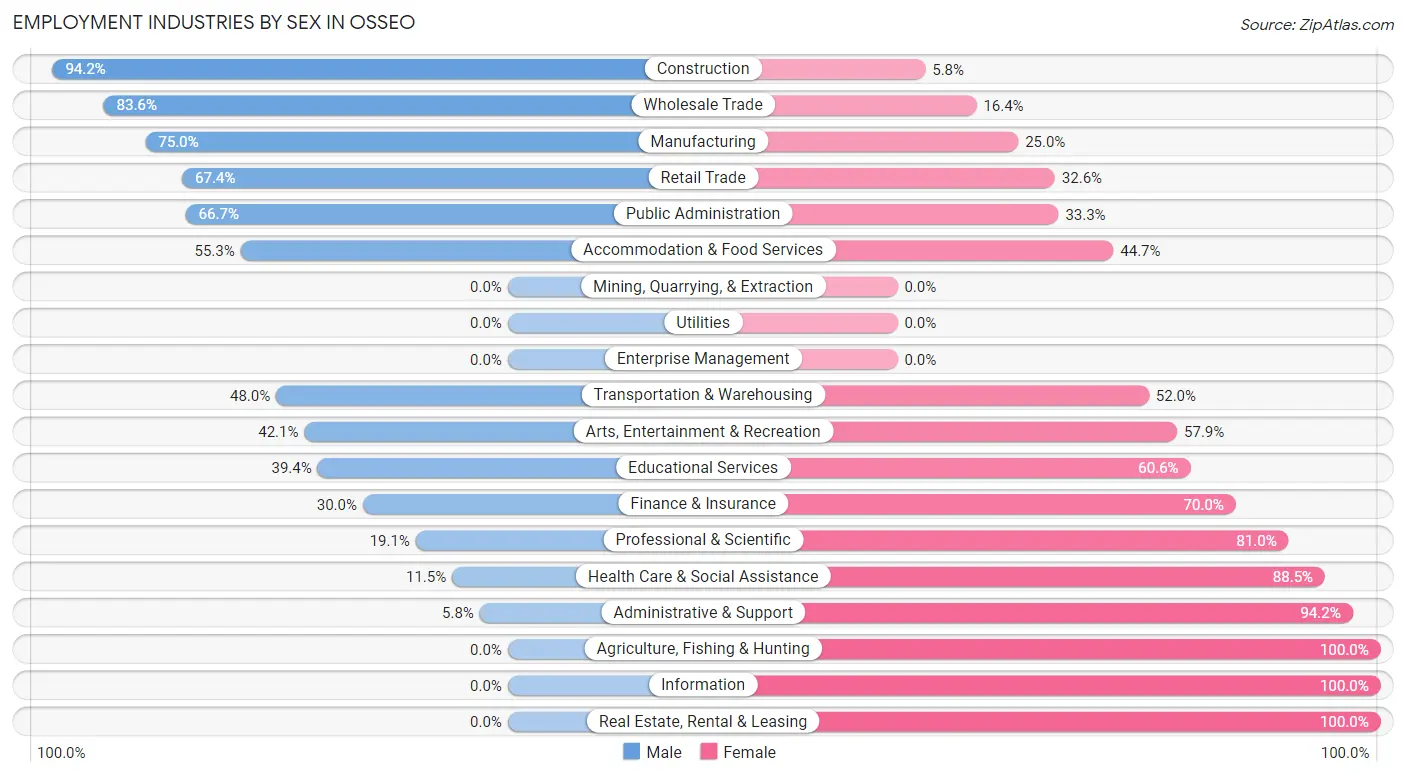
Employment Industries by Sex in Osseo
The Osseo industries that see more men than women are Construction (94.2%), Wholesale Trade (83.6%), and Manufacturing (75.0%), whereas the industries that tend to have a higher number of women are Agriculture, Fishing & Hunting (100.0%), Information (100.0%), and Real Estate, Rental & Leasing (100.0%).
| Industry | Male | Female |
| Agriculture, Fishing & Hunting | 0 (0.0%) | 7 (100.0%) |
| Mining, Quarrying, & Extraction | 0 (0.0%) | 0 (0.0%) |
| Construction | 49 (94.2%) | 3 (5.8%) |
| Manufacturing | 138 (75.0%) | 46 (25.0%) |
| Wholesale Trade | 46 (83.6%) | 9 (16.4%) |
| Retail Trade | 153 (67.4%) | 74 (32.6%) |
| Transportation & Warehousing | 47 (48.0%) | 51 (52.0%) |
| Utilities | 0 (0.0%) | 0 (0.0%) |
| Information | 0 (0.0%) | 8 (100.0%) |
| Finance & Insurance | 21 (30.0%) | 49 (70.0%) |
| Real Estate, Rental & Leasing | 0 (0.0%) | 5 (100.0%) |
| Professional & Scientific | 16 (19.1%) | 68 (80.9%) |
| Enterprise Management | 0 (0.0%) | 0 (0.0%) |
| Administrative & Support | 5 (5.8%) | 81 (94.2%) |
| Educational Services | 37 (39.4%) | 57 (60.6%) |
| Health Care & Social Assistance | 28 (11.5%) | 215 (88.5%) |
| Arts, Entertainment & Recreation | 8 (42.1%) | 11 (57.9%) |
| Accommodation & Food Services | 73 (55.3%) | 59 (44.7%) |
| Public Administration | 8 (66.7%) | 4 (33.3%) |
| Total | 648 (45.4%) | 780 (54.6%) |
Education in Osseo
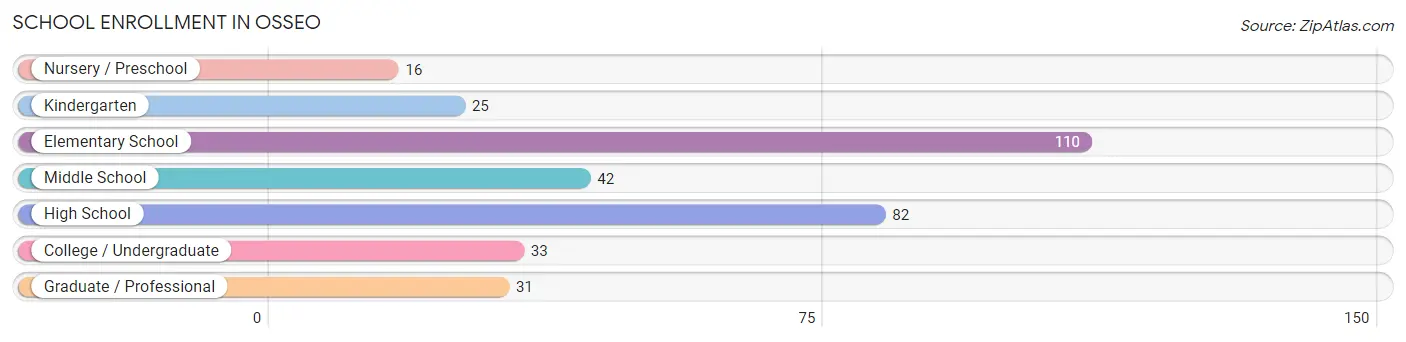
School Enrollment in Osseo
The most common levels of schooling among the 339 students in Osseo are elementary school (110 | 32.5%), high school (82 | 24.2%), and middle school (42 | 12.4%).
| School Level | # Students | % Students |
| Nursery / Preschool | 16 | 4.7% |
| Kindergarten | 25 | 7.4% |
| Elementary School | 110 | 32.5% |
| Middle School | 42 | 12.4% |
| High School | 82 | 24.2% |
| College / Undergraduate | 33 | 9.7% |
| Graduate / Professional | 31 | 9.1% |
| Total | 339 | 100.0% |
School Enrollment by Age by Funding Source in Osseo
Out of a total of 339 students who are enrolled in schools in Osseo, 49 (14.5%) attend a private institution, while the remaining 290 (85.5%) are enrolled in public schools. The age group of 25 to 34 year olds has the highest likelihood of being enrolled in private schools, with 24 (85.7% in the age bracket) enrolled. Conversely, the age group of 5 to 9 year old has the lowest likelihood of being enrolled in a private school, with 121 (100.0% in the age bracket) attending a public institution.
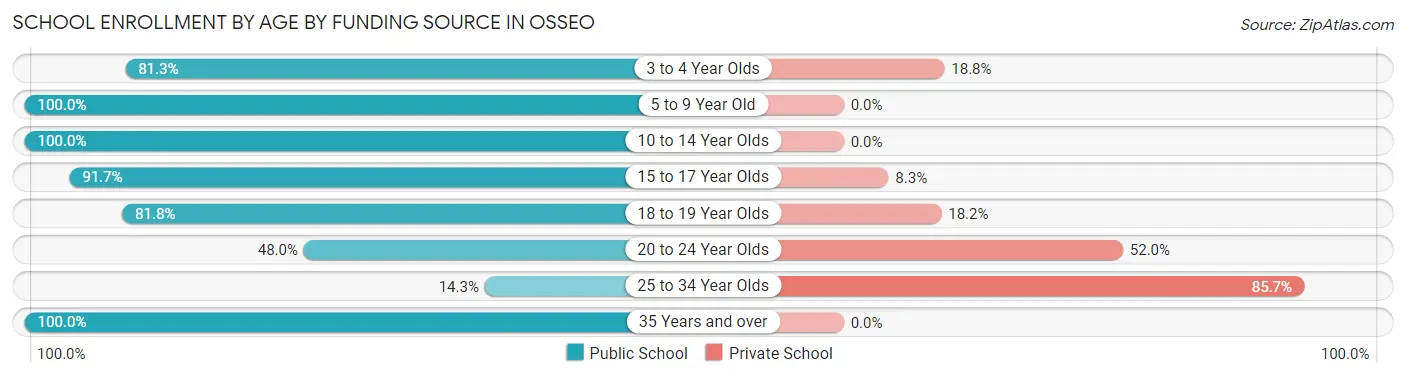
| Age Bracket | Public School | Private School |
| 3 to 4 Year Olds | 13 (81.2%) | 3 (18.8%) |
| 5 to 9 Year Old | 121 (100.0%) | 0 (0.0%) |
| 10 to 14 Year Olds | 56 (100.0%) | 0 (0.0%) |
| 15 to 17 Year Olds | 55 (91.7%) | 5 (8.3%) |
| 18 to 19 Year Olds | 18 (81.8%) | 4 (18.2%) |
| 20 to 24 Year Olds | 12 (48.0%) | 13 (52.0%) |
| 25 to 34 Year Olds | 4 (14.3%) | 24 (85.7%) |
| 35 Years and over | 11 (100.0%) | 0 (0.0%) |
| Total | 290 (85.5%) | 49 (14.5%) |
Educational Attainment by Field of Study in Osseo
Education (114 | 22.7%), business (81 | 16.1%), engineering (64 | 12.7%), science & technology (52 | 10.3%), and visual & performing arts (38 | 7.5%) are the most common fields of study among 503 individuals in Osseo who have obtained a bachelor's degree or higher.
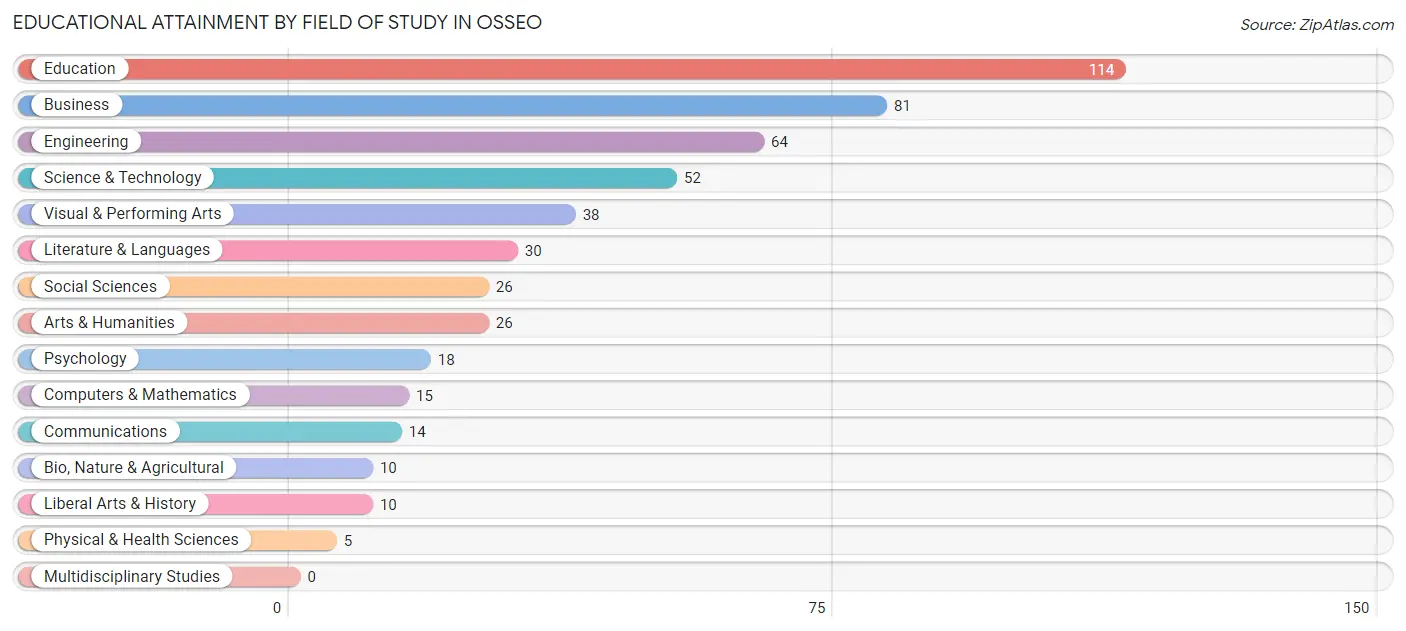
| Field of Study | # Graduates | % Graduates |
| Computers & Mathematics | 15 | 3.0% |
| Bio, Nature & Agricultural | 10 | 2.0% |
| Physical & Health Sciences | 5 | 1.0% |
| Psychology | 18 | 3.6% |
| Social Sciences | 26 | 5.2% |
| Engineering | 64 | 12.7% |
| Multidisciplinary Studies | 0 | 0.0% |
| Science & Technology | 52 | 10.3% |
| Business | 81 | 16.1% |
| Education | 114 | 22.7% |
| Literature & Languages | 30 | 6.0% |
| Liberal Arts & History | 10 | 2.0% |
| Visual & Performing Arts | 38 | 7.5% |
| Communications | 14 | 2.8% |
| Arts & Humanities | 26 | 5.2% |
| Total | 503 | 100.0% |
Transportation & Commute in Osseo
Vehicle Availability by Sex in Osseo
The most prevalent vehicle ownership categories in Osseo are males with 3 vehicles (258, accounting for 39.6%) and females with 3 vehicles (278, making up 33.6%).
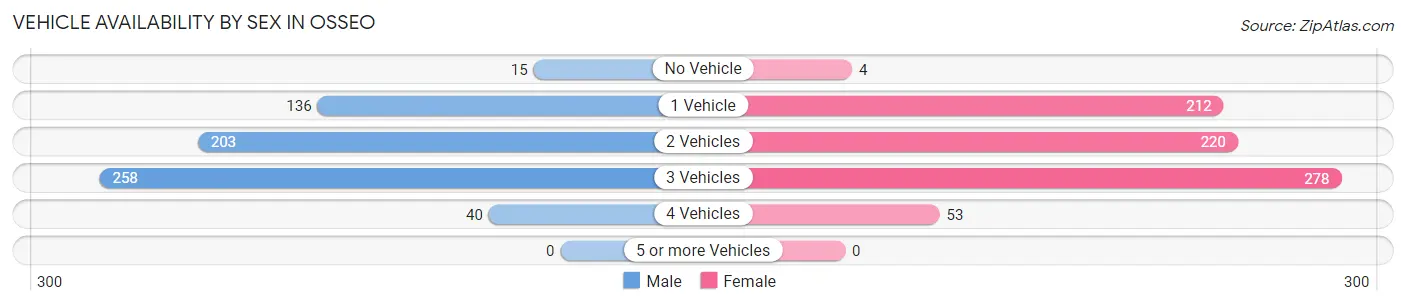
| Vehicles Available | Male | Female |
| No Vehicle | 15 (2.3%) | 4 (0.5%) |
| 1 Vehicle | 136 (20.9%) | 212 (27.6%) |
| 2 Vehicles | 203 (31.1%) | 220 (28.7%) |
| 3 Vehicles | 258 (39.6%) | 278 (36.2%) |
| 4 Vehicles | 40 (6.1%) | 53 (6.9%) |
| 5 or more Vehicles | 0 (0.0%) | 0 (0.0%) |
| Total | 652 (100.0%) | 767 (100.0%) |
Commute Time in Osseo
The most frequently occuring commute durations in Osseo are 10 to 14 minutes (295 commuters, 23.0%), 30 to 34 minutes (198 commuters, 15.4%), and 5 to 9 minutes (193 commuters, 15.0%).
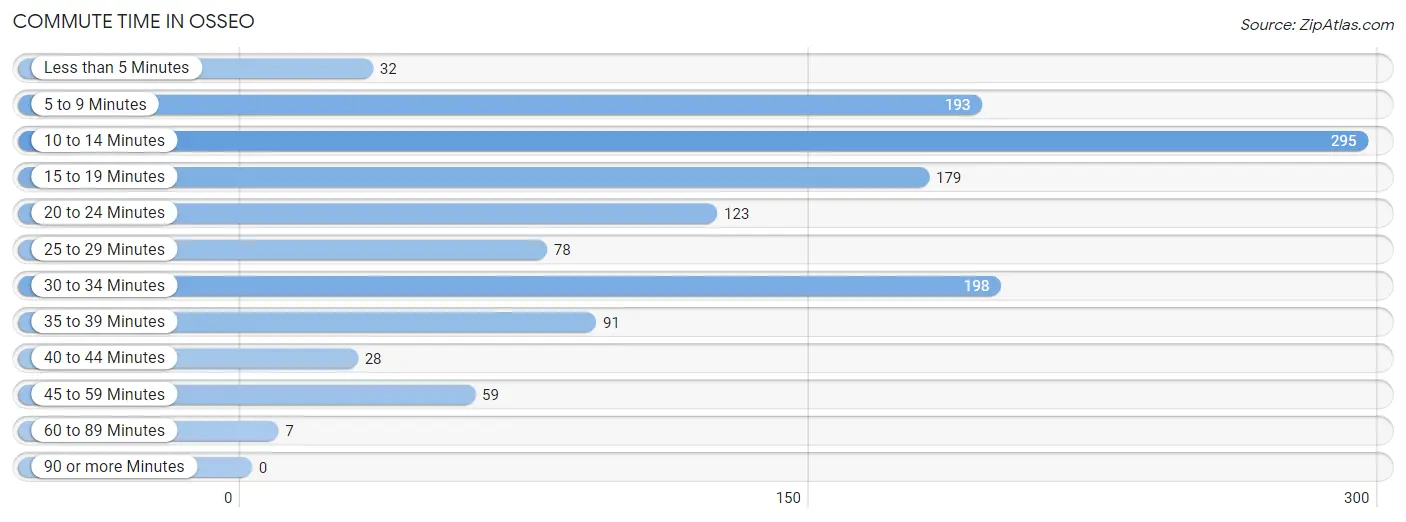
| Commute Time | # Commuters | % Commuters |
| Less than 5 Minutes | 32 | 2.5% |
| 5 to 9 Minutes | 193 | 15.0% |
| 10 to 14 Minutes | 295 | 23.0% |
| 15 to 19 Minutes | 179 | 14.0% |
| 20 to 24 Minutes | 123 | 9.6% |
| 25 to 29 Minutes | 78 | 6.1% |
| 30 to 34 Minutes | 198 | 15.4% |
| 35 to 39 Minutes | 91 | 7.1% |
| 40 to 44 Minutes | 28 | 2.2% |
| 45 to 59 Minutes | 59 | 4.6% |
| 60 to 89 Minutes | 7 | 0.5% |
| 90 or more Minutes | 0 | 0.0% |
Commute Time by Sex in Osseo
The most common commute times in Osseo are 10 to 14 minutes (195 commuters, 32.0%) for males and 30 to 34 minutes (131 commuters, 19.5%) for females.
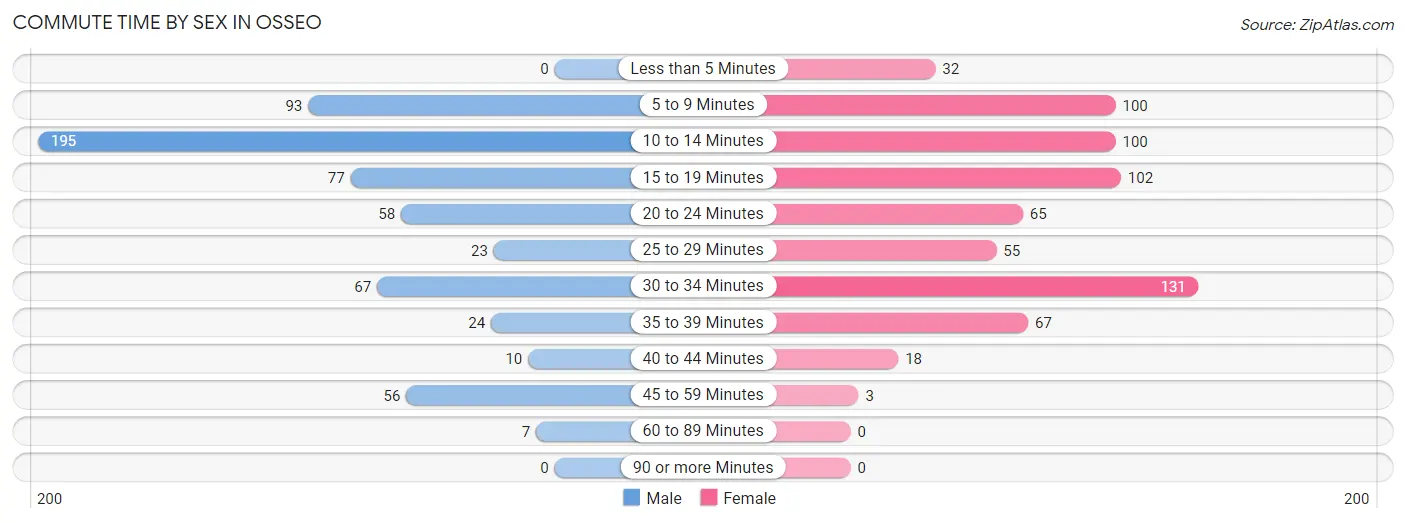
| Commute Time | Male | Female |
| Less than 5 Minutes | 0 (0.0%) | 32 (4.8%) |
| 5 to 9 Minutes | 93 (15.2%) | 100 (14.9%) |
| 10 to 14 Minutes | 195 (32.0%) | 100 (14.9%) |
| 15 to 19 Minutes | 77 (12.6%) | 102 (15.2%) |
| 20 to 24 Minutes | 58 (9.5%) | 65 (9.7%) |
| 25 to 29 Minutes | 23 (3.8%) | 55 (8.2%) |
| 30 to 34 Minutes | 67 (11.0%) | 131 (19.5%) |
| 35 to 39 Minutes | 24 (3.9%) | 67 (10.0%) |
| 40 to 44 Minutes | 10 (1.6%) | 18 (2.7%) |
| 45 to 59 Minutes | 56 (9.2%) | 3 (0.4%) |
| 60 to 89 Minutes | 7 (1.1%) | 0 (0.0%) |
| 90 or more Minutes | 0 (0.0%) | 0 (0.0%) |
Time of Departure to Work by Sex in Osseo
The most frequent times of departure to work in Osseo are 12:00 PM to 3:59 PM (93, 15.2%) for males and 7:00 AM to 7:29 AM (148, 22.0%) for females.
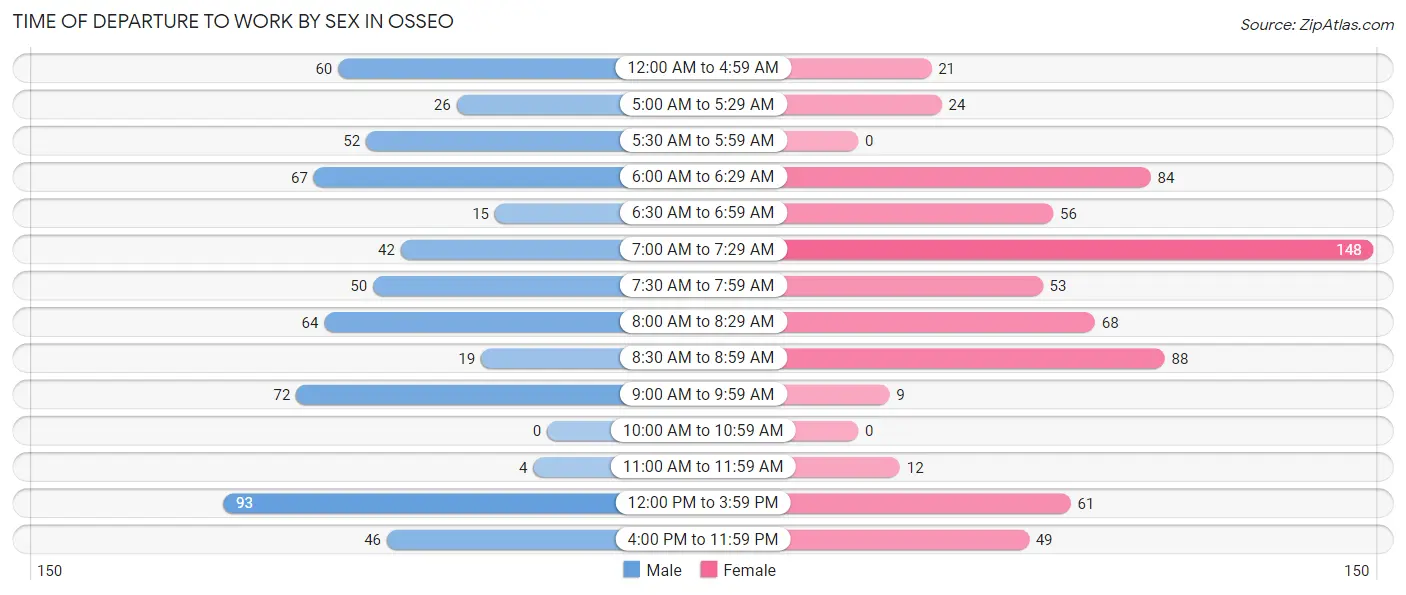
| Time of Departure | Male | Female |
| 12:00 AM to 4:59 AM | 60 (9.8%) | 21 (3.1%) |
| 5:00 AM to 5:29 AM | 26 (4.3%) | 24 (3.6%) |
| 5:30 AM to 5:59 AM | 52 (8.5%) | 0 (0.0%) |
| 6:00 AM to 6:29 AM | 67 (11.0%) | 84 (12.5%) |
| 6:30 AM to 6:59 AM | 15 (2.5%) | 56 (8.3%) |
| 7:00 AM to 7:29 AM | 42 (6.9%) | 148 (22.0%) |
| 7:30 AM to 7:59 AM | 50 (8.2%) | 53 (7.9%) |
| 8:00 AM to 8:29 AM | 64 (10.5%) | 68 (10.1%) |
| 8:30 AM to 8:59 AM | 19 (3.1%) | 88 (13.1%) |
| 9:00 AM to 9:59 AM | 72 (11.8%) | 9 (1.3%) |
| 10:00 AM to 10:59 AM | 0 (0.0%) | 0 (0.0%) |
| 11:00 AM to 11:59 AM | 4 (0.7%) | 12 (1.8%) |
| 12:00 PM to 3:59 PM | 93 (15.2%) | 61 (9.1%) |
| 4:00 PM to 11:59 PM | 46 (7.5%) | 49 (7.3%) |
| Total | 610 (100.0%) | 673 (100.0%) |
Housing Occupancy in Osseo
Occupancy by Ownership in Osseo
Of the total 1,184 dwellings in Osseo, owner-occupied units account for 568 (48.0%), while renter-occupied units make up 616 (52.0%).
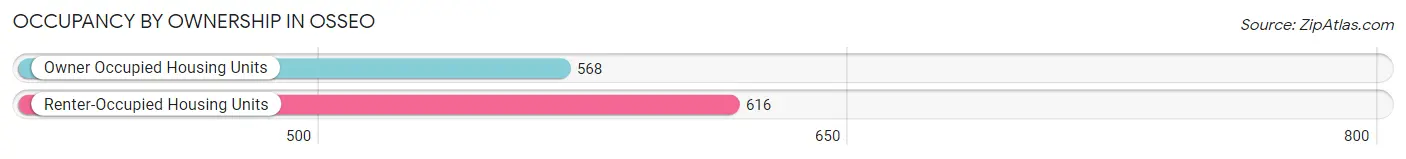
| Occupancy | # Housing Units | % Housing Units |
| Owner Occupied Housing Units | 568 | 48.0% |
| Renter-Occupied Housing Units | 616 | 52.0% |
| Total Occupied Housing Units | 1,184 | 100.0% |
Occupancy by Household Size in Osseo
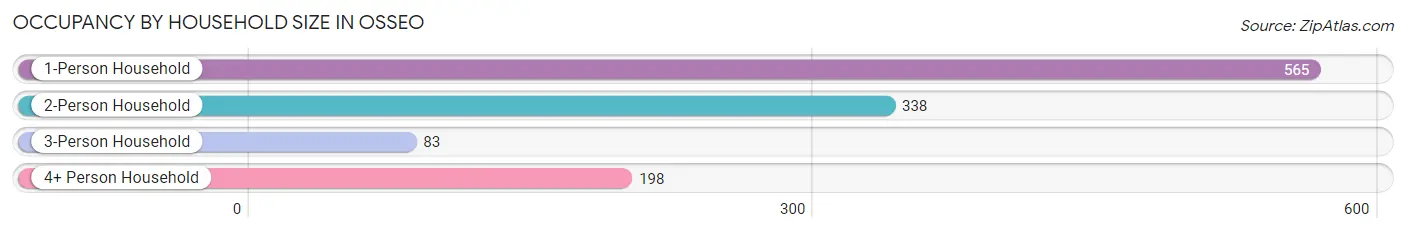
| Household Size | # Housing Units | % Housing Units |
| 1-Person Household | 565 | 47.7% |
| 2-Person Household | 338 | 28.5% |
| 3-Person Household | 83 | 7.0% |
| 4+ Person Household | 198 | 16.7% |
| Total Housing Units | 1,184 | 100.0% |
Occupancy by Ownership by Household Size in Osseo
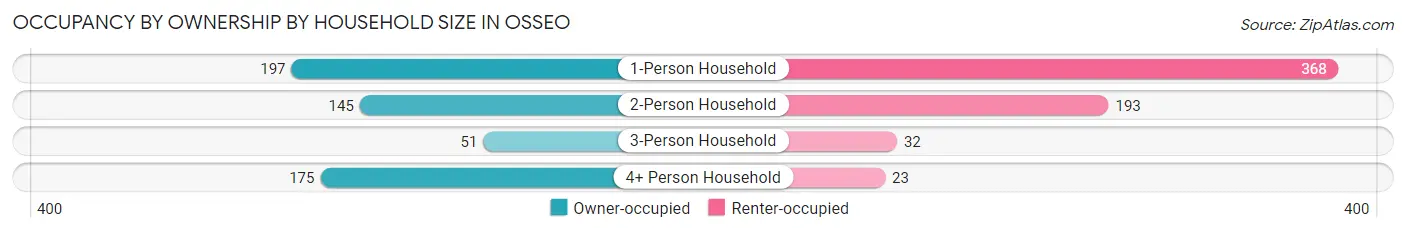
| Household Size | Owner-occupied | Renter-occupied |
| 1-Person Household | 197 (34.9%) | 368 (65.1%) |
| 2-Person Household | 145 (42.9%) | 193 (57.1%) |
| 3-Person Household | 51 (61.5%) | 32 (38.6%) |
| 4+ Person Household | 175 (88.4%) | 23 (11.6%) |
| Total Housing Units | 568 (48.0%) | 616 (52.0%) |
Occupancy by Educational Attainment in Osseo
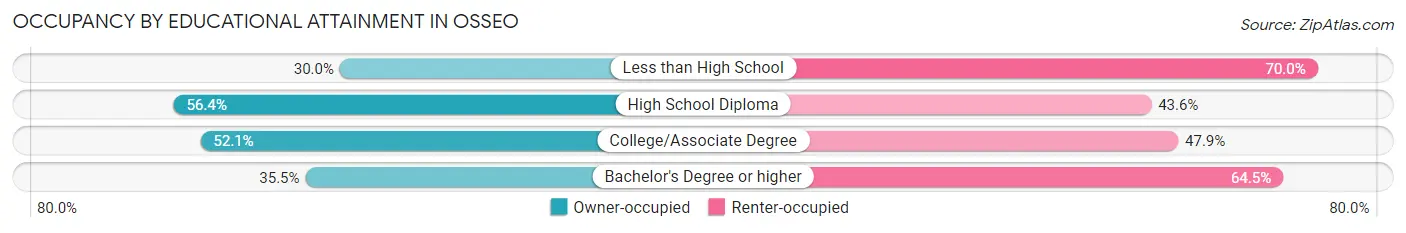
| Household Size | Owner-occupied | Renter-occupied |
| Less than High School | 6 (30.0%) | 14 (70.0%) |
| High School Diploma | 168 (56.4%) | 130 (43.6%) |
| College/Associate Degree | 272 (52.1%) | 250 (47.9%) |
| Bachelor's Degree or higher | 122 (35.5%) | 222 (64.5%) |
Occupancy by Age of Householder in Osseo
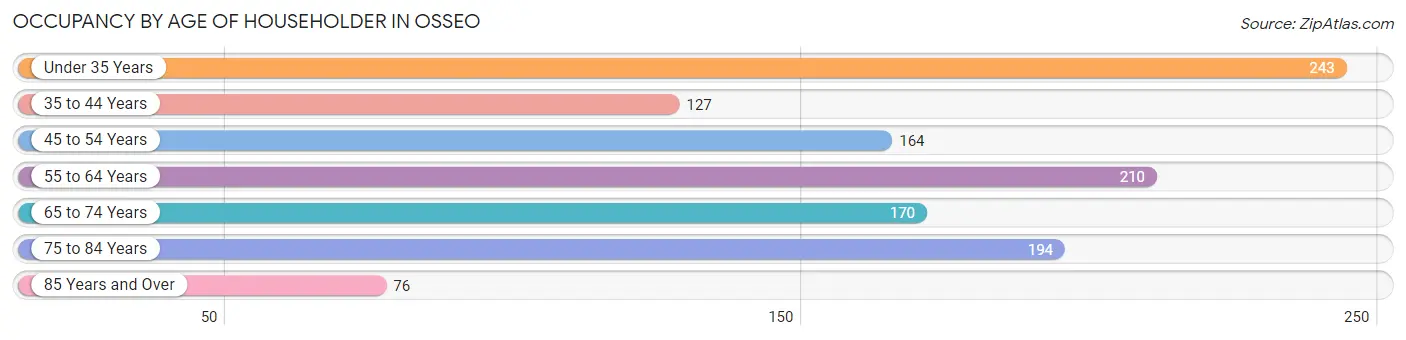
| Age Bracket | # Households | % Households |
| Under 35 Years | 243 | 20.5% |
| 35 to 44 Years | 127 | 10.7% |
| 45 to 54 Years | 164 | 13.9% |
| 55 to 64 Years | 210 | 17.7% |
| 65 to 74 Years | 170 | 14.4% |
| 75 to 84 Years | 194 | 16.4% |
| 85 Years and Over | 76 | 6.4% |
| Total | 1,184 | 100.0% |
Housing Finances in Osseo
Median Income by Occupancy in Osseo
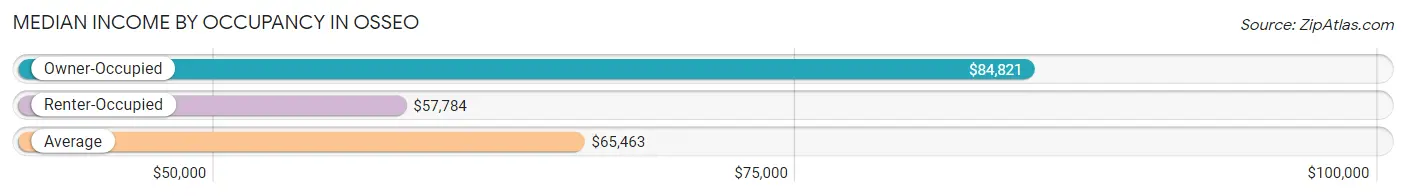
| Occupancy Type | # Households | Median Income |
| Owner-Occupied | 568 (48.0%) | $84,821 |
| Renter-Occupied | 616 (52.0%) | $57,784 |
| Average | 1,184 (100.0%) | $65,463 |
Occupancy by Householder Income Bracket in Osseo
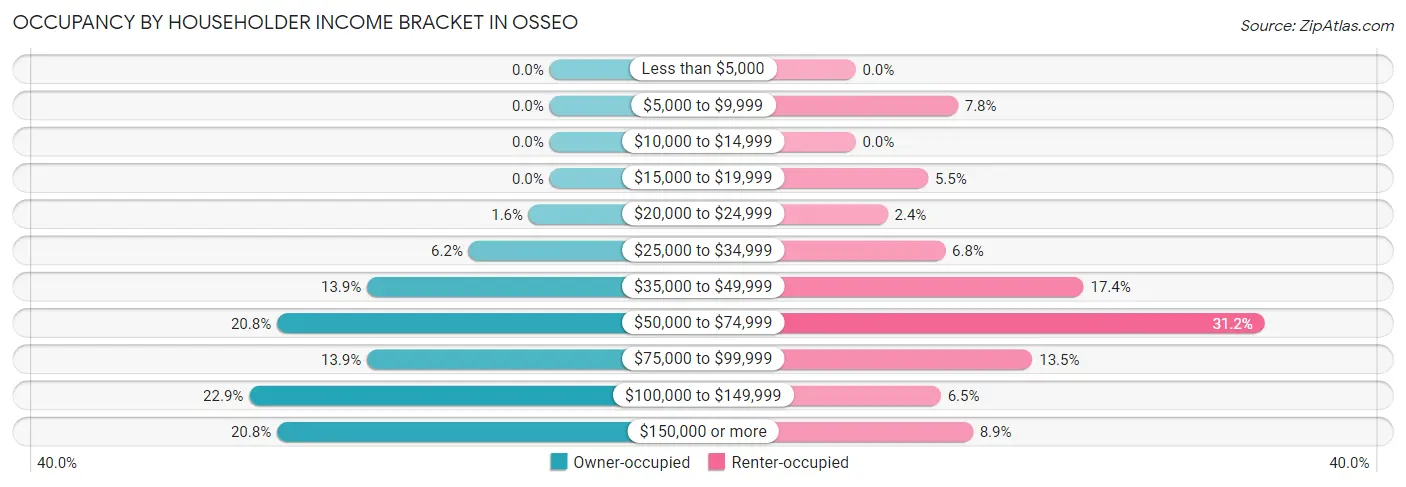
| Income Bracket | Owner-occupied | Renter-occupied |
| Less than $5,000 | 0 (0.0%) | 0 (0.0%) |
| $5,000 to $9,999 | 0 (0.0%) | 48 (7.8%) |
| $10,000 to $14,999 | 0 (0.0%) | 0 (0.0%) |
| $15,000 to $19,999 | 0 (0.0%) | 34 (5.5%) |
| $20,000 to $24,999 | 9 (1.6%) | 15 (2.4%) |
| $25,000 to $34,999 | 35 (6.2%) | 42 (6.8%) |
| $35,000 to $49,999 | 79 (13.9%) | 107 (17.4%) |
| $50,000 to $74,999 | 118 (20.8%) | 192 (31.2%) |
| $75,000 to $99,999 | 79 (13.9%) | 83 (13.5%) |
| $100,000 to $149,999 | 130 (22.9%) | 40 (6.5%) |
| $150,000 or more | 118 (20.8%) | 55 (8.9%) |
| Total | 568 (100.0%) | 616 (100.0%) |
Monthly Housing Cost Tiers in Osseo
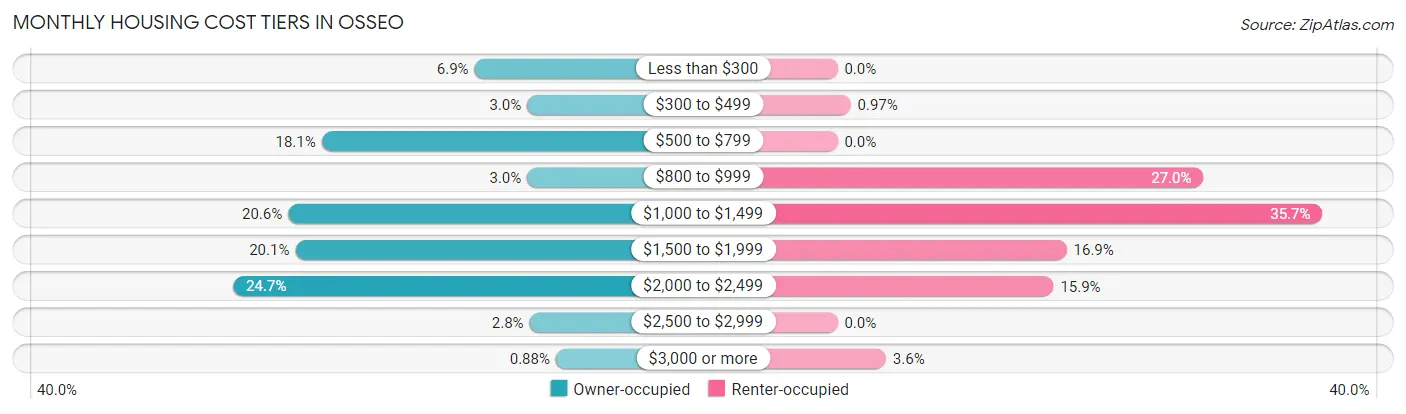
| Monthly Cost | Owner-occupied | Renter-occupied |
| Less than $300 | 39 (6.9%) | 0 (0.0%) |
| $300 to $499 | 17 (3.0%) | 6 (1.0%) |
| $500 to $799 | 103 (18.1%) | 0 (0.0%) |
| $800 to $999 | 17 (3.0%) | 166 (27.0%) |
| $1,000 to $1,499 | 117 (20.6%) | 220 (35.7%) |
| $1,500 to $1,999 | 114 (20.1%) | 104 (16.9%) |
| $2,000 to $2,499 | 140 (24.6%) | 98 (15.9%) |
| $2,500 to $2,999 | 16 (2.8%) | 0 (0.0%) |
| $3,000 or more | 5 (0.9%) | 22 (3.6%) |
| Total | 568 (100.0%) | 616 (100.0%) |
Physical Housing Characteristics in Osseo
Housing Structures in Osseo
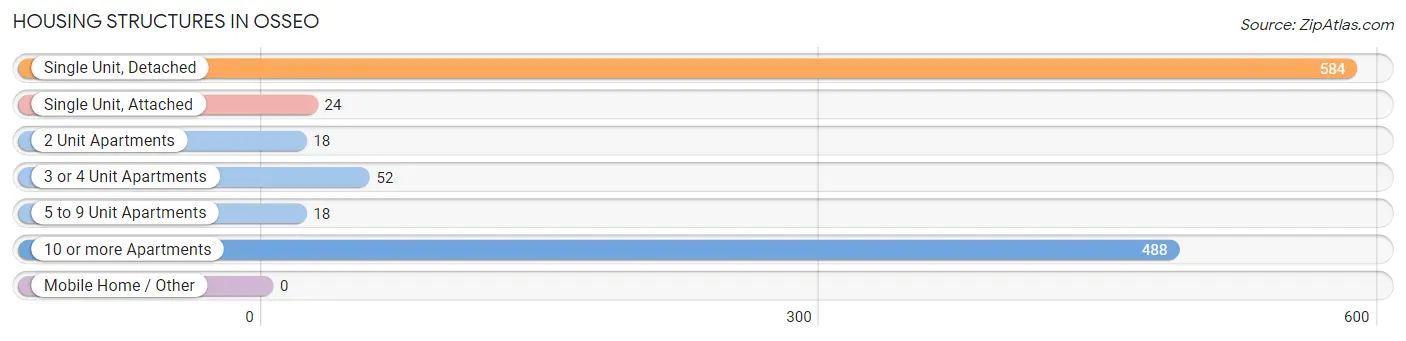
| Structure Type | # Housing Units | % Housing Units |
| Single Unit, Detached | 584 | 49.3% |
| Single Unit, Attached | 24 | 2.0% |
| 2 Unit Apartments | 18 | 1.5% |
| 3 or 4 Unit Apartments | 52 | 4.4% |
| 5 to 9 Unit Apartments | 18 | 1.5% |
| 10 or more Apartments | 488 | 41.2% |
| Mobile Home / Other | 0 | 0.0% |
| Total | 1,184 | 100.0% |
Housing Structures by Occupancy in Osseo
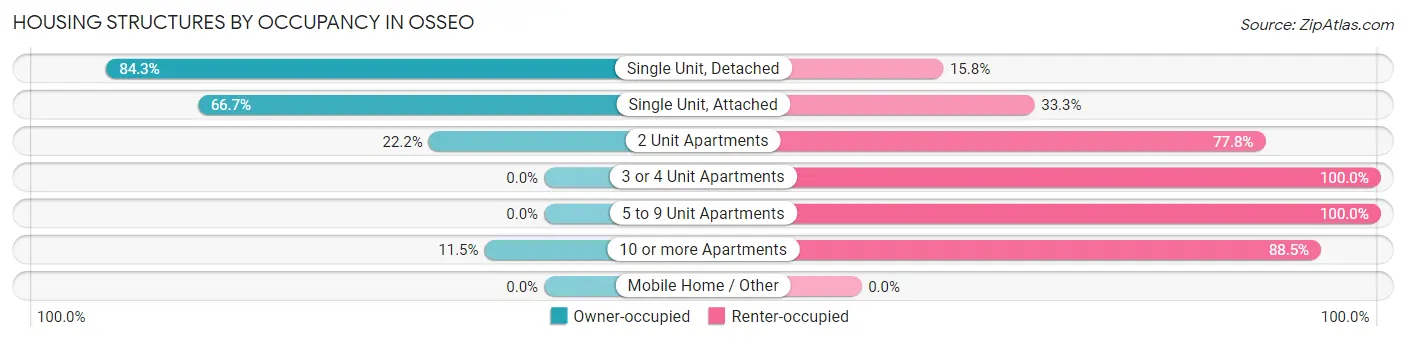
| Structure Type | Owner-occupied | Renter-occupied |
| Single Unit, Detached | 492 (84.3%) | 92 (15.8%) |
| Single Unit, Attached | 16 (66.7%) | 8 (33.3%) |
| 2 Unit Apartments | 4 (22.2%) | 14 (77.8%) |
| 3 or 4 Unit Apartments | 0 (0.0%) | 52 (100.0%) |
| 5 to 9 Unit Apartments | 0 (0.0%) | 18 (100.0%) |
| 10 or more Apartments | 56 (11.5%) | 432 (88.5%) |
| Mobile Home / Other | 0 (0.0%) | 0 (0.0%) |
| Total | 568 (48.0%) | 616 (52.0%) |
Housing Structures by Number of Rooms in Osseo
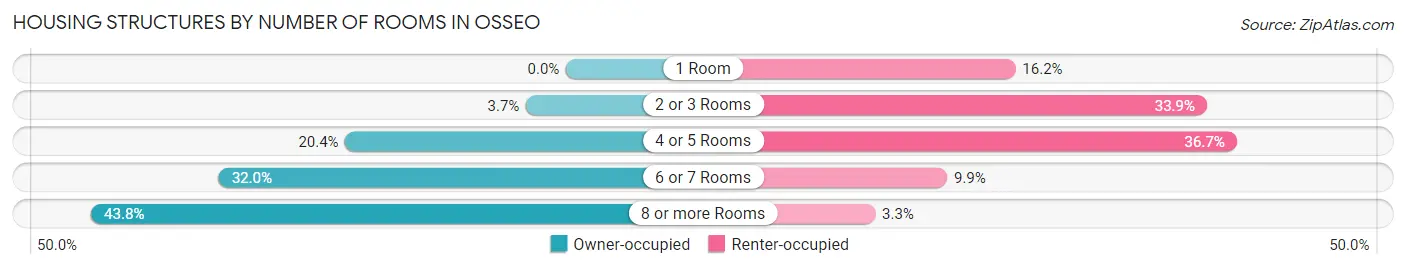
| Number of Rooms | Owner-occupied | Renter-occupied |
| 1 Room | 0 (0.0%) | 100 (16.2%) |
| 2 or 3 Rooms | 21 (3.7%) | 209 (33.9%) |
| 4 or 5 Rooms | 116 (20.4%) | 226 (36.7%) |
| 6 or 7 Rooms | 182 (32.0%) | 61 (9.9%) |
| 8 or more Rooms | 249 (43.8%) | 20 (3.3%) |
| Total | 568 (100.0%) | 616 (100.0%) |
Housing Structure by Heating Type in Osseo
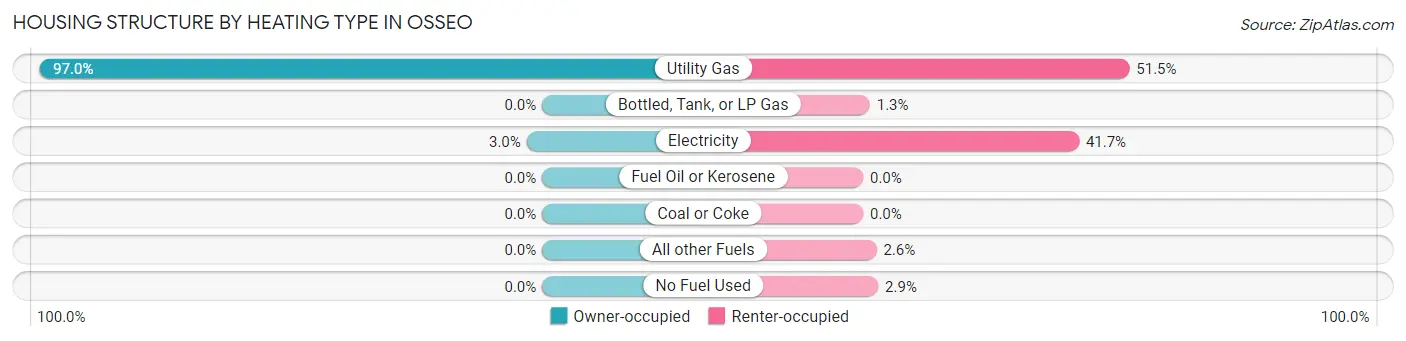
| Heating Type | Owner-occupied | Renter-occupied |
| Utility Gas | 551 (97.0%) | 317 (51.5%) |
| Bottled, Tank, or LP Gas | 0 (0.0%) | 8 (1.3%) |
| Electricity | 17 (3.0%) | 257 (41.7%) |
| Fuel Oil or Kerosene | 0 (0.0%) | 0 (0.0%) |
| Coal or Coke | 0 (0.0%) | 0 (0.0%) |
| All other Fuels | 0 (0.0%) | 16 (2.6%) |
| No Fuel Used | 0 (0.0%) | 18 (2.9%) |
| Total | 568 (100.0%) | 616 (100.0%) |
Household Vehicle Usage in Osseo
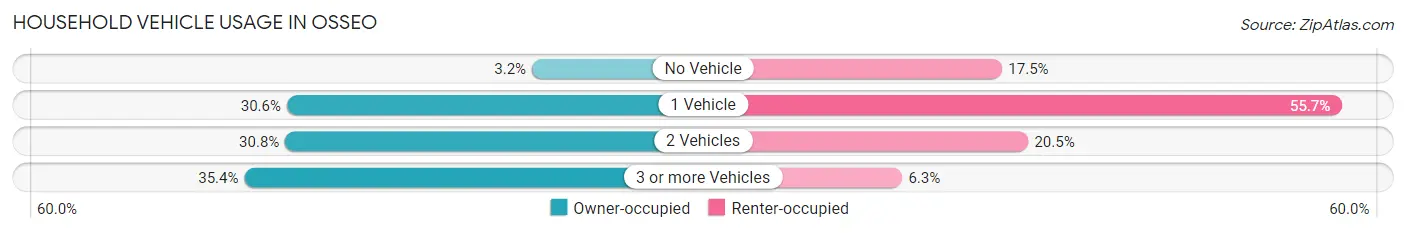
| Vehicles per Household | Owner-occupied | Renter-occupied |
| No Vehicle | 18 (3.2%) | 108 (17.5%) |
| 1 Vehicle | 174 (30.6%) | 343 (55.7%) |
| 2 Vehicles | 175 (30.8%) | 126 (20.4%) |
| 3 or more Vehicles | 201 (35.4%) | 39 (6.3%) |
| Total | 568 (100.0%) | 616 (100.0%) |
Real Estate & Mortgages in Osseo
Real Estate and Mortgage Overview in Osseo
| Characteristic | Without Mortgage | With Mortgage |
| Housing Units | 189 | 379 |
| Median Property Value | $208,800 | $272,300 |
| Median Household Income | $57,031 | $102 |
| Monthly Housing Costs | $586 | $5 |
| Real Estate Taxes | $2,406 | $0 |
Property Value by Mortgage Status in Osseo
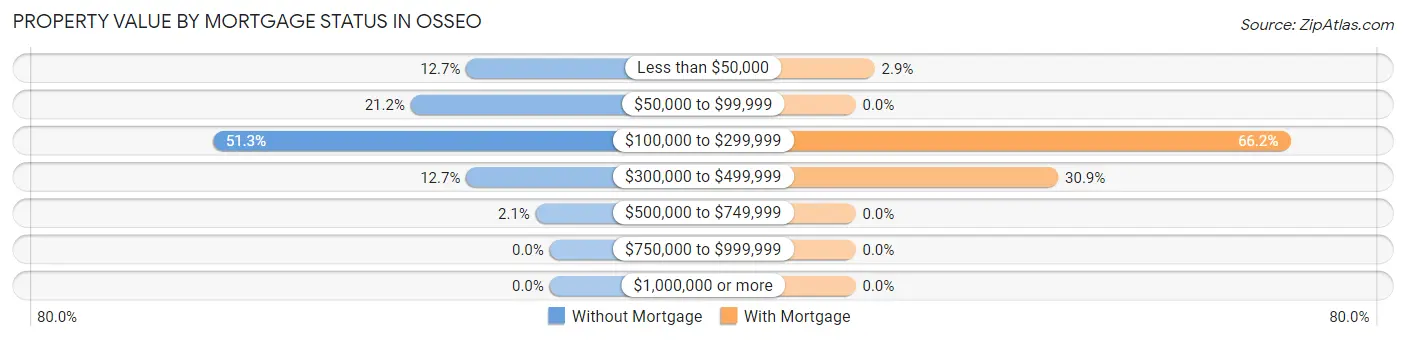
| Property Value | Without Mortgage | With Mortgage |
| Less than $50,000 | 24 (12.7%) | 11 (2.9%) |
| $50,000 to $99,999 | 40 (21.2%) | 0 (0.0%) |
| $100,000 to $299,999 | 97 (51.3%) | 251 (66.2%) |
| $300,000 to $499,999 | 24 (12.7%) | 117 (30.9%) |
| $500,000 to $749,999 | 4 (2.1%) | 0 (0.0%) |
| $750,000 to $999,999 | 0 (0.0%) | 0 (0.0%) |
| $1,000,000 or more | 0 (0.0%) | 0 (0.0%) |
| Total | 189 (100.0%) | 379 (100.0%) |
Household Income by Mortgage Status in Osseo
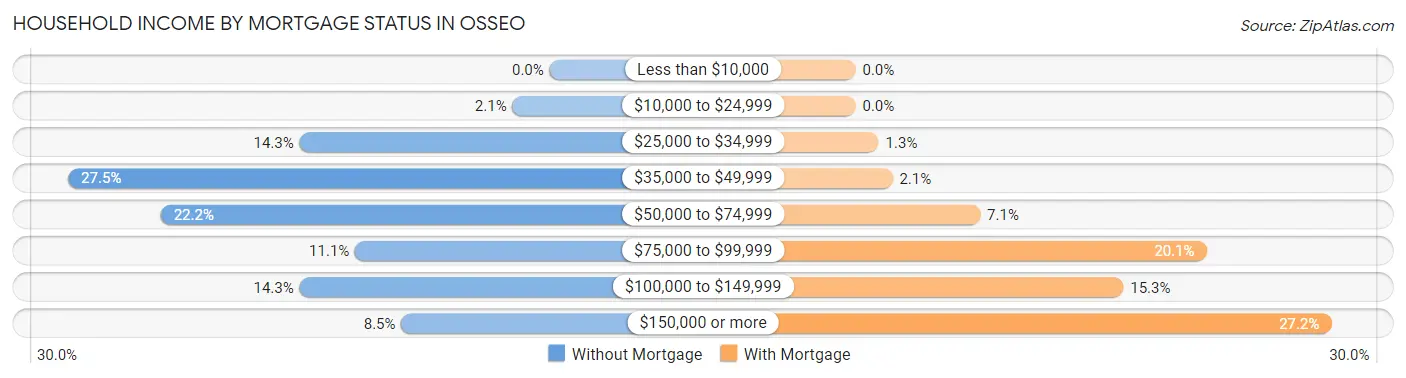
| Household Income | Without Mortgage | With Mortgage |
| Less than $10,000 | 0 (0.0%) | 0 (0.0%) |
| $10,000 to $24,999 | 4 (2.1%) | 0 (0.0%) |
| $25,000 to $34,999 | 27 (14.3%) | 5 (1.3%) |
| $35,000 to $49,999 | 52 (27.5%) | 8 (2.1%) |
| $50,000 to $74,999 | 42 (22.2%) | 27 (7.1%) |
| $75,000 to $99,999 | 21 (11.1%) | 76 (20.1%) |
| $100,000 to $149,999 | 27 (14.3%) | 58 (15.3%) |
| $150,000 or more | 16 (8.5%) | 103 (27.2%) |
| Total | 189 (100.0%) | 379 (100.0%) |
Property Value to Household Income Ratio in Osseo
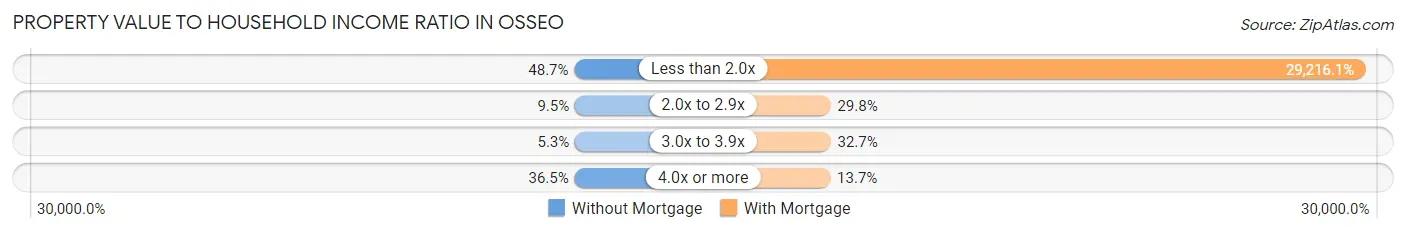
| Value-to-Income Ratio | Without Mortgage | With Mortgage |
| Less than 2.0x | 92 (48.7%) | 110,729 (29,216.1%) |
| 2.0x to 2.9x | 18 (9.5%) | 113 (29.8%) |
| 3.0x to 3.9x | 10 (5.3%) | 124 (32.7%) |
| 4.0x or more | 69 (36.5%) | 52 (13.7%) |
| Total | 189 (100.0%) | 379 (100.0%) |
Real Estate Taxes by Mortgage Status in Osseo
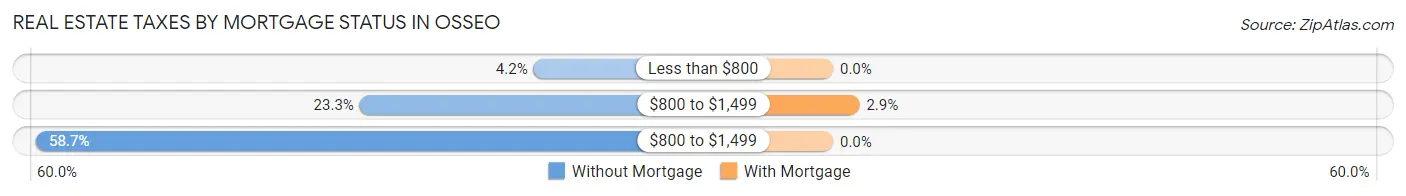
| Property Taxes | Without Mortgage | With Mortgage |
| Less than $800 | 8 (4.2%) | 0 (0.0%) |
| $800 to $1,499 | 44 (23.3%) | 11 (2.9%) |
| $800 to $1,499 | 111 (58.7%) | 0 (0.0%) |
| Total | 189 (100.0%) | 379 (100.0%) |
Health & Disability in Osseo
Health Insurance Coverage by Age in Osseo
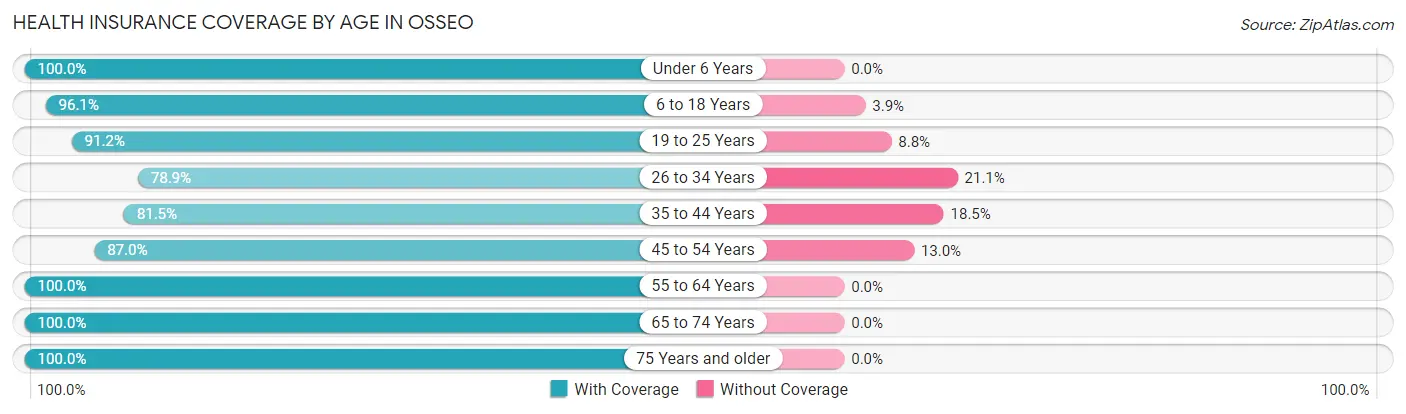
| Age Bracket | With Coverage | Without Coverage |
| Under 6 Years | 124 (100.0%) | 0 (0.0%) |
| 6 to 18 Years | 245 (96.1%) | 10 (3.9%) |
| 19 to 25 Years | 104 (91.2%) | 10 (8.8%) |
| 26 to 34 Years | 377 (78.9%) | 101 (21.1%) |
| 35 to 44 Years | 264 (81.5%) | 60 (18.5%) |
| 45 to 54 Years | 221 (87.0%) | 33 (13.0%) |
| 55 to 64 Years | 393 (100.0%) | 0 (0.0%) |
| 65 to 74 Years | 282 (100.0%) | 0 (0.0%) |
| 75 Years and older | 298 (100.0%) | 0 (0.0%) |
| Total | 2,308 (91.5%) | 214 (8.5%) |
Health Insurance Coverage by Citizenship Status in Osseo
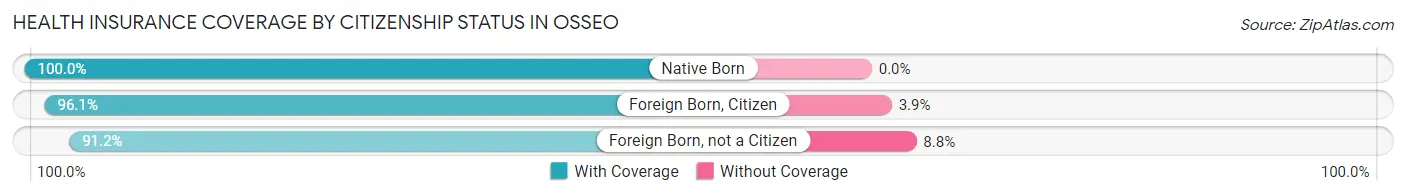
| Citizenship Status | With Coverage | Without Coverage |
| Native Born | 124 (100.0%) | 0 (0.0%) |
| Foreign Born, Citizen | 245 (96.1%) | 10 (3.9%) |
| Foreign Born, not a Citizen | 104 (91.2%) | 10 (8.8%) |
Health Insurance Coverage by Household Income in Osseo
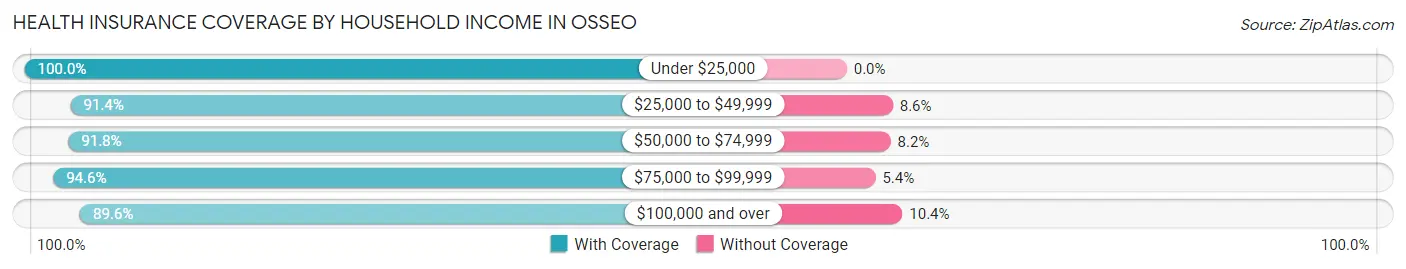
| Household Income | With Coverage | Without Coverage |
| Under $25,000 | 106 (100.0%) | 0 (0.0%) |
| $25,000 to $49,999 | 297 (91.4%) | 28 (8.6%) |
| $50,000 to $74,999 | 436 (91.8%) | 39 (8.2%) |
| $75,000 to $99,999 | 388 (94.6%) | 22 (5.4%) |
| $100,000 and over | 1,076 (89.6%) | 125 (10.4%) |
Public vs Private Health Insurance Coverage by Age in Osseo
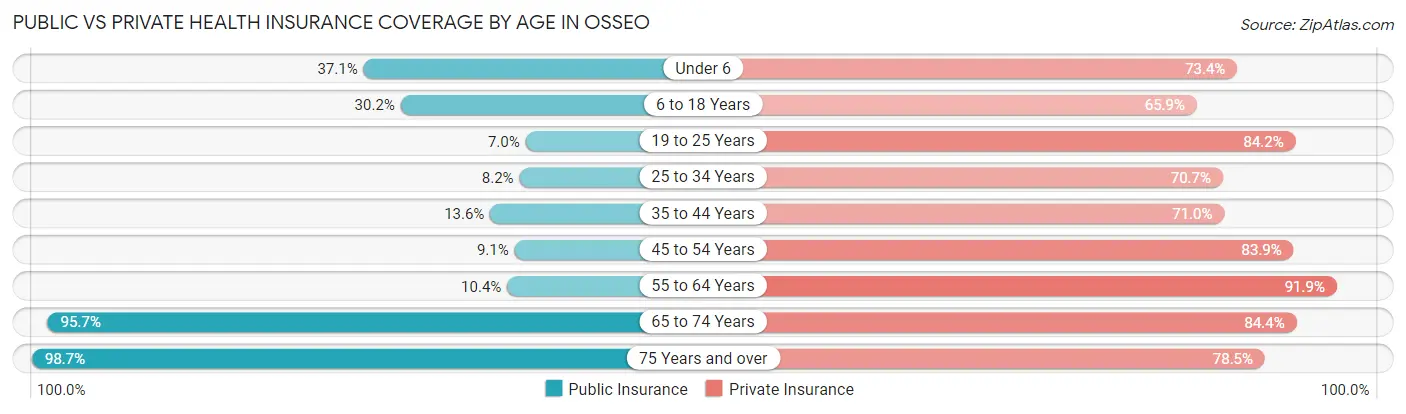
| Age Bracket | Public Insurance | Private Insurance |
| Under 6 | 46 (37.1%) | 91 (73.4%) |
| 6 to 18 Years | 77 (30.2%) | 168 (65.9%) |
| 19 to 25 Years | 8 (7.0%) | 96 (84.2%) |
| 25 to 34 Years | 39 (8.2%) | 338 (70.7%) |
| 35 to 44 Years | 44 (13.6%) | 230 (71.0%) |
| 45 to 54 Years | 23 (9.1%) | 213 (83.9%) |
| 55 to 64 Years | 41 (10.4%) | 361 (91.9%) |
| 65 to 74 Years | 270 (95.7%) | 238 (84.4%) |
| 75 Years and over | 294 (98.7%) | 234 (78.5%) |
| Total | 842 (33.4%) | 1,969 (78.1%) |
Disability Status by Sex by Age in Osseo
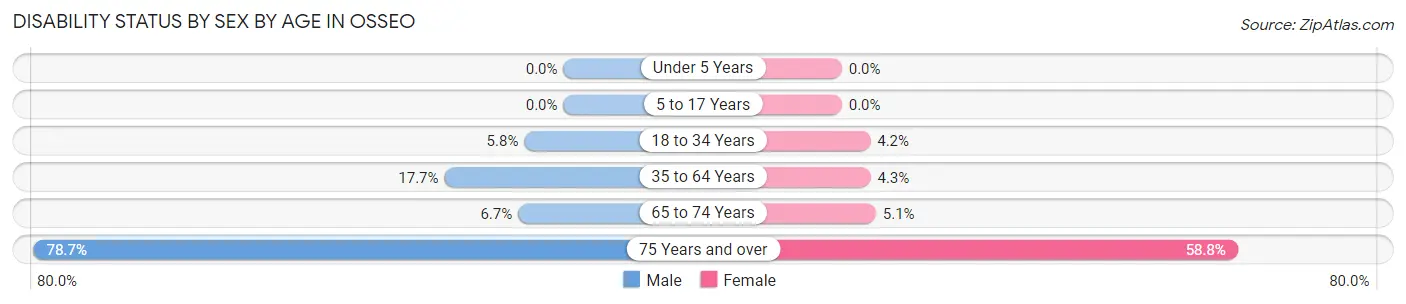
| Age Bracket | Male | Female |
| Under 5 Years | 0 (0.0%) | 0 (0.0%) |
| 5 to 17 Years | 0 (0.0%) | 0 (0.0%) |
| 18 to 34 Years | 15 (5.8%) | 15 (4.2%) |
| 35 to 64 Years | 97 (17.7%) | 18 (4.3%) |
| 65 to 74 Years | 7 (6.7%) | 9 (5.1%) |
| 75 Years and over | 118 (78.7%) | 87 (58.8%) |
Disability Class by Sex by Age in Osseo
Disability Class: Hearing Difficulty
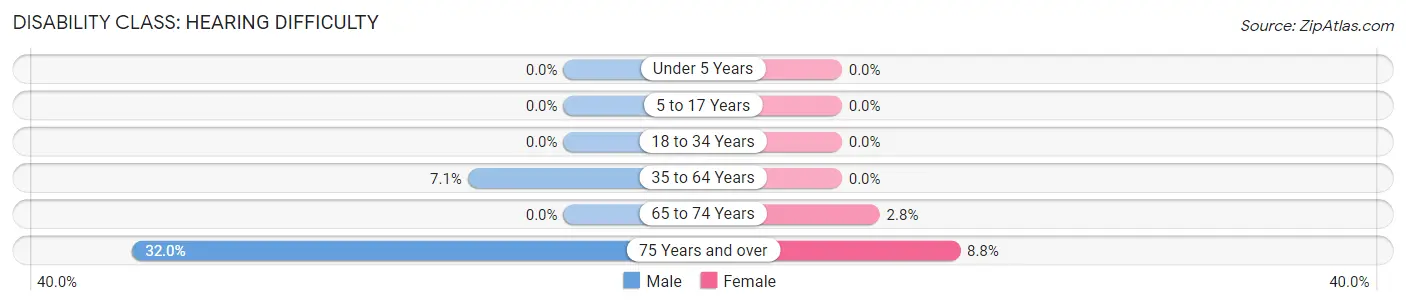
| Age Bracket | Male | Female |
| Under 5 Years | 0 (0.0%) | 0 (0.0%) |
| 5 to 17 Years | 0 (0.0%) | 0 (0.0%) |
| 18 to 34 Years | 0 (0.0%) | 0 (0.0%) |
| 35 to 64 Years | 39 (7.1%) | 0 (0.0%) |
| 65 to 74 Years | 0 (0.0%) | 5 (2.8%) |
| 75 Years and over | 48 (32.0%) | 13 (8.8%) |
Disability Class: Vision Difficulty
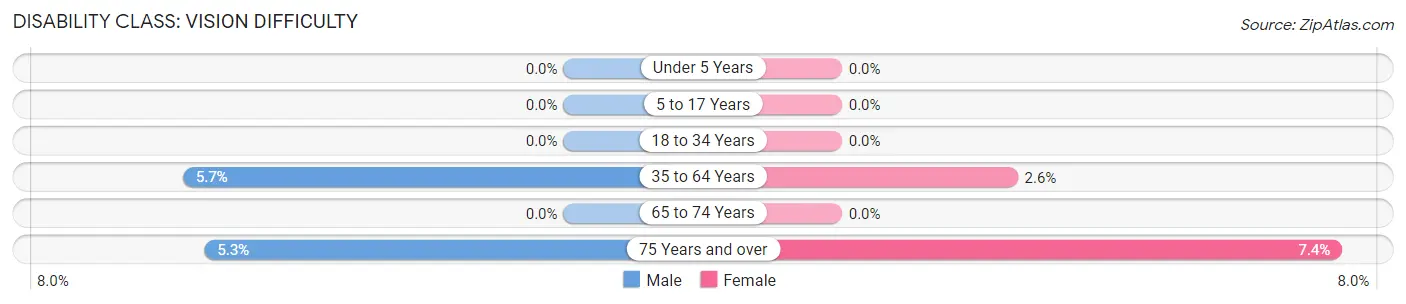
| Age Bracket | Male | Female |
| Under 5 Years | 0 (0.0%) | 0 (0.0%) |
| 5 to 17 Years | 0 (0.0%) | 0 (0.0%) |
| 18 to 34 Years | 0 (0.0%) | 0 (0.0%) |
| 35 to 64 Years | 31 (5.7%) | 11 (2.6%) |
| 65 to 74 Years | 0 (0.0%) | 0 (0.0%) |
| 75 Years and over | 8 (5.3%) | 11 (7.4%) |
Disability Class: Cognitive Difficulty
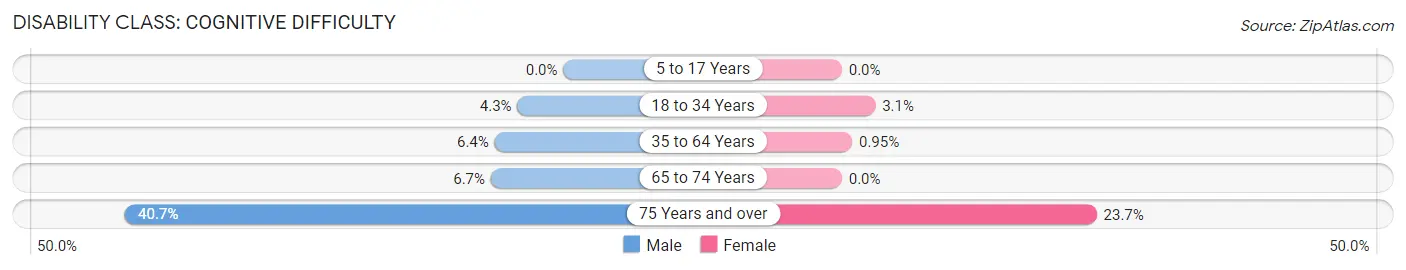
| Age Bracket | Male | Female |
| 5 to 17 Years | 0 (0.0%) | 0 (0.0%) |
| 18 to 34 Years | 11 (4.3%) | 11 (3.1%) |
| 35 to 64 Years | 35 (6.4%) | 4 (0.9%) |
| 65 to 74 Years | 7 (6.7%) | 0 (0.0%) |
| 75 Years and over | 61 (40.7%) | 35 (23.6%) |
Disability Class: Ambulatory Difficulty
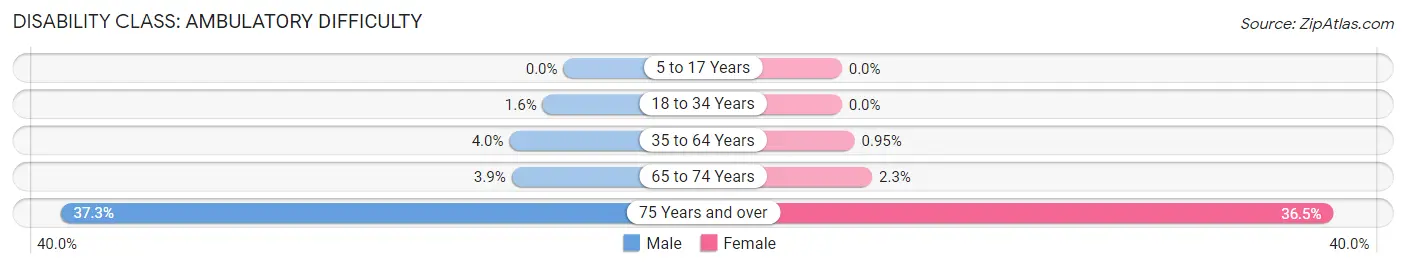
| Age Bracket | Male | Female |
| 5 to 17 Years | 0 (0.0%) | 0 (0.0%) |
| 18 to 34 Years | 4 (1.5%) | 0 (0.0%) |
| 35 to 64 Years | 22 (4.0%) | 4 (0.9%) |
| 65 to 74 Years | 4 (3.8%) | 4 (2.2%) |
| 75 Years and over | 56 (37.3%) | 54 (36.5%) |
Disability Class: Self-Care Difficulty
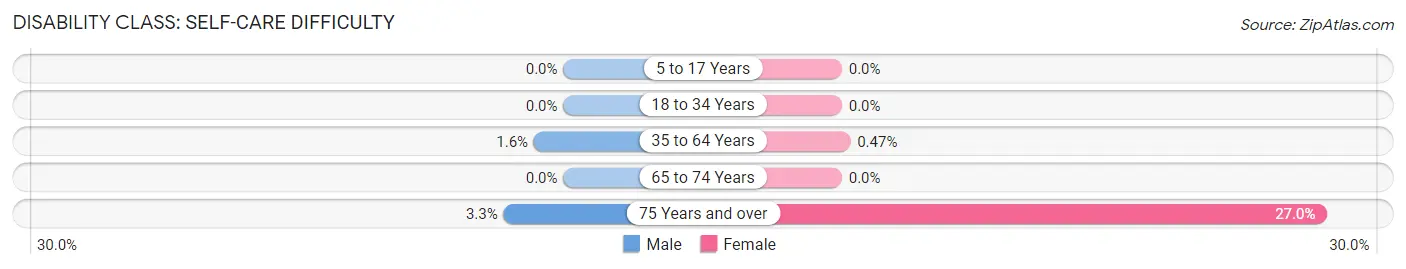
| Age Bracket | Male | Female |
| 5 to 17 Years | 0 (0.0%) | 0 (0.0%) |
| 18 to 34 Years | 0 (0.0%) | 0 (0.0%) |
| 35 to 64 Years | 9 (1.6%) | 2 (0.5%) |
| 65 to 74 Years | 0 (0.0%) | 0 (0.0%) |
| 75 Years and over | 5 (3.3%) | 40 (27.0%) |
Technology Access in Osseo
Computing Device Access in Osseo
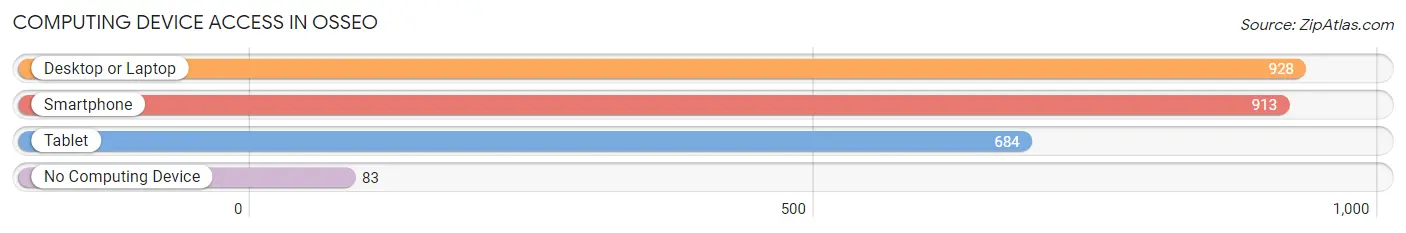
| Device Type | # Households | % Households |
| Desktop or Laptop | 928 | 78.4% |
| Smartphone | 913 | 77.1% |
| Tablet | 684 | 57.8% |
| No Computing Device | 83 | 7.0% |
| Total | 1,184 | 100.0% |
Internet Access in Osseo
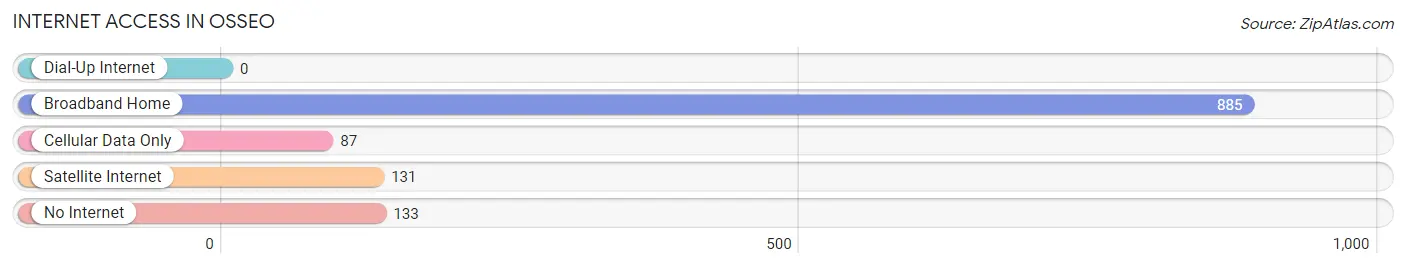
| Internet Type | # Households | % Households |
| Dial-Up Internet | 0 | 0.0% |
| Broadband Home | 885 | 74.8% |
| Cellular Data Only | 87 | 7.3% |
| Satellite Internet | 131 | 11.1% |
| No Internet | 133 | 11.2% |
| Total | 1,184 | 100.0% |
Osseo Summary
Osseo, Minnesota is a small city located in Hennepin County, Minnesota. It is a suburb of Minneapolis and is located about 15 miles northwest of the city. The population of Osseo was 5,434 at the 2010 census.
History
Osseo was first settled in 1855 by a group of settlers from New York. The town was originally called Osseo City, but the name was changed to Osseo in 1872. The town was incorporated in 1877.
Osseo was a farming community until the late 19th century when it began to develop into a small industrial center. The first industry in Osseo was a sawmill, which was built in 1881. Other industries followed, including a brickyard, a flour mill, and a creamery.
In the early 20th century, Osseo began to develop into a residential community. The first subdivision was built in 1910 and the town continued to grow throughout the century.
Geography
Osseo is located in Hennepin County, Minnesota. It is situated on the west bank of the Mississippi River, about 15 miles northwest of Minneapolis. The city has a total area of 2.2 square miles, all of which is land.
Osseo is located in the Twin Cities metropolitan area. It is bordered by Brooklyn Park to the north, Maple Grove to the east, and Plymouth to the south.
Economy
Osseo’s economy is largely based on retail and services. The city is home to several large retail stores, including Target, Walmart, and Home Depot. There are also several restaurants and other small businesses in the city.
Osseo is also home to several manufacturing companies, including Osseo Plastics, Osseo Tool & Die, and Osseo Machine Works.
Demographics
As of the 2010 census, the population of Osseo was 5,434. The racial makeup of the city was 87.3% White, 5.2% African American, 0.7% Native American, 2.2% Asian, 0.1% Pacific Islander, 1.7% from other races, and 2.8% from two or more races. Hispanic or Latino of any race were 4.2% of the population.
The median household income in Osseo was $60,945 in 2017. The median age of the population was 37.7 years. The city’s population is well-educated, with 92.3% of the population having a high school diploma or higher and 37.2% having a bachelor’s degree or higher.
Conclusion
Osseo, Minnesota is a small city located in Hennepin County, Minnesota. It is a suburb of Minneapolis and is located about 15 miles northwest of the city. The population of Osseo was 5,434 at the 2010 census. Osseo was first settled in 1855 and was originally called Osseo City. The town was incorporated in 1877 and has since developed into a residential community. Osseo’s economy is largely based on retail and services, with several large retail stores and manufacturing companies located in the city. The population of Osseo is well-educated, with 92.3% of the population having a high school diploma or higher and 37.2% having a bachelor’s degree or higher.
Common Questions
What is Per Capita Income in Osseo?
Per Capita income in Osseo is $40,466.
What is the Median Family Income in Osseo?
Median Family Income in Osseo is $103,750.
What is the Median Household income in Osseo?
Median Household Income in Osseo is $65,463.
What is Income or Wage Gap in Osseo?
Income or Wage Gap in Osseo is 7.5%.
Women in Osseo earn 92.5 cents for every dollar earned by a man.
What is Inequality or Gini Index in Osseo?
Inequality or Gini Index in Osseo is 0.38.
What is the Total Population of Osseo?
Total Population of Osseo is 2,634.
What is the Total Male Population of Osseo?
Total Male Population of Osseo is 1,250.
What is the Total Female Population of Osseo?
Total Female Population of Osseo is 1,384.
What is the Ratio of Males per 100 Females in Osseo?
There are 90.32 Males per 100 Females in Osseo.
What is the Ratio of Females per 100 Males in Osseo?
There are 110.72 Females per 100 Males in Osseo.
What is the Median Population Age in Osseo?
Median Population Age in Osseo is 46.1 Years.
What is the Average Family Size in Osseo
Average Family Size in Osseo is 3.1 People.
What is the Average Household Size in Osseo
Average Household Size in Osseo is 2.1 People.
How Large is the Labor Force in Osseo?
There are 1,528 People in the Labor Forcein in Osseo.
What is the Percentage of People in the Labor Force in Osseo?
65.5% of People are in the Labor Force in Osseo.
What is the Unemployment Rate in Osseo?
Unemployment Rate in Osseo is 6.4%.