Cities with the Highest Percentage of Immigrants from Philippines in Arizona
RELATED REPORTS & OPTIONS
Philippines
Arizona
Compare Cities
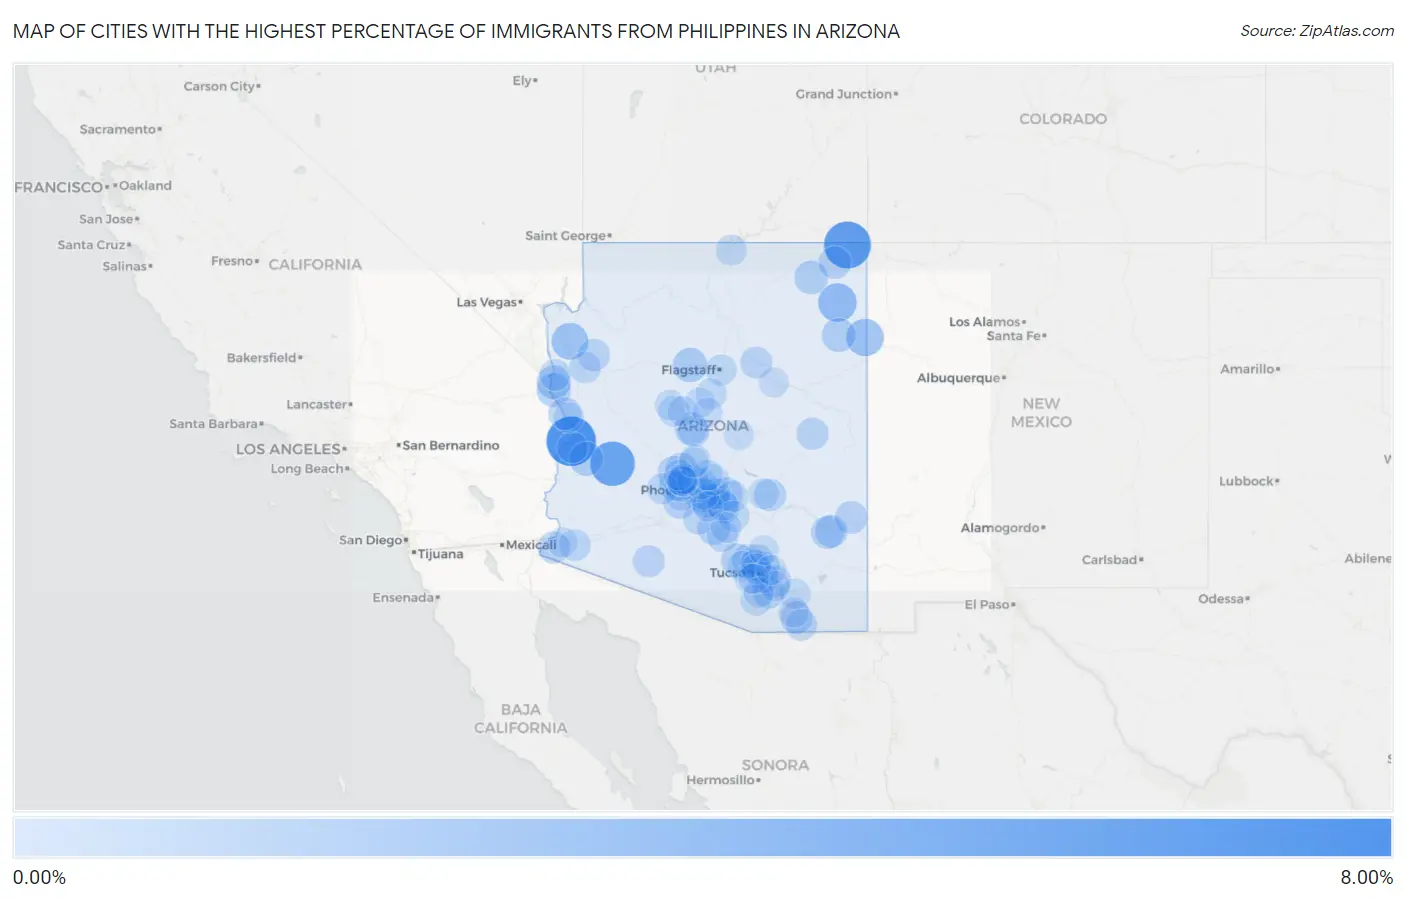
Map of Cities with the Highest Percentage of Immigrants from Philippines in Arizona
0.00%
8.00%
Cities with the Highest Percentage of Immigrants from Philippines in Arizona
| City | Philippines | vs State | vs National | |
| 1. | Bluewater | 6.32% | 0.42%(+5.90)#-1 | 0.60%(+5.72)#0 |
| 2. | Red Mesa | 5.47% | 0.42%(+5.04)#0 | 0.60%(+4.87)#1 |
| 3. | Wenden | 4.69% | 0.42%(+4.27)#1 | 0.60%(+4.09)#2 |
| 4. | Chinle | 2.70% | 0.42%(+2.28)#2 | 0.60%(+2.10)#3 |
| 5. | St Michaels | 2.33% | 0.42%(+1.90)#3 | 0.60%(+1.73)#4 |
| 6. | Dolan Springs | 2.15% | 0.42%(+1.72)#4 | 0.60%(+1.55)#5 |
| 7. | Bellemont | 1.49% | 0.42%(+1.07)#5 | 0.60%(+0.890)#6 |
| 8. | Williams | 1.44% | 0.42%(+1.01)#6 | 0.60%(+0.835)#7 |
| 9. | Mohave Valley | 1.28% | 0.42%(+0.861)#7 | 0.60%(+0.685)#8 |
| 10. | Bouse | 1.27% | 0.42%(+0.844)#8 | 0.60%(+0.667)#9 |
| 11. | Fort Mohave | 1.25% | 0.42%(+0.830)#9 | 0.60%(+0.654)#10 |
| 12. | Ganado | 1.22% | 0.42%(+0.798)#10 | 0.60%(+0.621)#11 |
| 13. | Chilchinbito | 1.18% | 0.42%(+0.754)#11 | 0.60%(+0.578)#12 |
| 14. | Circle | 1.16% | 0.42%(+0.741)#12 | 0.60%(+0.565)#13 |
| 15. | Guadalupe | 1.07% | 0.42%(+0.645)#13 | 0.60%(+0.469)#14 |
| 16. | Spring Valley | 0.99% | 0.42%(+0.567)#14 | 0.60%(+0.391)#15 |
| 17. | Thatcher | 0.95% | 0.42%(+0.523)#15 | 0.60%(+0.347)#16 |
| 18. | Avra Valley | 0.94% | 0.42%(+0.516)#16 | 0.60%(+0.340)#17 |
| 19. | Apache Junction | 0.91% | 0.42%(+0.490)#17 | 0.60%(+0.314)#18 |
| 20. | Desert Hills | 0.91% | 0.42%(+0.482)#18 | 0.60%(+0.306)#19 |
| 21. | Morenci | 0.89% | 0.42%(+0.463)#19 | 0.60%(+0.286)#20 |
| 22. | Surprise | 0.88% | 0.42%(+0.452)#20 | 0.60%(+0.275)#21 |
| 23. | Gilbert | 0.87% | 0.42%(+0.450)#21 | 0.60%(+0.274)#713 |
| 24. | Goodyear | 0.86% | 0.42%(+0.441)#22 | 0.60%(+0.265)#1,187 |
| 25. | Safford | 0.86% | 0.42%(+0.437)#23 | 0.60%(+0.261)#1,188 |
| 26. | Sierra Vista | 0.84% | 0.42%(+0.421)#24 | 0.60%(+0.245)#1,189 |
| 27. | Casa Grande | 0.83% | 0.42%(+0.405)#25 | 0.60%(+0.228)#1,190 |
| 28. | Rock Point | 0.82% | 0.42%(+0.394)#26 | 0.60%(+0.218)#1,191 |
| 29. | Chandler | 0.79% | 0.42%(+0.363)#27 | 0.60%(+0.186)#1,192 |
| 30. | Globe | 0.76% | 0.42%(+0.337)#28 | 0.60%(+0.161)#1,193 |
| 31. | Rincon Valley | 0.74% | 0.42%(+0.312)#29 | 0.60%(+0.136)#1,194 |
| 32. | Valle Vista | 0.72% | 0.42%(+0.298)#30 | 0.60%(+0.122)#1,195 |
| 33. | Show Low | 0.70% | 0.42%(+0.273)#31 | 0.60%(+0.097)#1,196 |
| 34. | Ajo | 0.68% | 0.42%(+0.261)#32 | 0.60%(+0.085)#1,197 |
| 35. | Corona De Tucson | 0.64% | 0.42%(+0.217)#33 | 0.60%(+0.041)#1,198 |
| 36. | Yuma | 0.63% | 0.42%(+0.201)#34 | 0.60%(+0.025)#1,199 |
| 37. | Glendale | 0.60% | 0.42%(+0.178)#35 | 0.60%(+0.002)#1,200 |
| 38. | Peoria | 0.60% | 0.42%(+0.174)#36 | 0.60%(-0.002)#1,201 |
| 39. | Leupp | 0.59% | 0.42%(+0.170)#37 | 0.60%(-0.006)#1,202 |
| 40. | Catalina Foothills | 0.59% | 0.42%(+0.162)#38 | 0.60%(-0.014)#1,276 |
| 41. | Wellton | 0.57% | 0.42%(+0.149)#39 | 0.60%(-0.028)#1,277 |
| 42. | Kingman | 0.54% | 0.42%(+0.118)#40 | 0.60%(-0.058)#1,278 |
| 43. | Citrus Park | 0.52% | 0.42%(+0.097)#41 | 0.60%(-0.079)#1,279 |
| 44. | San Tan Valley | 0.51% | 0.42%(+0.086)#42 | 0.60%(-0.090)#1,280 |
| 45. | Sierra Vista Southeast | 0.51% | 0.42%(+0.083)#43 | 0.60%(-0.093)#1,281 |
| 46. | Eloy | 0.50% | 0.42%(+0.074)#44 | 0.60%(-0.102)#1,282 |
| 47. | Maricopa | 0.49% | 0.42%(+0.065)#45 | 0.60%(-0.112)#1,283 |
| 48. | Cordes Lakes | 0.48% | 0.42%(+0.060)#46 | 0.60%(-0.116)#1,284 |
| 49. | Bullhead City | 0.48% | 0.42%(+0.055)#47 | 0.60%(-0.121)#1,285 |
| 50. | Tucson Mountains | 0.47% | 0.42%(+0.051)#48 | 0.60%(-0.125)#1,286 |
| 51. | Gold Canyon | 0.47% | 0.42%(+0.043)#49 | 0.60%(-0.133)#1,287 |
| 52. | Marana | 0.47% | 0.42%(+0.043)#50 | 0.60%(-0.133)#1,288 |
| 53. | Oro Valley | 0.47% | 0.42%(+0.042)#51 | 0.60%(-0.134)#1,289 |
| 54. | Avondale | 0.46% | 0.42%(+0.032)#52 | 0.60%(-0.145)#1,290 |
| 55. | Green Valley | 0.44% | 0.42%(+0.021)#53 | 0.60%(-0.156)#1,291 |
| 56. | Queen Creek | 0.41% | 0.42%(-0.009)#54 | 0.60%(-0.185)#1,292 |
| 57. | Mesa | 0.40% | 0.42%(-0.019)#55 | 0.60%(-0.195)#1,293 |
| 58. | Tempe | 0.40% | 0.42%(-0.021)#56 | 0.60%(-0.197)#1,294 |
| 59. | Phoenix | 0.40% | 0.42%(-0.022)#57 | 0.60%(-0.198)#1,295 |
| 60. | Casas Adobes | 0.40% | 0.42%(-0.023)#58 | 0.60%(-0.199)#1,296 |
| 61. | Litchfield Park | 0.40% | 0.42%(-0.026)#59 | 0.60%(-0.202)#1,297 |
| 62. | Flagstaff | 0.40% | 0.42%(-0.027)#60 | 0.60%(-0.203)#1,298 |
| 63. | Buckeye | 0.40% | 0.42%(-0.028)#61 | 0.60%(-0.204)#1,299 |
| 64. | Florence | 0.39% | 0.42%(-0.032)#62 | 0.60%(-0.208)#1,300 |
| 65. | New River | 0.39% | 0.42%(-0.033)#63 | 0.60%(-0.209)#1,301 |
| 66. | Parker | 0.39% | 0.42%(-0.036)#64 | 0.60%(-0.212)#1,302 |
| 67. | Prescott | 0.38% | 0.42%(-0.046)#65 | 0.60%(-0.222)#1,303 |
| 68. | Tucson | 0.37% | 0.42%(-0.056)#66 | 0.60%(-0.232)#1,304 |
| 69. | Paradise Valley | 0.36% | 0.42%(-0.061)#67 | 0.60%(-0.237)#1,305 |
| 70. | Sedona | 0.36% | 0.42%(-0.064)#68 | 0.60%(-0.240)#1,306 |
| 71. | Lechee | 0.34% | 0.42%(-0.079)#69 | 0.60%(-0.256)#1,307 |
| 72. | Fountain Hills | 0.32% | 0.42%(-0.099)#70 | 0.60%(-0.275)#1,308 |
| 73. | Scottsdale | 0.32% | 0.42%(-0.102)#71 | 0.60%(-0.278)#1,309 |
| 74. | Miami | 0.30% | 0.42%(-0.128)#72 | 0.60%(-0.304)#1,310 |
| 75. | Picture Rocks | 0.29% | 0.42%(-0.132)#73 | 0.60%(-0.308)#1,311 |
| 76. | Benson | 0.26% | 0.42%(-0.160)#74 | 0.60%(-0.336)#1,312 |
| 77. | Red Rock Cdp Pinal County | 0.25% | 0.42%(-0.171)#75 | 0.60%(-0.348)#1,313 |
| 78. | El Mirage | 0.23% | 0.42%(-0.196)#76 | 0.60%(-0.373)#1,314 |
| 79. | Williamson | 0.22% | 0.42%(-0.207)#77 | 0.60%(-0.383)#1,315 |
| 80. | Coolidge | 0.21% | 0.42%(-0.212)#78 | 0.60%(-0.388)#1,316 |
| 81. | Valencia West | 0.20% | 0.42%(-0.219)#79 | 0.60%(-0.395)#1,317 |
| 82. | Sun City | 0.19% | 0.42%(-0.233)#80 | 0.60%(-0.409)#1,318 |
| 83. | Lake Havasu City | 0.19% | 0.42%(-0.233)#81 | 0.60%(-0.409)#1,319 |
| 84. | Vail | 0.17% | 0.42%(-0.253)#82 | 0.60%(-0.429)#1,320 |
| 85. | Fortuna Foothills | 0.15% | 0.42%(-0.275)#83 | 0.60%(-0.451)#1,321 |
| 86. | Sun City West | 0.15% | 0.42%(-0.277)#84 | 0.60%(-0.453)#1,322 |
| 87. | Youngtown | 0.13% | 0.42%(-0.295)#85 | 0.60%(-0.471)#1,323 |
| 88. | Payson | 0.13% | 0.42%(-0.295)#86 | 0.60%(-0.471)#1,324 |
| 89. | Sun Lakes | 0.13% | 0.42%(-0.296)#87 | 0.60%(-0.473)#1,325 |
| 90. | Prescott Valley | 0.12% | 0.42%(-0.302)#88 | 0.60%(-0.478)#1,326 |
| 91. | Flowing Wells | 0.11% | 0.42%(-0.313)#89 | 0.60%(-0.489)#1,327 |
| 92. | Huachuca City | 0.11% | 0.42%(-0.316)#90 | 0.60%(-0.492)#1,328 |
| 93. | Sahuarita | 0.11% | 0.42%(-0.318)#91 | 0.60%(-0.495)#1,329 |
| 94. | Verde Village | 0.092% | 0.42%(-0.332)#92 | 0.60%(-0.508)#1,330 |
| 95. | Winslow | 0.089% | 0.42%(-0.334)#93 | 0.60%(-0.510)#1,331 |
| 96. | Drexel Heights | 0.086% | 0.42%(-0.338)#94 | 0.60%(-0.514)#1,332 |
| 97. | Camp Verde | 0.074% | 0.42%(-0.349)#95 | 0.60%(-0.526)#1,333 |
| 98. | Anthem | 0.070% | 0.42%(-0.353)#96 | 0.60%(-0.529)#1,334 |
| 99. | Saddlebrooke | 0.067% | 0.42%(-0.357)#97 | 0.60%(-0.533)#1,335 |
| 100. | Tanque Verde | 0.061% | 0.42%(-0.363)#98 | 0.60%(-0.539)#1,336 |
Common Questions
What are the Top 10 Cities with the Highest Percentage of Immigrants from Philippines in Arizona?
Top 10 Cities with the Highest Percentage of Immigrants from Philippines in Arizona are:
#1
6.32%
#2
5.47%
#3
4.69%
#4
2.70%
#5
2.33%
#6
2.15%
#7
1.44%
#8
1.28%
#9
1.27%
#10
1.25%
What city has the Highest Percentage of Immigrants from Philippines in Arizona?
Bluewater has the Highest Percentage of Immigrants from Philippines in Arizona with 6.32%.
What is the Percentage of Immigrants from Philippines in the State of Arizona?
Percentage of Immigrants from Philippines in Arizona is 0.42%.
What is the Percentage of Immigrants from Philippines in the United States?
Percentage of Immigrants from Philippines in the United States is 0.60%.