Lihue, HI Map & Demographics
Lihue Map
Lihue Overview
$39,369
PER CAPITA INCOME
$105,421
AVG FAMILY INCOME
$73,641
AVG HOUSEHOLD INCOME
27.1%
WAGE / INCOME GAP [ % ]
72.9¢/ $1
WAGE / INCOME GAP [ $ ]
0.48
INEQUALITY / GINI INDEX
8,649
TOTAL POPULATION
4,054
MALE POPULATION
4,595
FEMALE POPULATION
88.23
MALES / 100 FEMALES
113.34
FEMALES / 100 MALES
41.8
MEDIAN AGE
3.8
AVG FAMILY SIZE
3.1
AVG HOUSEHOLD SIZE
4,185
LABOR FORCE [ PEOPLE ]
60.9%
PERCENT IN LABOR FORCE
1.1%
UNEMPLOYMENT RATE
Lihue Zip Codes
Lihue Area Codes
Income in Lihue
Income Overview in Lihue
Per Capita Income in Lihue is $39,369, while median incomes of families and households are $105,421 and $73,641 respectively.
| Characteristic | Number | Measure |
| Per Capita Income | 8,649 | $39,369 |
| Median Family Income | 1,801 | $105,421 |
| Mean Family Income | 1,801 | $127,519 |
| Median Household Income | 2,714 | $73,641 |
| Mean Household Income | 2,714 | $113,633 |
| Income Deficit | 1,801 | $0 |
| Wage / Income Gap (%) | 8,649 | 27.14% |
| Wage / Income Gap ($) | 8,649 | 72.86¢ per $1 |
| Gini / Inequality Index | 8,649 | 0.48 |
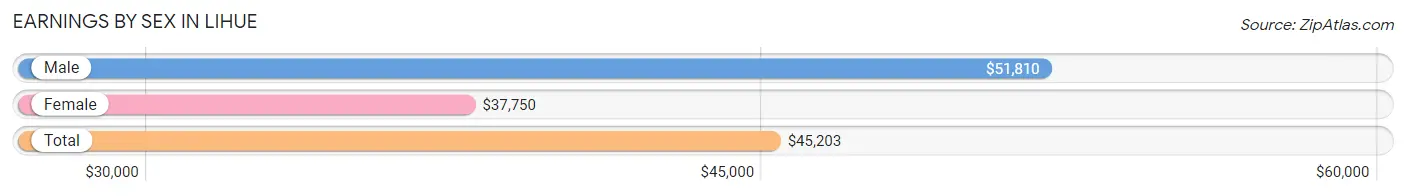
Earnings by Sex in Lihue
Average Earnings in Lihue are $45,203, $51,810 for men and $37,750 for women, a difference of 27.1%.
| Sex | Number | Average Earnings |
| Male | 2,140 (49.7%) | $51,810 |
| Female | 2,162 (50.3%) | $37,750 |
| Total | 4,302 (100.0%) | $45,203 |
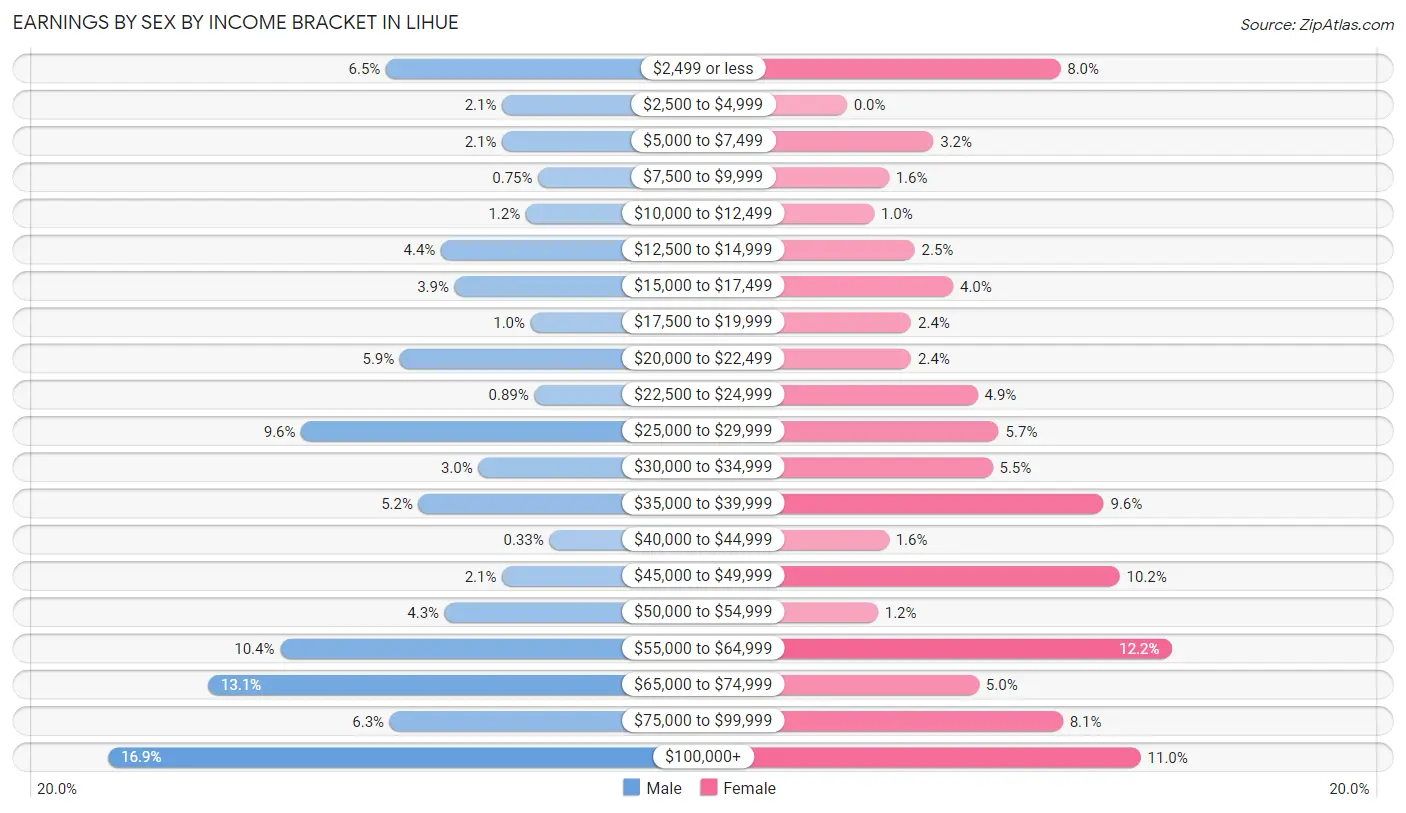
Earnings by Sex by Income Bracket in Lihue
The most common earnings brackets in Lihue are $100,000+ for men (361 | 16.9%) and $55,000 to $64,999 for women (263 | 12.2%).
| Income | Male | Female |
| $2,499 or less | 138 (6.5%) | 173 (8.0%) |
| $2,500 to $4,999 | 45 (2.1%) | 0 (0.0%) |
| $5,000 to $7,499 | 45 (2.1%) | 70 (3.2%) |
| $7,500 to $9,999 | 16 (0.7%) | 34 (1.6%) |
| $10,000 to $12,499 | 26 (1.2%) | 22 (1.0%) |
| $12,500 to $14,999 | 94 (4.4%) | 55 (2.5%) |
| $15,000 to $17,499 | 83 (3.9%) | 86 (4.0%) |
| $17,500 to $19,999 | 22 (1.0%) | 52 (2.4%) |
| $20,000 to $22,499 | 127 (5.9%) | 52 (2.4%) |
| $22,500 to $24,999 | 19 (0.9%) | 106 (4.9%) |
| $25,000 to $29,999 | 206 (9.6%) | 123 (5.7%) |
| $30,000 to $34,999 | 64 (3.0%) | 118 (5.5%) |
| $35,000 to $39,999 | 112 (5.2%) | 208 (9.6%) |
| $40,000 to $44,999 | 7 (0.3%) | 34 (1.6%) |
| $45,000 to $49,999 | 45 (2.1%) | 221 (10.2%) |
| $50,000 to $54,999 | 91 (4.3%) | 25 (1.2%) |
| $55,000 to $64,999 | 223 (10.4%) | 263 (12.2%) |
| $65,000 to $74,999 | 281 (13.1%) | 107 (5.0%) |
| $75,000 to $99,999 | 135 (6.3%) | 175 (8.1%) |
| $100,000+ | 361 (16.9%) | 238 (11.0%) |
| Total | 2,140 (100.0%) | 2,162 (100.0%) |
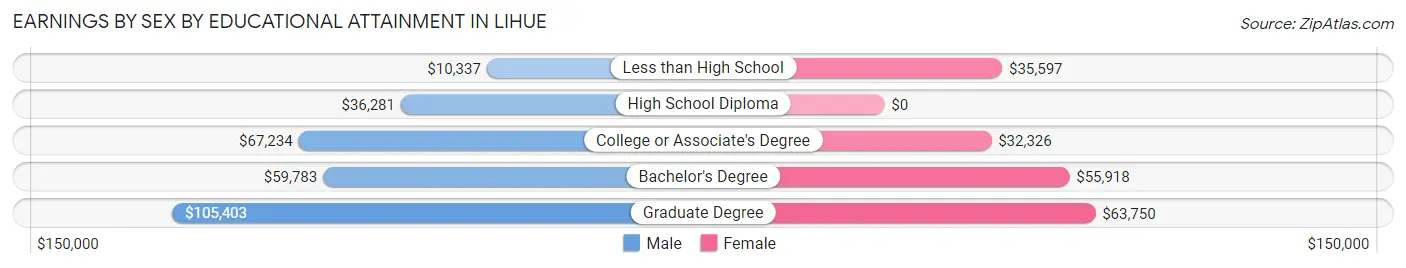
Earnings by Sex by Educational Attainment in Lihue
Average earnings in Lihue are $56,065 for men and $45,654 for women, a difference of 18.6%. Men with an educational attainment of graduate degree enjoy the highest average annual earnings of $105,403, while those with less than high school education earn the least with $10,337. Women with an educational attainment of graduate degree earn the most with the average annual earnings of $63,750, while those with college or associate's degree education have the smallest earnings of $32,326.
| Educational Attainment | Male Income | Female Income |
| Less than High School | $10,337 | $35,597 |
| High School Diploma | $36,281 | $0 |
| College or Associate's Degree | $67,234 | $32,326 |
| Bachelor's Degree | $59,783 | $55,918 |
| Graduate Degree | $105,403 | $63,750 |
| Total | $56,065 | $45,654 |
Family Income in Lihue
Family Income Brackets in Lihue
According to the Lihue family income data, there are 477 families falling into the $100,000 to $149,999 income range, which is the most common income bracket and makes up 26.5% of all families.
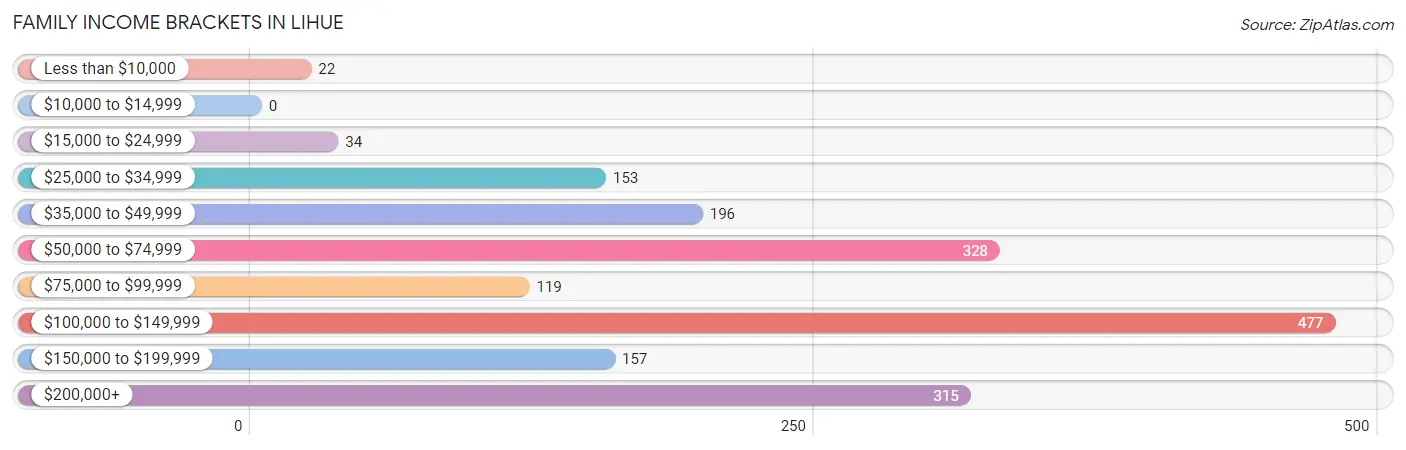
| Income Bracket | # Families | % Families |
| Less than $10,000 | 22 | 1.2% |
| $10,000 to $14,999 | 0 | 0.0% |
| $15,000 to $24,999 | 34 | 1.9% |
| $25,000 to $34,999 | 153 | 8.5% |
| $35,000 to $49,999 | 196 | 10.9% |
| $50,000 to $74,999 | 328 | 18.2% |
| $75,000 to $99,999 | 119 | 6.6% |
| $100,000 to $149,999 | 477 | 26.5% |
| $150,000 to $199,999 | 157 | 8.7% |
| $200,000+ | 315 | 17.5% |
Family Income by Famaliy Size in Lihue
7+ person families (77 | 4.3%) account for the highest median family income in Lihue with $146,058 per family, while 3-person families (336 | 18.7%) have the highest median income of $38,864 per family member.
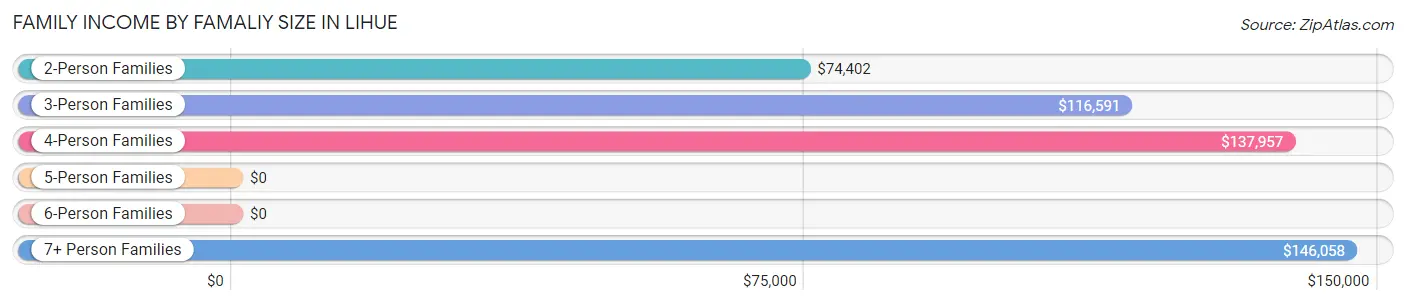
| Income Bracket | # Families | Median Income |
| 2-Person Families | 764 (42.4%) | $74,402 |
| 3-Person Families | 336 (18.7%) | $116,591 |
| 4-Person Families | 307 (17.1%) | $137,957 |
| 5-Person Families | 277 (15.4%) | $0 |
| 6-Person Families | 40 (2.2%) | $0 |
| 7+ Person Families | 77 (4.3%) | $146,058 |
| Total | 1,801 (100.0%) | $105,421 |
Family Income by Number of Earners in Lihue
The median family income in Lihue is $105,421, with families comprising 3+ earners (285) having the highest median family income of $179,479, while families with 1 earner (551) have the lowest median family income of $56,094, accounting for 15.8% and 30.6% of families, respectively.
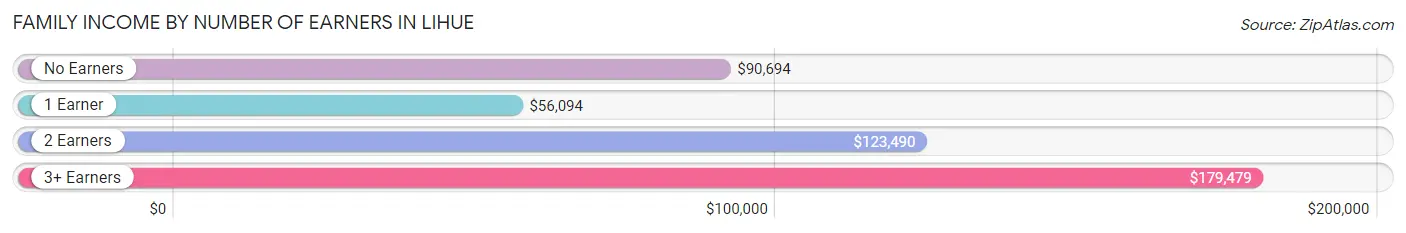
| Number of Earners | # Families | Median Income |
| No Earners | 324 (18.0%) | $90,694 |
| 1 Earner | 551 (30.6%) | $56,094 |
| 2 Earners | 641 (35.6%) | $123,490 |
| 3+ Earners | 285 (15.8%) | $179,479 |
| Total | 1,801 (100.0%) | $105,421 |
Household Income in Lihue
Household Income Brackets in Lihue
With 480 households falling in the category, the $50,000 to $74,999 income range is the most frequent in Lihue, accounting for 17.7% of all households. In contrast, only 52 households (1.9%) fall into the $10,000 to $14,999 income bracket, making it the least populous group.
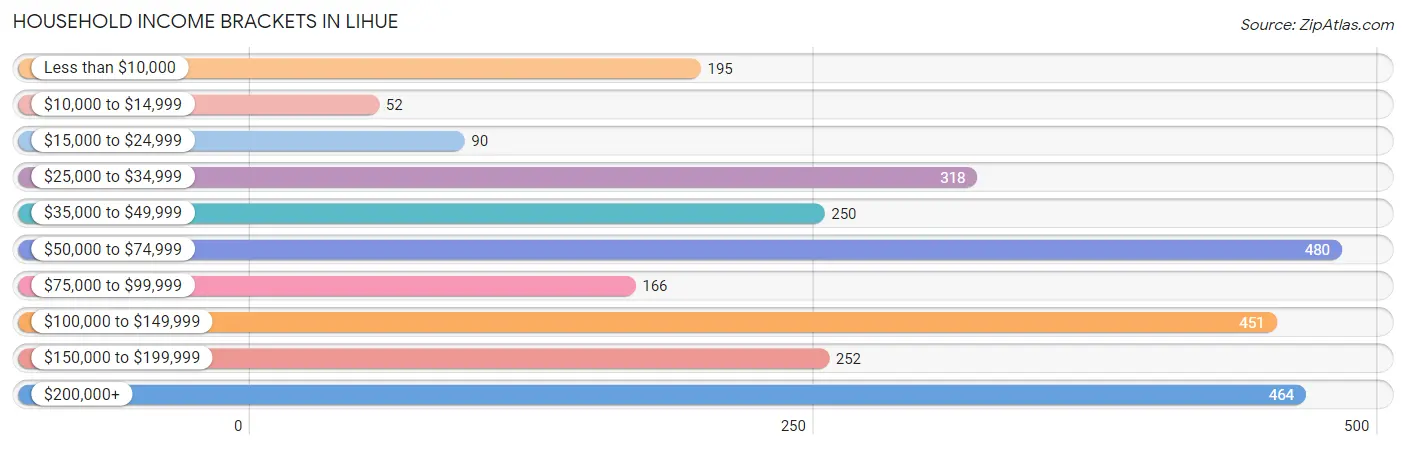
| Income Bracket | # Households | % Households |
| Less than $10,000 | 195 | 7.2% |
| $10,000 to $14,999 | 52 | 1.9% |
| $15,000 to $24,999 | 90 | 3.3% |
| $25,000 to $34,999 | 318 | 11.7% |
| $35,000 to $49,999 | 250 | 9.2% |
| $50,000 to $74,999 | 480 | 17.7% |
| $75,000 to $99,999 | 166 | 6.1% |
| $100,000 to $149,999 | 451 | 16.6% |
| $150,000 to $199,999 | 252 | 9.3% |
| $200,000+ | 464 | 17.1% |
Household Income by Householder Age in Lihue
The median household income in Lihue is $73,641, with the highest median household income of $115,114 found in the 25 to 44 years age bracket for the primary householder. A total of 602 households (22.2%) fall into this category. Meanwhile, the 15 to 24 years age bracket for the primary householder has the lowest median household income of $0, with 7 households (0.3%) in this group.
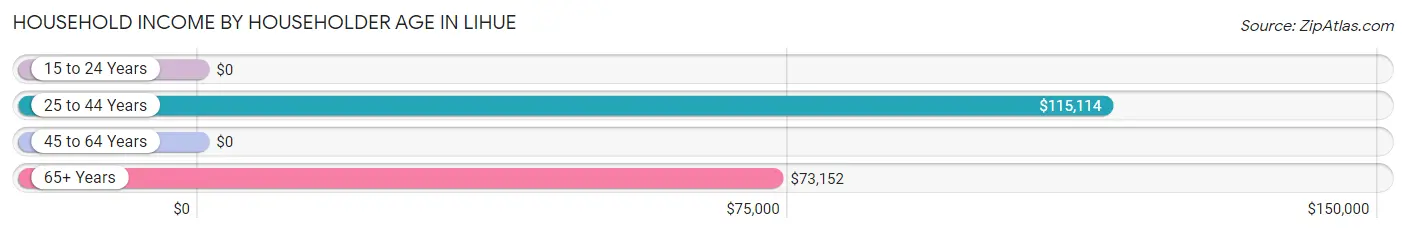
| Income Bracket | # Households | Median Income |
| 15 to 24 Years | 7 (0.3%) | $0 |
| 25 to 44 Years | 602 (22.2%) | $115,114 |
| 45 to 64 Years | 977 (36.0%) | $0 |
| 65+ Years | 1,128 (41.6%) | $73,152 |
| Total | 2,714 (100.0%) | $73,641 |
Poverty in Lihue
Income Below Poverty by Sex and Age in Lihue
With 3.3% poverty level for males and 6.5% for females among the residents of Lihue, 55 to 64 year old males and 12 to 14 year old females are the most vulnerable to poverty, with 108 males (23.6%) and 33 females (23.9%) in their respective age groups living below the poverty level.
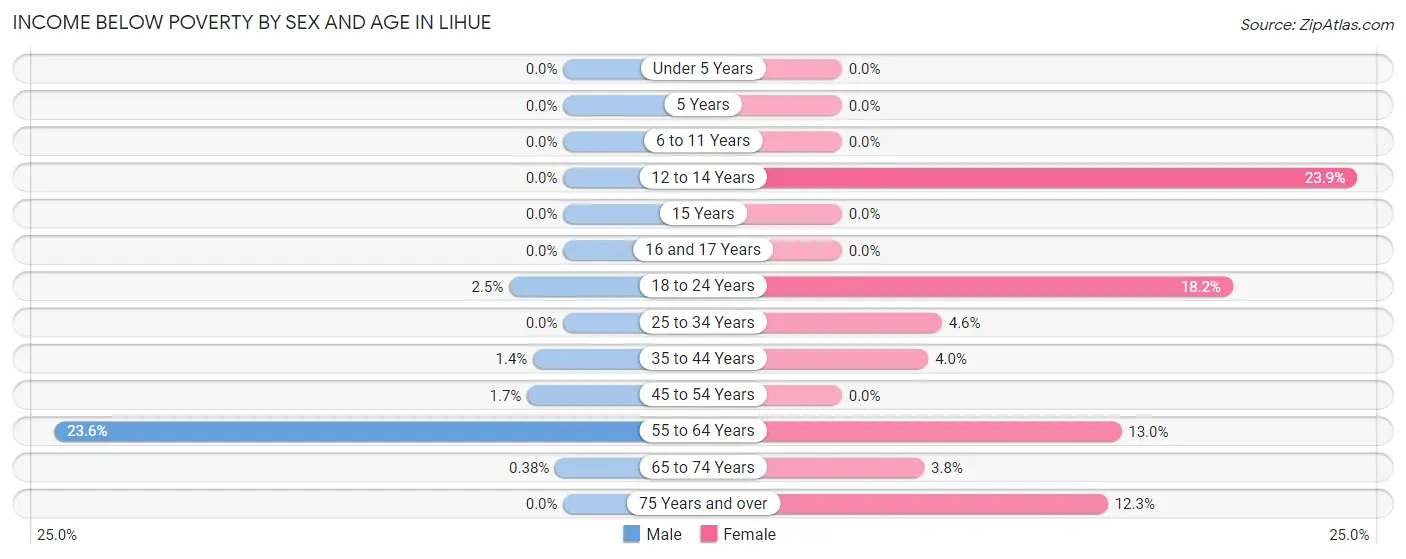
| Age Bracket | Male | Female |
| Under 5 Years | 0 (0.0%) | 0 (0.0%) |
| 5 Years | 0 (0.0%) | 0 (0.0%) |
| 6 to 11 Years | 0 (0.0%) | 0 (0.0%) |
| 12 to 14 Years | 0 (0.0%) | 33 (23.9%) |
| 15 Years | 0 (0.0%) | 0 (0.0%) |
| 16 and 17 Years | 0 (0.0%) | 0 (0.0%) |
| 18 to 24 Years | 8 (2.5%) | 47 (18.1%) |
| 25 to 34 Years | 0 (0.0%) | 22 (4.6%) |
| 35 to 44 Years | 7 (1.4%) | 22 (4.0%) |
| 45 to 54 Years | 9 (1.7%) | 0 (0.0%) |
| 55 to 64 Years | 108 (23.6%) | 76 (13.0%) |
| 65 to 74 Years | 2 (0.4%) | 19 (3.8%) |
| 75 Years and over | 0 (0.0%) | 76 (12.3%) |
| Total | 134 (3.3%) | 295 (6.5%) |
Income Above Poverty by Sex and Age in Lihue
According to the poverty statistics in Lihue, males aged under 5 years and females aged under 5 years are the age groups that are most secure financially, with 100.0% of males and 100.0% of females in these age groups living above the poverty line.
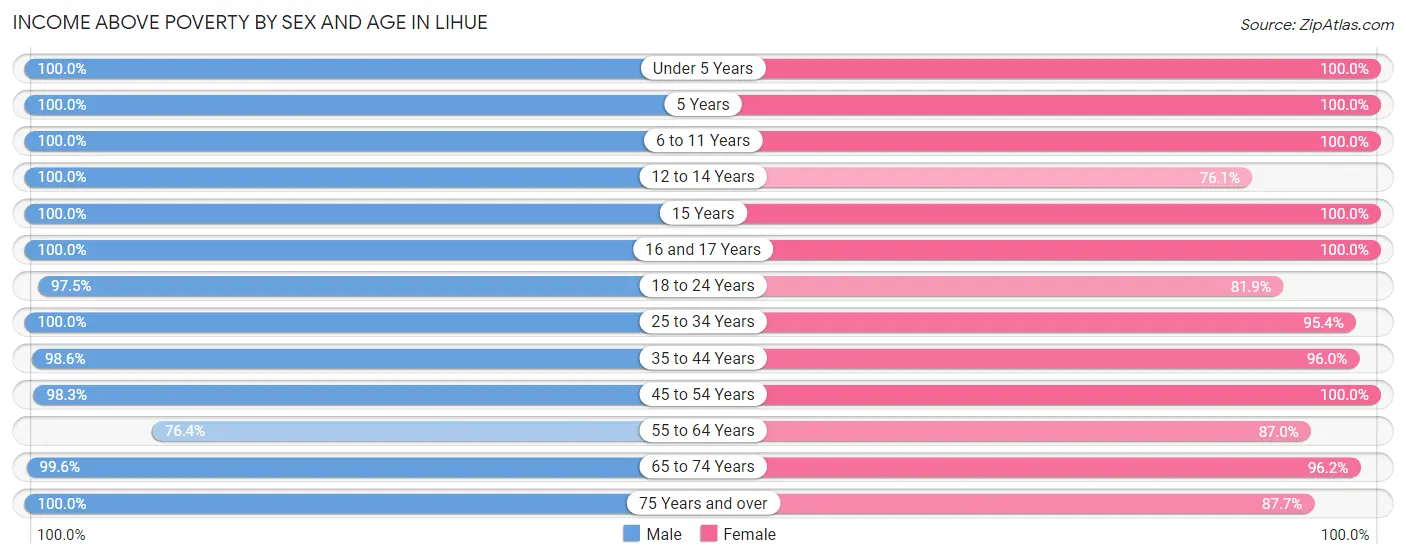
| Age Bracket | Male | Female |
| Under 5 Years | 341 (100.0%) | 233 (100.0%) |
| 5 Years | 22 (100.0%) | 39 (100.0%) |
| 6 to 11 Years | 295 (100.0%) | 433 (100.0%) |
| 12 to 14 Years | 173 (100.0%) | 105 (76.1%) |
| 15 Years | 82 (100.0%) | 21 (100.0%) |
| 16 and 17 Years | 85 (100.0%) | 201 (100.0%) |
| 18 to 24 Years | 309 (97.5%) | 212 (81.9%) |
| 25 to 34 Years | 368 (100.0%) | 452 (95.4%) |
| 35 to 44 Years | 494 (98.6%) | 526 (96.0%) |
| 45 to 54 Years | 526 (98.3%) | 488 (100.0%) |
| 55 to 64 Years | 349 (76.4%) | 510 (87.0%) |
| 65 to 74 Years | 529 (99.6%) | 478 (96.2%) |
| 75 Years and over | 299 (100.0%) | 540 (87.7%) |
| Total | 3,872 (96.7%) | 4,238 (93.5%) |
Income Below Poverty Among Married-Couple Families in Lihue
The poverty statistics for married-couple families in Lihue show that 1.6% or 21 of the total 1,286 families live below the poverty line. Families with no children have the highest poverty rate of 2.8%, comprising of 21 families. On the other hand, families with 1 or 2 children have the lowest poverty rate of 0.0%, which includes 0 families.
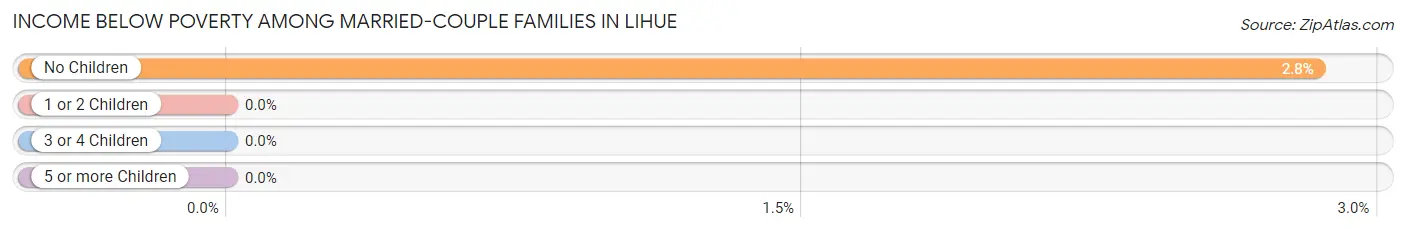
| Children | Above Poverty | Below Poverty |
| No Children | 719 (97.2%) | 21 (2.8%) |
| 1 or 2 Children | 398 (100.0%) | 0 (0.0%) |
| 3 or 4 Children | 139 (100.0%) | 0 (0.0%) |
| 5 or more Children | 9 (100.0%) | 0 (0.0%) |
| Total | 1,265 (98.4%) | 21 (1.6%) |
Income Below Poverty Among Single-Parent Households in Lihue
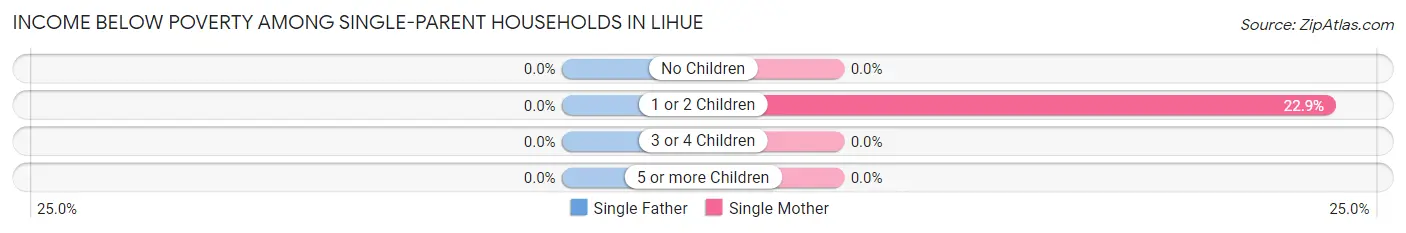
| Children | Single Father | Single Mother |
| No Children | 0 (0.0%) | 0 (0.0%) |
| 1 or 2 Children | 0 (0.0%) | 22 (22.9%) |
| 3 or 4 Children | 0 (0.0%) | 0 (0.0%) |
| 5 or more Children | 0 (0.0%) | 0 (0.0%) |
| Total | 0 (0.0%) | 22 (6.0%) |
Income Below Poverty Among Married-Couple vs Single-Parent Households in Lihue
The poverty data for Lihue shows that 21 of the married-couple family households (1.6%) and 22 of the single-parent households (4.3%) are living below the poverty level. Within the married-couple family households, those with no children have the highest poverty rate, with 21 households (2.8%) falling below the poverty line. Among the single-parent households, those with 1 or 2 children have the highest poverty rate, with 22 household (14.2%) living below poverty.
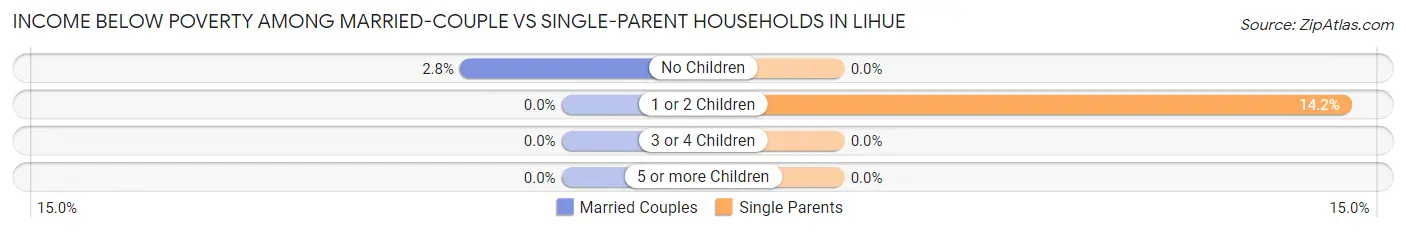
| Children | Married-Couple Families | Single-Parent Households |
| No Children | 21 (2.8%) | 0 (0.0%) |
| 1 or 2 Children | 0 (0.0%) | 22 (14.2%) |
| 3 or 4 Children | 0 (0.0%) | 0 (0.0%) |
| 5 or more Children | 0 (0.0%) | 0 (0.0%) |
| Total | 21 (1.6%) | 22 (4.3%) |
Race in Lihue
The most populous races in Lihue are Asian (3,696 | 42.7%), Two or more Races (2,638 | 30.5%), and White / Caucasian (1,467 | 17.0%).
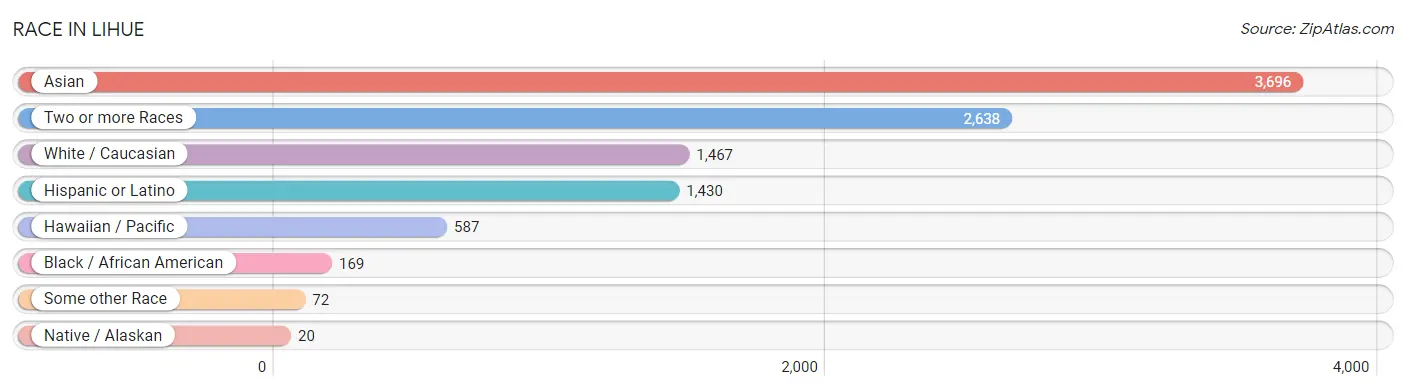
| Race | # Population | % Population |
| Asian | 3,696 | 42.7% |
| Black / African American | 169 | 1.9% |
| Hawaiian / Pacific | 587 | 6.8% |
| Hispanic or Latino | 1,430 | 16.5% |
| Native / Alaskan | 20 | 0.2% |
| White / Caucasian | 1,467 | 17.0% |
| Two or more Races | 2,638 | 30.5% |
| Some other Race | 72 | 0.8% |
| Total | 8,649 | 100.0% |
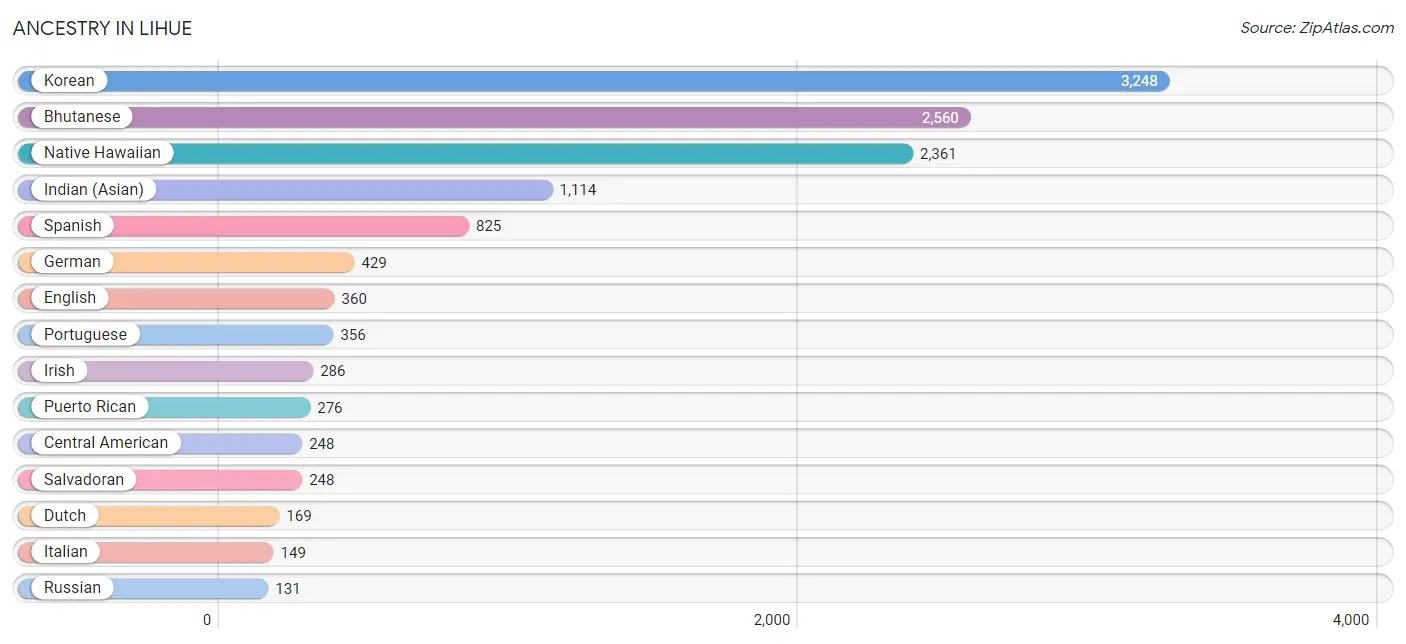
Ancestry in Lihue
The most populous ancestries reported in Lihue are Korean (3,248 | 37.6%), Bhutanese (2,560 | 29.6%), Native Hawaiian (2,361 | 27.3%), Indian (Asian) (1,114 | 12.9%), and Spanish (825 | 9.5%), together accounting for 116.9% of all Lihue residents.
| Ancestry | # Population | % Population |
| American | 98 | 1.1% |
| Apache | 8 | 0.1% |
| Arab | 57 | 0.7% |
| Bhutanese | 2,560 | 29.6% |
| British West Indian | 28 | 0.3% |
| Burmese | 127 | 1.5% |
| Canadian | 4 | 0.1% |
| Central American | 248 | 2.9% |
| Croatian | 7 | 0.1% |
| Czech | 36 | 0.4% |
| Danish | 13 | 0.2% |
| Dutch | 169 | 1.9% |
| English | 360 | 4.2% |
| European | 8 | 0.1% |
| French | 82 | 0.9% |
| French Canadian | 82 | 0.9% |
| German | 429 | 5.0% |
| Guamanian / Chamorro | 13 | 0.2% |
| Hungarian | 9 | 0.1% |
| Indian (Asian) | 1,114 | 12.9% |
| Irish | 286 | 3.3% |
| Italian | 149 | 1.7% |
| Japanese | 15 | 0.2% |
| Korean | 3,248 | 37.6% |
| Lebanese | 57 | 0.7% |
| Lithuanian | 5 | 0.1% |
| Macedonian | 11 | 0.1% |
| Marshallese | 9 | 0.1% |
| Mexican | 64 | 0.7% |
| Mongolian | 12 | 0.1% |
| Native Hawaiian | 2,361 | 27.3% |
| Pakistani | 24 | 0.3% |
| Polish | 50 | 0.6% |
| Portuguese | 356 | 4.1% |
| Puerto Rican | 276 | 3.2% |
| Russian | 131 | 1.5% |
| Salvadoran | 248 | 2.9% |
| Samoan | 17 | 0.2% |
| Scandinavian | 33 | 0.4% |
| Scotch-Irish | 90 | 1.0% |
| Scottish | 28 | 0.3% |
| Slovene | 38 | 0.4% |
| Spanish | 825 | 9.5% |
| Sri Lankan | 77 | 0.9% |
| Subsaharan African | 66 | 0.8% |
| Swedish | 79 | 0.9% |
| Swiss | 16 | 0.2% |
| Thai | 33 | 0.4% |
| Tlingit-Haida | 12 | 0.1% |
| Ukrainian | 22 | 0.3% |
| Welsh | 45 | 0.5% | View All 51 Rows |
Immigrants in Lihue
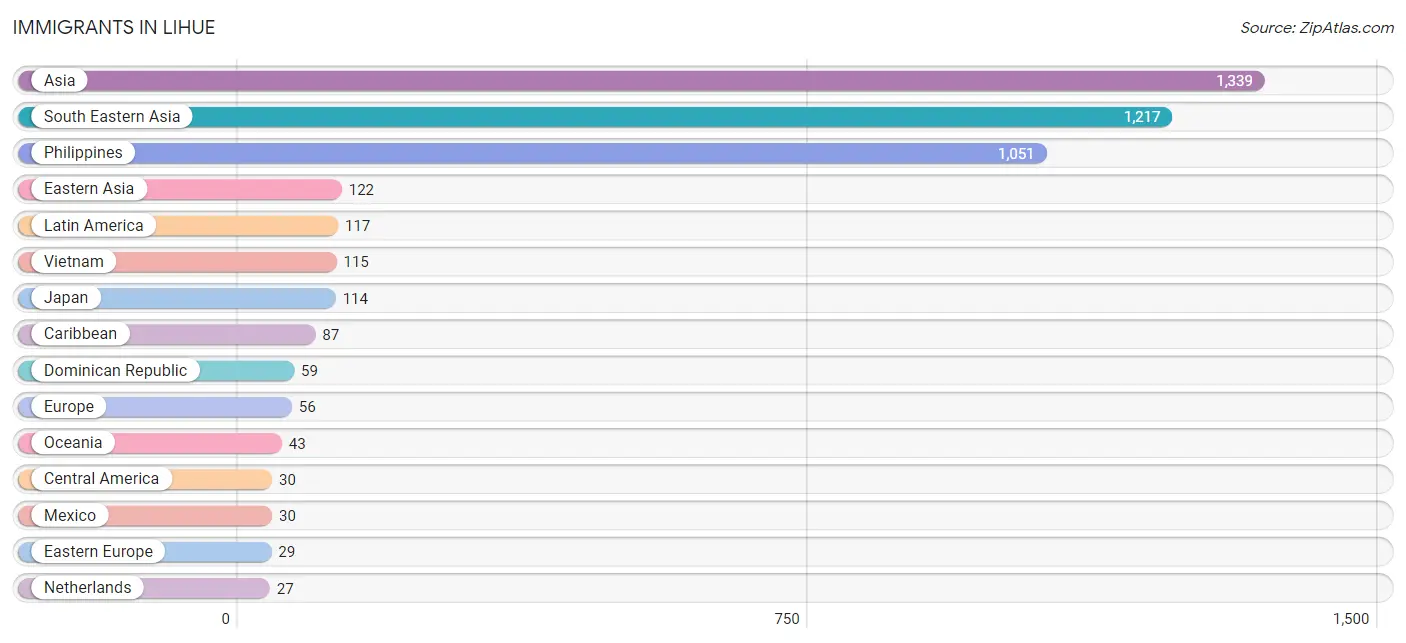
The most numerous immigrant groups reported in Lihue came from Asia (1,339 | 15.5%), South Eastern Asia (1,217 | 14.1%), Philippines (1,051 | 12.1%), Eastern Asia (122 | 1.4%), and Latin America (117 | 1.3%), together accounting for 44.5% of all Lihue residents.
| Immigration Origin | # Population | % Population |
| Asia | 1,339 | 15.5% |
| Cambodia | 15 | 0.2% |
| Canada | 16 | 0.2% |
| Caribbean | 87 | 1.0% |
| Central America | 30 | 0.4% |
| Czechoslovakia | 18 | 0.2% |
| Dominican Republic | 59 | 0.7% |
| Eastern Asia | 122 | 1.4% |
| Eastern Europe | 29 | 0.3% |
| Europe | 56 | 0.6% |
| Japan | 114 | 1.3% |
| Korea | 8 | 0.1% |
| Latin America | 117 | 1.3% |
| Malaysia | 12 | 0.1% |
| Mexico | 30 | 0.4% |
| Micronesia | 9 | 0.1% |
| Netherlands | 27 | 0.3% |
| North Macedonia | 11 | 0.1% |
| Oceania | 43 | 0.5% |
| Philippines | 1,051 | 12.1% |
| South Eastern Asia | 1,217 | 14.1% |
| Thailand | 24 | 0.3% |
| Vietnam | 115 | 1.3% |
| Western Europe | 27 | 0.3% | View All 24 Rows |
Sex and Age in Lihue
Sex and Age in Lihue
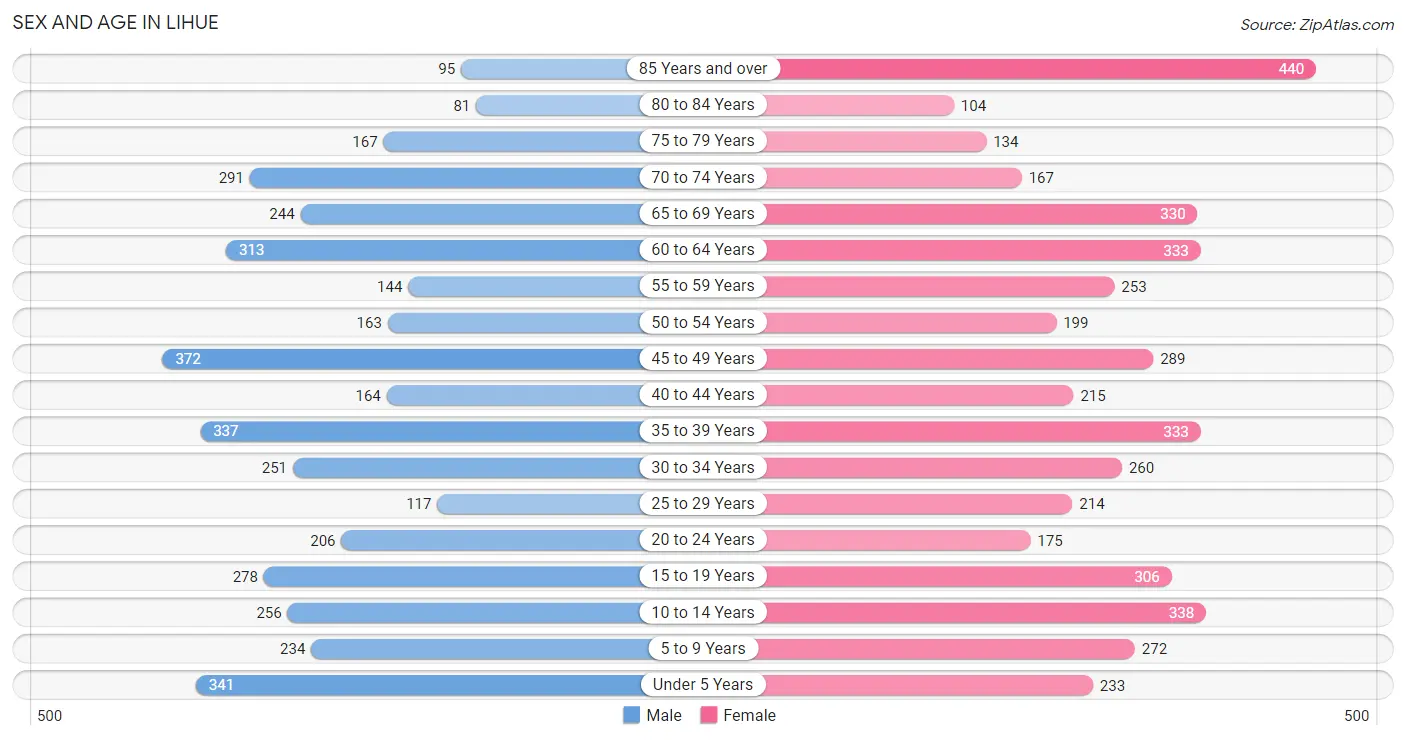
The most populous age groups in Lihue are 45 to 49 Years (372 | 9.2%) for men and 85 Years and over (440 | 9.6%) for women.
| Age Bracket | Male | Female |
| Under 5 Years | 341 (8.4%) | 233 (5.1%) |
| 5 to 9 Years | 234 (5.8%) | 272 (5.9%) |
| 10 to 14 Years | 256 (6.3%) | 338 (7.4%) |
| 15 to 19 Years | 278 (6.9%) | 306 (6.7%) |
| 20 to 24 Years | 206 (5.1%) | 175 (3.8%) |
| 25 to 29 Years | 117 (2.9%) | 214 (4.7%) |
| 30 to 34 Years | 251 (6.2%) | 260 (5.7%) |
| 35 to 39 Years | 337 (8.3%) | 333 (7.2%) |
| 40 to 44 Years | 164 (4.1%) | 215 (4.7%) |
| 45 to 49 Years | 372 (9.2%) | 289 (6.3%) |
| 50 to 54 Years | 163 (4.0%) | 199 (4.3%) |
| 55 to 59 Years | 144 (3.5%) | 253 (5.5%) |
| 60 to 64 Years | 313 (7.7%) | 333 (7.2%) |
| 65 to 69 Years | 244 (6.0%) | 330 (7.2%) |
| 70 to 74 Years | 291 (7.2%) | 167 (3.6%) |
| 75 to 79 Years | 167 (4.1%) | 134 (2.9%) |
| 80 to 84 Years | 81 (2.0%) | 104 (2.3%) |
| 85 Years and over | 95 (2.3%) | 440 (9.6%) |
| Total | 4,054 (100.0%) | 4,595 (100.0%) |
Families and Households in Lihue
Median Family Size in Lihue
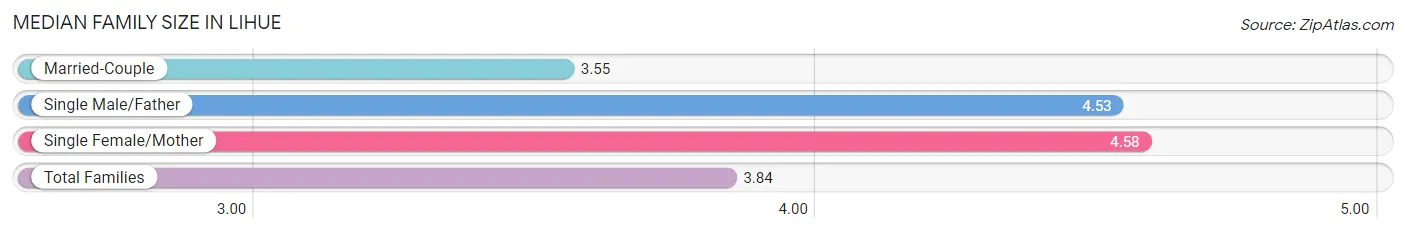
The median family size in Lihue is 3.84 persons per family, with single female/mother families (364 | 20.2%) accounting for the largest median family size of 4.58 persons per family. On the other hand, married-couple families (1,286 | 71.4%) represent the smallest median family size with 3.55 persons per family.
| Family Type | # Families | Family Size |
| Married-Couple | 1,286 (71.4%) | 3.55 |
| Single Male/Father | 151 (8.4%) | 4.53 |
| Single Female/Mother | 364 (20.2%) | 4.58 |
| Total Families | 1,801 (100.0%) | 3.84 |
Median Household Size in Lihue
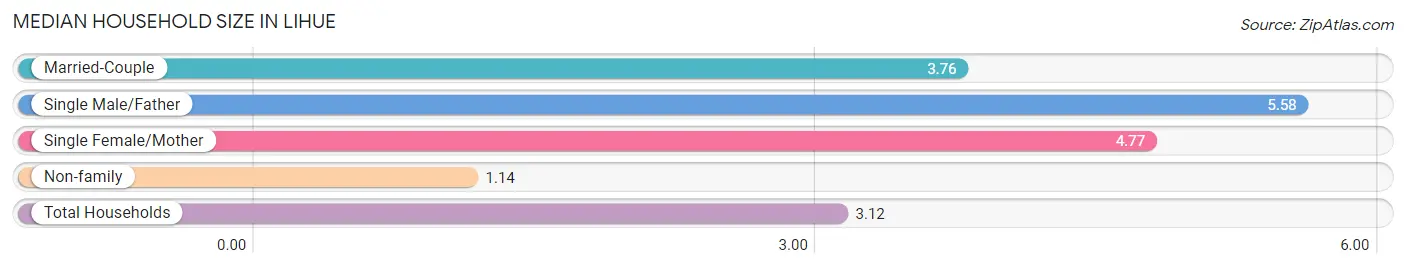
The median household size in Lihue is 3.12 persons per household, with single male/father households (151 | 5.6%) accounting for the largest median household size of 5.58 persons per household. non-family households (913 | 33.6%) represent the smallest median household size with 1.14 persons per household.
| Household Type | # Households | Household Size |
| Married-Couple | 1,286 (47.4%) | 3.76 |
| Single Male/Father | 151 (5.6%) | 5.58 |
| Single Female/Mother | 364 (13.4%) | 4.77 |
| Non-family | 913 (33.6%) | 1.14 |
| Total Households | 2,714 (100.0%) | 3.12 |
Household Size by Marriage Status in Lihue
Out of a total of 2,714 households in Lihue, 1,801 (66.4%) are family households, while 913 (33.6%) are nonfamily households. The most numerous type of family households are 2-person households, comprising 600, and the most common type of nonfamily households are 1-person households, comprising 827.
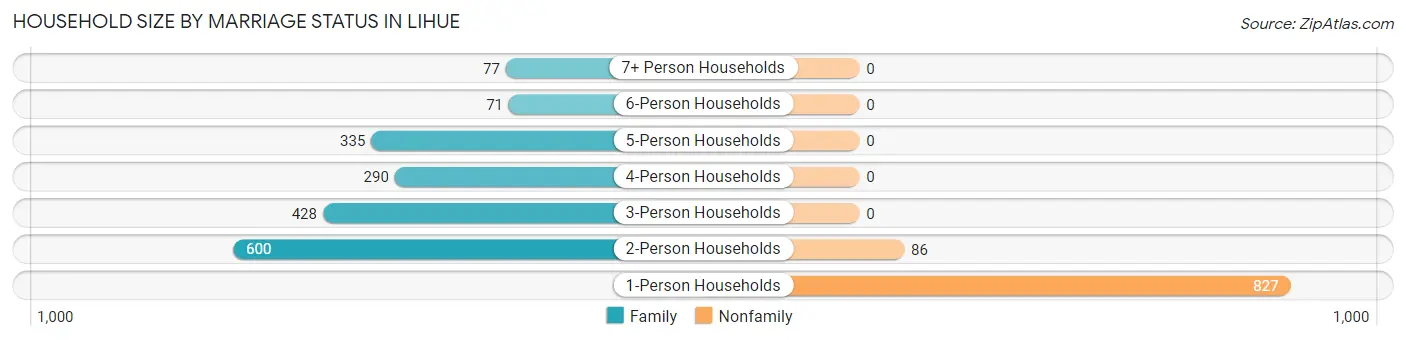
| Household Size | Family Households | Nonfamily Households |
| 1-Person Households | - | 827 (30.5%) |
| 2-Person Households | 600 (22.1%) | 86 (3.2%) |
| 3-Person Households | 428 (15.8%) | 0 (0.0%) |
| 4-Person Households | 290 (10.7%) | 0 (0.0%) |
| 5-Person Households | 335 (12.3%) | 0 (0.0%) |
| 6-Person Households | 71 (2.6%) | 0 (0.0%) |
| 7+ Person Households | 77 (2.8%) | 0 (0.0%) |
| Total | 1,801 (66.4%) | 913 (33.6%) |
Female Fertility in Lihue
Fertility by Age in Lihue
Average fertility rate in Lihue is 75.0 births per 1,000 women. Women in the age bracket of 35 to 50 years have the highest fertility rate with 114.0 births per 1,000 women. Women in the age bracket of 35 to 50 years acount for 70.4% of all women with births.
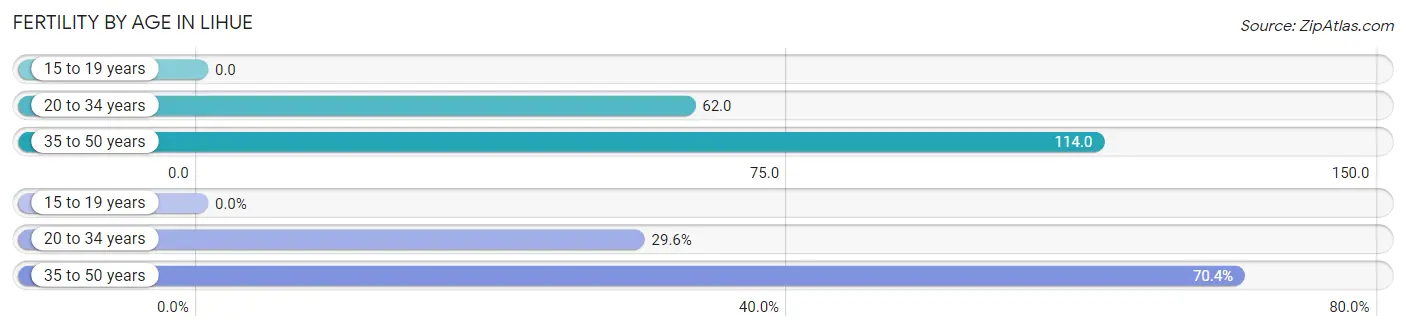
| Age Bracket | Women with Births | Births / 1,000 Women |
| 15 to 19 years | 0 (0.0%) | 0.0 |
| 20 to 34 years | 40 (29.6%) | 62.0 |
| 35 to 50 years | 95 (70.4%) | 114.0 |
| Total | 135 (100.0%) | 75.0 |
Fertility by Age by Marriage Status in Lihue
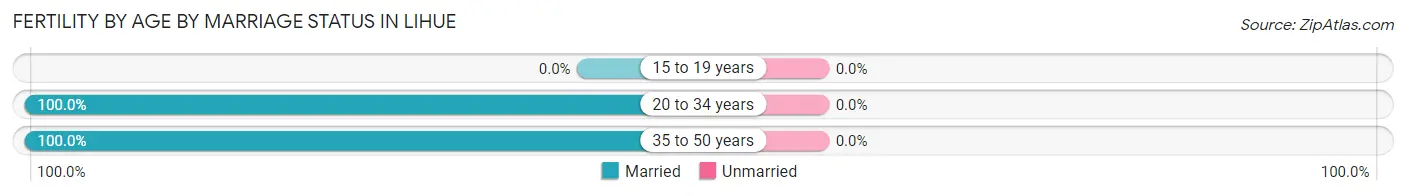
| Age Bracket | Married | Unmarried |
| 15 to 19 years | 0 (0.0%) | 0 (0.0%) |
| 20 to 34 years | 40 (100.0%) | 0 (0.0%) |
| 35 to 50 years | 95 (100.0%) | 0 (0.0%) |
| Total | 135 (100.0%) | 0 (0.0%) |
Fertility by Education in Lihue
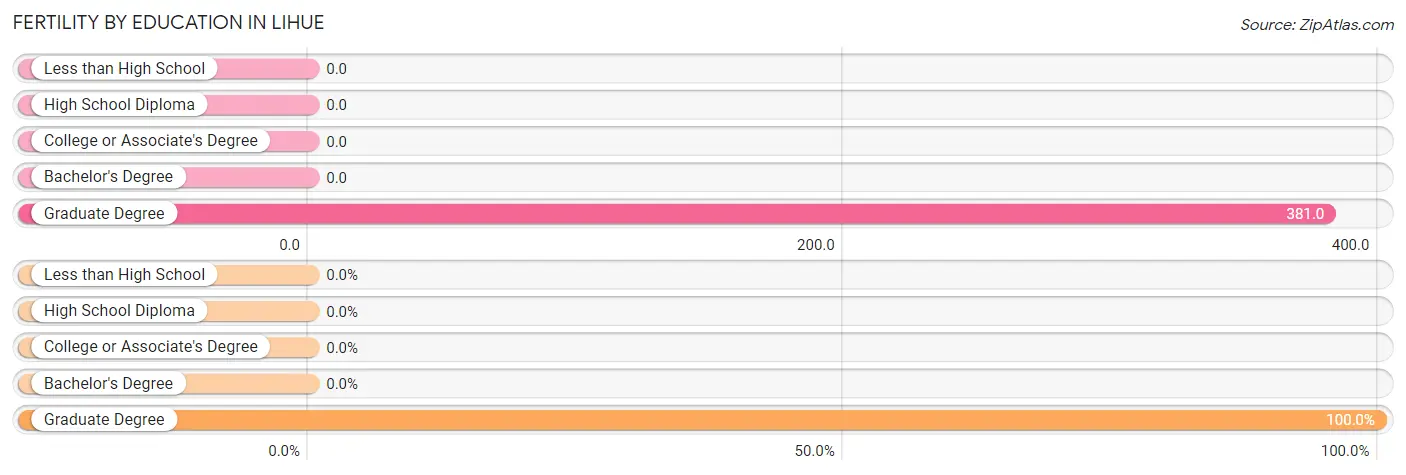
| Educational Attainment | Women with Births | Births / 1,000 Women |
| Less than High School | 0 (0.0%) | 0.0 |
| High School Diploma | 0 (0.0%) | 0.0 |
| College or Associate's Degree | 0 (0.0%) | 0.0 |
| Bachelor's Degree | 0 (0.0%) | 0.0 |
| Graduate Degree | 135 (100.0%) | 381.0 |
| Total | 135 (100.0%) | 75.0 |
Fertility by Education by Marriage Status in Lihue
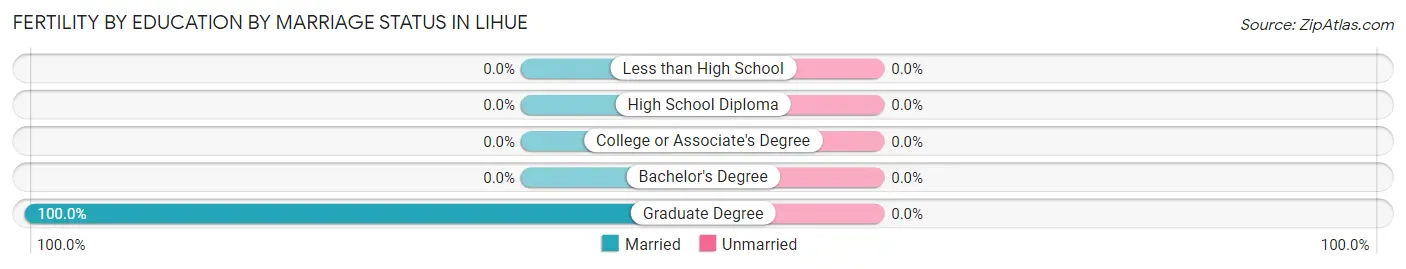
| Educational Attainment | Married | Unmarried |
| Less than High School | 0 (0.0%) | 0 (0.0%) |
| High School Diploma | 0 (0.0%) | 0 (0.0%) |
| College or Associate's Degree | 0 (0.0%) | 0 (0.0%) |
| Bachelor's Degree | 0 (0.0%) | 0 (0.0%) |
| Graduate Degree | 135 (100.0%) | 0 (0.0%) |
| Total | 135 (100.0%) | 0 (0.0%) |
Employment Characteristics in Lihue
Employment by Class of Employer in Lihue
Among the 4,031 employed individuals in Lihue, private company employees (2,522 | 62.6%), local government employees (383 | 9.5%), and not-for-profit organizations (365 | 9.0%) make up the most common classes of employment.
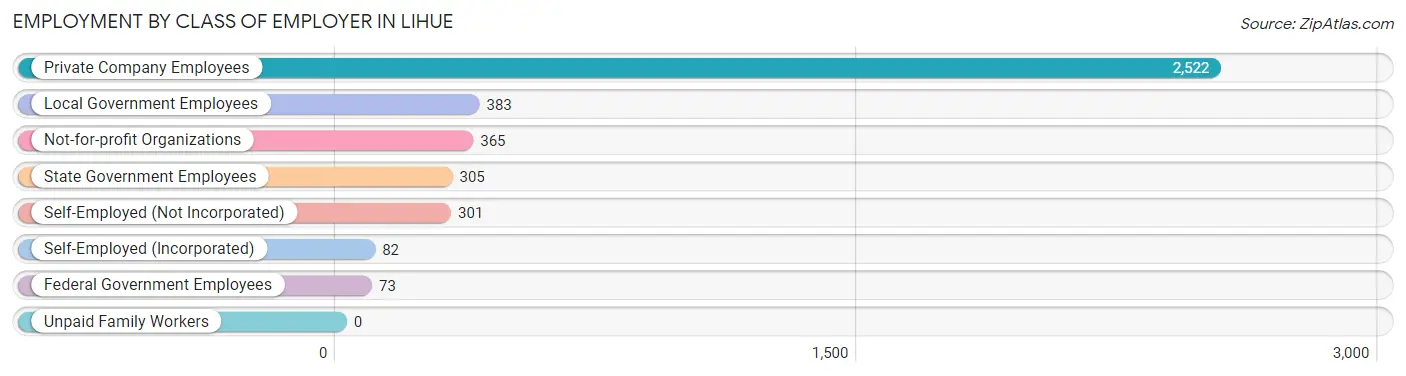
| Employer Class | # Employees | % Employees |
| Private Company Employees | 2,522 | 62.6% |
| Self-Employed (Incorporated) | 82 | 2.0% |
| Self-Employed (Not Incorporated) | 301 | 7.5% |
| Not-for-profit Organizations | 365 | 9.0% |
| Local Government Employees | 383 | 9.5% |
| State Government Employees | 305 | 7.6% |
| Federal Government Employees | 73 | 1.8% |
| Unpaid Family Workers | 0 | 0.0% |
| Total | 4,031 | 100.0% |
Employment Status by Age in Lihue
According to the labor force statistics for Lihue, out of the total population over 16 years of age (6,872), 60.9% or 4,185 individuals are in the labor force, with 1.1% or 46 of them unemployed. The age group with the highest labor force participation rate is 25 to 29 years, with 93.4% or 309 individuals in the labor force. Within the labor force, the 16 to 19 years age range has the highest percentage of unemployed individuals, with 17.4% or 24 of them being unemployed.
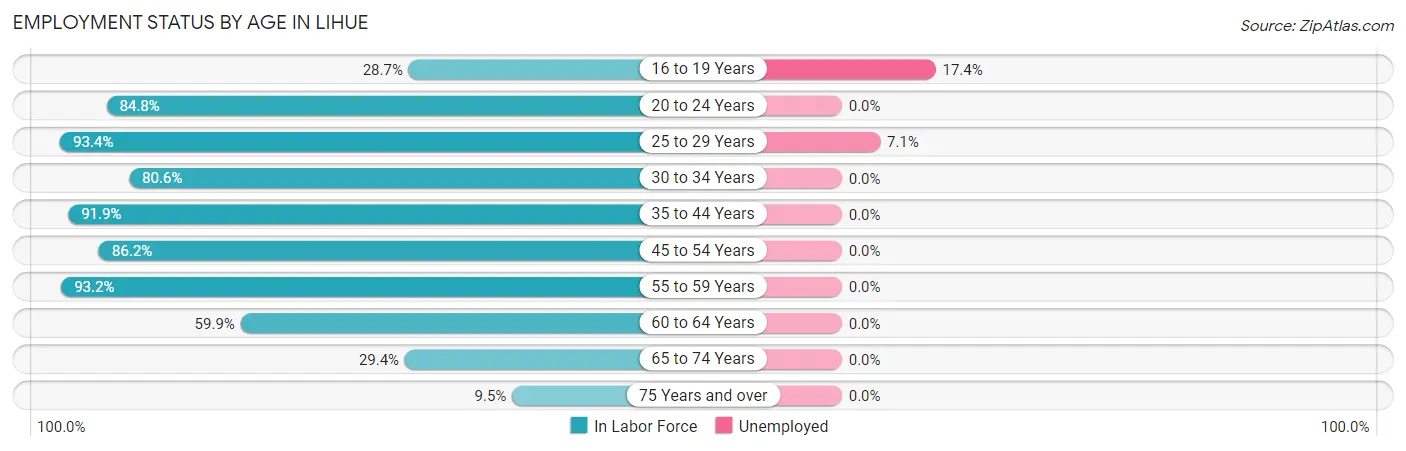
| Age Bracket | In Labor Force | Unemployed |
| 16 to 19 Years | 138 (28.7%) | 24 (17.4%) |
| 20 to 24 Years | 323 (84.8%) | 0 (0.0%) |
| 25 to 29 Years | 309 (93.4%) | 22 (7.1%) |
| 30 to 34 Years | 412 (80.6%) | 0 (0.0%) |
| 35 to 44 Years | 964 (91.9%) | 0 (0.0%) |
| 45 to 54 Years | 882 (86.2%) | 0 (0.0%) |
| 55 to 59 Years | 370 (93.2%) | 0 (0.0%) |
| 60 to 64 Years | 387 (59.9%) | 0 (0.0%) |
| 65 to 74 Years | 303 (29.4%) | 0 (0.0%) |
| 75 Years and over | 97 (9.5%) | 0 (0.0%) |
| Total | 4,185 (60.9%) | 46 (1.1%) |
Employment Status by Educational Attainment in Lihue
According to labor force statistics for Lihue, 84.0% of individuals (3,324) out of the total population between 25 and 64 years of age (3,957) are in the labor force, with 0.7% or 23 of them being unemployed. The group with the highest labor force participation rate are those with the educational attainment of less than high school, with 100.0% or 165 individuals in the labor force. Within the labor force, individuals with college / associate degree education have the highest percentage of unemployment, with 2.0% or 22 of them being unemployed.
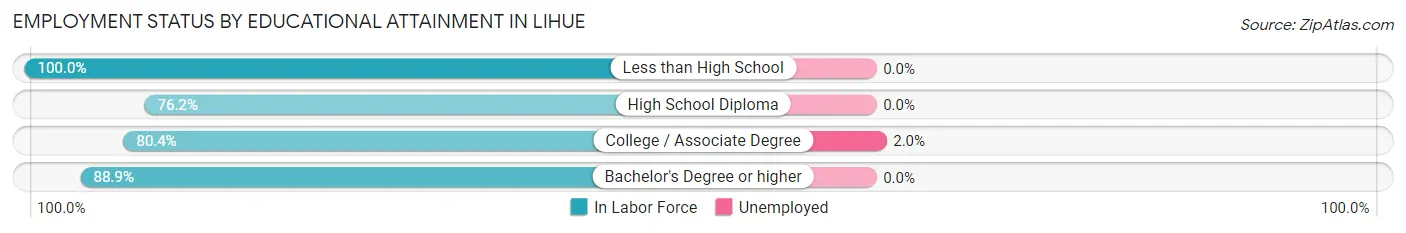
| Educational Attainment | In Labor Force | Unemployed |
| Less than High School | 165 (100.0%) | 0 (0.0%) |
| High School Diploma | 578 (76.2%) | 0 (0.0%) |
| College / Associate Degree | 1,093 (80.4%) | 27 (2.0%) |
| Bachelor's Degree or higher | 1,488 (88.9%) | 0 (0.0%) |
| Total | 3,324 (84.0%) | 28 (0.7%) |
Employment Occupations by Sex in Lihue
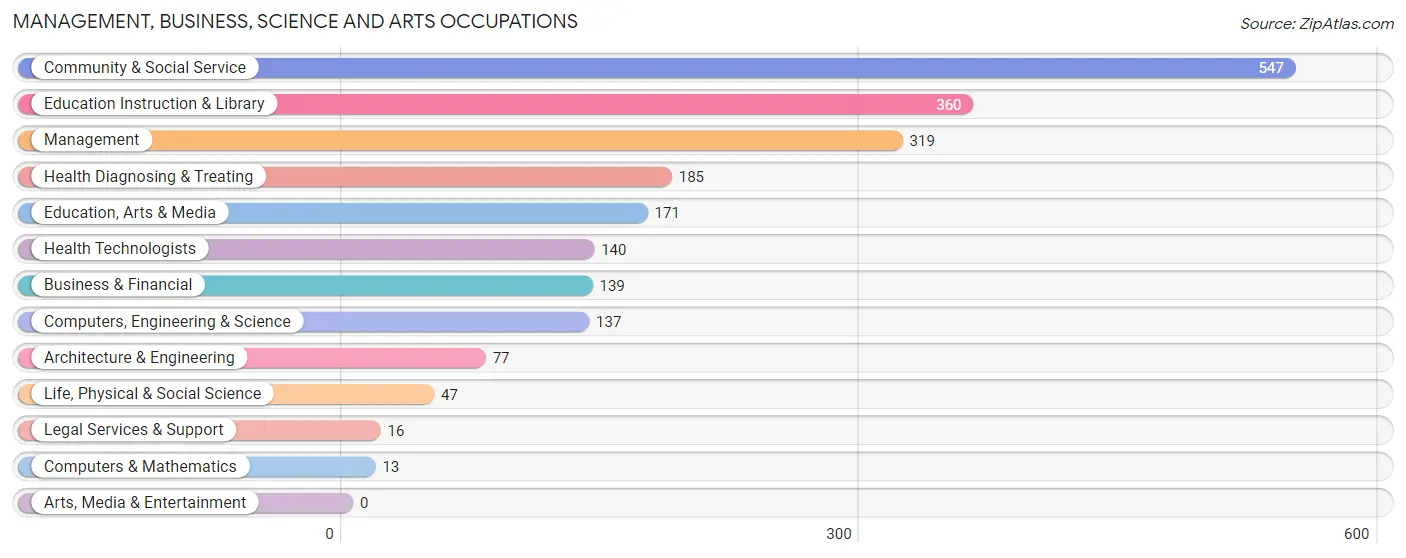
Management, Business, Science and Arts Occupations
The most common Management, Business, Science and Arts occupations in Lihue are Community & Social Service (547 | 13.2%), Education Instruction & Library (360 | 8.7%), Management (319 | 7.7%), Health Diagnosing & Treating (185 | 4.5%), and Education, Arts & Media (171 | 4.1%).
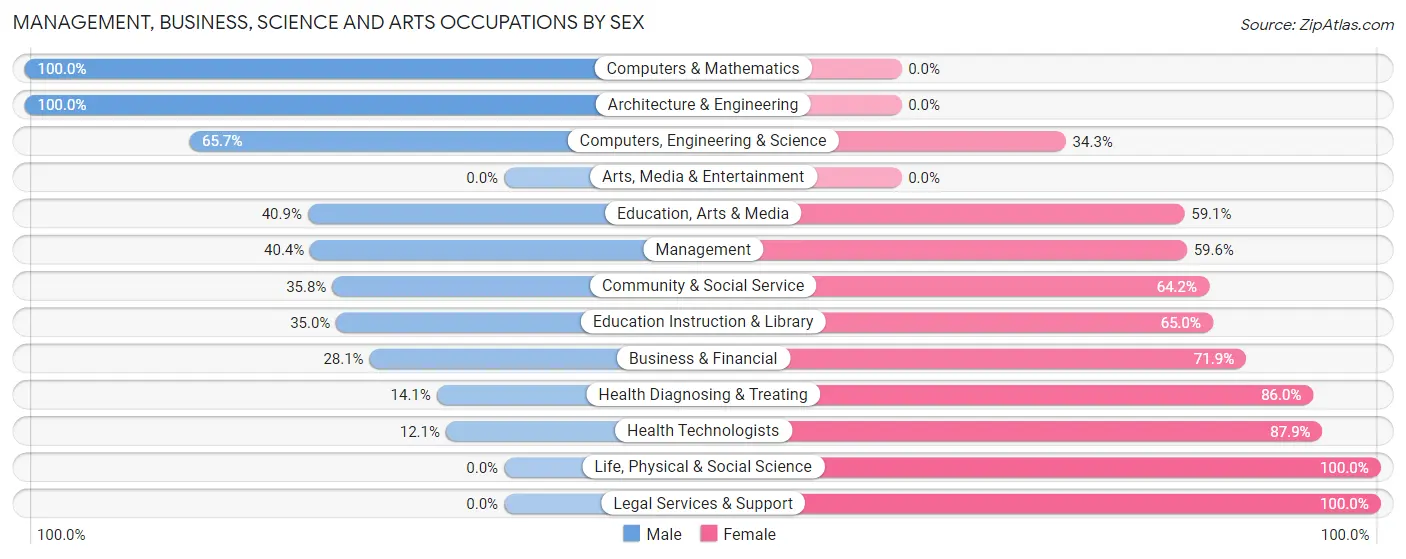
Management, Business, Science and Arts Occupations by Sex
Within the Management, Business, Science and Arts occupations in Lihue, the most male-oriented occupations are Computers & Mathematics (100.0%), Architecture & Engineering (100.0%), and Computers, Engineering & Science (65.7%), while the most female-oriented occupations are Life, Physical & Social Science (100.0%), Legal Services & Support (100.0%), and Health Technologists (87.9%).
| Occupation | Male | Female |
| Management | 129 (40.4%) | 190 (59.6%) |
| Business & Financial | 39 (28.1%) | 100 (71.9%) |
| Computers, Engineering & Science | 90 (65.7%) | 47 (34.3%) |
| Computers & Mathematics | 13 (100.0%) | 0 (0.0%) |
| Architecture & Engineering | 77 (100.0%) | 0 (0.0%) |
| Life, Physical & Social Science | 0 (0.0%) | 47 (100.0%) |
| Community & Social Service | 196 (35.8%) | 351 (64.2%) |
| Education, Arts & Media | 70 (40.9%) | 101 (59.1%) |
| Legal Services & Support | 0 (0.0%) | 16 (100.0%) |
| Education Instruction & Library | 126 (35.0%) | 234 (65.0%) |
| Arts, Media & Entertainment | 0 (0.0%) | 0 (0.0%) |
| Health Diagnosing & Treating | 26 (14.1%) | 159 (86.0%) |
| Health Technologists | 17 (12.1%) | 123 (87.9%) |
| Total (Category) | 480 (36.2%) | 847 (63.8%) |
| Total (Overall) | 1,984 (47.9%) | 2,155 (52.1%) |
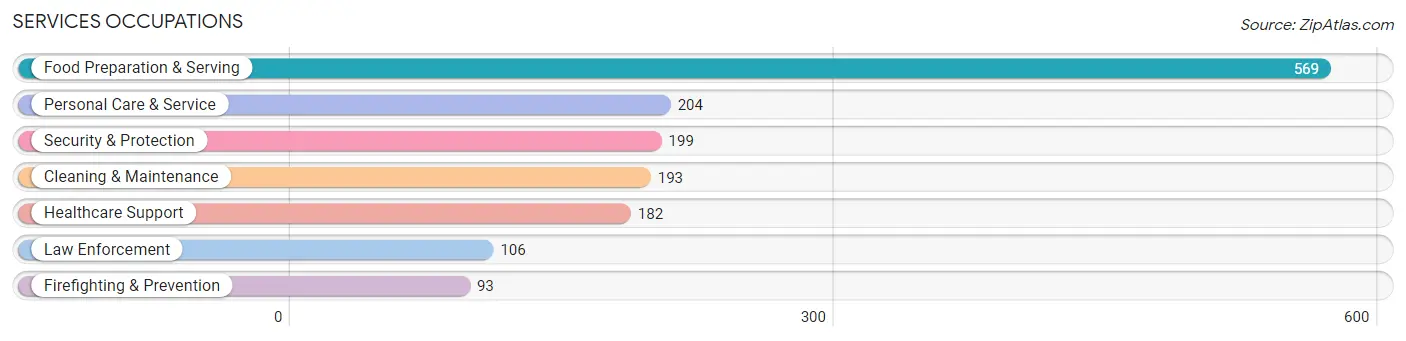
Services Occupations
The most common Services occupations in Lihue are Food Preparation & Serving (569 | 13.8%), Personal Care & Service (204 | 4.9%), Security & Protection (199 | 4.8%), Cleaning & Maintenance (193 | 4.7%), and Healthcare Support (182 | 4.4%).
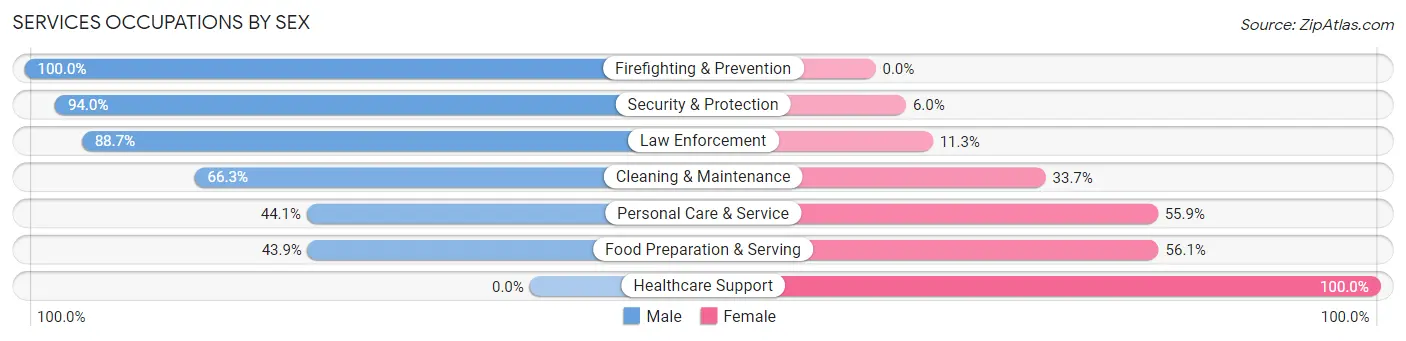
Services Occupations by Sex
Within the Services occupations in Lihue, the most male-oriented occupations are Firefighting & Prevention (100.0%), Security & Protection (94.0%), and Law Enforcement (88.7%), while the most female-oriented occupations are Healthcare Support (100.0%), Food Preparation & Serving (56.1%), and Personal Care & Service (55.9%).
| Occupation | Male | Female |
| Healthcare Support | 0 (0.0%) | 182 (100.0%) |
| Security & Protection | 187 (94.0%) | 12 (6.0%) |
| Firefighting & Prevention | 93 (100.0%) | 0 (0.0%) |
| Law Enforcement | 94 (88.7%) | 12 (11.3%) |
| Food Preparation & Serving | 250 (43.9%) | 319 (56.1%) |
| Cleaning & Maintenance | 128 (66.3%) | 65 (33.7%) |
| Personal Care & Service | 90 (44.1%) | 114 (55.9%) |
| Total (Category) | 655 (48.6%) | 692 (51.4%) |
| Total (Overall) | 1,984 (47.9%) | 2,155 (52.1%) |
Sales and Office Occupations
The most common Sales and Office occupations in Lihue are Sales & Related (618 | 14.9%), and Office & Administration (305 | 7.4%).
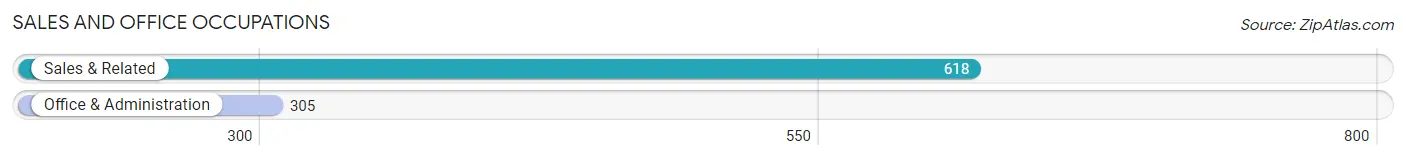
Sales and Office Occupations by Sex
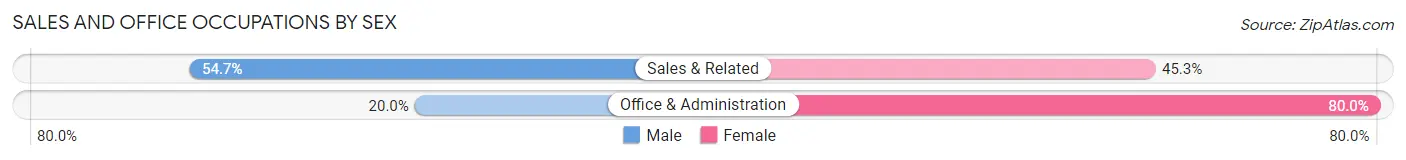
| Occupation | Male | Female |
| Sales & Related | 338 (54.7%) | 280 (45.3%) |
| Office & Administration | 61 (20.0%) | 244 (80.0%) |
| Total (Category) | 399 (43.2%) | 524 (56.8%) |
| Total (Overall) | 1,984 (47.9%) | 2,155 (52.1%) |
Natural Resources, Construction and Maintenance Occupations
The most common Natural Resources, Construction and Maintenance occupations in Lihue are Construction & Extraction (209 | 5.1%), and Installation, Maintenance & Repair (114 | 2.8%).
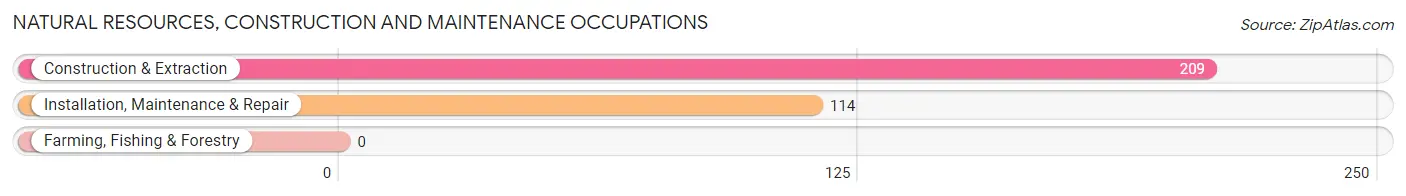
Natural Resources, Construction and Maintenance Occupations by Sex
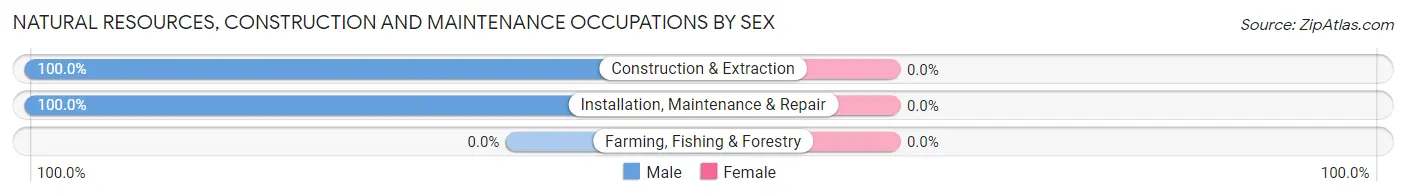
| Occupation | Male | Female |
| Farming, Fishing & Forestry | 0 (0.0%) | 0 (0.0%) |
| Construction & Extraction | 209 (100.0%) | 0 (0.0%) |
| Installation, Maintenance & Repair | 114 (100.0%) | 0 (0.0%) |
| Total (Category) | 323 (100.0%) | 0 (0.0%) |
| Total (Overall) | 1,984 (47.9%) | 2,155 (52.1%) |
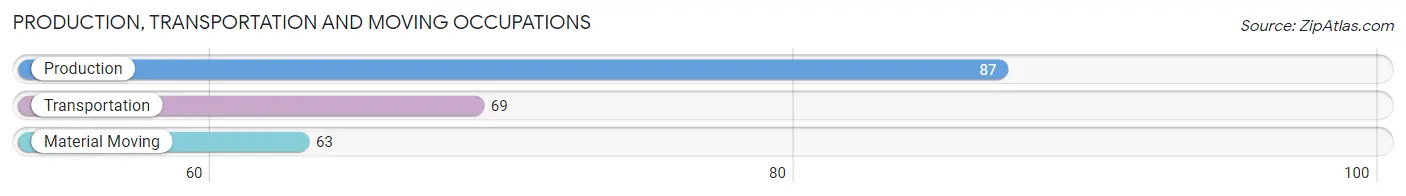
Production, Transportation and Moving Occupations
The most common Production, Transportation and Moving occupations in Lihue are Production (87 | 2.1%), Transportation (69 | 1.7%), and Material Moving (63 | 1.5%).
Production, Transportation and Moving Occupations by Sex
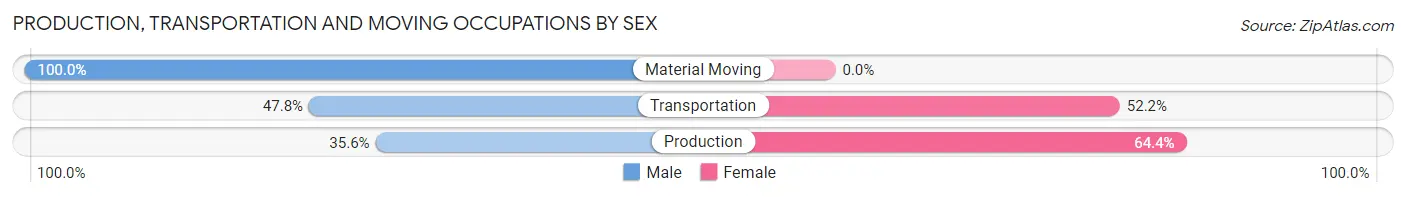
| Occupation | Male | Female |
| Production | 31 (35.6%) | 56 (64.4%) |
| Transportation | 33 (47.8%) | 36 (52.2%) |
| Material Moving | 63 (100.0%) | 0 (0.0%) |
| Total (Category) | 127 (58.0%) | 92 (42.0%) |
| Total (Overall) | 1,984 (47.9%) | 2,155 (52.1%) |
Employment Industries by Sex in Lihue
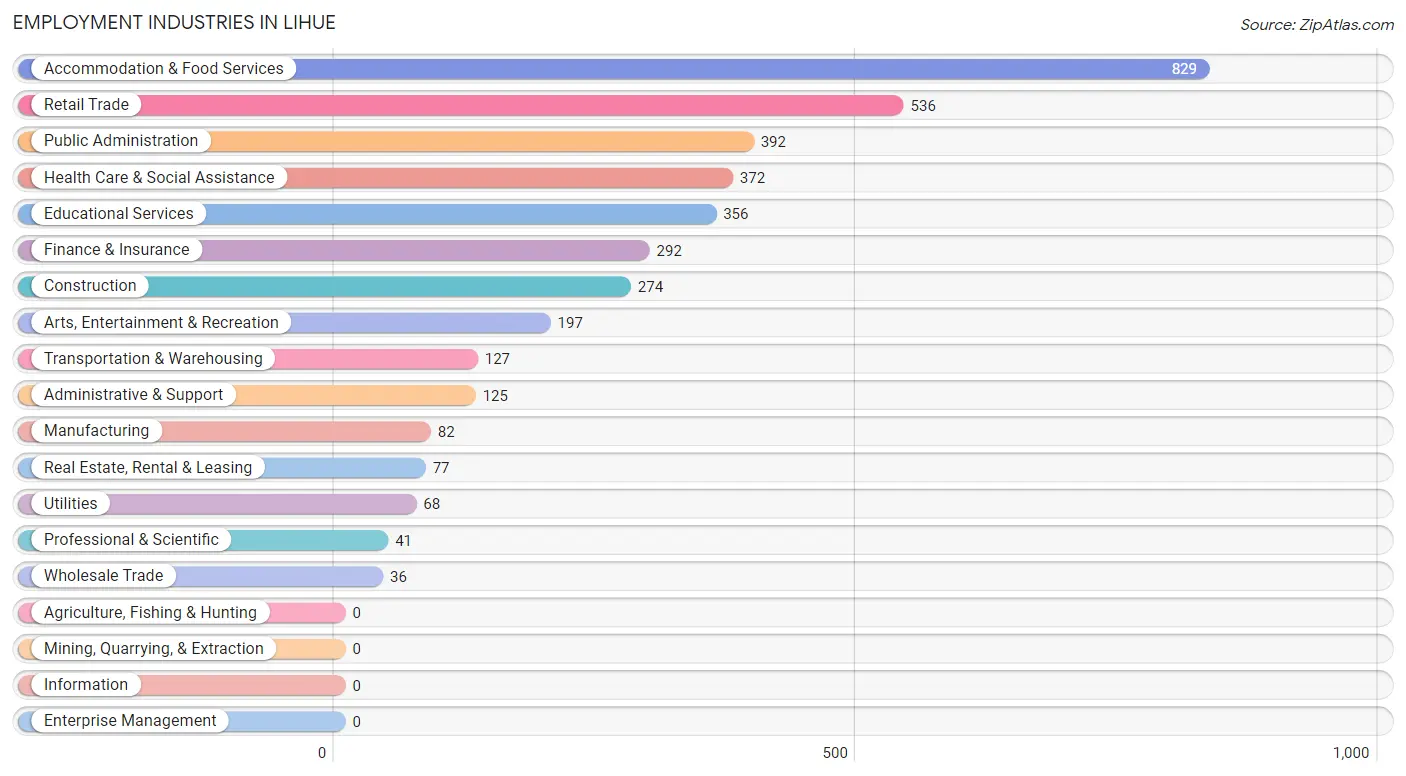
Employment Industries in Lihue
The major employment industries in Lihue include Accommodation & Food Services (829 | 20.0%), Retail Trade (536 | 13.0%), Public Administration (392 | 9.5%), Health Care & Social Assistance (372 | 9.0%), and Educational Services (356 | 8.6%).
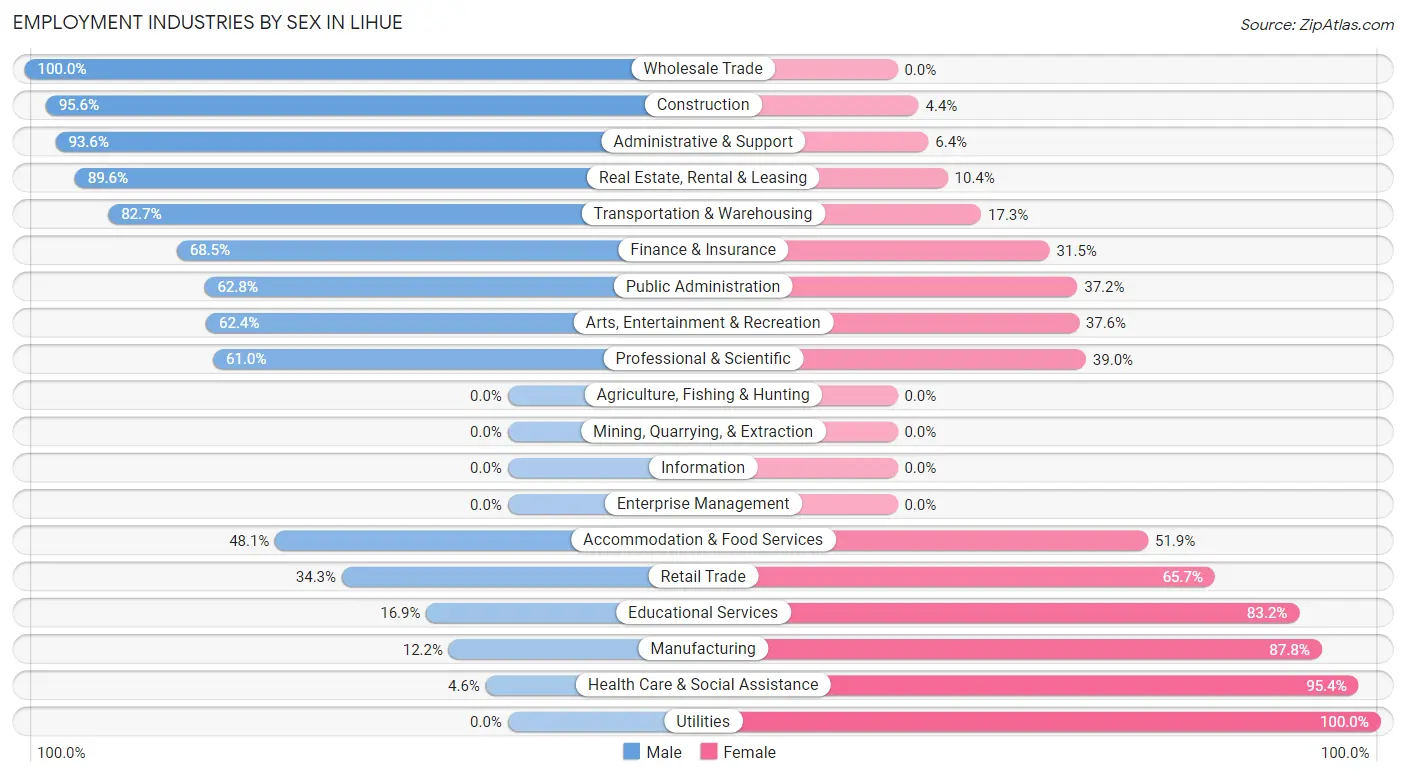
Employment Industries by Sex in Lihue
The Lihue industries that see more men than women are Wholesale Trade (100.0%), Construction (95.6%), and Administrative & Support (93.6%), whereas the industries that tend to have a higher number of women are Utilities (100.0%), Health Care & Social Assistance (95.4%), and Manufacturing (87.8%).
| Industry | Male | Female |
| Agriculture, Fishing & Hunting | 0 (0.0%) | 0 (0.0%) |
| Mining, Quarrying, & Extraction | 0 (0.0%) | 0 (0.0%) |
| Construction | 262 (95.6%) | 12 (4.4%) |
| Manufacturing | 10 (12.2%) | 72 (87.8%) |
| Wholesale Trade | 36 (100.0%) | 0 (0.0%) |
| Retail Trade | 184 (34.3%) | 352 (65.7%) |
| Transportation & Warehousing | 105 (82.7%) | 22 (17.3%) |
| Utilities | 0 (0.0%) | 68 (100.0%) |
| Information | 0 (0.0%) | 0 (0.0%) |
| Finance & Insurance | 200 (68.5%) | 92 (31.5%) |
| Real Estate, Rental & Leasing | 69 (89.6%) | 8 (10.4%) |
| Professional & Scientific | 25 (61.0%) | 16 (39.0%) |
| Enterprise Management | 0 (0.0%) | 0 (0.0%) |
| Administrative & Support | 117 (93.6%) | 8 (6.4%) |
| Educational Services | 60 (16.9%) | 296 (83.2%) |
| Health Care & Social Assistance | 17 (4.6%) | 355 (95.4%) |
| Arts, Entertainment & Recreation | 123 (62.4%) | 74 (37.6%) |
| Accommodation & Food Services | 399 (48.1%) | 430 (51.9%) |
| Public Administration | 246 (62.8%) | 146 (37.2%) |
| Total | 1,984 (47.9%) | 2,155 (52.1%) |
Education in Lihue
School Enrollment in Lihue
The most common levels of schooling among the 2,055 students in Lihue are middle school (594 | 28.9%), high school (504 | 24.5%), and elementary school (418 | 20.3%).
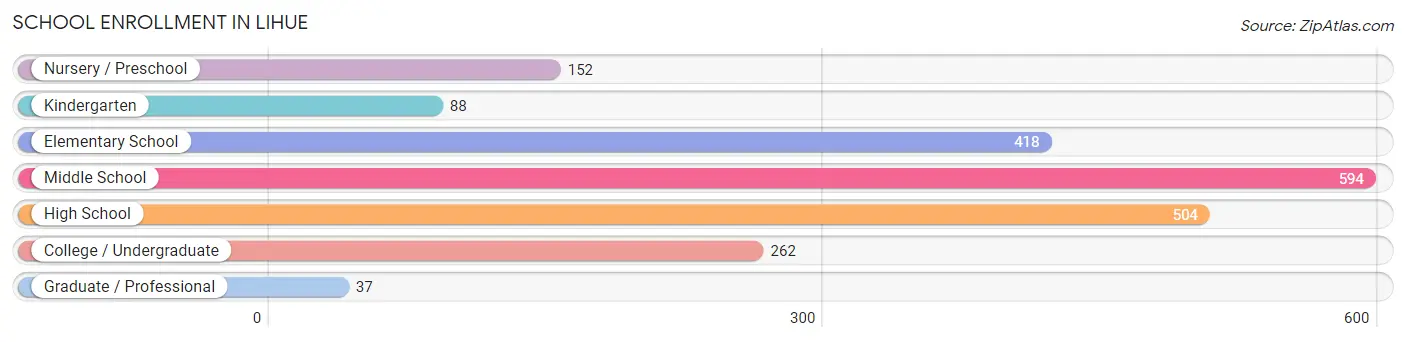
| School Level | # Students | % Students |
| Nursery / Preschool | 152 | 7.4% |
| Kindergarten | 88 | 4.3% |
| Elementary School | 418 | 20.3% |
| Middle School | 594 | 28.9% |
| High School | 504 | 24.5% |
| College / Undergraduate | 262 | 12.8% |
| Graduate / Professional | 37 | 1.8% |
| Total | 2,055 | 100.0% |
School Enrollment by Age by Funding Source in Lihue
Out of a total of 2,055 students who are enrolled in schools in Lihue, 224 (10.9%) attend a private institution, while the remaining 1,831 (89.1%) are enrolled in public schools. The age group of 35 years and over has the highest likelihood of being enrolled in private schools, with 37 (23.3% in the age bracket) enrolled. Conversely, the age group of 5 to 9 year old has the lowest likelihood of being enrolled in a private school, with 506 (100.0% in the age bracket) attending a public institution.
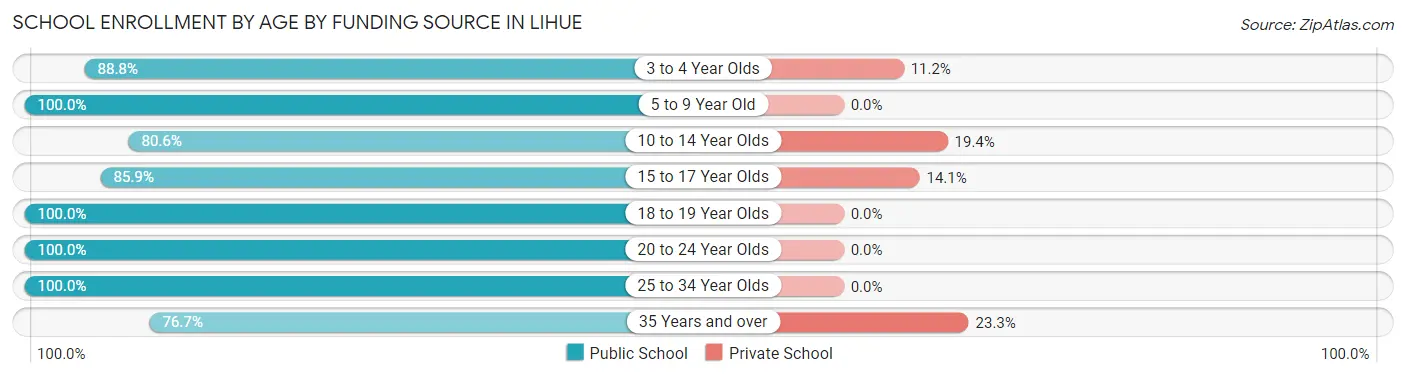
| Age Bracket | Public School | Private School |
| 3 to 4 Year Olds | 135 (88.8%) | 17 (11.2%) |
| 5 to 9 Year Old | 506 (100.0%) | 0 (0.0%) |
| 10 to 14 Year Olds | 479 (80.6%) | 115 (19.4%) |
| 15 to 17 Year Olds | 334 (85.9%) | 55 (14.1%) |
| 18 to 19 Year Olds | 160 (100.0%) | 0 (0.0%) |
| 20 to 24 Year Olds | 80 (100.0%) | 0 (0.0%) |
| 25 to 34 Year Olds | 15 (100.0%) | 0 (0.0%) |
| 35 Years and over | 122 (76.7%) | 37 (23.3%) |
| Total | 1,831 (89.1%) | 224 (10.9%) |
Educational Attainment by Field of Study in Lihue
Business (524 | 21.1%), education (469 | 18.9%), social sciences (227 | 9.1%), bio, nature & agricultural (212 | 8.6%), and science & technology (205 | 8.3%) are the most common fields of study among 2,480 individuals in Lihue who have obtained a bachelor's degree or higher.
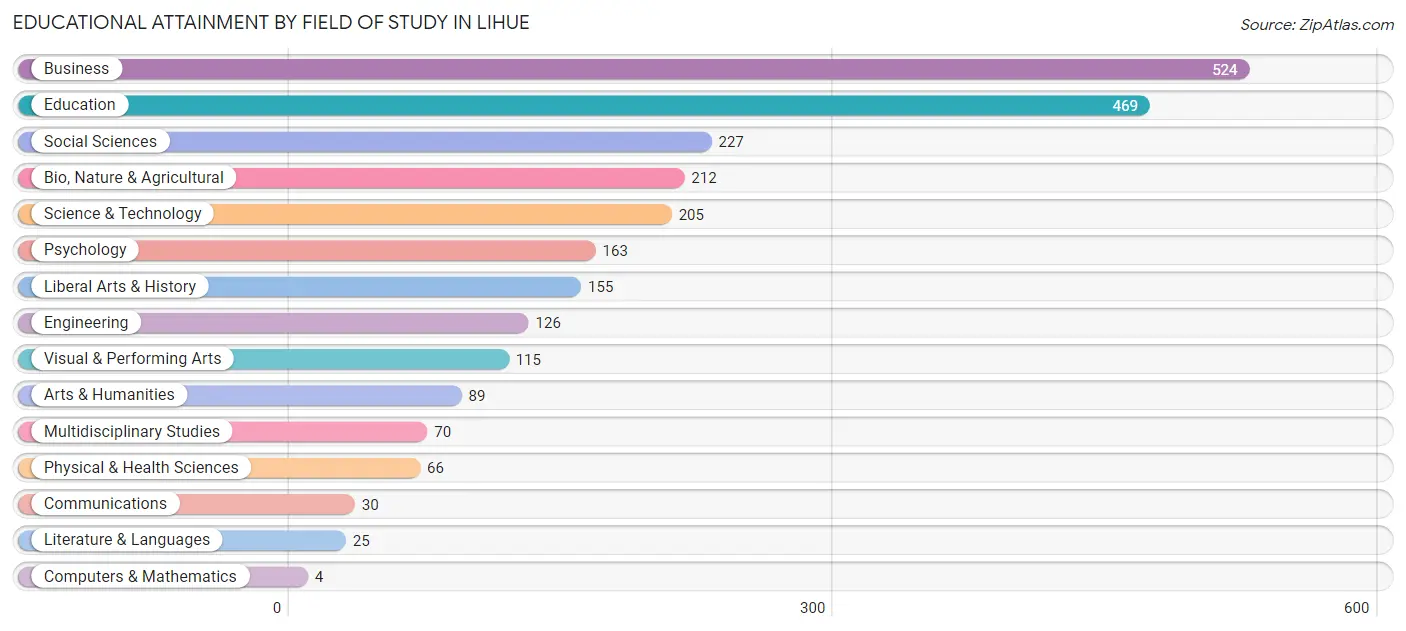
| Field of Study | # Graduates | % Graduates |
| Computers & Mathematics | 4 | 0.2% |
| Bio, Nature & Agricultural | 212 | 8.6% |
| Physical & Health Sciences | 66 | 2.7% |
| Psychology | 163 | 6.6% |
| Social Sciences | 227 | 9.1% |
| Engineering | 126 | 5.1% |
| Multidisciplinary Studies | 70 | 2.8% |
| Science & Technology | 205 | 8.3% |
| Business | 524 | 21.1% |
| Education | 469 | 18.9% |
| Literature & Languages | 25 | 1.0% |
| Liberal Arts & History | 155 | 6.2% |
| Visual & Performing Arts | 115 | 4.6% |
| Communications | 30 | 1.2% |
| Arts & Humanities | 89 | 3.6% |
| Total | 2,480 | 100.0% |
Transportation & Commute in Lihue
Vehicle Availability by Sex in Lihue
The most prevalent vehicle ownership categories in Lihue are males with 3 vehicles (840, accounting for 42.8%) and females with 3 vehicles (664, making up 41.1%).
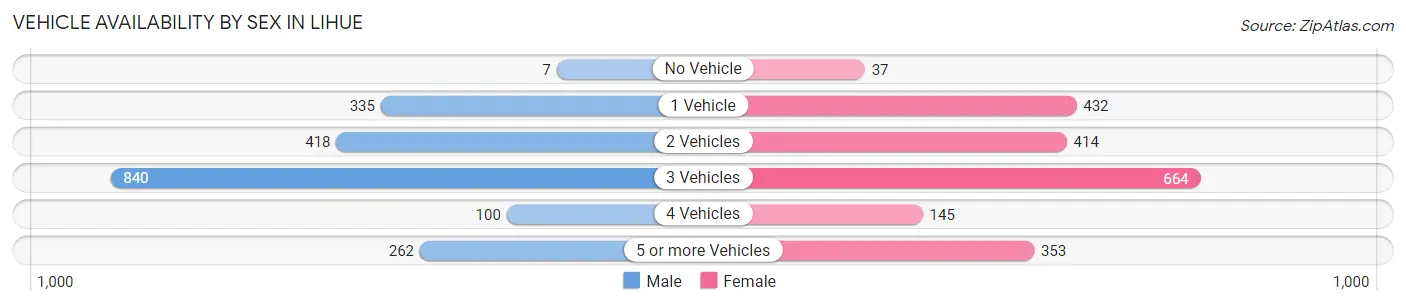
| Vehicles Available | Male | Female |
| No Vehicle | 7 (0.4%) | 37 (1.8%) |
| 1 Vehicle | 335 (17.1%) | 432 (21.1%) |
| 2 Vehicles | 418 (21.3%) | 414 (20.2%) |
| 3 Vehicles | 840 (42.8%) | 664 (32.5%) |
| 4 Vehicles | 100 (5.1%) | 145 (7.1%) |
| 5 or more Vehicles | 262 (13.4%) | 353 (17.3%) |
| Total | 1,962 (100.0%) | 2,045 (100.0%) |
Commute Time in Lihue
The most frequently occuring commute durations in Lihue are 5 to 9 minutes (1,054 commuters, 28.5%), 10 to 14 minutes (596 commuters, 16.1%), and 15 to 19 minutes (542 commuters, 14.7%).
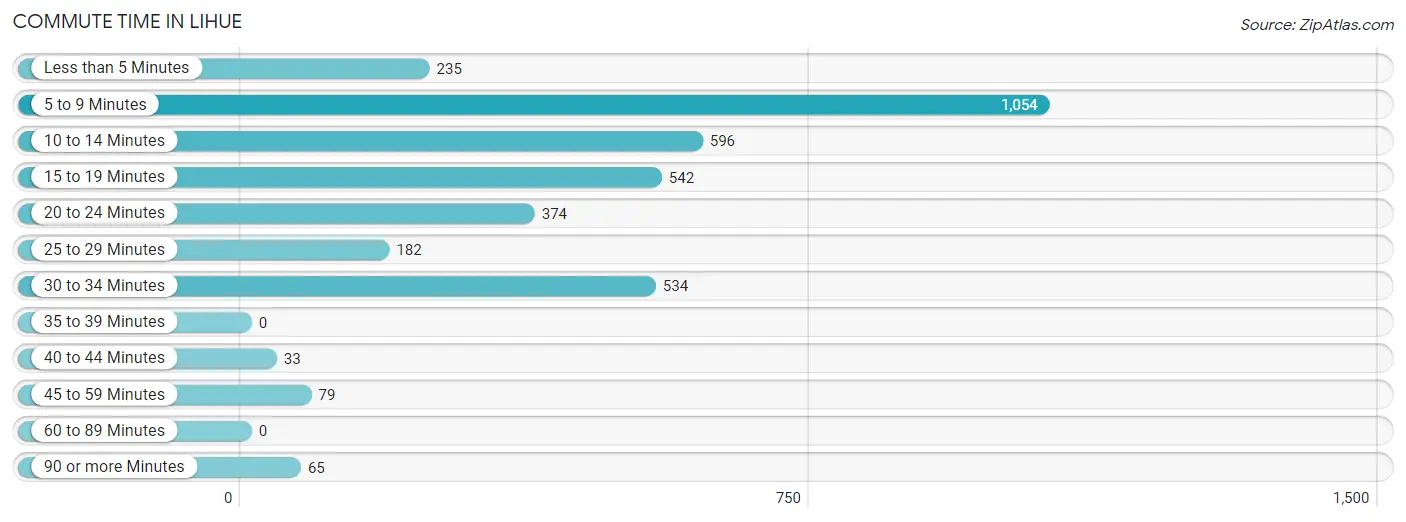
| Commute Time | # Commuters | % Commuters |
| Less than 5 Minutes | 235 | 6.4% |
| 5 to 9 Minutes | 1,054 | 28.5% |
| 10 to 14 Minutes | 596 | 16.1% |
| 15 to 19 Minutes | 542 | 14.7% |
| 20 to 24 Minutes | 374 | 10.1% |
| 25 to 29 Minutes | 182 | 4.9% |
| 30 to 34 Minutes | 534 | 14.5% |
| 35 to 39 Minutes | 0 | 0.0% |
| 40 to 44 Minutes | 33 | 0.9% |
| 45 to 59 Minutes | 79 | 2.1% |
| 60 to 89 Minutes | 0 | 0.0% |
| 90 or more Minutes | 65 | 1.8% |
Commute Time by Sex in Lihue
The most common commute times in Lihue are 5 to 9 minutes (616 commuters, 34.1%) for males and 10 to 14 minutes (454 commuters, 24.1%) for females.
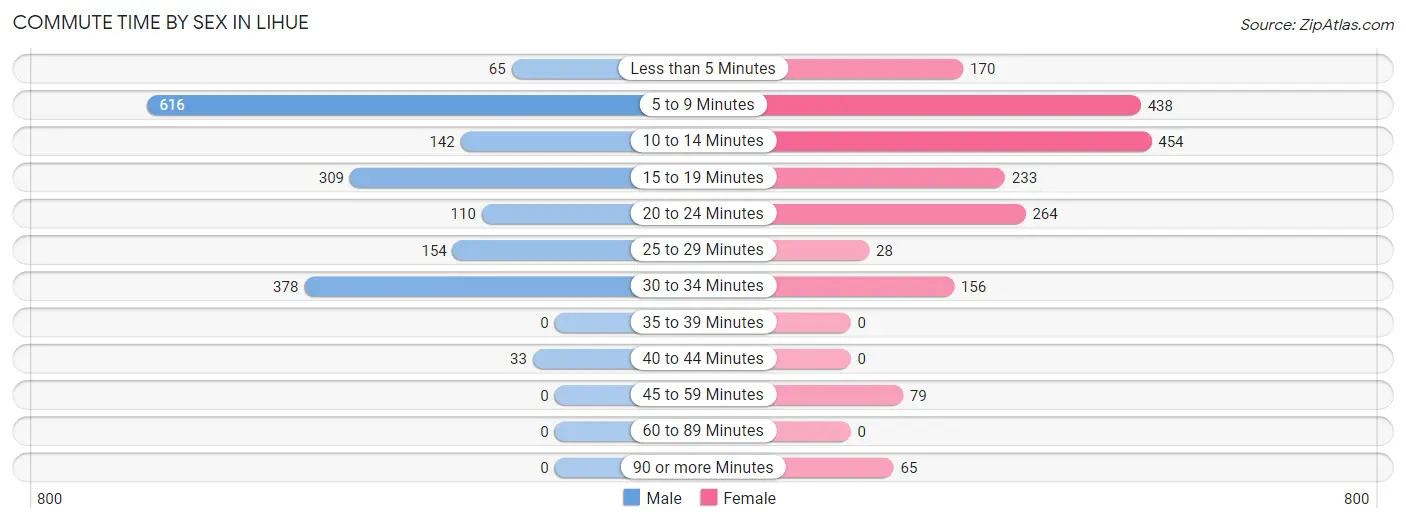
| Commute Time | Male | Female |
| Less than 5 Minutes | 65 (3.6%) | 170 (9.0%) |
| 5 to 9 Minutes | 616 (34.1%) | 438 (23.2%) |
| 10 to 14 Minutes | 142 (7.9%) | 454 (24.1%) |
| 15 to 19 Minutes | 309 (17.1%) | 233 (12.3%) |
| 20 to 24 Minutes | 110 (6.1%) | 264 (14.0%) |
| 25 to 29 Minutes | 154 (8.5%) | 28 (1.5%) |
| 30 to 34 Minutes | 378 (20.9%) | 156 (8.3%) |
| 35 to 39 Minutes | 0 (0.0%) | 0 (0.0%) |
| 40 to 44 Minutes | 33 (1.8%) | 0 (0.0%) |
| 45 to 59 Minutes | 0 (0.0%) | 79 (4.2%) |
| 60 to 89 Minutes | 0 (0.0%) | 0 (0.0%) |
| 90 or more Minutes | 0 (0.0%) | 65 (3.4%) |
Time of Departure to Work by Sex in Lihue
The most frequent times of departure to work in Lihue are 7:00 AM to 7:29 AM (364, 20.1%) for males and 7:00 AM to 7:29 AM (478, 25.3%) for females.
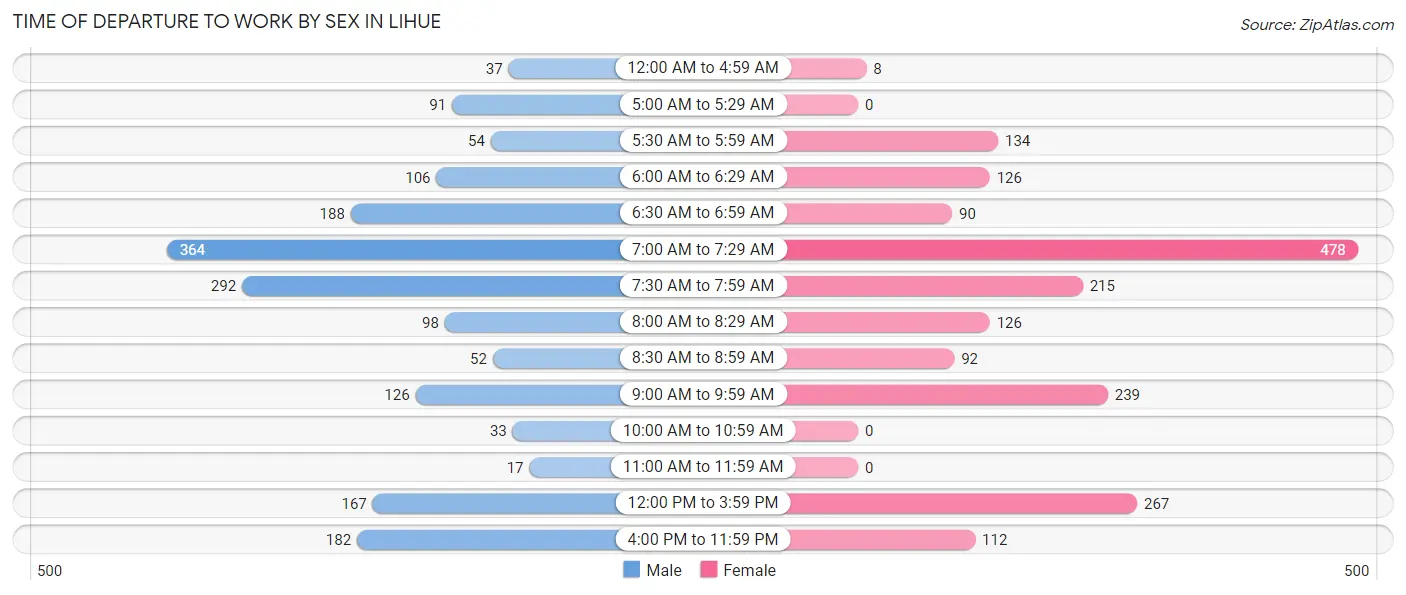
| Time of Departure | Male | Female |
| 12:00 AM to 4:59 AM | 37 (2.1%) | 8 (0.4%) |
| 5:00 AM to 5:29 AM | 91 (5.0%) | 0 (0.0%) |
| 5:30 AM to 5:59 AM | 54 (3.0%) | 134 (7.1%) |
| 6:00 AM to 6:29 AM | 106 (5.9%) | 126 (6.7%) |
| 6:30 AM to 6:59 AM | 188 (10.4%) | 90 (4.8%) |
| 7:00 AM to 7:29 AM | 364 (20.1%) | 478 (25.3%) |
| 7:30 AM to 7:59 AM | 292 (16.2%) | 215 (11.4%) |
| 8:00 AM to 8:29 AM | 98 (5.4%) | 126 (6.7%) |
| 8:30 AM to 8:59 AM | 52 (2.9%) | 92 (4.9%) |
| 9:00 AM to 9:59 AM | 126 (7.0%) | 239 (12.7%) |
| 10:00 AM to 10:59 AM | 33 (1.8%) | 0 (0.0%) |
| 11:00 AM to 11:59 AM | 17 (0.9%) | 0 (0.0%) |
| 12:00 PM to 3:59 PM | 167 (9.2%) | 267 (14.1%) |
| 4:00 PM to 11:59 PM | 182 (10.1%) | 112 (5.9%) |
| Total | 1,807 (100.0%) | 1,887 (100.0%) |
Housing Occupancy in Lihue
Occupancy by Ownership in Lihue
Of the total 2,714 dwellings in Lihue, owner-occupied units account for 1,625 (59.9%), while renter-occupied units make up 1,089 (40.1%).
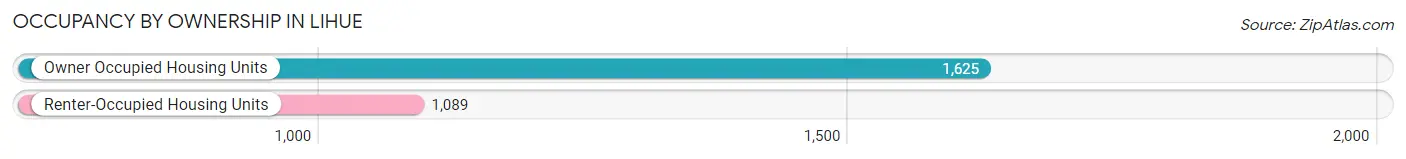
| Occupancy | # Housing Units | % Housing Units |
| Owner Occupied Housing Units | 1,625 | 59.9% |
| Renter-Occupied Housing Units | 1,089 | 40.1% |
| Total Occupied Housing Units | 2,714 | 100.0% |
Occupancy by Household Size in Lihue
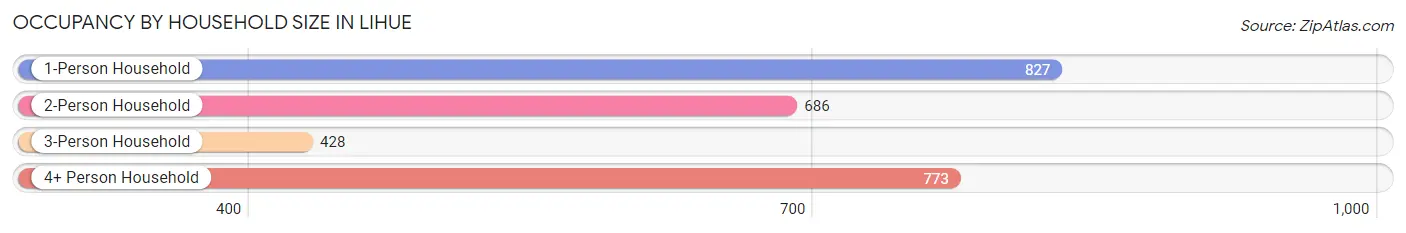
| Household Size | # Housing Units | % Housing Units |
| 1-Person Household | 827 | 30.5% |
| 2-Person Household | 686 | 25.3% |
| 3-Person Household | 428 | 15.8% |
| 4+ Person Household | 773 | 28.5% |
| Total Housing Units | 2,714 | 100.0% |
Occupancy by Ownership by Household Size in Lihue
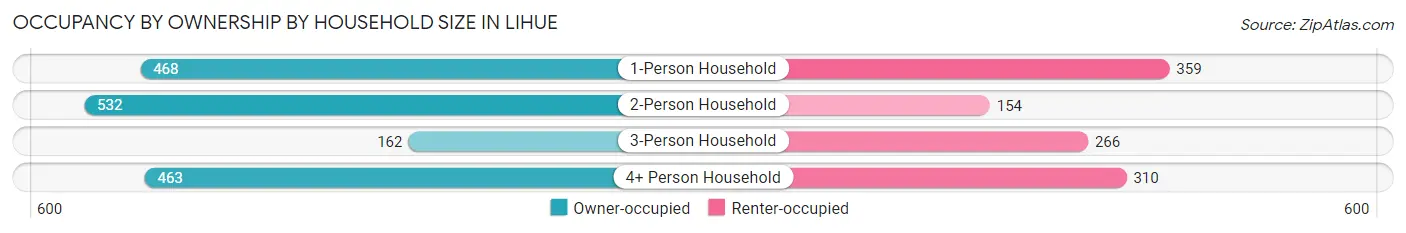
| Household Size | Owner-occupied | Renter-occupied |
| 1-Person Household | 468 (56.6%) | 359 (43.4%) |
| 2-Person Household | 532 (77.5%) | 154 (22.5%) |
| 3-Person Household | 162 (37.9%) | 266 (62.2%) |
| 4+ Person Household | 463 (59.9%) | 310 (40.1%) |
| Total Housing Units | 1,625 (59.9%) | 1,089 (40.1%) |
Occupancy by Educational Attainment in Lihue
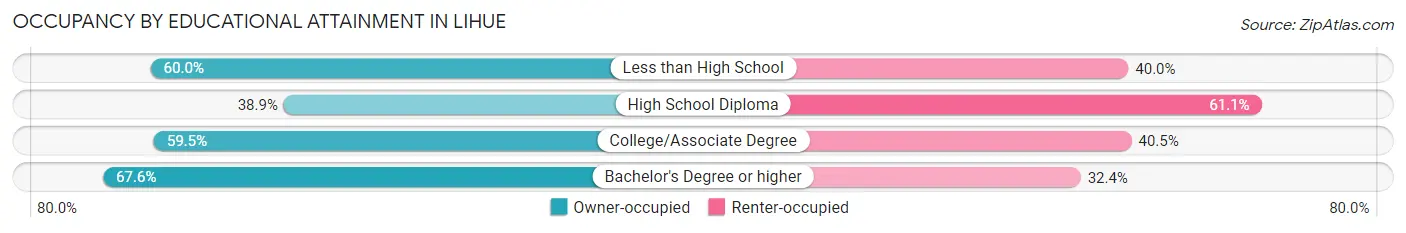
| Household Size | Owner-occupied | Renter-occupied |
| Less than High School | 24 (60.0%) | 16 (40.0%) |
| High School Diploma | 191 (38.9%) | 300 (61.1%) |
| College/Associate Degree | 479 (59.5%) | 326 (40.5%) |
| Bachelor's Degree or higher | 931 (67.6%) | 447 (32.4%) |
Occupancy by Age of Householder in Lihue
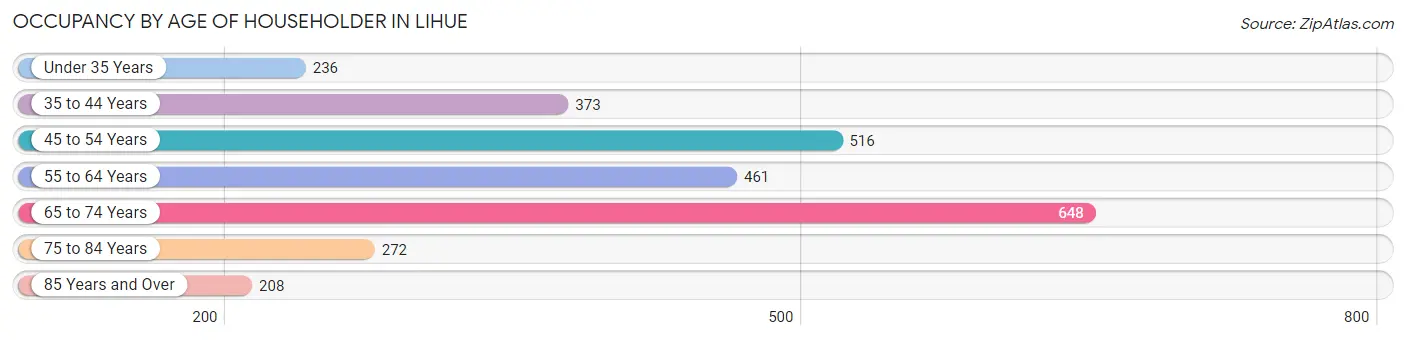
| Age Bracket | # Households | % Households |
| Under 35 Years | 236 | 8.7% |
| 35 to 44 Years | 373 | 13.7% |
| 45 to 54 Years | 516 | 19.0% |
| 55 to 64 Years | 461 | 17.0% |
| 65 to 74 Years | 648 | 23.9% |
| 75 to 84 Years | 272 | 10.0% |
| 85 Years and Over | 208 | 7.7% |
| Total | 2,714 | 100.0% |
Housing Finances in Lihue
Median Income by Occupancy in Lihue
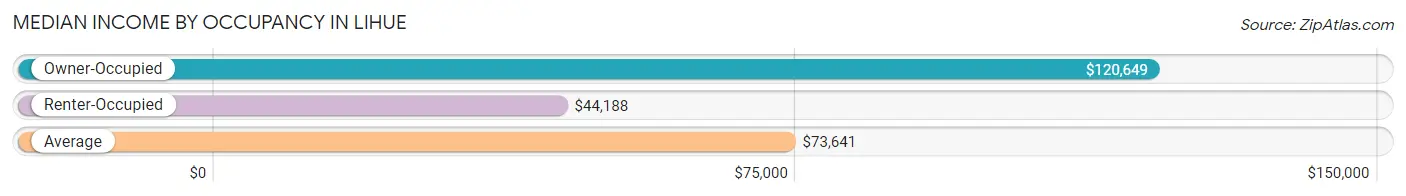
| Occupancy Type | # Households | Median Income |
| Owner-Occupied | 1,625 (59.9%) | $120,649 |
| Renter-Occupied | 1,089 (40.1%) | $44,188 |
| Average | 2,714 (100.0%) | $73,641 |
Occupancy by Householder Income Bracket in Lihue
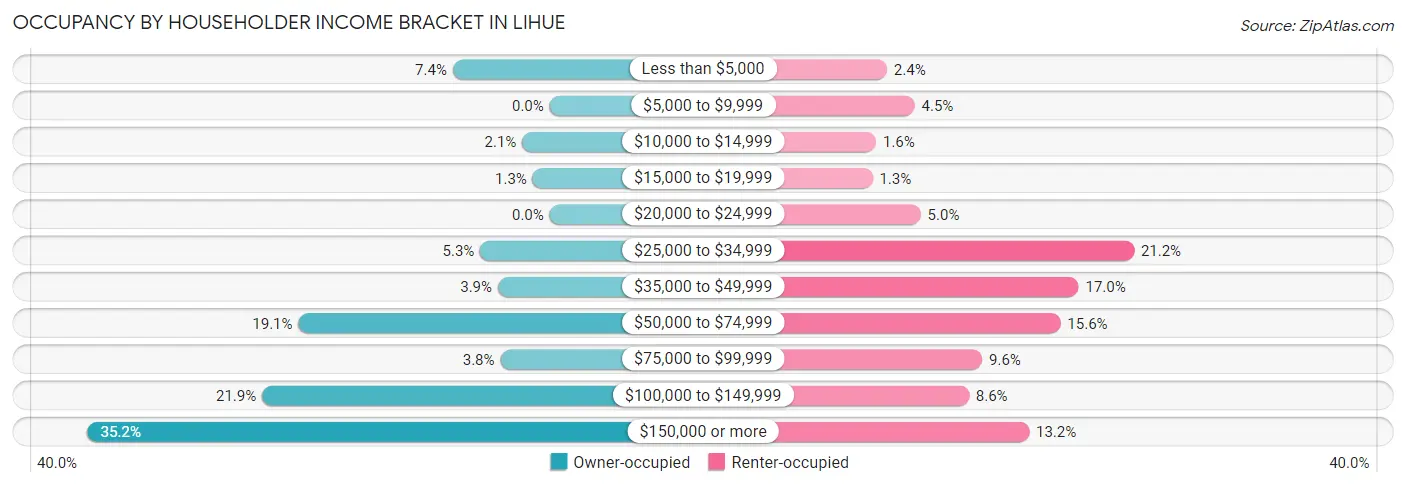
| Income Bracket | Owner-occupied | Renter-occupied |
| Less than $5,000 | 120 (7.4%) | 26 (2.4%) |
| $5,000 to $9,999 | 0 (0.0%) | 49 (4.5%) |
| $10,000 to $14,999 | 34 (2.1%) | 17 (1.6%) |
| $15,000 to $19,999 | 21 (1.3%) | 14 (1.3%) |
| $20,000 to $24,999 | 0 (0.0%) | 54 (5.0%) |
| $25,000 to $34,999 | 86 (5.3%) | 231 (21.2%) |
| $35,000 to $49,999 | 64 (3.9%) | 185 (17.0%) |
| $50,000 to $74,999 | 311 (19.1%) | 170 (15.6%) |
| $75,000 to $99,999 | 61 (3.7%) | 105 (9.6%) |
| $100,000 to $149,999 | 356 (21.9%) | 94 (8.6%) |
| $150,000 or more | 572 (35.2%) | 144 (13.2%) |
| Total | 1,625 (100.0%) | 1,089 (100.0%) |
Monthly Housing Cost Tiers in Lihue
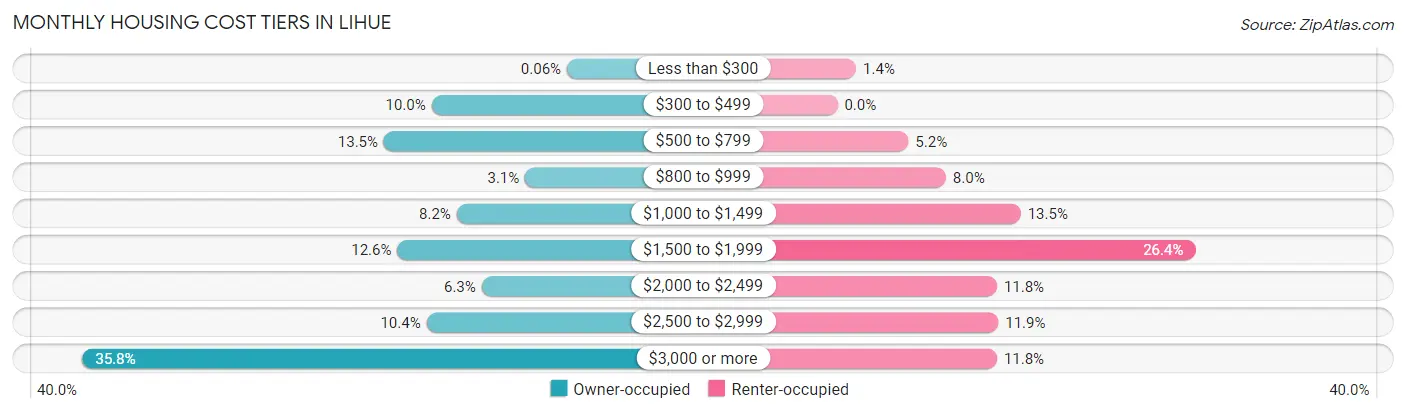
| Monthly Cost | Owner-occupied | Renter-occupied |
| Less than $300 | 1 (0.1%) | 15 (1.4%) |
| $300 to $499 | 163 (10.0%) | 0 (0.0%) |
| $500 to $799 | 220 (13.5%) | 57 (5.2%) |
| $800 to $999 | 51 (3.1%) | 87 (8.0%) |
| $1,000 to $1,499 | 133 (8.2%) | 147 (13.5%) |
| $1,500 to $1,999 | 204 (12.6%) | 287 (26.4%) |
| $2,000 to $2,499 | 103 (6.3%) | 128 (11.7%) |
| $2,500 to $2,999 | 169 (10.4%) | 129 (11.8%) |
| $3,000 or more | 581 (35.7%) | 128 (11.7%) |
| Total | 1,625 (100.0%) | 1,089 (100.0%) |
Physical Housing Characteristics in Lihue
Housing Structures in Lihue
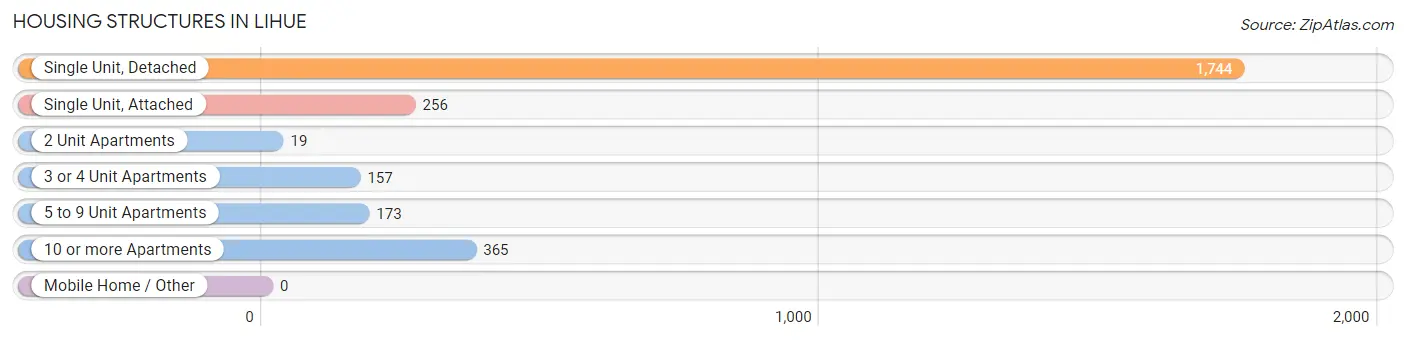
| Structure Type | # Housing Units | % Housing Units |
| Single Unit, Detached | 1,744 | 64.3% |
| Single Unit, Attached | 256 | 9.4% |
| 2 Unit Apartments | 19 | 0.7% |
| 3 or 4 Unit Apartments | 157 | 5.8% |
| 5 to 9 Unit Apartments | 173 | 6.4% |
| 10 or more Apartments | 365 | 13.5% |
| Mobile Home / Other | 0 | 0.0% |
| Total | 2,714 | 100.0% |
Housing Structures by Occupancy in Lihue
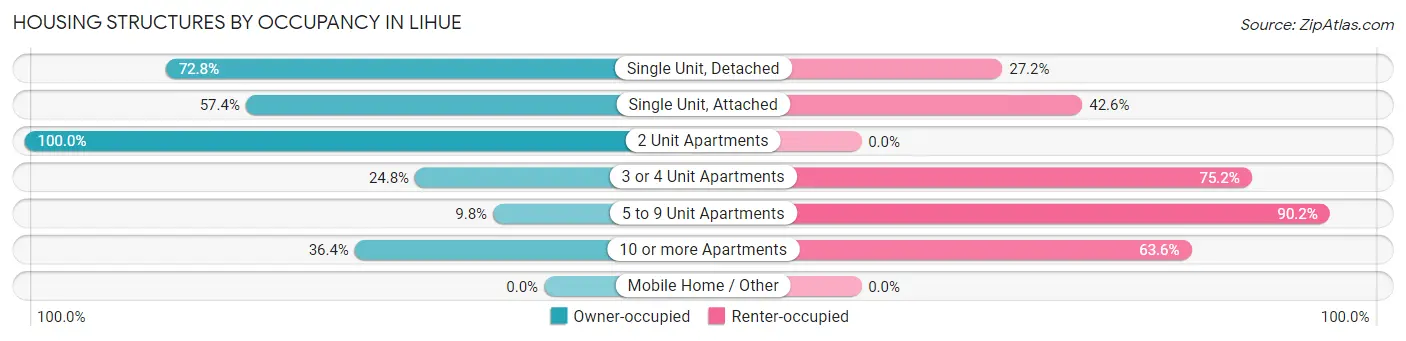
| Structure Type | Owner-occupied | Renter-occupied |
| Single Unit, Detached | 1,270 (72.8%) | 474 (27.2%) |
| Single Unit, Attached | 147 (57.4%) | 109 (42.6%) |
| 2 Unit Apartments | 19 (100.0%) | 0 (0.0%) |
| 3 or 4 Unit Apartments | 39 (24.8%) | 118 (75.2%) |
| 5 to 9 Unit Apartments | 17 (9.8%) | 156 (90.2%) |
| 10 or more Apartments | 133 (36.4%) | 232 (63.6%) |
| Mobile Home / Other | 0 (0.0%) | 0 (0.0%) |
| Total | 1,625 (59.9%) | 1,089 (40.1%) |
Housing Structures by Number of Rooms in Lihue
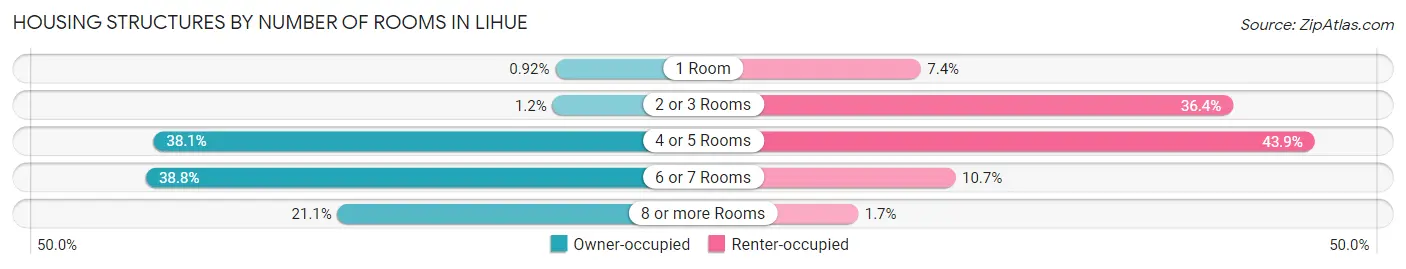
| Number of Rooms | Owner-occupied | Renter-occupied |
| 1 Room | 15 (0.9%) | 81 (7.4%) |
| 2 or 3 Rooms | 19 (1.2%) | 396 (36.4%) |
| 4 or 5 Rooms | 619 (38.1%) | 478 (43.9%) |
| 6 or 7 Rooms | 630 (38.8%) | 116 (10.6%) |
| 8 or more Rooms | 342 (21.0%) | 18 (1.7%) |
| Total | 1,625 (100.0%) | 1,089 (100.0%) |
Housing Structure by Heating Type in Lihue
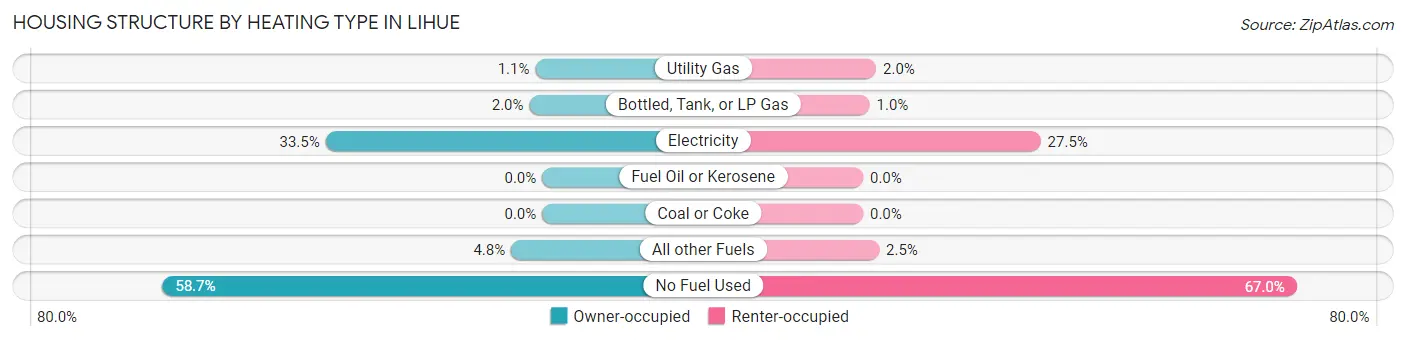
| Heating Type | Owner-occupied | Renter-occupied |
| Utility Gas | 17 (1.1%) | 22 (2.0%) |
| Bottled, Tank, or LP Gas | 32 (2.0%) | 11 (1.0%) |
| Electricity | 544 (33.5%) | 299 (27.5%) |
| Fuel Oil or Kerosene | 0 (0.0%) | 0 (0.0%) |
| Coal or Coke | 0 (0.0%) | 0 (0.0%) |
| All other Fuels | 78 (4.8%) | 27 (2.5%) |
| No Fuel Used | 954 (58.7%) | 730 (67.0%) |
| Total | 1,625 (100.0%) | 1,089 (100.0%) |
Household Vehicle Usage in Lihue
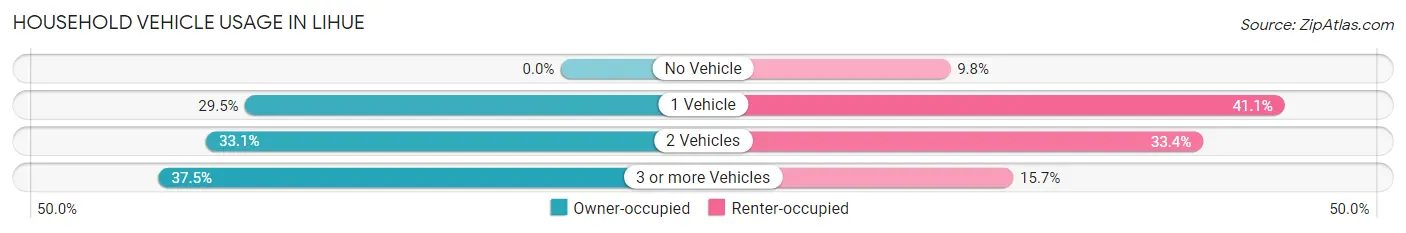
| Vehicles per Household | Owner-occupied | Renter-occupied |
| No Vehicle | 0 (0.0%) | 107 (9.8%) |
| 1 Vehicle | 479 (29.5%) | 447 (41.0%) |
| 2 Vehicles | 537 (33.1%) | 364 (33.4%) |
| 3 or more Vehicles | 609 (37.5%) | 171 (15.7%) |
| Total | 1,625 (100.0%) | 1,089 (100.0%) |
Real Estate & Mortgages in Lihue
Real Estate and Mortgage Overview in Lihue
| Characteristic | Without Mortgage | With Mortgage |
| Housing Units | 599 | 1,026 |
| Median Property Value | $751,900 | $825,900 |
| Median Household Income | $60,994 | $464 |
| Monthly Housing Costs | $651 | $581 |
| Real Estate Taxes | $1,416 | $19 |
Property Value by Mortgage Status in Lihue
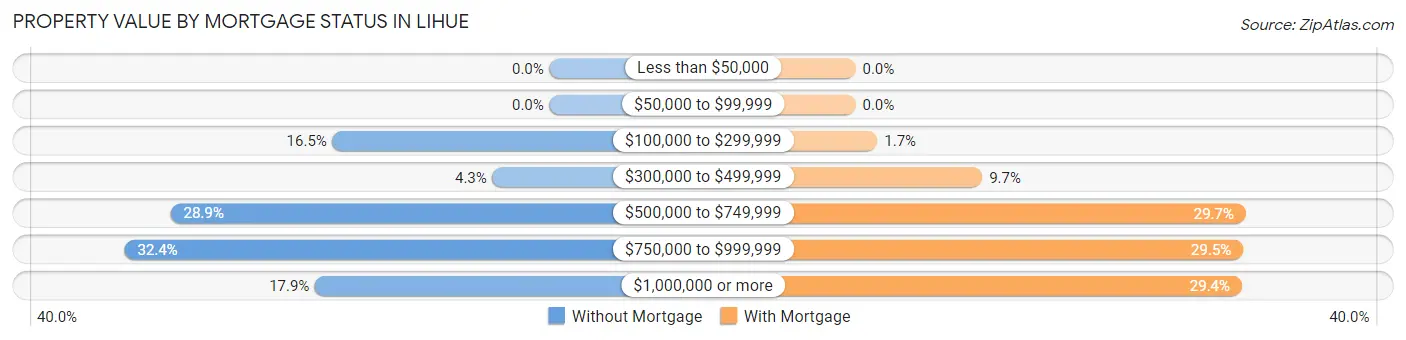
| Property Value | Without Mortgage | With Mortgage |
| Less than $50,000 | 0 (0.0%) | 0 (0.0%) |
| $50,000 to $99,999 | 0 (0.0%) | 0 (0.0%) |
| $100,000 to $299,999 | 99 (16.5%) | 17 (1.7%) |
| $300,000 to $499,999 | 26 (4.3%) | 99 (9.7%) |
| $500,000 to $749,999 | 173 (28.9%) | 305 (29.7%) |
| $750,000 to $999,999 | 194 (32.4%) | 303 (29.5%) |
| $1,000,000 or more | 107 (17.9%) | 302 (29.4%) |
| Total | 599 (100.0%) | 1,026 (100.0%) |
Household Income by Mortgage Status in Lihue
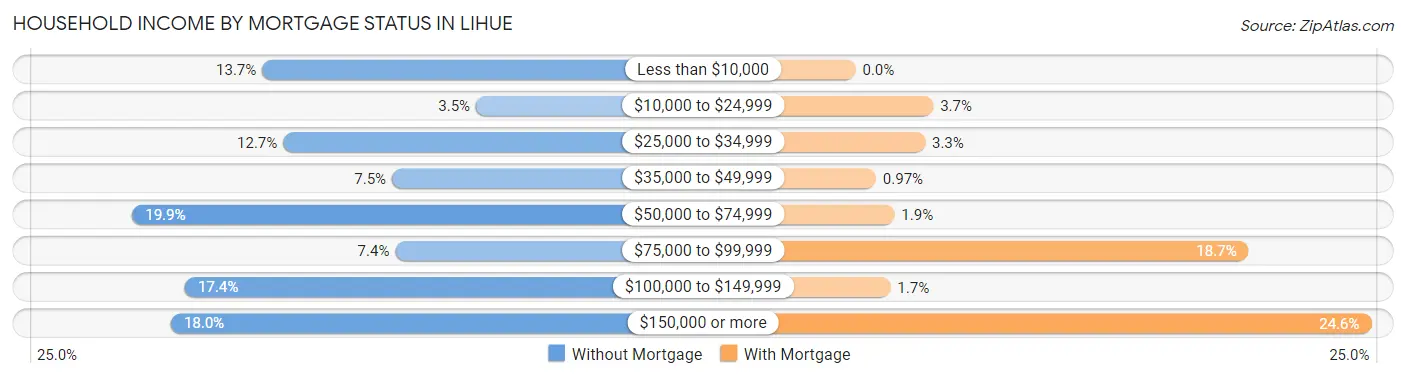
| Household Income | Without Mortgage | With Mortgage |
| Less than $10,000 | 82 (13.7%) | 0 (0.0%) |
| $10,000 to $24,999 | 21 (3.5%) | 38 (3.7%) |
| $25,000 to $34,999 | 76 (12.7%) | 34 (3.3%) |
| $35,000 to $49,999 | 45 (7.5%) | 10 (1.0%) |
| $50,000 to $74,999 | 119 (19.9%) | 19 (1.8%) |
| $75,000 to $99,999 | 44 (7.3%) | 192 (18.7%) |
| $100,000 to $149,999 | 104 (17.4%) | 17 (1.7%) |
| $150,000 or more | 108 (18.0%) | 252 (24.6%) |
| Total | 599 (100.0%) | 1,026 (100.0%) |
Property Value to Household Income Ratio in Lihue
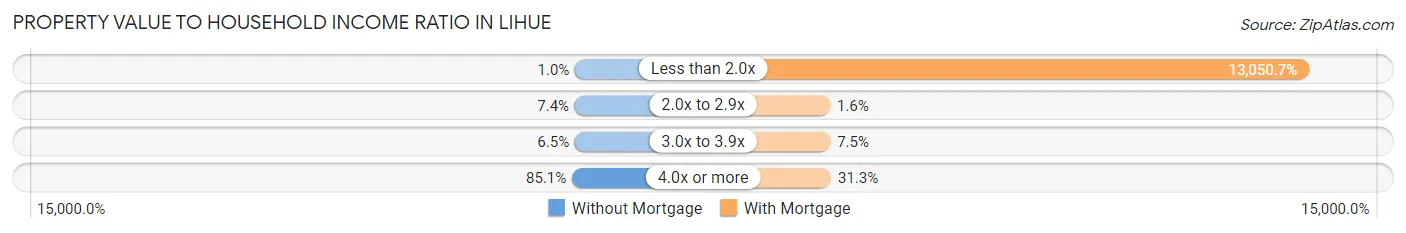
| Value-to-Income Ratio | Without Mortgage | With Mortgage |
| Less than 2.0x | 6 (1.0%) | 133,900 (13,050.7%) |
| 2.0x to 2.9x | 44 (7.3%) | 16 (1.6%) |
| 3.0x to 3.9x | 39 (6.5%) | 77 (7.5%) |
| 4.0x or more | 510 (85.1%) | 321 (31.3%) |
| Total | 599 (100.0%) | 1,026 (100.0%) |
Real Estate Taxes by Mortgage Status in Lihue
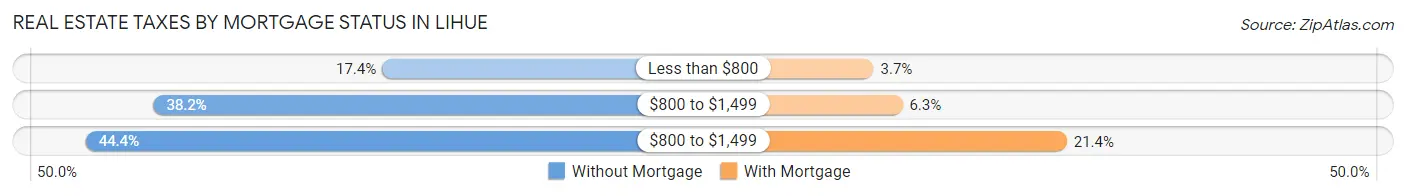
| Property Taxes | Without Mortgage | With Mortgage |
| Less than $800 | 104 (17.4%) | 38 (3.7%) |
| $800 to $1,499 | 229 (38.2%) | 65 (6.3%) |
| $800 to $1,499 | 266 (44.4%) | 219 (21.3%) |
| Total | 599 (100.0%) | 1,026 (100.0%) |
Health & Disability in Lihue
Health Insurance Coverage by Age in Lihue
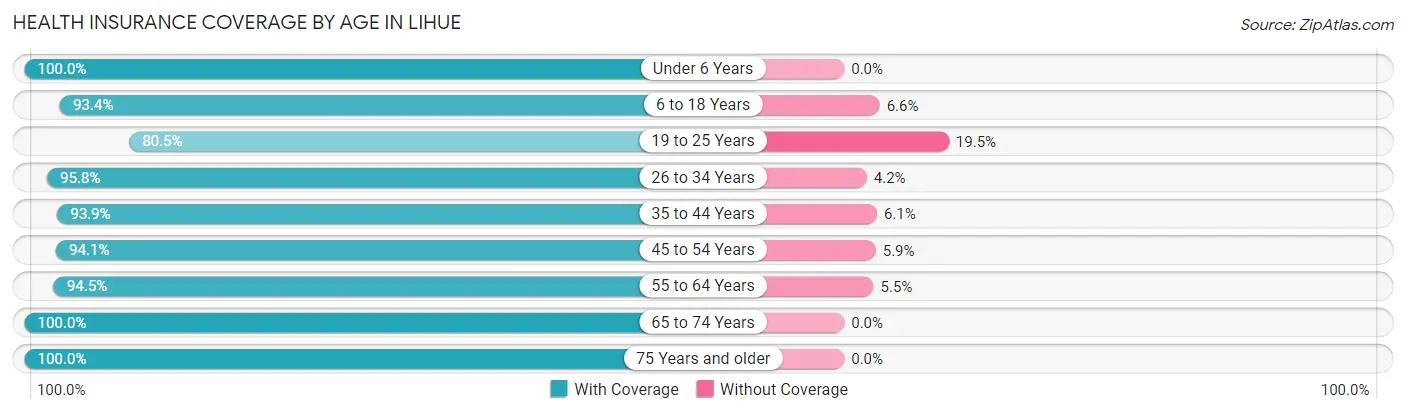
| Age Bracket | With Coverage | Without Coverage |
| Under 6 Years | 635 (100.0%) | 0 (0.0%) |
| 6 to 18 Years | 1,469 (93.4%) | 104 (6.6%) |
| 19 to 25 Years | 392 (80.5%) | 95 (19.5%) |
| 26 to 34 Years | 753 (95.8%) | 33 (4.2%) |
| 35 to 44 Years | 985 (93.9%) | 64 (6.1%) |
| 45 to 54 Years | 963 (94.1%) | 60 (5.9%) |
| 55 to 64 Years | 986 (94.5%) | 57 (5.5%) |
| 65 to 74 Years | 1,028 (100.0%) | 0 (0.0%) |
| 75 Years and older | 915 (100.0%) | 0 (0.0%) |
| Total | 8,126 (95.2%) | 413 (4.8%) |
Health Insurance Coverage by Citizenship Status in Lihue
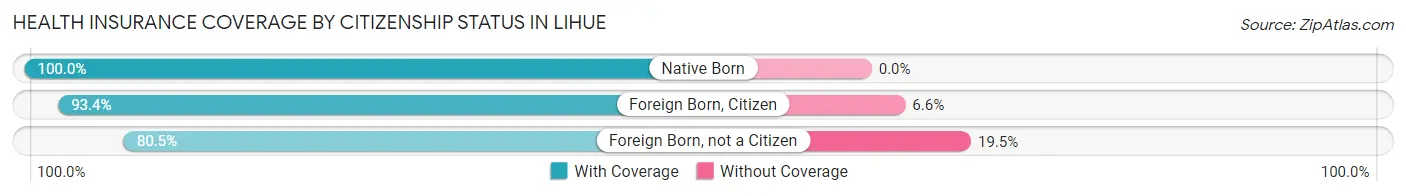
| Citizenship Status | With Coverage | Without Coverage |
| Native Born | 635 (100.0%) | 0 (0.0%) |
| Foreign Born, Citizen | 1,469 (93.4%) | 104 (6.6%) |
| Foreign Born, not a Citizen | 392 (80.5%) | 95 (19.5%) |
Health Insurance Coverage by Household Income in Lihue
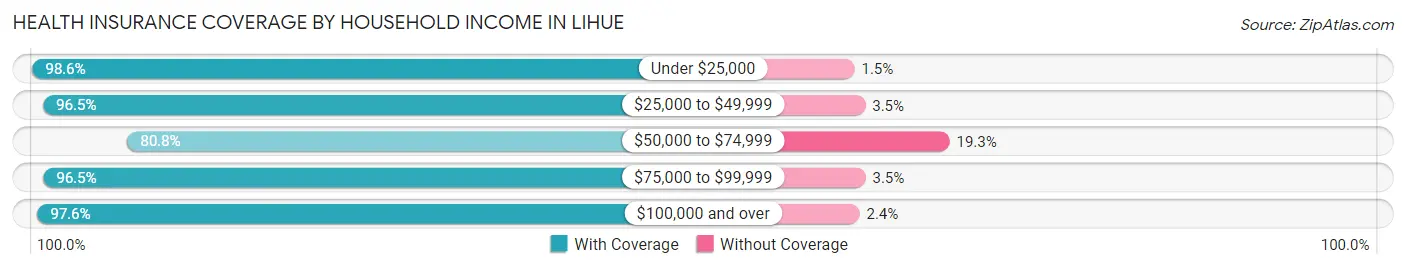
| Household Income | With Coverage | Without Coverage |
| Under $25,000 | 407 (98.6%) | 6 (1.5%) |
| $25,000 to $49,999 | 1,339 (96.5%) | 48 (3.5%) |
| $50,000 to $74,999 | 843 (80.7%) | 201 (19.3%) |
| $75,000 to $99,999 | 605 (96.5%) | 22 (3.5%) |
| $100,000 and over | 4,868 (97.6%) | 119 (2.4%) |
Public vs Private Health Insurance Coverage by Age in Lihue
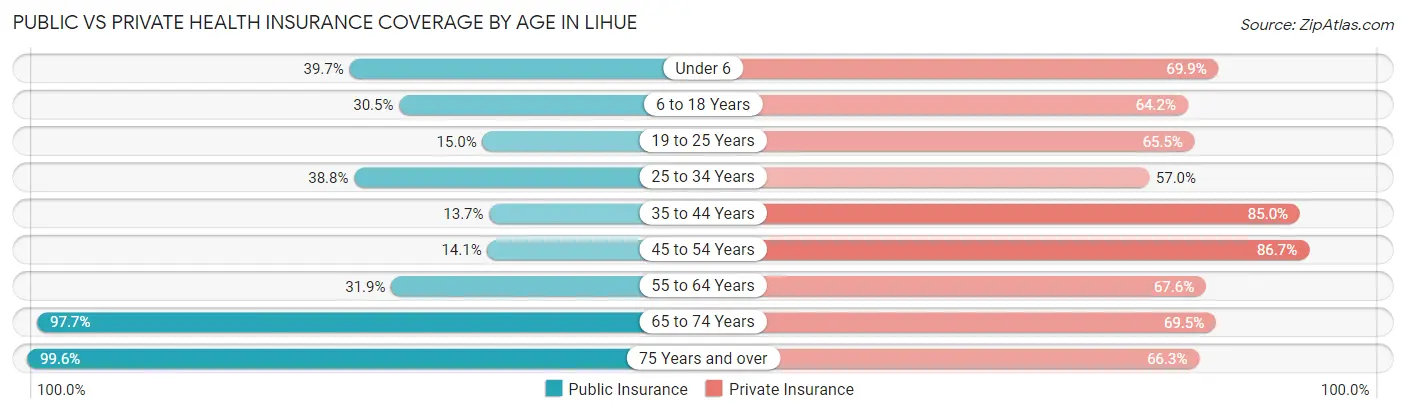
| Age Bracket | Public Insurance | Private Insurance |
| Under 6 | 252 (39.7%) | 444 (69.9%) |
| 6 to 18 Years | 479 (30.4%) | 1,010 (64.2%) |
| 19 to 25 Years | 73 (15.0%) | 319 (65.5%) |
| 25 to 34 Years | 305 (38.8%) | 448 (57.0%) |
| 35 to 44 Years | 144 (13.7%) | 892 (85.0%) |
| 45 to 54 Years | 144 (14.1%) | 887 (86.7%) |
| 55 to 64 Years | 333 (31.9%) | 705 (67.6%) |
| 65 to 74 Years | 1,004 (97.7%) | 714 (69.5%) |
| 75 Years and over | 911 (99.6%) | 607 (66.3%) |
| Total | 3,645 (42.7%) | 6,026 (70.6%) |
Disability Status by Sex by Age in Lihue
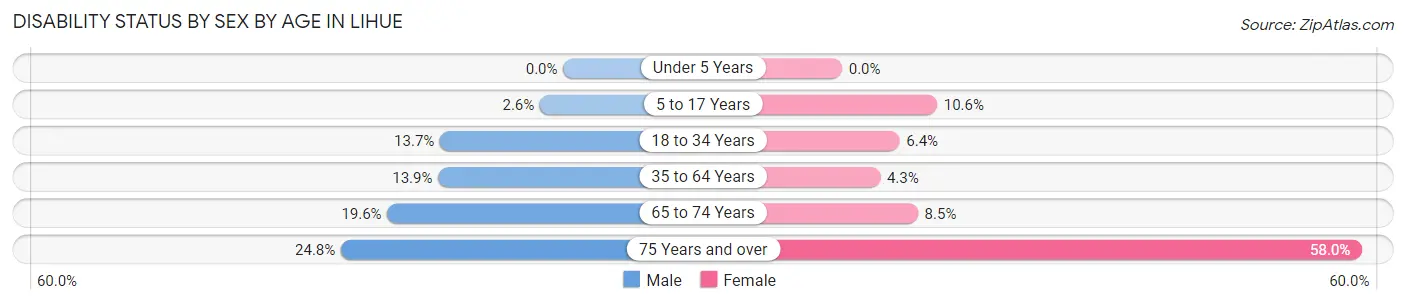
| Age Bracket | Male | Female |
| Under 5 Years | 0 (0.0%) | 0 (0.0%) |
| 5 to 17 Years | 17 (2.6%) | 88 (10.6%) |
| 18 to 34 Years | 94 (13.7%) | 47 (6.4%) |
| 35 to 64 Years | 208 (13.9%) | 69 (4.3%) |
| 65 to 74 Years | 104 (19.6%) | 42 (8.5%) |
| 75 Years and over | 74 (24.7%) | 357 (58.0%) |
Disability Class by Sex by Age in Lihue
Disability Class: Hearing Difficulty
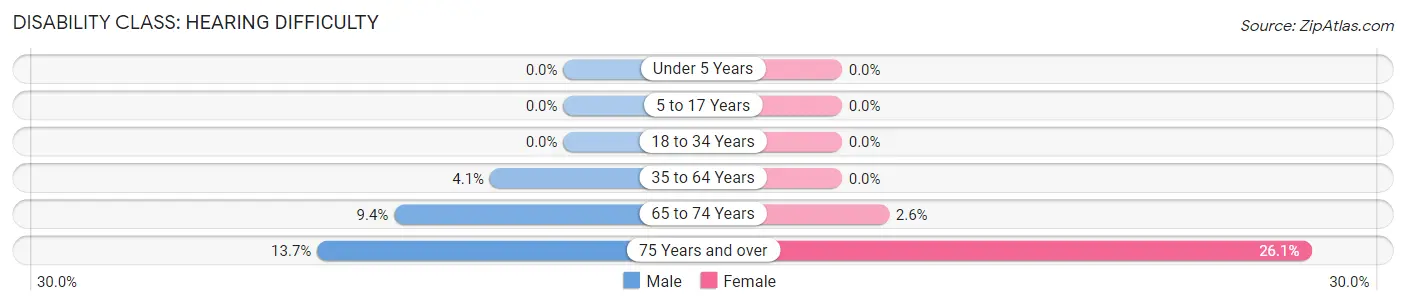
| Age Bracket | Male | Female |
| Under 5 Years | 0 (0.0%) | 0 (0.0%) |
| 5 to 17 Years | 0 (0.0%) | 0 (0.0%) |
| 18 to 34 Years | 0 (0.0%) | 0 (0.0%) |
| 35 to 64 Years | 61 (4.1%) | 0 (0.0%) |
| 65 to 74 Years | 50 (9.4%) | 13 (2.6%) |
| 75 Years and over | 41 (13.7%) | 161 (26.1%) |
Disability Class: Vision Difficulty
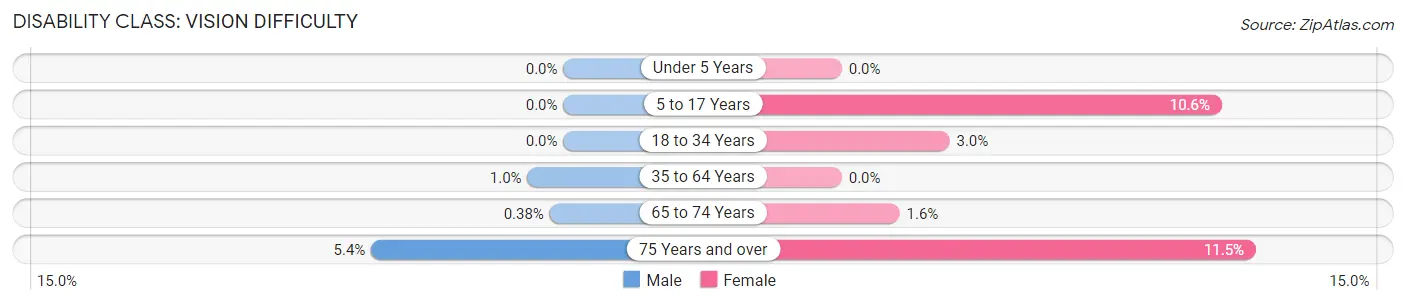
| Age Bracket | Male | Female |
| Under 5 Years | 0 (0.0%) | 0 (0.0%) |
| 5 to 17 Years | 0 (0.0%) | 88 (10.6%) |
| 18 to 34 Years | 0 (0.0%) | 22 (3.0%) |
| 35 to 64 Years | 15 (1.0%) | 0 (0.0%) |
| 65 to 74 Years | 2 (0.4%) | 8 (1.6%) |
| 75 Years and over | 16 (5.3%) | 71 (11.5%) |
Disability Class: Cognitive Difficulty
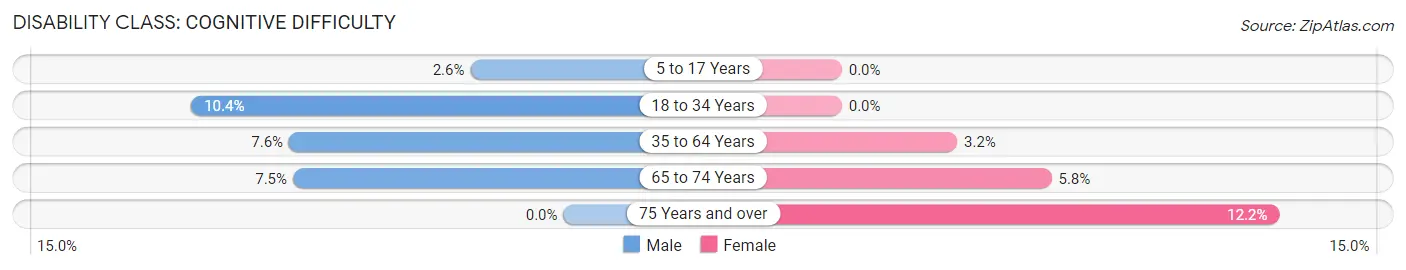
| Age Bracket | Male | Female |
| 5 to 17 Years | 17 (2.6%) | 0 (0.0%) |
| 18 to 34 Years | 71 (10.4%) | 0 (0.0%) |
| 35 to 64 Years | 114 (7.6%) | 52 (3.2%) |
| 65 to 74 Years | 40 (7.5%) | 29 (5.8%) |
| 75 Years and over | 0 (0.0%) | 75 (12.2%) |
Disability Class: Ambulatory Difficulty
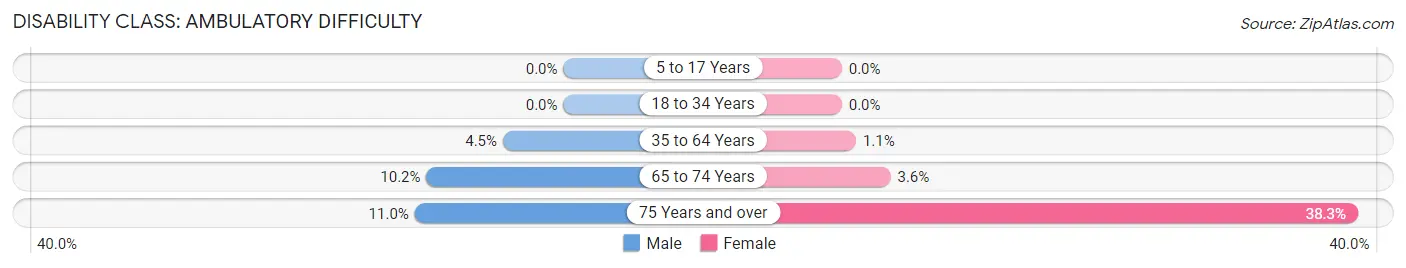
| Age Bracket | Male | Female |
| 5 to 17 Years | 0 (0.0%) | 0 (0.0%) |
| 18 to 34 Years | 0 (0.0%) | 0 (0.0%) |
| 35 to 64 Years | 67 (4.5%) | 17 (1.1%) |
| 65 to 74 Years | 54 (10.2%) | 18 (3.6%) |
| 75 Years and over | 33 (11.0%) | 236 (38.3%) |
Disability Class: Self-Care Difficulty
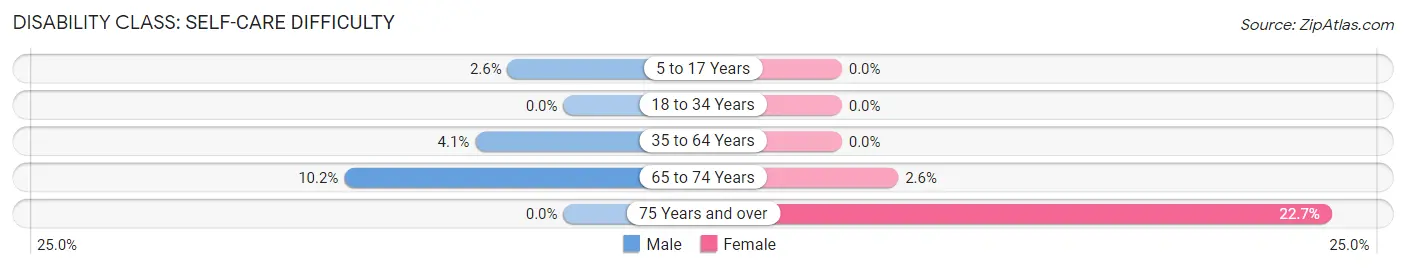
| Age Bracket | Male | Female |
| 5 to 17 Years | 17 (2.6%) | 0 (0.0%) |
| 18 to 34 Years | 0 (0.0%) | 0 (0.0%) |
| 35 to 64 Years | 61 (4.1%) | 0 (0.0%) |
| 65 to 74 Years | 54 (10.2%) | 13 (2.6%) |
| 75 Years and over | 0 (0.0%) | 140 (22.7%) |
Technology Access in Lihue
Computing Device Access in Lihue
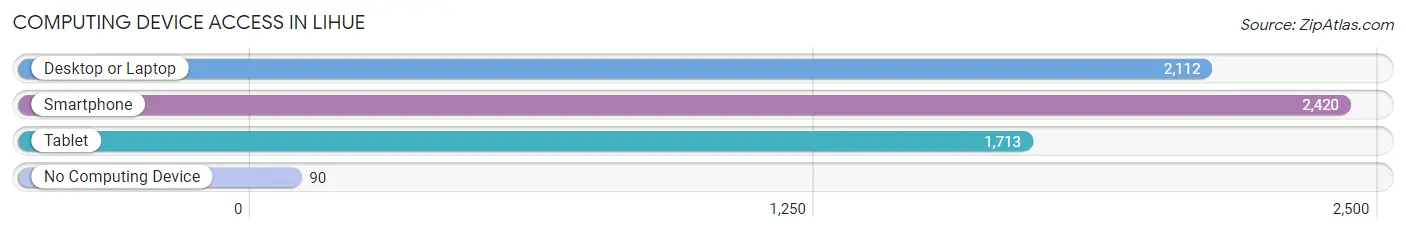
| Device Type | # Households | % Households |
| Desktop or Laptop | 2,112 | 77.8% |
| Smartphone | 2,420 | 89.2% |
| Tablet | 1,713 | 63.1% |
| No Computing Device | 90 | 3.3% |
| Total | 2,714 | 100.0% |
Internet Access in Lihue
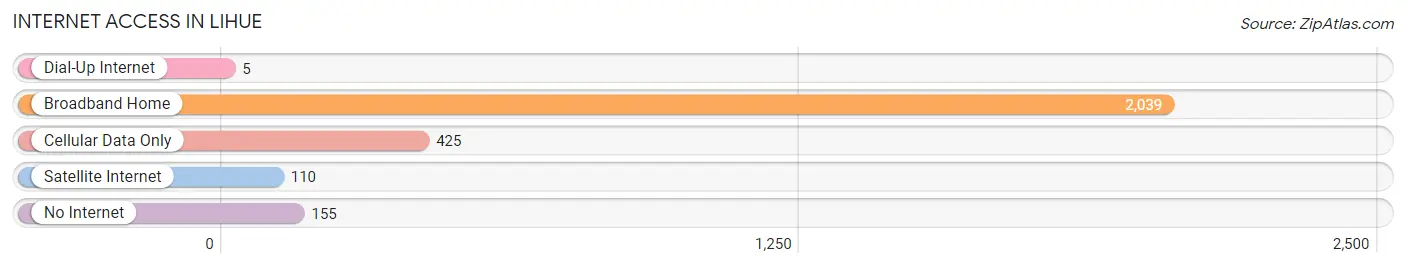
| Internet Type | # Households | % Households |
| Dial-Up Internet | 5 | 0.2% |
| Broadband Home | 2,039 | 75.1% |
| Cellular Data Only | 425 | 15.7% |
| Satellite Internet | 110 | 4.1% |
| No Internet | 155 | 5.7% |
| Total | 2,714 | 100.0% |
Lihue Summary
Lihue is a census-designated place (CDP) located in the state of Hawaii in the United States. It is the county seat of Kauai County and the second largest town on the island of Kauai. The population of Lihue was 5,453 at the 2010 census.
History
Lihue was originally known as Kalapaki, which means “the harbor” in Hawaiian. It was the site of a major battle between the Hawaiian chiefs in 1824. The battle was won by Kamehameha I, who unified the Hawaiian Islands. In 1837, the area was renamed Lihue after the Hawaiian chief who had been killed in the battle.
In the late 19th century, Lihue became a major port for the sugar industry. The town was also the site of the first sugar mill in Hawaii, which was built in 1835. The mill was destroyed by a hurricane in 1837, but was rebuilt in 1841.
In the early 20th century, Lihue became a popular tourist destination. The town was home to several hotels, including the Lihue Hotel, which was built in 1912. The hotel was destroyed by a fire in 1921, but was rebuilt in 1924.
Geography
Lihue is located on the eastern side of the island of Kauai, at 21°58'N 159°21'W. It is bordered to the north by the town of Kapaa, to the south by the town of Koloa, and to the west by the town of Hanamaulu. The town is situated on the banks of the Huleia River, which flows into the Pacific Ocean.
The town has a total area of 4.2 square miles, of which 4.1 square miles is land and 0.1 square miles is water. The terrain is mostly flat, with some hills in the northern part of the town.
Economy
The economy of Lihue is largely based on tourism. The town is home to several resorts, including the Kauai Marriott Resort and the Kauai Beach Resort. The town is also home to several shopping centers, including the Kukui Grove Shopping Center and the Lihue Town Center.
The town is also home to several government offices, including the Kauai County Courthouse and the Kauai County Office Building. The town is also home to several educational institutions, including the University of Hawaii at Manoa, Kauai Community College, and the Kauai High School.
Demographics
As of the 2010 census, there were 5,453 people, 2,072 households, and 1,323 families residing in the town. The population density was 1,312.3 people per square mile. The racial makeup of the town was 57.2% White, 0.7% African American, 0.4% Native American, 15.2% Asian, 0.2% Pacific Islander, 1.2% from other races, and 25.1% from two or more races. Hispanic or Latino of any race were 8.3% of the population.
The median income for a household in the town was $50,945, and the median income for a family was $60,945. The per capita income for the town was $25,945. About 8.2% of families and 11.2% of the population were below the poverty line, including 15.2% of those under age 18 and 8.2% of those age 65 or over.
Common Questions
What is Per Capita Income in Lihue?
Per Capita income in Lihue is $39,369.
What is the Median Family Income in Lihue?
Median Family Income in Lihue is $105,421.
What is the Median Household income in Lihue?
Median Household Income in Lihue is $73,641.
What is Income or Wage Gap in Lihue?
Income or Wage Gap in Lihue is 27.1%.
Women in Lihue earn 72.9 cents for every dollar earned by a man.
What is Inequality or Gini Index in Lihue?
Inequality or Gini Index in Lihue is 0.48.
What is the Total Population of Lihue?
Total Population of Lihue is 8,649.
What is the Total Male Population of Lihue?
Total Male Population of Lihue is 4,054.
What is the Total Female Population of Lihue?
Total Female Population of Lihue is 4,595.
What is the Ratio of Males per 100 Females in Lihue?
There are 88.23 Males per 100 Females in Lihue.
What is the Ratio of Females per 100 Males in Lihue?
There are 113.34 Females per 100 Males in Lihue.
What is the Median Population Age in Lihue?
Median Population Age in Lihue is 41.8 Years.
What is the Average Family Size in Lihue
Average Family Size in Lihue is 3.8 People.
What is the Average Household Size in Lihue
Average Household Size in Lihue is 3.1 People.
How Large is the Labor Force in Lihue?
There are 4,185 People in the Labor Forcein in Lihue.
What is the Percentage of People in the Labor Force in Lihue?
60.9% of People are in the Labor Force in Lihue.
What is the Unemployment Rate in Lihue?
Unemployment Rate in Lihue is 1.1%.