Sand Point, AK Map & Demographics
Sand Point Map
Sand Point Overview
$40,288
PER CAPITA INCOME
$91,250
AVG FAMILY INCOME
$79,922
AVG HOUSEHOLD INCOME
1.9%
WAGE / INCOME GAP [ % ]
98.1¢/ $1
WAGE / INCOME GAP [ $ ]
0.41
INEQUALITY / GINI INDEX
1,048
TOTAL POPULATION
580
MALE POPULATION
468
FEMALE POPULATION
123.93
MALES / 100 FEMALES
80.69
FEMALES / 100 MALES
48.3
MEDIAN AGE
2.5
AVG FAMILY SIZE
2.3
AVG HOUSEHOLD SIZE
680
LABOR FORCE [ PEOPLE ]
71.4%
PERCENT IN LABOR FORCE
3.2%
UNEMPLOYMENT RATE
Sand Point Zip Codes
Sand Point Area Codes
Income in Sand Point
Income Overview in Sand Point
Per Capita Income in Sand Point is $40,288, while median incomes of families and households are $91,250 and $79,922 respectively.
| Characteristic | Number | Measure |
| Per Capita Income | 1,048 | $40,288 |
| Median Family Income | 251 | $91,250 |
| Mean Family Income | 251 | $109,346 |
| Median Household Income | 341 | $79,922 |
| Mean Household Income | 341 | $96,908 |
| Income Deficit | 251 | $0 |
| Wage / Income Gap (%) | 1,048 | 1.85% |
| Wage / Income Gap ($) | 1,048 | 98.15¢ per $1 |
| Gini / Inequality Index | 1,048 | 0.41 |
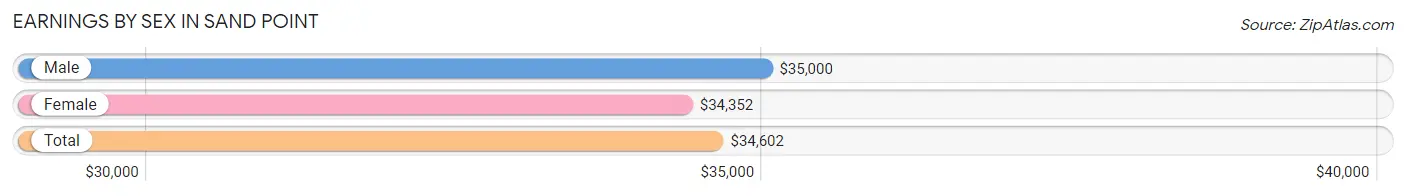
Earnings by Sex in Sand Point
Average Earnings in Sand Point are $34,602, $35,000 for men and $34,352 for women, a difference of 1.8%.
| Sex | Number | Average Earnings |
| Male | 434 (55.6%) | $35,000 |
| Female | 346 (44.4%) | $34,352 |
| Total | 780 (100.0%) | $34,602 |
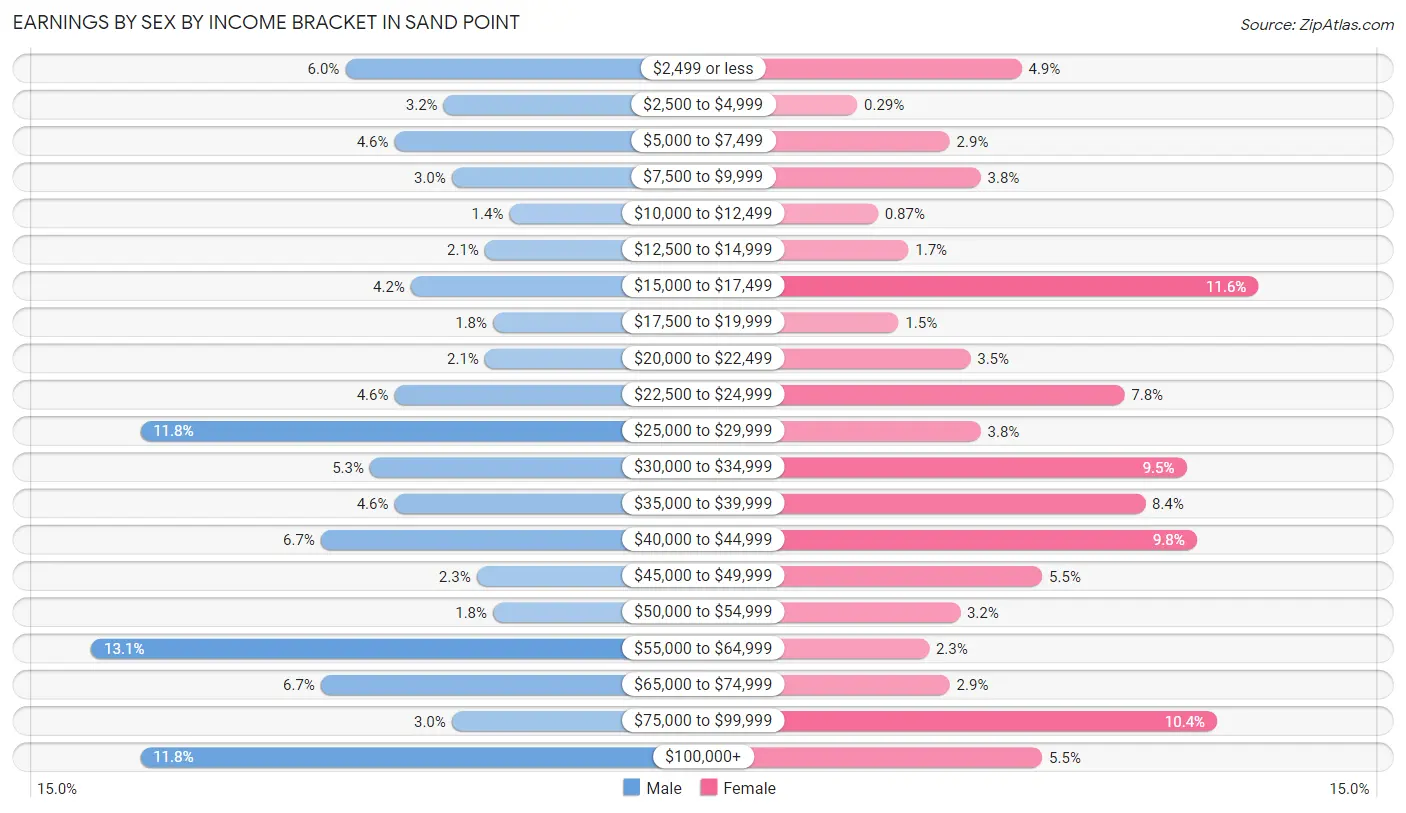
Earnings by Sex by Income Bracket in Sand Point
The most common earnings brackets in Sand Point are $55,000 to $64,999 for men (57 | 13.1%) and $15,000 to $17,499 for women (40 | 11.6%).
| Income | Male | Female |
| $2,499 or less | 26 (6.0%) | 17 (4.9%) |
| $2,500 to $4,999 | 14 (3.2%) | 1 (0.3%) |
| $5,000 to $7,499 | 20 (4.6%) | 10 (2.9%) |
| $7,500 to $9,999 | 13 (3.0%) | 13 (3.8%) |
| $10,000 to $12,499 | 6 (1.4%) | 3 (0.9%) |
| $12,500 to $14,999 | 9 (2.1%) | 6 (1.7%) |
| $15,000 to $17,499 | 18 (4.2%) | 40 (11.6%) |
| $17,500 to $19,999 | 8 (1.8%) | 5 (1.5%) |
| $20,000 to $22,499 | 9 (2.1%) | 12 (3.5%) |
| $22,500 to $24,999 | 20 (4.6%) | 27 (7.8%) |
| $25,000 to $29,999 | 51 (11.7%) | 13 (3.8%) |
| $30,000 to $34,999 | 23 (5.3%) | 33 (9.5%) |
| $35,000 to $39,999 | 20 (4.6%) | 29 (8.4%) |
| $40,000 to $44,999 | 29 (6.7%) | 34 (9.8%) |
| $45,000 to $49,999 | 10 (2.3%) | 19 (5.5%) |
| $50,000 to $54,999 | 8 (1.8%) | 11 (3.2%) |
| $55,000 to $64,999 | 57 (13.1%) | 8 (2.3%) |
| $65,000 to $74,999 | 29 (6.7%) | 10 (2.9%) |
| $75,000 to $99,999 | 13 (3.0%) | 36 (10.4%) |
| $100,000+ | 51 (11.7%) | 19 (5.5%) |
| Total | 434 (100.0%) | 346 (100.0%) |
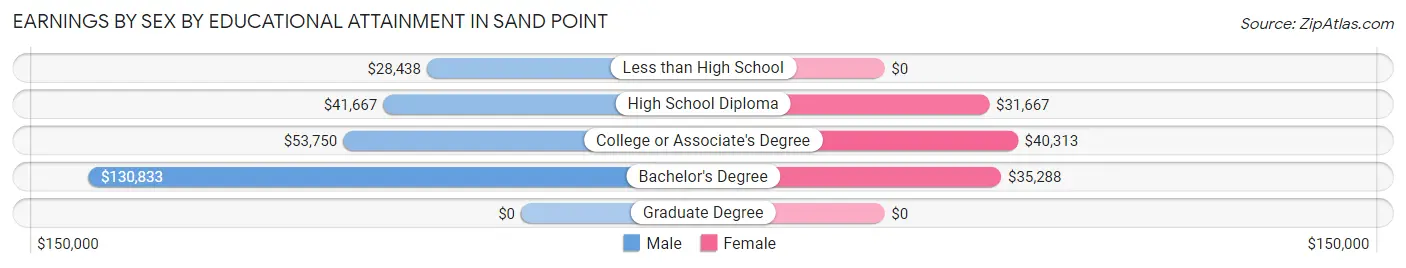
Earnings by Sex by Educational Attainment in Sand Point
Average earnings in Sand Point are $36,875 for men and $33,704 for women, a difference of 8.6%. Men with an educational attainment of bachelor's degree enjoy the highest average annual earnings of $130,833, while those with less than high school education earn the least with $28,438. Women with an educational attainment of college or associate's degree earn the most with the average annual earnings of $40,313, while those with high school diploma education have the smallest earnings of $31,667.
| Educational Attainment | Male Income | Female Income |
| Less than High School | $28,438 | $0 |
| High School Diploma | $41,667 | $31,667 |
| College or Associate's Degree | $53,750 | $40,313 |
| Bachelor's Degree | $130,833 | $35,288 |
| Graduate Degree | - | - |
| Total | $36,875 | $33,704 |
Family Income in Sand Point
Family Income Brackets in Sand Point
According to the Sand Point family income data, there are 61 families falling into the $150,000 to $199,999 income range, which is the most common income bracket and makes up 24.3% of all families. Conversely, the $10,000 to $14,999 income bracket is the least frequent group with only 4 families (1.6%) belonging to this category.
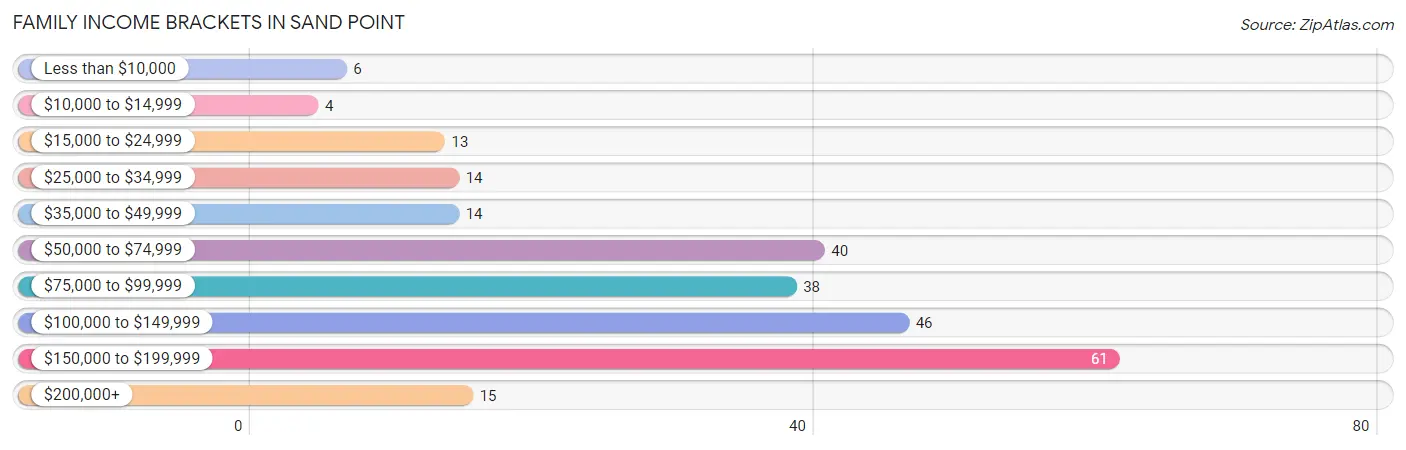
| Income Bracket | # Families | % Families |
| Less than $10,000 | 6 | 2.4% |
| $10,000 to $14,999 | 4 | 1.6% |
| $15,000 to $24,999 | 13 | 5.2% |
| $25,000 to $34,999 | 14 | 5.6% |
| $35,000 to $49,999 | 14 | 5.6% |
| $50,000 to $74,999 | 40 | 15.9% |
| $75,000 to $99,999 | 38 | 15.1% |
| $100,000 to $149,999 | 46 | 18.3% |
| $150,000 to $199,999 | 61 | 24.3% |
| $200,000+ | 15 | 6.0% |
Family Income by Famaliy Size in Sand Point
5-person families (9 | 3.6%) account for the highest median family income in Sand Point with $128,750 per family, while 2-person families (149 | 59.4%) have the highest median income of $64,062 per family member.
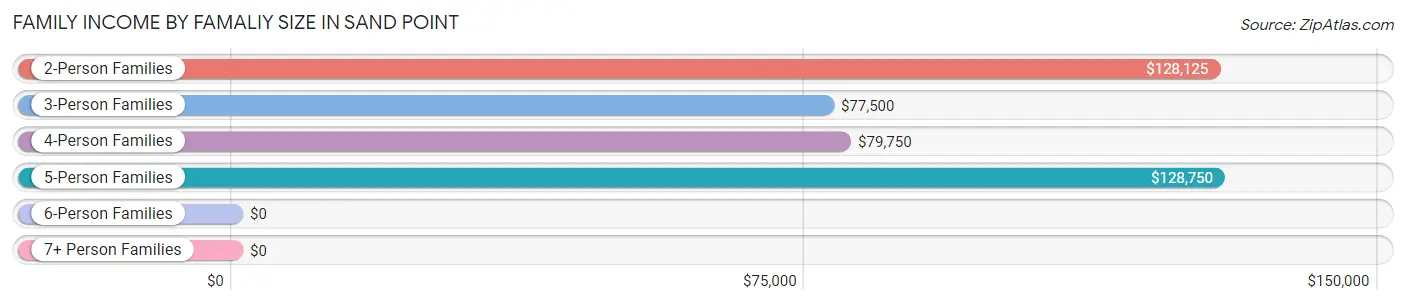
| Income Bracket | # Families | Median Income |
| 2-Person Families | 149 (59.4%) | $128,125 |
| 3-Person Families | 56 (22.3%) | $77,500 |
| 4-Person Families | 37 (14.7%) | $79,750 |
| 5-Person Families | 9 (3.6%) | $128,750 |
| 6-Person Families | 0 (0.0%) | $0 |
| 7+ Person Families | 0 (0.0%) | $0 |
| Total | 251 (100.0%) | $91,250 |
Family Income by Number of Earners in Sand Point
The median family income in Sand Point is $91,250, with families comprising 3+ earners (39) having the highest median family income of $129,583, while families with 1 earner (103) have the lowest median family income of $67,917, accounting for 15.5% and 41.0% of families, respectively.
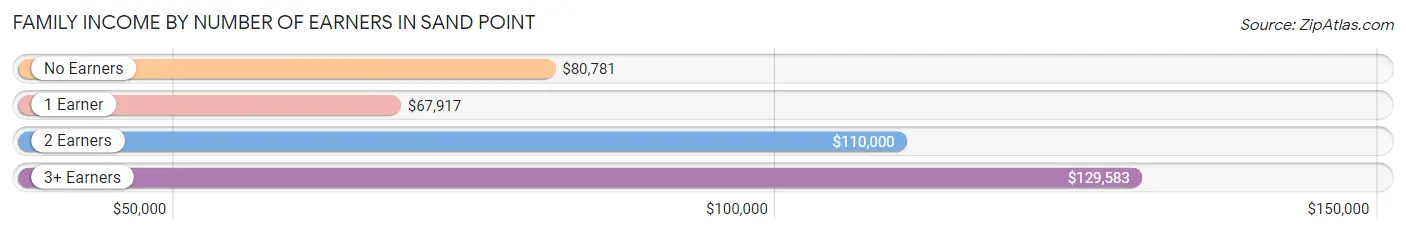
| Number of Earners | # Families | Median Income |
| No Earners | 11 (4.4%) | $80,781 |
| 1 Earner | 103 (41.0%) | $67,917 |
| 2 Earners | 98 (39.0%) | $110,000 |
| 3+ Earners | 39 (15.5%) | $129,583 |
| Total | 251 (100.0%) | $91,250 |
Household Income in Sand Point
Household Income Brackets in Sand Point
With 67 households falling in the category, the $150,000 to $199,999 income range is the most frequent in Sand Point, accounting for 19.7% of all households. In contrast, only 8 households (2.4%) fall into the $10,000 to $14,999 income bracket, making it the least populous group.
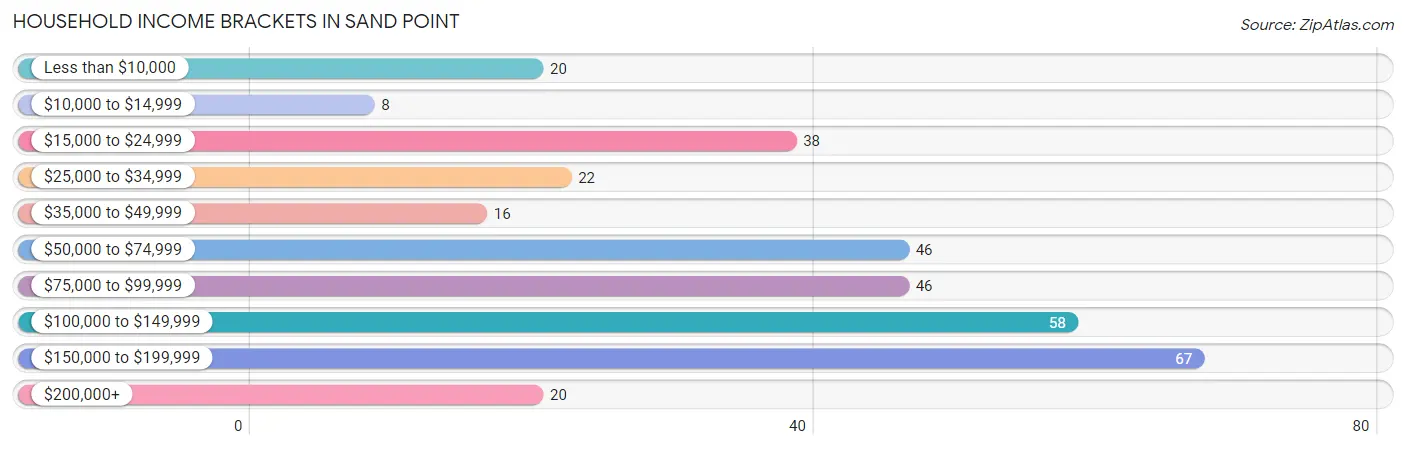
| Income Bracket | # Households | % Households |
| Less than $10,000 | 20 | 5.9% |
| $10,000 to $14,999 | 8 | 2.3% |
| $15,000 to $24,999 | 38 | 11.1% |
| $25,000 to $34,999 | 22 | 6.5% |
| $35,000 to $49,999 | 16 | 4.7% |
| $50,000 to $74,999 | 46 | 13.5% |
| $75,000 to $99,999 | 46 | 13.5% |
| $100,000 to $149,999 | 58 | 17.0% |
| $150,000 to $199,999 | 67 | 19.6% |
| $200,000+ | 20 | 5.9% |
Household Income by Householder Age in Sand Point
The median household income in Sand Point is $79,922, with the highest median household income of $129,375 found in the 45 to 64 years age bracket for the primary householder. A total of 159 households (46.6%) fall into this category. Meanwhile, the 15 to 24 years age bracket for the primary householder has the lowest median household income of $0, with 4 households (1.2%) in this group.
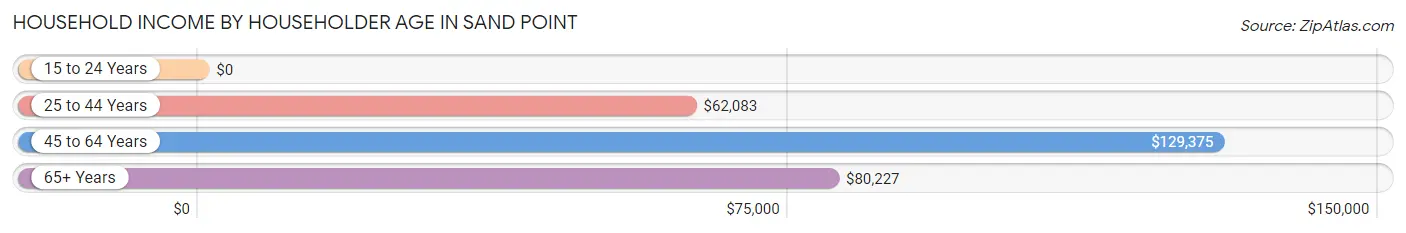
| Income Bracket | # Households | Median Income |
| 15 to 24 Years | 4 (1.2%) | $0 |
| 25 to 44 Years | 80 (23.5%) | $62,083 |
| 45 to 64 Years | 159 (46.6%) | $129,375 |
| 65+ Years | 98 (28.7%) | $80,227 |
| Total | 341 (100.0%) | $79,922 |
Poverty in Sand Point
Income Below Poverty by Sex and Age in Sand Point
With 10.1% poverty level for males and 7.5% for females among the residents of Sand Point, 6 to 11 year old males and 12 to 14 year old females are the most vulnerable to poverty, with 5 males (33.3%) and 3 females (100.0%) in their respective age groups living below the poverty level.
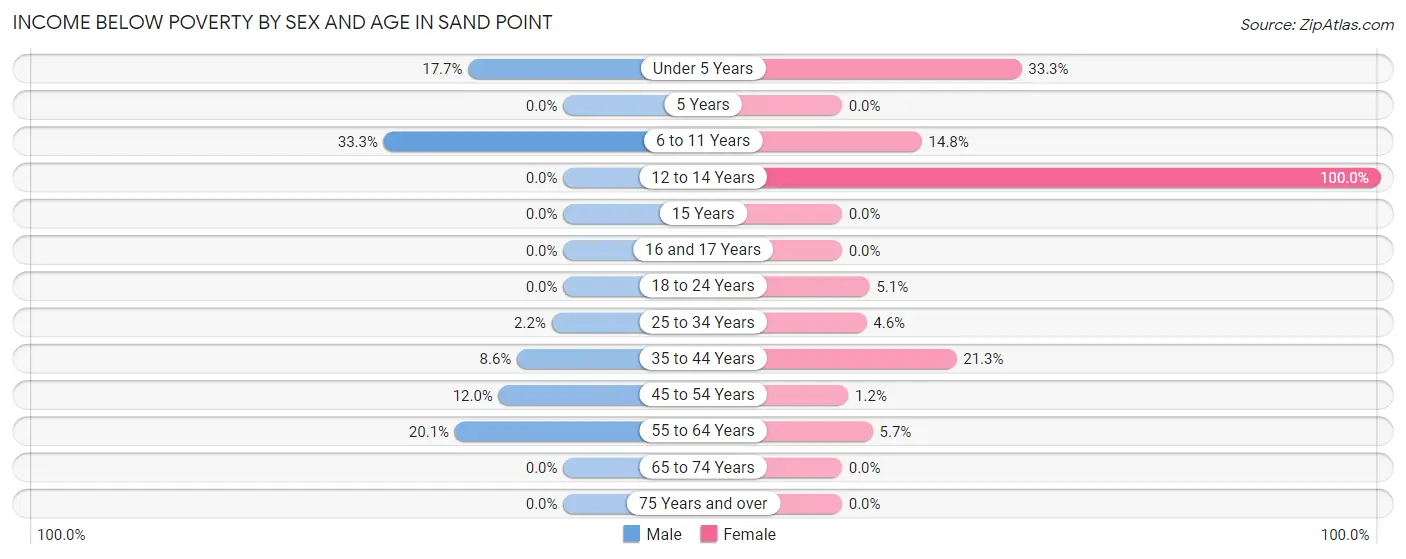
| Age Bracket | Male | Female |
| Under 5 Years | 3 (17.6%) | 2 (33.3%) |
| 5 Years | 0 (0.0%) | 0 (0.0%) |
| 6 to 11 Years | 5 (33.3%) | 4 (14.8%) |
| 12 to 14 Years | 0 (0.0%) | 3 (100.0%) |
| 15 Years | 0 (0.0%) | 0 (0.0%) |
| 16 and 17 Years | 0 (0.0%) | 0 (0.0%) |
| 18 to 24 Years | 0 (0.0%) | 2 (5.1%) |
| 25 to 34 Years | 2 (2.1%) | 2 (4.5%) |
| 35 to 44 Years | 6 (8.6%) | 17 (21.2%) |
| 45 to 54 Years | 12 (12.0%) | 1 (1.2%) |
| 55 to 64 Years | 30 (20.1%) | 4 (5.7%) |
| 65 to 74 Years | 0 (0.0%) | 0 (0.0%) |
| 75 Years and over | 0 (0.0%) | 0 (0.0%) |
| Total | 58 (10.1%) | 35 (7.5%) |
Income Above Poverty by Sex and Age in Sand Point
According to the poverty statistics in Sand Point, males aged 5 years and females aged 5 years are the age groups that are most secure financially, with 100.0% of males and 100.0% of females in these age groups living above the poverty line.
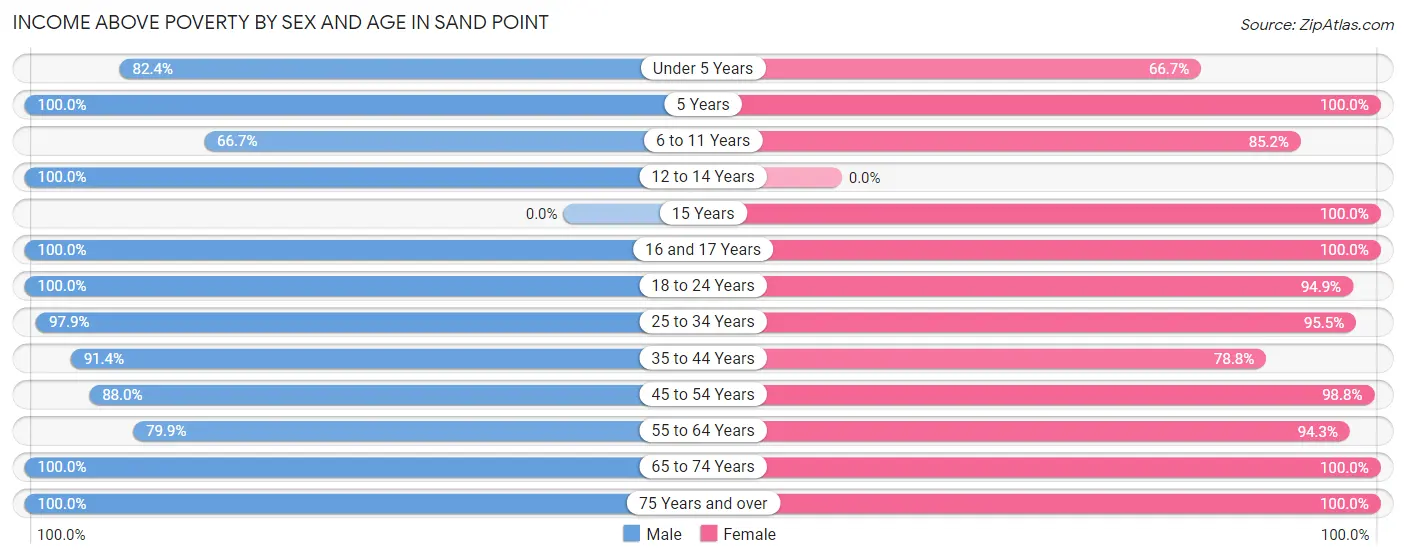
| Age Bracket | Male | Female |
| Under 5 Years | 14 (82.4%) | 4 (66.7%) |
| 5 Years | 2 (100.0%) | 2 (100.0%) |
| 6 to 11 Years | 10 (66.7%) | 23 (85.2%) |
| 12 to 14 Years | 15 (100.0%) | 0 (0.0%) |
| 15 Years | 0 (0.0%) | 3 (100.0%) |
| 16 and 17 Years | 23 (100.0%) | 7 (100.0%) |
| 18 to 24 Years | 15 (100.0%) | 37 (94.9%) |
| 25 to 34 Years | 91 (97.9%) | 42 (95.5%) |
| 35 to 44 Years | 64 (91.4%) | 63 (78.7%) |
| 45 to 54 Years | 88 (88.0%) | 84 (98.8%) |
| 55 to 64 Years | 119 (79.9%) | 66 (94.3%) |
| 65 to 74 Years | 59 (100.0%) | 73 (100.0%) |
| 75 Years and over | 18 (100.0%) | 28 (100.0%) |
| Total | 518 (89.9%) | 432 (92.5%) |
Income Below Poverty Among Married-Couple Families in Sand Point
The poverty statistics for married-couple families in Sand Point show that 1.6% or 3 of the total 187 families live below the poverty line. Families with 1 or 2 children have the highest poverty rate of 5.9%, comprising of 3 families. On the other hand, families with no children have the lowest poverty rate of 0.0%, which includes 0 families.
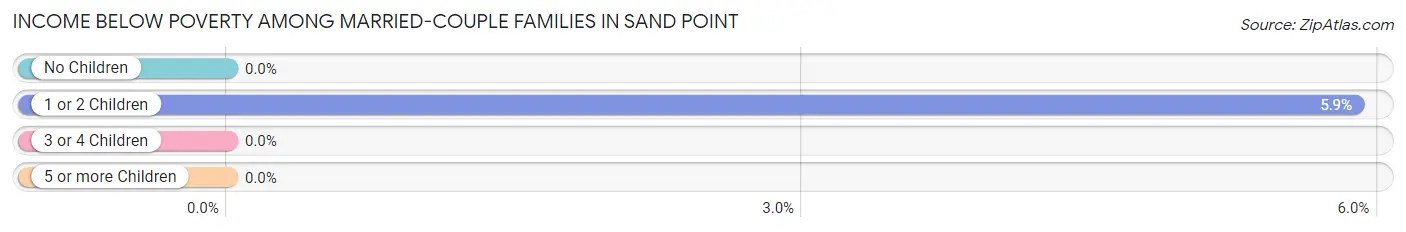
| Children | Above Poverty | Below Poverty |
| No Children | 133 (100.0%) | 0 (0.0%) |
| 1 or 2 Children | 48 (94.1%) | 3 (5.9%) |
| 3 or 4 Children | 3 (100.0%) | 0 (0.0%) |
| 5 or more Children | 0 (0.0%) | 0 (0.0%) |
| Total | 184 (98.4%) | 3 (1.6%) |
Income Below Poverty Among Single-Parent Households in Sand Point
According to the poverty data in Sand Point, 21.4% or 6 single-father households and 16.7% or 6 single-mother households are living below the poverty line. Among single-father households, those with 3 or 4 children have the highest poverty rate, with 3 households (100.0%) experiencing poverty. Likewise, among single-mother households, those with 1 or 2 children have the highest poverty rate, with 6 households (24.0%) falling below the poverty line.
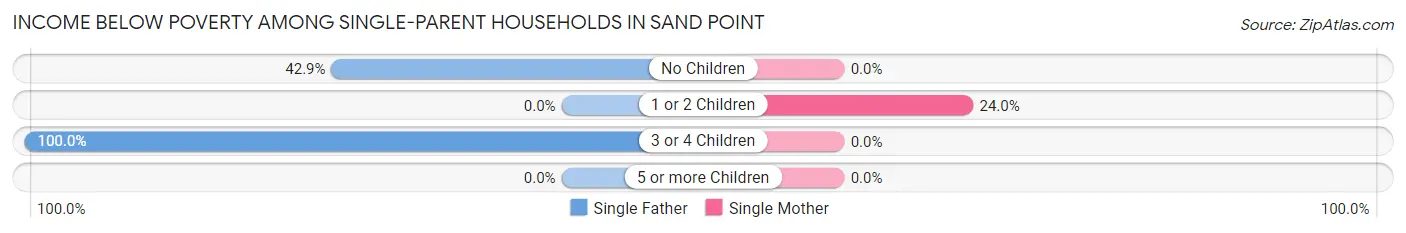
| Children | Single Father | Single Mother |
| No Children | 3 (42.9%) | 0 (0.0%) |
| 1 or 2 Children | 0 (0.0%) | 6 (24.0%) |
| 3 or 4 Children | 3 (100.0%) | 0 (0.0%) |
| 5 or more Children | 0 (0.0%) | 0 (0.0%) |
| Total | 6 (21.4%) | 6 (16.7%) |
Income Below Poverty Among Married-Couple vs Single-Parent Households in Sand Point
The poverty data for Sand Point shows that 3 of the married-couple family households (1.6%) and 12 of the single-parent households (18.8%) are living below the poverty level. Within the married-couple family households, those with 1 or 2 children have the highest poverty rate, with 3 households (5.9%) falling below the poverty line. Among the single-parent households, those with 3 or 4 children have the highest poverty rate, with 3 household (60.0%) living below poverty.
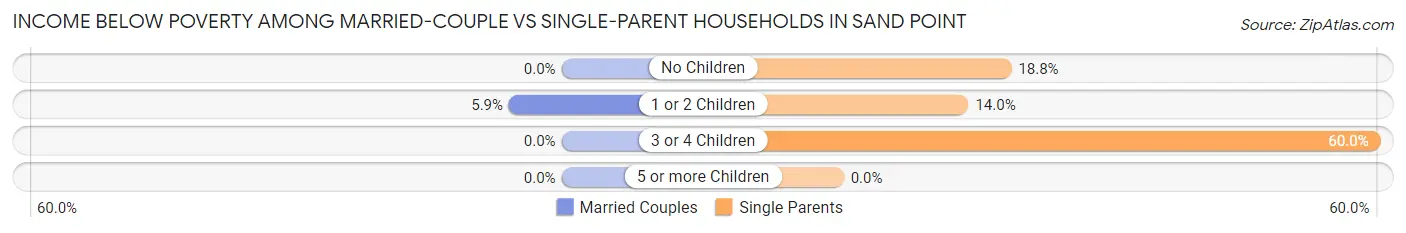
| Children | Married-Couple Families | Single-Parent Households |
| No Children | 0 (0.0%) | 3 (18.8%) |
| 1 or 2 Children | 3 (5.9%) | 6 (14.0%) |
| 3 or 4 Children | 0 (0.0%) | 3 (60.0%) |
| 5 or more Children | 0 (0.0%) | 0 (0.0%) |
| Total | 3 (1.6%) | 12 (18.8%) |
Race in Sand Point
The most populous races in Sand Point are Native / Alaskan (419 | 40.0%), Asian (216 | 20.6%), and Two or more Races (185 | 17.6%).
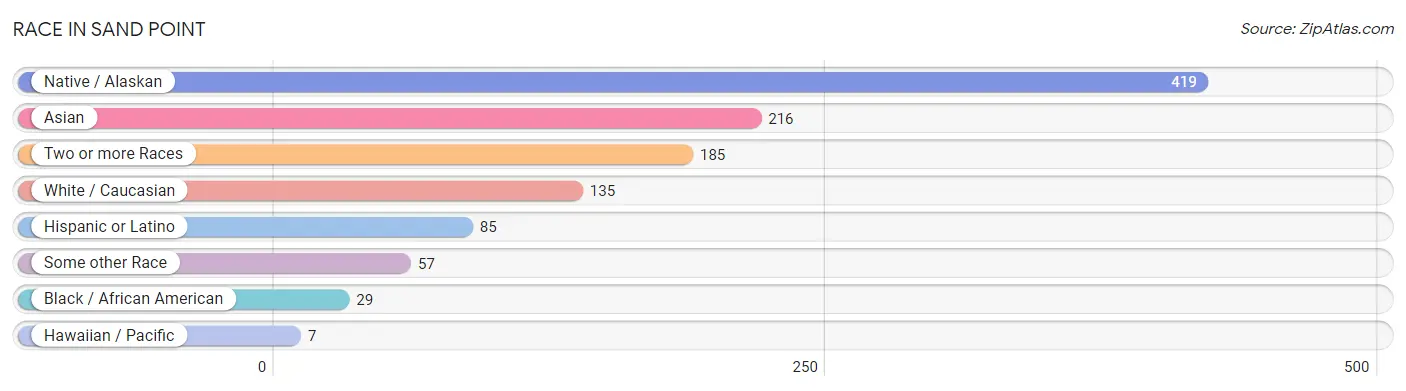
| Race | # Population | % Population |
| Asian | 216 | 20.6% |
| Black / African American | 29 | 2.8% |
| Hawaiian / Pacific | 7 | 0.7% |
| Hispanic or Latino | 85 | 8.1% |
| Native / Alaskan | 419 | 40.0% |
| White / Caucasian | 135 | 12.9% |
| Two or more Races | 185 | 17.6% |
| Some other Race | 57 | 5.4% |
| Total | 1,048 | 100.0% |
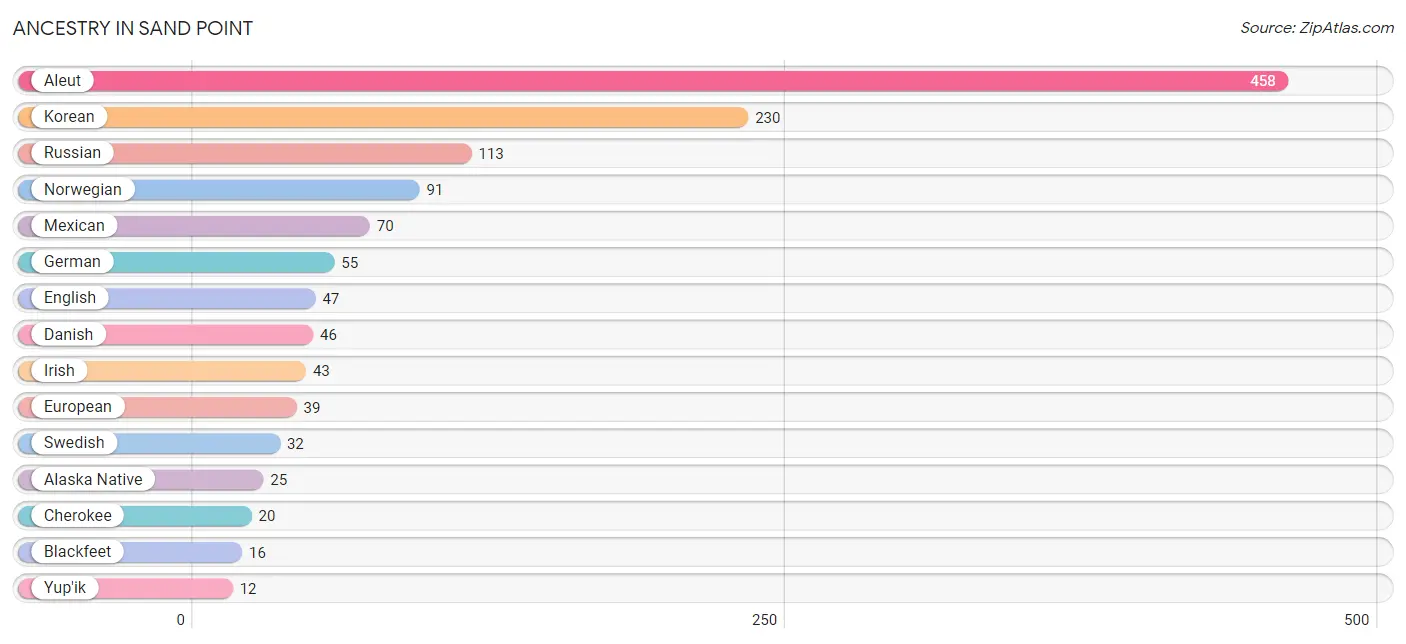
Ancestry in Sand Point
The most populous ancestries reported in Sand Point are Aleut (458 | 43.7%), Korean (230 | 22.0%), Russian (113 | 10.8%), Norwegian (91 | 8.7%), and Mexican (70 | 6.7%), together accounting for 91.8% of all Sand Point residents.
| Ancestry | # Population | % Population |
| Alaska Native | 25 | 2.4% |
| Alaskan Athabascan | 9 | 0.9% |
| Aleut | 458 | 43.7% |
| American | 10 | 0.9% |
| Apache | 3 | 0.3% |
| Austrian | 3 | 0.3% |
| Bhutanese | 9 | 0.9% |
| Blackfeet | 16 | 1.5% |
| British | 9 | 0.9% |
| Canadian | 3 | 0.3% |
| Cherokee | 20 | 1.9% |
| Danish | 46 | 4.4% |
| Dutch | 4 | 0.4% |
| English | 47 | 4.5% |
| European | 39 | 3.7% |
| Finnish | 10 | 0.9% |
| German | 55 | 5.2% |
| Guamanian / Chamorro | 1 | 0.1% |
| Indian (Asian) | 2 | 0.2% |
| Irish | 43 | 4.1% |
| Italian | 2 | 0.2% |
| Korean | 230 | 22.0% |
| Marshallese | 7 | 0.7% |
| Mexican | 70 | 6.7% |
| Native Hawaiian | 1 | 0.1% |
| Norwegian | 91 | 8.7% |
| Polish | 4 | 0.4% |
| Puerto Rican | 5 | 0.5% |
| Russian | 113 | 10.8% |
| Scandinavian | 3 | 0.3% |
| Scotch-Irish | 4 | 0.4% |
| Scottish | 2 | 0.2% |
| Spanish | 10 | 0.9% |
| Sri Lankan | 11 | 1.1% |
| Swedish | 32 | 3.0% |
| Tlingit-Haida | 5 | 0.5% |
| Ukrainian | 6 | 0.6% |
| Welsh | 6 | 0.6% |
| Yup'ik | 12 | 1.1% | View All 39 Rows |
Immigrants in Sand Point
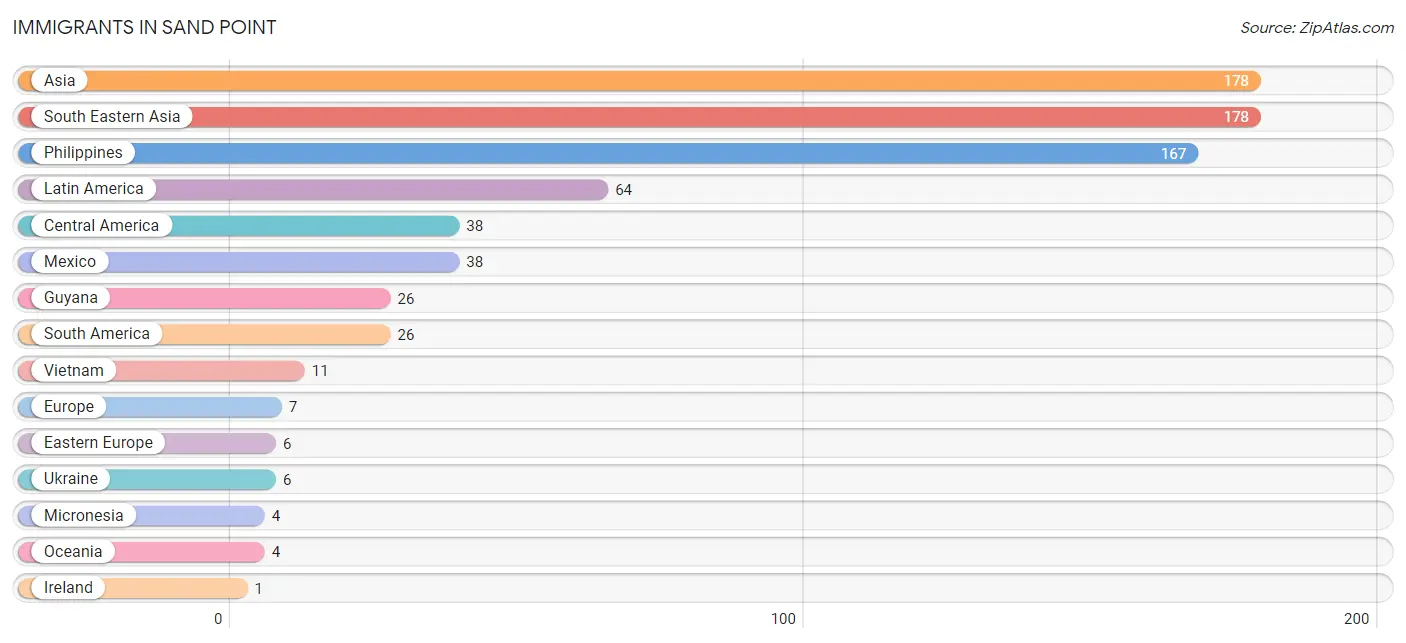
The most numerous immigrant groups reported in Sand Point came from Asia (178 | 17.0%), South Eastern Asia (178 | 17.0%), Philippines (167 | 15.9%), Latin America (64 | 6.1%), and Central America (38 | 3.6%), together accounting for 59.6% of all Sand Point residents.
| Immigration Origin | # Population | % Population |
| Asia | 178 | 17.0% |
| Central America | 38 | 3.6% |
| Eastern Europe | 6 | 0.6% |
| Europe | 7 | 0.7% |
| Guyana | 26 | 2.5% |
| Ireland | 1 | 0.1% |
| Latin America | 64 | 6.1% |
| Mexico | 38 | 3.6% |
| Micronesia | 4 | 0.4% |
| Northern Europe | 1 | 0.1% |
| Oceania | 4 | 0.4% |
| Philippines | 167 | 15.9% |
| South America | 26 | 2.5% |
| South Eastern Asia | 178 | 17.0% |
| Ukraine | 6 | 0.6% |
| Vietnam | 11 | 1.1% | View All 16 Rows |
Sex and Age in Sand Point
Sex and Age in Sand Point
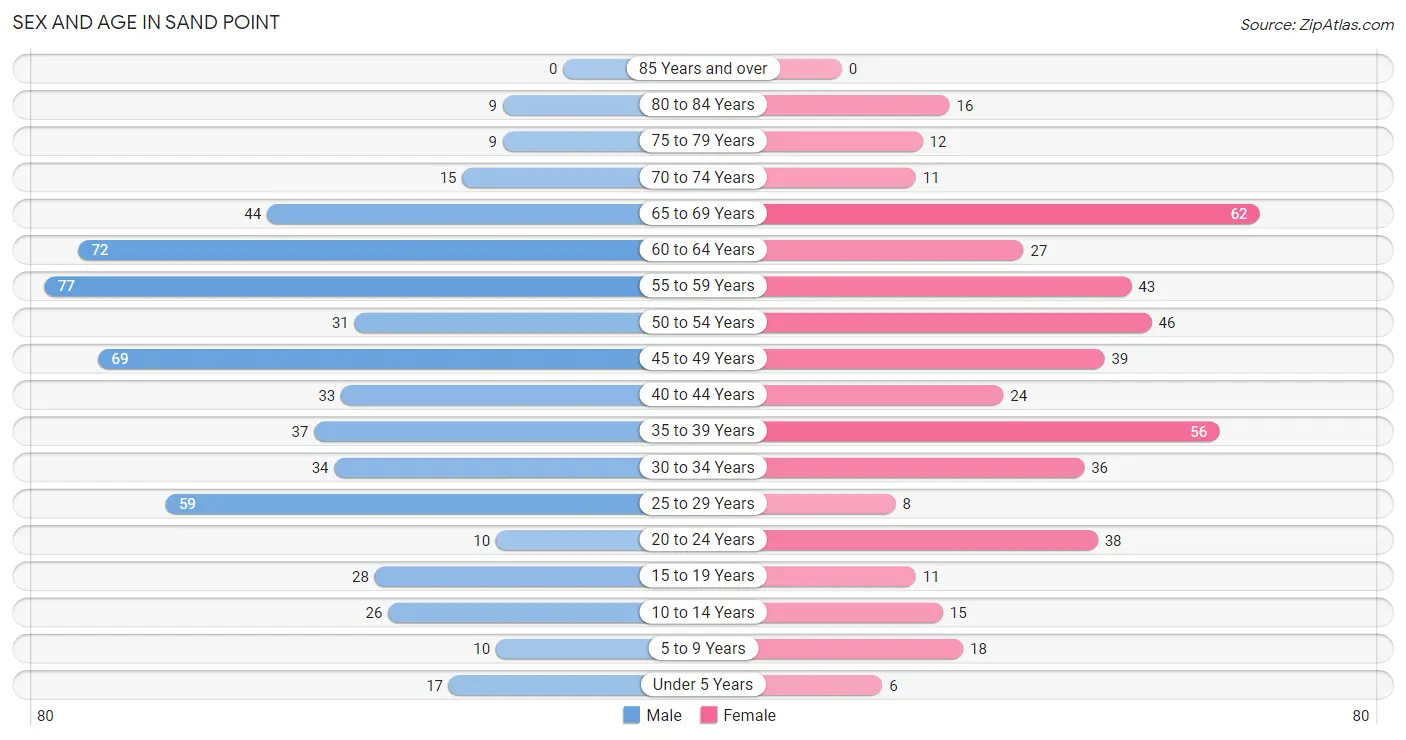
The most populous age groups in Sand Point are 55 to 59 Years (77 | 13.3%) for men and 65 to 69 Years (62 | 13.3%) for women.
| Age Bracket | Male | Female |
| Under 5 Years | 17 (2.9%) | 6 (1.3%) |
| 5 to 9 Years | 10 (1.7%) | 18 (3.8%) |
| 10 to 14 Years | 26 (4.5%) | 15 (3.2%) |
| 15 to 19 Years | 28 (4.8%) | 11 (2.4%) |
| 20 to 24 Years | 10 (1.7%) | 38 (8.1%) |
| 25 to 29 Years | 59 (10.2%) | 8 (1.7%) |
| 30 to 34 Years | 34 (5.9%) | 36 (7.7%) |
| 35 to 39 Years | 37 (6.4%) | 56 (12.0%) |
| 40 to 44 Years | 33 (5.7%) | 24 (5.1%) |
| 45 to 49 Years | 69 (11.9%) | 39 (8.3%) |
| 50 to 54 Years | 31 (5.3%) | 46 (9.8%) |
| 55 to 59 Years | 77 (13.3%) | 43 (9.2%) |
| 60 to 64 Years | 72 (12.4%) | 27 (5.8%) |
| 65 to 69 Years | 44 (7.6%) | 62 (13.3%) |
| 70 to 74 Years | 15 (2.6%) | 11 (2.4%) |
| 75 to 79 Years | 9 (1.5%) | 12 (2.6%) |
| 80 to 84 Years | 9 (1.5%) | 16 (3.4%) |
| 85 Years and over | 0 (0.0%) | 0 (0.0%) |
| Total | 580 (100.0%) | 468 (100.0%) |
Families and Households in Sand Point
Median Family Size in Sand Point
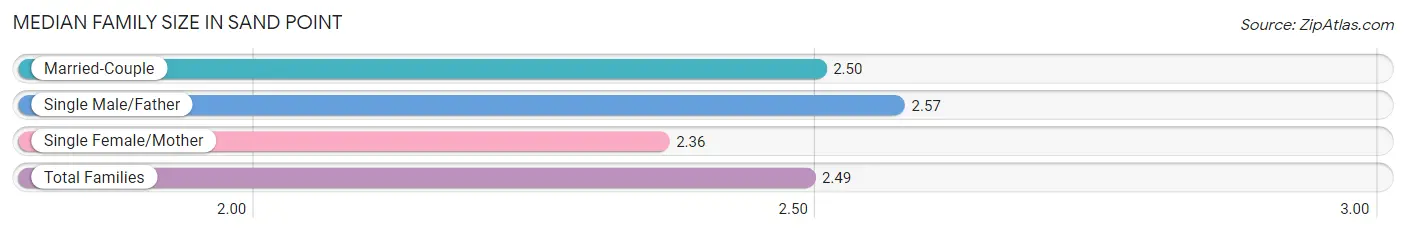
The median family size in Sand Point is 2.49 persons per family, with single male/father families (28 | 11.2%) accounting for the largest median family size of 2.57 persons per family. On the other hand, single female/mother families (36 | 14.3%) represent the smallest median family size with 2.36 persons per family.
| Family Type | # Families | Family Size |
| Married-Couple | 187 (74.5%) | 2.50 |
| Single Male/Father | 28 (11.2%) | 2.57 |
| Single Female/Mother | 36 (14.3%) | 2.36 |
| Total Families | 251 (100.0%) | 2.49 |
Median Household Size in Sand Point
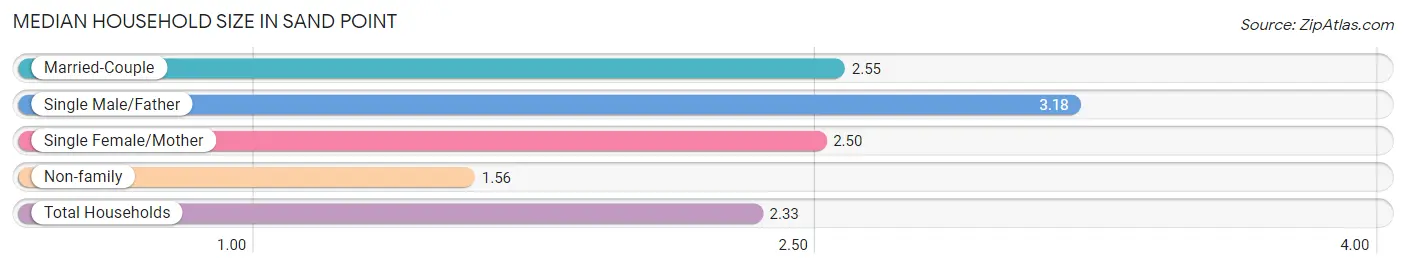
The median household size in Sand Point is 2.33 persons per household, with single male/father households (28 | 8.2%) accounting for the largest median household size of 3.18 persons per household. non-family households (90 | 26.4%) represent the smallest median household size with 1.56 persons per household.
| Household Type | # Households | Household Size |
| Married-Couple | 187 (54.8%) | 2.55 |
| Single Male/Father | 28 (8.2%) | 3.18 |
| Single Female/Mother | 36 (10.6%) | 2.50 |
| Non-family | 90 (26.4%) | 1.56 |
| Total Households | 341 (100.0%) | 2.33 |
Household Size by Marriage Status in Sand Point
Out of a total of 341 households in Sand Point, 251 (73.6%) are family households, while 90 (26.4%) are nonfamily households. The most numerous type of family households are 2-person households, comprising 137, and the most common type of nonfamily households are 1-person households, comprising 69.
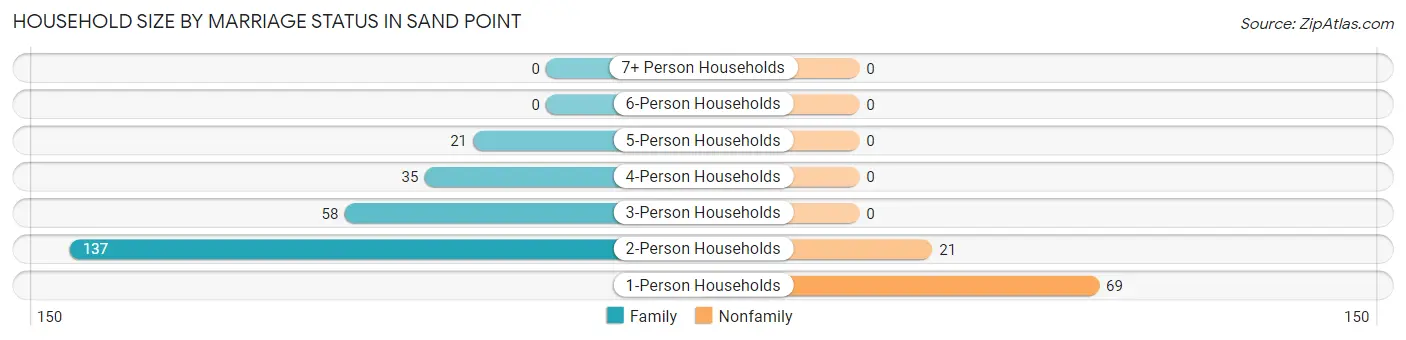
| Household Size | Family Households | Nonfamily Households |
| 1-Person Households | - | 69 (20.2%) |
| 2-Person Households | 137 (40.2%) | 21 (6.2%) |
| 3-Person Households | 58 (17.0%) | 0 (0.0%) |
| 4-Person Households | 35 (10.3%) | 0 (0.0%) |
| 5-Person Households | 21 (6.2%) | 0 (0.0%) |
| 6-Person Households | 0 (0.0%) | 0 (0.0%) |
| 7+ Person Households | 0 (0.0%) | 0 (0.0%) |
| Total | 251 (73.6%) | 90 (26.4%) |
Female Fertility in Sand Point
Fertility by Age in Sand Point
Average fertility rate in Sand Point is 69.0 births per 1,000 women. Women in the age bracket of 20 to 34 years have the highest fertility rate with 159.0 births per 1,000 women. Women in the age bracket of 20 to 34 years acount for 86.7% of all women with births.
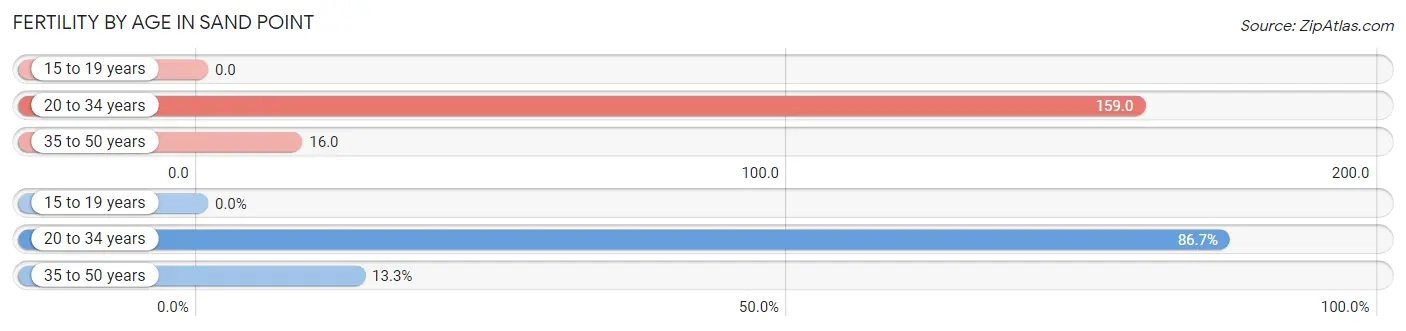
| Age Bracket | Women with Births | Births / 1,000 Women |
| 15 to 19 years | 0 (0.0%) | 0.0 |
| 20 to 34 years | 13 (86.7%) | 159.0 |
| 35 to 50 years | 2 (13.3%) | 16.0 |
| Total | 15 (100.0%) | 69.0 |
Fertility by Age by Marriage Status in Sand Point
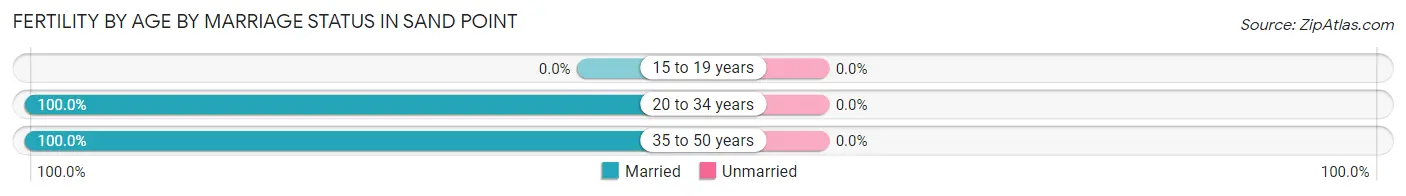
| Age Bracket | Married | Unmarried |
| 15 to 19 years | 0 (0.0%) | 0 (0.0%) |
| 20 to 34 years | 13 (100.0%) | 0 (0.0%) |
| 35 to 50 years | 2 (100.0%) | 0 (0.0%) |
| Total | 15 (100.0%) | 0 (0.0%) |
Fertility by Education in Sand Point
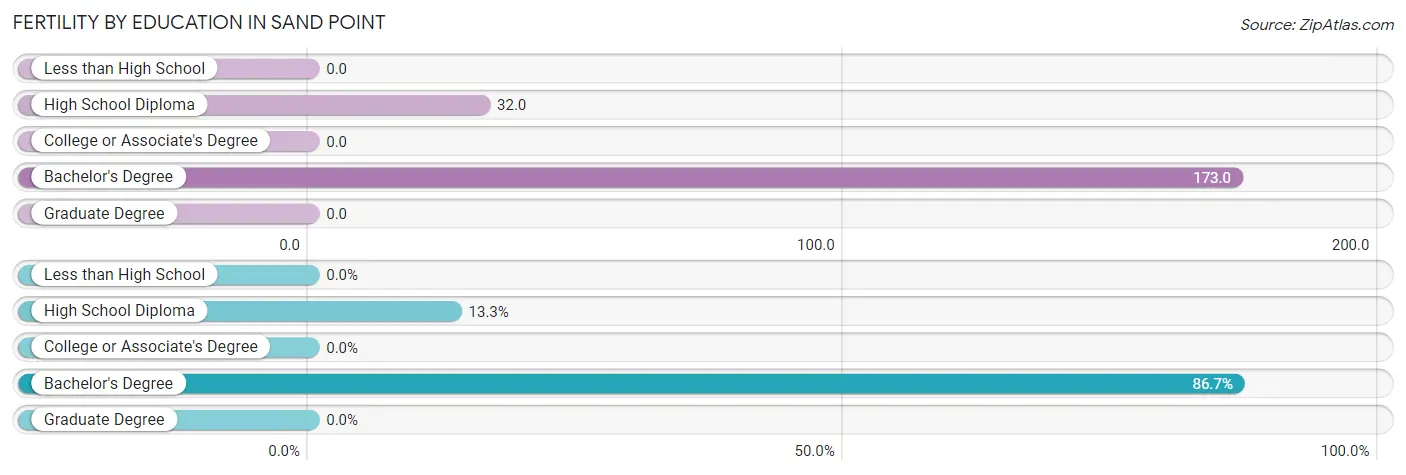
| Educational Attainment | Women with Births | Births / 1,000 Women |
| Less than High School | 0 (0.0%) | 0.0 |
| High School Diploma | 2 (13.3%) | 32.0 |
| College or Associate's Degree | 0 (0.0%) | 0.0 |
| Bachelor's Degree | 13 (86.7%) | 173.0 |
| Graduate Degree | 0 (0.0%) | 0.0 |
| Total | 15 (100.0%) | 69.0 |
Fertility by Education by Marriage Status in Sand Point
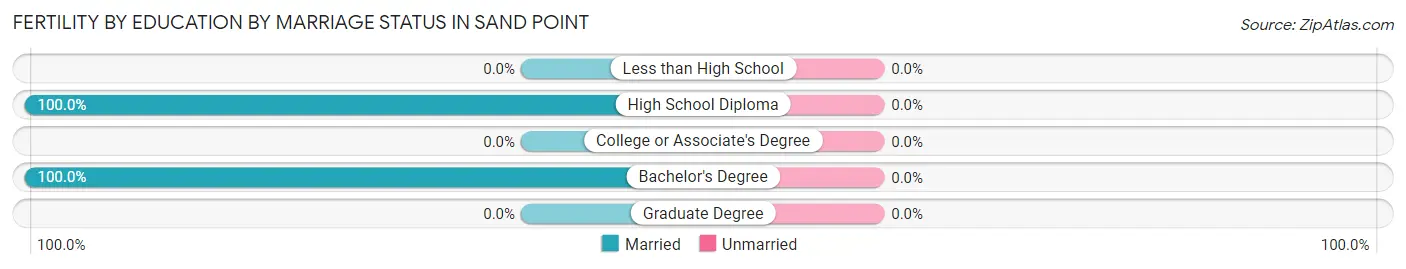
| Educational Attainment | Married | Unmarried |
| Less than High School | 0 (0.0%) | 0 (0.0%) |
| High School Diploma | 2 (100.0%) | 0 (0.0%) |
| College or Associate's Degree | 0 (0.0%) | 0 (0.0%) |
| Bachelor's Degree | 13 (100.0%) | 0 (0.0%) |
| Graduate Degree | 0 (0.0%) | 0 (0.0%) |
| Total | 15 (100.0%) | 0 (0.0%) |
Employment Characteristics in Sand Point
Employment by Class of Employer in Sand Point
Among the 617 employed individuals in Sand Point, private company employees (331 | 53.6%), local government employees (142 | 23.0%), and self-employed (not incorporated) (89 | 14.4%) make up the most common classes of employment.
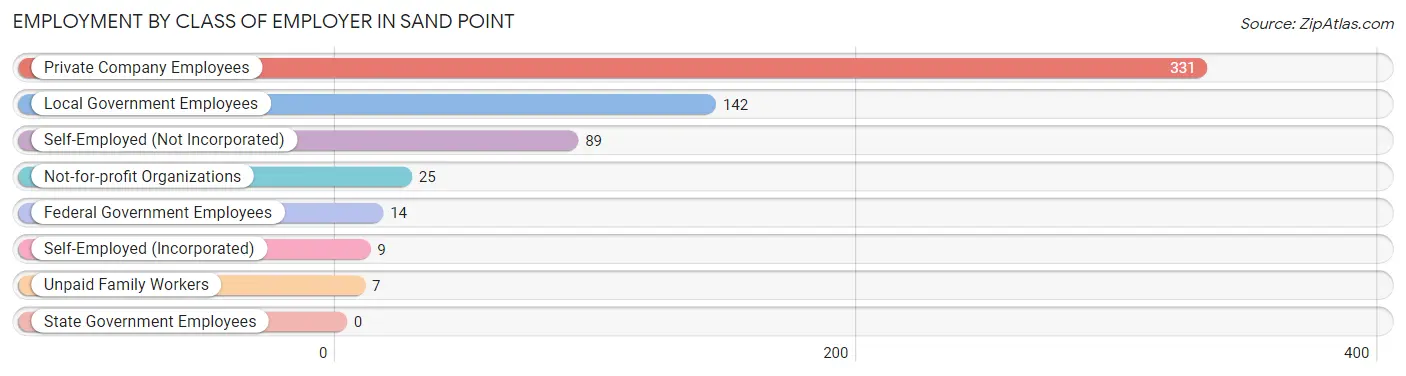
| Employer Class | # Employees | % Employees |
| Private Company Employees | 331 | 53.6% |
| Self-Employed (Incorporated) | 9 | 1.5% |
| Self-Employed (Not Incorporated) | 89 | 14.4% |
| Not-for-profit Organizations | 25 | 4.1% |
| Local Government Employees | 142 | 23.0% |
| State Government Employees | 0 | 0.0% |
| Federal Government Employees | 14 | 2.3% |
| Unpaid Family Workers | 7 | 1.1% |
| Total | 617 | 100.0% |
Employment Status by Age in Sand Point
According to the labor force statistics for Sand Point, out of the total population over 16 years of age (953), 71.4% or 680 individuals are in the labor force, with 3.2% or 22 of them unemployed. The age group with the highest labor force participation rate is 25 to 29 years, with 89.6% or 60 individuals in the labor force. Within the labor force, the 20 to 24 years age range has the highest percentage of unemployed individuals, with 9.5% or 4 of them being unemployed.
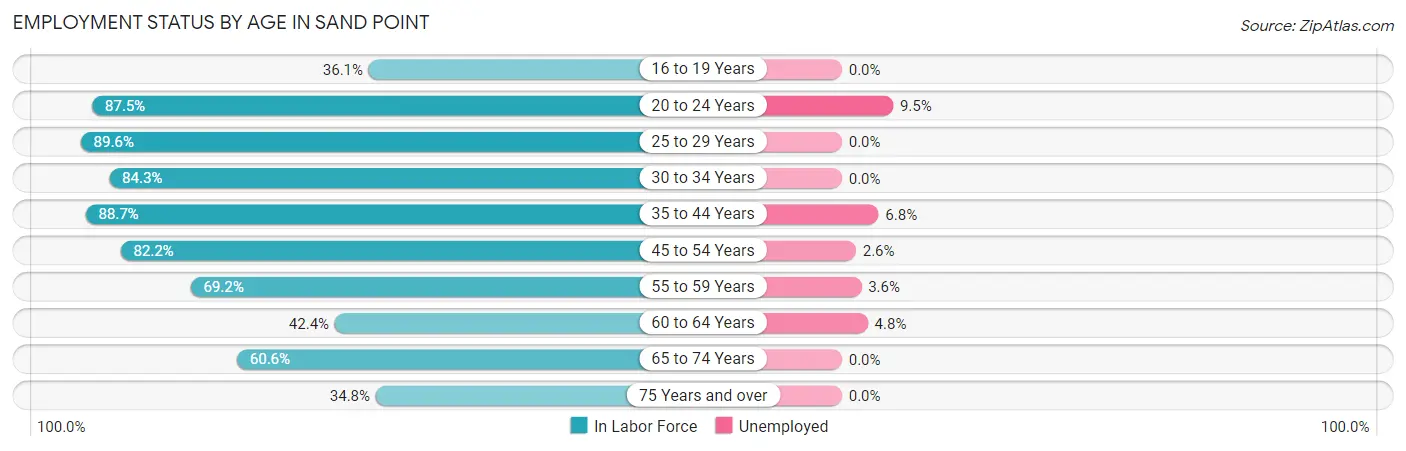
| Age Bracket | In Labor Force | Unemployed |
| 16 to 19 Years | 13 (36.1%) | 0 (0.0%) |
| 20 to 24 Years | 42 (87.5%) | 4 (9.5%) |
| 25 to 29 Years | 60 (89.6%) | 0 (0.0%) |
| 30 to 34 Years | 59 (84.3%) | 0 (0.0%) |
| 35 to 44 Years | 133 (88.7%) | 9 (6.8%) |
| 45 to 54 Years | 152 (82.2%) | 4 (2.6%) |
| 55 to 59 Years | 83 (69.2%) | 3 (3.6%) |
| 60 to 64 Years | 42 (42.4%) | 2 (4.8%) |
| 65 to 74 Years | 80 (60.6%) | 0 (0.0%) |
| 75 Years and over | 16 (34.8%) | 0 (0.0%) |
| Total | 680 (71.4%) | 22 (3.2%) |
Employment Status by Educational Attainment in Sand Point
According to labor force statistics for Sand Point, 76.6% of individuals (529) out of the total population between 25 and 64 years of age (691) are in the labor force, with 3.4% or 18 of them being unemployed. The group with the highest labor force participation rate are those with the educational attainment of college / associate degree, with 82.7% or 139 individuals in the labor force. Within the labor force, individuals with high school diploma education have the highest percentage of unemployment, with 6.7% or 15 of them being unemployed.
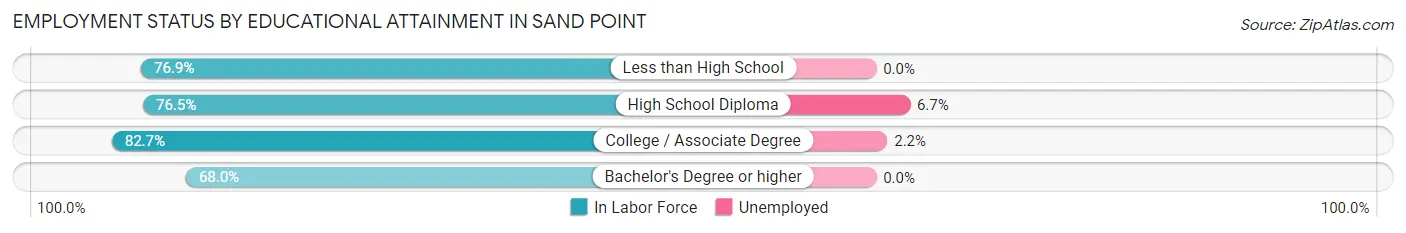
| Educational Attainment | In Labor Force | Unemployed |
| Less than High School | 80 (76.9%) | 0 (0.0%) |
| High School Diploma | 225 (76.5%) | 20 (6.7%) |
| College / Associate Degree | 139 (82.7%) | 4 (2.2%) |
| Bachelor's Degree or higher | 85 (68.0%) | 0 (0.0%) |
| Total | 529 (76.6%) | 23 (3.4%) |
Employment Occupations by Sex in Sand Point
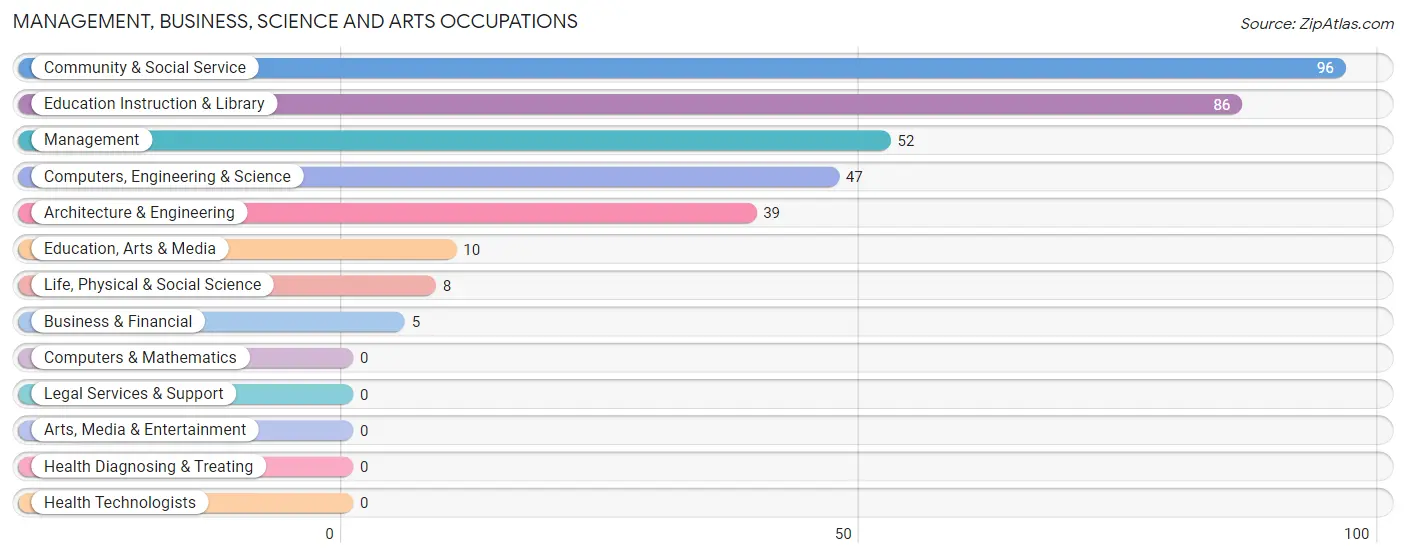
Management, Business, Science and Arts Occupations
The most common Management, Business, Science and Arts occupations in Sand Point are Community & Social Service (96 | 14.6%), Education Instruction & Library (86 | 13.1%), Management (52 | 7.9%), Computers, Engineering & Science (47 | 7.1%), and Architecture & Engineering (39 | 5.9%).
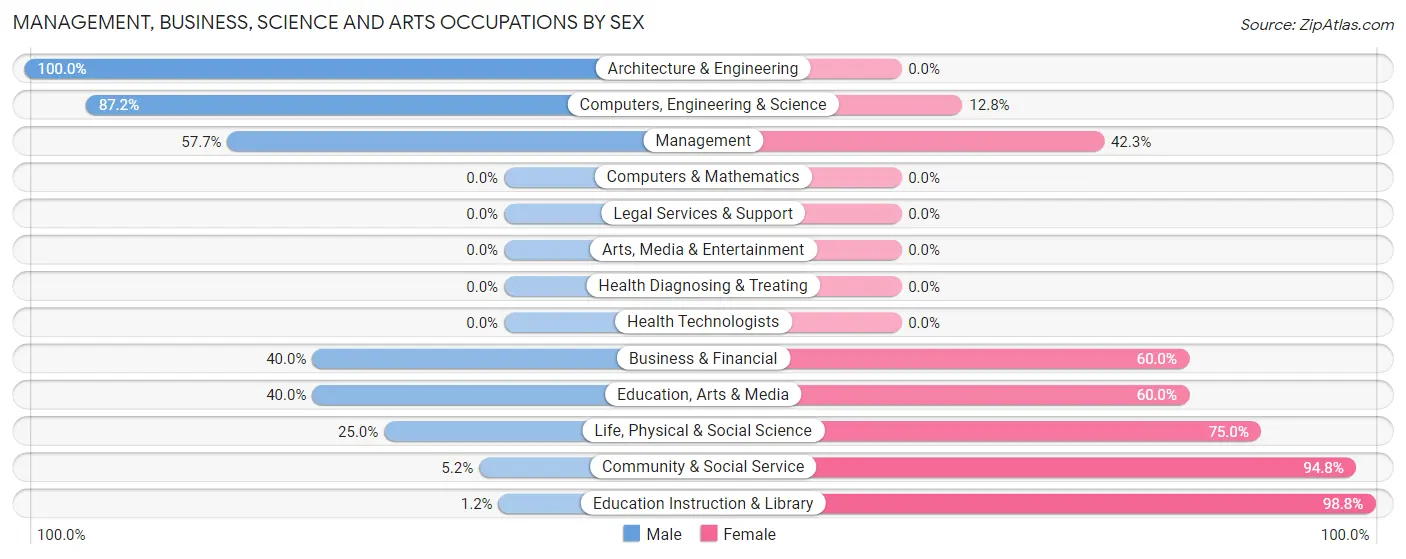
Management, Business, Science and Arts Occupations by Sex
Within the Management, Business, Science and Arts occupations in Sand Point, the most male-oriented occupations are Architecture & Engineering (100.0%), Computers, Engineering & Science (87.2%), and Management (57.7%), while the most female-oriented occupations are Education Instruction & Library (98.8%), Community & Social Service (94.8%), and Life, Physical & Social Science (75.0%).
| Occupation | Male | Female |
| Management | 30 (57.7%) | 22 (42.3%) |
| Business & Financial | 2 (40.0%) | 3 (60.0%) |
| Computers, Engineering & Science | 41 (87.2%) | 6 (12.8%) |
| Computers & Mathematics | 0 (0.0%) | 0 (0.0%) |
| Architecture & Engineering | 39 (100.0%) | 0 (0.0%) |
| Life, Physical & Social Science | 2 (25.0%) | 6 (75.0%) |
| Community & Social Service | 5 (5.2%) | 91 (94.8%) |
| Education, Arts & Media | 4 (40.0%) | 6 (60.0%) |
| Legal Services & Support | 0 (0.0%) | 0 (0.0%) |
| Education Instruction & Library | 1 (1.2%) | 85 (98.8%) |
| Arts, Media & Entertainment | 0 (0.0%) | 0 (0.0%) |
| Health Diagnosing & Treating | 0 (0.0%) | 0 (0.0%) |
| Health Technologists | 0 (0.0%) | 0 (0.0%) |
| Total (Category) | 78 (39.0%) | 122 (61.0%) |
| Total (Overall) | 327 (49.7%) | 331 (50.3%) |
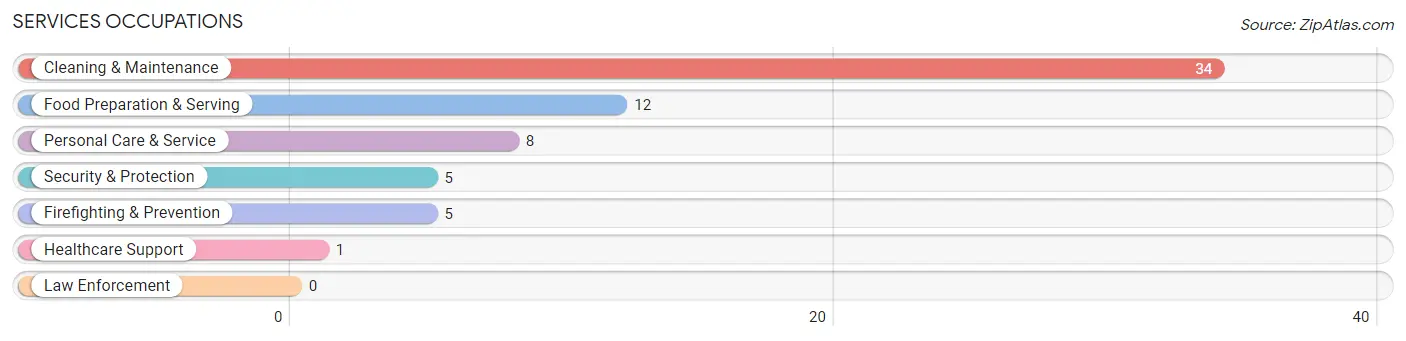
Services Occupations
The most common Services occupations in Sand Point are Cleaning & Maintenance (34 | 5.2%), Food Preparation & Serving (12 | 1.8%), Personal Care & Service (8 | 1.2%), Security & Protection (5 | 0.8%), and Firefighting & Prevention (5 | 0.8%).
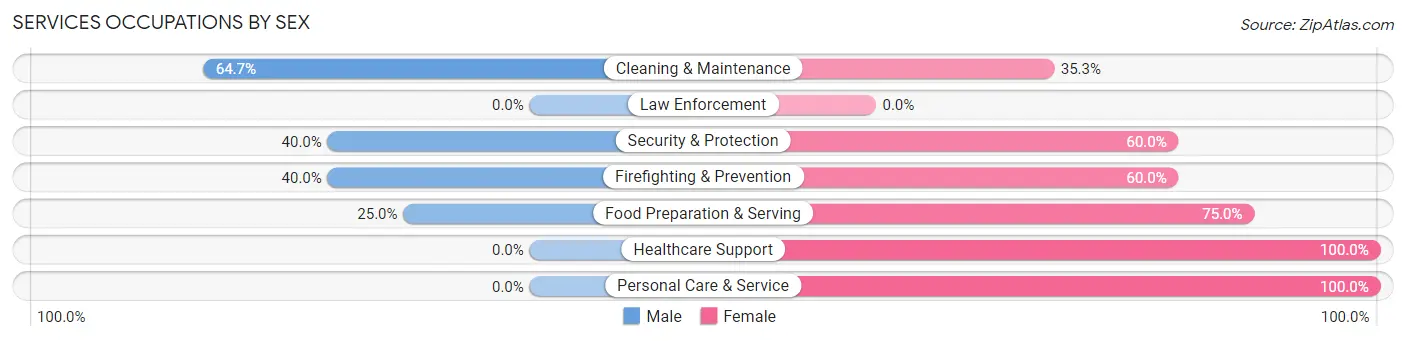
Services Occupations by Sex
Within the Services occupations in Sand Point, the most male-oriented occupations are Cleaning & Maintenance (64.7%), Security & Protection (40.0%), and Firefighting & Prevention (40.0%), while the most female-oriented occupations are Healthcare Support (100.0%), Personal Care & Service (100.0%), and Food Preparation & Serving (75.0%).
| Occupation | Male | Female |
| Healthcare Support | 0 (0.0%) | 1 (100.0%) |
| Security & Protection | 2 (40.0%) | 3 (60.0%) |
| Firefighting & Prevention | 2 (40.0%) | 3 (60.0%) |
| Law Enforcement | 0 (0.0%) | 0 (0.0%) |
| Food Preparation & Serving | 3 (25.0%) | 9 (75.0%) |
| Cleaning & Maintenance | 22 (64.7%) | 12 (35.3%) |
| Personal Care & Service | 0 (0.0%) | 8 (100.0%) |
| Total (Category) | 27 (45.0%) | 33 (55.0%) |
| Total (Overall) | 327 (49.7%) | 331 (50.3%) |
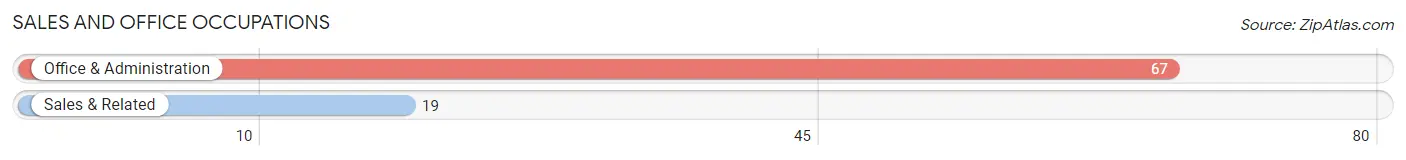
Sales and Office Occupations
The most common Sales and Office occupations in Sand Point are Office & Administration (67 | 10.2%), and Sales & Related (19 | 2.9%).
Sales and Office Occupations by Sex
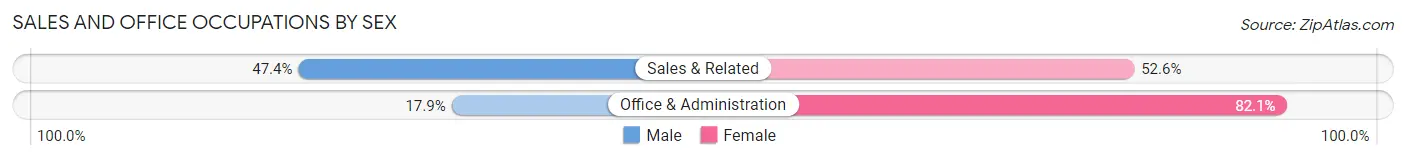
| Occupation | Male | Female |
| Sales & Related | 9 (47.4%) | 10 (52.6%) |
| Office & Administration | 12 (17.9%) | 55 (82.1%) |
| Total (Category) | 21 (24.4%) | 65 (75.6%) |
| Total (Overall) | 327 (49.7%) | 331 (50.3%) |
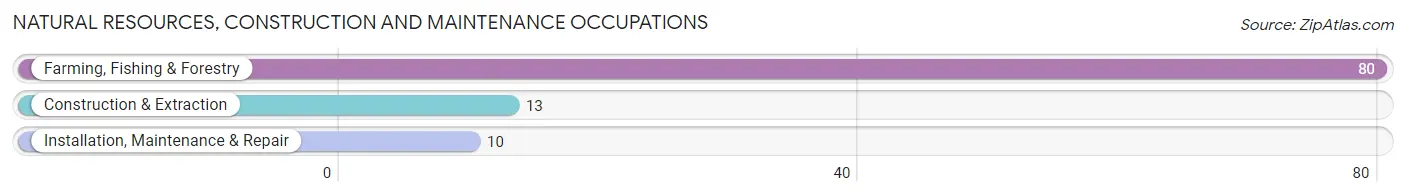
Natural Resources, Construction and Maintenance Occupations
The most common Natural Resources, Construction and Maintenance occupations in Sand Point are Farming, Fishing & Forestry (80 | 12.2%), Construction & Extraction (13 | 2.0%), and Installation, Maintenance & Repair (10 | 1.5%).
Natural Resources, Construction and Maintenance Occupations by Sex
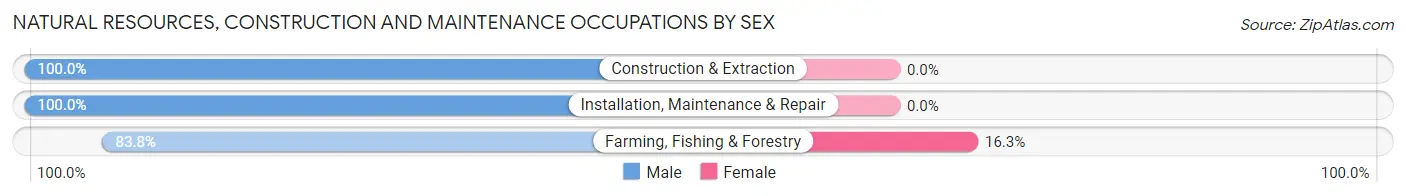
| Occupation | Male | Female |
| Farming, Fishing & Forestry | 67 (83.8%) | 13 (16.3%) |
| Construction & Extraction | 13 (100.0%) | 0 (0.0%) |
| Installation, Maintenance & Repair | 10 (100.0%) | 0 (0.0%) |
| Total (Category) | 90 (87.4%) | 13 (12.6%) |
| Total (Overall) | 327 (49.7%) | 331 (50.3%) |
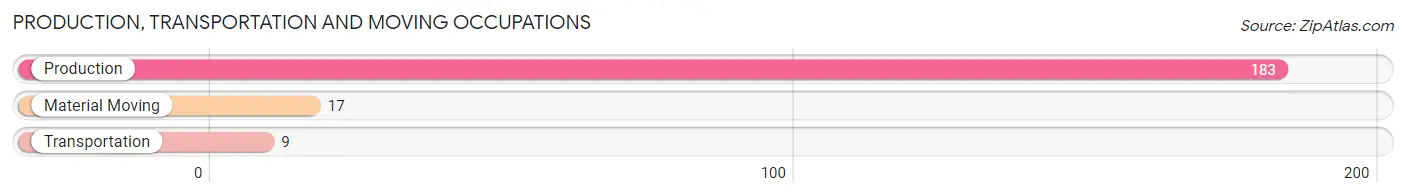
Production, Transportation and Moving Occupations
The most common Production, Transportation and Moving occupations in Sand Point are Production (183 | 27.8%), Material Moving (17 | 2.6%), and Transportation (9 | 1.4%).
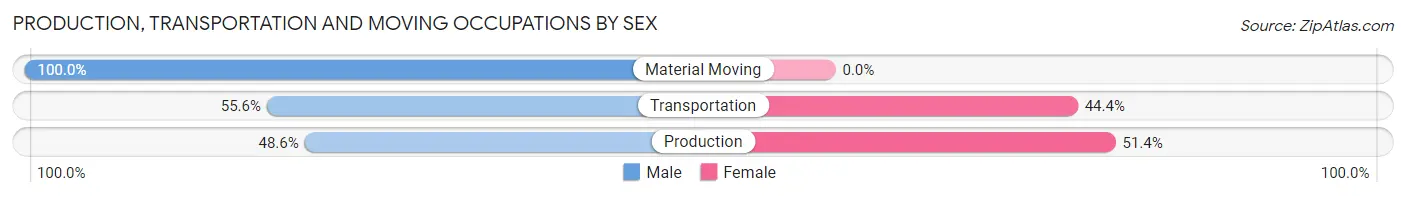
Production, Transportation and Moving Occupations by Sex
| Occupation | Male | Female |
| Production | 89 (48.6%) | 94 (51.4%) |
| Transportation | 5 (55.6%) | 4 (44.4%) |
| Material Moving | 17 (100.0%) | 0 (0.0%) |
| Total (Category) | 111 (53.1%) | 98 (46.9%) |
| Total (Overall) | 327 (49.7%) | 331 (50.3%) |
Employment Industries by Sex in Sand Point
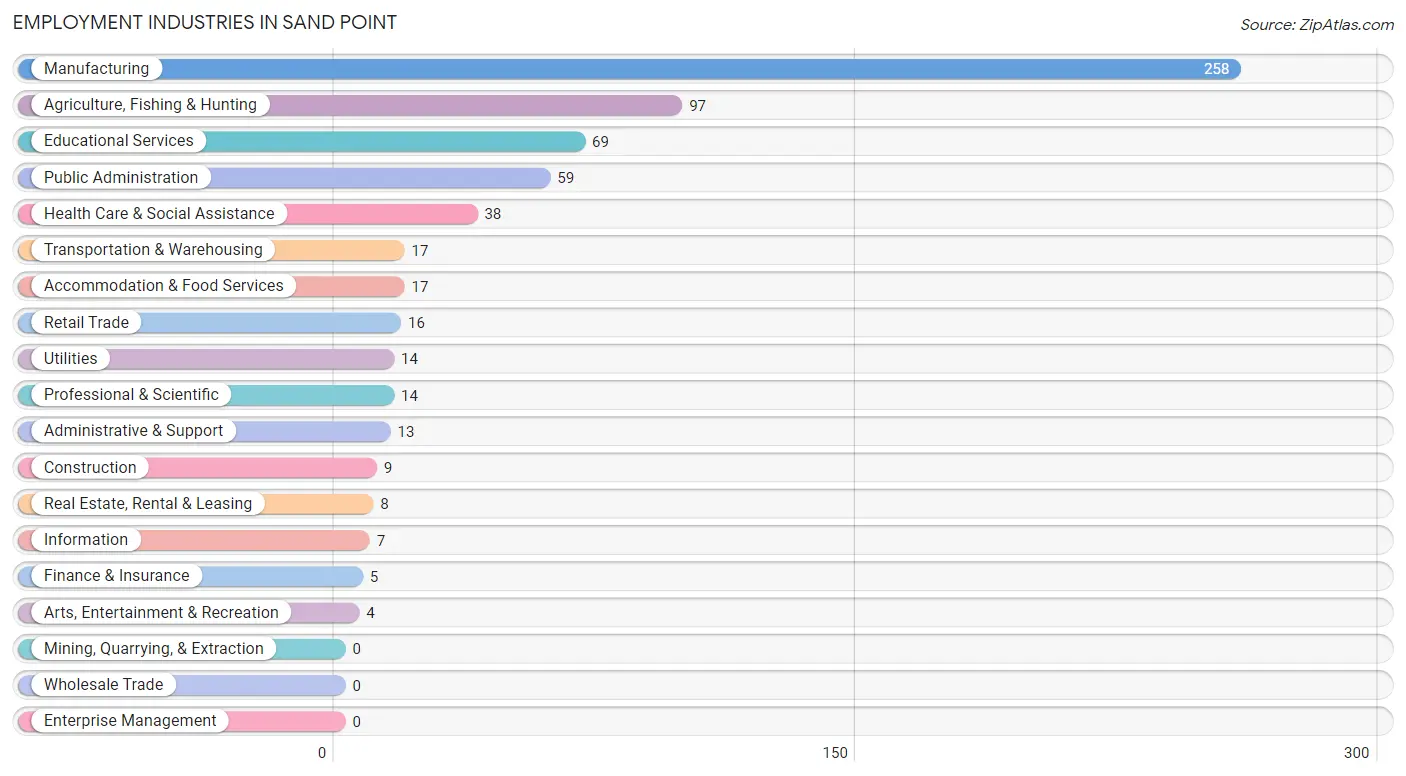
Employment Industries in Sand Point
The major employment industries in Sand Point include Manufacturing (258 | 39.2%), Agriculture, Fishing & Hunting (97 | 14.7%), Educational Services (69 | 10.5%), Public Administration (59 | 9.0%), and Health Care & Social Assistance (38 | 5.8%).
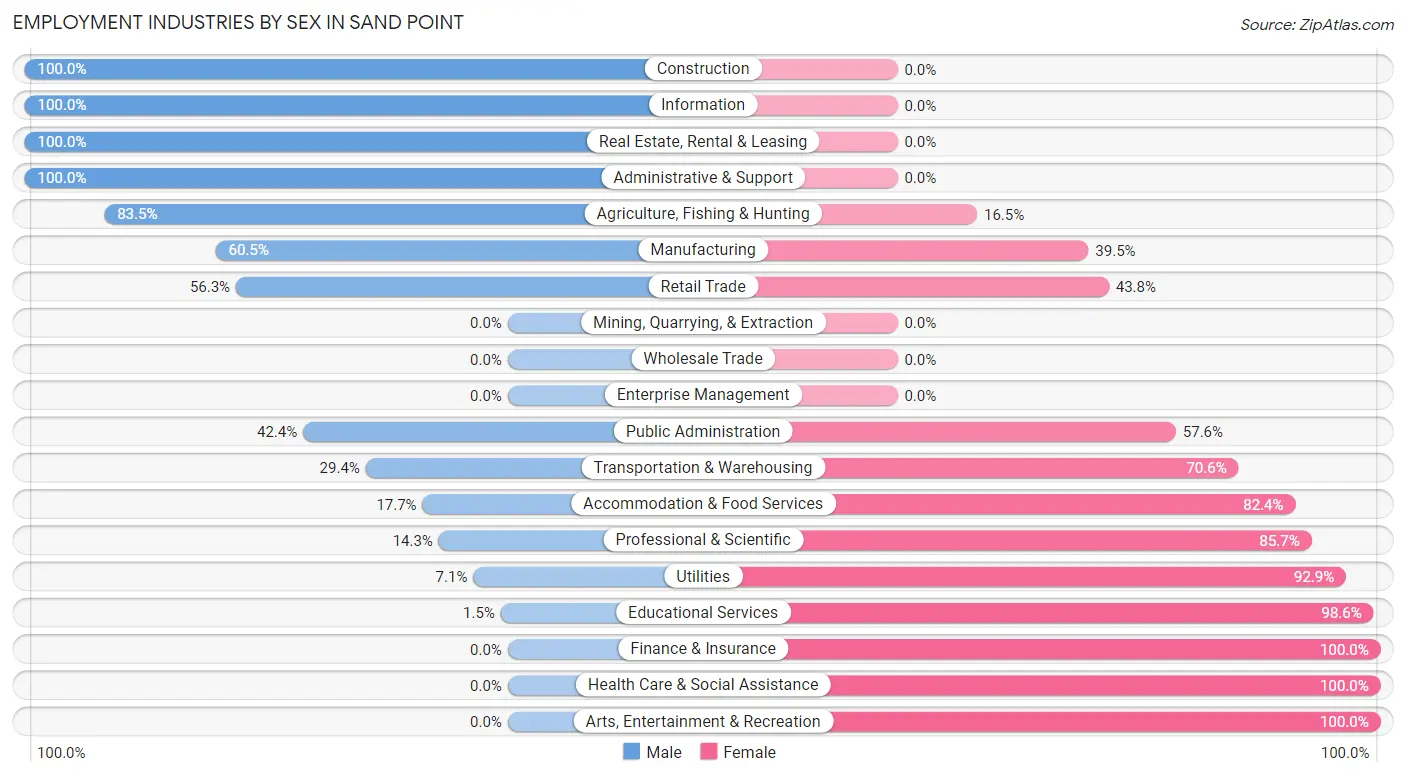
Employment Industries by Sex in Sand Point
The Sand Point industries that see more men than women are Construction (100.0%), Information (100.0%), and Real Estate, Rental & Leasing (100.0%), whereas the industries that tend to have a higher number of women are Finance & Insurance (100.0%), Health Care & Social Assistance (100.0%), and Arts, Entertainment & Recreation (100.0%).
| Industry | Male | Female |
| Agriculture, Fishing & Hunting | 81 (83.5%) | 16 (16.5%) |
| Mining, Quarrying, & Extraction | 0 (0.0%) | 0 (0.0%) |
| Construction | 9 (100.0%) | 0 (0.0%) |
| Manufacturing | 156 (60.5%) | 102 (39.5%) |
| Wholesale Trade | 0 (0.0%) | 0 (0.0%) |
| Retail Trade | 9 (56.2%) | 7 (43.8%) |
| Transportation & Warehousing | 5 (29.4%) | 12 (70.6%) |
| Utilities | 1 (7.1%) | 13 (92.9%) |
| Information | 7 (100.0%) | 0 (0.0%) |
| Finance & Insurance | 0 (0.0%) | 5 (100.0%) |
| Real Estate, Rental & Leasing | 8 (100.0%) | 0 (0.0%) |
| Professional & Scientific | 2 (14.3%) | 12 (85.7%) |
| Enterprise Management | 0 (0.0%) | 0 (0.0%) |
| Administrative & Support | 13 (100.0%) | 0 (0.0%) |
| Educational Services | 1 (1.5%) | 68 (98.6%) |
| Health Care & Social Assistance | 0 (0.0%) | 38 (100.0%) |
| Arts, Entertainment & Recreation | 0 (0.0%) | 4 (100.0%) |
| Accommodation & Food Services | 3 (17.6%) | 14 (82.4%) |
| Public Administration | 25 (42.4%) | 34 (57.6%) |
| Total | 327 (49.7%) | 331 (50.3%) |
Education in Sand Point
School Enrollment in Sand Point
The most common levels of schooling among the 158 students in Sand Point are middle school (42 | 26.6%), high school (36 | 22.8%), and graduate / professional (27 | 17.1%).
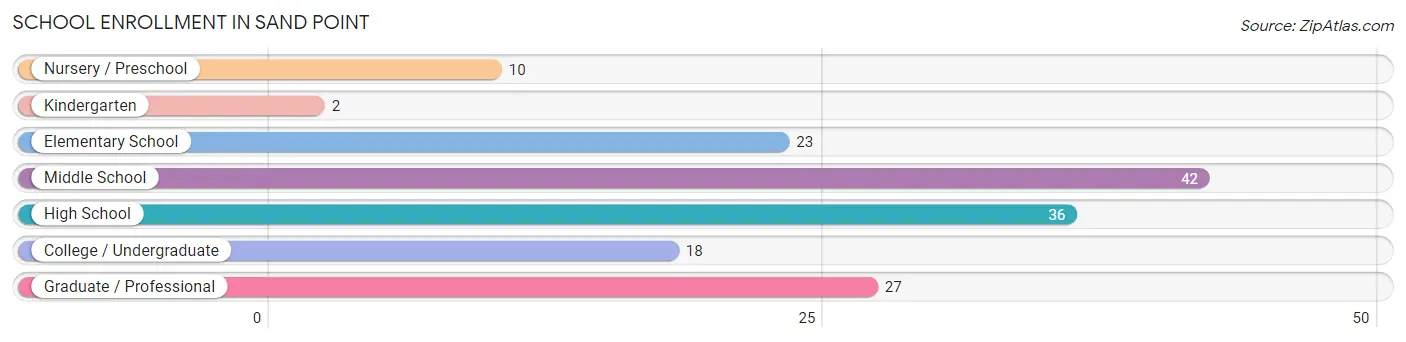
| School Level | # Students | % Students |
| Nursery / Preschool | 10 | 6.3% |
| Kindergarten | 2 | 1.3% |
| Elementary School | 23 | 14.6% |
| Middle School | 42 | 26.6% |
| High School | 36 | 22.8% |
| College / Undergraduate | 18 | 11.4% |
| Graduate / Professional | 27 | 17.1% |
| Total | 158 | 100.0% |
School Enrollment by Age by Funding Source in Sand Point
Out of a total of 158 students who are enrolled in schools in Sand Point, 36 (22.8%) attend a private institution, while the remaining 122 (77.2%) are enrolled in public schools. The age group of 20 to 24 year olds has the highest likelihood of being enrolled in private schools, with 27 (93.1% in the age bracket) enrolled. Conversely, the age group of 10 to 14 year olds has the lowest likelihood of being enrolled in a private school, with 41 (100.0% in the age bracket) attending a public institution.
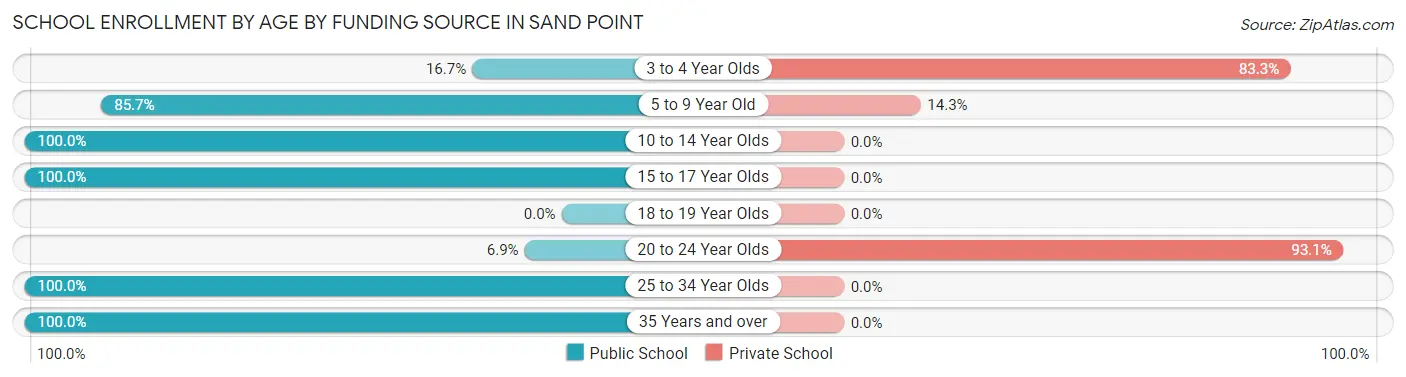
| Age Bracket | Public School | Private School |
| 3 to 4 Year Olds | 1 (16.7%) | 5 (83.3%) |
| 5 to 9 Year Old | 24 (85.7%) | 4 (14.3%) |
| 10 to 14 Year Olds | 41 (100.0%) | 0 (0.0%) |
| 15 to 17 Year Olds | 33 (100.0%) | 0 (0.0%) |
| 18 to 19 Year Olds | 0 (0.0%) | 0 (0.0%) |
| 20 to 24 Year Olds | 2 (6.9%) | 27 (93.1%) |
| 25 to 34 Year Olds | 10 (100.0%) | 0 (0.0%) |
| 35 Years and over | 11 (100.0%) | 0 (0.0%) |
| Total | 122 (77.2%) | 36 (22.8%) |
Educational Attainment by Field of Study in Sand Point
Education (68 | 48.2%), business (39 | 27.7%), science & technology (15 | 10.6%), engineering (6 | 4.3%), and literature & languages (5 | 3.5%) are the most common fields of study among 141 individuals in Sand Point who have obtained a bachelor's degree or higher.
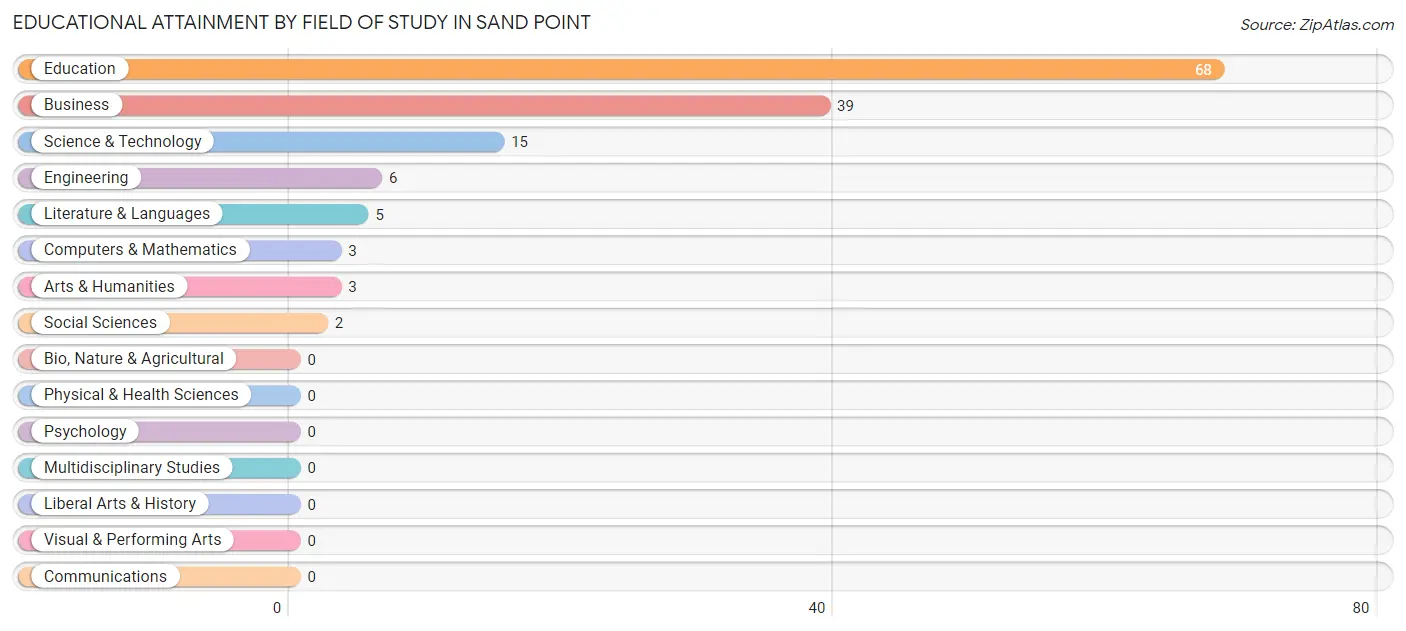
| Field of Study | # Graduates | % Graduates |
| Computers & Mathematics | 3 | 2.1% |
| Bio, Nature & Agricultural | 0 | 0.0% |
| Physical & Health Sciences | 0 | 0.0% |
| Psychology | 0 | 0.0% |
| Social Sciences | 2 | 1.4% |
| Engineering | 6 | 4.3% |
| Multidisciplinary Studies | 0 | 0.0% |
| Science & Technology | 15 | 10.6% |
| Business | 39 | 27.7% |
| Education | 68 | 48.2% |
| Literature & Languages | 5 | 3.5% |
| Liberal Arts & History | 0 | 0.0% |
| Visual & Performing Arts | 0 | 0.0% |
| Communications | 0 | 0.0% |
| Arts & Humanities | 3 | 2.1% |
| Total | 141 | 100.0% |
Transportation & Commute in Sand Point
Vehicle Availability by Sex in Sand Point
The most prevalent vehicle ownership categories in Sand Point are males with 2 vehicles (85, accounting for 52.5%) and females with 2 vehicles (43, making up 42.1%).
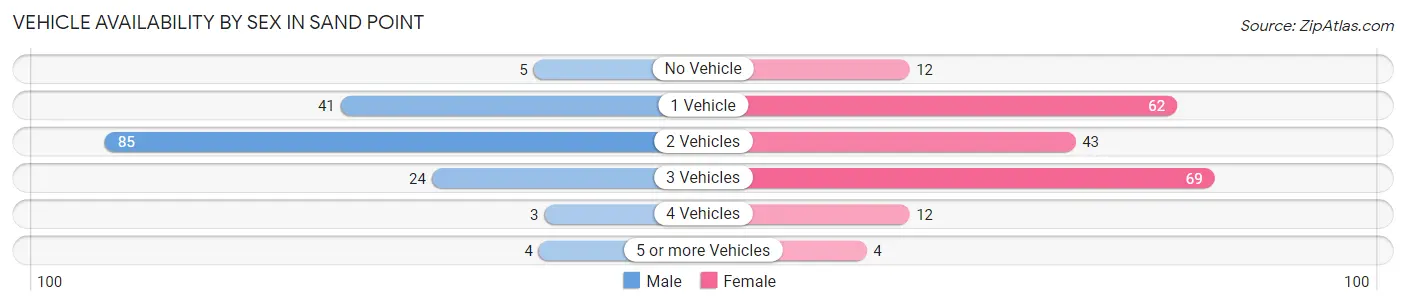
| Vehicles Available | Male | Female |
| No Vehicle | 5 (3.1%) | 12 (5.9%) |
| 1 Vehicle | 41 (25.3%) | 62 (30.7%) |
| 2 Vehicles | 85 (52.5%) | 43 (21.3%) |
| 3 Vehicles | 24 (14.8%) | 69 (34.2%) |
| 4 Vehicles | 3 (1.8%) | 12 (5.9%) |
| 5 or more Vehicles | 4 (2.5%) | 4 (2.0%) |
| Total | 162 (100.0%) | 202 (100.0%) |
Commute Time in Sand Point
The most frequently occuring commute durations in Sand Point are 5 to 9 minutes (371 commuters, 66.5%), less than 5 minutes (104 commuters, 18.6%), and 10 to 14 minutes (48 commuters, 8.6%).
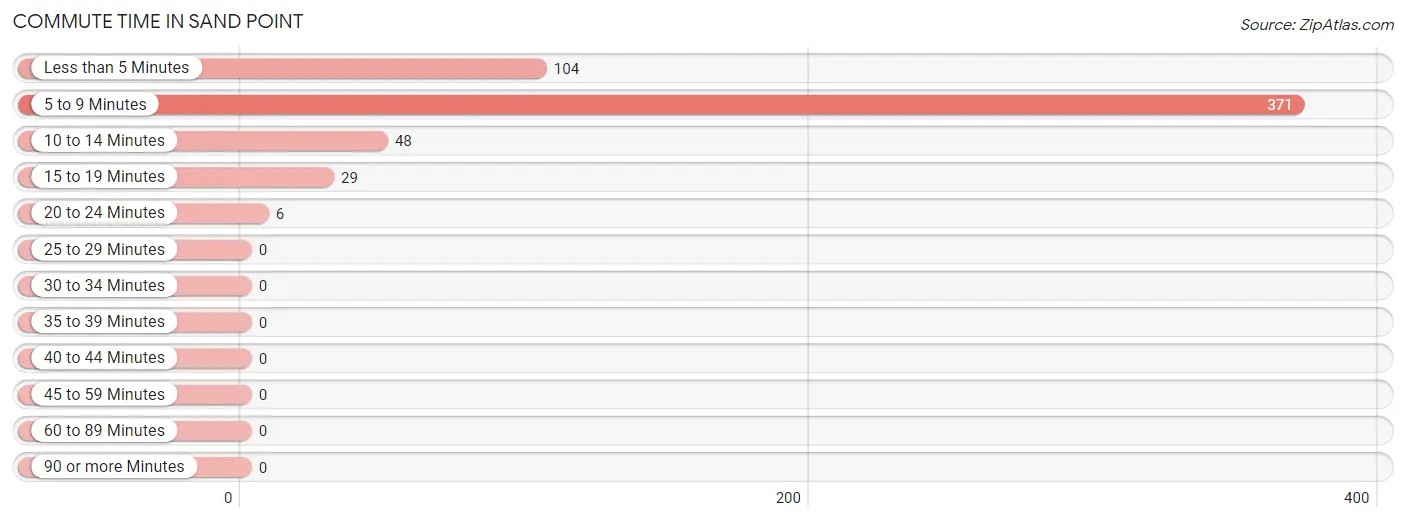
| Commute Time | # Commuters | % Commuters |
| Less than 5 Minutes | 104 | 18.6% |
| 5 to 9 Minutes | 371 | 66.5% |
| 10 to 14 Minutes | 48 | 8.6% |
| 15 to 19 Minutes | 29 | 5.2% |
| 20 to 24 Minutes | 6 | 1.1% |
| 25 to 29 Minutes | 0 | 0.0% |
| 30 to 34 Minutes | 0 | 0.0% |
| 35 to 39 Minutes | 0 | 0.0% |
| 40 to 44 Minutes | 0 | 0.0% |
| 45 to 59 Minutes | 0 | 0.0% |
| 60 to 89 Minutes | 0 | 0.0% |
| 90 or more Minutes | 0 | 0.0% |
Commute Time by Sex in Sand Point
The most common commute times in Sand Point are 5 to 9 minutes (201 commuters, 67.0%) for males and 5 to 9 minutes (170 commuters, 65.9%) for females.
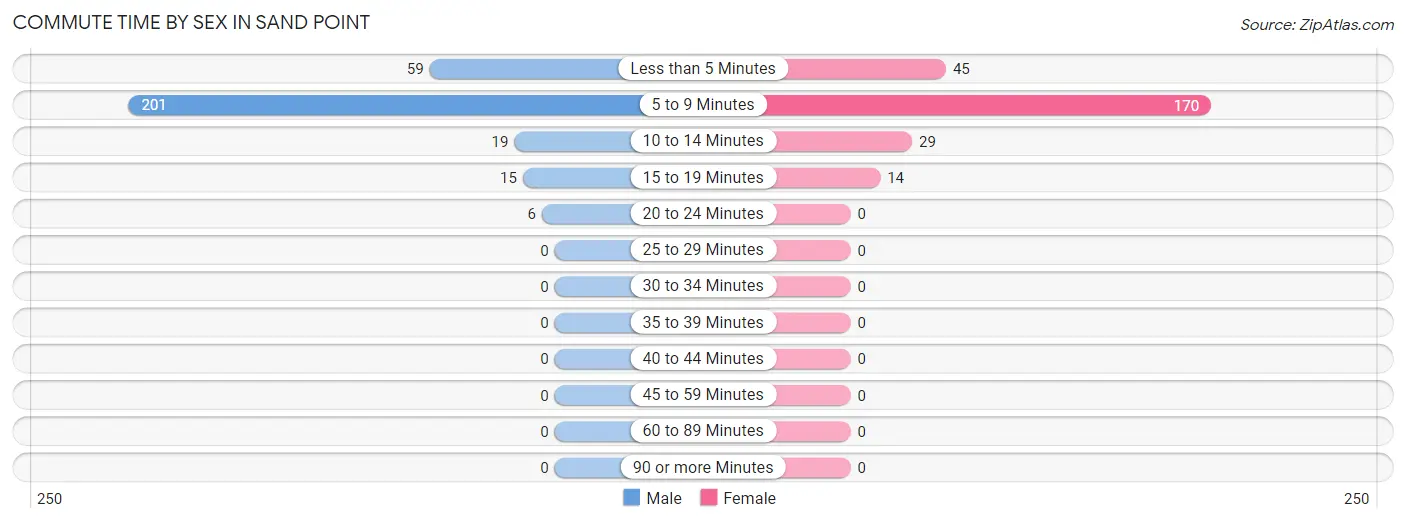
| Commute Time | Male | Female |
| Less than 5 Minutes | 59 (19.7%) | 45 (17.4%) |
| 5 to 9 Minutes | 201 (67.0%) | 170 (65.9%) |
| 10 to 14 Minutes | 19 (6.3%) | 29 (11.2%) |
| 15 to 19 Minutes | 15 (5.0%) | 14 (5.4%) |
| 20 to 24 Minutes | 6 (2.0%) | 0 (0.0%) |
| 25 to 29 Minutes | 0 (0.0%) | 0 (0.0%) |
| 30 to 34 Minutes | 0 (0.0%) | 0 (0.0%) |
| 35 to 39 Minutes | 0 (0.0%) | 0 (0.0%) |
| 40 to 44 Minutes | 0 (0.0%) | 0 (0.0%) |
| 45 to 59 Minutes | 0 (0.0%) | 0 (0.0%) |
| 60 to 89 Minutes | 0 (0.0%) | 0 (0.0%) |
| 90 or more Minutes | 0 (0.0%) | 0 (0.0%) |
Time of Departure to Work by Sex in Sand Point
The most frequent times of departure to work in Sand Point are 5:30 AM to 5:59 AM (74, 24.7%) for males and 7:30 AM to 7:59 AM (64, 24.8%) for females.
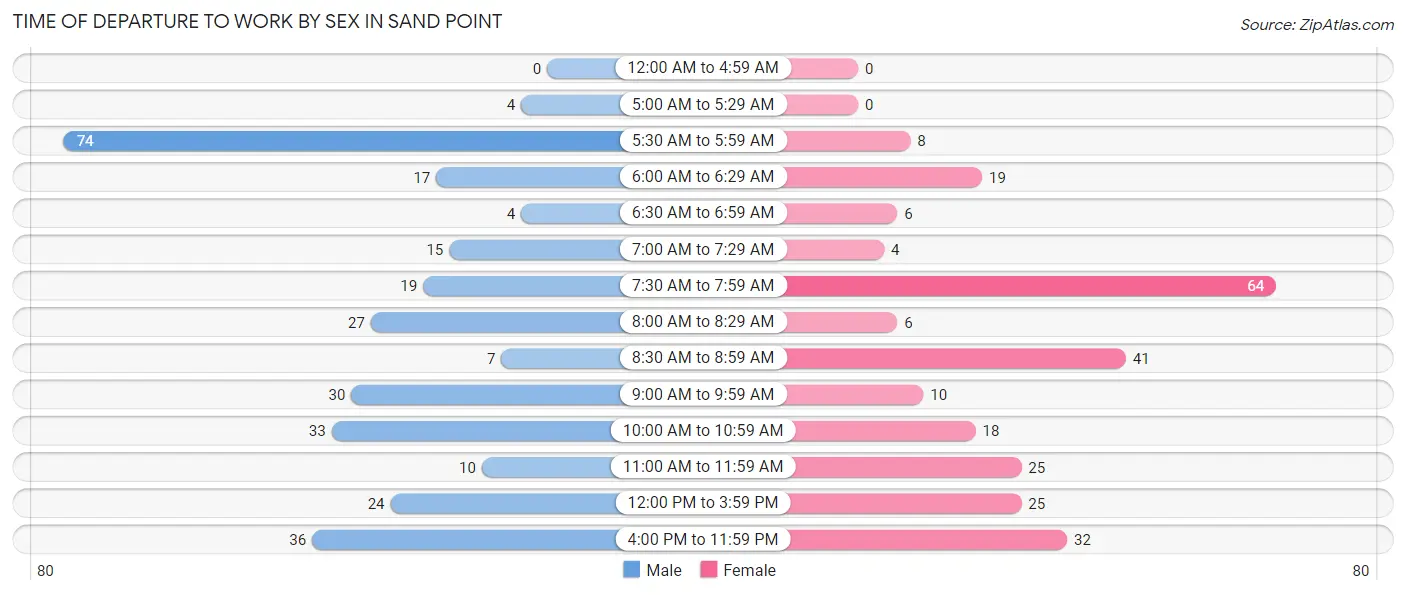
| Time of Departure | Male | Female |
| 12:00 AM to 4:59 AM | 0 (0.0%) | 0 (0.0%) |
| 5:00 AM to 5:29 AM | 4 (1.3%) | 0 (0.0%) |
| 5:30 AM to 5:59 AM | 74 (24.7%) | 8 (3.1%) |
| 6:00 AM to 6:29 AM | 17 (5.7%) | 19 (7.4%) |
| 6:30 AM to 6:59 AM | 4 (1.3%) | 6 (2.3%) |
| 7:00 AM to 7:29 AM | 15 (5.0%) | 4 (1.5%) |
| 7:30 AM to 7:59 AM | 19 (6.3%) | 64 (24.8%) |
| 8:00 AM to 8:29 AM | 27 (9.0%) | 6 (2.3%) |
| 8:30 AM to 8:59 AM | 7 (2.3%) | 41 (15.9%) |
| 9:00 AM to 9:59 AM | 30 (10.0%) | 10 (3.9%) |
| 10:00 AM to 10:59 AM | 33 (11.0%) | 18 (7.0%) |
| 11:00 AM to 11:59 AM | 10 (3.3%) | 25 (9.7%) |
| 12:00 PM to 3:59 PM | 24 (8.0%) | 25 (9.7%) |
| 4:00 PM to 11:59 PM | 36 (12.0%) | 32 (12.4%) |
| Total | 300 (100.0%) | 258 (100.0%) |
Housing Occupancy in Sand Point
Occupancy by Ownership in Sand Point
Of the total 341 dwellings in Sand Point, owner-occupied units account for 262 (76.8%), while renter-occupied units make up 79 (23.2%).
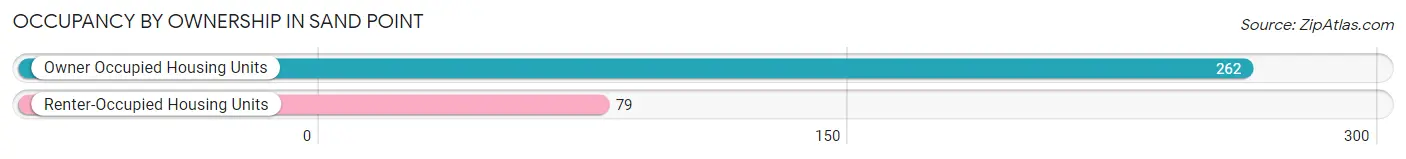
| Occupancy | # Housing Units | % Housing Units |
| Owner Occupied Housing Units | 262 | 76.8% |
| Renter-Occupied Housing Units | 79 | 23.2% |
| Total Occupied Housing Units | 341 | 100.0% |
Occupancy by Household Size in Sand Point
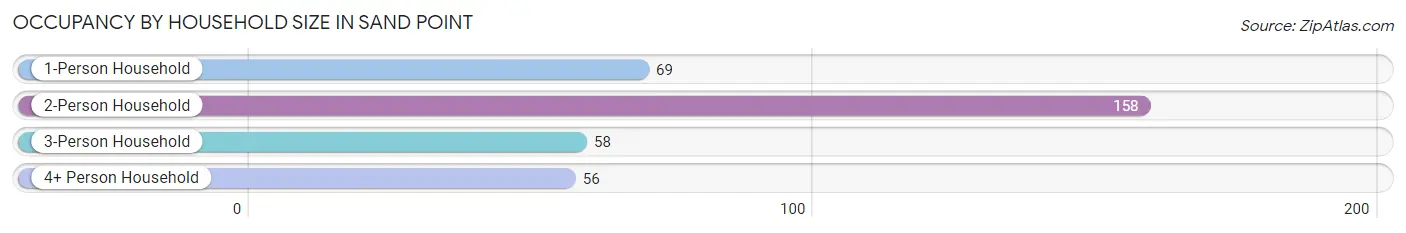
| Household Size | # Housing Units | % Housing Units |
| 1-Person Household | 69 | 20.2% |
| 2-Person Household | 158 | 46.3% |
| 3-Person Household | 58 | 17.0% |
| 4+ Person Household | 56 | 16.4% |
| Total Housing Units | 341 | 100.0% |
Occupancy by Ownership by Household Size in Sand Point
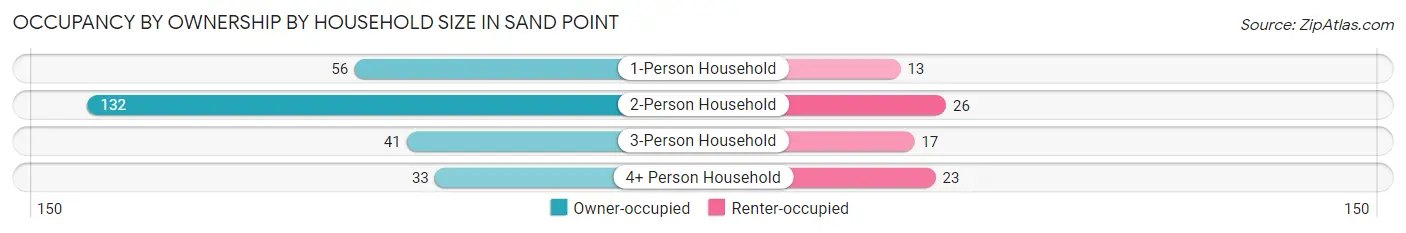
| Household Size | Owner-occupied | Renter-occupied |
| 1-Person Household | 56 (81.2%) | 13 (18.8%) |
| 2-Person Household | 132 (83.5%) | 26 (16.5%) |
| 3-Person Household | 41 (70.7%) | 17 (29.3%) |
| 4+ Person Household | 33 (58.9%) | 23 (41.1%) |
| Total Housing Units | 262 (76.8%) | 79 (23.2%) |
Occupancy by Educational Attainment in Sand Point
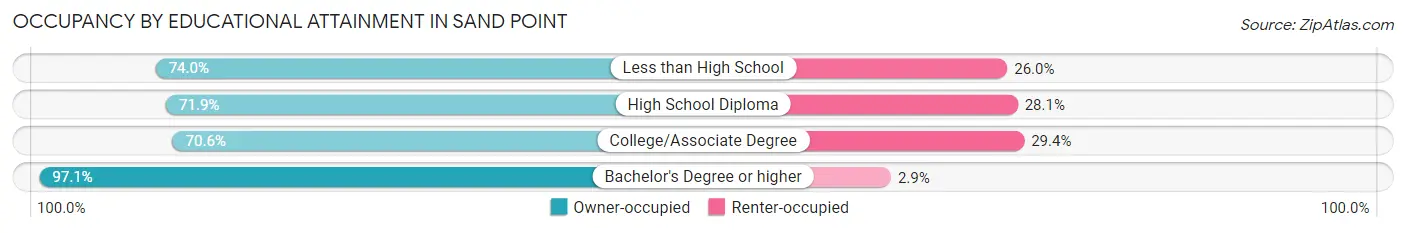
| Household Size | Owner-occupied | Renter-occupied |
| Less than High School | 37 (74.0%) | 13 (26.0%) |
| High School Diploma | 82 (71.9%) | 32 (28.1%) |
| College/Associate Degree | 77 (70.6%) | 32 (29.4%) |
| Bachelor's Degree or higher | 66 (97.1%) | 2 (2.9%) |
Occupancy by Age of Householder in Sand Point
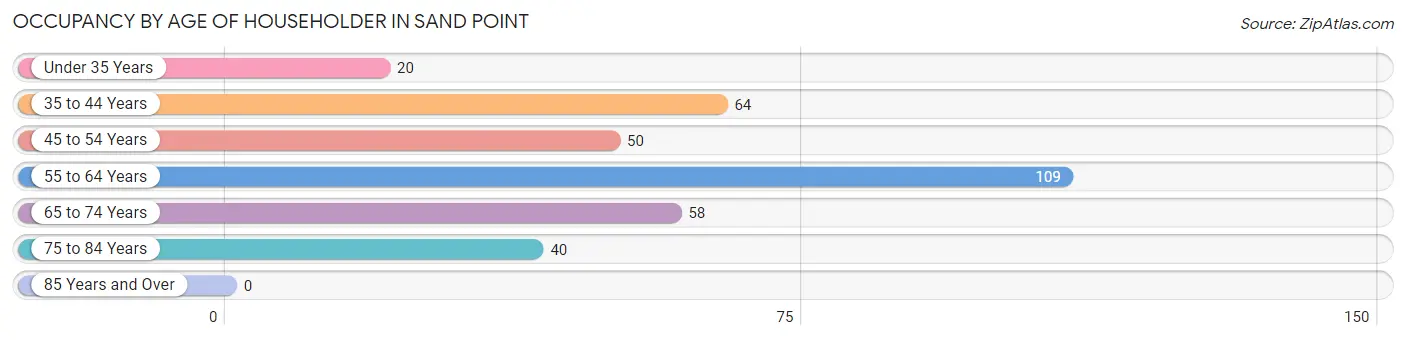
| Age Bracket | # Households | % Households |
| Under 35 Years | 20 | 5.9% |
| 35 to 44 Years | 64 | 18.8% |
| 45 to 54 Years | 50 | 14.7% |
| 55 to 64 Years | 109 | 32.0% |
| 65 to 74 Years | 58 | 17.0% |
| 75 to 84 Years | 40 | 11.7% |
| 85 Years and Over | 0 | 0.0% |
| Total | 341 | 100.0% |
Housing Finances in Sand Point
Median Income by Occupancy in Sand Point
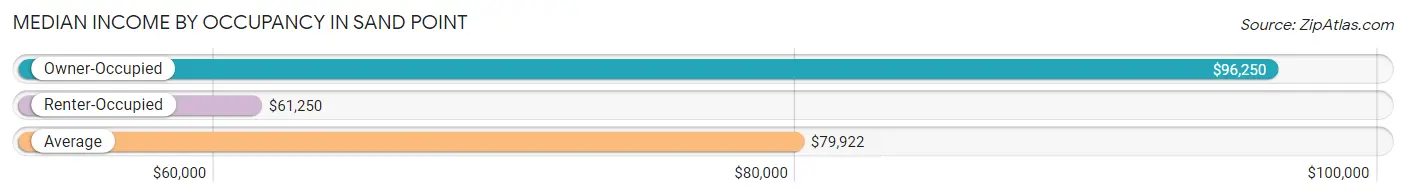
| Occupancy Type | # Households | Median Income |
| Owner-Occupied | 262 (76.8%) | $96,250 |
| Renter-Occupied | 79 (23.2%) | $61,250 |
| Average | 341 (100.0%) | $79,922 |
Occupancy by Householder Income Bracket in Sand Point
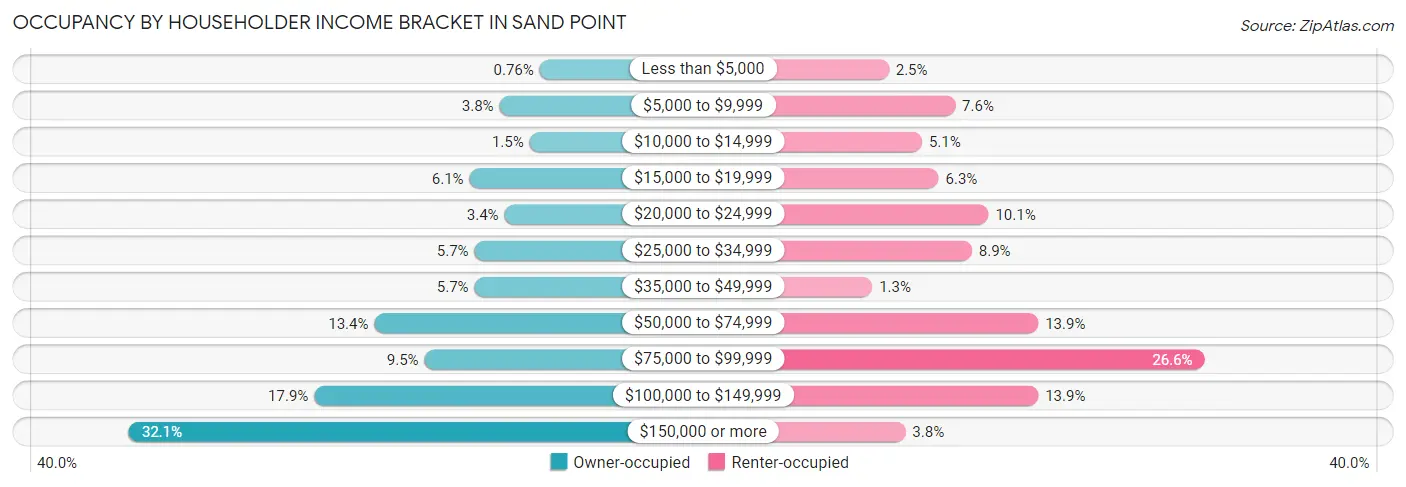
| Income Bracket | Owner-occupied | Renter-occupied |
| Less than $5,000 | 2 (0.8%) | 2 (2.5%) |
| $5,000 to $9,999 | 10 (3.8%) | 6 (7.6%) |
| $10,000 to $14,999 | 4 (1.5%) | 4 (5.1%) |
| $15,000 to $19,999 | 16 (6.1%) | 5 (6.3%) |
| $20,000 to $24,999 | 9 (3.4%) | 8 (10.1%) |
| $25,000 to $34,999 | 15 (5.7%) | 7 (8.9%) |
| $35,000 to $49,999 | 15 (5.7%) | 1 (1.3%) |
| $50,000 to $74,999 | 35 (13.4%) | 11 (13.9%) |
| $75,000 to $99,999 | 25 (9.5%) | 21 (26.6%) |
| $100,000 to $149,999 | 47 (17.9%) | 11 (13.9%) |
| $150,000 or more | 84 (32.1%) | 3 (3.8%) |
| Total | 262 (100.0%) | 79 (100.0%) |
Monthly Housing Cost Tiers in Sand Point
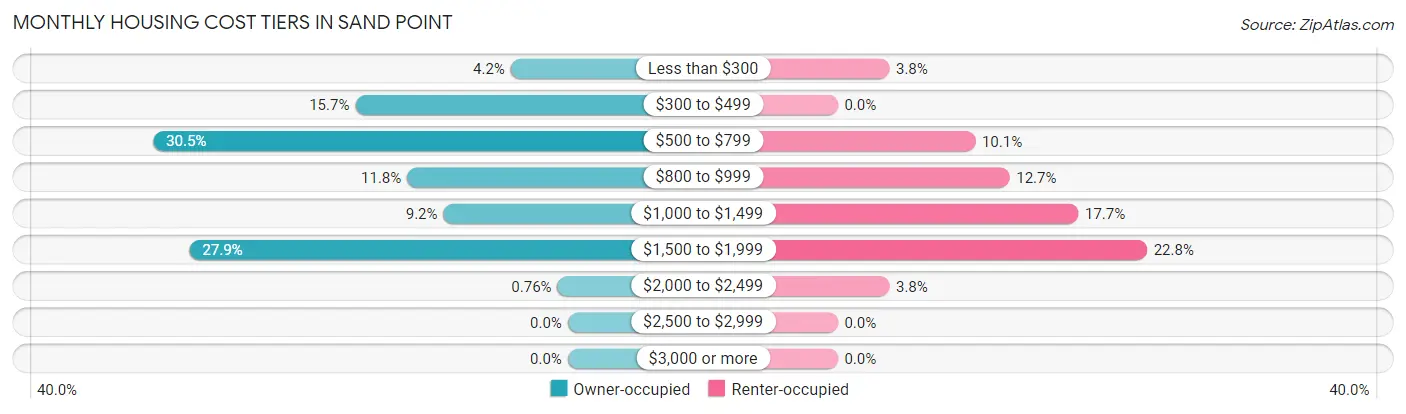
| Monthly Cost | Owner-occupied | Renter-occupied |
| Less than $300 | 11 (4.2%) | 3 (3.8%) |
| $300 to $499 | 41 (15.7%) | 0 (0.0%) |
| $500 to $799 | 80 (30.5%) | 8 (10.1%) |
| $800 to $999 | 31 (11.8%) | 10 (12.7%) |
| $1,000 to $1,499 | 24 (9.2%) | 14 (17.7%) |
| $1,500 to $1,999 | 73 (27.9%) | 18 (22.8%) |
| $2,000 to $2,499 | 2 (0.8%) | 3 (3.8%) |
| $2,500 to $2,999 | 0 (0.0%) | 0 (0.0%) |
| $3,000 or more | 0 (0.0%) | 0 (0.0%) |
| Total | 262 (100.0%) | 79 (100.0%) |
Physical Housing Characteristics in Sand Point
Housing Structures in Sand Point
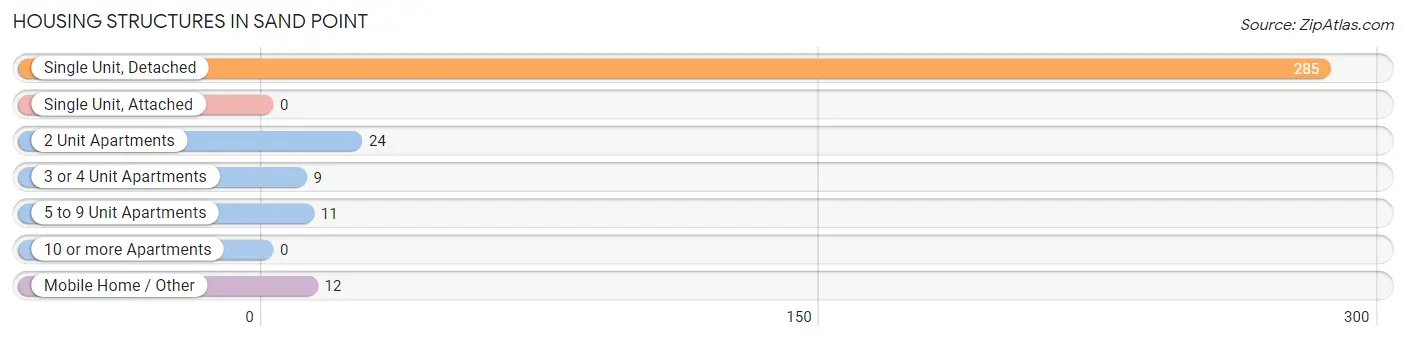
| Structure Type | # Housing Units | % Housing Units |
| Single Unit, Detached | 285 | 83.6% |
| Single Unit, Attached | 0 | 0.0% |
| 2 Unit Apartments | 24 | 7.0% |
| 3 or 4 Unit Apartments | 9 | 2.6% |
| 5 to 9 Unit Apartments | 11 | 3.2% |
| 10 or more Apartments | 0 | 0.0% |
| Mobile Home / Other | 12 | 3.5% |
| Total | 341 | 100.0% |
Housing Structures by Occupancy in Sand Point
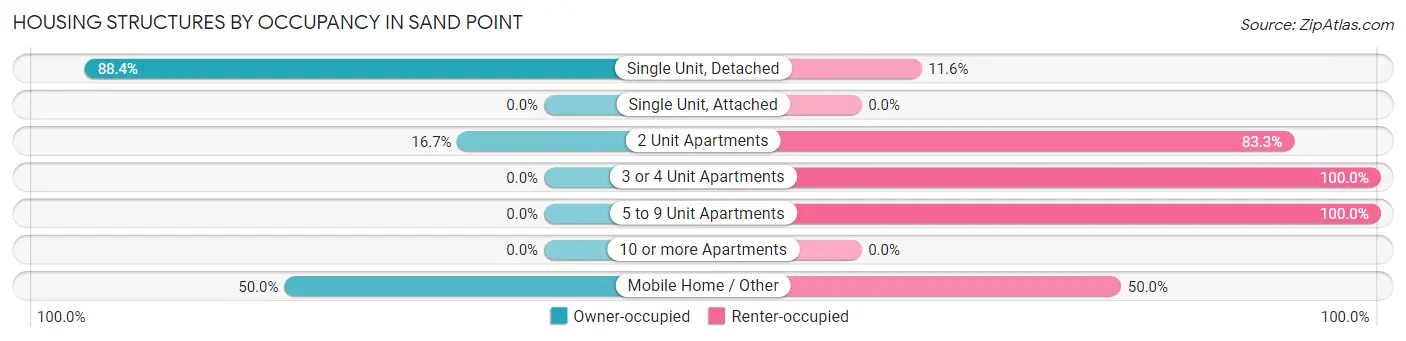
| Structure Type | Owner-occupied | Renter-occupied |
| Single Unit, Detached | 252 (88.4%) | 33 (11.6%) |
| Single Unit, Attached | 0 (0.0%) | 0 (0.0%) |
| 2 Unit Apartments | 4 (16.7%) | 20 (83.3%) |
| 3 or 4 Unit Apartments | 0 (0.0%) | 9 (100.0%) |
| 5 to 9 Unit Apartments | 0 (0.0%) | 11 (100.0%) |
| 10 or more Apartments | 0 (0.0%) | 0 (0.0%) |
| Mobile Home / Other | 6 (50.0%) | 6 (50.0%) |
| Total | 262 (76.8%) | 79 (23.2%) |
Housing Structures by Number of Rooms in Sand Point
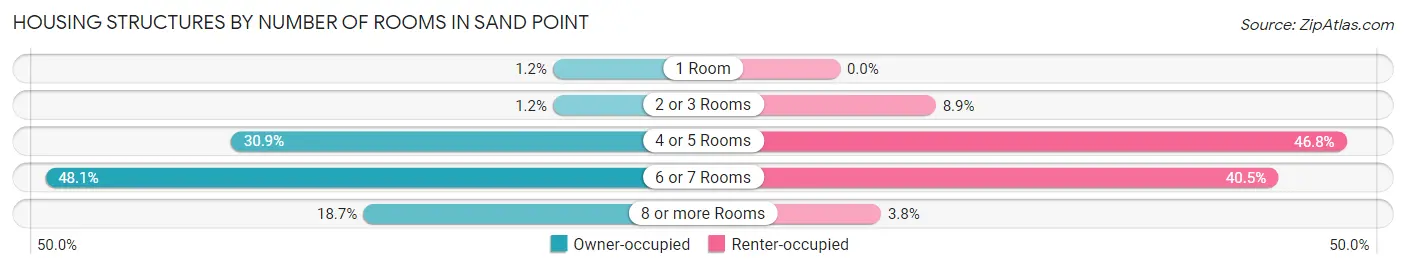
| Number of Rooms | Owner-occupied | Renter-occupied |
| 1 Room | 3 (1.1%) | 0 (0.0%) |
| 2 or 3 Rooms | 3 (1.1%) | 7 (8.9%) |
| 4 or 5 Rooms | 81 (30.9%) | 37 (46.8%) |
| 6 or 7 Rooms | 126 (48.1%) | 32 (40.5%) |
| 8 or more Rooms | 49 (18.7%) | 3 (3.8%) |
| Total | 262 (100.0%) | 79 (100.0%) |
Housing Structure by Heating Type in Sand Point
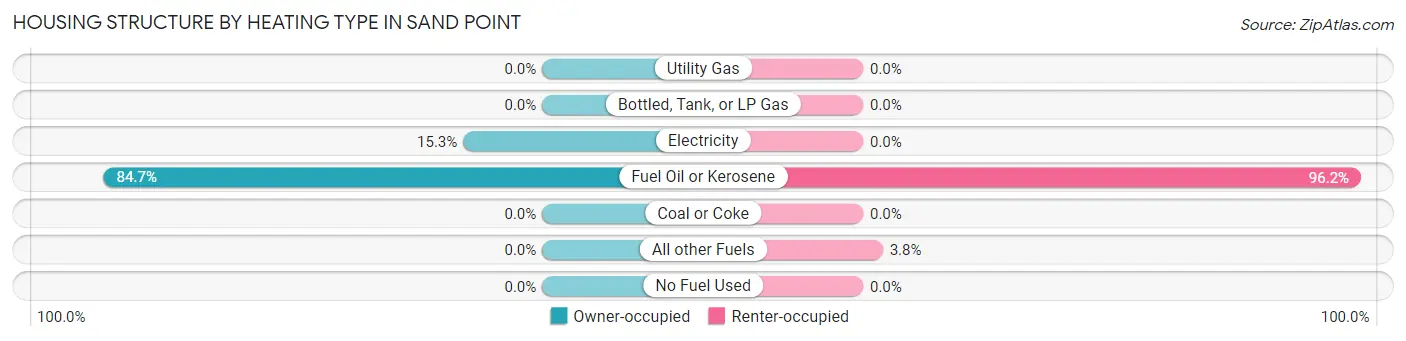
| Heating Type | Owner-occupied | Renter-occupied |
| Utility Gas | 0 (0.0%) | 0 (0.0%) |
| Bottled, Tank, or LP Gas | 0 (0.0%) | 0 (0.0%) |
| Electricity | 40 (15.3%) | 0 (0.0%) |
| Fuel Oil or Kerosene | 222 (84.7%) | 76 (96.2%) |
| Coal or Coke | 0 (0.0%) | 0 (0.0%) |
| All other Fuels | 0 (0.0%) | 3 (3.8%) |
| No Fuel Used | 0 (0.0%) | 0 (0.0%) |
| Total | 262 (100.0%) | 79 (100.0%) |
Household Vehicle Usage in Sand Point
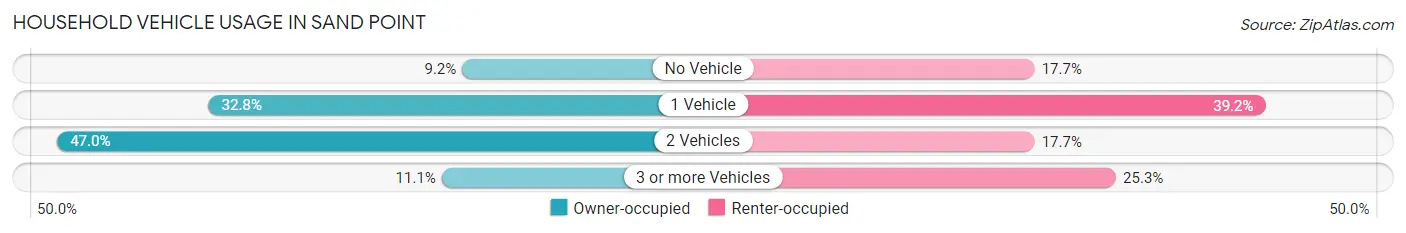
| Vehicles per Household | Owner-occupied | Renter-occupied |
| No Vehicle | 24 (9.2%) | 14 (17.7%) |
| 1 Vehicle | 86 (32.8%) | 31 (39.2%) |
| 2 Vehicles | 123 (46.9%) | 14 (17.7%) |
| 3 or more Vehicles | 29 (11.1%) | 20 (25.3%) |
| Total | 262 (100.0%) | 79 (100.0%) |
Real Estate & Mortgages in Sand Point
Real Estate and Mortgage Overview in Sand Point
| Characteristic | Without Mortgage | With Mortgage |
| Housing Units | 168 | 94 |
| Median Property Value | $164,100 | $254,500 |
| Median Household Income | $70,000 | $50 |
| Monthly Housing Costs | $625 | $0 |
| Real Estate Taxes | - | - |
Property Value by Mortgage Status in Sand Point
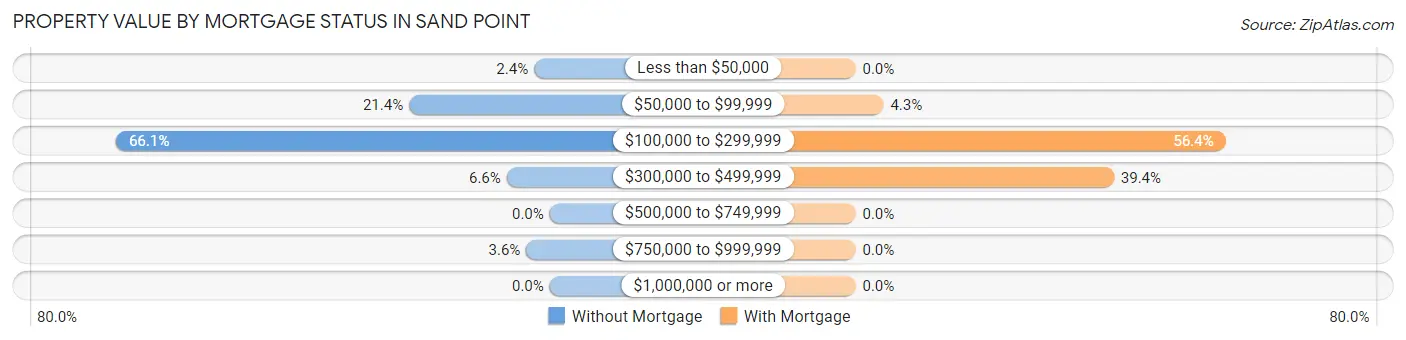
| Property Value | Without Mortgage | With Mortgage |
| Less than $50,000 | 4 (2.4%) | 0 (0.0%) |
| $50,000 to $99,999 | 36 (21.4%) | 4 (4.3%) |
| $100,000 to $299,999 | 111 (66.1%) | 53 (56.4%) |
| $300,000 to $499,999 | 11 (6.6%) | 37 (39.4%) |
| $500,000 to $749,999 | 0 (0.0%) | 0 (0.0%) |
| $750,000 to $999,999 | 6 (3.6%) | 0 (0.0%) |
| $1,000,000 or more | 0 (0.0%) | 0 (0.0%) |
| Total | 168 (100.0%) | 94 (100.0%) |
Household Income by Mortgage Status in Sand Point
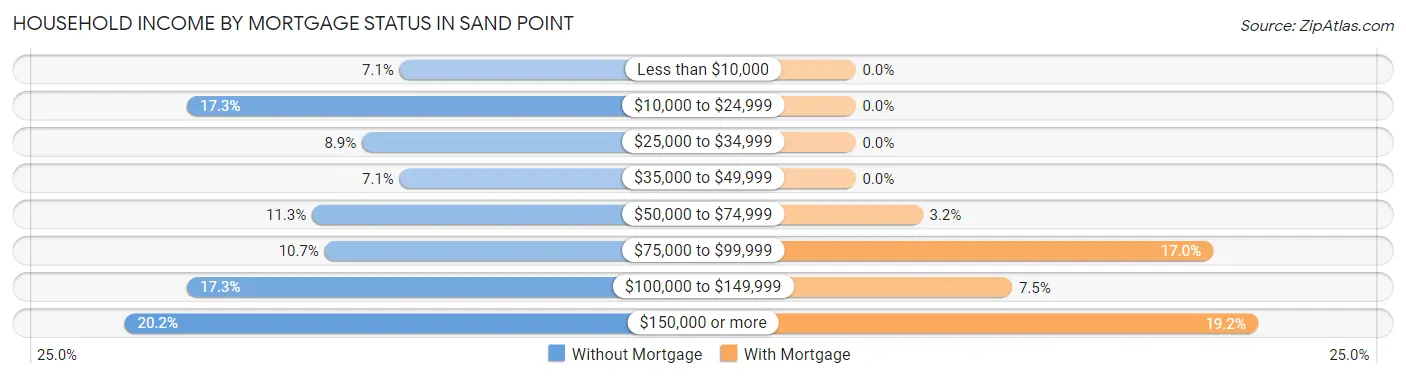
| Household Income | Without Mortgage | With Mortgage |
| Less than $10,000 | 12 (7.1%) | 0 (0.0%) |
| $10,000 to $24,999 | 29 (17.3%) | 0 (0.0%) |
| $25,000 to $34,999 | 15 (8.9%) | 0 (0.0%) |
| $35,000 to $49,999 | 12 (7.1%) | 0 (0.0%) |
| $50,000 to $74,999 | 19 (11.3%) | 3 (3.2%) |
| $75,000 to $99,999 | 18 (10.7%) | 16 (17.0%) |
| $100,000 to $149,999 | 29 (17.3%) | 7 (7.4%) |
| $150,000 or more | 34 (20.2%) | 18 (19.2%) |
| Total | 168 (100.0%) | 94 (100.0%) |
Property Value to Household Income Ratio in Sand Point
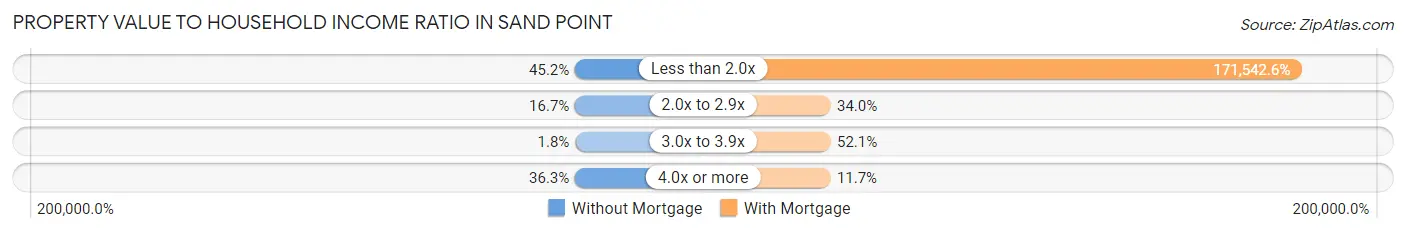
| Value-to-Income Ratio | Without Mortgage | With Mortgage |
| Less than 2.0x | 76 (45.2%) | 161,250 (171,542.6%) |
| 2.0x to 2.9x | 28 (16.7%) | 32 (34.0%) |
| 3.0x to 3.9x | 3 (1.8%) | 49 (52.1%) |
| 4.0x or more | 61 (36.3%) | 11 (11.7%) |
| Total | 168 (100.0%) | 94 (100.0%) |
Real Estate Taxes by Mortgage Status in Sand Point
| Property Taxes | Without Mortgage | With Mortgage |
| Less than $800 | 0 (0.0%) | 0 (0.0%) |
| $800 to $1,499 | 0 (0.0%) | 0 (0.0%) |
| $800 to $1,499 | 0 (0.0%) | 0 (0.0%) |
| Total | 168 (100.0%) | 94 (100.0%) |
Health & Disability in Sand Point
Health Insurance Coverage by Age in Sand Point
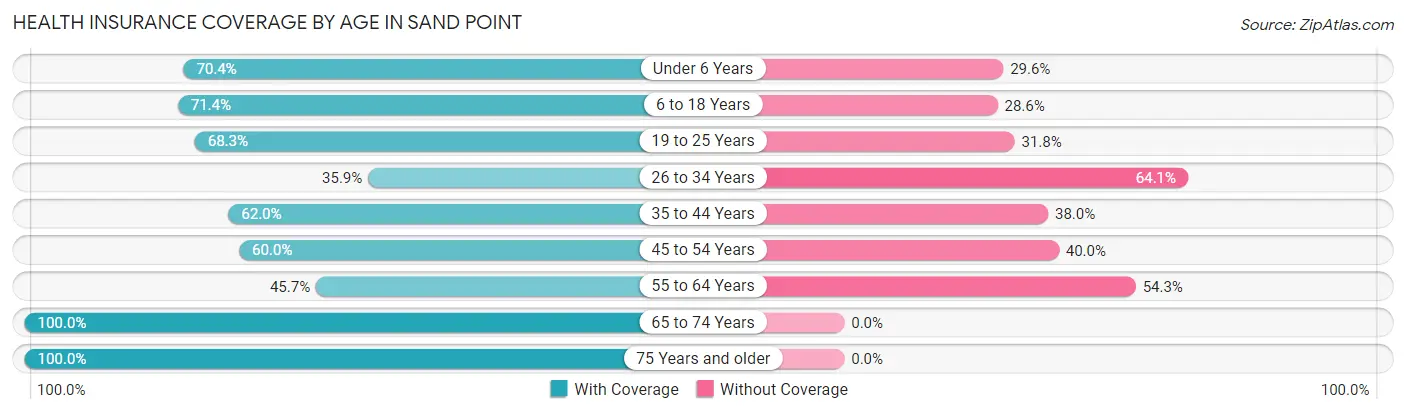
| Age Bracket | With Coverage | Without Coverage |
| Under 6 Years | 19 (70.4%) | 8 (29.6%) |
| 6 to 18 Years | 70 (71.4%) | 28 (28.6%) |
| 19 to 25 Years | 43 (68.2%) | 20 (31.8%) |
| 26 to 34 Years | 46 (35.9%) | 82 (64.1%) |
| 35 to 44 Years | 93 (62.0%) | 57 (38.0%) |
| 45 to 54 Years | 111 (60.0%) | 74 (40.0%) |
| 55 to 64 Years | 100 (45.7%) | 119 (54.3%) |
| 65 to 74 Years | 132 (100.0%) | 0 (0.0%) |
| 75 Years and older | 46 (100.0%) | 0 (0.0%) |
| Total | 660 (63.0%) | 388 (37.0%) |
Health Insurance Coverage by Citizenship Status in Sand Point
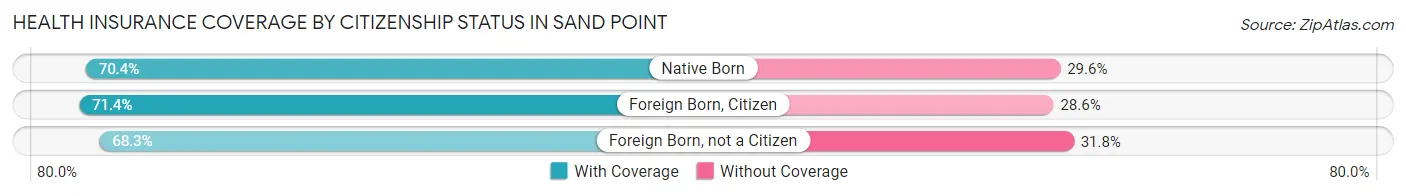
| Citizenship Status | With Coverage | Without Coverage |
| Native Born | 19 (70.4%) | 8 (29.6%) |
| Foreign Born, Citizen | 70 (71.4%) | 28 (28.6%) |
| Foreign Born, not a Citizen | 43 (68.2%) | 20 (31.8%) |
Health Insurance Coverage by Household Income in Sand Point
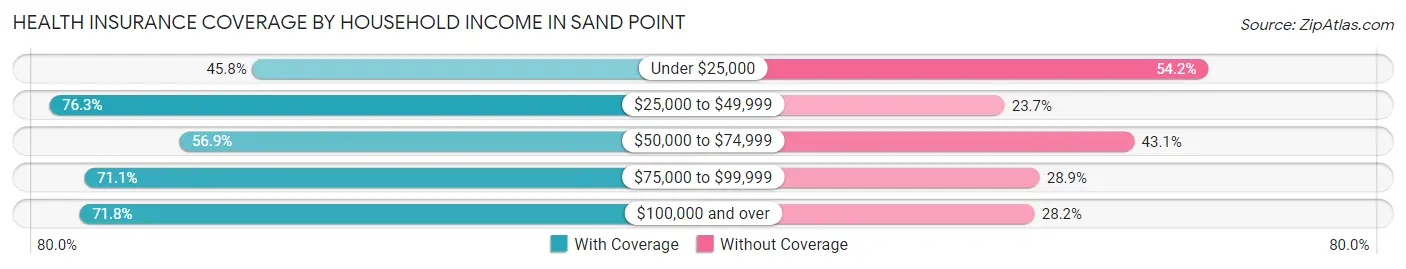
| Household Income | With Coverage | Without Coverage |
| Under $25,000 | 55 (45.8%) | 65 (54.2%) |
| $25,000 to $49,999 | 58 (76.3%) | 18 (23.7%) |
| $50,000 to $74,999 | 58 (56.9%) | 44 (43.1%) |
| $75,000 to $99,999 | 86 (71.1%) | 35 (28.9%) |
| $100,000 and over | 270 (71.8%) | 106 (28.2%) |
Public vs Private Health Insurance Coverage by Age in Sand Point
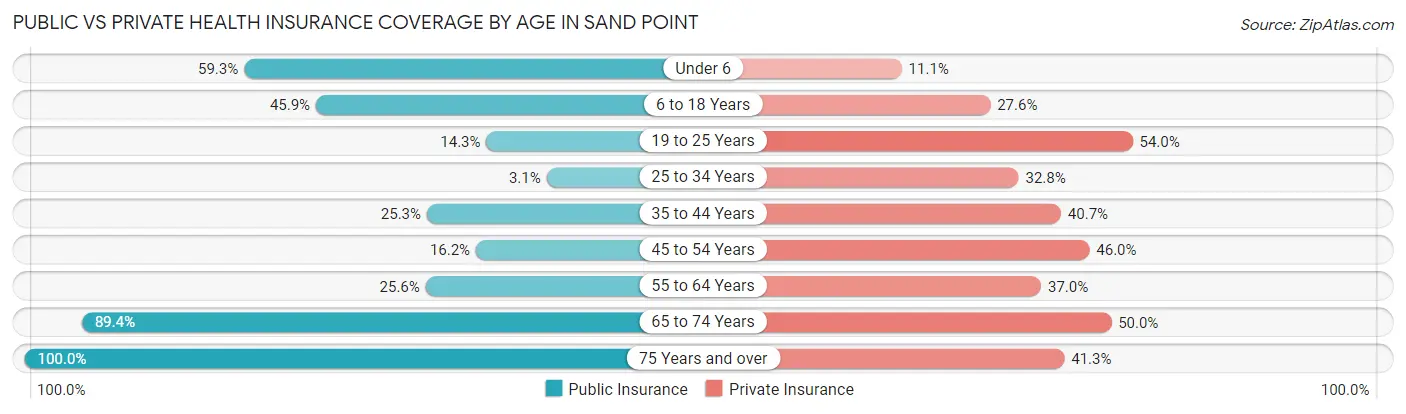
| Age Bracket | Public Insurance | Private Insurance |
| Under 6 | 16 (59.3%) | 3 (11.1%) |
| 6 to 18 Years | 45 (45.9%) | 27 (27.6%) |
| 19 to 25 Years | 9 (14.3%) | 34 (54.0%) |
| 25 to 34 Years | 4 (3.1%) | 42 (32.8%) |
| 35 to 44 Years | 38 (25.3%) | 61 (40.7%) |
| 45 to 54 Years | 30 (16.2%) | 85 (46.0%) |
| 55 to 64 Years | 56 (25.6%) | 81 (37.0%) |
| 65 to 74 Years | 118 (89.4%) | 66 (50.0%) |
| 75 Years and over | 46 (100.0%) | 19 (41.3%) |
| Total | 362 (34.5%) | 418 (39.9%) |
Disability Status by Sex by Age in Sand Point
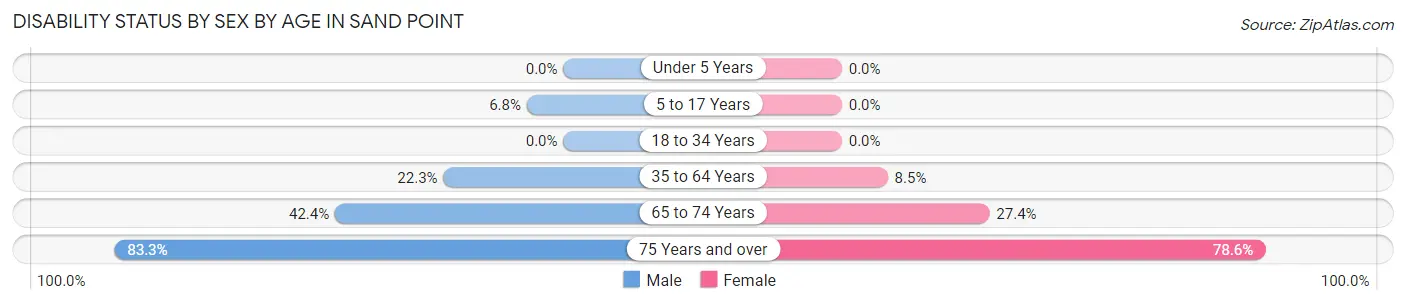
| Age Bracket | Male | Female |
| Under 5 Years | 0 (0.0%) | 0 (0.0%) |
| 5 to 17 Years | 4 (6.8%) | 0 (0.0%) |
| 18 to 34 Years | 0 (0.0%) | 0 (0.0%) |
| 35 to 64 Years | 71 (22.3%) | 20 (8.5%) |
| 65 to 74 Years | 25 (42.4%) | 20 (27.4%) |
| 75 Years and over | 15 (83.3%) | 22 (78.6%) |
Disability Class by Sex by Age in Sand Point
Disability Class: Hearing Difficulty
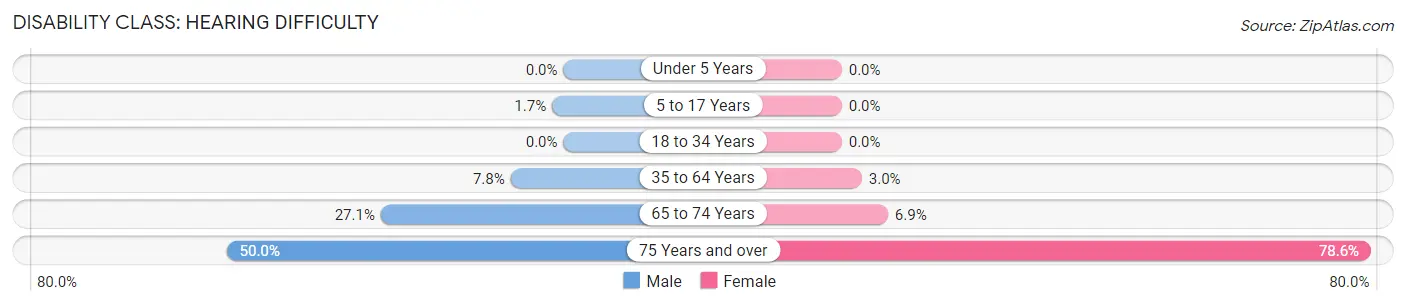
| Age Bracket | Male | Female |
| Under 5 Years | 0 (0.0%) | 0 (0.0%) |
| 5 to 17 Years | 1 (1.7%) | 0 (0.0%) |
| 18 to 34 Years | 0 (0.0%) | 0 (0.0%) |
| 35 to 64 Years | 25 (7.8%) | 7 (3.0%) |
| 65 to 74 Years | 16 (27.1%) | 5 (6.9%) |
| 75 Years and over | 9 (50.0%) | 22 (78.6%) |
Disability Class: Vision Difficulty
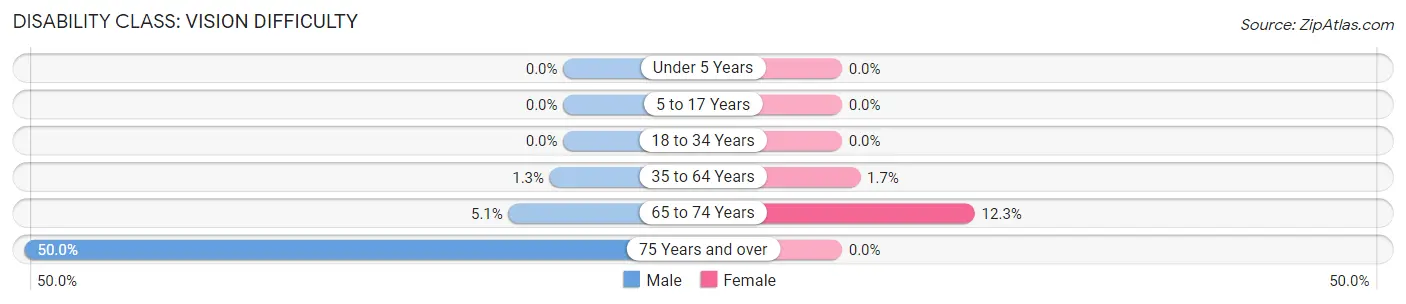
| Age Bracket | Male | Female |
| Under 5 Years | 0 (0.0%) | 0 (0.0%) |
| 5 to 17 Years | 0 (0.0%) | 0 (0.0%) |
| 18 to 34 Years | 0 (0.0%) | 0 (0.0%) |
| 35 to 64 Years | 4 (1.3%) | 4 (1.7%) |
| 65 to 74 Years | 3 (5.1%) | 9 (12.3%) |
| 75 Years and over | 9 (50.0%) | 0 (0.0%) |
Disability Class: Cognitive Difficulty
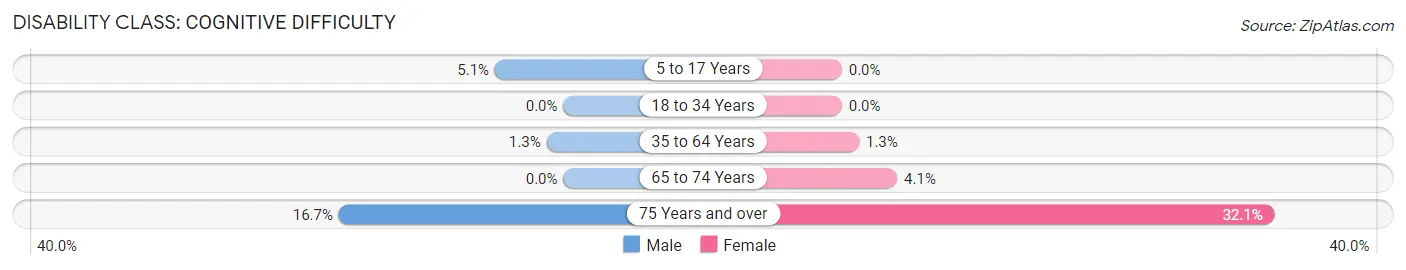
| Age Bracket | Male | Female |
| 5 to 17 Years | 3 (5.1%) | 0 (0.0%) |
| 18 to 34 Years | 0 (0.0%) | 0 (0.0%) |
| 35 to 64 Years | 4 (1.3%) | 3 (1.3%) |
| 65 to 74 Years | 0 (0.0%) | 3 (4.1%) |
| 75 Years and over | 3 (16.7%) | 9 (32.1%) |
Disability Class: Ambulatory Difficulty
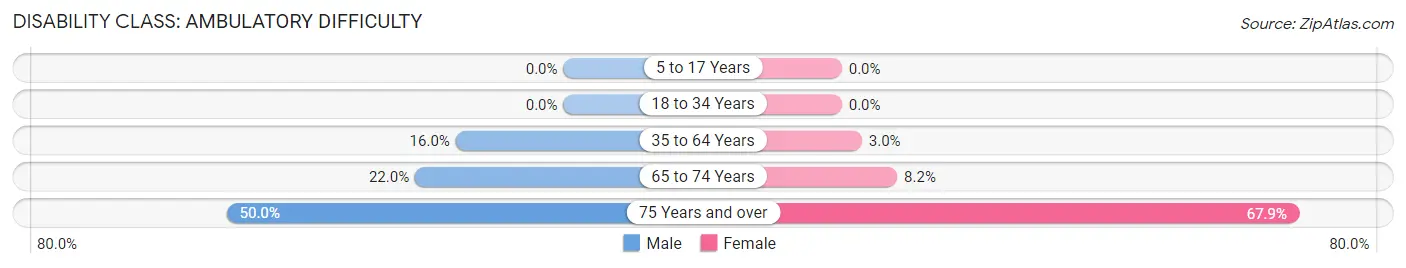
| Age Bracket | Male | Female |
| 5 to 17 Years | 0 (0.0%) | 0 (0.0%) |
| 18 to 34 Years | 0 (0.0%) | 0 (0.0%) |
| 35 to 64 Years | 51 (16.0%) | 7 (3.0%) |
| 65 to 74 Years | 13 (22.0%) | 6 (8.2%) |
| 75 Years and over | 9 (50.0%) | 19 (67.9%) |
Disability Class: Self-Care Difficulty
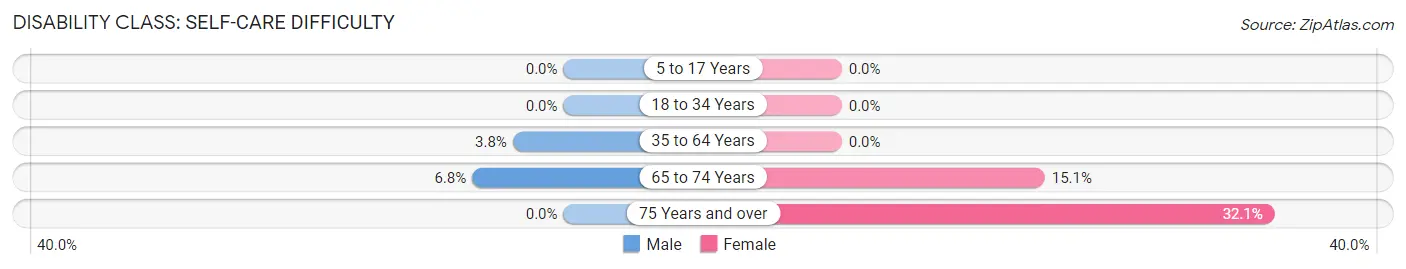
| Age Bracket | Male | Female |
| 5 to 17 Years | 0 (0.0%) | 0 (0.0%) |
| 18 to 34 Years | 0 (0.0%) | 0 (0.0%) |
| 35 to 64 Years | 12 (3.8%) | 0 (0.0%) |
| 65 to 74 Years | 4 (6.8%) | 11 (15.1%) |
| 75 Years and over | 0 (0.0%) | 9 (32.1%) |
Technology Access in Sand Point
Computing Device Access in Sand Point
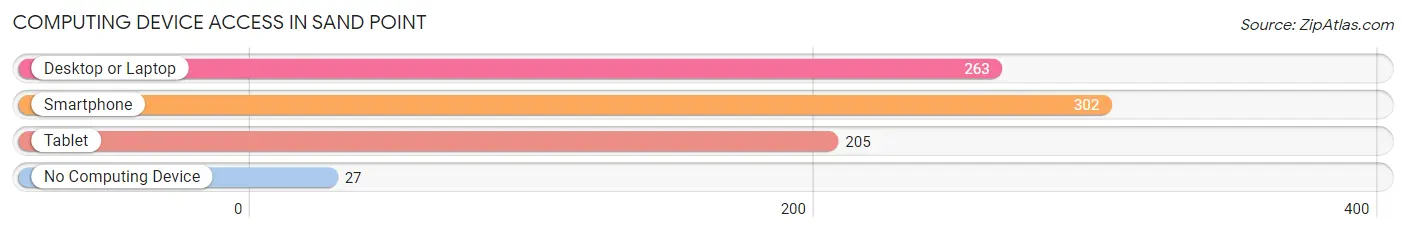
| Device Type | # Households | % Households |
| Desktop or Laptop | 263 | 77.1% |
| Smartphone | 302 | 88.6% |
| Tablet | 205 | 60.1% |
| No Computing Device | 27 | 7.9% |
| Total | 341 | 100.0% |
Internet Access in Sand Point
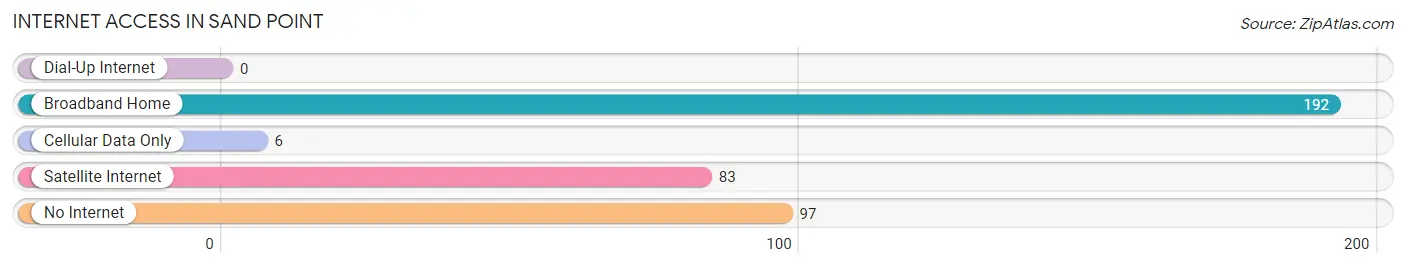
| Internet Type | # Households | % Households |
| Dial-Up Internet | 0 | 0.0% |
| Broadband Home | 192 | 56.3% |
| Cellular Data Only | 6 | 1.8% |
| Satellite Internet | 83 | 24.3% |
| No Internet | 97 | 28.4% |
| Total | 341 | 100.0% |
Sand Point Summary
Sand Point is a city located in the Aleutians East Borough of Alaska. It is located on the western side of the Alaska Peninsula, on the eastern shore of Popof Island. The city has a population of approximately 1,400 people, and is the largest city in the Aleutians East Borough.
History
The area around Sand Point has been inhabited for thousands of years by the Unangan people, also known as the Aleut. The Unangan people were hunter-gatherers, and relied on the abundant marine life in the area for sustenance. The Unangan people were also known for their skill in crafting tools and weapons from the materials found in the area.
In 1741, the Russian explorer Vitus Bering arrived in the area, and claimed the land for Russia. The Unangan people were forced to relocate to other parts of the Alaska Peninsula, and the Russian fur traders began to exploit the area for its resources.
In 1867, the United States purchased Alaska from Russia, and the area around Sand Point became part of the newly formed Alaska Territory. In the late 19th century, the area around Sand Point began to be settled by American and European immigrants. The first permanent settlement in the area was established in 1891, and was named Sand Point after the nearby sand spit.
In the early 20th century, the area around Sand Point began to be developed for commercial fishing. The first cannery was established in 1912, and the area quickly became a major center for the commercial fishing industry.
In the 1950s, the United States Air Force established a base in the area, and the population of Sand Point began to grow rapidly. The base was closed in the 1970s, but the population of Sand Point continued to grow, and the city was incorporated in 1975.
Geography
Sand Point is located on the western side of the Alaska Peninsula, on the eastern shore of Popof Island. The city is located at an elevation of approximately 20 feet above sea level, and is surrounded by the Bering Sea to the north, the Pacific Ocean to the south, and the Aleutian Islands to the west.
The climate in Sand Point is generally mild, with temperatures ranging from the mid-30s in the winter to the mid-60s in the summer. The area receives an average of approximately 40 inches of precipitation per year, with most of the precipitation falling in the form of snow.
Economy
The economy of Sand Point is largely based on commercial fishing and tourism. The city is home to several seafood processing plants, and is a major center for the commercial fishing industry in Alaska. The city also has a thriving tourism industry, with visitors coming to the area to take advantage of the abundant wildlife and outdoor activities.
The city is also home to several small businesses, including restaurants, retail stores, and other services. The city is also home to a small airport, which serves as a hub for air travel to and from the Aleutian Islands.
Demographics
As of the 2010 census, the population of Sand Point was 1,382. The population is largely composed of Native Americans, with the Unangan people making up the majority of the population. The city also has a large population of European and American immigrants, as well as a small population of Asian immigrants.
The median household income in Sand Point is $50,000, and the median home value is $150,000. The city has a high rate of poverty, with approximately 25% of the population living below the poverty line.
Conclusion
Sand Point is a city located in the Aleutians East Borough of Alaska. It is located on the western side of the Alaska Peninsula, on the eastern shore of Popof Island. The city has a population of approximately 1,400 people, and is the largest city in the Aleutians East Borough. The economy of Sand Point is largely based on commercial fishing and tourism, and the city is home to a large population of Native Americans, as well as a small population of European and American immigrants. The city has a high rate of poverty, with approximately 25% of the population living below the poverty line.
Common Questions
What is Per Capita Income in Sand Point?
Per Capita income in Sand Point is $40,288.
What is the Median Family Income in Sand Point?
Median Family Income in Sand Point is $91,250.
What is the Median Household income in Sand Point?
Median Household Income in Sand Point is $79,922.
What is Income or Wage Gap in Sand Point?
Income or Wage Gap in Sand Point is 1.9%.
Women in Sand Point earn 98.1 cents for every dollar earned by a man.
What is Inequality or Gini Index in Sand Point?
Inequality or Gini Index in Sand Point is 0.41.
What is the Total Population of Sand Point?
Total Population of Sand Point is 1,048.
What is the Total Male Population of Sand Point?
Total Male Population of Sand Point is 580.
What is the Total Female Population of Sand Point?
Total Female Population of Sand Point is 468.
What is the Ratio of Males per 100 Females in Sand Point?
There are 123.93 Males per 100 Females in Sand Point.
What is the Ratio of Females per 100 Males in Sand Point?
There are 80.69 Females per 100 Males in Sand Point.
What is the Median Population Age in Sand Point?
Median Population Age in Sand Point is 48.3 Years.
What is the Average Family Size in Sand Point
Average Family Size in Sand Point is 2.5 People.
What is the Average Household Size in Sand Point
Average Household Size in Sand Point is 2.3 People.
How Large is the Labor Force in Sand Point?
There are 680 People in the Labor Forcein in Sand Point.
What is the Percentage of People in the Labor Force in Sand Point?
71.4% of People are in the Labor Force in Sand Point.
What is the Unemployment Rate in Sand Point?
Unemployment Rate in Sand Point is 3.2%.