Chignik, AK Map & Demographics
Chignik Map
Chignik Overview
$25,963
PER CAPITA INCOME
$81,094
AVG FAMILY INCOME
$80,469
AVG HOUSEHOLD INCOME
60.0%
WAGE / INCOME GAP [ % ]
40.0¢/ $1
WAGE / INCOME GAP [ $ ]
0.17
INEQUALITY / GINI INDEX
54
TOTAL POPULATION
25
MALE POPULATION
29
FEMALE POPULATION
86.21
MALES / 100 FEMALES
116.00
FEMALES / 100 MALES
44.5
MEDIAN AGE
2.9
AVG FAMILY SIZE
2.6
AVG HOUSEHOLD SIZE
28
LABOR FORCE [ PEOPLE ]
65.1%
PERCENT IN LABOR FORCE
10.7%
UNEMPLOYMENT RATE
Chignik Zip Codes
Chignik Area Codes
Income in Chignik
Income Overview in Chignik
Per Capita Income in Chignik is $25,963, while median incomes of families and households are $81,094 and $80,469 respectively.
| Characteristic | Number | Measure |
| Per Capita Income | 54 | $25,963 |
| Median Family Income | 17 | $81,094 |
| Mean Family Income | 17 | $68,729 |
| Median Household Income | 21 | $80,469 |
| Mean Household Income | 21 | $69,233 |
| Income Deficit | 17 | $0 |
| Wage / Income Gap (%) | 54 | 60.00% |
| Wage / Income Gap ($) | 54 | 40.00¢ per $1 |
| Gini / Inequality Index | 54 | 0.17 |
Earnings by Sex in Chignik
Average Earnings in Chignik are $23,750, $43,750 for men and $17,500 for women, a difference of 60.0%.
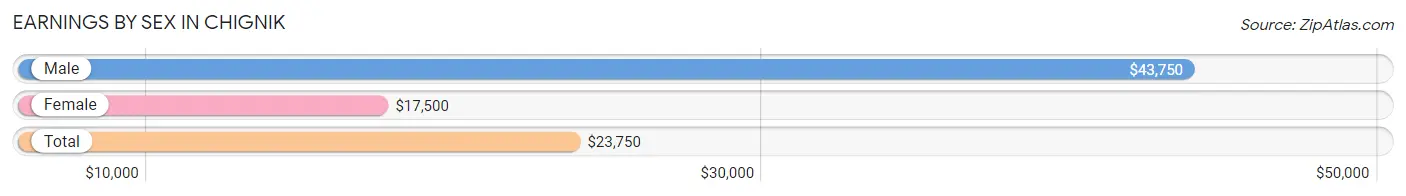
| Sex | Number | Average Earnings |
| Male | 20 (50.0%) | $43,750 |
| Female | 20 (50.0%) | $17,500 |
| Total | 40 (100.0%) | $23,750 |
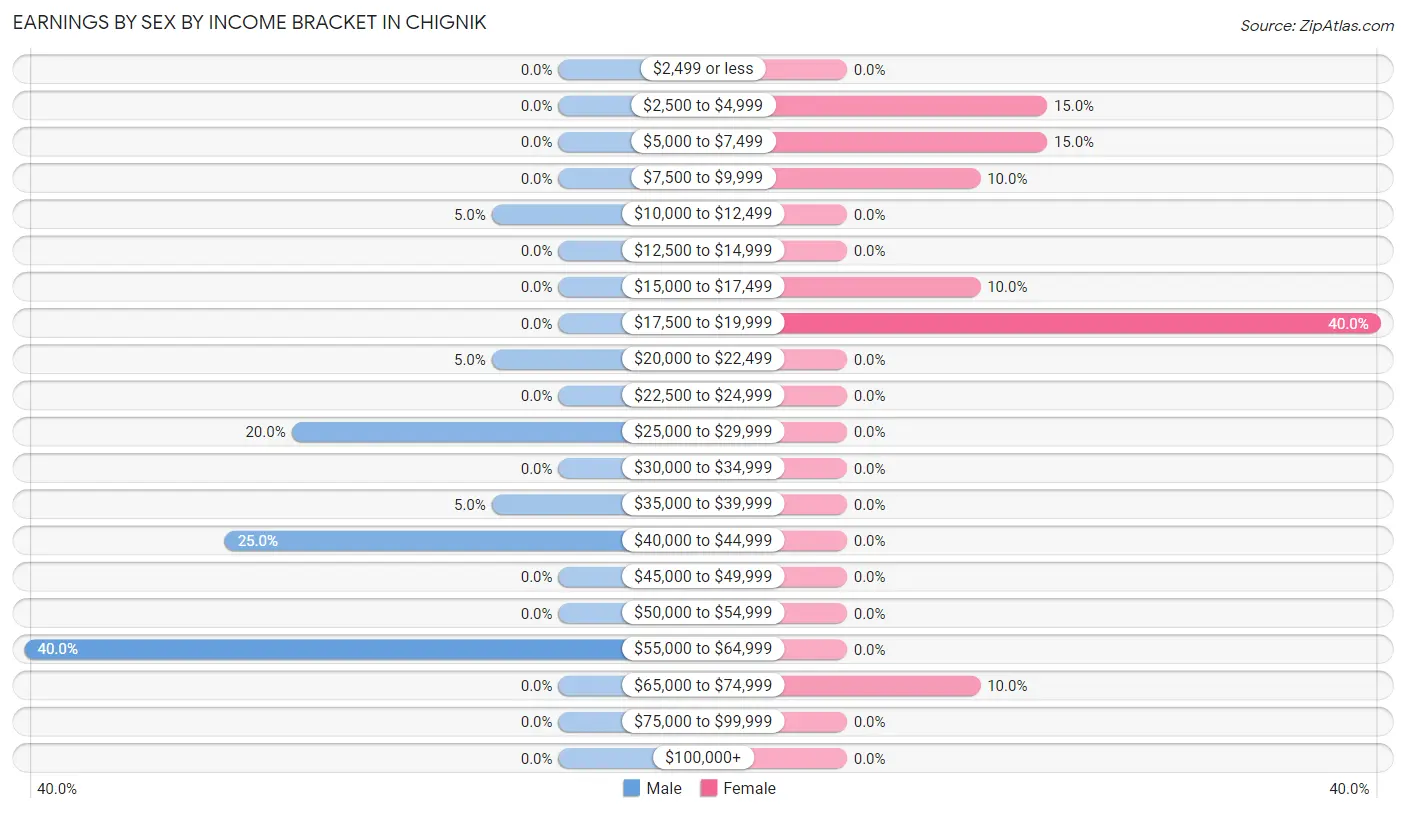
Earnings by Sex by Income Bracket in Chignik
The most common earnings brackets in Chignik are $55,000 to $64,999 for men (8 | 40.0%) and $17,500 to $19,999 for women (8 | 40.0%).
| Income | Male | Female |
| $2,499 or less | 0 (0.0%) | 0 (0.0%) |
| $2,500 to $4,999 | 0 (0.0%) | 3 (15.0%) |
| $5,000 to $7,499 | 0 (0.0%) | 3 (15.0%) |
| $7,500 to $9,999 | 0 (0.0%) | 2 (10.0%) |
| $10,000 to $12,499 | 1 (5.0%) | 0 (0.0%) |
| $12,500 to $14,999 | 0 (0.0%) | 0 (0.0%) |
| $15,000 to $17,499 | 0 (0.0%) | 2 (10.0%) |
| $17,500 to $19,999 | 0 (0.0%) | 8 (40.0%) |
| $20,000 to $22,499 | 1 (5.0%) | 0 (0.0%) |
| $22,500 to $24,999 | 0 (0.0%) | 0 (0.0%) |
| $25,000 to $29,999 | 4 (20.0%) | 0 (0.0%) |
| $30,000 to $34,999 | 0 (0.0%) | 0 (0.0%) |
| $35,000 to $39,999 | 1 (5.0%) | 0 (0.0%) |
| $40,000 to $44,999 | 5 (25.0%) | 0 (0.0%) |
| $45,000 to $49,999 | 0 (0.0%) | 0 (0.0%) |
| $50,000 to $54,999 | 0 (0.0%) | 0 (0.0%) |
| $55,000 to $64,999 | 8 (40.0%) | 0 (0.0%) |
| $65,000 to $74,999 | 0 (0.0%) | 2 (10.0%) |
| $75,000 to $99,999 | 0 (0.0%) | 0 (0.0%) |
| $100,000+ | 0 (0.0%) | 0 (0.0%) |
| Total | 20 (100.0%) | 20 (100.0%) |
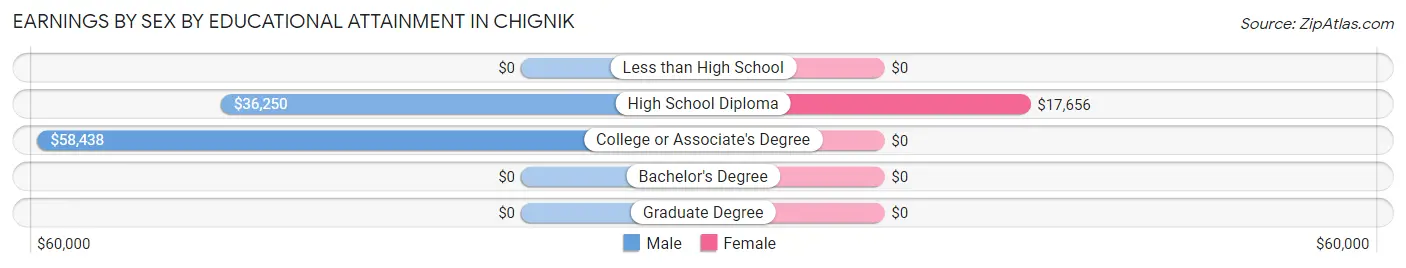
Earnings by Sex by Educational Attainment in Chignik
Average earnings in Chignik are $43,750 for men and $17,813 for women, a difference of 59.3%. Men with an educational attainment of college or associate's degree enjoy the highest average annual earnings of $58,438, while those with high school diploma education earn the least with $36,250. Women with an educational attainment of high school diploma earn the most with the average annual earnings of $17,656, while those with high school diploma education have the smallest earnings of $17,656.
| Educational Attainment | Male Income | Female Income |
| Less than High School | - | - |
| High School Diploma | $36,250 | $17,656 |
| College or Associate's Degree | $58,438 | $0 |
| Bachelor's Degree | - | - |
| Graduate Degree | - | - |
| Total | $43,750 | $17,813 |
Family Income in Chignik
Family Income Brackets in Chignik
According to the Chignik family income data, there are 10 families falling into the $75,000 to $99,999 income range, which is the most common income bracket and makes up 58.8% of all families.
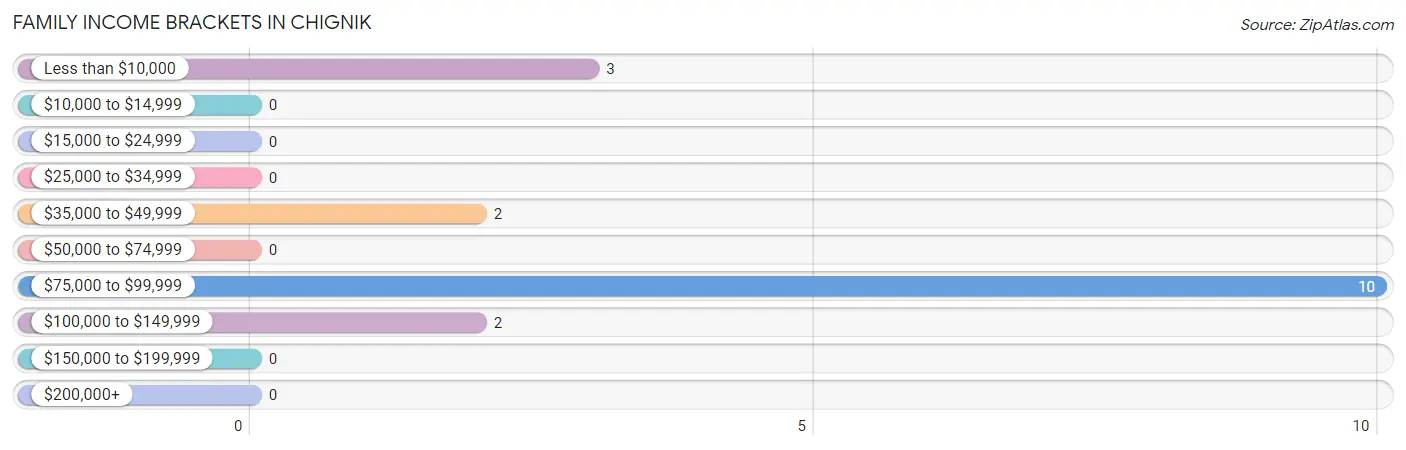
| Income Bracket | # Families | % Families |
| Less than $10,000 | 3 | 17.6% |
| $10,000 to $14,999 | 0 | 0.0% |
| $15,000 to $24,999 | 0 | 0.0% |
| $25,000 to $34,999 | 0 | 0.0% |
| $35,000 to $49,999 | 2 | 11.8% |
| $50,000 to $74,999 | 0 | 0.0% |
| $75,000 to $99,999 | 10 | 58.8% |
| $100,000 to $149,999 | 2 | 11.8% |
| $150,000 to $199,999 | 0 | 0.0% |
| $200,000+ | 0 | 0.0% |
Family Income by Famaliy Size in Chignik
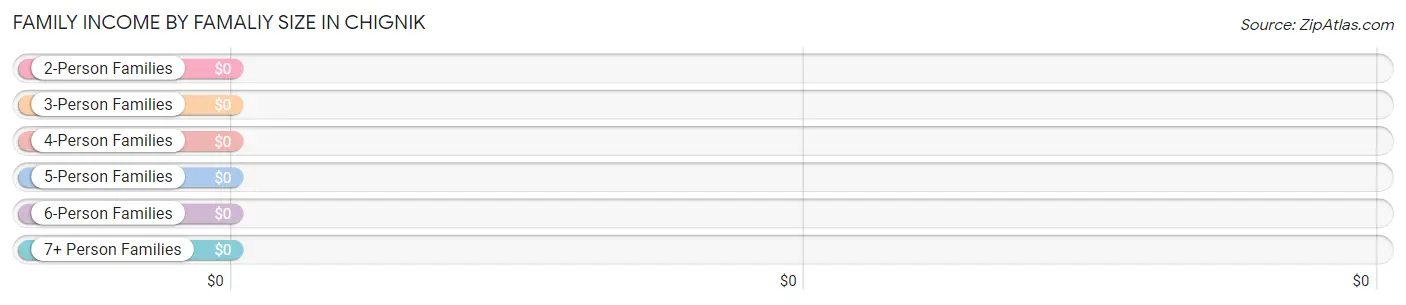
| Income Bracket | # Families | Median Income |
| 2-Person Families | 9 (52.9%) | $0 |
| 3-Person Families | 2 (11.8%) | $0 |
| 4-Person Families | 6 (35.3%) | $0 |
| 5-Person Families | 0 (0.0%) | $0 |
| 6-Person Families | 0 (0.0%) | $0 |
| 7+ Person Families | 0 (0.0%) | $0 |
| Total | 17 (100.0%) | $81,094 |
Family Income by Number of Earners in Chignik
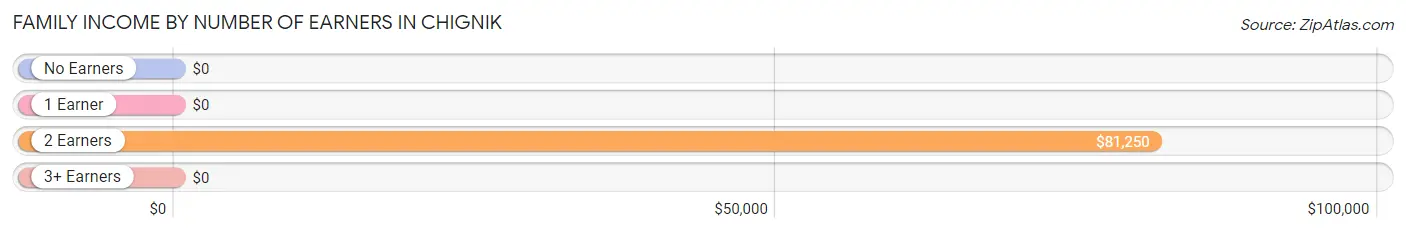
| Number of Earners | # Families | Median Income |
| No Earners | 0 (0.0%) | $0 |
| 1 Earner | 3 (17.6%) | $0 |
| 2 Earners | 12 (70.6%) | $81,250 |
| 3+ Earners | 2 (11.8%) | $0 |
| Total | 17 (100.0%) | $81,094 |
Household Income in Chignik
Household Income Brackets in Chignik
With 10 households falling in the category, the $75,000 to $99,999 income range is the most frequent in Chignik, accounting for 47.6% of all households.
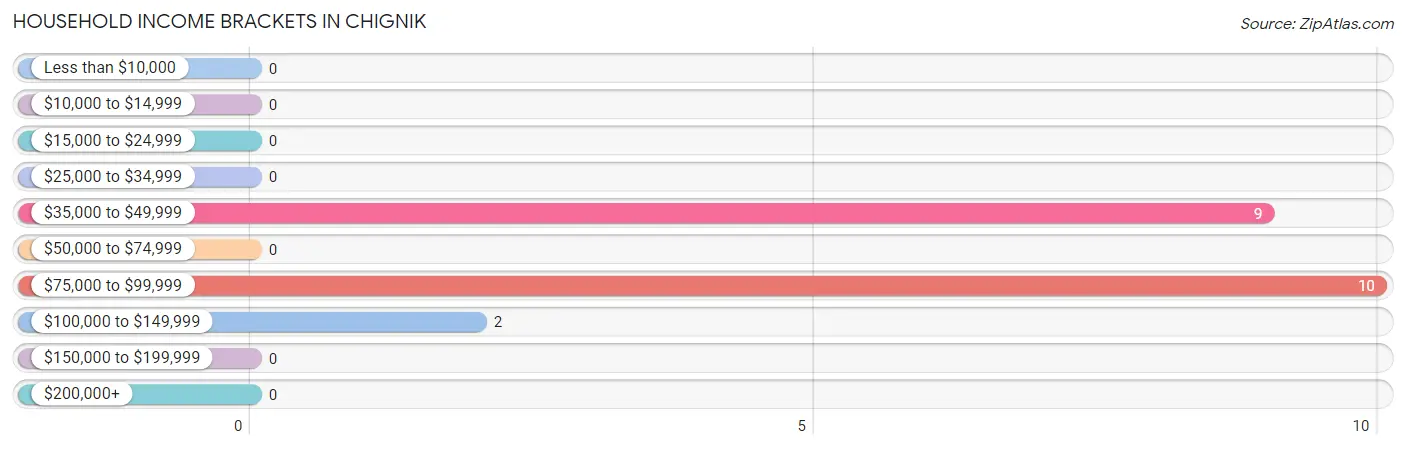
| Income Bracket | # Households | % Households |
| Less than $10,000 | 0 | 0.0% |
| $10,000 to $14,999 | 0 | 0.0% |
| $15,000 to $24,999 | 0 | 0.0% |
| $25,000 to $34,999 | 0 | 0.0% |
| $35,000 to $49,999 | 9 | 42.9% |
| $50,000 to $74,999 | 0 | 0.0% |
| $75,000 to $99,999 | 10 | 47.6% |
| $100,000 to $149,999 | 2 | 9.5% |
| $150,000 to $199,999 | 0 | 0.0% |
| $200,000+ | 0 | 0.0% |
Household Income by Householder Age in Chignik
The median household income in Chignik is $80,469, with the highest median household income of $81,250 found in the 45 to 64 years age bracket for the primary householder. A total of 12 households (57.1%) fall into this category.
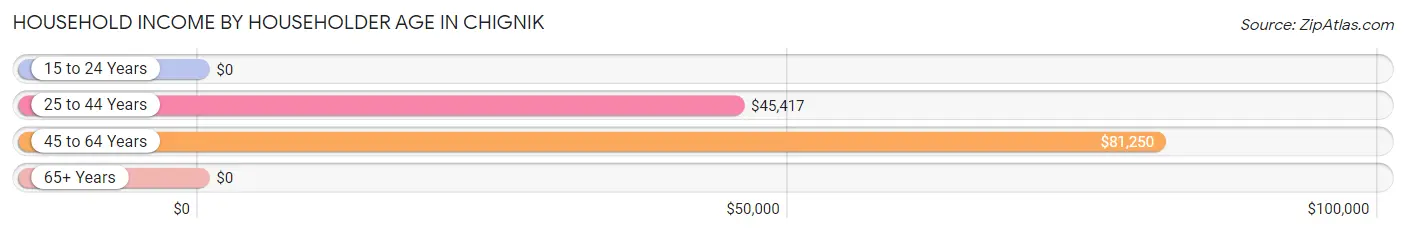
| Income Bracket | # Households | Median Income |
| 15 to 24 Years | 0 (0.0%) | $0 |
| 25 to 44 Years | 9 (42.9%) | $45,417 |
| 45 to 64 Years | 12 (57.1%) | $81,250 |
| 65+ Years | 0 (0.0%) | $0 |
| Total | 21 (100.0%) | $80,469 |
Poverty in Chignik
Income Below Poverty by Sex and Age in Chignik
With 20.0% poverty level for males and 20.7% for females among the residents of Chignik, under 5 year old males and 6 to 11 year old females are the most vulnerable to poverty, with 3 males (100.0%) and 3 females (100.0%) in their respective age groups living below the poverty level.
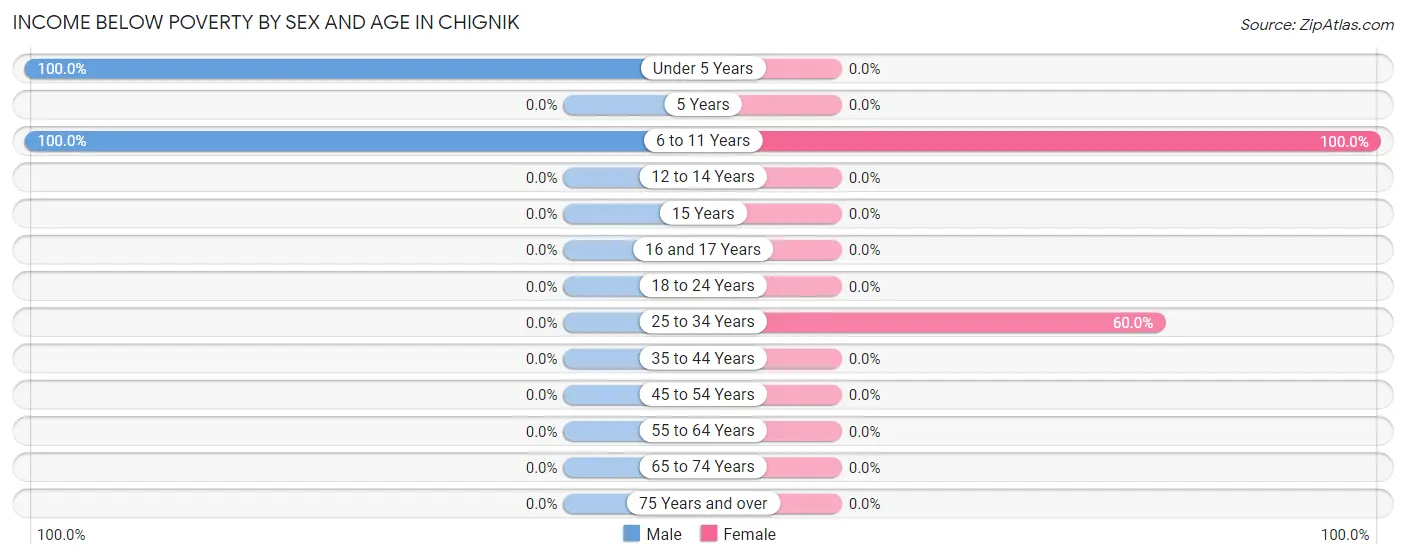
| Age Bracket | Male | Female |
| Under 5 Years | 3 (100.0%) | 0 (0.0%) |
| 5 Years | 0 (0.0%) | 0 (0.0%) |
| 6 to 11 Years | 2 (100.0%) | 3 (100.0%) |
| 12 to 14 Years | 0 (0.0%) | 0 (0.0%) |
| 15 Years | 0 (0.0%) | 0 (0.0%) |
| 16 and 17 Years | 0 (0.0%) | 0 (0.0%) |
| 18 to 24 Years | 0 (0.0%) | 0 (0.0%) |
| 25 to 34 Years | 0 (0.0%) | 3 (60.0%) |
| 35 to 44 Years | 0 (0.0%) | 0 (0.0%) |
| 45 to 54 Years | 0 (0.0%) | 0 (0.0%) |
| 55 to 64 Years | 0 (0.0%) | 0 (0.0%) |
| 65 to 74 Years | 0 (0.0%) | 0 (0.0%) |
| 75 Years and over | 0 (0.0%) | 0 (0.0%) |
| Total | 5 (20.0%) | 6 (20.7%) |
Income Above Poverty by Sex and Age in Chignik
According to the poverty statistics in Chignik, males aged 25 to 34 years and females aged under 5 years are the age groups that are most secure financially, with 100.0% of males and 100.0% of females in these age groups living above the poverty line.
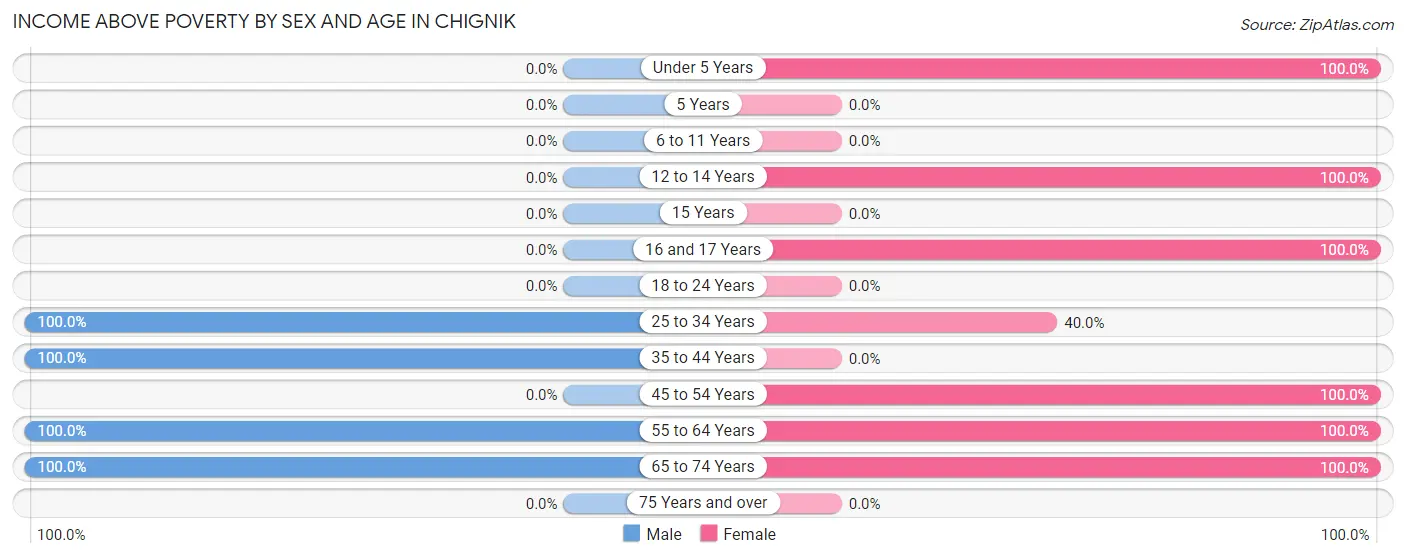
| Age Bracket | Male | Female |
| Under 5 Years | 0 (0.0%) | 1 (100.0%) |
| 5 Years | 0 (0.0%) | 0 (0.0%) |
| 6 to 11 Years | 0 (0.0%) | 0 (0.0%) |
| 12 to 14 Years | 0 (0.0%) | 2 (100.0%) |
| 15 Years | 0 (0.0%) | 0 (0.0%) |
| 16 and 17 Years | 0 (0.0%) | 2 (100.0%) |
| 18 to 24 Years | 0 (0.0%) | 0 (0.0%) |
| 25 to 34 Years | 5 (100.0%) | 2 (40.0%) |
| 35 to 44 Years | 4 (100.0%) | 0 (0.0%) |
| 45 to 54 Years | 0 (0.0%) | 1 (100.0%) |
| 55 to 64 Years | 10 (100.0%) | 12 (100.0%) |
| 65 to 74 Years | 1 (100.0%) | 3 (100.0%) |
| 75 Years and over | 0 (0.0%) | 0 (0.0%) |
| Total | 20 (80.0%) | 23 (79.3%) |
Income Below Poverty Among Married-Couple Families in Chignik
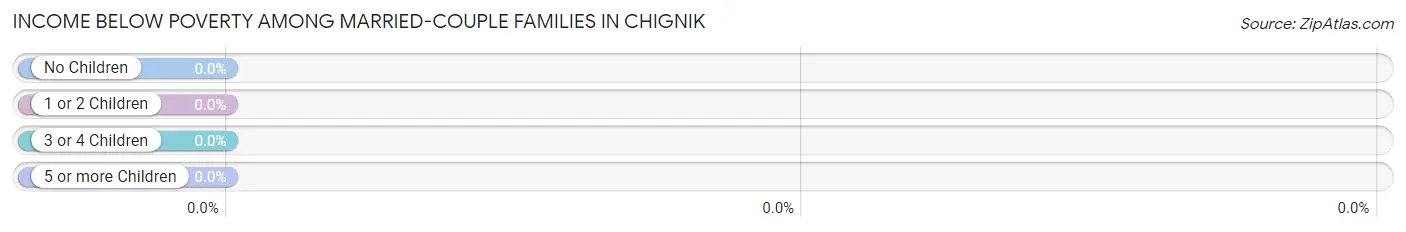
| Children | Above Poverty | Below Poverty |
| No Children | 9 (100.0%) | 0 (0.0%) |
| 1 or 2 Children | 5 (100.0%) | 0 (0.0%) |
| 3 or 4 Children | 0 (0.0%) | 0 (0.0%) |
| 5 or more Children | 0 (0.0%) | 0 (0.0%) |
| Total | 14 (100.0%) | 0 (0.0%) |
Income Below Poverty Among Single-Parent Households in Chignik
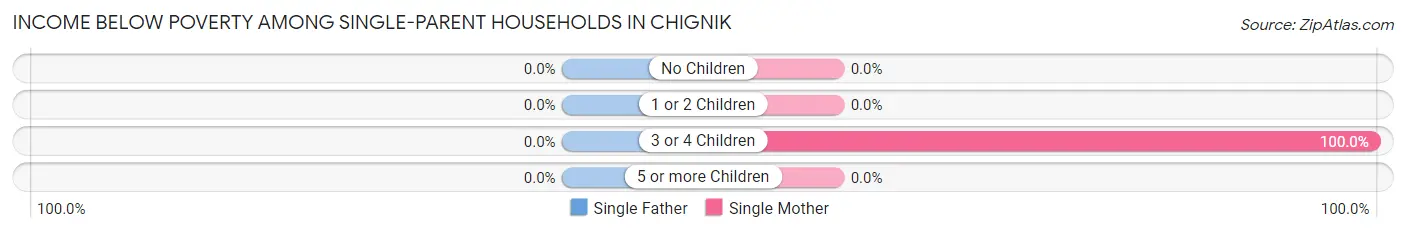
| Children | Single Father | Single Mother |
| No Children | 0 (0.0%) | 0 (0.0%) |
| 1 or 2 Children | 0 (0.0%) | 0 (0.0%) |
| 3 or 4 Children | 0 (0.0%) | 3 (100.0%) |
| 5 or more Children | 0 (0.0%) | 0 (0.0%) |
| Total | 0 (0.0%) | 3 (100.0%) |
Income Below Poverty Among Married-Couple vs Single-Parent Households in Chignik
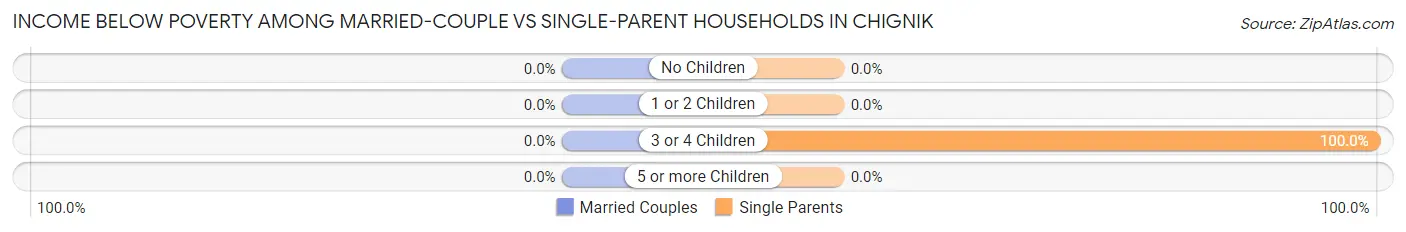
| Children | Married-Couple Families | Single-Parent Households |
| No Children | 0 (0.0%) | 0 (0.0%) |
| 1 or 2 Children | 0 (0.0%) | 0 (0.0%) |
| 3 or 4 Children | 0 (0.0%) | 3 (100.0%) |
| 5 or more Children | 0 (0.0%) | 0 (0.0%) |
| Total | 0 (0.0%) | 3 (100.0%) |
Race in Chignik
The most populous races in Chignik are Native / Alaskan (19 | 35.2%), Asian (16 | 29.6%), and Two or more Races (12 | 22.2%).
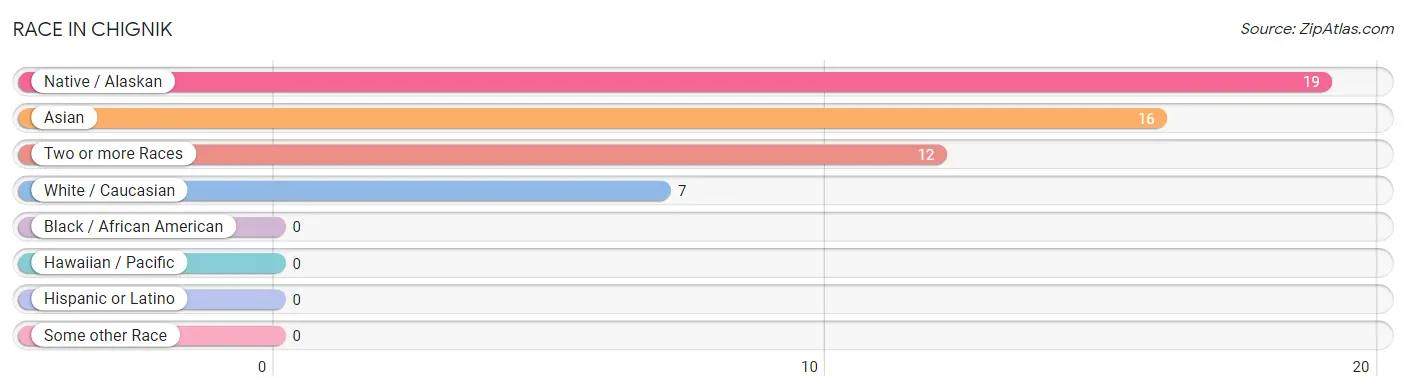
| Race | # Population | % Population |
| Asian | 16 | 29.6% |
| Black / African American | 0 | 0.0% |
| Hawaiian / Pacific | 0 | 0.0% |
| Hispanic or Latino | 0 | 0.0% |
| Native / Alaskan | 19 | 35.2% |
| White / Caucasian | 7 | 13.0% |
| Two or more Races | 12 | 22.2% |
| Some other Race | 0 | 0.0% |
| Total | 54 | 100.0% |
Ancestry in Chignik
The most populous ancestries reported in Chignik are Aleut (19 | 35.2%), Korean (16 | 29.6%), German (13 | 24.1%), Alaska Native (8 | 14.8%), and Irish (6 | 11.1%), together accounting for 114.8% of all Chignik residents.
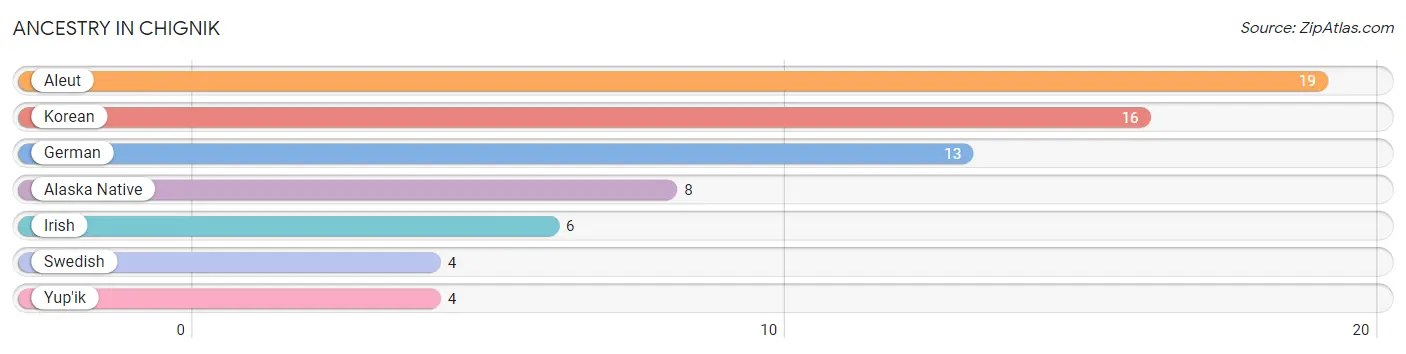
| Ancestry | # Population | % Population |
| Alaska Native | 8 | 14.8% |
| Aleut | 19 | 35.2% |
| German | 13 | 24.1% |
| Irish | 6 | 11.1% |
| Korean | 16 | 29.6% |
| Swedish | 4 | 7.4% |
| Yup'ik | 4 | 7.4% | View All 7 Rows |
Immigrants in Chignik
The most numerous immigrant groups reported in Chignik came from Asia (8 | 14.8%), Central America (8 | 14.8%), Latin America (8 | 14.8%), Mexico (8 | 14.8%), and Philippines (8 | 14.8%), together accounting for 74.1% of all Chignik residents.
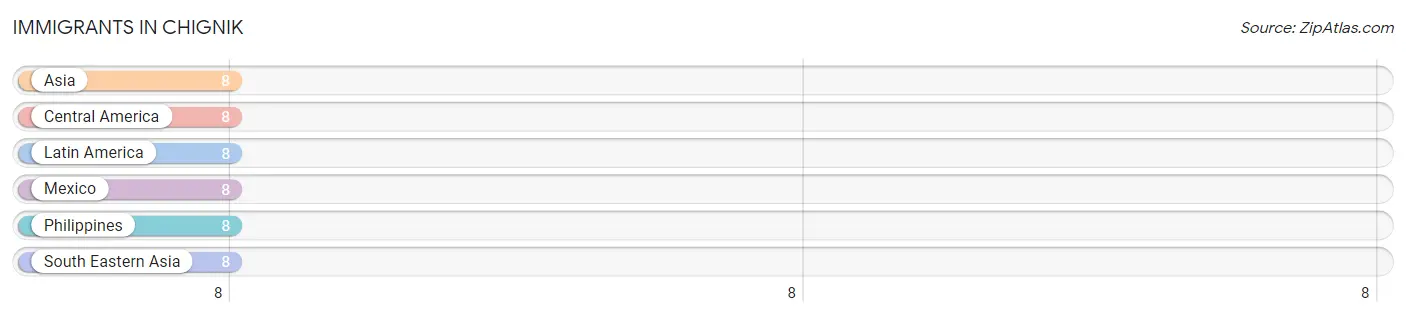
| Immigration Origin | # Population | % Population |
| Asia | 8 | 14.8% |
| Central America | 8 | 14.8% |
| Latin America | 8 | 14.8% |
| Mexico | 8 | 14.8% |
| Philippines | 8 | 14.8% |
| South Eastern Asia | 8 | 14.8% | View All 6 Rows |
Sex and Age in Chignik
Sex and Age in Chignik
The most populous age groups in Chignik are 55 to 59 Years (10 | 40.0%) for men and 60 to 64 Years (12 | 41.4%) for women.
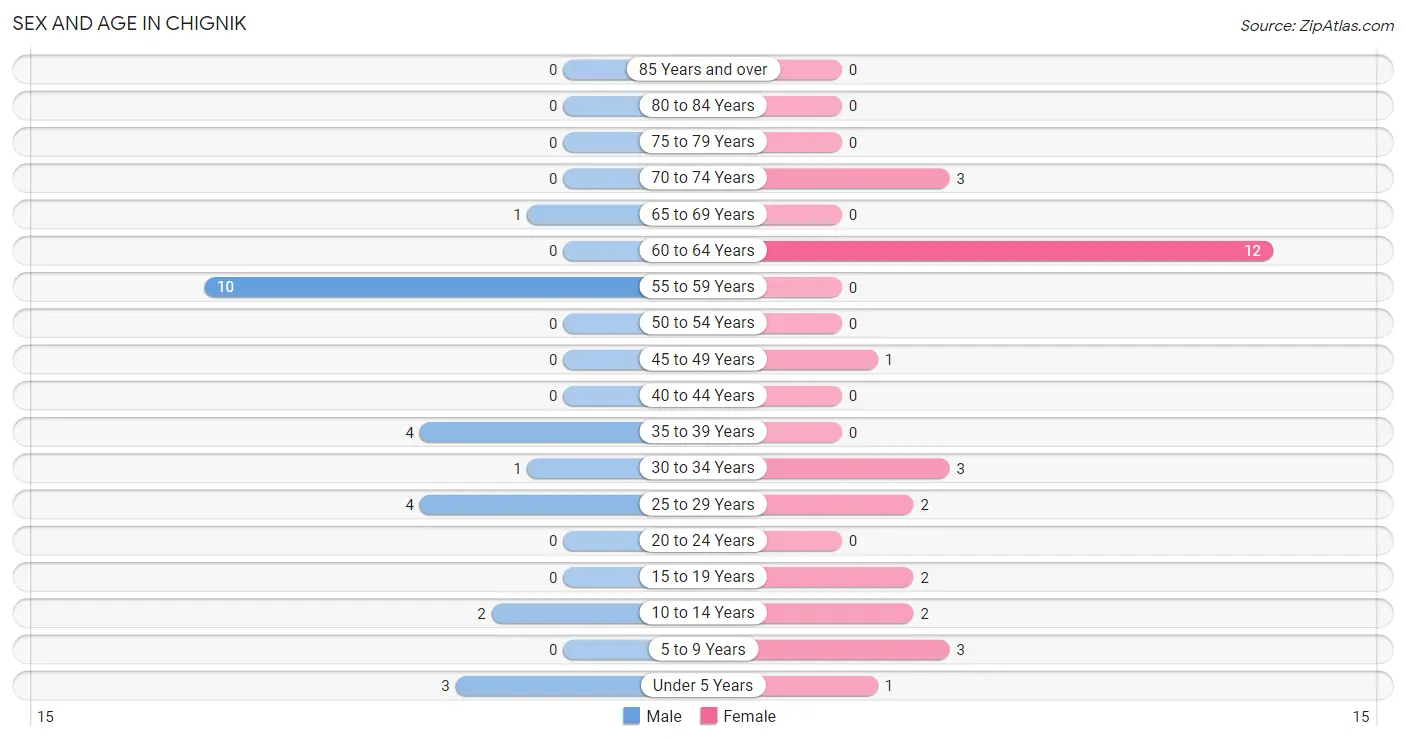
| Age Bracket | Male | Female |
| Under 5 Years | 3 (12.0%) | 1 (3.5%) |
| 5 to 9 Years | 0 (0.0%) | 3 (10.3%) |
| 10 to 14 Years | 2 (8.0%) | 2 (6.9%) |
| 15 to 19 Years | 0 (0.0%) | 2 (6.9%) |
| 20 to 24 Years | 0 (0.0%) | 0 (0.0%) |
| 25 to 29 Years | 4 (16.0%) | 2 (6.9%) |
| 30 to 34 Years | 1 (4.0%) | 3 (10.3%) |
| 35 to 39 Years | 4 (16.0%) | 0 (0.0%) |
| 40 to 44 Years | 0 (0.0%) | 0 (0.0%) |
| 45 to 49 Years | 0 (0.0%) | 1 (3.5%) |
| 50 to 54 Years | 0 (0.0%) | 0 (0.0%) |
| 55 to 59 Years | 10 (40.0%) | 0 (0.0%) |
| 60 to 64 Years | 0 (0.0%) | 12 (41.4%) |
| 65 to 69 Years | 1 (4.0%) | 0 (0.0%) |
| 70 to 74 Years | 0 (0.0%) | 3 (10.3%) |
| 75 to 79 Years | 0 (0.0%) | 0 (0.0%) |
| 80 to 84 Years | 0 (0.0%) | 0 (0.0%) |
| 85 Years and over | 0 (0.0%) | 0 (0.0%) |
| Total | 25 (100.0%) | 29 (100.0%) |
Families and Households in Chignik
Median Family Size in Chignik
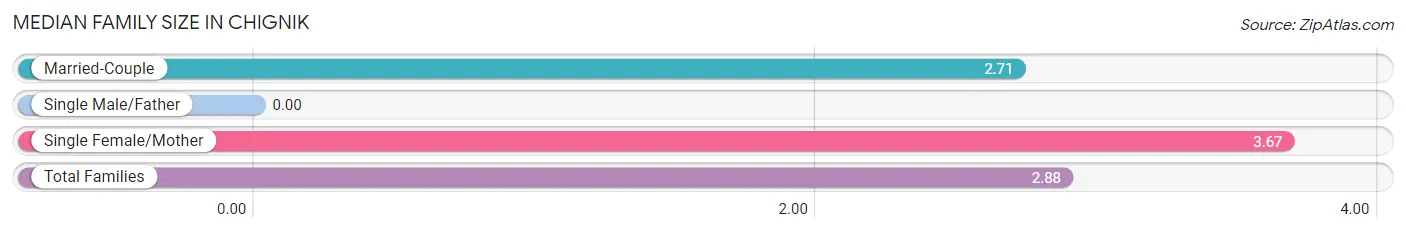
| Family Type | # Families | Family Size |
| Married-Couple | 14 (82.4%) | 2.71 |
| Single Male/Father | 0 (0.0%) | - |
| Single Female/Mother | 3 (17.6%) | 3.67 |
| Total Families | 17 (100.0%) | 2.88 |
Median Household Size in Chignik
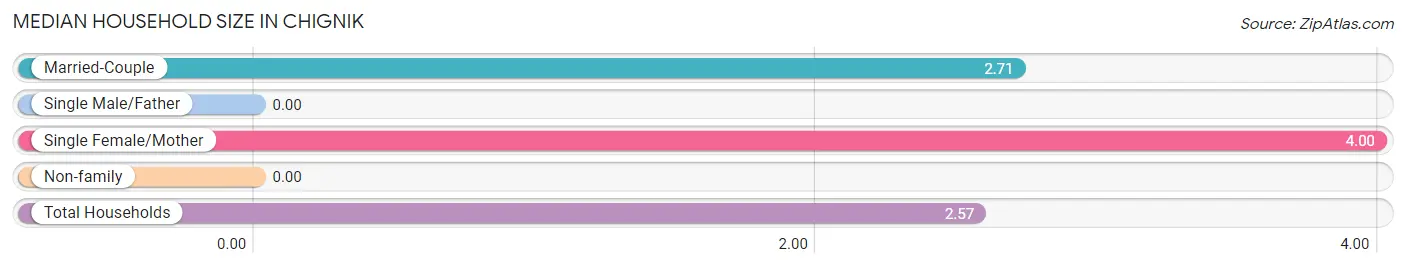
| Household Type | # Households | Household Size |
| Married-Couple | 14 (66.7%) | 2.71 |
| Single Male/Father | 0 (0.0%) | - |
| Single Female/Mother | 3 (14.3%) | 4.00 |
| Non-family | 4 (19.1%) | - |
| Total Households | 21 (100.0%) | 2.57 |
Household Size by Marriage Status in Chignik
Out of a total of 21 households in Chignik, 17 (80.9%) are family households, while 4 (19.1%) are nonfamily households. The most numerous type of family households are 2-person households, comprising 9, and the most common type of nonfamily households are 1-person households, comprising 4.
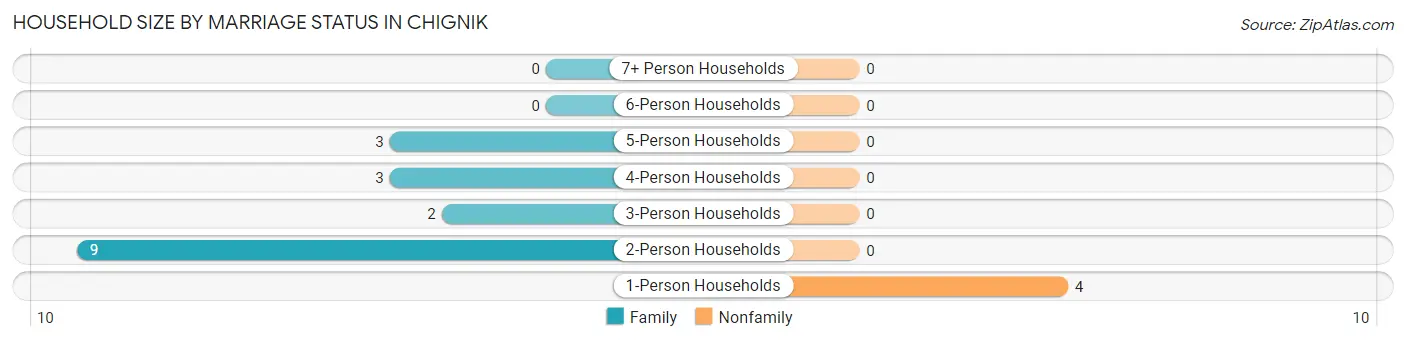
| Household Size | Family Households | Nonfamily Households |
| 1-Person Households | - | 4 (19.1%) |
| 2-Person Households | 9 (42.9%) | 0 (0.0%) |
| 3-Person Households | 2 (9.5%) | 0 (0.0%) |
| 4-Person Households | 3 (14.3%) | 0 (0.0%) |
| 5-Person Households | 3 (14.3%) | 0 (0.0%) |
| 6-Person Households | 0 (0.0%) | 0 (0.0%) |
| 7+ Person Households | 0 (0.0%) | 0 (0.0%) |
| Total | 17 (80.9%) | 4 (19.1%) |
Female Fertility in Chignik
Fertility by Age in Chignik
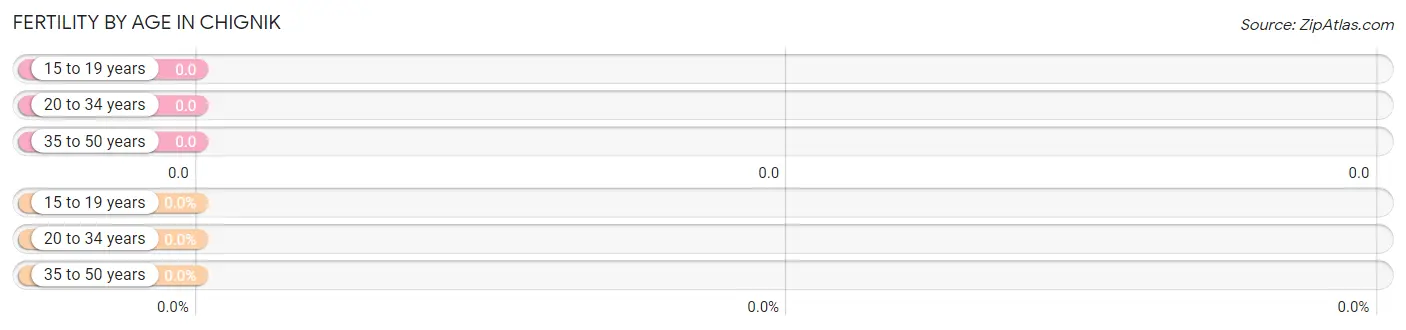
| Age Bracket | Women with Births | Births / 1,000 Women |
| 15 to 19 years | 0 (0.0%) | 0.0 |
| 20 to 34 years | 0 (0.0%) | 0.0 |
| 35 to 50 years | 0 (0.0%) | 0.0 |
| Total | 0 (0.0%) | 0.0 |
Fertility by Age by Marriage Status in Chignik
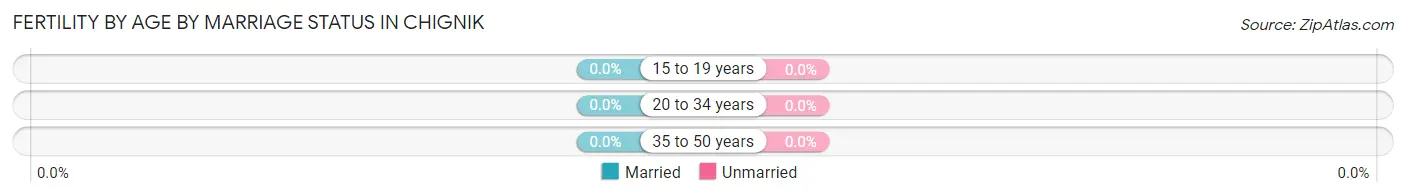
| Age Bracket | Married | Unmarried |
| 15 to 19 years | 0 (0.0%) | 0 (0.0%) |
| 20 to 34 years | 0 (0.0%) | 0 (0.0%) |
| 35 to 50 years | 0 (0.0%) | 0 (0.0%) |
| Total | 0 (0.0%) | 0 (0.0%) |
Fertility by Education in Chignik
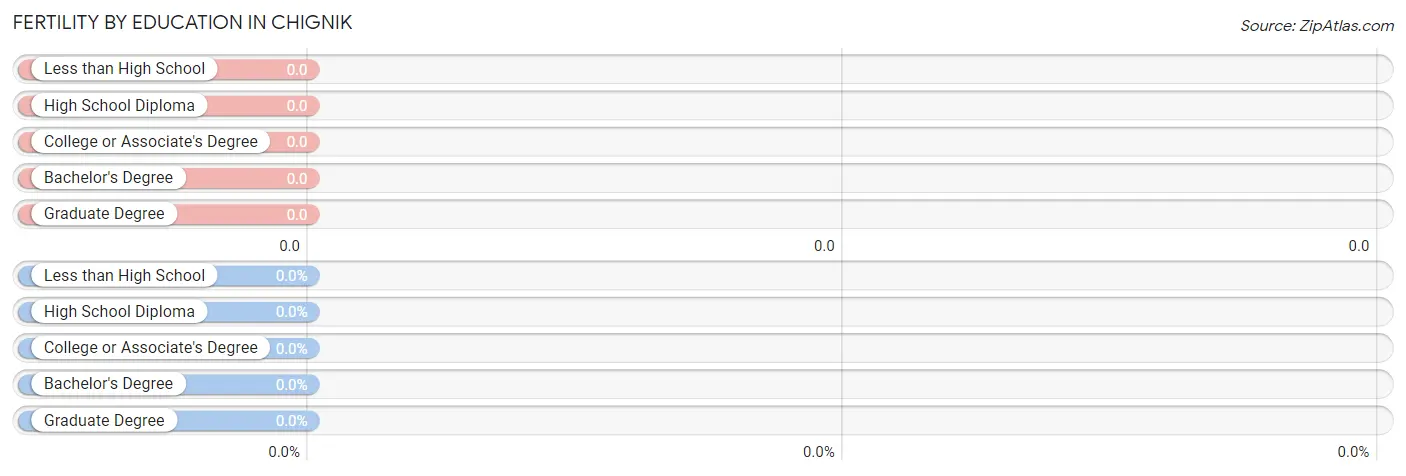
| Educational Attainment | Women with Births | Births / 1,000 Women |
| Less than High School | 0 (0.0%) | 0.0 |
| High School Diploma | 0 (0.0%) | 0.0 |
| College or Associate's Degree | 0 (0.0%) | 0.0 |
| Bachelor's Degree | 0 (0.0%) | 0.0 |
| Graduate Degree | 0 (0.0%) | 0.0 |
| Total | 0 (0.0%) | 0.0 |
Fertility by Education by Marriage Status in Chignik
| Educational Attainment | Married | Unmarried |
| Less than High School | 0 (0.0%) | 0 (0.0%) |
| High School Diploma | 0 (0.0%) | 0 (0.0%) |
| College or Associate's Degree | 0 (0.0%) | 0 (0.0%) |
| Bachelor's Degree | 0 (0.0%) | 0 (0.0%) |
| Graduate Degree | 0 (0.0%) | 0 (0.0%) |
| Total | 0 (0.0%) | 0 (0.0%) |
Employment Characteristics in Chignik
Employment by Class of Employer in Chignik
Among the 25 employed individuals in Chignik, not-for-profit organizations (8 | 32.0%), state government employees (7 | 28.0%), and local government employees (6 | 24.0%) make up the most common classes of employment.
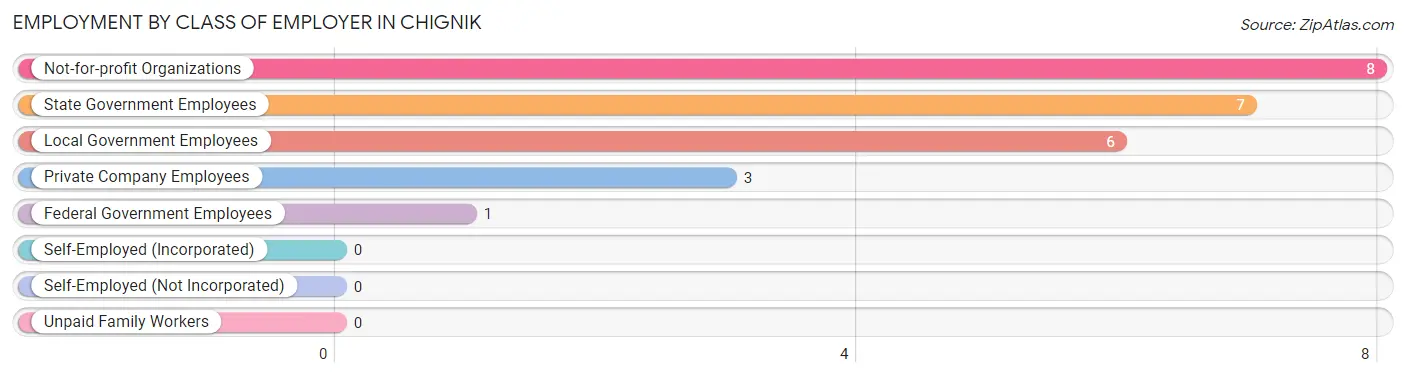
| Employer Class | # Employees | % Employees |
| Private Company Employees | 3 | 12.0% |
| Self-Employed (Incorporated) | 0 | 0.0% |
| Self-Employed (Not Incorporated) | 0 | 0.0% |
| Not-for-profit Organizations | 8 | 32.0% |
| Local Government Employees | 6 | 24.0% |
| State Government Employees | 7 | 28.0% |
| Federal Government Employees | 1 | 4.0% |
| Unpaid Family Workers | 0 | 0.0% |
| Total | 25 | 100.0% |
Employment Status by Age in Chignik
According to the labor force statistics for Chignik, out of the total population over 16 years of age (43), 65.1% or 28 individuals are in the labor force, with 10.7% or 3 of them unemployed. The age group with the highest labor force participation rate is 16 to 19 years, with 100.0% or 2 individuals in the labor force. Within the labor force, the 30 to 34 years age range has the highest percentage of unemployed individuals, with 75.0% or 3 of them being unemployed.
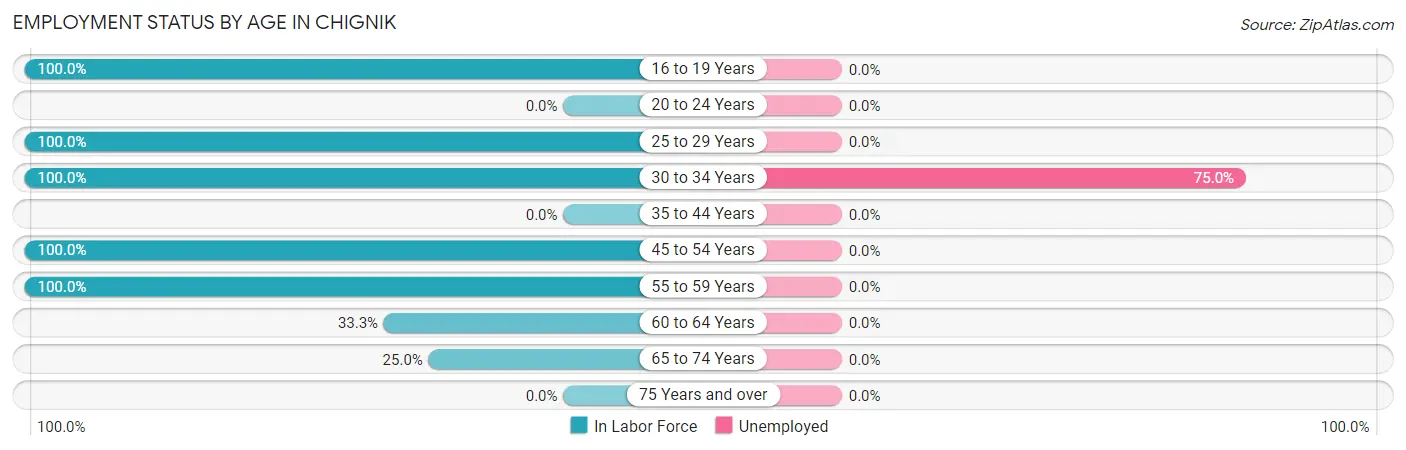
| Age Bracket | In Labor Force | Unemployed |
| 16 to 19 Years | 2 (100.0%) | 0 (0.0%) |
| 20 to 24 Years | 0 (0.0%) | 0 (0.0%) |
| 25 to 29 Years | 6 (100.0%) | 0 (0.0%) |
| 30 to 34 Years | 4 (100.0%) | 3 (75.0%) |
| 35 to 44 Years | 0 (0.0%) | 0 (0.0%) |
| 45 to 54 Years | 1 (100.0%) | 0 (0.0%) |
| 55 to 59 Years | 10 (100.0%) | 0 (0.0%) |
| 60 to 64 Years | 4 (33.3%) | 0 (0.0%) |
| 65 to 74 Years | 1 (25.0%) | 0 (0.0%) |
| 75 Years and over | 0 (0.0%) | 0 (0.0%) |
| Total | 28 (65.1%) | 3 (10.7%) |
Employment Status by Educational Attainment in Chignik
According to labor force statistics for Chignik, 67.6% of individuals (25) out of the total population between 25 and 64 years of age (37) are in the labor force, with 12.0% or 3 of them being unemployed. The group with the highest labor force participation rate are those with the educational attainment of college / associate degree, with 100.0% or 11 individuals in the labor force. Within the labor force, individuals with high school diploma education have the highest percentage of unemployment, with 27.3% or 3 of them being unemployed.
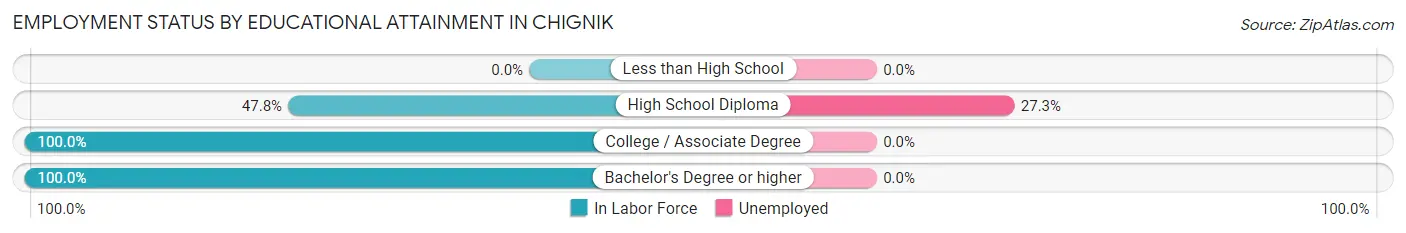
| Educational Attainment | In Labor Force | Unemployed |
| Less than High School | 0 (0.0%) | 0 (0.0%) |
| High School Diploma | 11 (47.8%) | 6 (27.3%) |
| College / Associate Degree | 11 (100.0%) | 0 (0.0%) |
| Bachelor's Degree or higher | 3 (100.0%) | 0 (0.0%) |
| Total | 25 (67.6%) | 4 (12.0%) |
Employment Occupations by Sex in Chignik
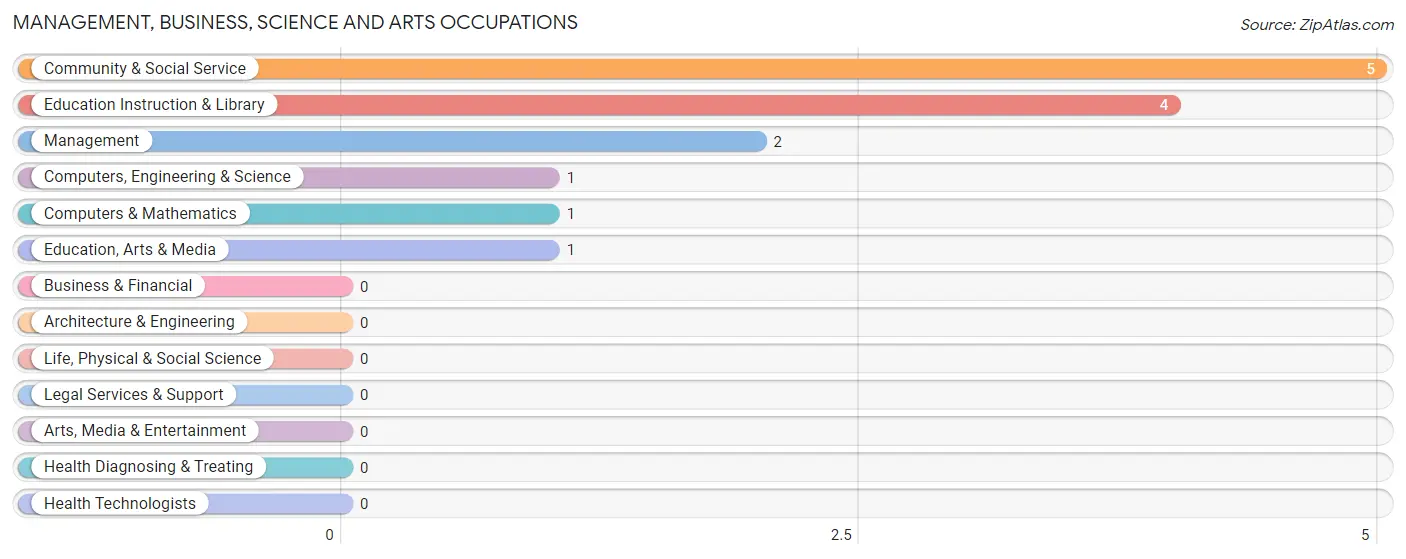
Management, Business, Science and Arts Occupations
The most common Management, Business, Science and Arts occupations in Chignik are Community & Social Service (5 | 20.0%), Education Instruction & Library (4 | 16.0%), Management (2 | 8.0%), Computers, Engineering & Science (1 | 4.0%), and Computers & Mathematics (1 | 4.0%).
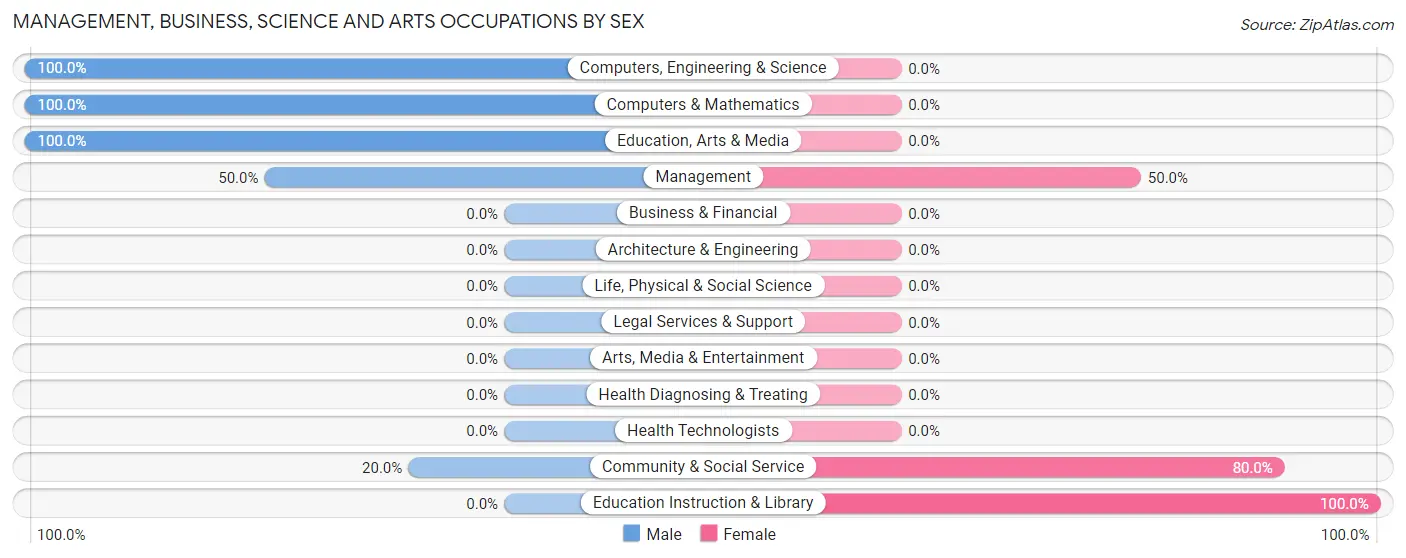
Management, Business, Science and Arts Occupations by Sex
Within the Management, Business, Science and Arts occupations in Chignik, the most male-oriented occupations are Computers, Engineering & Science (100.0%), Computers & Mathematics (100.0%), and Education, Arts & Media (100.0%), while the most female-oriented occupations are Education Instruction & Library (100.0%), Community & Social Service (80.0%), and Management (50.0%).
| Occupation | Male | Female |
| Management | 1 (50.0%) | 1 (50.0%) |
| Business & Financial | 0 (0.0%) | 0 (0.0%) |
| Computers, Engineering & Science | 1 (100.0%) | 0 (0.0%) |
| Computers & Mathematics | 1 (100.0%) | 0 (0.0%) |
| Architecture & Engineering | 0 (0.0%) | 0 (0.0%) |
| Life, Physical & Social Science | 0 (0.0%) | 0 (0.0%) |
| Community & Social Service | 1 (20.0%) | 4 (80.0%) |
| Education, Arts & Media | 1 (100.0%) | 0 (0.0%) |
| Legal Services & Support | 0 (0.0%) | 0 (0.0%) |
| Education Instruction & Library | 0 (0.0%) | 4 (100.0%) |
| Arts, Media & Entertainment | 0 (0.0%) | 0 (0.0%) |
| Health Diagnosing & Treating | 0 (0.0%) | 0 (0.0%) |
| Health Technologists | 0 (0.0%) | 0 (0.0%) |
| Total (Category) | 3 (37.5%) | 5 (62.5%) |
| Total (Overall) | 16 (64.0%) | 9 (36.0%) |
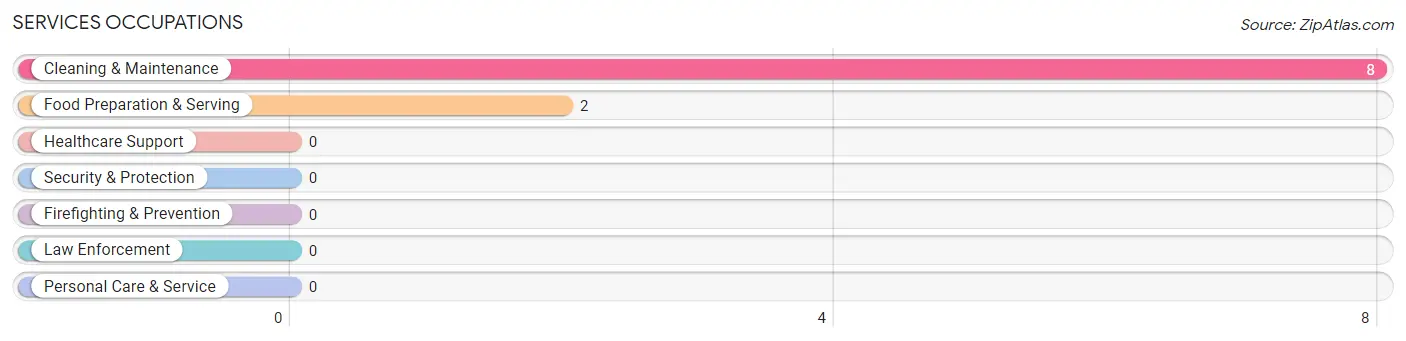
Services Occupations
The most common Services occupations in Chignik are Cleaning & Maintenance (8 | 32.0%), and Food Preparation & Serving (2 | 8.0%).
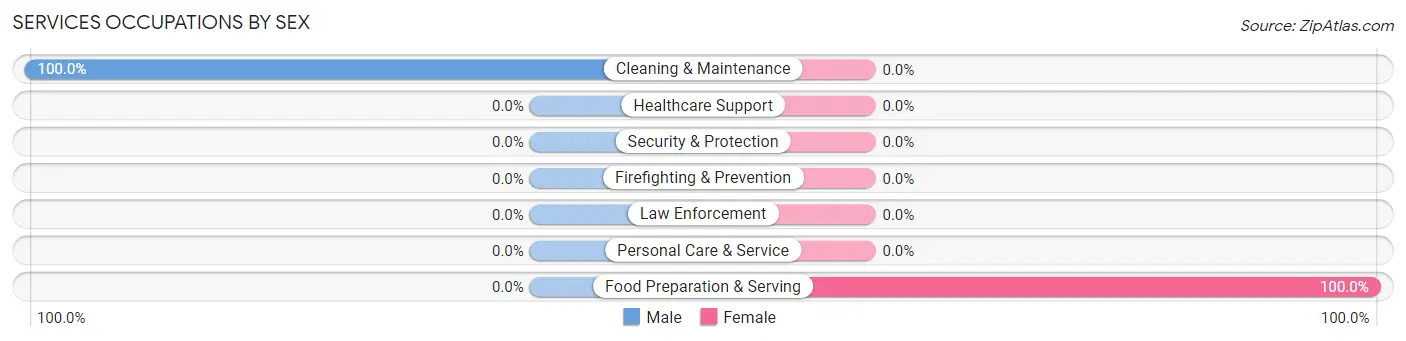
Services Occupations by Sex
| Occupation | Male | Female |
| Healthcare Support | 0 (0.0%) | 0 (0.0%) |
| Security & Protection | 0 (0.0%) | 0 (0.0%) |
| Firefighting & Prevention | 0 (0.0%) | 0 (0.0%) |
| Law Enforcement | 0 (0.0%) | 0 (0.0%) |
| Food Preparation & Serving | 0 (0.0%) | 2 (100.0%) |
| Cleaning & Maintenance | 8 (100.0%) | 0 (0.0%) |
| Personal Care & Service | 0 (0.0%) | 0 (0.0%) |
| Total (Category) | 8 (80.0%) | 2 (20.0%) |
| Total (Overall) | 16 (64.0%) | 9 (36.0%) |
Sales and Office Occupations
Sales and Office Occupations by Sex
| Occupation | Male | Female |
| Sales & Related | 0 (0.0%) | 0 (0.0%) |
| Office & Administration | 0 (0.0%) | 0 (0.0%) |
| Total (Category) | 0 (0.0%) | 0 (0.0%) |
| Total (Overall) | 16 (64.0%) | 9 (36.0%) |
Natural Resources, Construction and Maintenance Occupations
The most common Natural Resources, Construction and Maintenance occupations in Chignik are , and Construction & Extraction (3 | 12.0%).
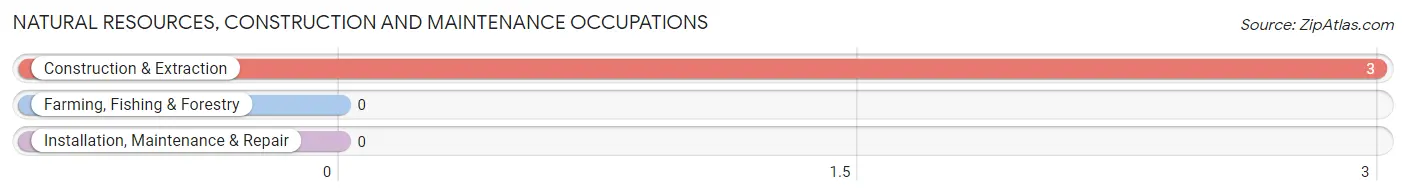
Natural Resources, Construction and Maintenance Occupations by Sex
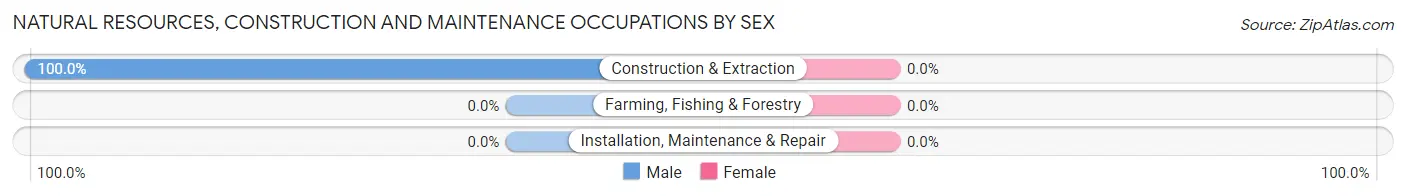
| Occupation | Male | Female |
| Farming, Fishing & Forestry | 0 (0.0%) | 0 (0.0%) |
| Construction & Extraction | 3 (100.0%) | 0 (0.0%) |
| Installation, Maintenance & Repair | 0 (0.0%) | 0 (0.0%) |
| Total (Category) | 3 (100.0%) | 0 (0.0%) |
| Total (Overall) | 16 (64.0%) | 9 (36.0%) |
Production, Transportation and Moving Occupations
The most common Production, Transportation and Moving occupations in Chignik are Transportation (3 | 12.0%), and Production (1 | 4.0%).
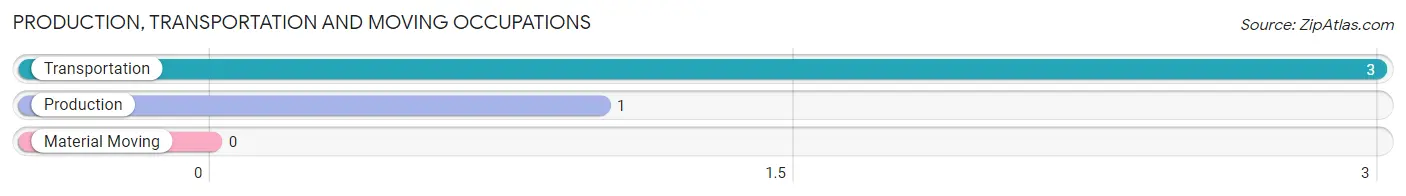
Production, Transportation and Moving Occupations by Sex
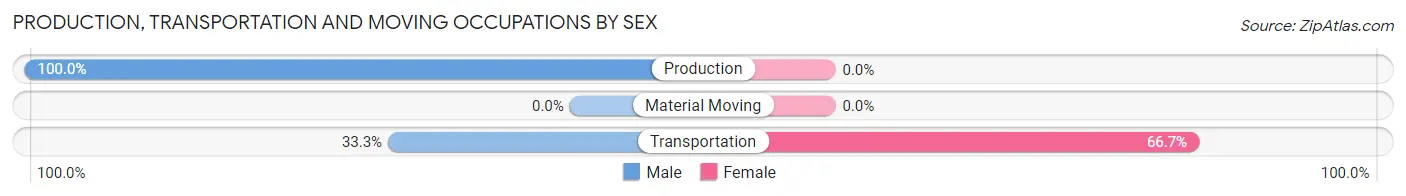
| Occupation | Male | Female |
| Production | 1 (100.0%) | 0 (0.0%) |
| Transportation | 1 (33.3%) | 2 (66.7%) |
| Material Moving | 0 (0.0%) | 0 (0.0%) |
| Total (Category) | 2 (50.0%) | 2 (50.0%) |
| Total (Overall) | 16 (64.0%) | 9 (36.0%) |
Employment Industries by Sex in Chignik
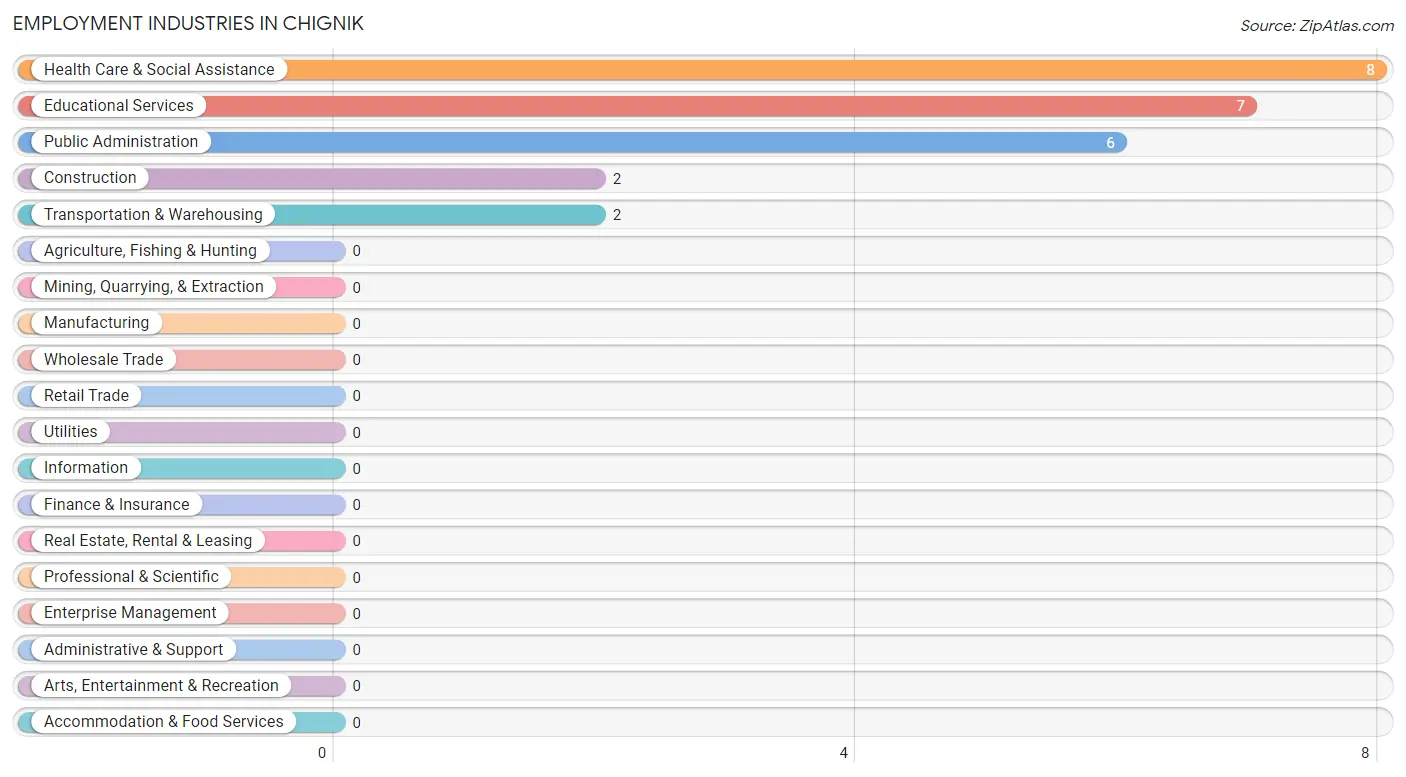
Employment Industries in Chignik
The major employment industries in Chignik include Health Care & Social Assistance (8 | 32.0%), Educational Services (7 | 28.0%), Public Administration (6 | 24.0%), Construction (2 | 8.0%), and Transportation & Warehousing (2 | 8.0%).
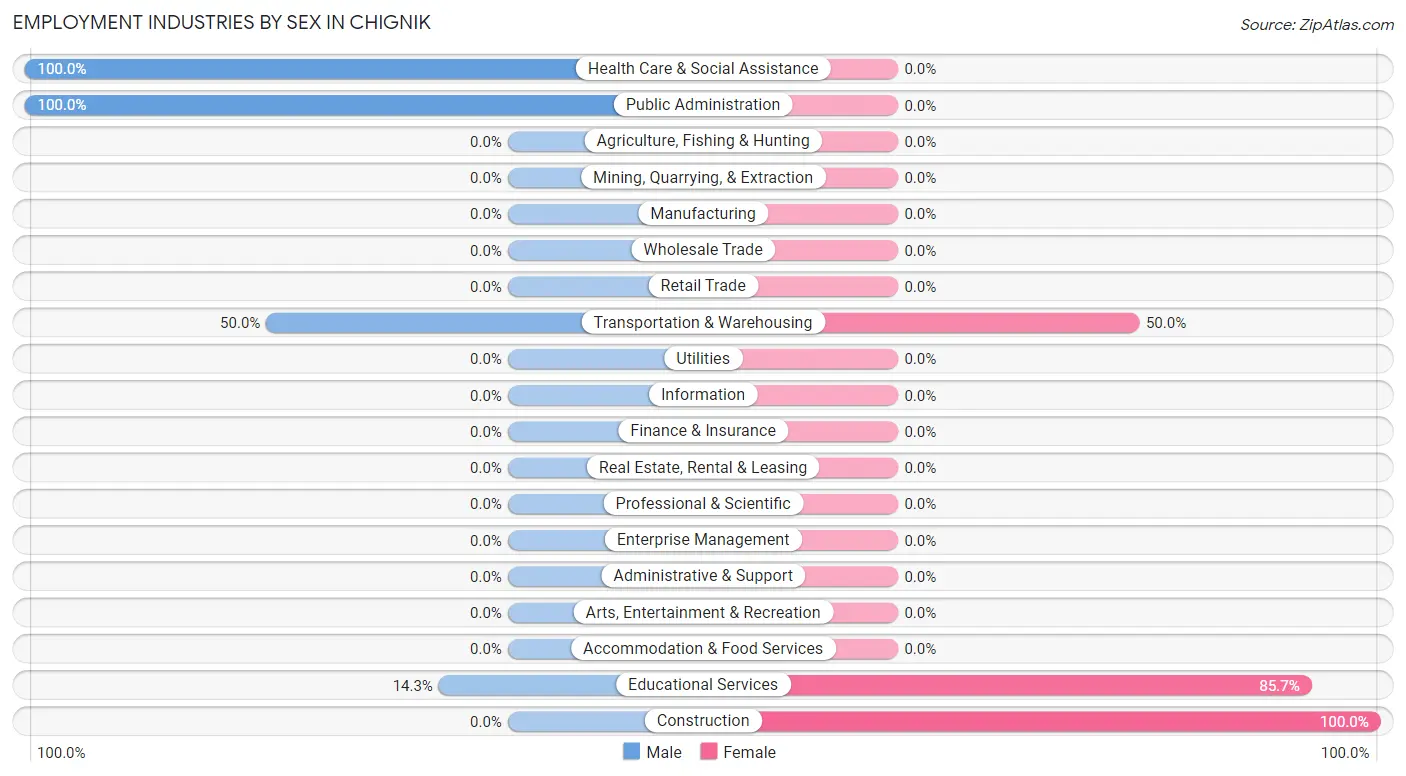
Employment Industries by Sex in Chignik
The Chignik industries that see more men than women are Health Care & Social Assistance (100.0%), Public Administration (100.0%), and Transportation & Warehousing (50.0%), whereas the industries that tend to have a higher number of women are Construction (100.0%), Educational Services (85.7%), and Transportation & Warehousing (50.0%).
| Industry | Male | Female |
| Agriculture, Fishing & Hunting | 0 (0.0%) | 0 (0.0%) |
| Mining, Quarrying, & Extraction | 0 (0.0%) | 0 (0.0%) |
| Construction | 0 (0.0%) | 2 (100.0%) |
| Manufacturing | 0 (0.0%) | 0 (0.0%) |
| Wholesale Trade | 0 (0.0%) | 0 (0.0%) |
| Retail Trade | 0 (0.0%) | 0 (0.0%) |
| Transportation & Warehousing | 1 (50.0%) | 1 (50.0%) |
| Utilities | 0 (0.0%) | 0 (0.0%) |
| Information | 0 (0.0%) | 0 (0.0%) |
| Finance & Insurance | 0 (0.0%) | 0 (0.0%) |
| Real Estate, Rental & Leasing | 0 (0.0%) | 0 (0.0%) |
| Professional & Scientific | 0 (0.0%) | 0 (0.0%) |
| Enterprise Management | 0 (0.0%) | 0 (0.0%) |
| Administrative & Support | 0 (0.0%) | 0 (0.0%) |
| Educational Services | 1 (14.3%) | 6 (85.7%) |
| Health Care & Social Assistance | 8 (100.0%) | 0 (0.0%) |
| Arts, Entertainment & Recreation | 0 (0.0%) | 0 (0.0%) |
| Accommodation & Food Services | 0 (0.0%) | 0 (0.0%) |
| Public Administration | 6 (100.0%) | 0 (0.0%) |
| Total | 16 (64.0%) | 9 (36.0%) |
Education in Chignik
School Enrollment in Chignik
The most common levels of schooling among the 10 students in Chignik are elementary school (3 | 30.0%), middle school (2 | 20.0%), and high school (2 | 20.0%).
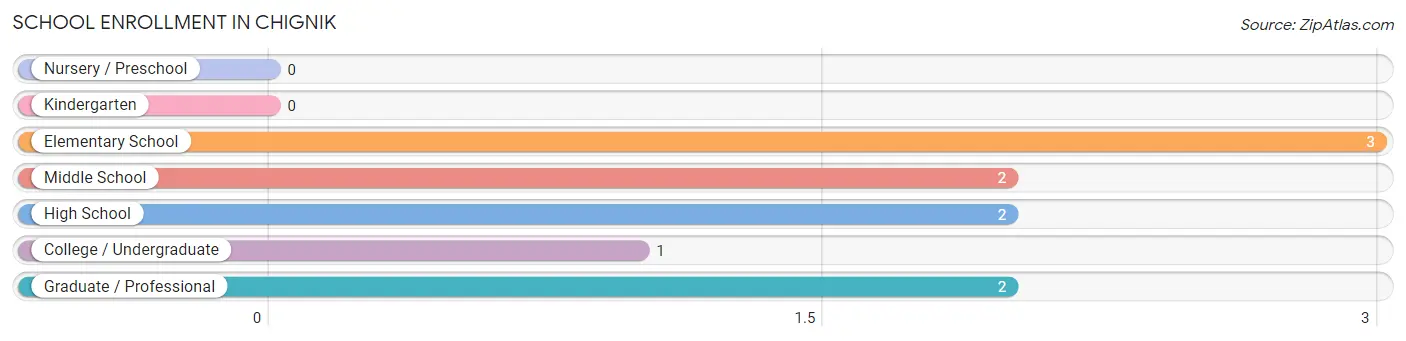
| School Level | # Students | % Students |
| Nursery / Preschool | 0 | 0.0% |
| Kindergarten | 0 | 0.0% |
| Elementary School | 3 | 30.0% |
| Middle School | 2 | 20.0% |
| High School | 2 | 20.0% |
| College / Undergraduate | 1 | 10.0% |
| Graduate / Professional | 2 | 20.0% |
| Total | 10 | 100.0% |
School Enrollment by Age by Funding Source in Chignik
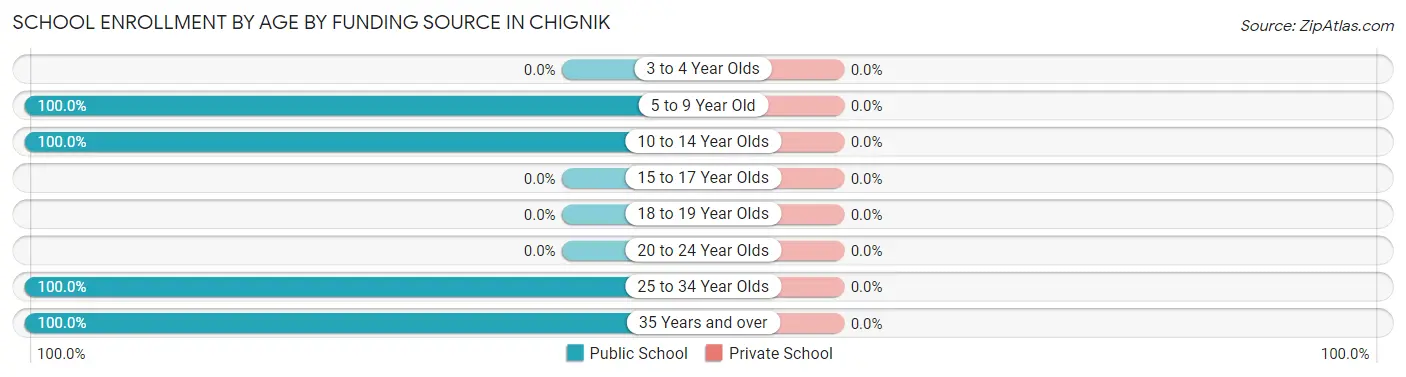
| Age Bracket | Public School | Private School |
| 3 to 4 Year Olds | 0 (0.0%) | 0 (0.0%) |
| 5 to 9 Year Old | 3 (100.0%) | 0 (0.0%) |
| 10 to 14 Year Olds | 4 (100.0%) | 0 (0.0%) |
| 15 to 17 Year Olds | 0 (0.0%) | 0 (0.0%) |
| 18 to 19 Year Olds | 0 (0.0%) | 0 (0.0%) |
| 20 to 24 Year Olds | 0 (0.0%) | 0 (0.0%) |
| 25 to 34 Year Olds | 2 (100.0%) | 0 (0.0%) |
| 35 Years and over | 1 (100.0%) | 0 (0.0%) |
| Total | 10 (100.0%) | 0 (0.0%) |
Educational Attainment by Field of Study in Chignik
Education (2 | 66.7%), and liberal arts & history (1 | 33.3%) are the most common fields of study among 3 individuals in Chignik who have obtained a bachelor's degree or higher.
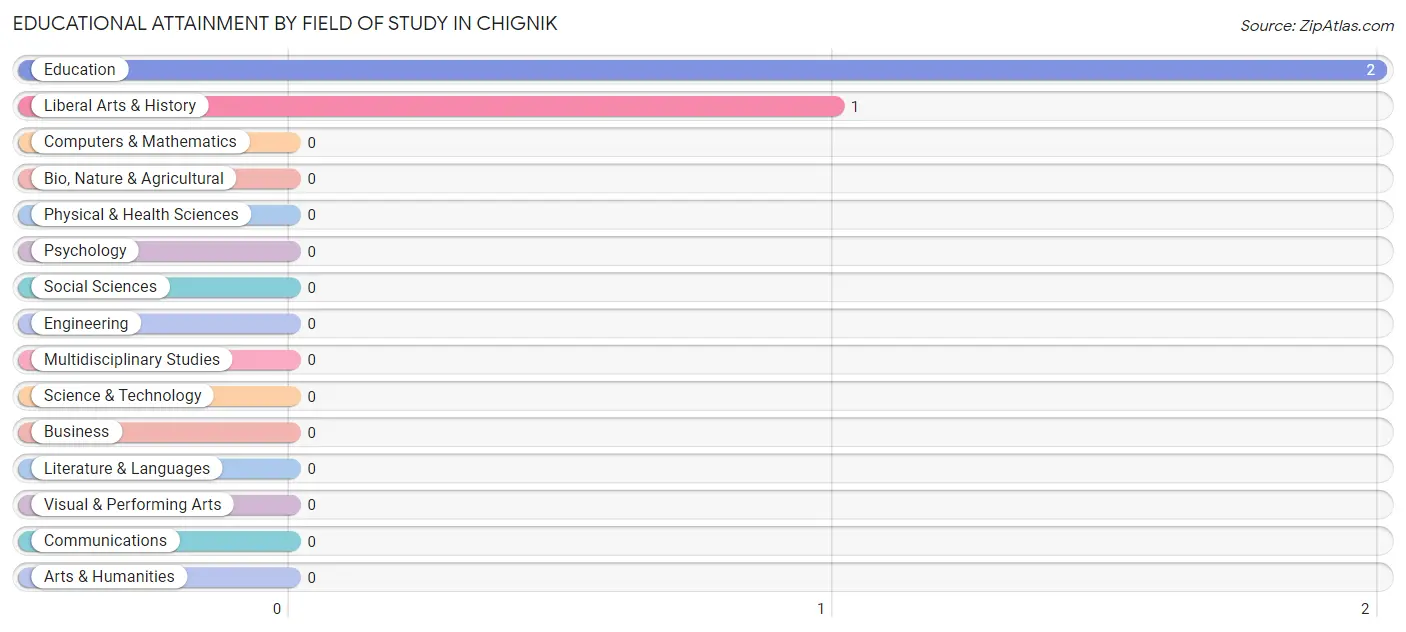
| Field of Study | # Graduates | % Graduates |
| Computers & Mathematics | 0 | 0.0% |
| Bio, Nature & Agricultural | 0 | 0.0% |
| Physical & Health Sciences | 0 | 0.0% |
| Psychology | 0 | 0.0% |
| Social Sciences | 0 | 0.0% |
| Engineering | 0 | 0.0% |
| Multidisciplinary Studies | 0 | 0.0% |
| Science & Technology | 0 | 0.0% |
| Business | 0 | 0.0% |
| Education | 2 | 66.7% |
| Literature & Languages | 0 | 0.0% |
| Liberal Arts & History | 1 | 33.3% |
| Visual & Performing Arts | 0 | 0.0% |
| Communications | 0 | 0.0% |
| Arts & Humanities | 0 | 0.0% |
| Total | 3 | 100.0% |
Transportation & Commute in Chignik
Vehicle Availability by Sex in Chignik
The most prevalent vehicle ownership categories in Chignik are males with 3 vehicles (12, accounting for 75.0%) and females with 3 vehicles (4, making up 133.3%).
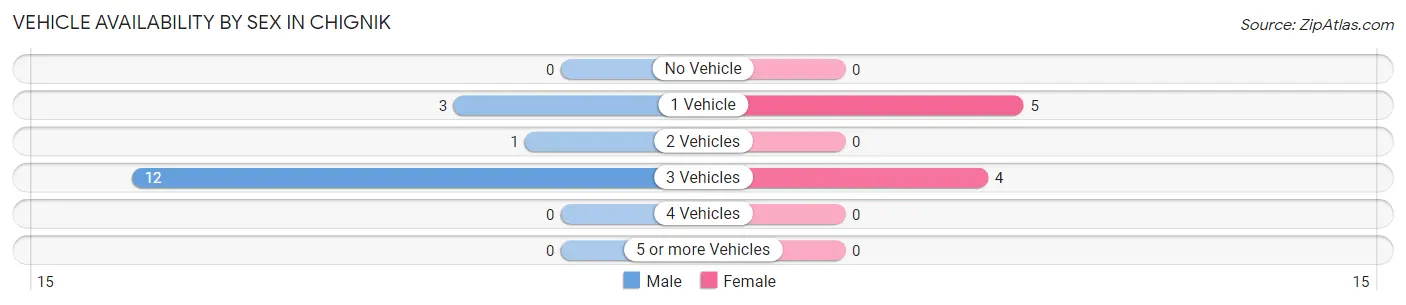
| Vehicles Available | Male | Female |
| No Vehicle | 0 (0.0%) | 0 (0.0%) |
| 1 Vehicle | 3 (18.8%) | 5 (55.6%) |
| 2 Vehicles | 1 (6.2%) | 0 (0.0%) |
| 3 Vehicles | 12 (75.0%) | 4 (44.4%) |
| 4 Vehicles | 0 (0.0%) | 0 (0.0%) |
| 5 or more Vehicles | 0 (0.0%) | 0 (0.0%) |
| Total | 16 (100.0%) | 9 (100.0%) |
Commute Time in Chignik
The most frequently occuring commute durations in Chignik are less than 5 minutes (20 commuters, 87.0%), 5 to 9 minutes (3 commuters, 13.0%), and 10 to 14 minutes (0 commuters, 0.0%).
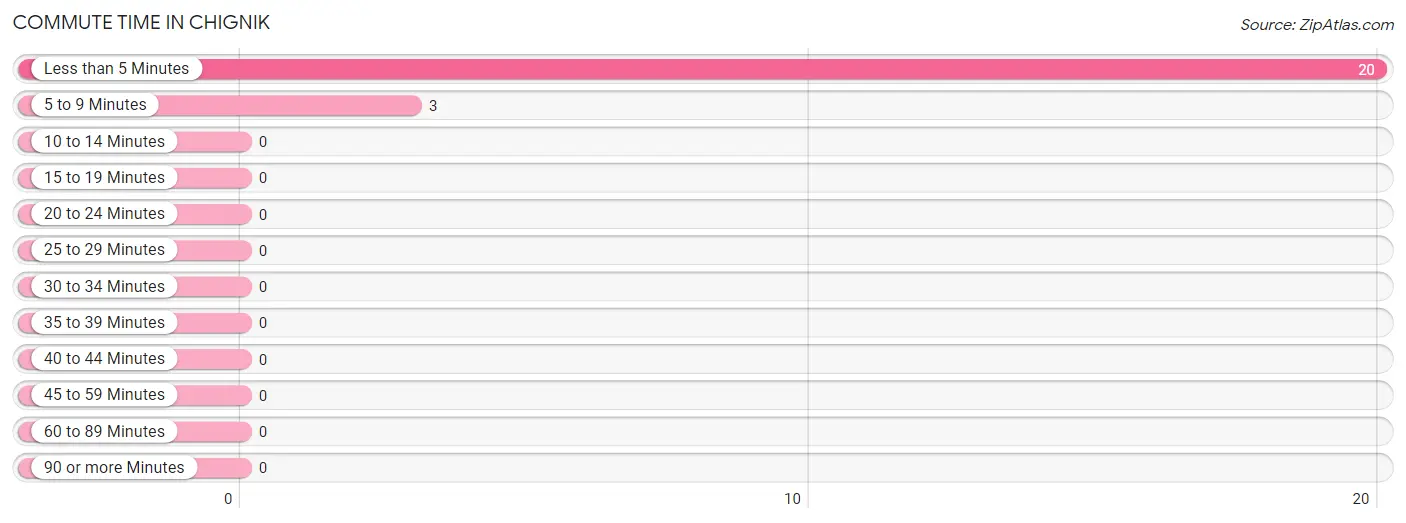
| Commute Time | # Commuters | % Commuters |
| Less than 5 Minutes | 20 | 87.0% |
| 5 to 9 Minutes | 3 | 13.0% |
| 10 to 14 Minutes | 0 | 0.0% |
| 15 to 19 Minutes | 0 | 0.0% |
| 20 to 24 Minutes | 0 | 0.0% |
| 25 to 29 Minutes | 0 | 0.0% |
| 30 to 34 Minutes | 0 | 0.0% |
| 35 to 39 Minutes | 0 | 0.0% |
| 40 to 44 Minutes | 0 | 0.0% |
| 45 to 59 Minutes | 0 | 0.0% |
| 60 to 89 Minutes | 0 | 0.0% |
| 90 or more Minutes | 0 | 0.0% |
Commute Time by Sex in Chignik
The most common commute times in Chignik are less than 5 minutes (14 commuters, 87.5%) for males and less than 5 minutes (6 commuters, 85.7%) for females.
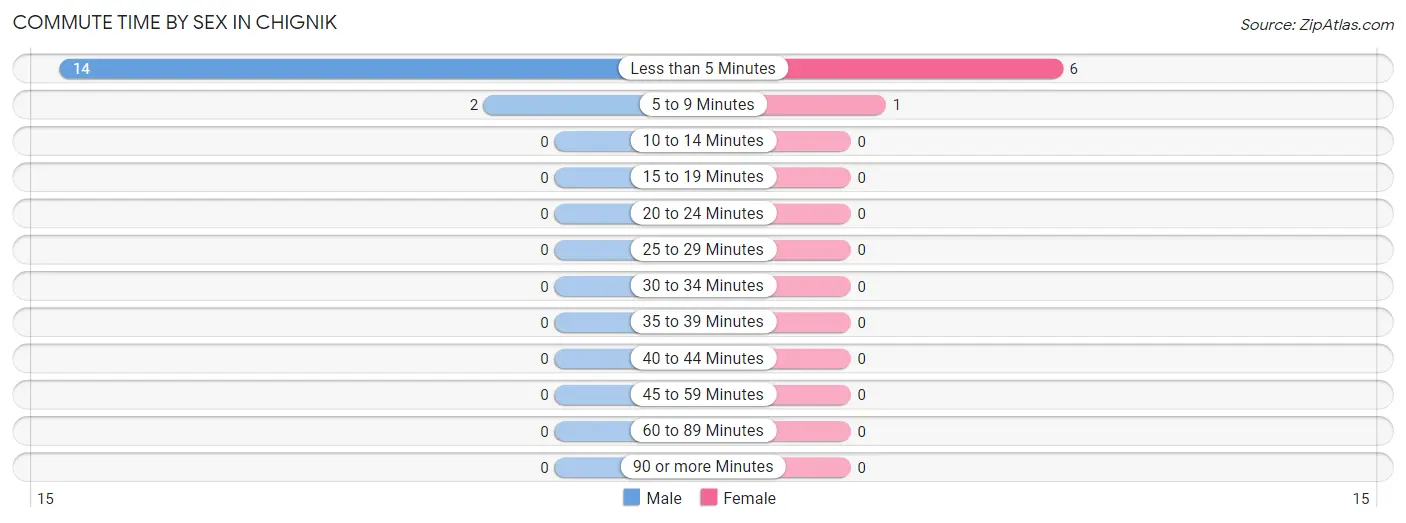
| Commute Time | Male | Female |
| Less than 5 Minutes | 14 (87.5%) | 6 (85.7%) |
| 5 to 9 Minutes | 2 (12.5%) | 1 (14.3%) |
| 10 to 14 Minutes | 0 (0.0%) | 0 (0.0%) |
| 15 to 19 Minutes | 0 (0.0%) | 0 (0.0%) |
| 20 to 24 Minutes | 0 (0.0%) | 0 (0.0%) |
| 25 to 29 Minutes | 0 (0.0%) | 0 (0.0%) |
| 30 to 34 Minutes | 0 (0.0%) | 0 (0.0%) |
| 35 to 39 Minutes | 0 (0.0%) | 0 (0.0%) |
| 40 to 44 Minutes | 0 (0.0%) | 0 (0.0%) |
| 45 to 59 Minutes | 0 (0.0%) | 0 (0.0%) |
| 60 to 89 Minutes | 0 (0.0%) | 0 (0.0%) |
| 90 or more Minutes | 0 (0.0%) | 0 (0.0%) |
Time of Departure to Work by Sex in Chignik
The most frequent times of departure to work in Chignik are 7:30 AM to 7:59 AM (9, 56.2%) for males and 9:00 AM to 9:59 AM (3, 42.9%) for females.
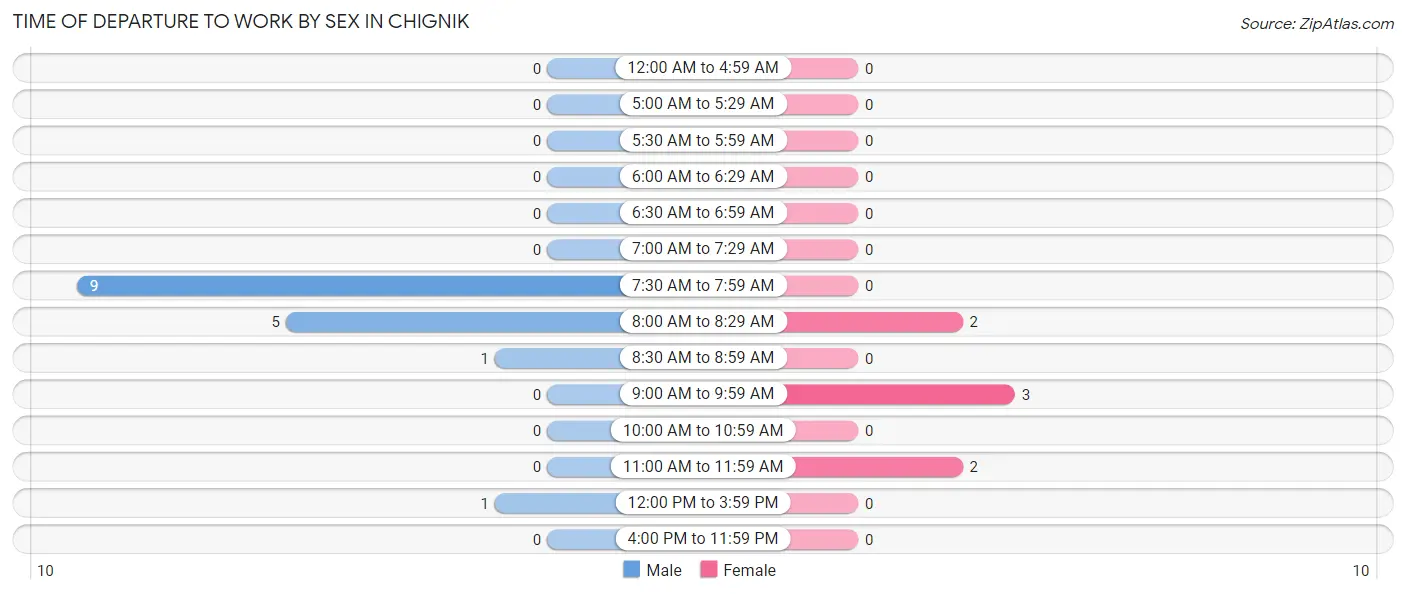
| Time of Departure | Male | Female |
| 12:00 AM to 4:59 AM | 0 (0.0%) | 0 (0.0%) |
| 5:00 AM to 5:29 AM | 0 (0.0%) | 0 (0.0%) |
| 5:30 AM to 5:59 AM | 0 (0.0%) | 0 (0.0%) |
| 6:00 AM to 6:29 AM | 0 (0.0%) | 0 (0.0%) |
| 6:30 AM to 6:59 AM | 0 (0.0%) | 0 (0.0%) |
| 7:00 AM to 7:29 AM | 0 (0.0%) | 0 (0.0%) |
| 7:30 AM to 7:59 AM | 9 (56.2%) | 0 (0.0%) |
| 8:00 AM to 8:29 AM | 5 (31.2%) | 2 (28.6%) |
| 8:30 AM to 8:59 AM | 1 (6.2%) | 0 (0.0%) |
| 9:00 AM to 9:59 AM | 0 (0.0%) | 3 (42.9%) |
| 10:00 AM to 10:59 AM | 0 (0.0%) | 0 (0.0%) |
| 11:00 AM to 11:59 AM | 0 (0.0%) | 2 (28.6%) |
| 12:00 PM to 3:59 PM | 1 (6.2%) | 0 (0.0%) |
| 4:00 PM to 11:59 PM | 0 (0.0%) | 0 (0.0%) |
| Total | 16 (100.0%) | 7 (100.0%) |
Housing Occupancy in Chignik
Occupancy by Ownership in Chignik
Of the total 21 dwellings in Chignik, owner-occupied units account for 16 (76.2%), while renter-occupied units make up 5 (23.8%).
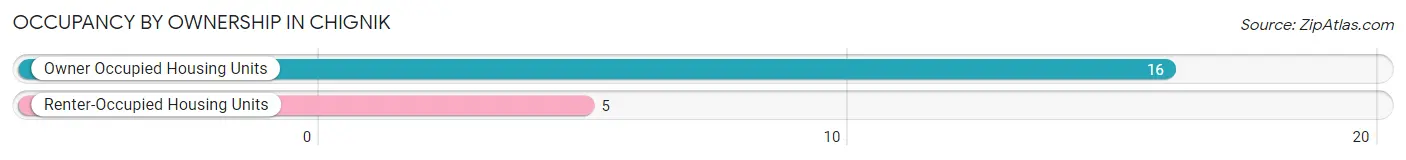
| Occupancy | # Housing Units | % Housing Units |
| Owner Occupied Housing Units | 16 | 76.2% |
| Renter-Occupied Housing Units | 5 | 23.8% |
| Total Occupied Housing Units | 21 | 100.0% |
Occupancy by Household Size in Chignik
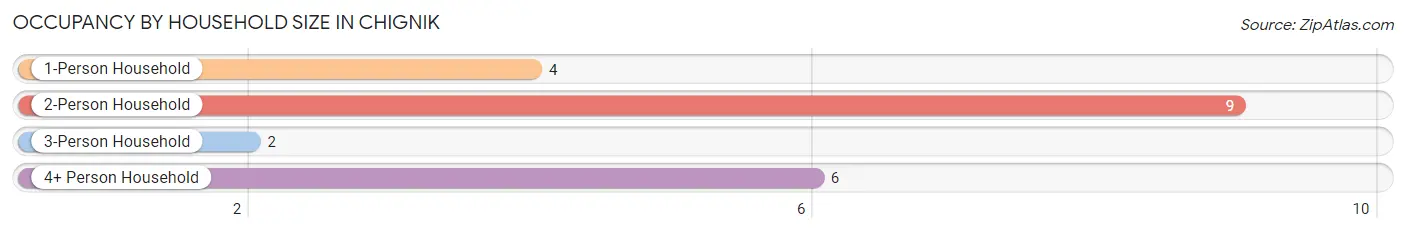
| Household Size | # Housing Units | % Housing Units |
| 1-Person Household | 4 | 19.1% |
| 2-Person Household | 9 | 42.9% |
| 3-Person Household | 2 | 9.5% |
| 4+ Person Household | 6 | 28.6% |
| Total Housing Units | 21 | 100.0% |
Occupancy by Ownership by Household Size in Chignik
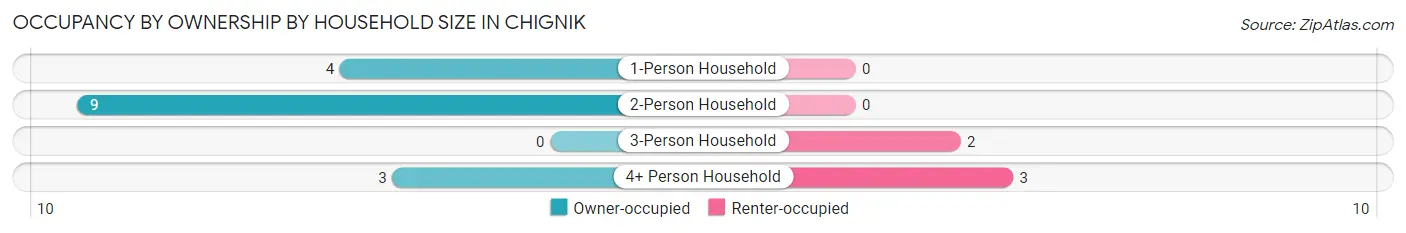
| Household Size | Owner-occupied | Renter-occupied |
| 1-Person Household | 4 (100.0%) | 0 (0.0%) |
| 2-Person Household | 9 (100.0%) | 0 (0.0%) |
| 3-Person Household | 0 (0.0%) | 2 (100.0%) |
| 4+ Person Household | 3 (50.0%) | 3 (50.0%) |
| Total Housing Units | 16 (76.2%) | 5 (23.8%) |
Occupancy by Educational Attainment in Chignik
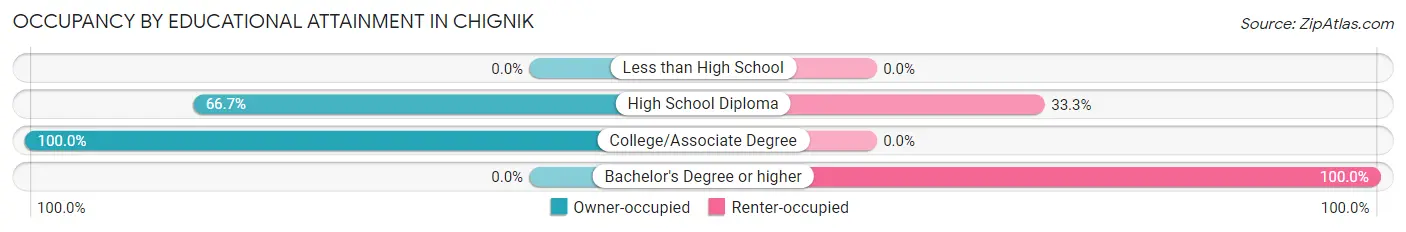
| Household Size | Owner-occupied | Renter-occupied |
| Less than High School | 0 (0.0%) | 0 (0.0%) |
| High School Diploma | 6 (66.7%) | 3 (33.3%) |
| College/Associate Degree | 10 (100.0%) | 0 (0.0%) |
| Bachelor's Degree or higher | 0 (0.0%) | 2 (100.0%) |
Occupancy by Age of Householder in Chignik
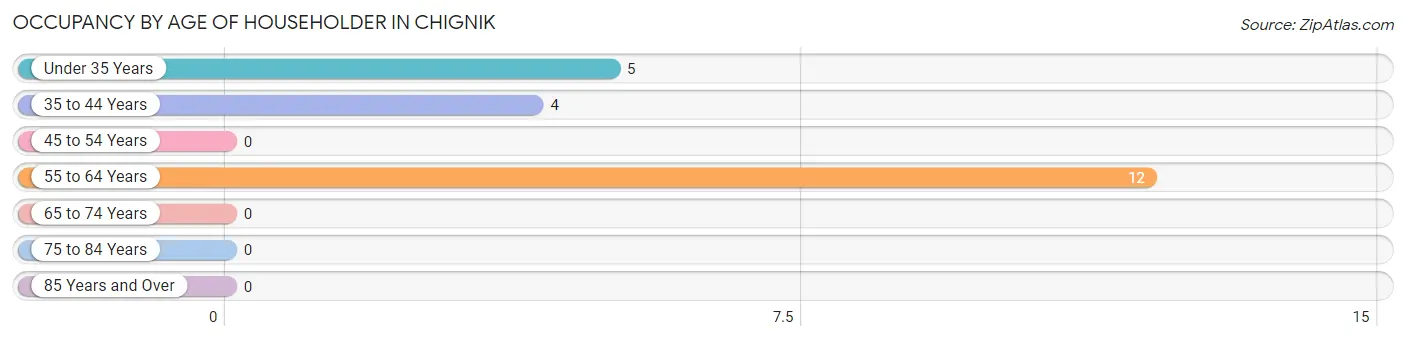
| Age Bracket | # Households | % Households |
| Under 35 Years | 5 | 23.8% |
| 35 to 44 Years | 4 | 19.1% |
| 45 to 54 Years | 0 | 0.0% |
| 55 to 64 Years | 12 | 57.1% |
| 65 to 74 Years | 0 | 0.0% |
| 75 to 84 Years | 0 | 0.0% |
| 85 Years and Over | 0 | 0.0% |
| Total | 21 | 100.0% |
Housing Finances in Chignik
Median Income by Occupancy in Chignik
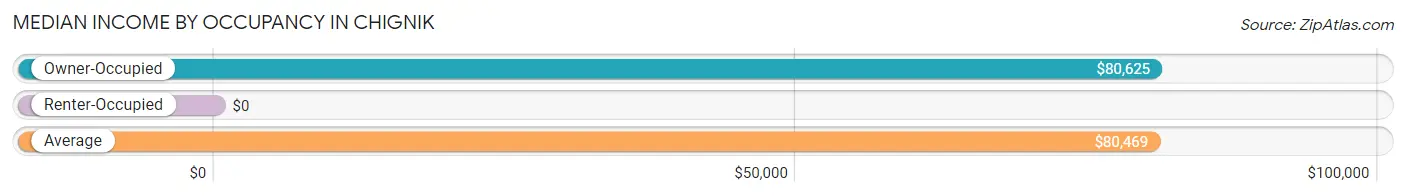
| Occupancy Type | # Households | Median Income |
| Owner-Occupied | 16 (76.2%) | $80,625 |
| Renter-Occupied | 5 (23.8%) | $0 |
| Average | 21 (100.0%) | $80,469 |
Occupancy by Householder Income Bracket in Chignik
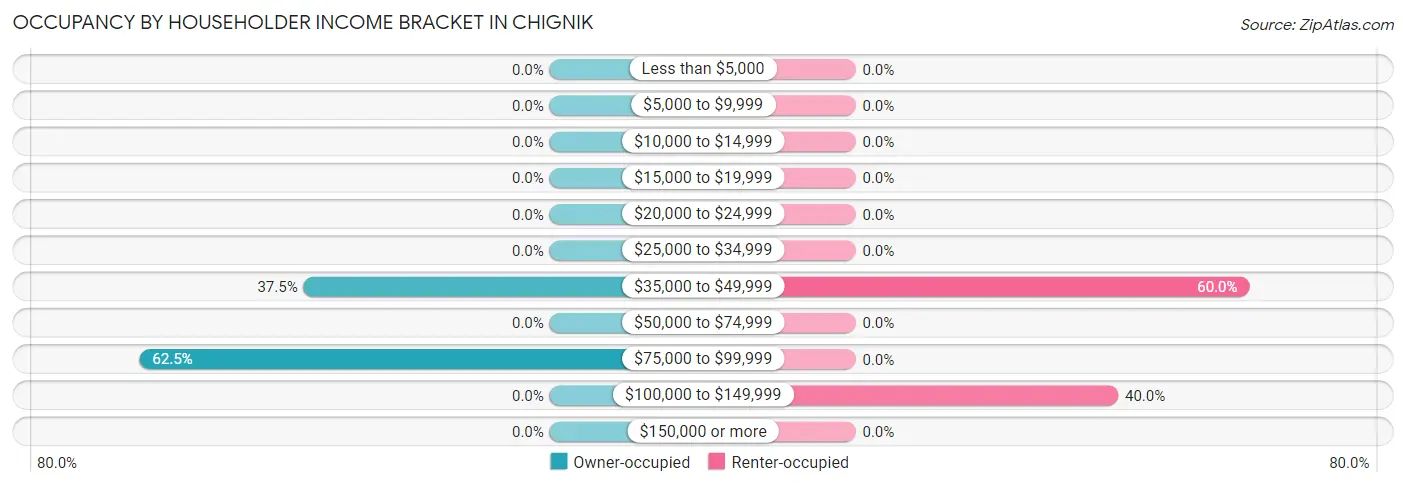
| Income Bracket | Owner-occupied | Renter-occupied |
| Less than $5,000 | 0 (0.0%) | 0 (0.0%) |
| $5,000 to $9,999 | 0 (0.0%) | 0 (0.0%) |
| $10,000 to $14,999 | 0 (0.0%) | 0 (0.0%) |
| $15,000 to $19,999 | 0 (0.0%) | 0 (0.0%) |
| $20,000 to $24,999 | 0 (0.0%) | 0 (0.0%) |
| $25,000 to $34,999 | 0 (0.0%) | 0 (0.0%) |
| $35,000 to $49,999 | 6 (37.5%) | 3 (60.0%) |
| $50,000 to $74,999 | 0 (0.0%) | 0 (0.0%) |
| $75,000 to $99,999 | 10 (62.5%) | 0 (0.0%) |
| $100,000 to $149,999 | 0 (0.0%) | 2 (40.0%) |
| $150,000 or more | 0 (0.0%) | 0 (0.0%) |
| Total | 16 (100.0%) | 5 (100.0%) |
Monthly Housing Cost Tiers in Chignik
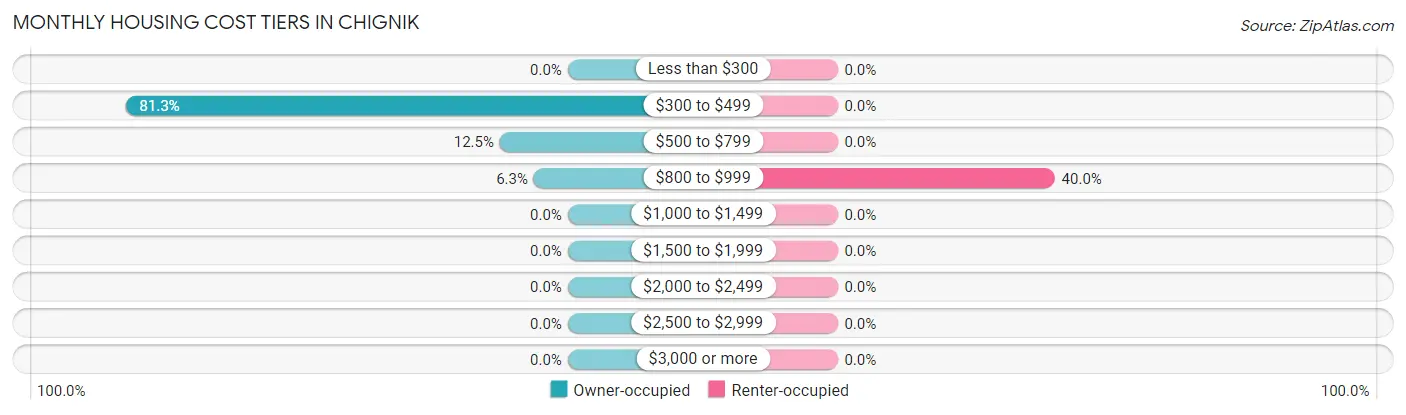
| Monthly Cost | Owner-occupied | Renter-occupied |
| Less than $300 | 0 (0.0%) | 0 (0.0%) |
| $300 to $499 | 13 (81.2%) | 0 (0.0%) |
| $500 to $799 | 2 (12.5%) | 0 (0.0%) |
| $800 to $999 | 1 (6.2%) | 2 (40.0%) |
| $1,000 to $1,499 | 0 (0.0%) | 0 (0.0%) |
| $1,500 to $1,999 | 0 (0.0%) | 0 (0.0%) |
| $2,000 to $2,499 | 0 (0.0%) | 0 (0.0%) |
| $2,500 to $2,999 | 0 (0.0%) | 0 (0.0%) |
| $3,000 or more | 0 (0.0%) | 0 (0.0%) |
| Total | 16 (100.0%) | 5 (100.0%) |
Physical Housing Characteristics in Chignik
Housing Structures in Chignik
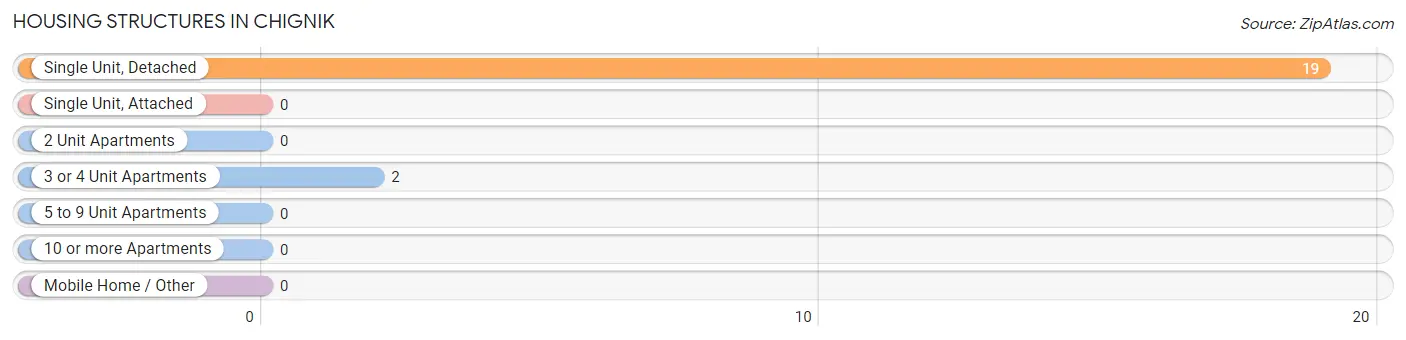
| Structure Type | # Housing Units | % Housing Units |
| Single Unit, Detached | 19 | 90.5% |
| Single Unit, Attached | 0 | 0.0% |
| 2 Unit Apartments | 0 | 0.0% |
| 3 or 4 Unit Apartments | 2 | 9.5% |
| 5 to 9 Unit Apartments | 0 | 0.0% |
| 10 or more Apartments | 0 | 0.0% |
| Mobile Home / Other | 0 | 0.0% |
| Total | 21 | 100.0% |
Housing Structures by Occupancy in Chignik
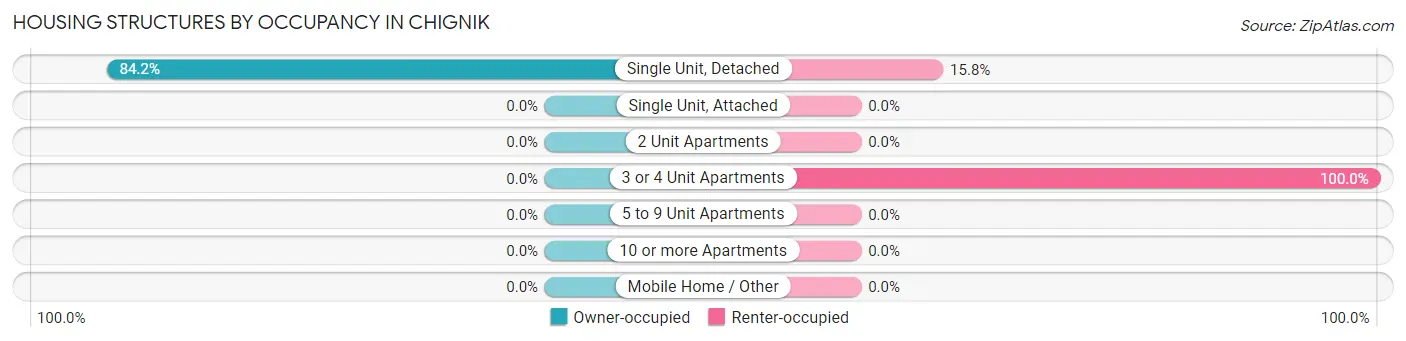
| Structure Type | Owner-occupied | Renter-occupied |
| Single Unit, Detached | 16 (84.2%) | 3 (15.8%) |
| Single Unit, Attached | 0 (0.0%) | 0 (0.0%) |
| 2 Unit Apartments | 0 (0.0%) | 0 (0.0%) |
| 3 or 4 Unit Apartments | 0 (0.0%) | 2 (100.0%) |
| 5 to 9 Unit Apartments | 0 (0.0%) | 0 (0.0%) |
| 10 or more Apartments | 0 (0.0%) | 0 (0.0%) |
| Mobile Home / Other | 0 (0.0%) | 0 (0.0%) |
| Total | 16 (76.2%) | 5 (23.8%) |
Housing Structures by Number of Rooms in Chignik
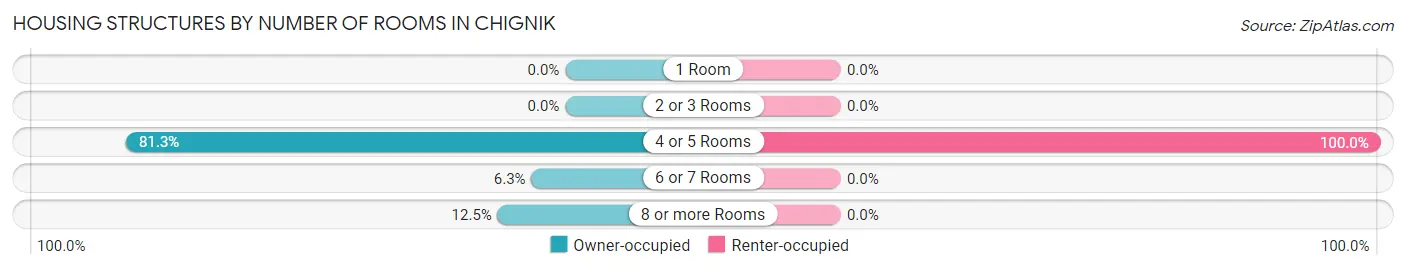
| Number of Rooms | Owner-occupied | Renter-occupied |
| 1 Room | 0 (0.0%) | 0 (0.0%) |
| 2 or 3 Rooms | 0 (0.0%) | 0 (0.0%) |
| 4 or 5 Rooms | 13 (81.2%) | 5 (100.0%) |
| 6 or 7 Rooms | 1 (6.2%) | 0 (0.0%) |
| 8 or more Rooms | 2 (12.5%) | 0 (0.0%) |
| Total | 16 (100.0%) | 5 (100.0%) |
Housing Structure by Heating Type in Chignik
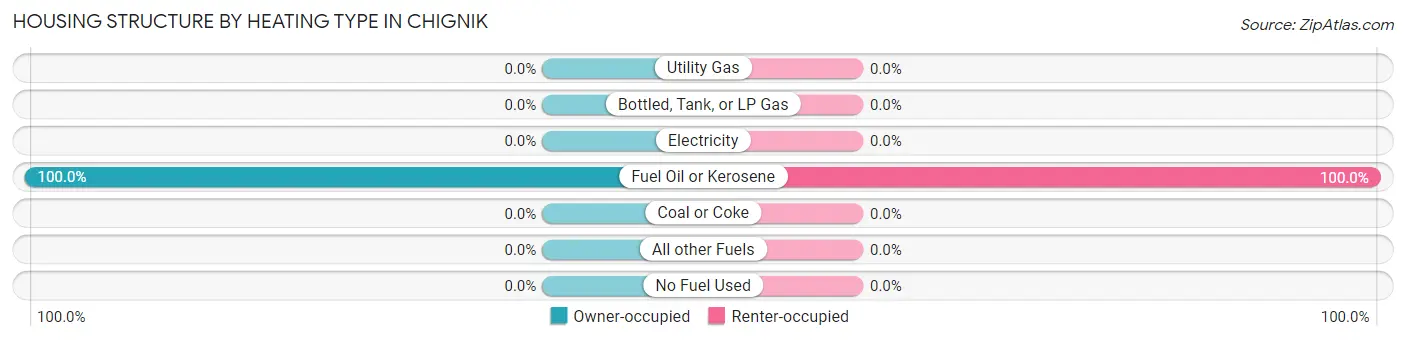
| Heating Type | Owner-occupied | Renter-occupied |
| Utility Gas | 0 (0.0%) | 0 (0.0%) |
| Bottled, Tank, or LP Gas | 0 (0.0%) | 0 (0.0%) |
| Electricity | 0 (0.0%) | 0 (0.0%) |
| Fuel Oil or Kerosene | 16 (100.0%) | 5 (100.0%) |
| Coal or Coke | 0 (0.0%) | 0 (0.0%) |
| All other Fuels | 0 (0.0%) | 0 (0.0%) |
| No Fuel Used | 0 (0.0%) | 0 (0.0%) |
| Total | 16 (100.0%) | 5 (100.0%) |
Household Vehicle Usage in Chignik
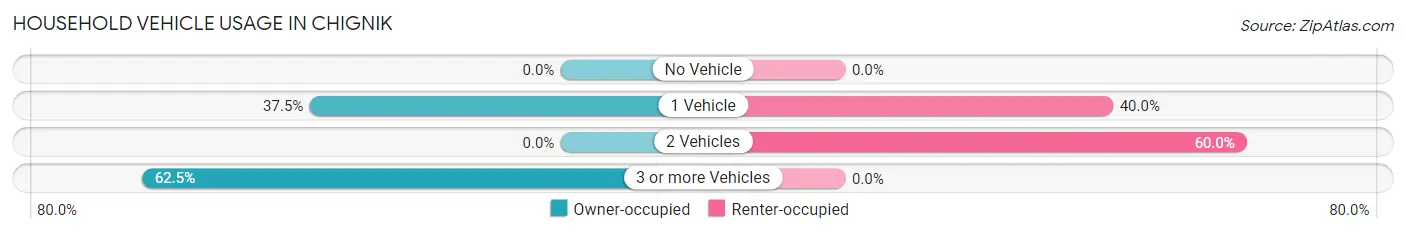
| Vehicles per Household | Owner-occupied | Renter-occupied |
| No Vehicle | 0 (0.0%) | 0 (0.0%) |
| 1 Vehicle | 6 (37.5%) | 2 (40.0%) |
| 2 Vehicles | 0 (0.0%) | 3 (60.0%) |
| 3 or more Vehicles | 10 (62.5%) | 0 (0.0%) |
| Total | 16 (100.0%) | 5 (100.0%) |
Real Estate & Mortgages in Chignik
Real Estate and Mortgage Overview in Chignik
| Characteristic | Without Mortgage | With Mortgage |
| Housing Units | 15 | 1 |
| Median Property Value | $89,400 | $0 |
| Median Household Income | $80,781 | $0 |
| Monthly Housing Costs | $342 | $0 |
| Real Estate Taxes | - | - |
Property Value by Mortgage Status in Chignik
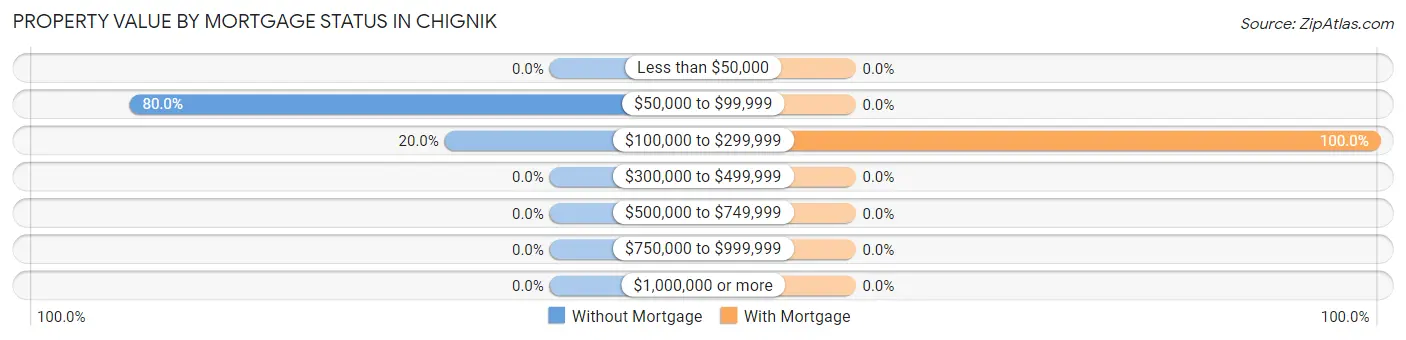
| Property Value | Without Mortgage | With Mortgage |
| Less than $50,000 | 0 (0.0%) | 0 (0.0%) |
| $50,000 to $99,999 | 12 (80.0%) | 0 (0.0%) |
| $100,000 to $299,999 | 3 (20.0%) | 1 (100.0%) |
| $300,000 to $499,999 | 0 (0.0%) | 0 (0.0%) |
| $500,000 to $749,999 | 0 (0.0%) | 0 (0.0%) |
| $750,000 to $999,999 | 0 (0.0%) | 0 (0.0%) |
| $1,000,000 or more | 0 (0.0%) | 0 (0.0%) |
| Total | 15 (100.0%) | 1 (100.0%) |
Household Income by Mortgage Status in Chignik
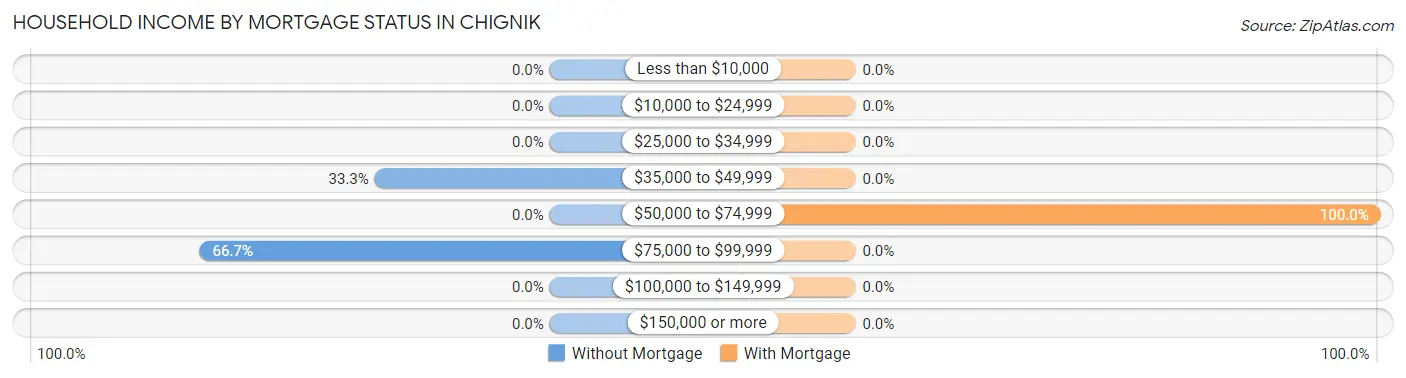
| Household Income | Without Mortgage | With Mortgage |
| Less than $10,000 | 0 (0.0%) | 0 (0.0%) |
| $10,000 to $24,999 | 0 (0.0%) | 0 (0.0%) |
| $25,000 to $34,999 | 0 (0.0%) | 0 (0.0%) |
| $35,000 to $49,999 | 5 (33.3%) | 0 (0.0%) |
| $50,000 to $74,999 | 0 (0.0%) | 1 (100.0%) |
| $75,000 to $99,999 | 10 (66.7%) | 0 (0.0%) |
| $100,000 to $149,999 | 0 (0.0%) | 0 (0.0%) |
| $150,000 or more | 0 (0.0%) | 0 (0.0%) |
| Total | 15 (100.0%) | 1 (100.0%) |
Property Value to Household Income Ratio in Chignik
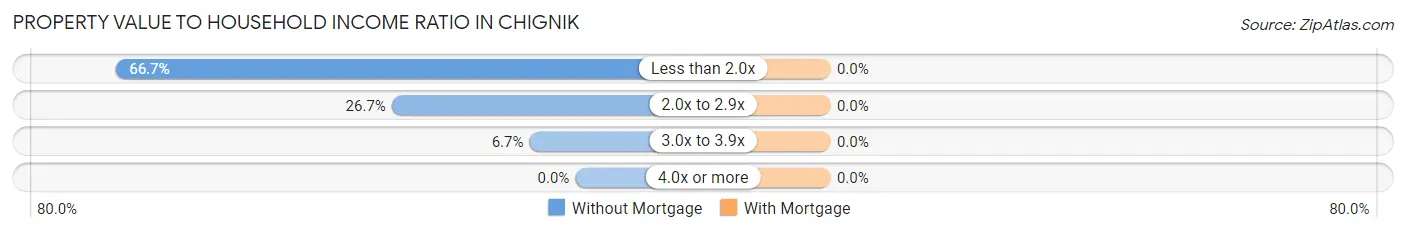
| Value-to-Income Ratio | Without Mortgage | With Mortgage |
| Less than 2.0x | 10 (66.7%) | 0 (0.0%) |
| 2.0x to 2.9x | 4 (26.7%) | 0 (0.0%) |
| 3.0x to 3.9x | 1 (6.7%) | 0 (0.0%) |
| 4.0x or more | 0 (0.0%) | 0 (0.0%) |
| Total | 15 (100.0%) | 1 (100.0%) |
Real Estate Taxes by Mortgage Status in Chignik
| Property Taxes | Without Mortgage | With Mortgage |
| Less than $800 | 0 (0.0%) | 0 (0.0%) |
| $800 to $1,499 | 0 (0.0%) | 0 (0.0%) |
| $800 to $1,499 | 0 (0.0%) | 0 (0.0%) |
| Total | 15 (100.0%) | 1 (100.0%) |
Health & Disability in Chignik
Health Insurance Coverage by Age in Chignik
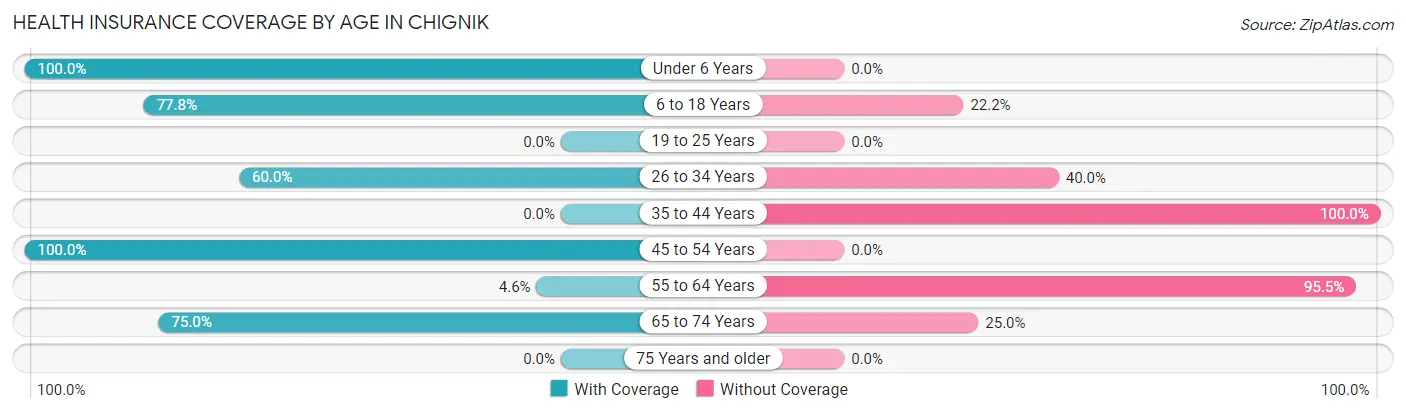
| Age Bracket | With Coverage | Without Coverage |
| Under 6 Years | 4 (100.0%) | 0 (0.0%) |
| 6 to 18 Years | 7 (77.8%) | 2 (22.2%) |
| 19 to 25 Years | 0 (0.0%) | 0 (0.0%) |
| 26 to 34 Years | 6 (60.0%) | 4 (40.0%) |
| 35 to 44 Years | 0 (0.0%) | 4 (100.0%) |
| 45 to 54 Years | 1 (100.0%) | 0 (0.0%) |
| 55 to 64 Years | 1 (4.5%) | 21 (95.5%) |
| 65 to 74 Years | 3 (75.0%) | 1 (25.0%) |
| 75 Years and older | 0 (0.0%) | 0 (0.0%) |
| Total | 22 (40.7%) | 32 (59.3%) |
Health Insurance Coverage by Citizenship Status in Chignik
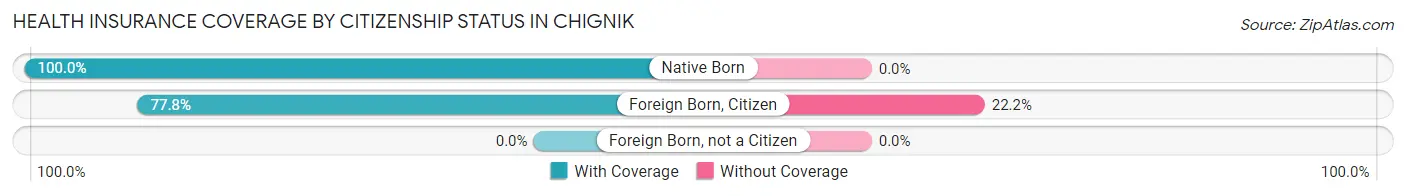
| Citizenship Status | With Coverage | Without Coverage |
| Native Born | 4 (100.0%) | 0 (0.0%) |
| Foreign Born, Citizen | 7 (77.8%) | 2 (22.2%) |
| Foreign Born, not a Citizen | 0 (0.0%) | 0 (0.0%) |
Health Insurance Coverage by Household Income in Chignik
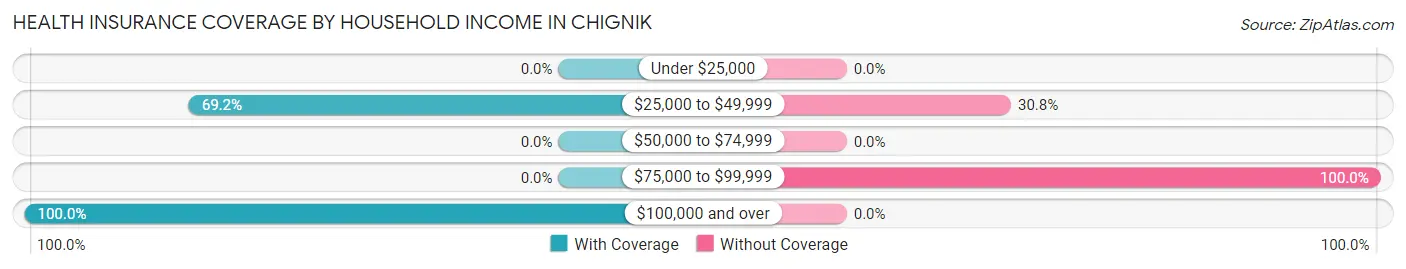
| Household Income | With Coverage | Without Coverage |
| Under $25,000 | 0 (0.0%) | 0 (0.0%) |
| $25,000 to $49,999 | 18 (69.2%) | 8 (30.8%) |
| $50,000 to $74,999 | 0 (0.0%) | 0 (0.0%) |
| $75,000 to $99,999 | 0 (0.0%) | 24 (100.0%) |
| $100,000 and over | 4 (100.0%) | 0 (0.0%) |
Public vs Private Health Insurance Coverage by Age in Chignik
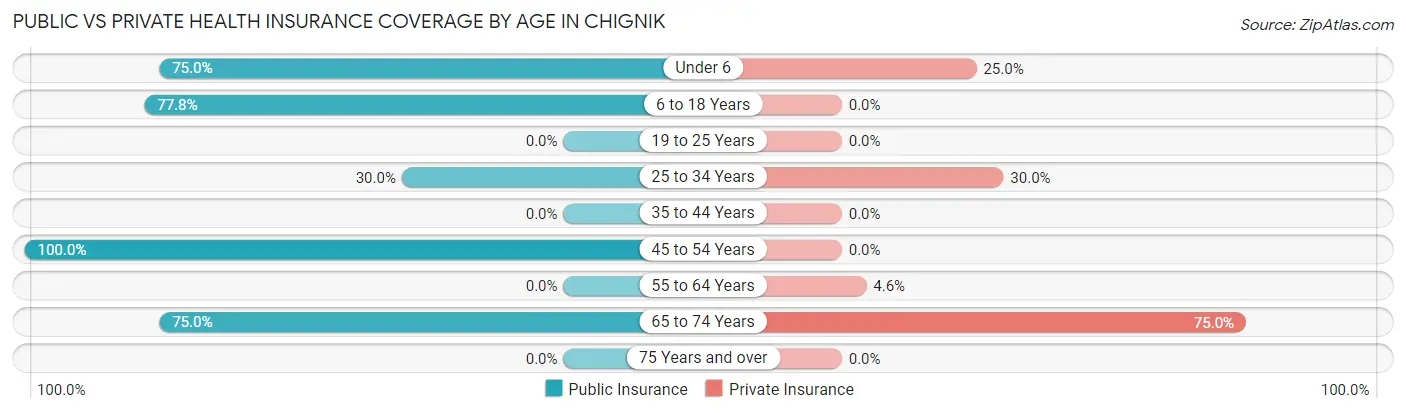
| Age Bracket | Public Insurance | Private Insurance |
| Under 6 | 3 (75.0%) | 1 (25.0%) |
| 6 to 18 Years | 7 (77.8%) | 0 (0.0%) |
| 19 to 25 Years | 0 (0.0%) | 0 (0.0%) |
| 25 to 34 Years | 3 (30.0%) | 3 (30.0%) |
| 35 to 44 Years | 0 (0.0%) | 0 (0.0%) |
| 45 to 54 Years | 1 (100.0%) | 0 (0.0%) |
| 55 to 64 Years | 0 (0.0%) | 1 (4.5%) |
| 65 to 74 Years | 3 (75.0%) | 3 (75.0%) |
| 75 Years and over | 0 (0.0%) | 0 (0.0%) |
| Total | 17 (31.5%) | 8 (14.8%) |
Disability Status by Sex by Age in Chignik
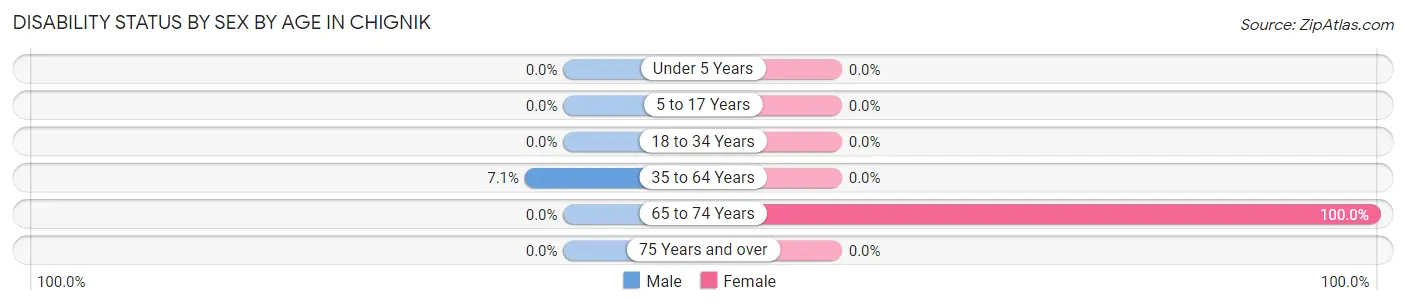
| Age Bracket | Male | Female |
| Under 5 Years | 0 (0.0%) | 0 (0.0%) |
| 5 to 17 Years | 0 (0.0%) | 0 (0.0%) |
| 18 to 34 Years | 0 (0.0%) | 0 (0.0%) |
| 35 to 64 Years | 1 (7.1%) | 0 (0.0%) |
| 65 to 74 Years | 0 (0.0%) | 3 (100.0%) |
| 75 Years and over | 0 (0.0%) | 0 (0.0%) |
Disability Class by Sex by Age in Chignik
Disability Class: Hearing Difficulty
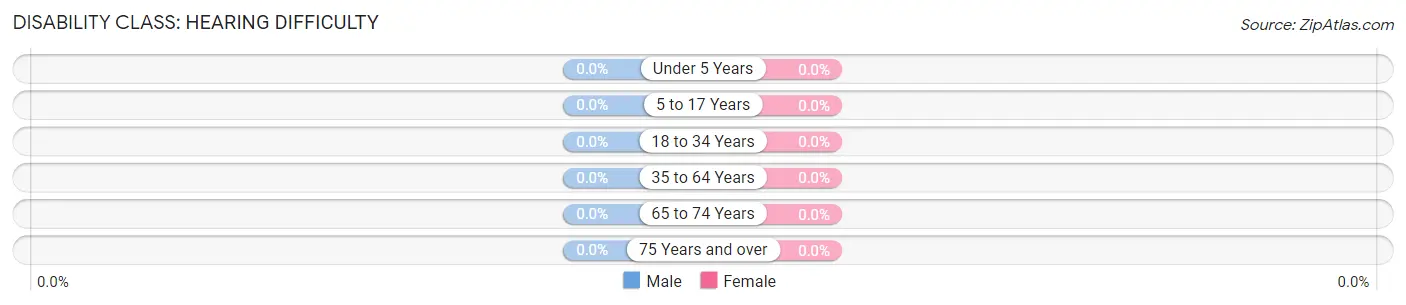
| Age Bracket | Male | Female |
| Under 5 Years | 0 (0.0%) | 0 (0.0%) |
| 5 to 17 Years | 0 (0.0%) | 0 (0.0%) |
| 18 to 34 Years | 0 (0.0%) | 0 (0.0%) |
| 35 to 64 Years | 0 (0.0%) | 0 (0.0%) |
| 65 to 74 Years | 0 (0.0%) | 0 (0.0%) |
| 75 Years and over | 0 (0.0%) | 0 (0.0%) |
Disability Class: Vision Difficulty
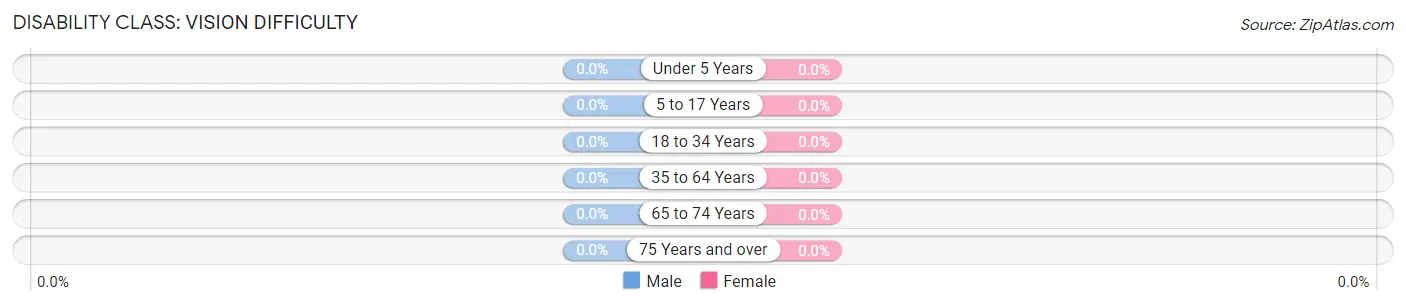
| Age Bracket | Male | Female |
| Under 5 Years | 0 (0.0%) | 0 (0.0%) |
| 5 to 17 Years | 0 (0.0%) | 0 (0.0%) |
| 18 to 34 Years | 0 (0.0%) | 0 (0.0%) |
| 35 to 64 Years | 0 (0.0%) | 0 (0.0%) |
| 65 to 74 Years | 0 (0.0%) | 0 (0.0%) |
| 75 Years and over | 0 (0.0%) | 0 (0.0%) |
Disability Class: Cognitive Difficulty

| Age Bracket | Male | Female |
| 5 to 17 Years | 0 (0.0%) | 0 (0.0%) |
| 18 to 34 Years | 0 (0.0%) | 0 (0.0%) |
| 35 to 64 Years | 0 (0.0%) | 0 (0.0%) |
| 65 to 74 Years | 0 (0.0%) | 0 (0.0%) |
| 75 Years and over | 0 (0.0%) | 0 (0.0%) |
Disability Class: Ambulatory Difficulty
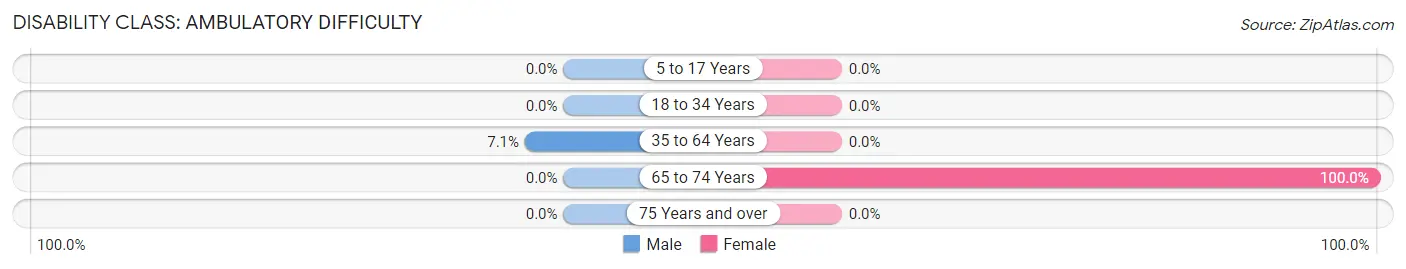
| Age Bracket | Male | Female |
| 5 to 17 Years | 0 (0.0%) | 0 (0.0%) |
| 18 to 34 Years | 0 (0.0%) | 0 (0.0%) |
| 35 to 64 Years | 1 (7.1%) | 0 (0.0%) |
| 65 to 74 Years | 0 (0.0%) | 3 (100.0%) |
| 75 Years and over | 0 (0.0%) | 0 (0.0%) |
Disability Class: Self-Care Difficulty
| Age Bracket | Male | Female |
| 5 to 17 Years | 0 (0.0%) | 0 (0.0%) |
| 18 to 34 Years | 0 (0.0%) | 0 (0.0%) |
| 35 to 64 Years | 0 (0.0%) | 0 (0.0%) |
| 65 to 74 Years | 0 (0.0%) | 0 (0.0%) |
| 75 Years and over | 0 (0.0%) | 0 (0.0%) |
Technology Access in Chignik
Computing Device Access in Chignik
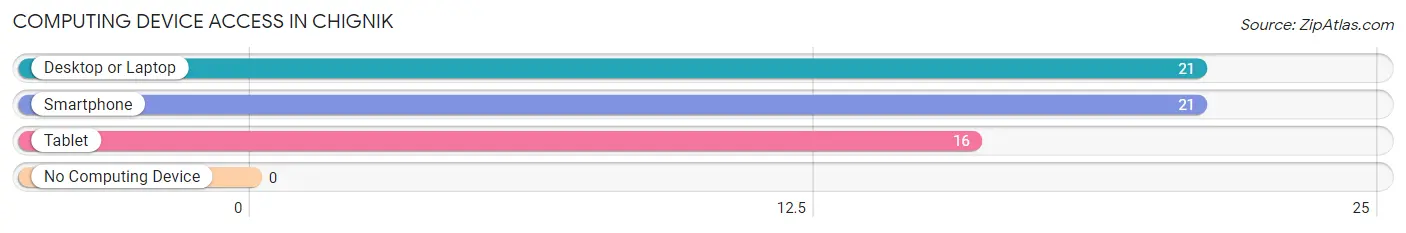
| Device Type | # Households | % Households |
| Desktop or Laptop | 21 | 100.0% |
| Smartphone | 21 | 100.0% |
| Tablet | 16 | 76.2% |
| No Computing Device | 0 | 0.0% |
| Total | 21 | 100.0% |
Internet Access in Chignik
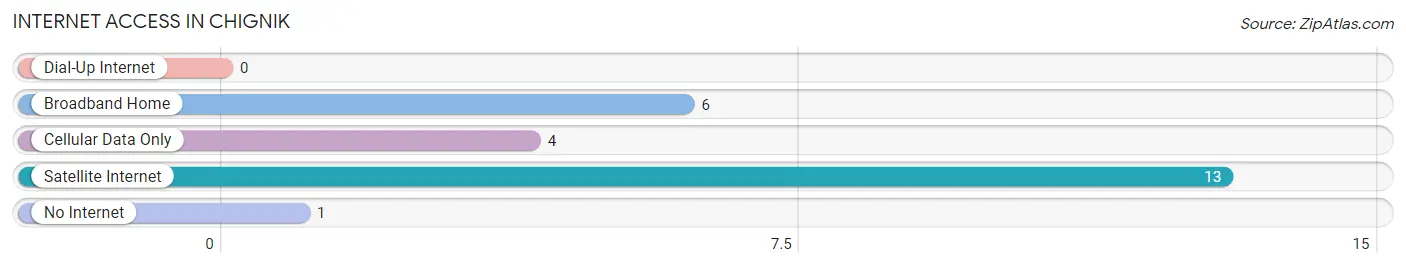
| Internet Type | # Households | % Households |
| Dial-Up Internet | 0 | 0.0% |
| Broadband Home | 6 | 28.6% |
| Cellular Data Only | 4 | 19.1% |
| Satellite Internet | 13 | 61.9% |
| No Internet | 1 | 4.8% |
| Total | 21 | 100.0% |
Chignik Summary
Chignik, Alaska is a small fishing village located on the Alaska Peninsula in the Aleutian Islands. It is situated on the eastern shore of Chignik Bay, about 200 miles southwest of Anchorage. The population of Chignik was estimated to be around 200 people in 2020.
History
The Chignik area has been inhabited by the Alutiiq people for thousands of years. The first recorded contact with Europeans was in 1741, when the Russian explorer Vitus Bering sailed through the area. In the late 1800s, the area was settled by Russian fur traders and fishermen. In the early 1900s, the area was settled by American fishermen and cannery workers.
The village of Chignik was established in the early 1900s and was incorporated in 1912. The village was named after the Chignik River, which flows into Chignik Bay. The village was a center for commercial fishing and canning operations. In the 1950s, the cannery closed and the village became a fishing village.
Geography
Chignik is located on the eastern shore of Chignik Bay, about 200 miles southwest of Anchorage. The bay is surrounded by mountains and is home to a variety of wildlife, including sea otters, seals, sea lions, and whales. The bay is also home to a variety of fish, including salmon, halibut, and cod.
The climate in Chignik is mild and wet, with temperatures ranging from the mid-30s in the winter to the mid-60s in the summer. The area receives an average of 40 inches of rain per year.
Economy
The economy of Chignik is largely based on commercial fishing and subsistence activities. The village is home to several commercial fishing boats, which fish for salmon, halibut, and cod. The village also has a fish processing plant, which processes and packages the fish for sale.
The village also has a small tourism industry, with visitors coming to the area to fish, hunt, and observe wildlife. The village also has a small retail sector, with a few stores selling groceries, clothing, and other goods.
Demographics
The population of Chignik was estimated to be around 200 people in 2020. The majority of the population is of Alutiiq descent. The village also has a small population of non-Native Americans, mostly fishermen and cannery workers.
The village is served by a single school, Chignik Elementary School, which serves students in grades K-12. The village also has a small medical clinic, which provides basic medical care to the residents.
Conclusion
Chignik, Alaska is a small fishing village located on the Alaska Peninsula in the Aleutian Islands. It has a long history of settlement by the Alutiiq people and has been a center for commercial fishing and canning operations. The economy of Chignik is largely based on commercial fishing and subsistence activities, and the village has a small tourism industry. The population of Chignik was estimated to be around 200 people in 2020, with the majority of the population being of Alutiiq descent.
Common Questions
What is Per Capita Income in Chignik?
Per Capita income in Chignik is $25,963.
What is the Median Family Income in Chignik?
Median Family Income in Chignik is $81,094.
What is the Median Household income in Chignik?
Median Household Income in Chignik is $80,469.
What is Income or Wage Gap in Chignik?
Income or Wage Gap in Chignik is 60.0%.
Women in Chignik earn 40.0 cents for every dollar earned by a man.
What is Inequality or Gini Index in Chignik?
Inequality or Gini Index in Chignik is 0.17.
What is the Total Population of Chignik?
Total Population of Chignik is 54.
What is the Total Male Population of Chignik?
Total Male Population of Chignik is 25.
What is the Total Female Population of Chignik?
Total Female Population of Chignik is 29.
What is the Ratio of Males per 100 Females in Chignik?
There are 86.21 Males per 100 Females in Chignik.
What is the Ratio of Females per 100 Males in Chignik?
There are 116.00 Females per 100 Males in Chignik.
What is the Median Population Age in Chignik?
Median Population Age in Chignik is 44.5 Years.
What is the Average Family Size in Chignik
Average Family Size in Chignik is 2.9 People.
What is the Average Household Size in Chignik
Average Household Size in Chignik is 2.6 People.
How Large is the Labor Force in Chignik?
There are 28 People in the Labor Forcein in Chignik.
What is the Percentage of People in the Labor Force in Chignik?
65.1% of People are in the Labor Force in Chignik.
What is the Unemployment Rate in Chignik?
Unemployment Rate in Chignik is 10.7%.