Beaumont, MS Map & Demographics
Beaumont Map
Beaumont Overview
$29,193
PER CAPITA INCOME
$75,071
AVG HOUSEHOLD INCOME
67.0%
WAGE / INCOME GAP [ % ]
33.0¢/ $1
WAGE / INCOME GAP [ $ ]
0.33
INEQUALITY / GINI INDEX
857
TOTAL POPULATION
461
MALE POPULATION
396
FEMALE POPULATION
116.41
MALES / 100 FEMALES
85.90
FEMALES / 100 MALES
46.1
MEDIAN AGE
3.0
AVG FAMILY SIZE
1.9
AVG HOUSEHOLD SIZE
521
LABOR FORCE [ PEOPLE ]
63.2%
PERCENT IN LABOR FORCE
3.2%
UNEMPLOYMENT RATE
Beaumont Zip Codes
Income in Beaumont
Income Overview in Beaumont
| Characteristic | Number | Measure |
| Per Capita Income | 857 | $29,193 |
| Median Family Income | 146 | $0 |
| Mean Family Income | 146 | $50,973 |
| Median Household Income | 462 | $75,071 |
| Mean Household Income | 462 | $54,272 |
| Income Deficit | 146 | $0 |
| Wage / Income Gap (%) | 857 | 66.95% |
| Wage / Income Gap ($) | 857 | 33.05¢ per $1 |
| Gini / Inequality Index | 857 | 0.33 |
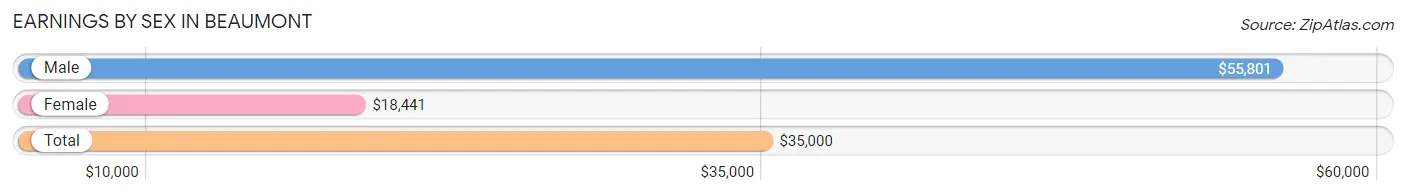
Earnings by Sex in Beaumont
Average Earnings in Beaumont are $35,000, $55,801 for men and $18,441 for women, a difference of 66.9%.
| Sex | Number | Average Earnings |
| Male | 306 (57.5%) | $55,801 |
| Female | 226 (42.5%) | $18,441 |
| Total | 532 (100.0%) | $35,000 |
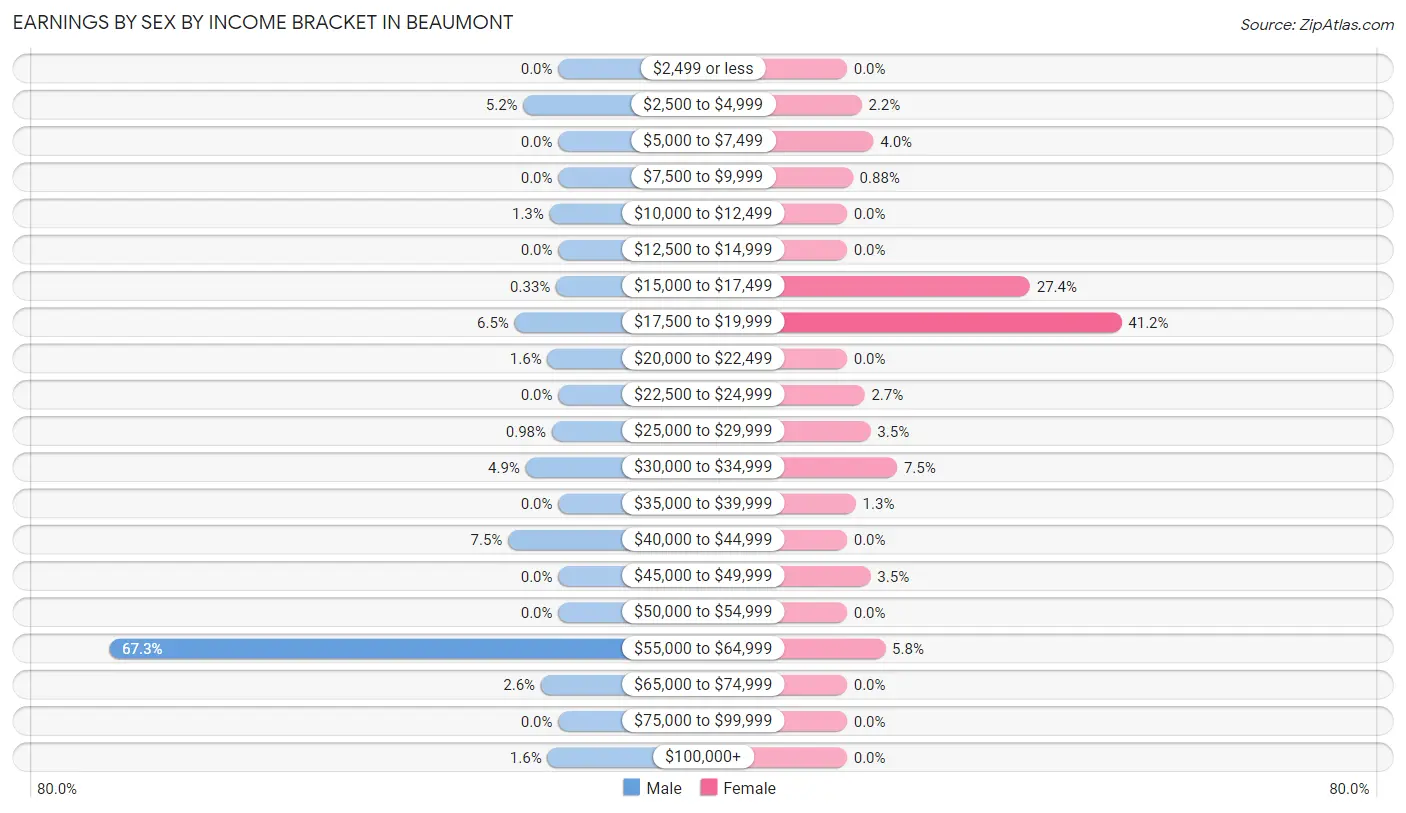
Earnings by Sex by Income Bracket in Beaumont
The most common earnings brackets in Beaumont are $55,000 to $64,999 for men (206 | 67.3%) and $17,500 to $19,999 for women (93 | 41.1%).
| Income | Male | Female |
| $2,499 or less | 0 (0.0%) | 0 (0.0%) |
| $2,500 to $4,999 | 16 (5.2%) | 5 (2.2%) |
| $5,000 to $7,499 | 0 (0.0%) | 9 (4.0%) |
| $7,500 to $9,999 | 0 (0.0%) | 2 (0.9%) |
| $10,000 to $12,499 | 4 (1.3%) | 0 (0.0%) |
| $12,500 to $14,999 | 0 (0.0%) | 0 (0.0%) |
| $15,000 to $17,499 | 1 (0.3%) | 62 (27.4%) |
| $17,500 to $19,999 | 20 (6.5%) | 93 (41.1%) |
| $20,000 to $22,499 | 5 (1.6%) | 0 (0.0%) |
| $22,500 to $24,999 | 0 (0.0%) | 6 (2.6%) |
| $25,000 to $29,999 | 3 (1.0%) | 8 (3.5%) |
| $30,000 to $34,999 | 15 (4.9%) | 17 (7.5%) |
| $35,000 to $39,999 | 0 (0.0%) | 3 (1.3%) |
| $40,000 to $44,999 | 23 (7.5%) | 0 (0.0%) |
| $45,000 to $49,999 | 0 (0.0%) | 8 (3.5%) |
| $50,000 to $54,999 | 0 (0.0%) | 0 (0.0%) |
| $55,000 to $64,999 | 206 (67.3%) | 13 (5.8%) |
| $65,000 to $74,999 | 8 (2.6%) | 0 (0.0%) |
| $75,000 to $99,999 | 0 (0.0%) | 0 (0.0%) |
| $100,000+ | 5 (1.6%) | 0 (0.0%) |
| Total | 306 (100.0%) | 226 (100.0%) |
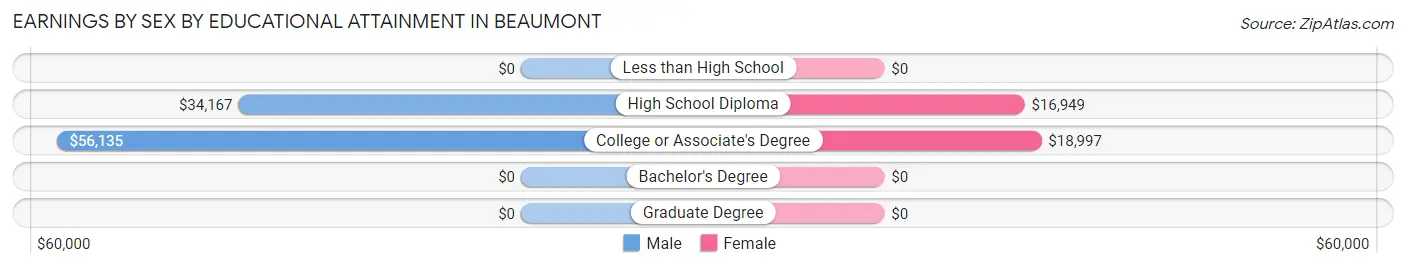
Earnings by Sex by Educational Attainment in Beaumont
Average earnings in Beaumont are $55,843 for men and $18,522 for women, a difference of 66.8%. Men with an educational attainment of college or associate's degree enjoy the highest average annual earnings of $56,135, while those with high school diploma education earn the least with $34,167. Women with an educational attainment of college or associate's degree earn the most with the average annual earnings of $18,997, while those with high school diploma education have the smallest earnings of $16,949.
| Educational Attainment | Male Income | Female Income |
| Less than High School | - | - |
| High School Diploma | $34,167 | $16,949 |
| College or Associate's Degree | $56,135 | $18,997 |
| Bachelor's Degree | - | - |
| Graduate Degree | - | - |
| Total | $55,843 | $18,522 |
Family Income in Beaumont
Family Income Brackets in Beaumont
According to the Beaumont family income data, there are 34 families falling into the $50,000 to $74,999 income range, which is the most common income bracket and makes up 23.3% of all families.
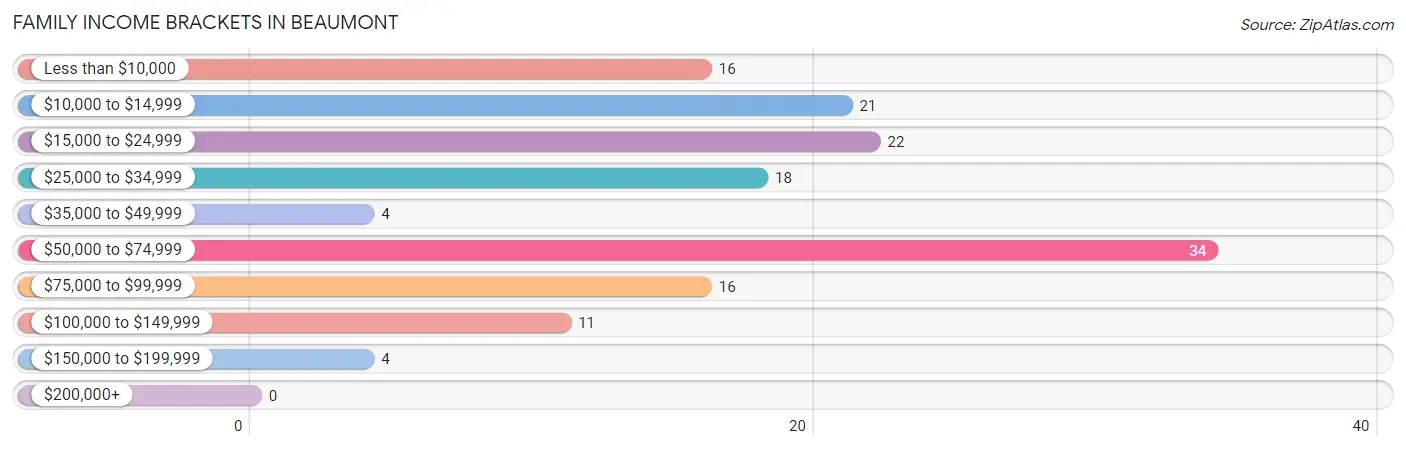
| Income Bracket | # Families | % Families |
| Less than $10,000 | 16 | 11.0% |
| $10,000 to $14,999 | 21 | 14.4% |
| $15,000 to $24,999 | 22 | 15.1% |
| $25,000 to $34,999 | 18 | 12.3% |
| $35,000 to $49,999 | 4 | 2.7% |
| $50,000 to $74,999 | 34 | 23.3% |
| $75,000 to $99,999 | 16 | 11.0% |
| $100,000 to $149,999 | 11 | 7.5% |
| $150,000 to $199,999 | 4 | 2.7% |
| $200,000+ | 0 | 0.0% |
Family Income by Famaliy Size in Beaumont
3-person families (51 | 34.9%) account for the highest median family income in Beaumont with $73,424 per family, while 3-person families (51 | 34.9%) have the highest median income of $24,475 per family member.
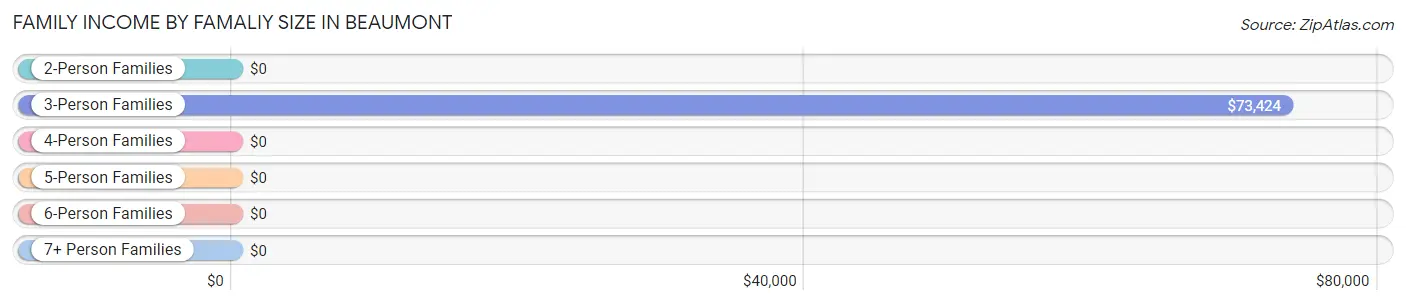
| Income Bracket | # Families | Median Income |
| 2-Person Families | 84 (57.5%) | $0 |
| 3-Person Families | 51 (34.9%) | $73,424 |
| 4-Person Families | 5 (3.4%) | $0 |
| 5-Person Families | 6 (4.1%) | $0 |
| 6-Person Families | 0 (0.0%) | $0 |
| 7+ Person Families | 0 (0.0%) | $0 |
| Total | 146 (100.0%) | $0 |
Family Income by Number of Earners in Beaumont
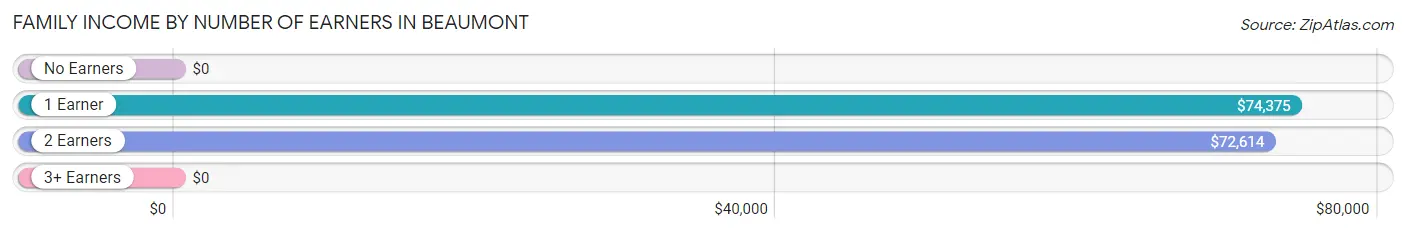
| Number of Earners | # Families | Median Income |
| No Earners | 71 (48.6%) | $0 |
| 1 Earner | 30 (20.5%) | $74,375 |
| 2 Earners | 35 (24.0%) | $72,614 |
| 3+ Earners | 10 (6.9%) | $0 |
| Total | 146 (100.0%) | $0 |
Household Income in Beaumont
Household Income Brackets in Beaumont
With 222 households falling in the category, the $75,000 to $99,999 income range is the most frequent in Beaumont, accounting for 48.0% of all households.
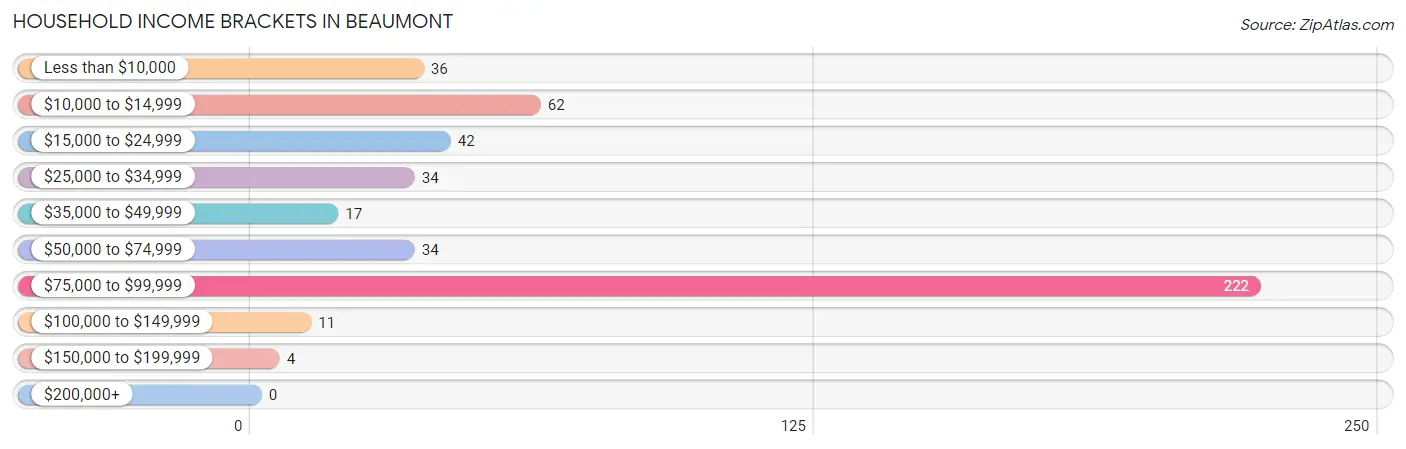
| Income Bracket | # Households | % Households |
| Less than $10,000 | 36 | 7.8% |
| $10,000 to $14,999 | 62 | 13.4% |
| $15,000 to $24,999 | 42 | 9.1% |
| $25,000 to $34,999 | 34 | 7.4% |
| $35,000 to $49,999 | 17 | 3.7% |
| $50,000 to $74,999 | 34 | 7.4% |
| $75,000 to $99,999 | 222 | 48.1% |
| $100,000 to $149,999 | 11 | 2.4% |
| $150,000 to $199,999 | 4 | 0.9% |
| $200,000+ | 0 | 0.0% |
Household Income by Householder Age in Beaumont
The median household income in Beaumont is $75,071, with the highest median household income of $76,159 found in the 25 to 44 years age bracket for the primary householder. A total of 229 households (49.6%) fall into this category.
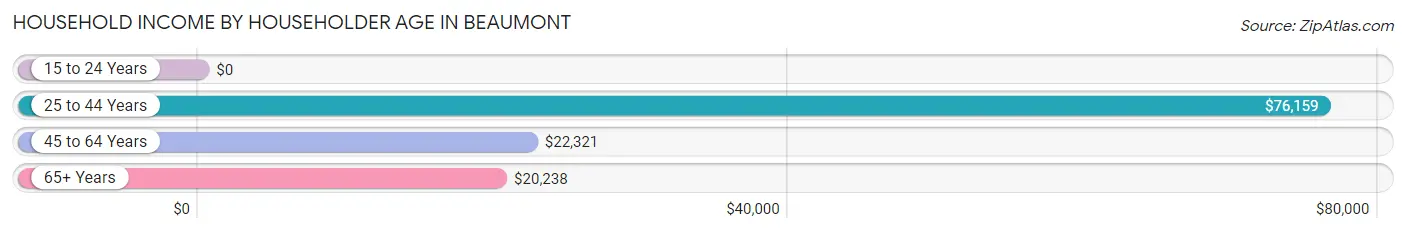
| Income Bracket | # Households | Median Income |
| 15 to 24 Years | 0 (0.0%) | $0 |
| 25 to 44 Years | 229 (49.6%) | $76,159 |
| 45 to 64 Years | 129 (27.9%) | $22,321 |
| 65+ Years | 104 (22.5%) | $20,238 |
| Total | 462 (100.0%) | $75,071 |
Poverty in Beaumont
Income Below Poverty by Sex and Age in Beaumont
With 18.7% poverty level for males and 26.3% for females among the residents of Beaumont, 25 to 34 year old males and 6 to 11 year old females are the most vulnerable to poverty, with 24 males (54.5%) and 1 females (100.0%) in their respective age groups living below the poverty level.
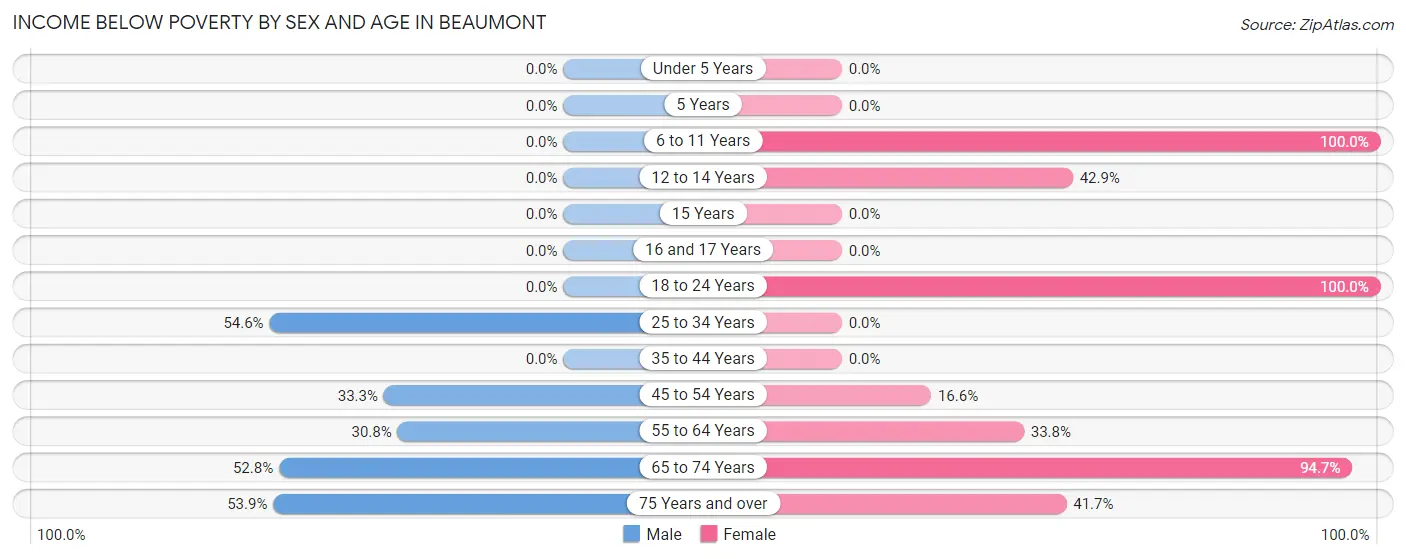
| Age Bracket | Male | Female |
| Under 5 Years | 0 (0.0%) | 0 (0.0%) |
| 5 Years | 0 (0.0%) | 0 (0.0%) |
| 6 to 11 Years | 0 (0.0%) | 1 (100.0%) |
| 12 to 14 Years | 0 (0.0%) | 6 (42.9%) |
| 15 Years | 0 (0.0%) | 0 (0.0%) |
| 16 and 17 Years | 0 (0.0%) | 0 (0.0%) |
| 18 to 24 Years | 0 (0.0%) | 1 (100.0%) |
| 25 to 34 Years | 24 (54.5%) | 0 (0.0%) |
| 35 to 44 Years | 0 (0.0%) | 0 (0.0%) |
| 45 to 54 Years | 13 (33.3%) | 25 (16.6%) |
| 55 to 64 Years | 16 (30.8%) | 25 (33.8%) |
| 65 to 74 Years | 19 (52.8%) | 36 (94.7%) |
| 75 Years and over | 14 (53.8%) | 10 (41.7%) |
| Total | 86 (18.7%) | 104 (26.3%) |
Income Above Poverty by Sex and Age in Beaumont
According to the poverty statistics in Beaumont, males aged under 5 years and females aged under 5 years are the age groups that are most secure financially, with 100.0% of males and 100.0% of females in these age groups living above the poverty line.
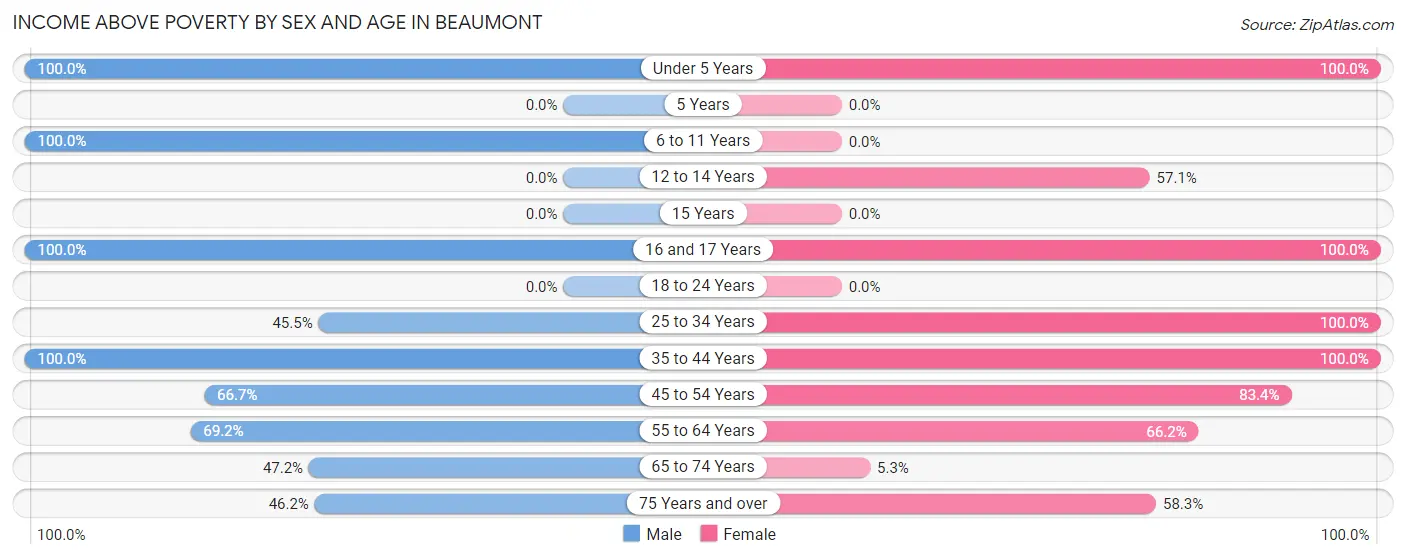
| Age Bracket | Male | Female |
| Under 5 Years | 2 (100.0%) | 7 (100.0%) |
| 5 Years | 0 (0.0%) | 0 (0.0%) |
| 6 to 11 Years | 9 (100.0%) | 0 (0.0%) |
| 12 to 14 Years | 0 (0.0%) | 8 (57.1%) |
| 15 Years | 0 (0.0%) | 0 (0.0%) |
| 16 and 17 Years | 7 (100.0%) | 5 (100.0%) |
| 18 to 24 Years | 0 (0.0%) | 0 (0.0%) |
| 25 to 34 Years | 20 (45.5%) | 59 (100.0%) |
| 35 to 44 Years | 246 (100.0%) | 22 (100.0%) |
| 45 to 54 Years | 26 (66.7%) | 126 (83.4%) |
| 55 to 64 Years | 36 (69.2%) | 49 (66.2%) |
| 65 to 74 Years | 17 (47.2%) | 2 (5.3%) |
| 75 Years and over | 12 (46.2%) | 14 (58.3%) |
| Total | 375 (81.3%) | 292 (73.7%) |
Income Below Poverty Among Married-Couple Families in Beaumont
The poverty statistics for married-couple families in Beaumont show that 40.2% or 45 of the total 112 families live below the poverty line. Families with no children have the highest poverty rate of 48.9%, comprising of 45 families. On the other hand, families with 1 or 2 children have the lowest poverty rate of 0.0%, which includes 0 families.
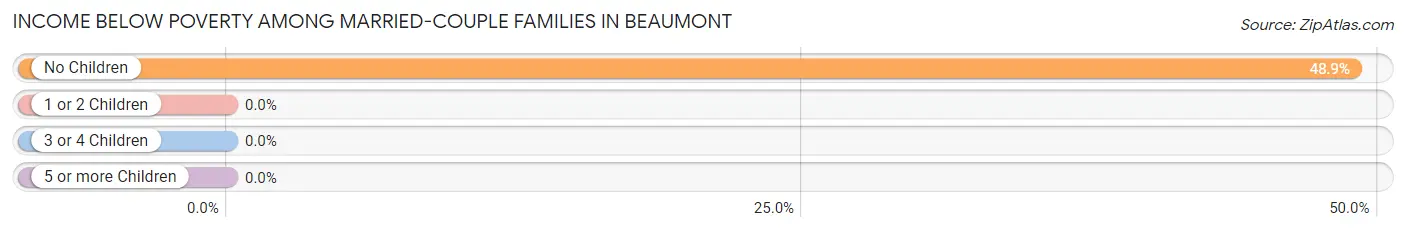
| Children | Above Poverty | Below Poverty |
| No Children | 47 (51.1%) | 45 (48.9%) |
| 1 or 2 Children | 20 (100.0%) | 0 (0.0%) |
| 3 or 4 Children | 0 (0.0%) | 0 (0.0%) |
| 5 or more Children | 0 (0.0%) | 0 (0.0%) |
| Total | 67 (59.8%) | 45 (40.2%) |
Income Below Poverty Among Single-Parent Households in Beaumont
According to the poverty data in Beaumont, 85.7% or 6 single-father households and 29.6% or 8 single-mother households are living below the poverty line. Among single-father households, those with no children have the highest poverty rate, with 6 households (85.7%) experiencing poverty. Likewise, among single-mother households, those with 1 or 2 children have the highest poverty rate, with 8 households (33.3%) falling below the poverty line.
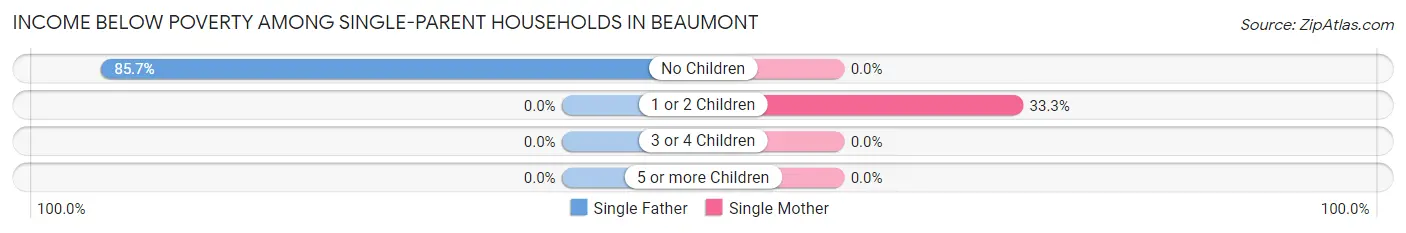
| Children | Single Father | Single Mother |
| No Children | 6 (85.7%) | 0 (0.0%) |
| 1 or 2 Children | 0 (0.0%) | 8 (33.3%) |
| 3 or 4 Children | 0 (0.0%) | 0 (0.0%) |
| 5 or more Children | 0 (0.0%) | 0 (0.0%) |
| Total | 6 (85.7%) | 8 (29.6%) |
Income Below Poverty Among Married-Couple vs Single-Parent Households in Beaumont
The poverty data for Beaumont shows that 45 of the married-couple family households (40.2%) and 14 of the single-parent households (41.2%) are living below the poverty level. Within the married-couple family households, those with no children have the highest poverty rate, with 45 households (48.9%) falling below the poverty line. Among the single-parent households, those with no children have the highest poverty rate, with 6 household (60.0%) living below poverty.
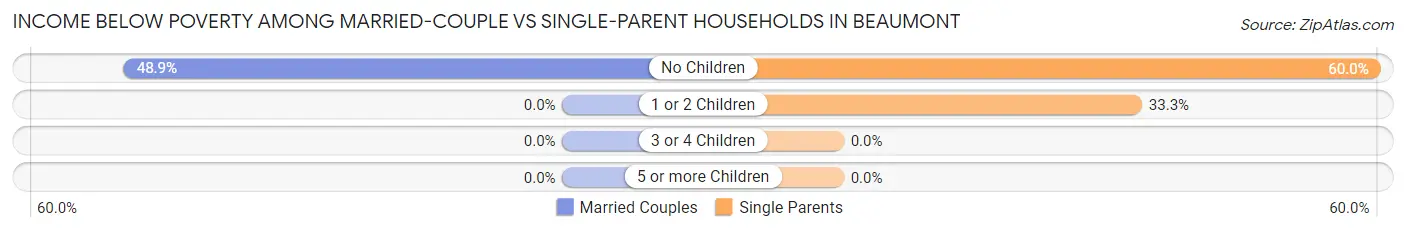
| Children | Married-Couple Families | Single-Parent Households |
| No Children | 45 (48.9%) | 6 (60.0%) |
| 1 or 2 Children | 0 (0.0%) | 8 (33.3%) |
| 3 or 4 Children | 0 (0.0%) | 0 (0.0%) |
| 5 or more Children | 0 (0.0%) | 0 (0.0%) |
| Total | 45 (40.2%) | 14 (41.2%) |
Race in Beaumont
The most populous races in Beaumont are White / Caucasian (374 | 43.6%), Black / African American (263 | 30.7%), and Asian (206 | 24.0%).
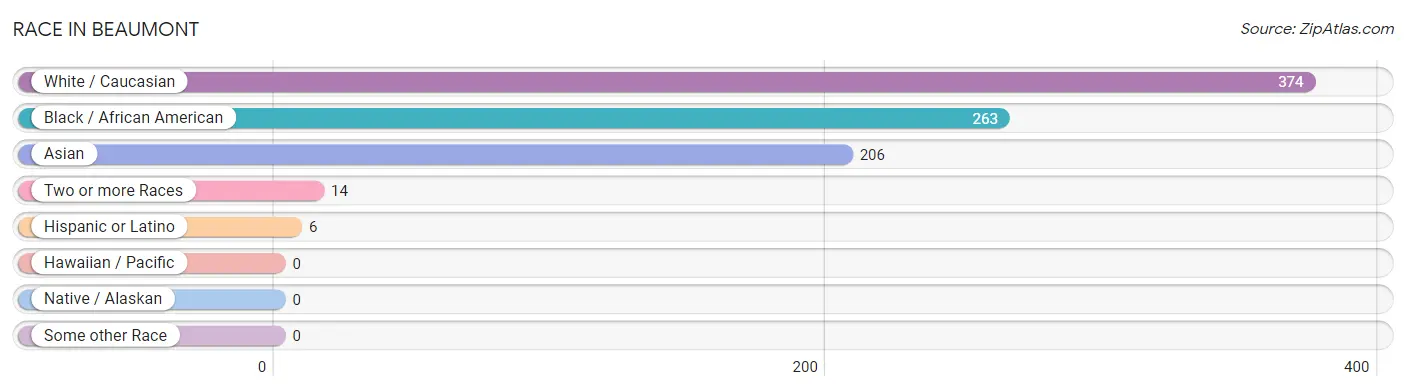
| Race | # Population | % Population |
| Asian | 206 | 24.0% |
| Black / African American | 263 | 30.7% |
| Hawaiian / Pacific | 0 | 0.0% |
| Hispanic or Latino | 6 | 0.7% |
| Native / Alaskan | 0 | 0.0% |
| White / Caucasian | 374 | 43.6% |
| Two or more Races | 14 | 1.6% |
| Some other Race | 0 | 0.0% |
| Total | 857 | 100.0% |
Ancestry in Beaumont
The most populous ancestries reported in Beaumont are Indian (Asian) (206 | 24.0%), Sri Lankan (206 | 24.0%), Irish (194 | 22.6%), American (92 | 10.7%), and English (42 | 4.9%), together accounting for 86.4% of all Beaumont residents.
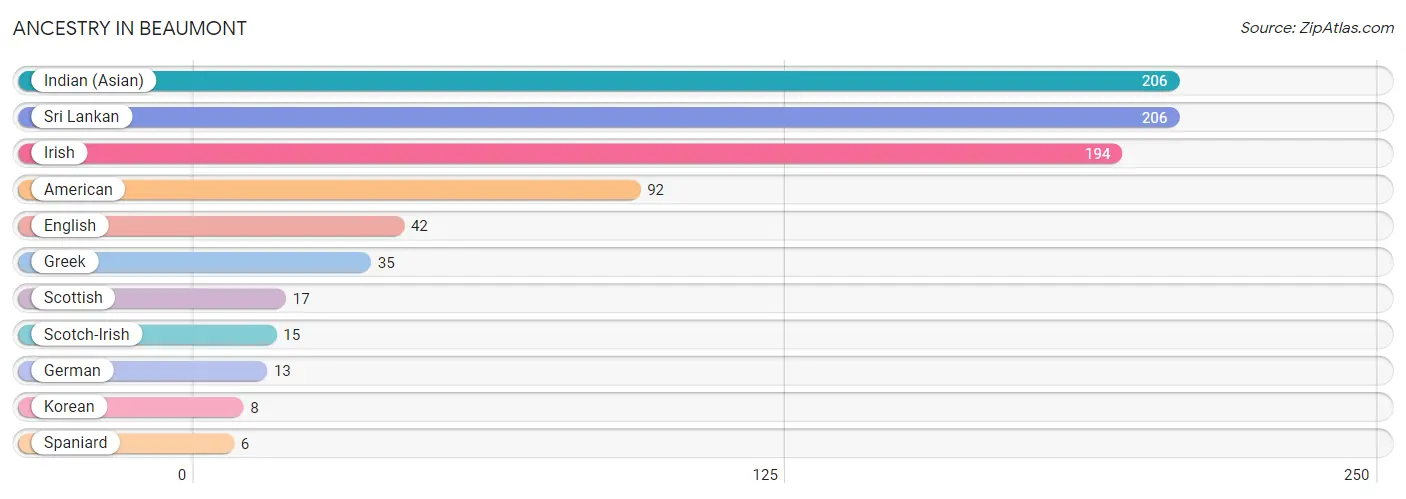
| Ancestry | # Population | % Population |
| American | 92 | 10.7% |
| English | 42 | 4.9% |
| German | 13 | 1.5% |
| Greek | 35 | 4.1% |
| Indian (Asian) | 206 | 24.0% |
| Irish | 194 | 22.6% |
| Korean | 8 | 0.9% |
| Scotch-Irish | 15 | 1.8% |
| Scottish | 17 | 2.0% |
| Spaniard | 6 | 0.7% |
| Sri Lankan | 206 | 24.0% | View All 11 Rows |
Immigrants in Beaumont
The most numerous immigrant groups reported in Beaumont came from Asia (206 | 24.0%), Philippines (206 | 24.0%), and South Eastern Asia (206 | 24.0%), together accounting for 72.1% of all Beaumont residents.
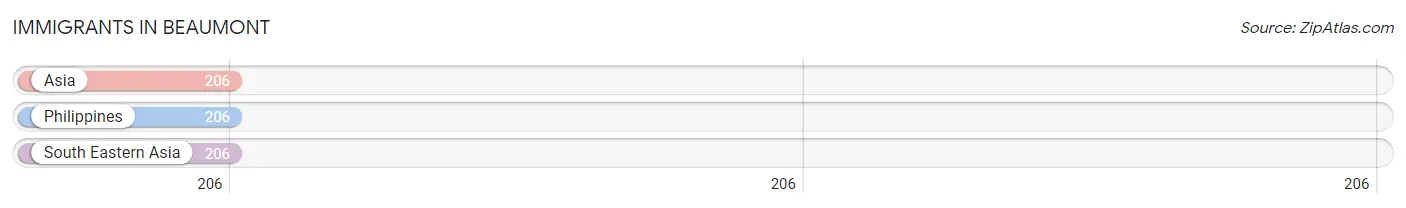
| Immigration Origin | # Population | % Population |
| Asia | 206 | 24.0% |
| Philippines | 206 | 24.0% |
| South Eastern Asia | 206 | 24.0% | View All 3 Rows |
Sex and Age in Beaumont
Sex and Age in Beaumont
The most populous age groups in Beaumont are 40 to 44 Years (238 | 51.6%) for men and 45 to 49 Years (125 | 31.6%) for women.
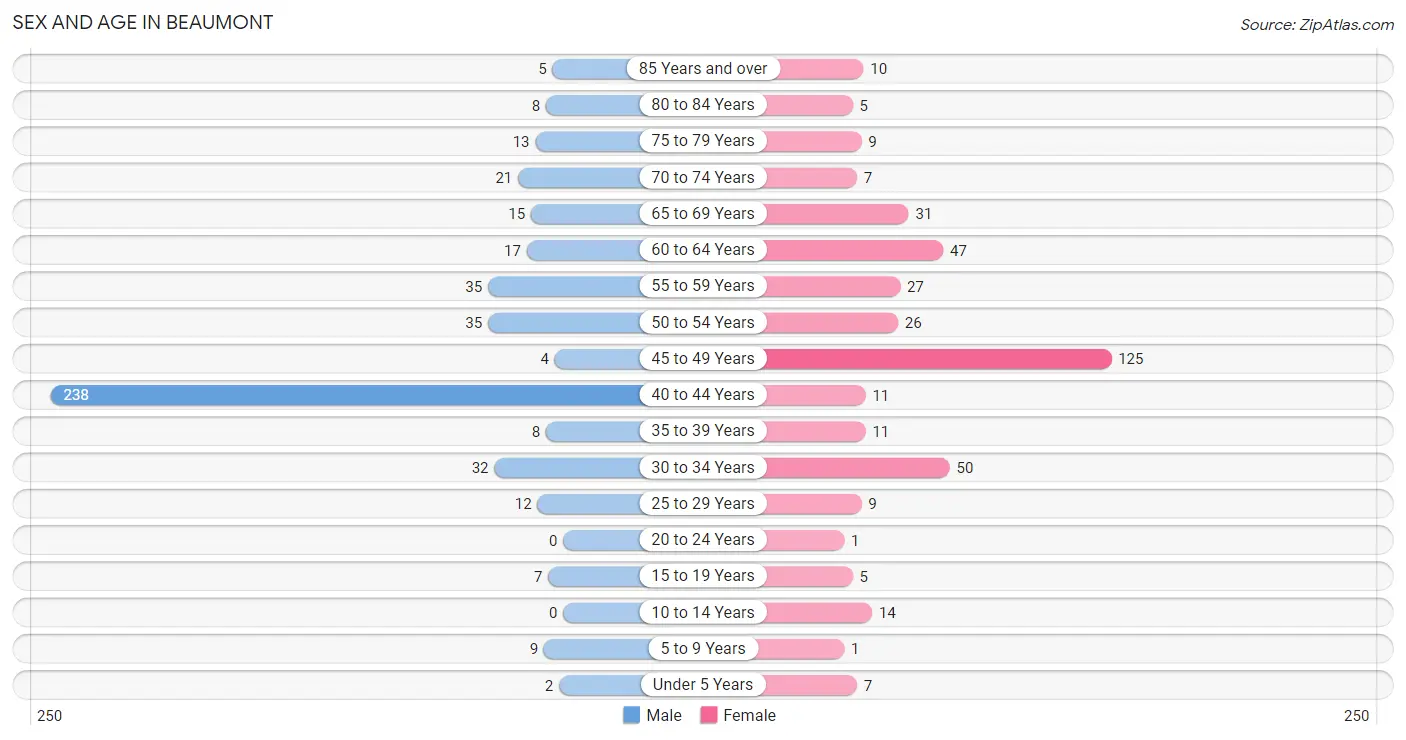
| Age Bracket | Male | Female |
| Under 5 Years | 2 (0.4%) | 7 (1.8%) |
| 5 to 9 Years | 9 (1.9%) | 1 (0.3%) |
| 10 to 14 Years | 0 (0.0%) | 14 (3.5%) |
| 15 to 19 Years | 7 (1.5%) | 5 (1.3%) |
| 20 to 24 Years | 0 (0.0%) | 1 (0.3%) |
| 25 to 29 Years | 12 (2.6%) | 9 (2.3%) |
| 30 to 34 Years | 32 (6.9%) | 50 (12.6%) |
| 35 to 39 Years | 8 (1.7%) | 11 (2.8%) |
| 40 to 44 Years | 238 (51.6%) | 11 (2.8%) |
| 45 to 49 Years | 4 (0.9%) | 125 (31.6%) |
| 50 to 54 Years | 35 (7.6%) | 26 (6.6%) |
| 55 to 59 Years | 35 (7.6%) | 27 (6.8%) |
| 60 to 64 Years | 17 (3.7%) | 47 (11.9%) |
| 65 to 69 Years | 15 (3.3%) | 31 (7.8%) |
| 70 to 74 Years | 21 (4.6%) | 7 (1.8%) |
| 75 to 79 Years | 13 (2.8%) | 9 (2.3%) |
| 80 to 84 Years | 8 (1.7%) | 5 (1.3%) |
| 85 Years and over | 5 (1.1%) | 10 (2.5%) |
| Total | 461 (100.0%) | 396 (100.0%) |
Families and Households in Beaumont
Median Family Size in Beaumont
The median family size in Beaumont is 2.95 persons per family, with married-couple families (112 | 76.7%) accounting for the largest median family size of 2.99 persons per family. On the other hand, single male/father families (7 | 4.8%) represent the smallest median family size with 2.71 persons per family.
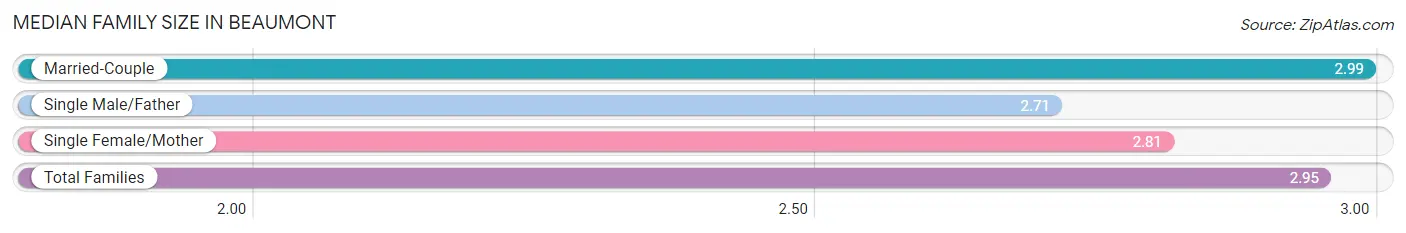
| Family Type | # Families | Family Size |
| Married-Couple | 112 (76.7%) | 2.99 |
| Single Male/Father | 7 (4.8%) | 2.71 |
| Single Female/Mother | 27 (18.5%) | 2.81 |
| Total Families | 146 (100.0%) | 2.95 |
Median Household Size in Beaumont
The median household size in Beaumont is 1.85 persons per household, with married-couple households (112 | 24.2%) accounting for the largest median household size of 2.99 persons per household. non-family households (316 | 68.4%) represent the smallest median household size with 1.35 persons per household.
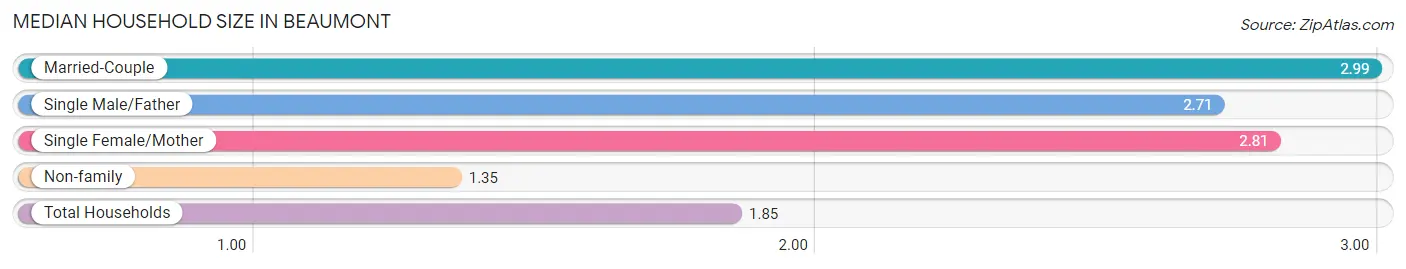
| Household Type | # Households | Household Size |
| Married-Couple | 112 (24.2%) | 2.99 |
| Single Male/Father | 7 (1.5%) | 2.71 |
| Single Female/Mother | 27 (5.8%) | 2.81 |
| Non-family | 316 (68.4%) | 1.35 |
| Total Households | 462 (100.0%) | 1.85 |
Household Size by Marriage Status in Beaumont
Out of a total of 462 households in Beaumont, 146 (31.6%) are family households, while 316 (68.4%) are nonfamily households. The most numerous type of family households are 2-person households, comprising 84, and the most common type of nonfamily households are 2-person households, comprising 221.
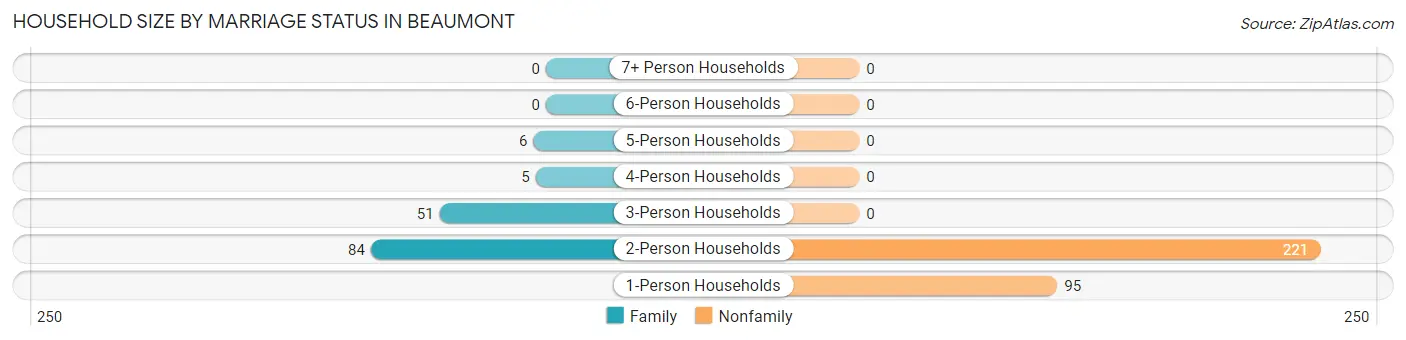
| Household Size | Family Households | Nonfamily Households |
| 1-Person Households | - | 95 (20.6%) |
| 2-Person Households | 84 (18.2%) | 221 (47.8%) |
| 3-Person Households | 51 (11.0%) | 0 (0.0%) |
| 4-Person Households | 5 (1.1%) | 0 (0.0%) |
| 5-Person Households | 6 (1.3%) | 0 (0.0%) |
| 6-Person Households | 0 (0.0%) | 0 (0.0%) |
| 7+ Person Households | 0 (0.0%) | 0 (0.0%) |
| Total | 146 (31.6%) | 316 (68.4%) |
Female Fertility in Beaumont
Fertility by Age in Beaumont
Average fertility rate in Beaumont is 24.0 births per 1,000 women. Women in the age bracket of 20 to 34 years have the highest fertility rate with 83.0 births per 1,000 women. Women in the age bracket of 20 to 34 years acount for 100.0% of all women with births.
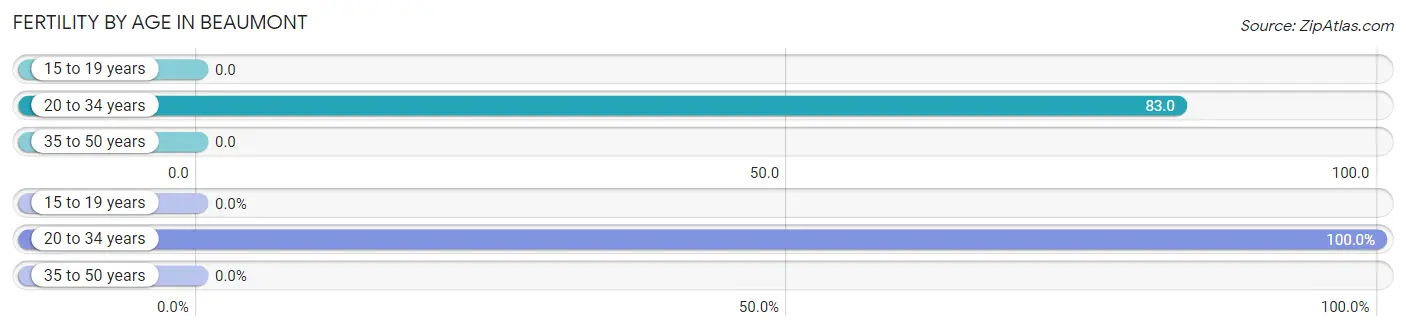
| Age Bracket | Women with Births | Births / 1,000 Women |
| 15 to 19 years | 0 (0.0%) | 0.0 |
| 20 to 34 years | 5 (100.0%) | 83.0 |
| 35 to 50 years | 0 (0.0%) | 0.0 |
| Total | 5 (100.0%) | 24.0 |
Fertility by Age by Marriage Status in Beaumont
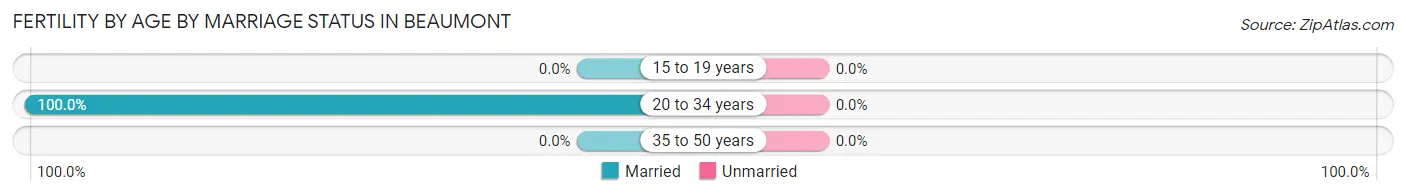
| Age Bracket | Married | Unmarried |
| 15 to 19 years | 0 (0.0%) | 0 (0.0%) |
| 20 to 34 years | 5 (100.0%) | 0 (0.0%) |
| 35 to 50 years | 0 (0.0%) | 0 (0.0%) |
| Total | 5 (100.0%) | 0 (0.0%) |
Fertility by Education in Beaumont
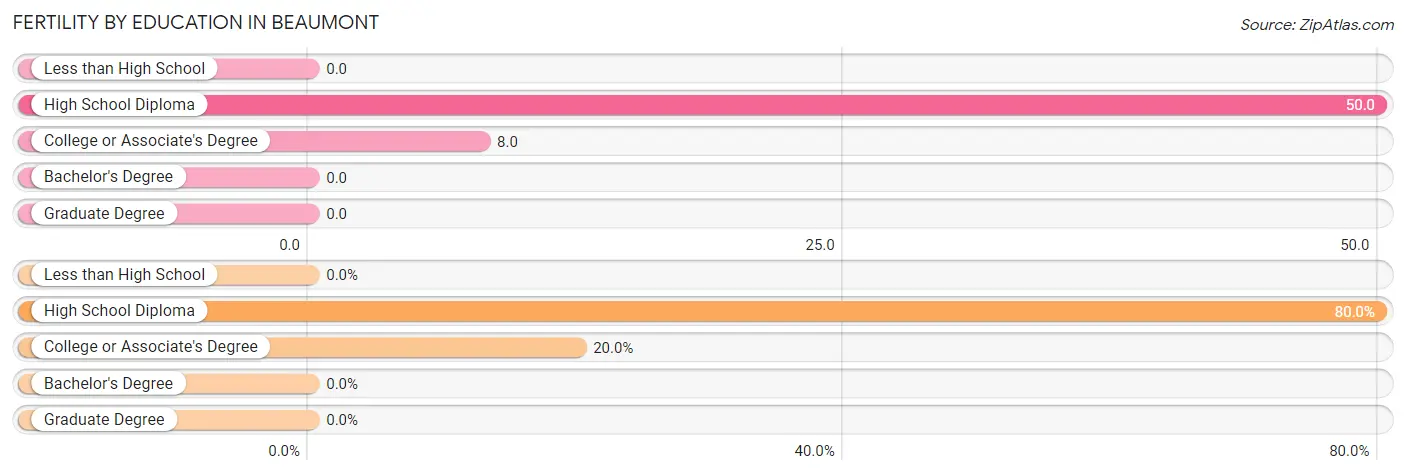
| Educational Attainment | Women with Births | Births / 1,000 Women |
| Less than High School | 0 (0.0%) | 0.0 |
| High School Diploma | 4 (80.0%) | 50.0 |
| College or Associate's Degree | 1 (20.0%) | 8.0 |
| Bachelor's Degree | 0 (0.0%) | 0.0 |
| Graduate Degree | 0 (0.0%) | 0.0 |
| Total | 5 (100.0%) | 24.0 |
Fertility by Education by Marriage Status in Beaumont
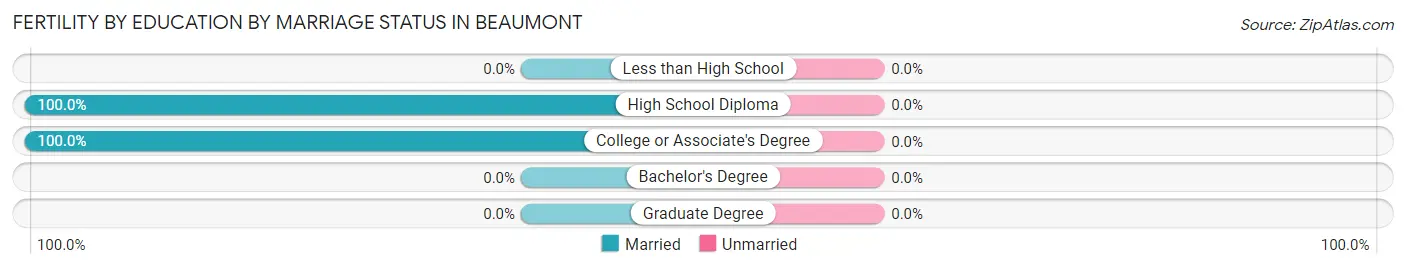
| Educational Attainment | Married | Unmarried |
| Less than High School | 0 (0.0%) | 0 (0.0%) |
| High School Diploma | 4 (100.0%) | 0 (0.0%) |
| College or Associate's Degree | 1 (100.0%) | 0 (0.0%) |
| Bachelor's Degree | 0 (0.0%) | 0 (0.0%) |
| Graduate Degree | 0 (0.0%) | 0 (0.0%) |
| Total | 5 (100.0%) | 0 (0.0%) |
Employment Characteristics in Beaumont
Employment by Class of Employer in Beaumont
Among the 418 employed individuals in Beaumont, federal government employees (206 | 49.3%), private company employees (163 | 39.0%), and local government employees (21 | 5.0%) make up the most common classes of employment.
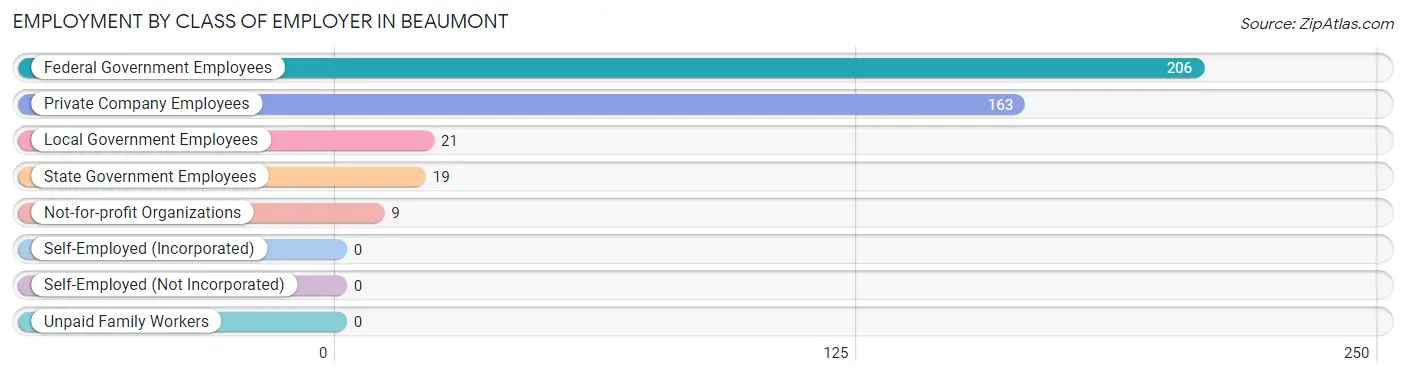
| Employer Class | # Employees | % Employees |
| Private Company Employees | 163 | 39.0% |
| Self-Employed (Incorporated) | 0 | 0.0% |
| Self-Employed (Not Incorporated) | 0 | 0.0% |
| Not-for-profit Organizations | 9 | 2.1% |
| Local Government Employees | 21 | 5.0% |
| State Government Employees | 19 | 4.5% |
| Federal Government Employees | 206 | 49.3% |
| Unpaid Family Workers | 0 | 0.0% |
| Total | 418 | 100.0% |
Employment Status by Age in Beaumont
According to the labor force statistics for Beaumont, out of the total population over 16 years of age (824), 63.2% or 521 individuals are in the labor force, with 3.2% or 17 of them unemployed. The age group with the highest labor force participation rate is 16 to 19 years, with 100.0% or 12 individuals in the labor force. Within the labor force, the 45 to 54 years age range has the highest percentage of unemployed individuals, with 6.7% or 10 of them being unemployed.
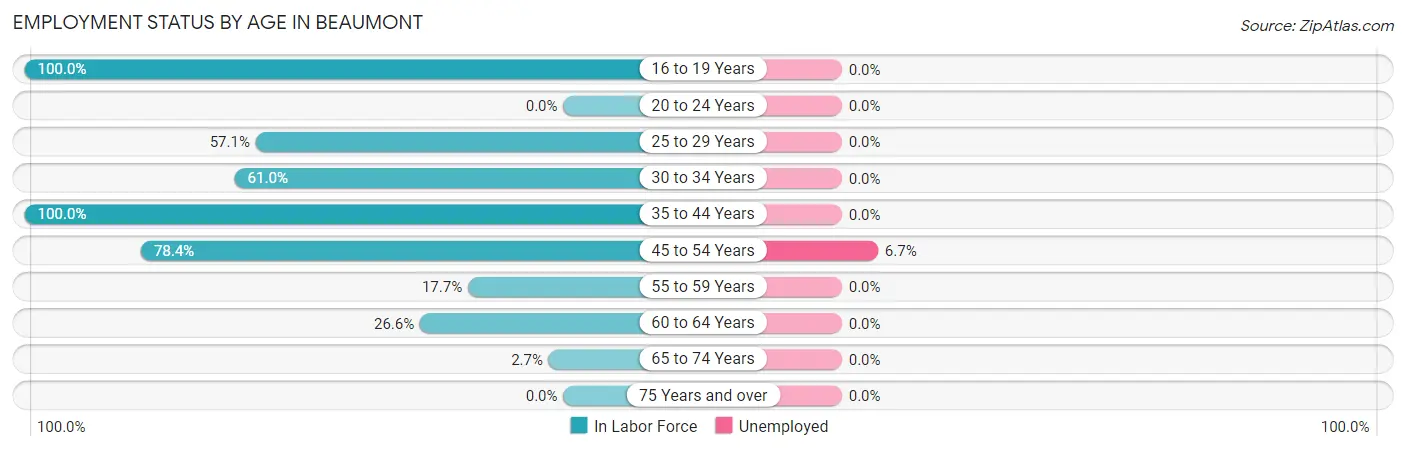
| Age Bracket | In Labor Force | Unemployed |
| 16 to 19 Years | 12 (100.0%) | 0 (0.0%) |
| 20 to 24 Years | 0 (0.0%) | 0 (0.0%) |
| 25 to 29 Years | 12 (57.1%) | 0 (0.0%) |
| 30 to 34 Years | 50 (61.0%) | 0 (0.0%) |
| 35 to 44 Years | 268 (100.0%) | 0 (0.0%) |
| 45 to 54 Years | 149 (78.4%) | 10 (6.7%) |
| 55 to 59 Years | 11 (17.7%) | 0 (0.0%) |
| 60 to 64 Years | 17 (26.6%) | 0 (0.0%) |
| 65 to 74 Years | 2 (2.7%) | 0 (0.0%) |
| 75 Years and over | 0 (0.0%) | 0 (0.0%) |
| Total | 521 (63.2%) | 17 (3.2%) |
Employment Status by Educational Attainment in Beaumont
According to labor force statistics for Beaumont, 73.8% of individuals (507) out of the total population between 25 and 64 years of age (687) are in the labor force, with 3.3% or 17 of them being unemployed. The group with the highest labor force participation rate are those with the educational attainment of college / associate degree, with 89.1% or 352 individuals in the labor force. Within the labor force, individuals with college / associate degree education have the highest percentage of unemployment, with 6.8% or 24 of them being unemployed.
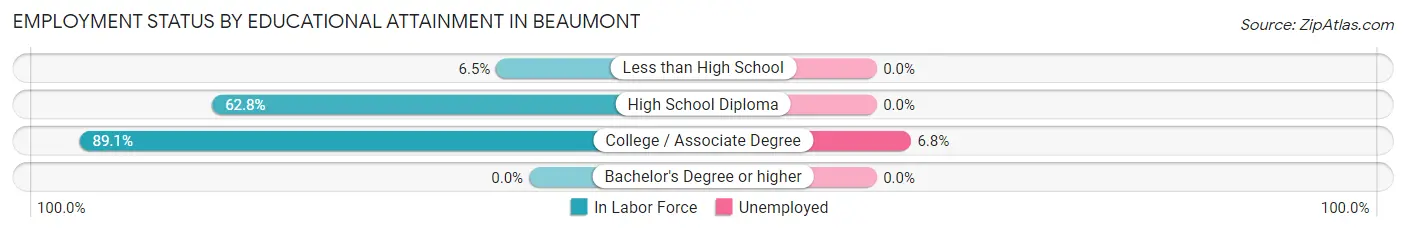
| Educational Attainment | In Labor Force | Unemployed |
| Less than High School | 3 (6.5%) | 0 (0.0%) |
| High School Diploma | 152 (62.8%) | 0 (0.0%) |
| College / Associate Degree | 352 (89.1%) | 27 (6.8%) |
| Bachelor's Degree or higher | 0 (0.0%) | 0 (0.0%) |
| Total | 507 (73.8%) | 23 (3.3%) |
Employment Occupations by Sex in Beaumont
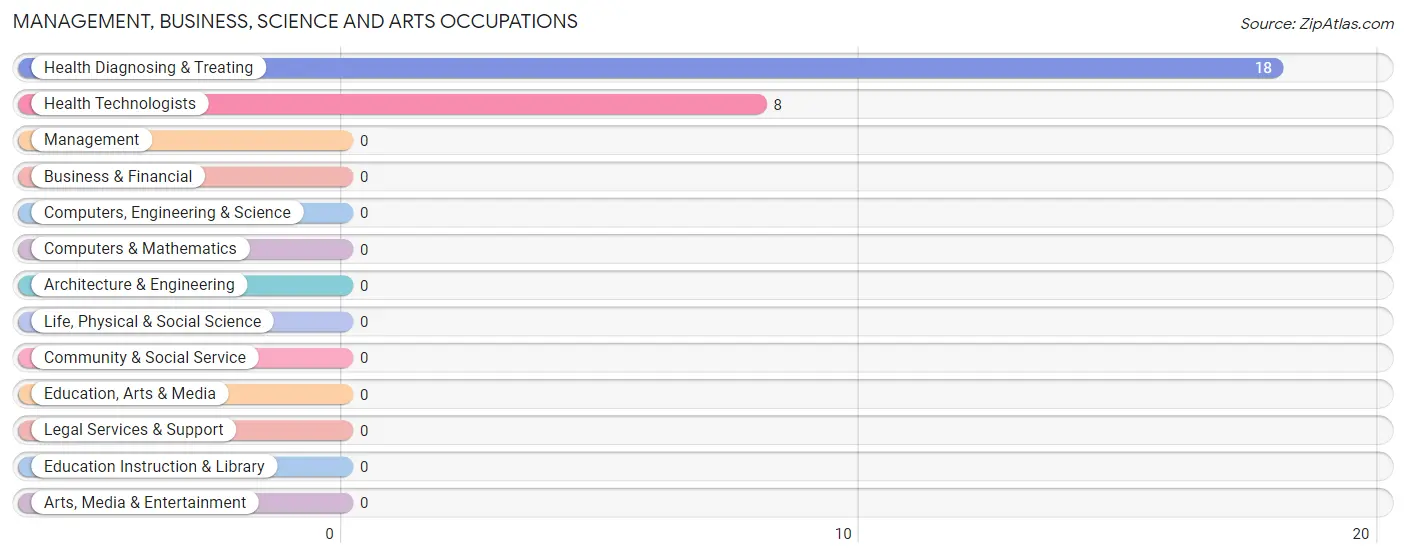
Management, Business, Science and Arts Occupations
The most common Management, Business, Science and Arts occupations in Beaumont are Health Diagnosing & Treating (18 | 5.9%), and Health Technologists (8 | 2.6%).
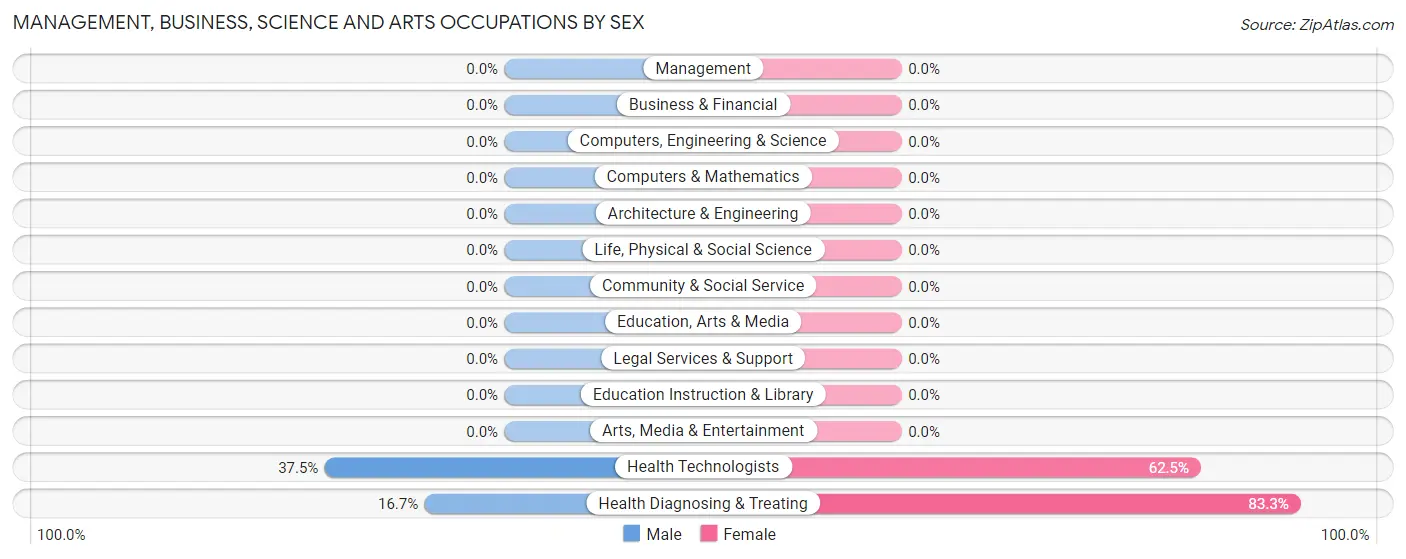
Management, Business, Science and Arts Occupations by Sex
Within the Management, Business, Science and Arts occupations in Beaumont, the most male-oriented occupations are Health Technologists (37.5%), and Health Diagnosing & Treating (16.7%), while the most female-oriented occupations are Health Diagnosing & Treating (83.3%), and Health Technologists (62.5%).
| Occupation | Male | Female |
| Management | 0 (0.0%) | 0 (0.0%) |
| Business & Financial | 0 (0.0%) | 0 (0.0%) |
| Computers, Engineering & Science | 0 (0.0%) | 0 (0.0%) |
| Computers & Mathematics | 0 (0.0%) | 0 (0.0%) |
| Architecture & Engineering | 0 (0.0%) | 0 (0.0%) |
| Life, Physical & Social Science | 0 (0.0%) | 0 (0.0%) |
| Community & Social Service | 0 (0.0%) | 0 (0.0%) |
| Education, Arts & Media | 0 (0.0%) | 0 (0.0%) |
| Legal Services & Support | 0 (0.0%) | 0 (0.0%) |
| Education Instruction & Library | 0 (0.0%) | 0 (0.0%) |
| Arts, Media & Entertainment | 0 (0.0%) | 0 (0.0%) |
| Health Diagnosing & Treating | 3 (16.7%) | 15 (83.3%) |
| Health Technologists | 3 (37.5%) | 5 (62.5%) |
| Total (Category) | 3 (16.7%) | 15 (83.3%) |
| Total (Overall) | 88 (28.8%) | 217 (71.2%) |
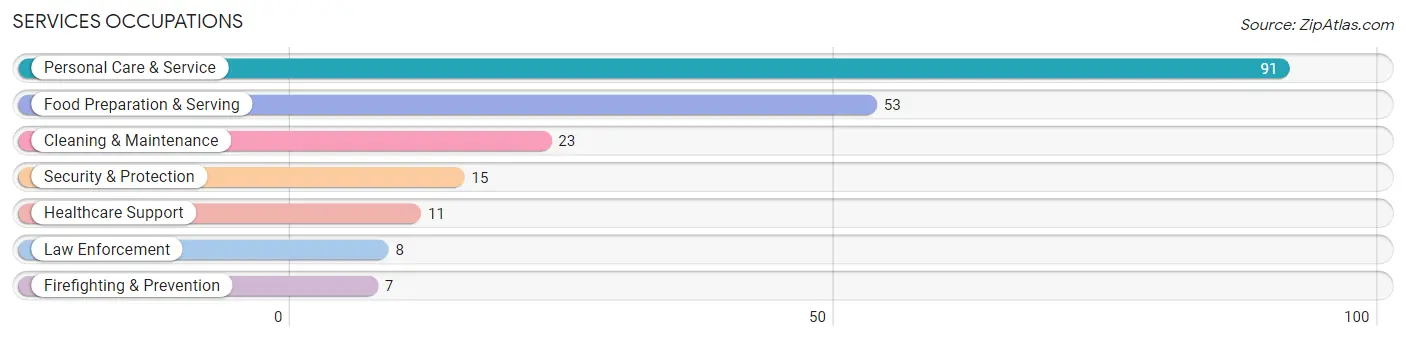
Services Occupations
The most common Services occupations in Beaumont are Personal Care & Service (91 | 29.8%), Food Preparation & Serving (53 | 17.4%), Cleaning & Maintenance (23 | 7.5%), Security & Protection (15 | 4.9%), and Healthcare Support (11 | 3.6%).
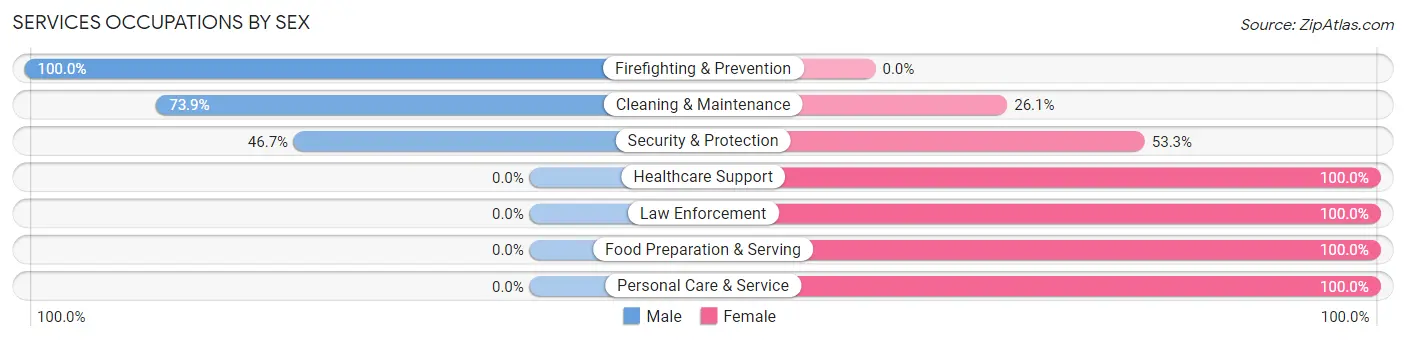
Services Occupations by Sex
Within the Services occupations in Beaumont, the most male-oriented occupations are Firefighting & Prevention (100.0%), Cleaning & Maintenance (73.9%), and Security & Protection (46.7%), while the most female-oriented occupations are Healthcare Support (100.0%), Law Enforcement (100.0%), and Food Preparation & Serving (100.0%).
| Occupation | Male | Female |
| Healthcare Support | 0 (0.0%) | 11 (100.0%) |
| Security & Protection | 7 (46.7%) | 8 (53.3%) |
| Firefighting & Prevention | 7 (100.0%) | 0 (0.0%) |
| Law Enforcement | 0 (0.0%) | 8 (100.0%) |
| Food Preparation & Serving | 0 (0.0%) | 53 (100.0%) |
| Cleaning & Maintenance | 17 (73.9%) | 6 (26.1%) |
| Personal Care & Service | 0 (0.0%) | 91 (100.0%) |
| Total (Category) | 24 (12.4%) | 169 (87.6%) |
| Total (Overall) | 88 (28.8%) | 217 (71.2%) |
Sales and Office Occupations
The most common Sales and Office occupations in Beaumont are Sales & Related (30 | 9.8%), and Office & Administration (15 | 4.9%).
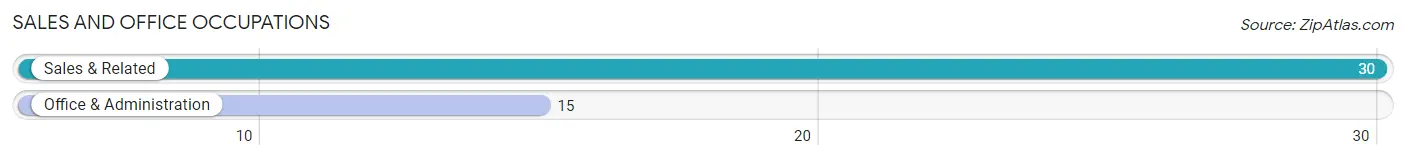
Sales and Office Occupations by Sex
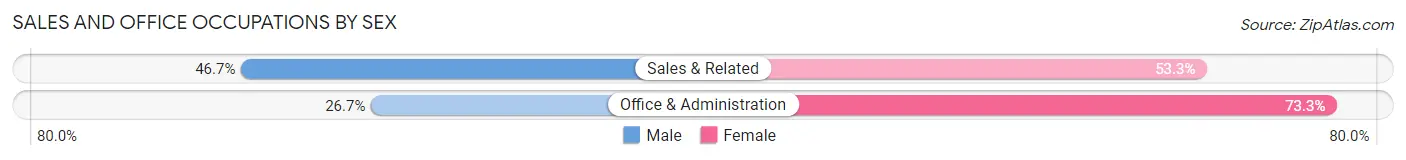
| Occupation | Male | Female |
| Sales & Related | 14 (46.7%) | 16 (53.3%) |
| Office & Administration | 4 (26.7%) | 11 (73.3%) |
| Total (Category) | 18 (40.0%) | 27 (60.0%) |
| Total (Overall) | 88 (28.8%) | 217 (71.2%) |
Natural Resources, Construction and Maintenance Occupations
The most common Natural Resources, Construction and Maintenance occupations in Beaumont are , and Construction & Extraction (8 | 2.6%).
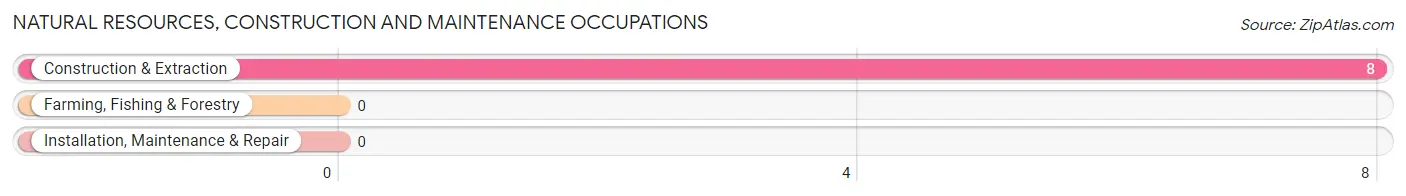
Natural Resources, Construction and Maintenance Occupations by Sex
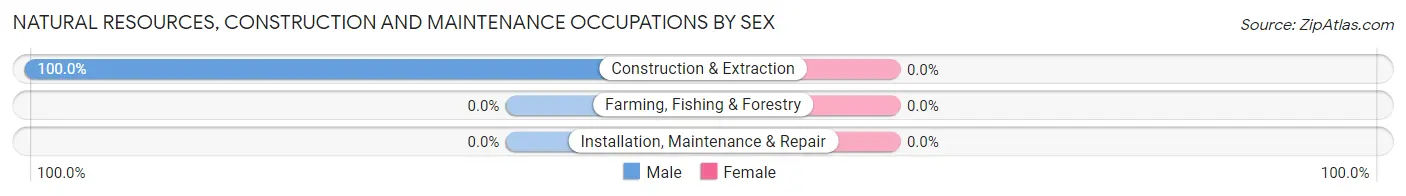
| Occupation | Male | Female |
| Farming, Fishing & Forestry | 0 (0.0%) | 0 (0.0%) |
| Construction & Extraction | 8 (100.0%) | 0 (0.0%) |
| Installation, Maintenance & Repair | 0 (0.0%) | 0 (0.0%) |
| Total (Category) | 8 (100.0%) | 0 (0.0%) |
| Total (Overall) | 88 (28.8%) | 217 (71.2%) |
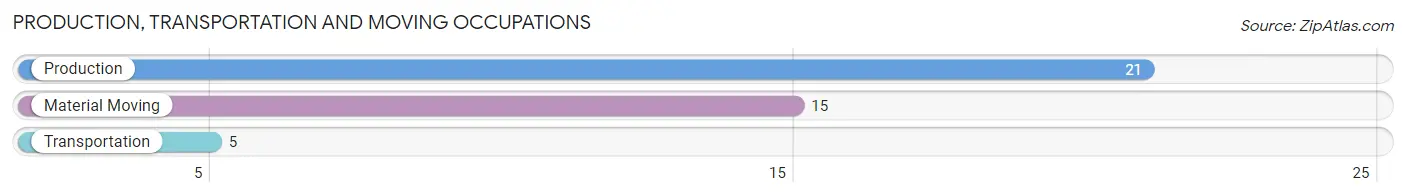
Production, Transportation and Moving Occupations
The most common Production, Transportation and Moving occupations in Beaumont are Production (21 | 6.9%), Material Moving (15 | 4.9%), and Transportation (5 | 1.6%).
Production, Transportation and Moving Occupations by Sex
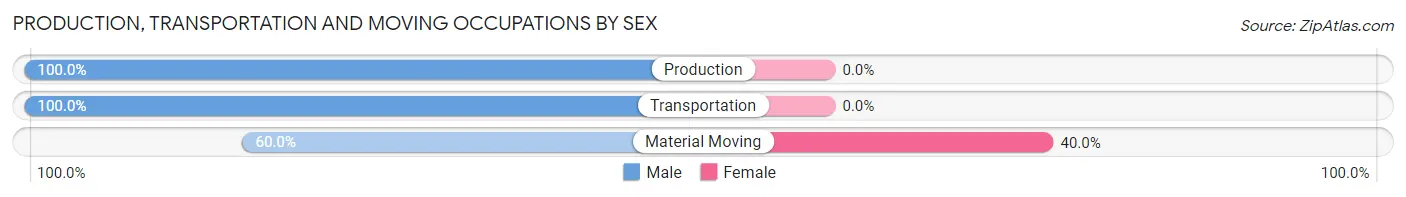
| Occupation | Male | Female |
| Production | 21 (100.0%) | 0 (0.0%) |
| Transportation | 5 (100.0%) | 0 (0.0%) |
| Material Moving | 9 (60.0%) | 6 (40.0%) |
| Total (Category) | 35 (85.4%) | 6 (14.6%) |
| Total (Overall) | 88 (28.8%) | 217 (71.2%) |
Employment Industries by Sex in Beaumont
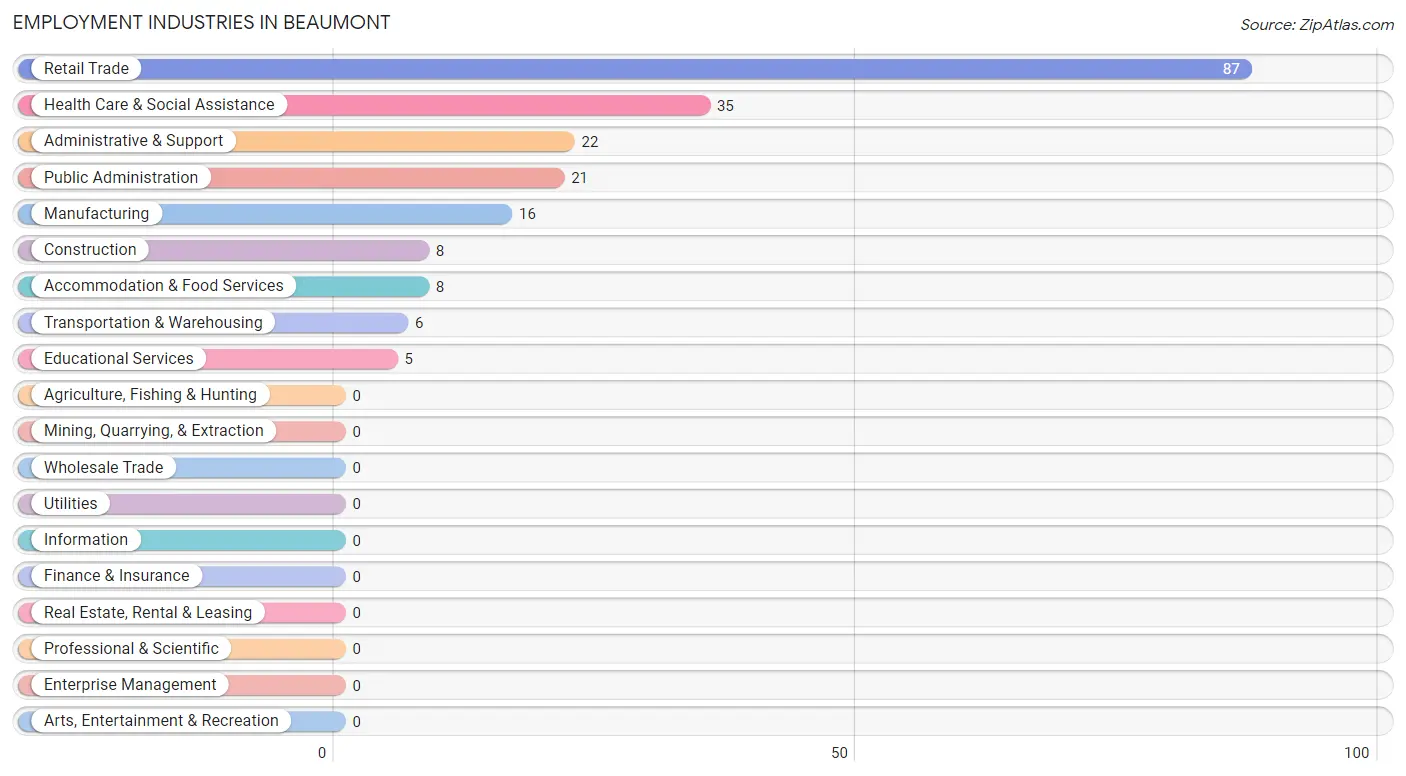
Employment Industries in Beaumont
The major employment industries in Beaumont include Retail Trade (87 | 28.5%), Health Care & Social Assistance (35 | 11.5%), Administrative & Support (22 | 7.2%), Public Administration (21 | 6.9%), and Manufacturing (16 | 5.2%).
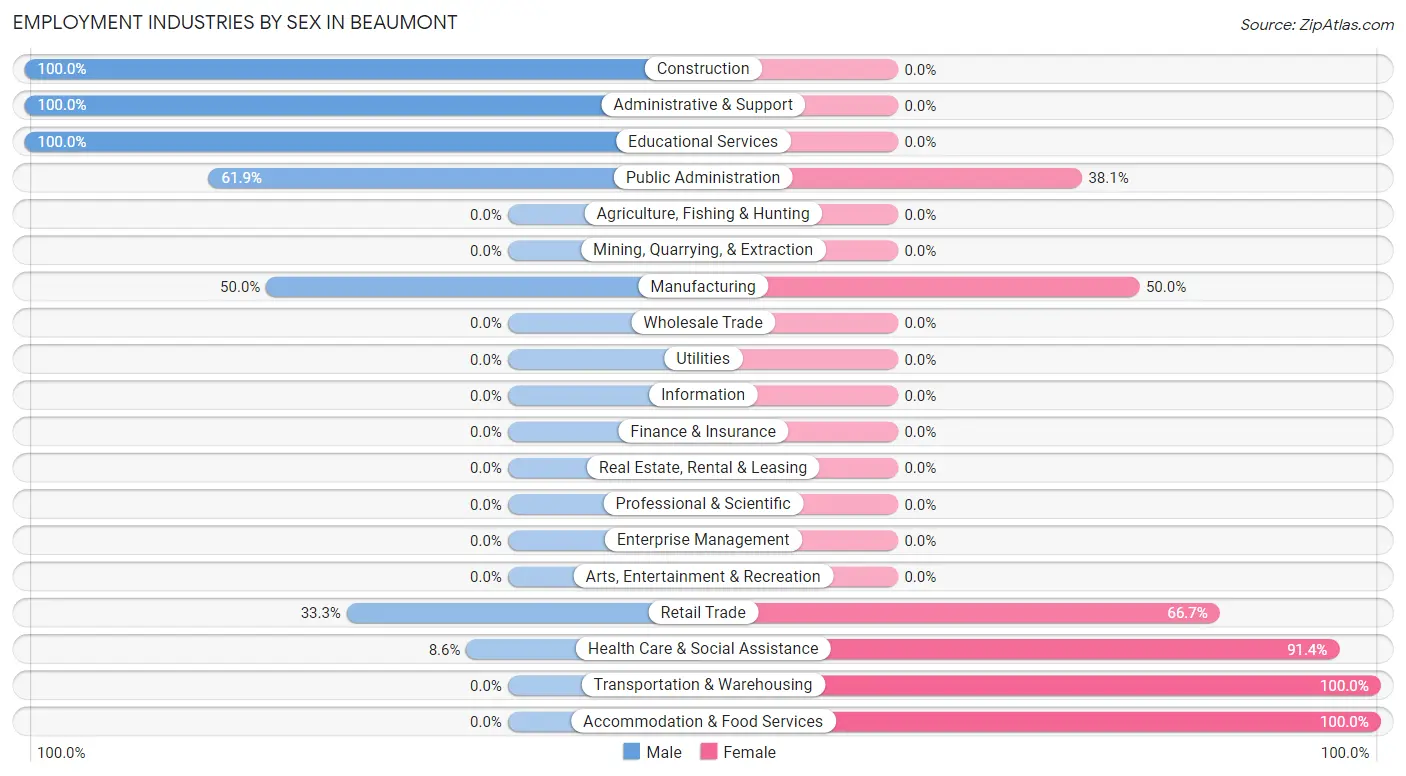
Employment Industries by Sex in Beaumont
The Beaumont industries that see more men than women are Construction (100.0%), Administrative & Support (100.0%), and Educational Services (100.0%), whereas the industries that tend to have a higher number of women are Transportation & Warehousing (100.0%), Accommodation & Food Services (100.0%), and Health Care & Social Assistance (91.4%).
| Industry | Male | Female |
| Agriculture, Fishing & Hunting | 0 (0.0%) | 0 (0.0%) |
| Mining, Quarrying, & Extraction | 0 (0.0%) | 0 (0.0%) |
| Construction | 8 (100.0%) | 0 (0.0%) |
| Manufacturing | 8 (50.0%) | 8 (50.0%) |
| Wholesale Trade | 0 (0.0%) | 0 (0.0%) |
| Retail Trade | 29 (33.3%) | 58 (66.7%) |
| Transportation & Warehousing | 0 (0.0%) | 6 (100.0%) |
| Utilities | 0 (0.0%) | 0 (0.0%) |
| Information | 0 (0.0%) | 0 (0.0%) |
| Finance & Insurance | 0 (0.0%) | 0 (0.0%) |
| Real Estate, Rental & Leasing | 0 (0.0%) | 0 (0.0%) |
| Professional & Scientific | 0 (0.0%) | 0 (0.0%) |
| Enterprise Management | 0 (0.0%) | 0 (0.0%) |
| Administrative & Support | 22 (100.0%) | 0 (0.0%) |
| Educational Services | 5 (100.0%) | 0 (0.0%) |
| Health Care & Social Assistance | 3 (8.6%) | 32 (91.4%) |
| Arts, Entertainment & Recreation | 0 (0.0%) | 0 (0.0%) |
| Accommodation & Food Services | 0 (0.0%) | 8 (100.0%) |
| Public Administration | 13 (61.9%) | 8 (38.1%) |
| Total | 88 (28.8%) | 217 (71.2%) |
Education in Beaumont
School Enrollment in Beaumont
The most common levels of schooling among the 36 students in Beaumont are middle school (14 | 38.9%), high school (12 | 33.3%), and elementary school (10 | 27.8%).
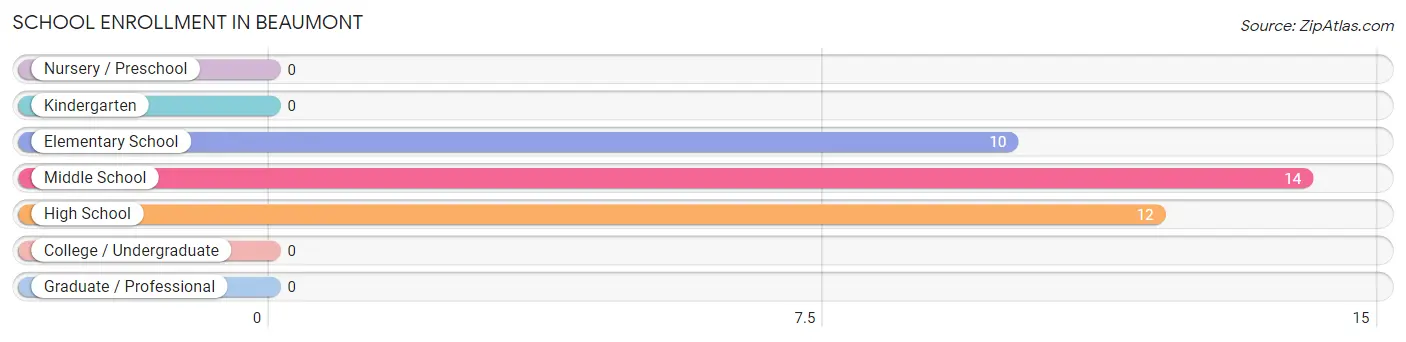
| School Level | # Students | % Students |
| Nursery / Preschool | 0 | 0.0% |
| Kindergarten | 0 | 0.0% |
| Elementary School | 10 | 27.8% |
| Middle School | 14 | 38.9% |
| High School | 12 | 33.3% |
| College / Undergraduate | 0 | 0.0% |
| Graduate / Professional | 0 | 0.0% |
| Total | 36 | 100.0% |
School Enrollment by Age by Funding Source in Beaumont
Out of a total of 36 students who are enrolled in schools in Beaumont, 7 (19.4%) attend a private institution, while the remaining 29 (80.6%) are enrolled in public schools. The age group of 15 to 17 year olds has the highest likelihood of being enrolled in private schools, with 7 (58.3% in the age bracket) enrolled. Conversely, the age group of 5 to 9 year old has the lowest likelihood of being enrolled in a private school, with 10 (100.0% in the age bracket) attending a public institution.
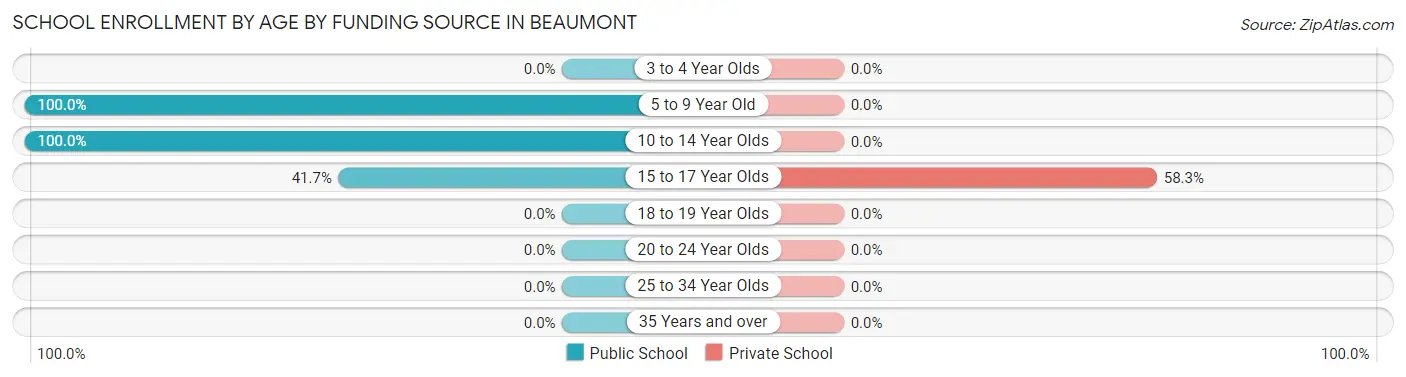
| Age Bracket | Public School | Private School |
| 3 to 4 Year Olds | 0 (0.0%) | 0 (0.0%) |
| 5 to 9 Year Old | 10 (100.0%) | 0 (0.0%) |
| 10 to 14 Year Olds | 14 (100.0%) | 0 (0.0%) |
| 15 to 17 Year Olds | 5 (41.7%) | 7 (58.3%) |
| 18 to 19 Year Olds | 0 (0.0%) | 0 (0.0%) |
| 20 to 24 Year Olds | 0 (0.0%) | 0 (0.0%) |
| 25 to 34 Year Olds | 0 (0.0%) | 0 (0.0%) |
| 35 Years and over | 0 (0.0%) | 0 (0.0%) |
| Total | 29 (80.6%) | 7 (19.4%) |
Educational Attainment by Field of Study in Beaumont
Business (16 | 51.6%), education (10 | 32.3%), science & technology (4 | 12.9%), and physical & health sciences (1 | 3.2%) are the most common fields of study among 31 individuals in Beaumont who have obtained a bachelor's degree or higher.
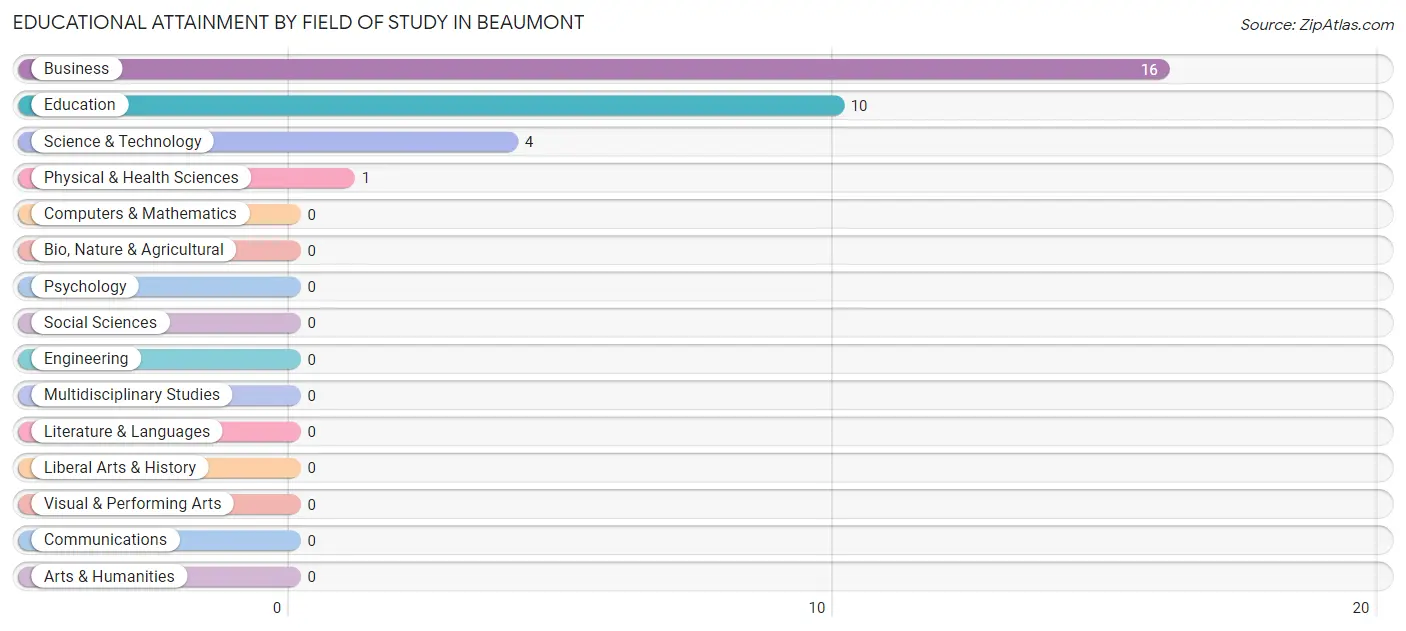
| Field of Study | # Graduates | % Graduates |
| Computers & Mathematics | 0 | 0.0% |
| Bio, Nature & Agricultural | 0 | 0.0% |
| Physical & Health Sciences | 1 | 3.2% |
| Psychology | 0 | 0.0% |
| Social Sciences | 0 | 0.0% |
| Engineering | 0 | 0.0% |
| Multidisciplinary Studies | 0 | 0.0% |
| Science & Technology | 4 | 12.9% |
| Business | 16 | 51.6% |
| Education | 10 | 32.3% |
| Literature & Languages | 0 | 0.0% |
| Liberal Arts & History | 0 | 0.0% |
| Visual & Performing Arts | 0 | 0.0% |
| Communications | 0 | 0.0% |
| Arts & Humanities | 0 | 0.0% |
| Total | 31 | 100.0% |
Transportation & Commute in Beaumont
Vehicle Availability by Sex in Beaumont
The most prevalent vehicle ownership categories in Beaumont are males with 3 vehicles (221, accounting for 75.2%) and females with 3 vehicles (61, making up 178.2%).
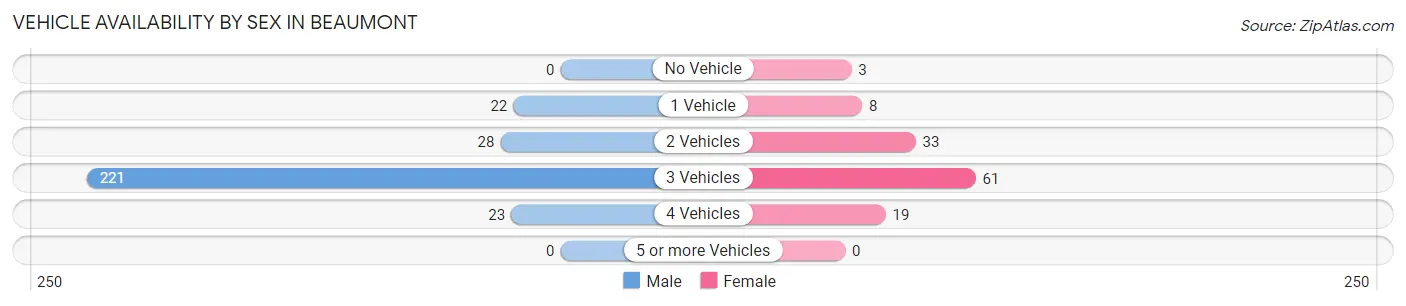
| Vehicles Available | Male | Female |
| No Vehicle | 0 (0.0%) | 3 (2.4%) |
| 1 Vehicle | 22 (7.5%) | 8 (6.5%) |
| 2 Vehicles | 28 (9.5%) | 33 (26.6%) |
| 3 Vehicles | 221 (75.2%) | 61 (49.2%) |
| 4 Vehicles | 23 (7.8%) | 19 (15.3%) |
| 5 or more Vehicles | 0 (0.0%) | 0 (0.0%) |
| Total | 294 (100.0%) | 124 (100.0%) |
Commute Time in Beaumont
The most frequently occuring commute durations in Beaumont are 5 to 9 minutes (227 commuters, 54.3%), less than 5 minutes (63 commuters, 15.1%), and 20 to 24 minutes (30 commuters, 7.2%).
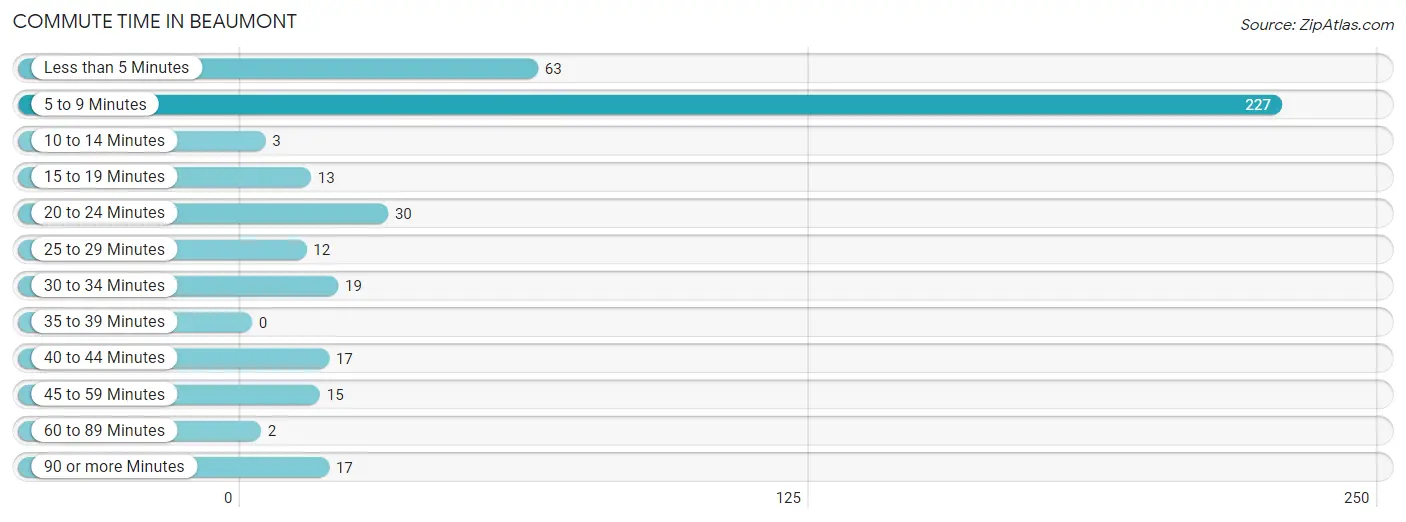
| Commute Time | # Commuters | % Commuters |
| Less than 5 Minutes | 63 | 15.1% |
| 5 to 9 Minutes | 227 | 54.3% |
| 10 to 14 Minutes | 3 | 0.7% |
| 15 to 19 Minutes | 13 | 3.1% |
| 20 to 24 Minutes | 30 | 7.2% |
| 25 to 29 Minutes | 12 | 2.9% |
| 30 to 34 Minutes | 19 | 4.5% |
| 35 to 39 Minutes | 0 | 0.0% |
| 40 to 44 Minutes | 17 | 4.1% |
| 45 to 59 Minutes | 15 | 3.6% |
| 60 to 89 Minutes | 2 | 0.5% |
| 90 or more Minutes | 17 | 4.1% |
Commute Time by Sex in Beaumont
The most common commute times in Beaumont are 5 to 9 minutes (211 commuters, 71.8%) for males and less than 5 minutes (50 commuters, 40.3%) for females.
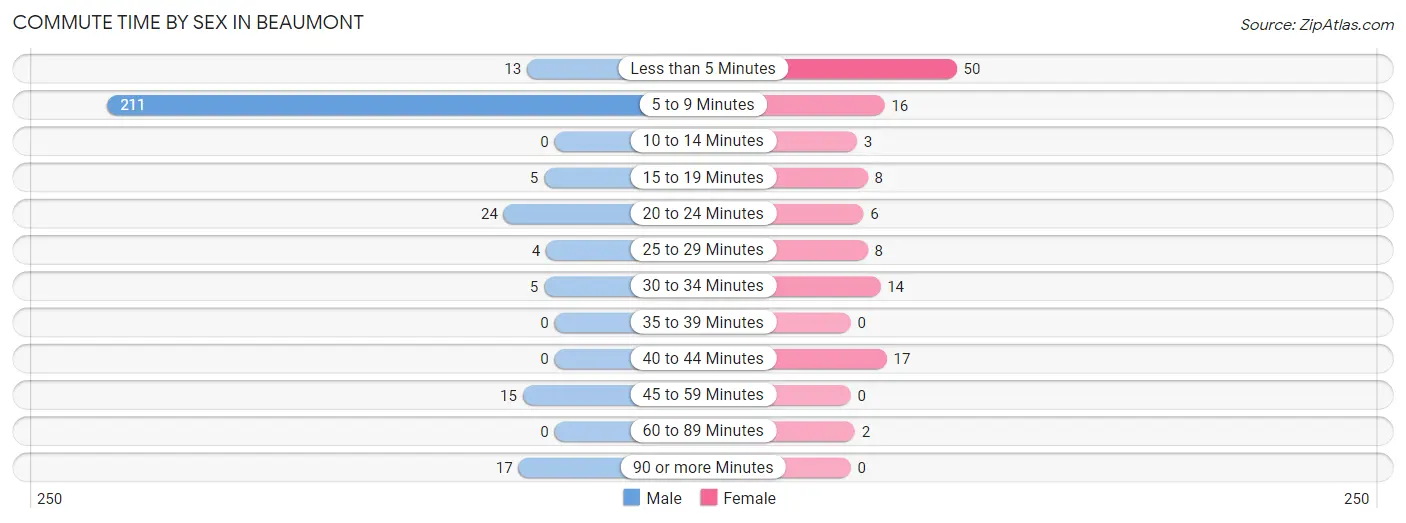
| Commute Time | Male | Female |
| Less than 5 Minutes | 13 (4.4%) | 50 (40.3%) |
| 5 to 9 Minutes | 211 (71.8%) | 16 (12.9%) |
| 10 to 14 Minutes | 0 (0.0%) | 3 (2.4%) |
| 15 to 19 Minutes | 5 (1.7%) | 8 (6.5%) |
| 20 to 24 Minutes | 24 (8.2%) | 6 (4.8%) |
| 25 to 29 Minutes | 4 (1.4%) | 8 (6.5%) |
| 30 to 34 Minutes | 5 (1.7%) | 14 (11.3%) |
| 35 to 39 Minutes | 0 (0.0%) | 0 (0.0%) |
| 40 to 44 Minutes | 0 (0.0%) | 17 (13.7%) |
| 45 to 59 Minutes | 15 (5.1%) | 0 (0.0%) |
| 60 to 89 Minutes | 0 (0.0%) | 2 (1.6%) |
| 90 or more Minutes | 17 (5.8%) | 0 (0.0%) |
Time of Departure to Work by Sex in Beaumont
The most frequent times of departure to work in Beaumont are 4:00 PM to 11:59 PM (206, 70.1%) for males and 7:00 AM to 7:29 AM (53, 42.7%) for females.
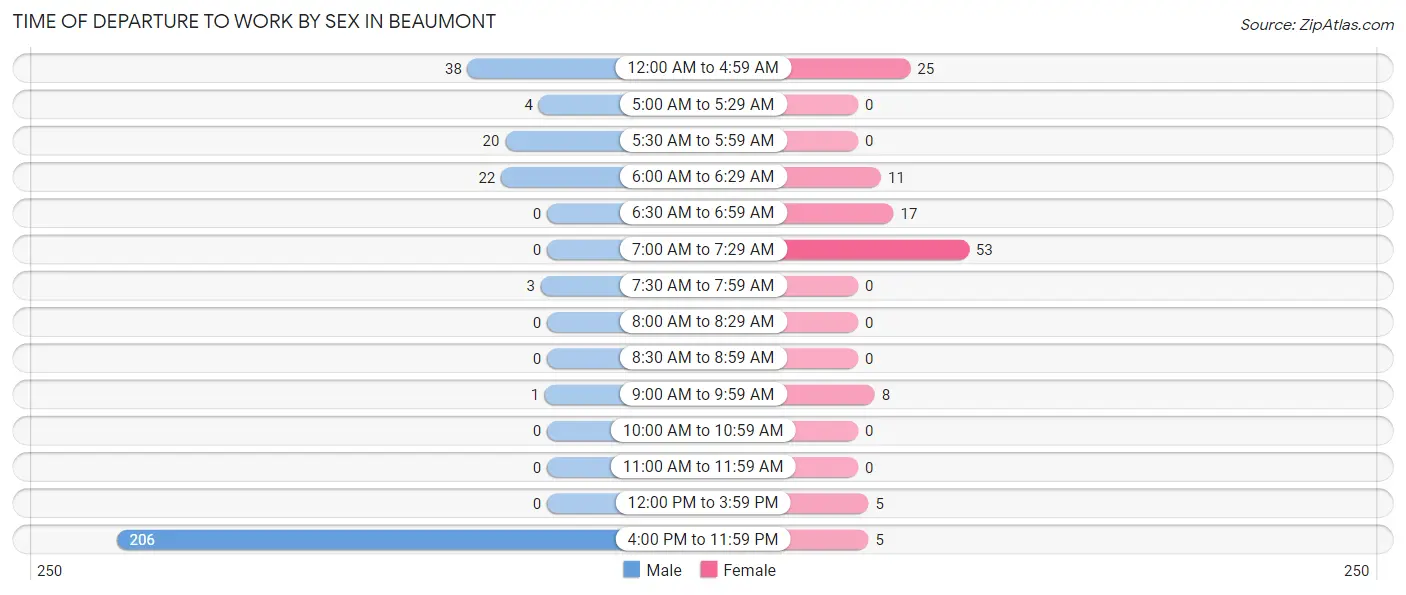
| Time of Departure | Male | Female |
| 12:00 AM to 4:59 AM | 38 (12.9%) | 25 (20.2%) |
| 5:00 AM to 5:29 AM | 4 (1.4%) | 0 (0.0%) |
| 5:30 AM to 5:59 AM | 20 (6.8%) | 0 (0.0%) |
| 6:00 AM to 6:29 AM | 22 (7.5%) | 11 (8.9%) |
| 6:30 AM to 6:59 AM | 0 (0.0%) | 17 (13.7%) |
| 7:00 AM to 7:29 AM | 0 (0.0%) | 53 (42.7%) |
| 7:30 AM to 7:59 AM | 3 (1.0%) | 0 (0.0%) |
| 8:00 AM to 8:29 AM | 0 (0.0%) | 0 (0.0%) |
| 8:30 AM to 8:59 AM | 0 (0.0%) | 0 (0.0%) |
| 9:00 AM to 9:59 AM | 1 (0.3%) | 8 (6.5%) |
| 10:00 AM to 10:59 AM | 0 (0.0%) | 0 (0.0%) |
| 11:00 AM to 11:59 AM | 0 (0.0%) | 0 (0.0%) |
| 12:00 PM to 3:59 PM | 0 (0.0%) | 5 (4.0%) |
| 4:00 PM to 11:59 PM | 206 (70.1%) | 5 (4.0%) |
| Total | 294 (100.0%) | 124 (100.0%) |
Housing Occupancy in Beaumont
Occupancy by Ownership in Beaumont
Of the total 462 dwellings in Beaumont, owner-occupied units account for 373 (80.7%), while renter-occupied units make up 89 (19.3%).
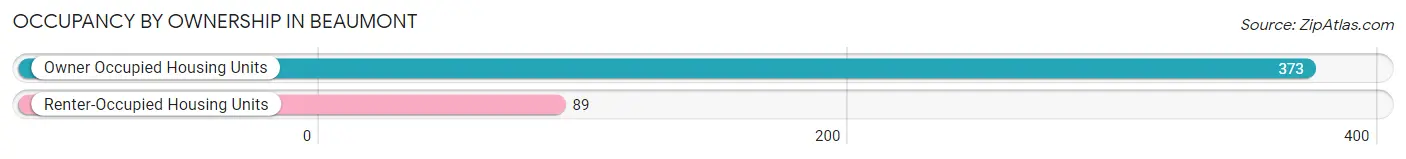
| Occupancy | # Housing Units | % Housing Units |
| Owner Occupied Housing Units | 373 | 80.7% |
| Renter-Occupied Housing Units | 89 | 19.3% |
| Total Occupied Housing Units | 462 | 100.0% |
Occupancy by Household Size in Beaumont
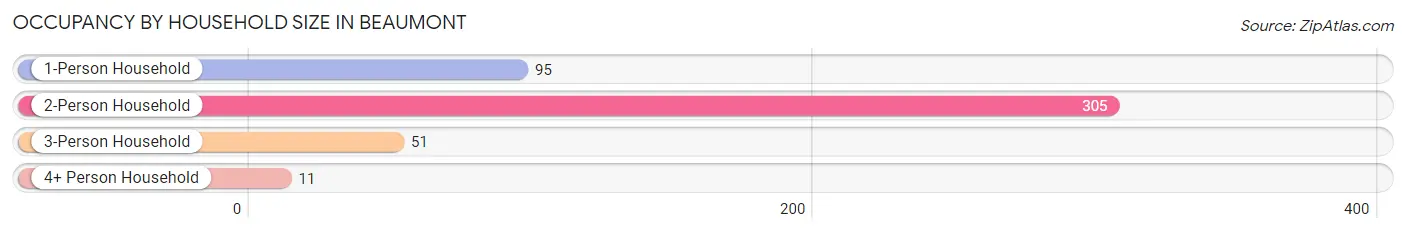
| Household Size | # Housing Units | % Housing Units |
| 1-Person Household | 95 | 20.6% |
| 2-Person Household | 305 | 66.0% |
| 3-Person Household | 51 | 11.0% |
| 4+ Person Household | 11 | 2.4% |
| Total Housing Units | 462 | 100.0% |
Occupancy by Ownership by Household Size in Beaumont
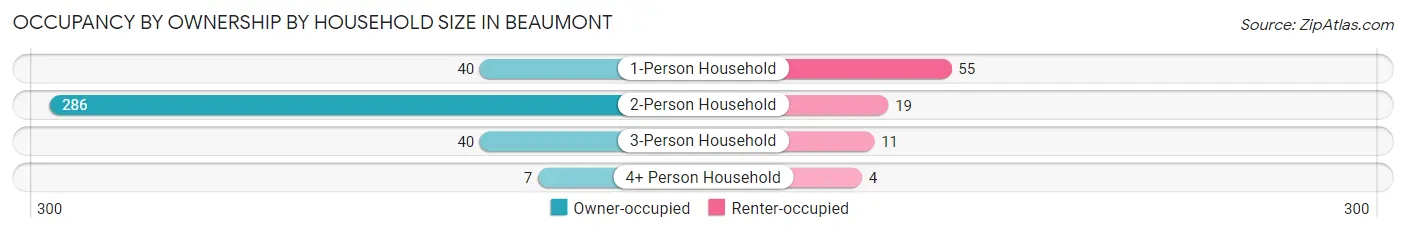
| Household Size | Owner-occupied | Renter-occupied |
| 1-Person Household | 40 (42.1%) | 55 (57.9%) |
| 2-Person Household | 286 (93.8%) | 19 (6.2%) |
| 3-Person Household | 40 (78.4%) | 11 (21.6%) |
| 4+ Person Household | 7 (63.6%) | 4 (36.4%) |
| Total Housing Units | 373 (80.7%) | 89 (19.3%) |
Occupancy by Educational Attainment in Beaumont
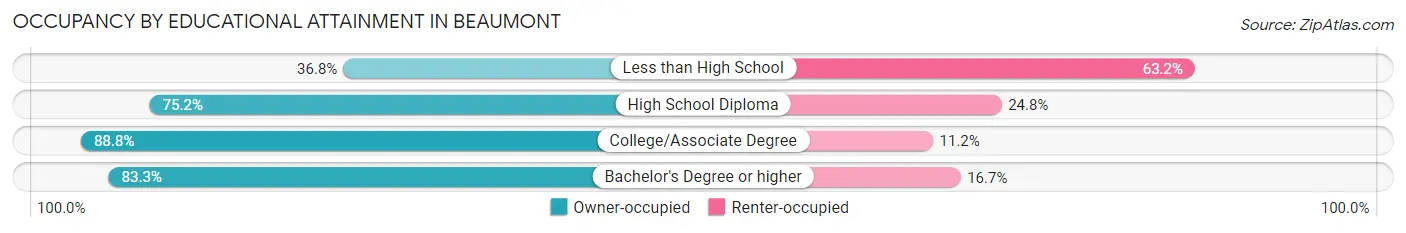
| Household Size | Owner-occupied | Renter-occupied |
| Less than High School | 14 (36.8%) | 24 (63.2%) |
| High School Diploma | 88 (75.2%) | 29 (24.8%) |
| College/Associate Degree | 246 (88.8%) | 31 (11.2%) |
| Bachelor's Degree or higher | 25 (83.3%) | 5 (16.7%) |
Occupancy by Age of Householder in Beaumont
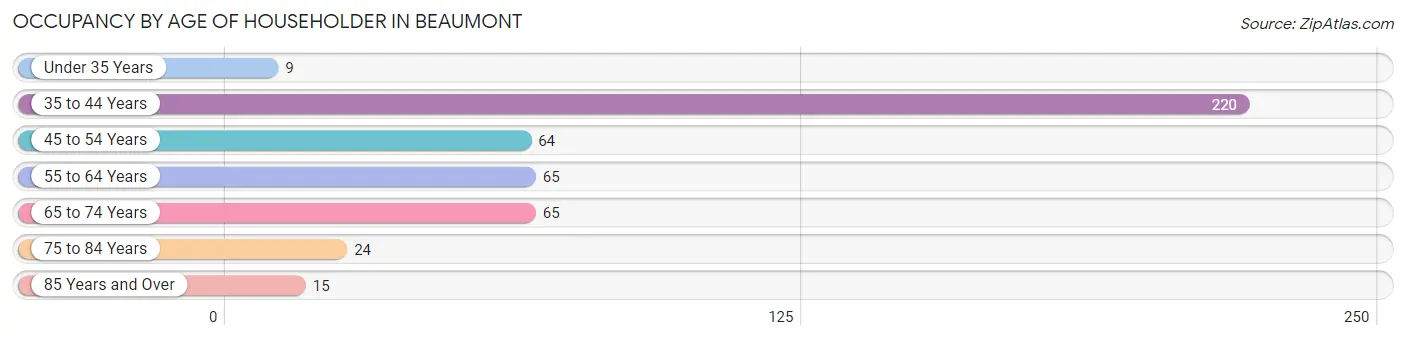
| Age Bracket | # Households | % Households |
| Under 35 Years | 9 | 1.9% |
| 35 to 44 Years | 220 | 47.6% |
| 45 to 54 Years | 64 | 13.9% |
| 55 to 64 Years | 65 | 14.1% |
| 65 to 74 Years | 65 | 14.1% |
| 75 to 84 Years | 24 | 5.2% |
| 85 Years and Over | 15 | 3.3% |
| Total | 462 | 100.0% |
Housing Finances in Beaumont
Median Income by Occupancy in Beaumont
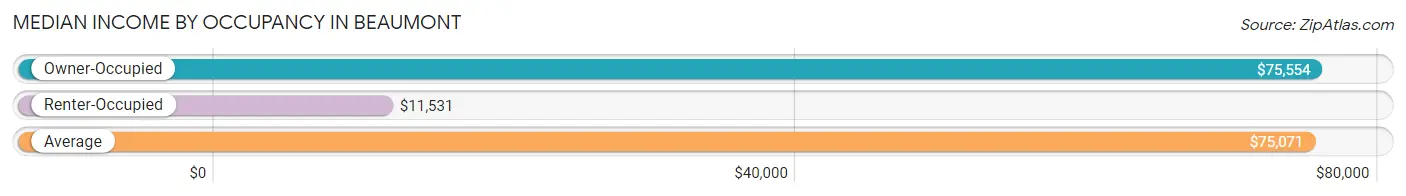
| Occupancy Type | # Households | Median Income |
| Owner-Occupied | 373 (80.7%) | $75,554 |
| Renter-Occupied | 89 (19.3%) | $11,531 |
| Average | 462 (100.0%) | $75,071 |
Occupancy by Householder Income Bracket in Beaumont
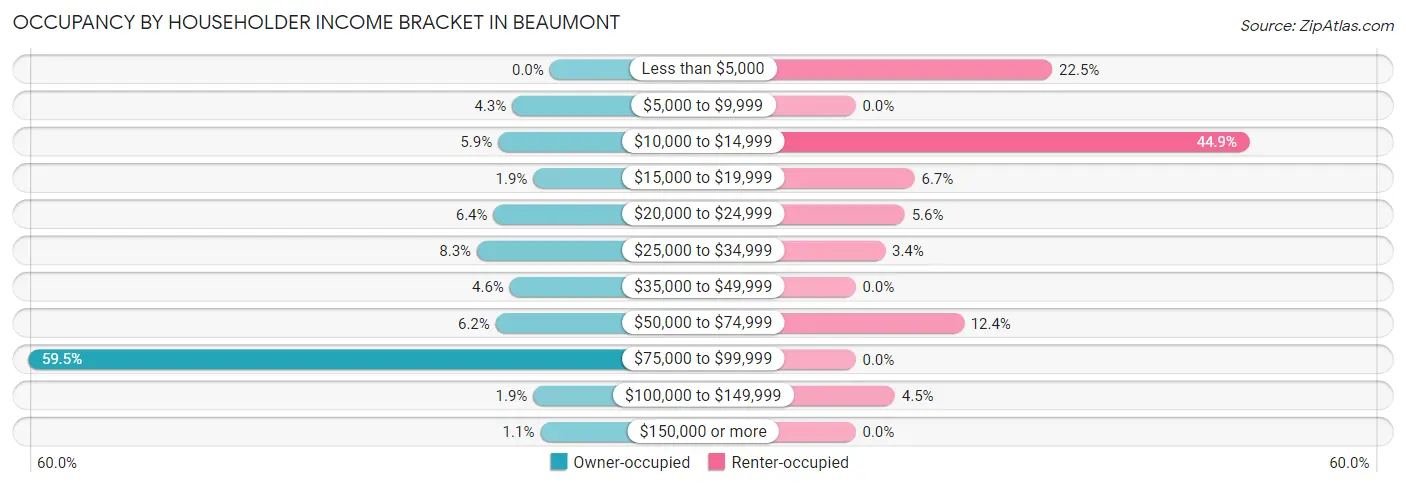
| Income Bracket | Owner-occupied | Renter-occupied |
| Less than $5,000 | 0 (0.0%) | 20 (22.5%) |
| $5,000 to $9,999 | 16 (4.3%) | 0 (0.0%) |
| $10,000 to $14,999 | 22 (5.9%) | 40 (44.9%) |
| $15,000 to $19,999 | 7 (1.9%) | 6 (6.7%) |
| $20,000 to $24,999 | 24 (6.4%) | 5 (5.6%) |
| $25,000 to $34,999 | 31 (8.3%) | 3 (3.4%) |
| $35,000 to $49,999 | 17 (4.6%) | 0 (0.0%) |
| $50,000 to $74,999 | 23 (6.2%) | 11 (12.4%) |
| $75,000 to $99,999 | 222 (59.5%) | 0 (0.0%) |
| $100,000 to $149,999 | 7 (1.9%) | 4 (4.5%) |
| $150,000 or more | 4 (1.1%) | 0 (0.0%) |
| Total | 373 (100.0%) | 89 (100.0%) |
Monthly Housing Cost Tiers in Beaumont
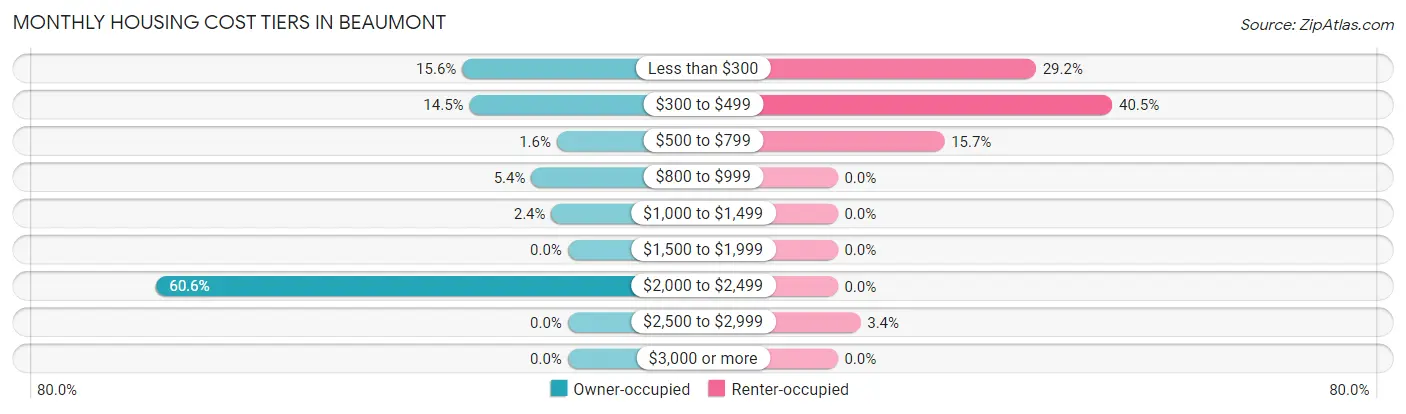
| Monthly Cost | Owner-occupied | Renter-occupied |
| Less than $300 | 58 (15.5%) | 26 (29.2%) |
| $300 to $499 | 54 (14.5%) | 36 (40.5%) |
| $500 to $799 | 6 (1.6%) | 14 (15.7%) |
| $800 to $999 | 20 (5.4%) | 0 (0.0%) |
| $1,000 to $1,499 | 9 (2.4%) | 0 (0.0%) |
| $1,500 to $1,999 | 0 (0.0%) | 0 (0.0%) |
| $2,000 to $2,499 | 226 (60.6%) | 0 (0.0%) |
| $2,500 to $2,999 | 0 (0.0%) | 3 (3.4%) |
| $3,000 or more | 0 (0.0%) | 0 (0.0%) |
| Total | 373 (100.0%) | 89 (100.0%) |
Physical Housing Characteristics in Beaumont
Housing Structures in Beaumont
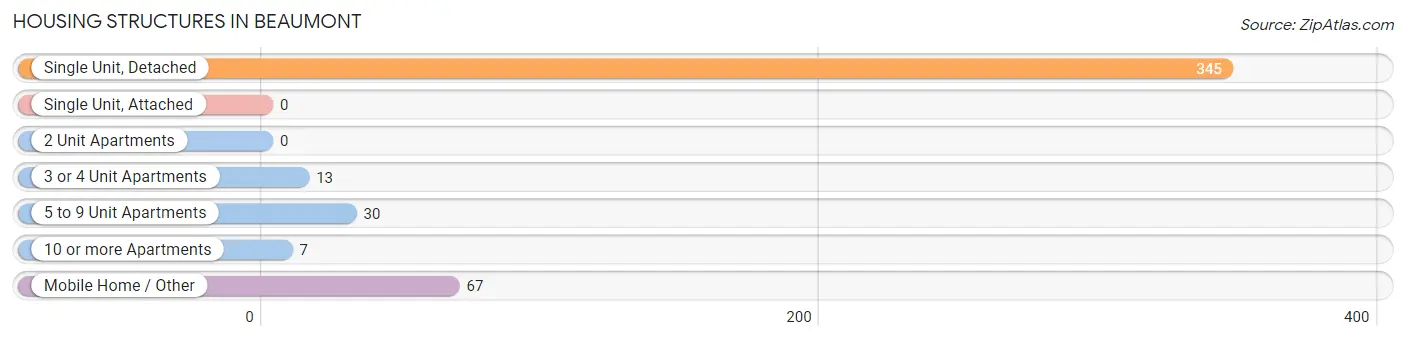
| Structure Type | # Housing Units | % Housing Units |
| Single Unit, Detached | 345 | 74.7% |
| Single Unit, Attached | 0 | 0.0% |
| 2 Unit Apartments | 0 | 0.0% |
| 3 or 4 Unit Apartments | 13 | 2.8% |
| 5 to 9 Unit Apartments | 30 | 6.5% |
| 10 or more Apartments | 7 | 1.5% |
| Mobile Home / Other | 67 | 14.5% |
| Total | 462 | 100.0% |
Housing Structures by Occupancy in Beaumont
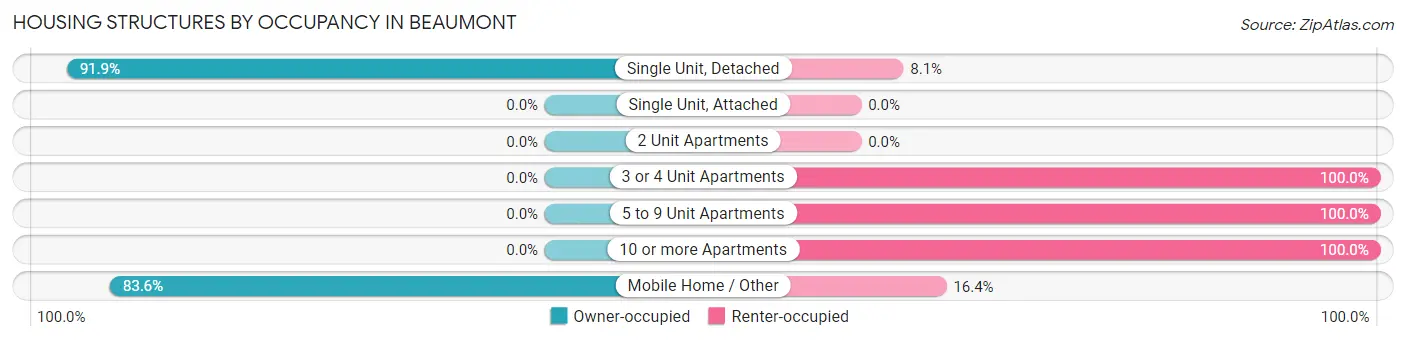
| Structure Type | Owner-occupied | Renter-occupied |
| Single Unit, Detached | 317 (91.9%) | 28 (8.1%) |
| Single Unit, Attached | 0 (0.0%) | 0 (0.0%) |
| 2 Unit Apartments | 0 (0.0%) | 0 (0.0%) |
| 3 or 4 Unit Apartments | 0 (0.0%) | 13 (100.0%) |
| 5 to 9 Unit Apartments | 0 (0.0%) | 30 (100.0%) |
| 10 or more Apartments | 0 (0.0%) | 7 (100.0%) |
| Mobile Home / Other | 56 (83.6%) | 11 (16.4%) |
| Total | 373 (80.7%) | 89 (19.3%) |
Housing Structures by Number of Rooms in Beaumont
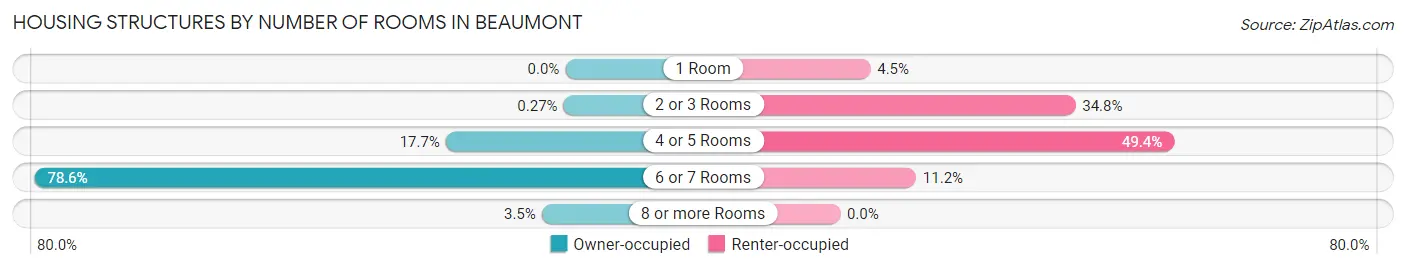
| Number of Rooms | Owner-occupied | Renter-occupied |
| 1 Room | 0 (0.0%) | 4 (4.5%) |
| 2 or 3 Rooms | 1 (0.3%) | 31 (34.8%) |
| 4 or 5 Rooms | 66 (17.7%) | 44 (49.4%) |
| 6 or 7 Rooms | 293 (78.5%) | 10 (11.2%) |
| 8 or more Rooms | 13 (3.5%) | 0 (0.0%) |
| Total | 373 (100.0%) | 89 (100.0%) |
Housing Structure by Heating Type in Beaumont
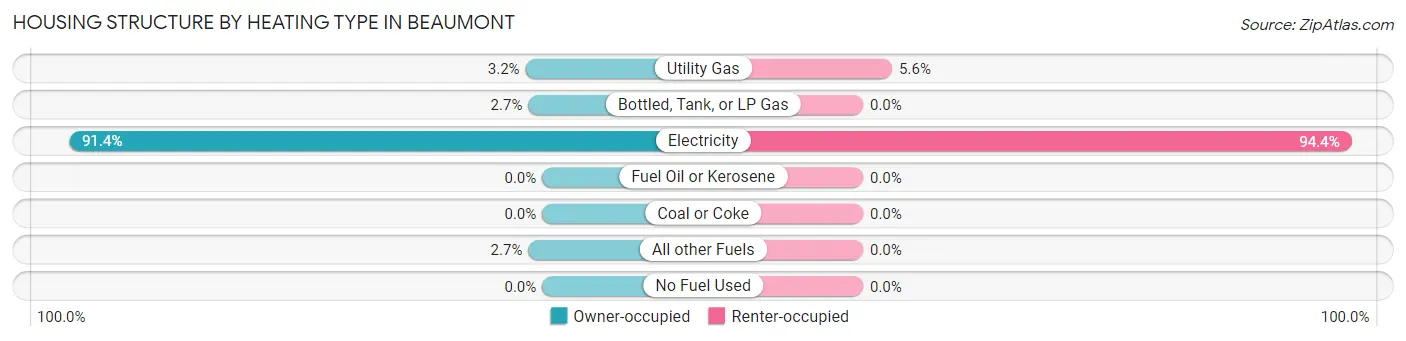
| Heating Type | Owner-occupied | Renter-occupied |
| Utility Gas | 12 (3.2%) | 5 (5.6%) |
| Bottled, Tank, or LP Gas | 10 (2.7%) | 0 (0.0%) |
| Electricity | 341 (91.4%) | 84 (94.4%) |
| Fuel Oil or Kerosene | 0 (0.0%) | 0 (0.0%) |
| Coal or Coke | 0 (0.0%) | 0 (0.0%) |
| All other Fuels | 10 (2.7%) | 0 (0.0%) |
| No Fuel Used | 0 (0.0%) | 0 (0.0%) |
| Total | 373 (100.0%) | 89 (100.0%) |
Household Vehicle Usage in Beaumont
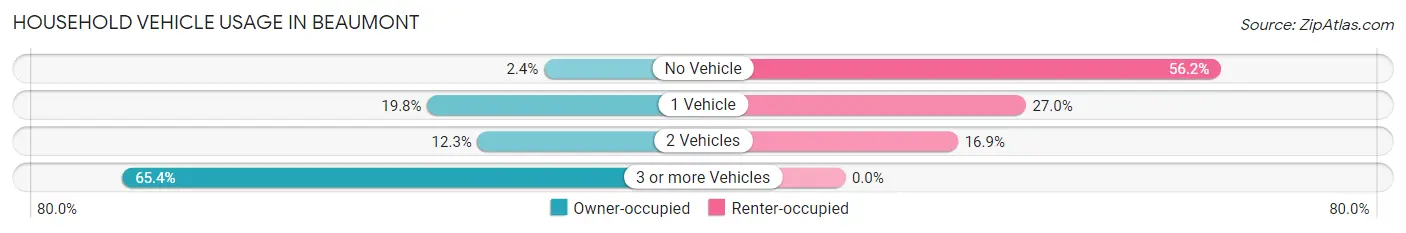
| Vehicles per Household | Owner-occupied | Renter-occupied |
| No Vehicle | 9 (2.4%) | 50 (56.2%) |
| 1 Vehicle | 74 (19.8%) | 24 (27.0%) |
| 2 Vehicles | 46 (12.3%) | 15 (16.9%) |
| 3 or more Vehicles | 244 (65.4%) | 0 (0.0%) |
| Total | 373 (100.0%) | 89 (100.0%) |
Real Estate & Mortgages in Beaumont
Real Estate and Mortgage Overview in Beaumont
| Characteristic | Without Mortgage | With Mortgage |
| Housing Units | 109 | 264 |
| Median Property Value | $70,400 | $223,500 |
| Median Household Income | $31,458 | $4 |
| Monthly Housing Costs | $265 | $0 |
| Real Estate Taxes | - | - |
Property Value by Mortgage Status in Beaumont
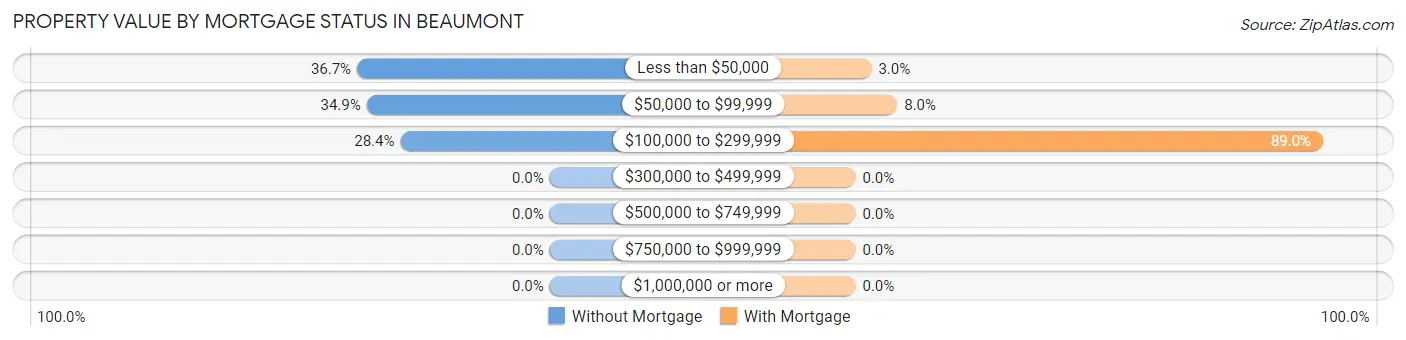
| Property Value | Without Mortgage | With Mortgage |
| Less than $50,000 | 40 (36.7%) | 8 (3.0%) |
| $50,000 to $99,999 | 38 (34.9%) | 21 (8.0%) |
| $100,000 to $299,999 | 31 (28.4%) | 235 (89.0%) |
| $300,000 to $499,999 | 0 (0.0%) | 0 (0.0%) |
| $500,000 to $749,999 | 0 (0.0%) | 0 (0.0%) |
| $750,000 to $999,999 | 0 (0.0%) | 0 (0.0%) |
| $1,000,000 or more | 0 (0.0%) | 0 (0.0%) |
| Total | 109 (100.0%) | 264 (100.0%) |
Household Income by Mortgage Status in Beaumont
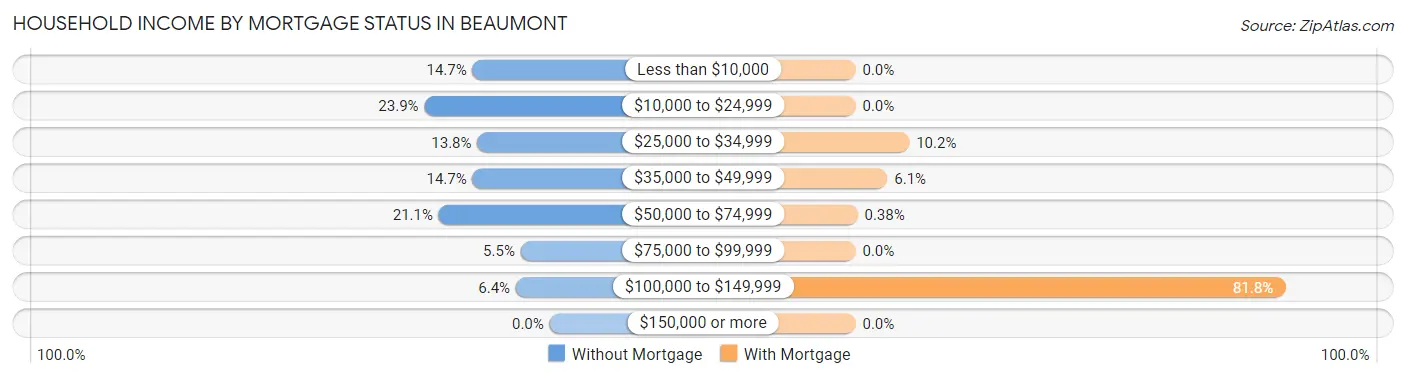
| Household Income | Without Mortgage | With Mortgage |
| Less than $10,000 | 16 (14.7%) | 0 (0.0%) |
| $10,000 to $24,999 | 26 (23.8%) | 0 (0.0%) |
| $25,000 to $34,999 | 15 (13.8%) | 27 (10.2%) |
| $35,000 to $49,999 | 16 (14.7%) | 16 (6.1%) |
| $50,000 to $74,999 | 23 (21.1%) | 1 (0.4%) |
| $75,000 to $99,999 | 6 (5.5%) | 0 (0.0%) |
| $100,000 to $149,999 | 7 (6.4%) | 216 (81.8%) |
| $150,000 or more | 0 (0.0%) | 0 (0.0%) |
| Total | 109 (100.0%) | 264 (100.0%) |
Property Value to Household Income Ratio in Beaumont
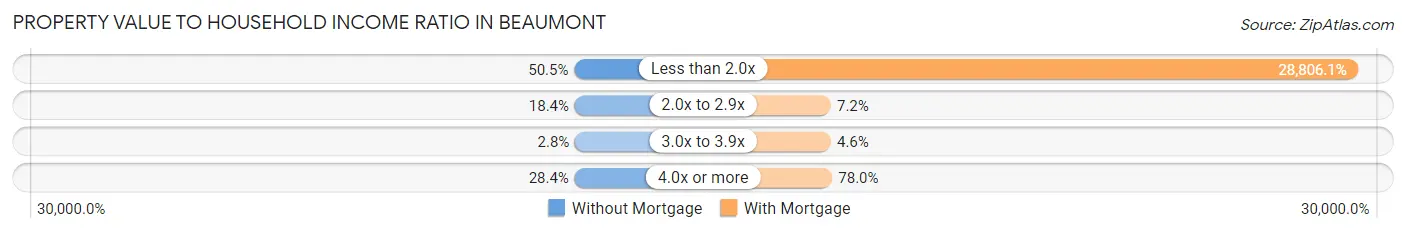
| Value-to-Income Ratio | Without Mortgage | With Mortgage |
| Less than 2.0x | 55 (50.5%) | 76,048 (28,806.1%) |
| 2.0x to 2.9x | 20 (18.3%) | 19 (7.2%) |
| 3.0x to 3.9x | 3 (2.8%) | 12 (4.5%) |
| 4.0x or more | 31 (28.4%) | 206 (78.0%) |
| Total | 109 (100.0%) | 264 (100.0%) |
Real Estate Taxes by Mortgage Status in Beaumont
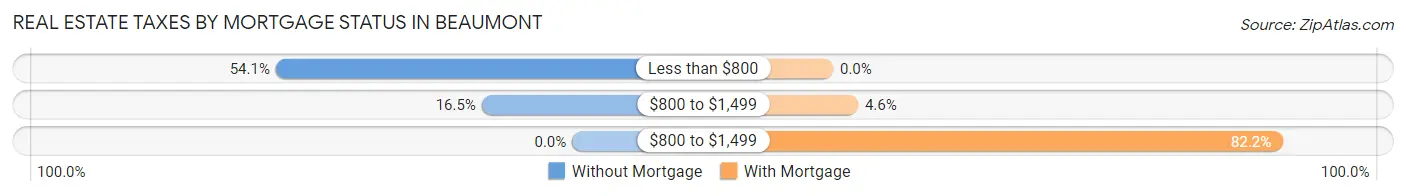
| Property Taxes | Without Mortgage | With Mortgage |
| Less than $800 | 59 (54.1%) | 0 (0.0%) |
| $800 to $1,499 | 18 (16.5%) | 12 (4.5%) |
| $800 to $1,499 | 0 (0.0%) | 217 (82.2%) |
| Total | 109 (100.0%) | 264 (100.0%) |
Health & Disability in Beaumont
Health Insurance Coverage by Age in Beaumont
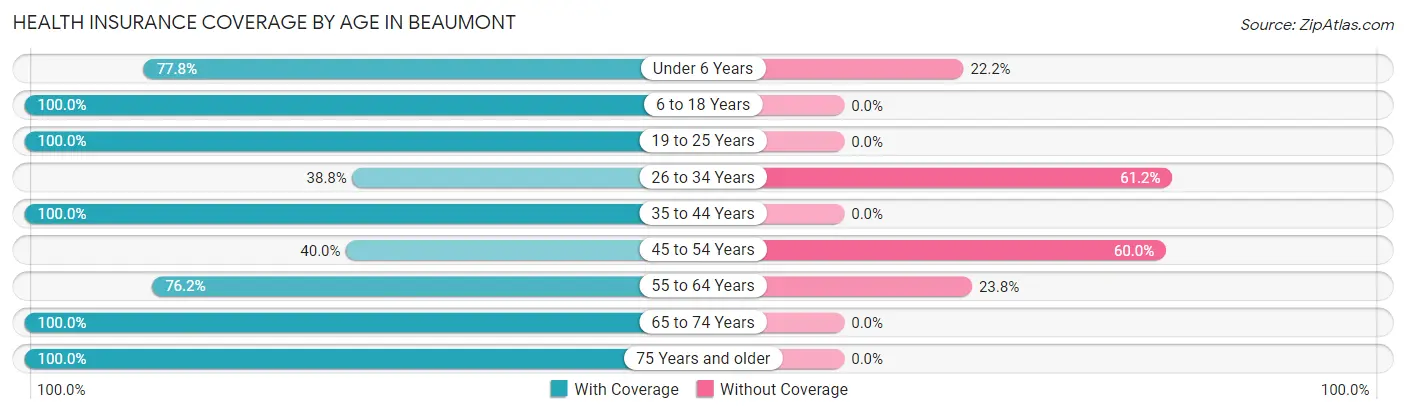
| Age Bracket | With Coverage | Without Coverage |
| Under 6 Years | 7 (77.8%) | 2 (22.2%) |
| 6 to 18 Years | 36 (100.0%) | 0 (0.0%) |
| 19 to 25 Years | 1 (100.0%) | 0 (0.0%) |
| 26 to 34 Years | 40 (38.8%) | 63 (61.2%) |
| 35 to 44 Years | 62 (100.0%) | 0 (0.0%) |
| 45 to 54 Years | 76 (40.0%) | 114 (60.0%) |
| 55 to 64 Years | 96 (76.2%) | 30 (23.8%) |
| 65 to 74 Years | 74 (100.0%) | 0 (0.0%) |
| 75 Years and older | 50 (100.0%) | 0 (0.0%) |
| Total | 442 (67.9%) | 209 (32.1%) |
Health Insurance Coverage by Citizenship Status in Beaumont
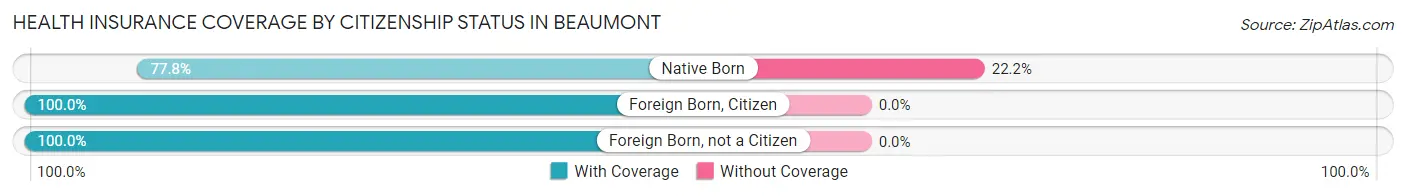
| Citizenship Status | With Coverage | Without Coverage |
| Native Born | 7 (77.8%) | 2 (22.2%) |
| Foreign Born, Citizen | 36 (100.0%) | 0 (0.0%) |
| Foreign Born, not a Citizen | 1 (100.0%) | 0 (0.0%) |
Health Insurance Coverage by Household Income in Beaumont
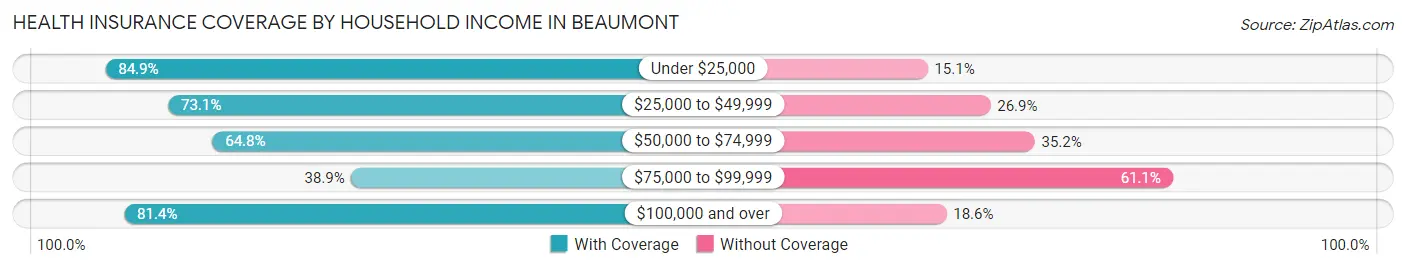
| Household Income | With Coverage | Without Coverage |
| Under $25,000 | 174 (84.9%) | 31 (15.1%) |
| $25,000 to $49,999 | 68 (73.1%) | 25 (26.9%) |
| $50,000 to $74,999 | 94 (64.8%) | 51 (35.2%) |
| $75,000 to $99,999 | 58 (38.9%) | 91 (61.1%) |
| $100,000 and over | 48 (81.4%) | 11 (18.6%) |
Public vs Private Health Insurance Coverage by Age in Beaumont
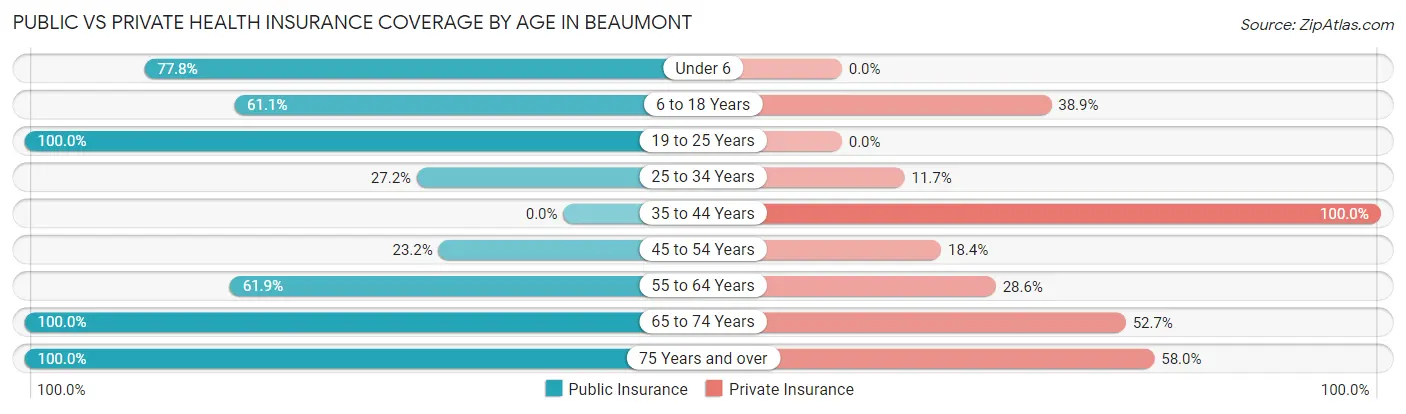
| Age Bracket | Public Insurance | Private Insurance |
| Under 6 | 7 (77.8%) | 0 (0.0%) |
| 6 to 18 Years | 22 (61.1%) | 14 (38.9%) |
| 19 to 25 Years | 1 (100.0%) | 0 (0.0%) |
| 25 to 34 Years | 28 (27.2%) | 12 (11.7%) |
| 35 to 44 Years | 0 (0.0%) | 62 (100.0%) |
| 45 to 54 Years | 44 (23.2%) | 35 (18.4%) |
| 55 to 64 Years | 78 (61.9%) | 36 (28.6%) |
| 65 to 74 Years | 74 (100.0%) | 39 (52.7%) |
| 75 Years and over | 50 (100.0%) | 29 (58.0%) |
| Total | 304 (46.7%) | 227 (34.9%) |
Disability Status by Sex by Age in Beaumont
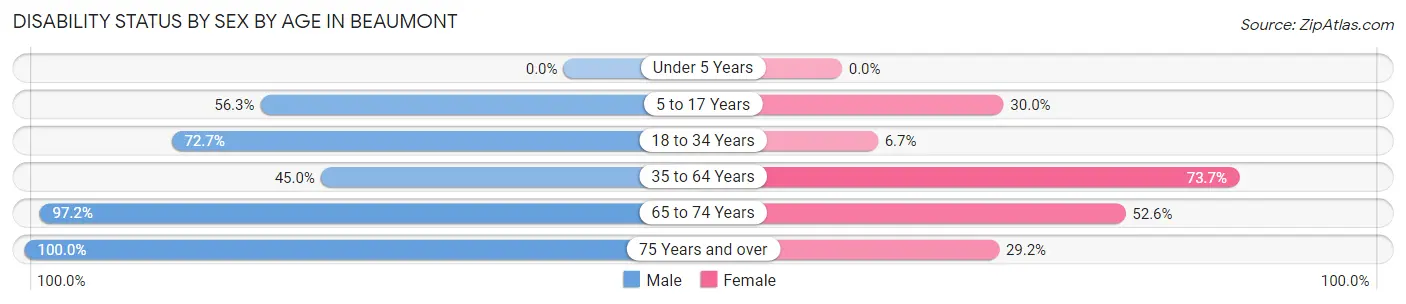
| Age Bracket | Male | Female |
| Under 5 Years | 0 (0.0%) | 0 (0.0%) |
| 5 to 17 Years | 9 (56.2%) | 6 (30.0%) |
| 18 to 34 Years | 32 (72.7%) | 4 (6.7%) |
| 35 to 64 Years | 59 (45.0%) | 182 (73.7%) |
| 65 to 74 Years | 35 (97.2%) | 20 (52.6%) |
| 75 Years and over | 26 (100.0%) | 7 (29.2%) |
Disability Class by Sex by Age in Beaumont
Disability Class: Hearing Difficulty
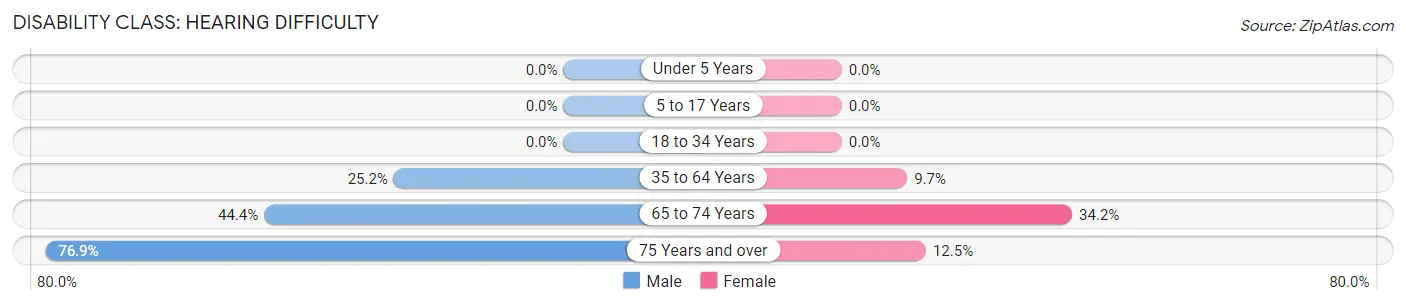
| Age Bracket | Male | Female |
| Under 5 Years | 0 (0.0%) | 0 (0.0%) |
| 5 to 17 Years | 0 (0.0%) | 0 (0.0%) |
| 18 to 34 Years | 0 (0.0%) | 0 (0.0%) |
| 35 to 64 Years | 33 (25.2%) | 24 (9.7%) |
| 65 to 74 Years | 16 (44.4%) | 13 (34.2%) |
| 75 Years and over | 20 (76.9%) | 3 (12.5%) |
Disability Class: Vision Difficulty
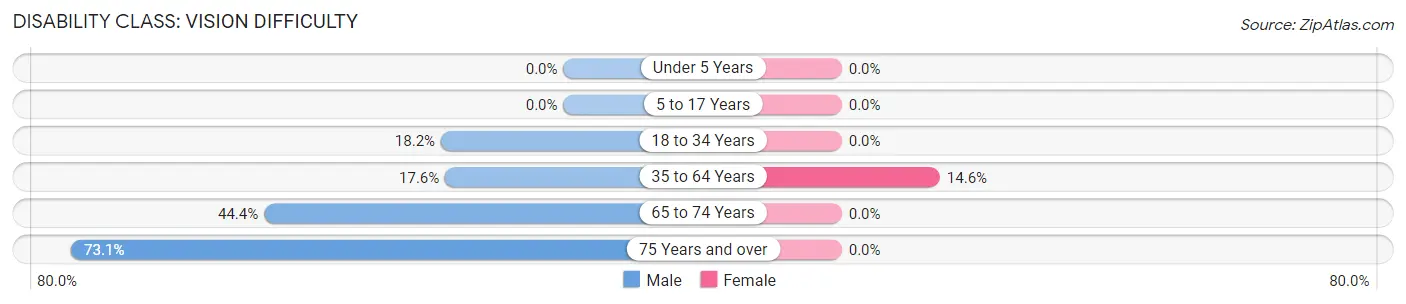
| Age Bracket | Male | Female |
| Under 5 Years | 0 (0.0%) | 0 (0.0%) |
| 5 to 17 Years | 0 (0.0%) | 0 (0.0%) |
| 18 to 34 Years | 8 (18.2%) | 0 (0.0%) |
| 35 to 64 Years | 23 (17.6%) | 36 (14.6%) |
| 65 to 74 Years | 16 (44.4%) | 0 (0.0%) |
| 75 Years and over | 19 (73.1%) | 0 (0.0%) |
Disability Class: Cognitive Difficulty
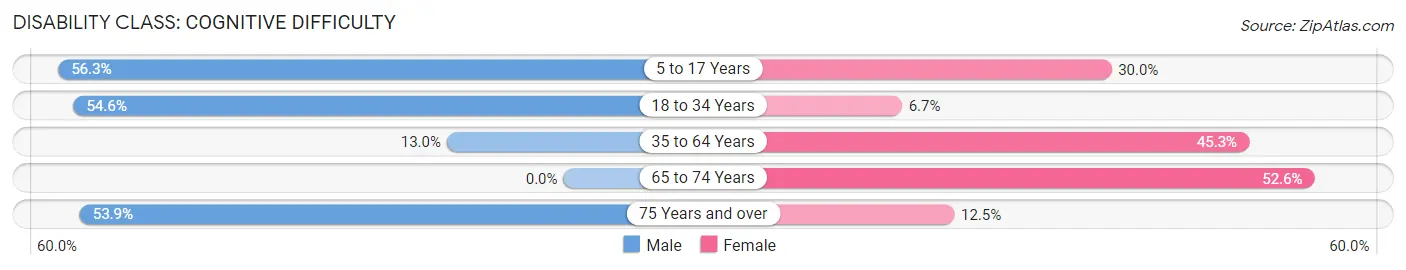
| Age Bracket | Male | Female |
| 5 to 17 Years | 9 (56.2%) | 6 (30.0%) |
| 18 to 34 Years | 24 (54.5%) | 4 (6.7%) |
| 35 to 64 Years | 17 (13.0%) | 112 (45.3%) |
| 65 to 74 Years | 0 (0.0%) | 20 (52.6%) |
| 75 Years and over | 14 (53.8%) | 3 (12.5%) |
Disability Class: Ambulatory Difficulty
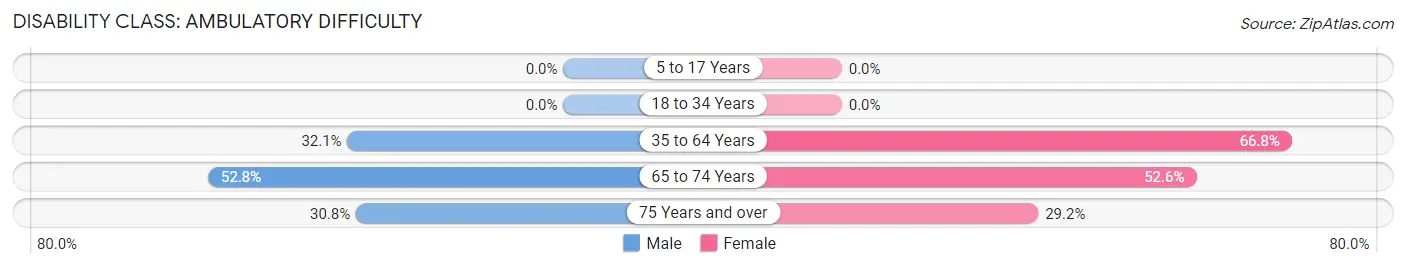
| Age Bracket | Male | Female |
| 5 to 17 Years | 0 (0.0%) | 0 (0.0%) |
| 18 to 34 Years | 0 (0.0%) | 0 (0.0%) |
| 35 to 64 Years | 42 (32.1%) | 165 (66.8%) |
| 65 to 74 Years | 19 (52.8%) | 20 (52.6%) |
| 75 Years and over | 8 (30.8%) | 7 (29.2%) |
Disability Class: Self-Care Difficulty
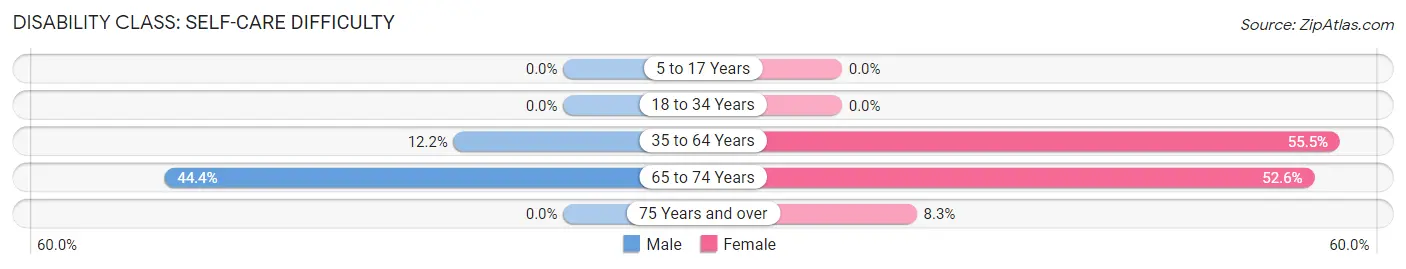
| Age Bracket | Male | Female |
| 5 to 17 Years | 0 (0.0%) | 0 (0.0%) |
| 18 to 34 Years | 0 (0.0%) | 0 (0.0%) |
| 35 to 64 Years | 16 (12.2%) | 137 (55.5%) |
| 65 to 74 Years | 16 (44.4%) | 20 (52.6%) |
| 75 Years and over | 0 (0.0%) | 2 (8.3%) |
Technology Access in Beaumont
Computing Device Access in Beaumont
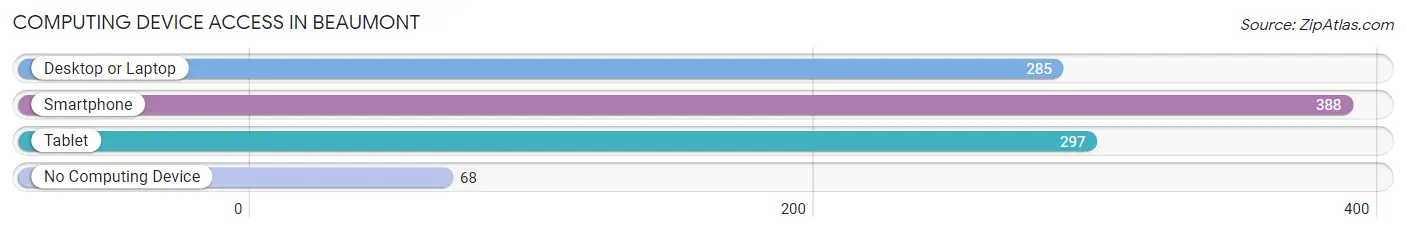
| Device Type | # Households | % Households |
| Desktop or Laptop | 285 | 61.7% |
| Smartphone | 388 | 84.0% |
| Tablet | 297 | 64.3% |
| No Computing Device | 68 | 14.7% |
| Total | 462 | 100.0% |
Internet Access in Beaumont
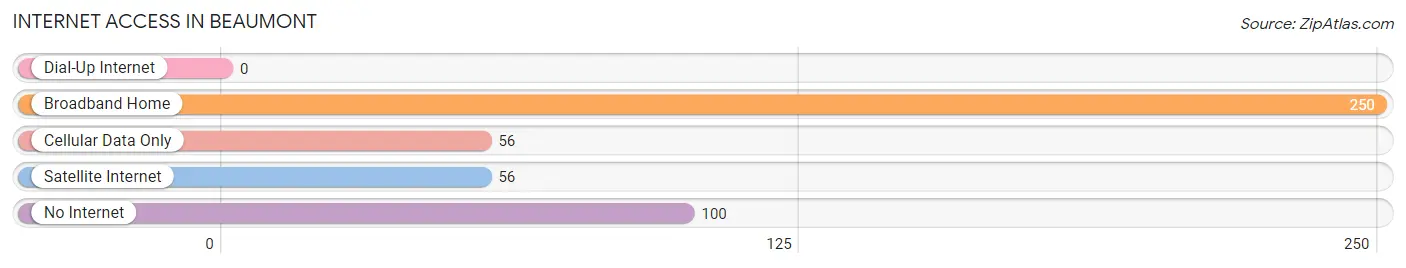
| Internet Type | # Households | % Households |
| Dial-Up Internet | 0 | 0.0% |
| Broadband Home | 250 | 54.1% |
| Cellular Data Only | 56 | 12.1% |
| Satellite Internet | 56 | 12.1% |
| No Internet | 100 | 21.6% |
| Total | 462 | 100.0% |
Beaumont Summary
Beaumont is a small town located in the state of Mississippi, in the United States. It is situated in the southeastern corner of the state, near the border with Alabama. The town has a population of approximately 1,500 people, and is part of the Jackson metropolitan area.
History
Beaumont was founded in 1837 by a group of settlers from the nearby town of Jackson. The town was named after the French word for “beautiful mountain”, and was originally intended to be a farming community. The town quickly grew, and by the late 19th century, it had become a thriving commercial center.
In the early 20th century, Beaumont was a popular destination for tourists, and the town was home to several resorts and hotels. The town also had a thriving lumber industry, and was home to several sawmills.
In the 1950s, Beaumont began to decline, as the lumber industry moved away and the tourist industry declined. The town was hit hard by the Great Recession of 2008, and many businesses closed. However, the town has since seen a resurgence, and is now home to several small businesses and restaurants.
Geography
Beaumont is located in the southeastern corner of Mississippi, near the border with Alabama. The town is situated on the banks of the Pearl River, and is surrounded by rolling hills and forests. The town is located about 30 miles from the state capital of Jackson, and is part of the Jackson metropolitan area.
The climate in Beaumont is humid subtropical, with hot, humid summers and mild winters. The average annual temperature is around 70 degrees Fahrenheit, and the average annual precipitation is around 50 inches.
Economy
Beaumont’s economy is largely based on agriculture and tourism. The town is home to several small businesses, including restaurants, retail stores, and service providers. The town is also home to several sawmills, and is a popular destination for hunters and fishermen.
Demographics
As of the 2010 census, Beaumont had a population of 1,500 people. The racial makeup of the town was 79.3% White, 17.3% African American, 0.7% Native American, 0.3% Asian, and 2.3% from other races. The median household income was $31,250, and the median family income was $37,500.
Beaumont is a small town with a rich history and a bright future. The town is home to a diverse population, and is a popular destination for tourists and outdoor enthusiasts. The town has seen a resurgence in recent years, and is now home to several small businesses and restaurants. Beaumont is a great place to live, work, and play.
Common Questions
What is Per Capita Income in Beaumont?
Per Capita income in Beaumont is $29,193.
What is the Median Household income in Beaumont?
Median Household Income in Beaumont is $75,071.
What is Income or Wage Gap in Beaumont?
Income or Wage Gap in Beaumont is 67.0%.
Women in Beaumont earn 33.0 cents for every dollar earned by a man.
What is Inequality or Gini Index in Beaumont?
Inequality or Gini Index in Beaumont is 0.33.
What is the Total Population of Beaumont?
Total Population of Beaumont is 857.
What is the Total Male Population of Beaumont?
Total Male Population of Beaumont is 461.
What is the Total Female Population of Beaumont?
Total Female Population of Beaumont is 396.
What is the Ratio of Males per 100 Females in Beaumont?
There are 116.41 Males per 100 Females in Beaumont.
What is the Ratio of Females per 100 Males in Beaumont?
There are 85.90 Females per 100 Males in Beaumont.
What is the Median Population Age in Beaumont?
Median Population Age in Beaumont is 46.1 Years.
What is the Average Family Size in Beaumont
Average Family Size in Beaumont is 3.0 People.
What is the Average Household Size in Beaumont
Average Household Size in Beaumont is 1.9 People.
How Large is the Labor Force in Beaumont?
There are 521 People in the Labor Forcein in Beaumont.
What is the Percentage of People in the Labor Force in Beaumont?
63.2% of People are in the Labor Force in Beaumont.
What is the Unemployment Rate in Beaumont?
Unemployment Rate in Beaumont is 3.2%.