Cordova, AK Map & Demographics
Cordova Map
Cordova Overview
$39,962
PER CAPITA INCOME
$100,096
AVG FAMILY INCOME
$79,526
AVG HOUSEHOLD INCOME
37.3%
WAGE / INCOME GAP [ % ]
62.7¢/ $1
WAGE / INCOME GAP [ $ ]
0.35
INEQUALITY / GINI INDEX
2,507
TOTAL POPULATION
1,330
MALE POPULATION
1,177
FEMALE POPULATION
113.00
MALES / 100 FEMALES
88.50
FEMALES / 100 MALES
36.9
MEDIAN AGE
3.1
AVG FAMILY SIZE
2.7
AVG HOUSEHOLD SIZE
1,311
LABOR FORCE [ PEOPLE ]
65.1%
PERCENT IN LABOR FORCE
12.1%
UNEMPLOYMENT RATE
Cordova Zip Codes
Cordova Area Codes
Income in Cordova
Income Overview in Cordova
Per Capita Income in Cordova is $39,962, while median incomes of families and households are $100,096 and $79,526 respectively.
| Characteristic | Number | Measure |
| Per Capita Income | 2,507 | $39,962 |
| Median Family Income | 663 | $100,096 |
| Mean Family Income | 663 | $116,331 |
| Median Household Income | 883 | $79,526 |
| Mean Household Income | 883 | $100,660 |
| Income Deficit | 663 | $0 |
| Wage / Income Gap (%) | 2,507 | 37.34% |
| Wage / Income Gap ($) | 2,507 | 62.66¢ per $1 |
| Gini / Inequality Index | 2,507 | 0.35 |
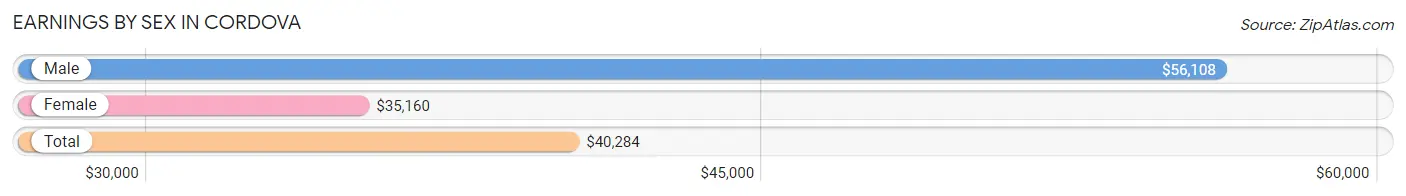
Earnings by Sex in Cordova
Average Earnings in Cordova are $40,284, $56,108 for men and $35,160 for women, a difference of 37.3%.
| Sex | Number | Average Earnings |
| Male | 955 (61.7%) | $56,108 |
| Female | 592 (38.3%) | $35,160 |
| Total | 1,547 (100.0%) | $40,284 |
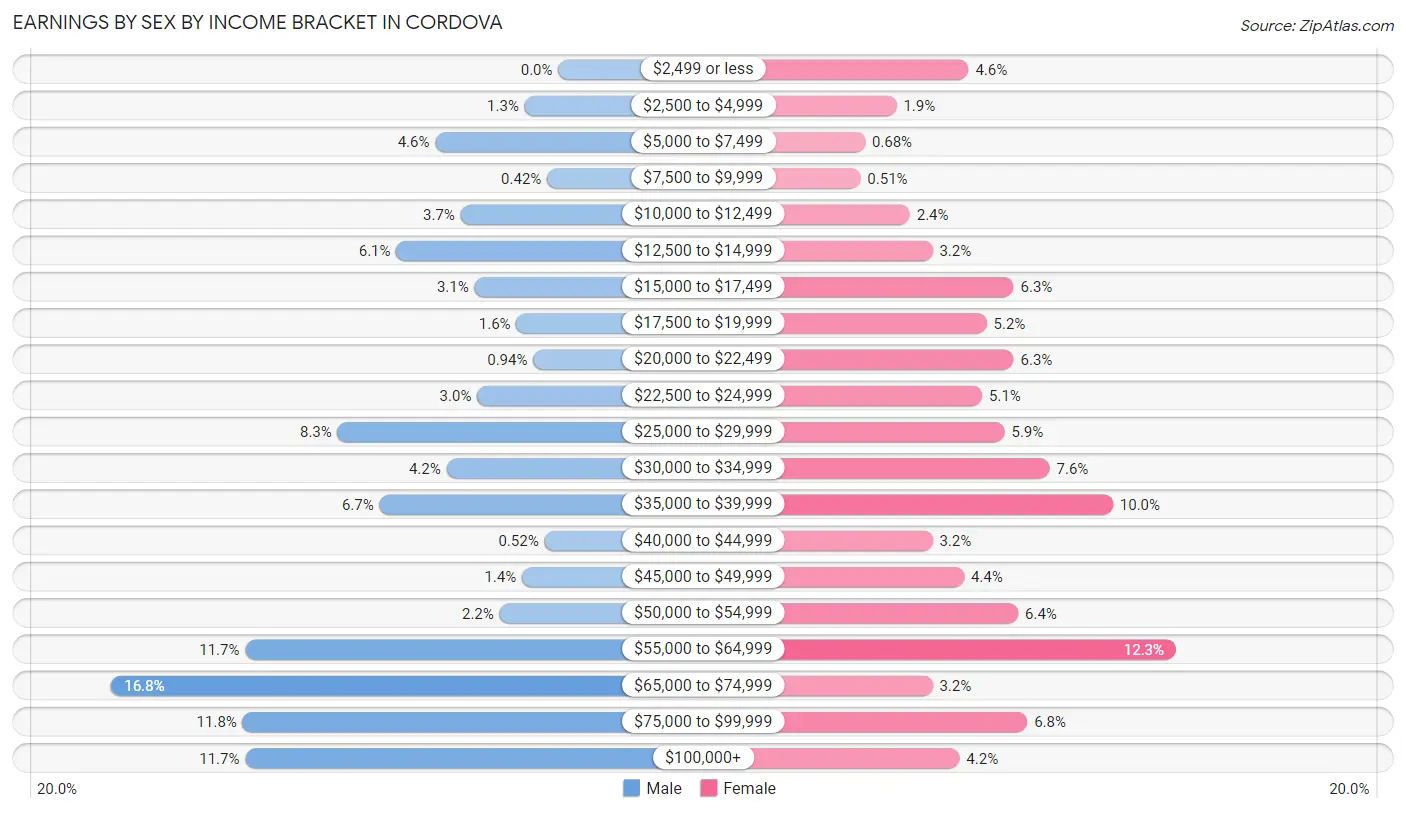
Earnings by Sex by Income Bracket in Cordova
The most common earnings brackets in Cordova are $65,000 to $74,999 for men (160 | 16.8%) and $55,000 to $64,999 for women (73 | 12.3%).
| Income | Male | Female |
| $2,499 or less | 0 (0.0%) | 27 (4.6%) |
| $2,500 to $4,999 | 12 (1.3%) | 11 (1.9%) |
| $5,000 to $7,499 | 44 (4.6%) | 4 (0.7%) |
| $7,500 to $9,999 | 4 (0.4%) | 3 (0.5%) |
| $10,000 to $12,499 | 35 (3.7%) | 14 (2.4%) |
| $12,500 to $14,999 | 58 (6.1%) | 19 (3.2%) |
| $15,000 to $17,499 | 30 (3.1%) | 37 (6.2%) |
| $17,500 to $19,999 | 15 (1.6%) | 31 (5.2%) |
| $20,000 to $22,499 | 9 (0.9%) | 37 (6.2%) |
| $22,500 to $24,999 | 29 (3.0%) | 30 (5.1%) |
| $25,000 to $29,999 | 79 (8.3%) | 35 (5.9%) |
| $30,000 to $34,999 | 40 (4.2%) | 45 (7.6%) |
| $35,000 to $39,999 | 64 (6.7%) | 59 (10.0%) |
| $40,000 to $44,999 | 5 (0.5%) | 19 (3.2%) |
| $45,000 to $49,999 | 13 (1.4%) | 26 (4.4%) |
| $50,000 to $54,999 | 21 (2.2%) | 38 (6.4%) |
| $55,000 to $64,999 | 112 (11.7%) | 73 (12.3%) |
| $65,000 to $74,999 | 160 (16.8%) | 19 (3.2%) |
| $75,000 to $99,999 | 113 (11.8%) | 40 (6.8%) |
| $100,000+ | 112 (11.7%) | 25 (4.2%) |
| Total | 955 (100.0%) | 592 (100.0%) |
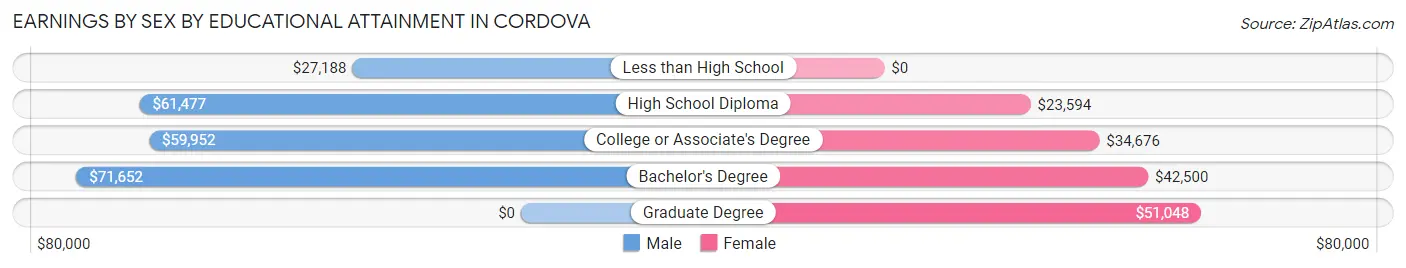
Earnings by Sex by Educational Attainment in Cordova
Average earnings in Cordova are $58,462 for men and $36,064 for women, a difference of 38.3%. Men with an educational attainment of bachelor's degree enjoy the highest average annual earnings of $71,652, while those with less than high school education earn the least with $27,188. Women with an educational attainment of graduate degree earn the most with the average annual earnings of $51,048, while those with high school diploma education have the smallest earnings of $23,594.
| Educational Attainment | Male Income | Female Income |
| Less than High School | $27,188 | $0 |
| High School Diploma | $61,477 | $23,594 |
| College or Associate's Degree | $59,952 | $34,676 |
| Bachelor's Degree | $71,652 | $42,500 |
| Graduate Degree | - | - |
| Total | $58,462 | $36,064 |
Family Income in Cordova
Family Income Brackets in Cordova
According to the Cordova family income data, there are 166 families falling into the $100,000 to $149,999 income range, which is the most common income bracket and makes up 25.0% of all families.
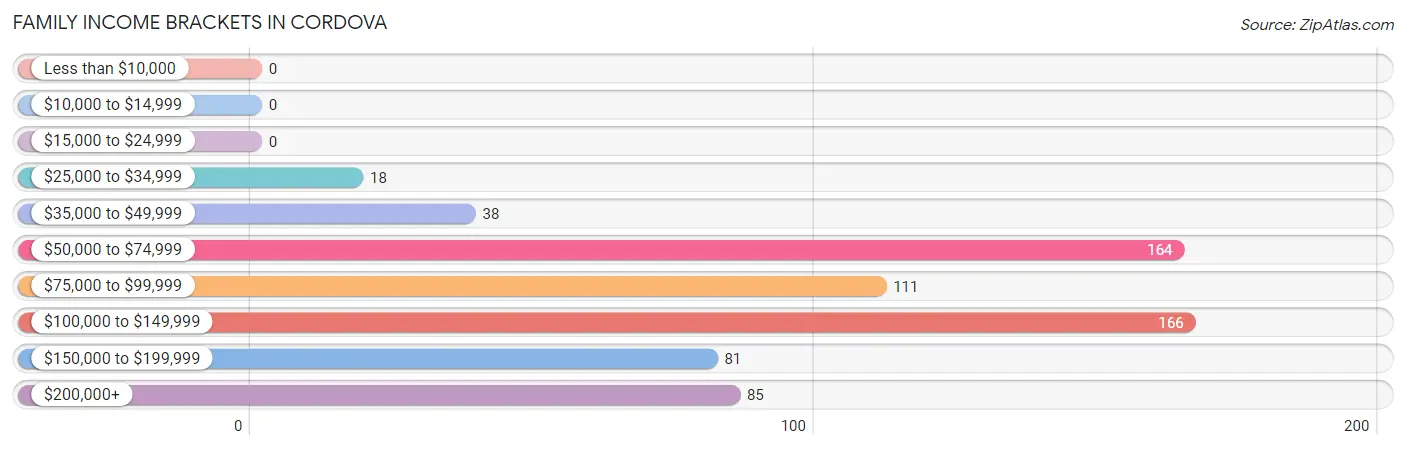
| Income Bracket | # Families | % Families |
| Less than $10,000 | 0 | 0.0% |
| $10,000 to $14,999 | 0 | 0.0% |
| $15,000 to $24,999 | 0 | 0.0% |
| $25,000 to $34,999 | 18 | 2.7% |
| $35,000 to $49,999 | 38 | 5.7% |
| $50,000 to $74,999 | 164 | 24.7% |
| $75,000 to $99,999 | 111 | 16.7% |
| $100,000 to $149,999 | 166 | 25.0% |
| $150,000 to $199,999 | 81 | 12.2% |
| $200,000+ | 85 | 12.8% |
Family Income by Famaliy Size in Cordova
5-person families (14 | 2.1%) account for the highest median family income in Cordova with $105,833 per family, while 2-person families (389 | 58.7%) have the highest median income of $45,404 per family member.
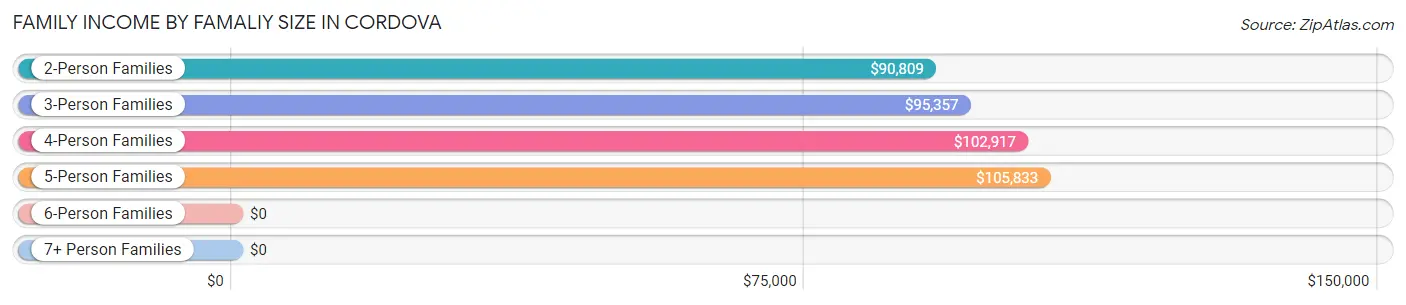
| Income Bracket | # Families | Median Income |
| 2-Person Families | 389 (58.7%) | $90,809 |
| 3-Person Families | 162 (24.4%) | $95,357 |
| 4-Person Families | 62 (9.3%) | $102,917 |
| 5-Person Families | 14 (2.1%) | $105,833 |
| 6-Person Families | 6 (0.9%) | $0 |
| 7+ Person Families | 30 (4.5%) | $0 |
| Total | 663 (100.0%) | $100,096 |
Family Income by Number of Earners in Cordova
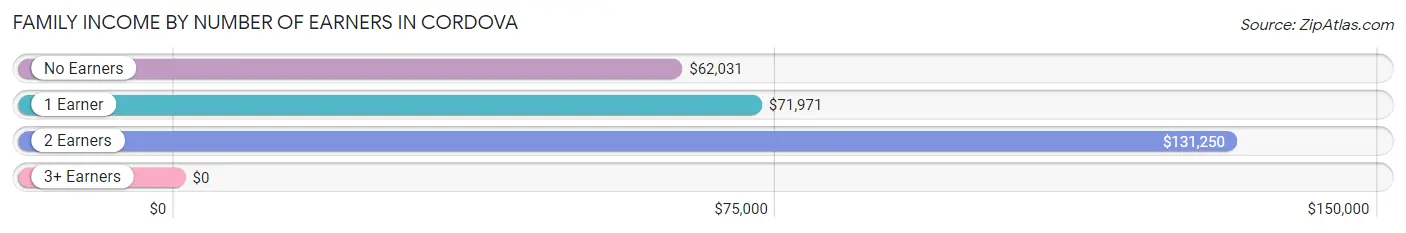
| Number of Earners | # Families | Median Income |
| No Earners | 83 (12.5%) | $62,031 |
| 1 Earner | 151 (22.8%) | $71,971 |
| 2 Earners | 403 (60.8%) | $131,250 |
| 3+ Earners | 26 (3.9%) | $0 |
| Total | 663 (100.0%) | $100,096 |
Household Income in Cordova
Household Income Brackets in Cordova
With 260 households falling in the category, the $50,000 to $74,999 income range is the most frequent in Cordova, accounting for 29.4% of all households.
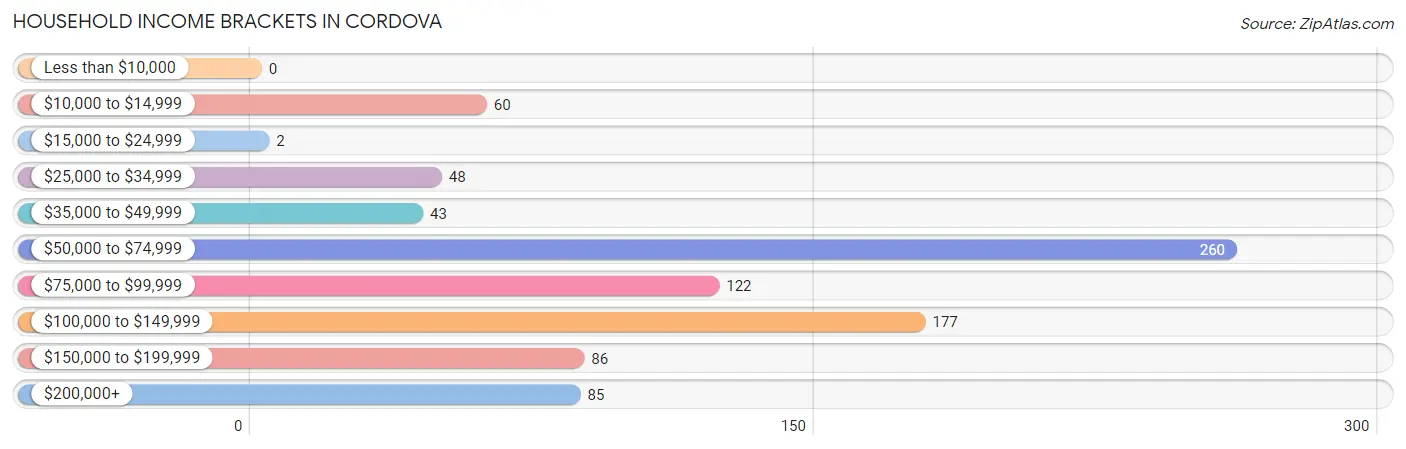
| Income Bracket | # Households | % Households |
| Less than $10,000 | 0 | 0.0% |
| $10,000 to $14,999 | 60 | 6.8% |
| $15,000 to $24,999 | 2 | 0.2% |
| $25,000 to $34,999 | 48 | 5.4% |
| $35,000 to $49,999 | 43 | 4.9% |
| $50,000 to $74,999 | 260 | 29.4% |
| $75,000 to $99,999 | 122 | 13.8% |
| $100,000 to $149,999 | 177 | 20.0% |
| $150,000 to $199,999 | 86 | 9.7% |
| $200,000+ | 85 | 9.6% |
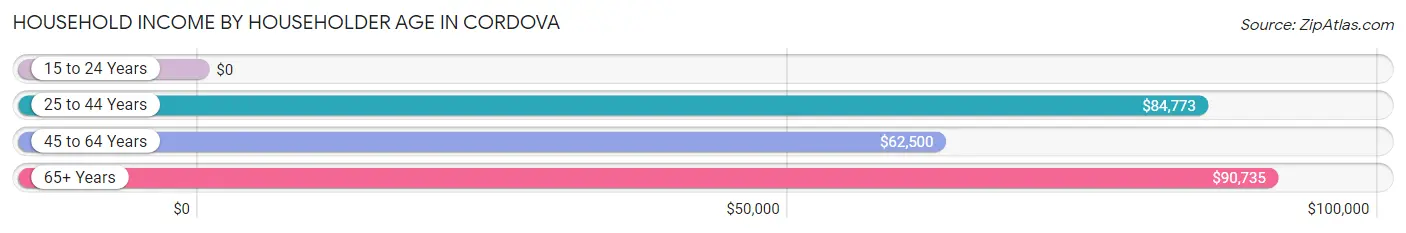
Household Income by Householder Age in Cordova
The median household income in Cordova is $79,526, with the highest median household income of $90,735 found in the 65+ years age bracket for the primary householder. A total of 246 households (27.9%) fall into this category. Meanwhile, the 15 to 24 years age bracket for the primary householder has the lowest median household income of $0, with 17 households (1.9%) in this group.
| Income Bracket | # Households | Median Income |
| 15 to 24 Years | 17 (1.9%) | $0 |
| 25 to 44 Years | 288 (32.6%) | $84,773 |
| 45 to 64 Years | 332 (37.6%) | $62,500 |
| 65+ Years | 246 (27.9%) | $90,735 |
| Total | 883 (100.0%) | $79,526 |
Poverty in Cordova
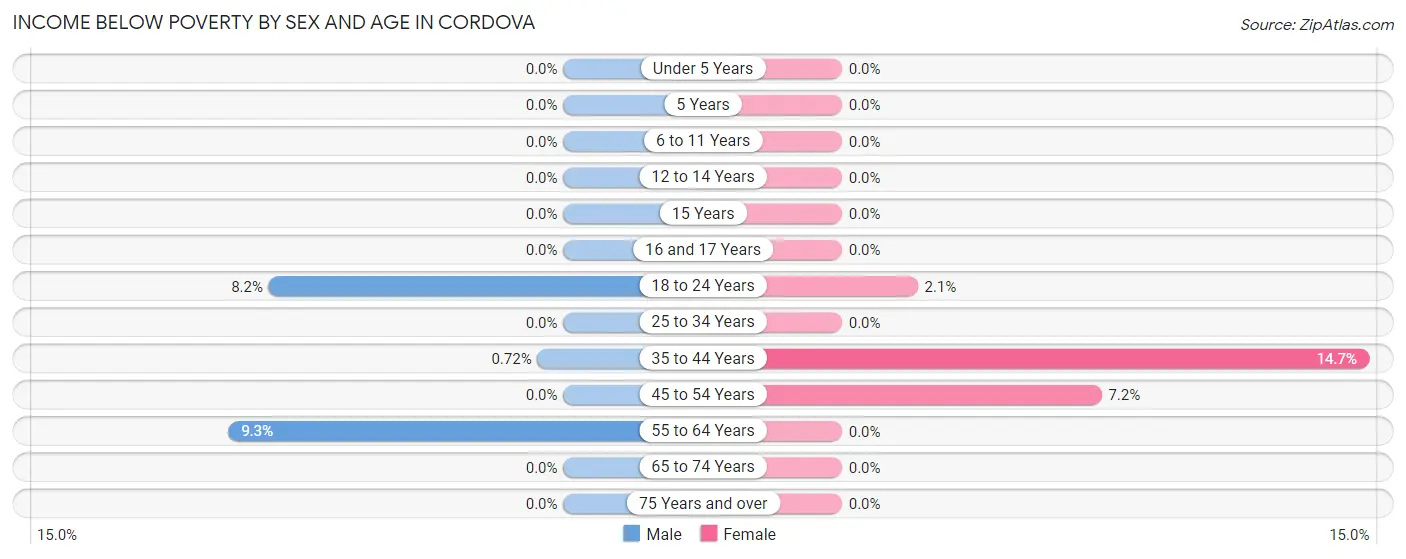
Income Below Poverty by Sex and Age in Cordova
With 3.2% poverty level for males and 1.7% for females among the residents of Cordova, 55 to 64 year old males and 35 to 44 year old females are the most vulnerable to poverty, with 35 males (9.3%) and 11 females (14.7%) in their respective age groups living below the poverty level.
| Age Bracket | Male | Female |
| Under 5 Years | 0 (0.0%) | 0 (0.0%) |
| 5 Years | 0 (0.0%) | 0 (0.0%) |
| 6 to 11 Years | 0 (0.0%) | 0 (0.0%) |
| 12 to 14 Years | 0 (0.0%) | 0 (0.0%) |
| 15 Years | 0 (0.0%) | 0 (0.0%) |
| 16 and 17 Years | 0 (0.0%) | 0 (0.0%) |
| 18 to 24 Years | 5 (8.2%) | 2 (2.1%) |
| 25 to 34 Years | 0 (0.0%) | 0 (0.0%) |
| 35 to 44 Years | 1 (0.7%) | 11 (14.7%) |
| 45 to 54 Years | 0 (0.0%) | 6 (7.2%) |
| 55 to 64 Years | 35 (9.3%) | 0 (0.0%) |
| 65 to 74 Years | 0 (0.0%) | 0 (0.0%) |
| 75 Years and over | 0 (0.0%) | 0 (0.0%) |
| Total | 41 (3.2%) | 19 (1.7%) |
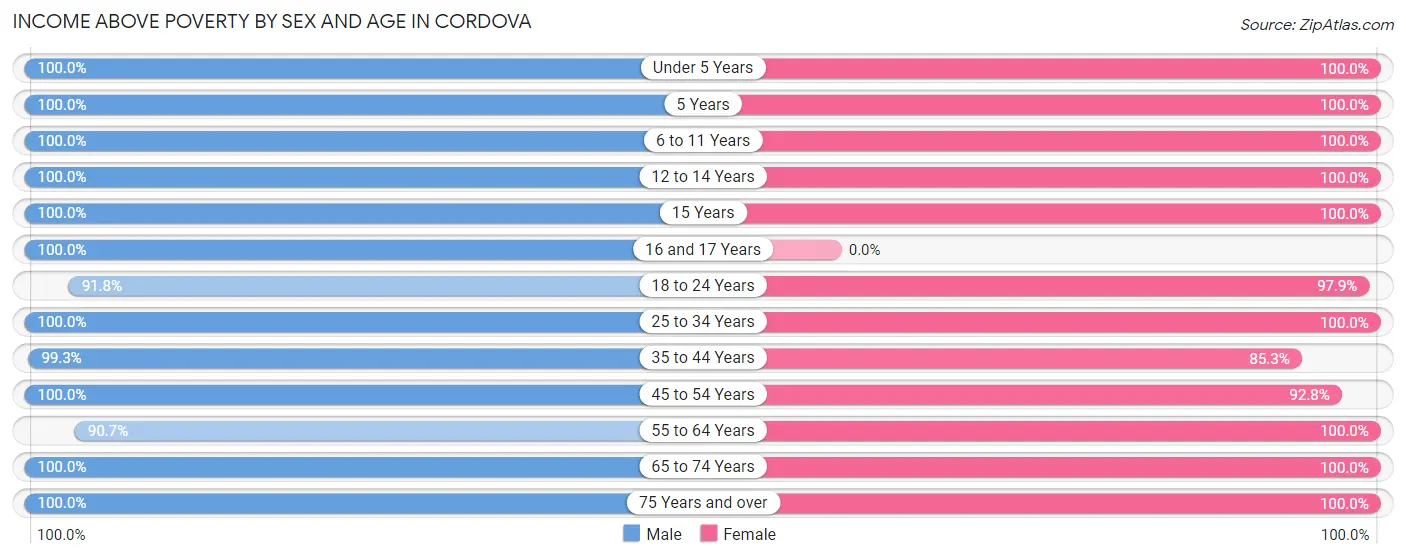
Income Above Poverty by Sex and Age in Cordova
According to the poverty statistics in Cordova, males aged under 5 years and females aged under 5 years are the age groups that are most secure financially, with 100.0% of males and 100.0% of females in these age groups living above the poverty line.
| Age Bracket | Male | Female |
| Under 5 Years | 57 (100.0%) | 72 (100.0%) |
| 5 Years | 35 (100.0%) | 2 (100.0%) |
| 6 to 11 Years | 79 (100.0%) | 84 (100.0%) |
| 12 to 14 Years | 19 (100.0%) | 102 (100.0%) |
| 15 Years | 18 (100.0%) | 25 (100.0%) |
| 16 and 17 Years | 27 (100.0%) | 0 (0.0%) |
| 18 to 24 Years | 56 (91.8%) | 93 (97.9%) |
| 25 to 34 Years | 239 (100.0%) | 235 (100.0%) |
| 35 to 44 Years | 138 (99.3%) | 64 (85.3%) |
| 45 to 54 Years | 106 (100.0%) | 77 (92.8%) |
| 55 to 64 Years | 340 (90.7%) | 109 (100.0%) |
| 65 to 74 Years | 102 (100.0%) | 186 (100.0%) |
| 75 Years and over | 39 (100.0%) | 52 (100.0%) |
| Total | 1,255 (96.8%) | 1,101 (98.3%) |
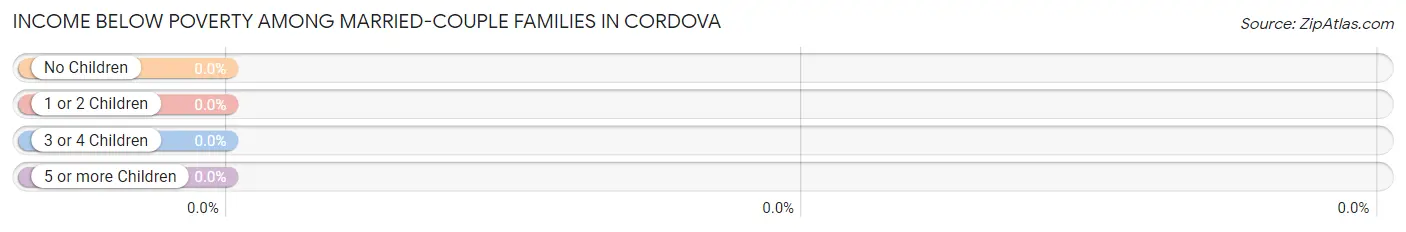
Income Below Poverty Among Married-Couple Families in Cordova
| Children | Above Poverty | Below Poverty |
| No Children | 392 (100.0%) | 0 (0.0%) |
| 1 or 2 Children | 148 (100.0%) | 0 (0.0%) |
| 3 or 4 Children | 11 (100.0%) | 0 (0.0%) |
| 5 or more Children | 19 (100.0%) | 0 (0.0%) |
| Total | 570 (100.0%) | 0 (0.0%) |
Income Below Poverty Among Single-Parent Households in Cordova
| Children | Single Father | Single Mother |
| No Children | 0 (0.0%) | 0 (0.0%) |
| 1 or 2 Children | 0 (0.0%) | 0 (0.0%) |
| 3 or 4 Children | 0 (0.0%) | 0 (0.0%) |
| 5 or more Children | 0 (0.0%) | 0 (0.0%) |
| Total | 0 (0.0%) | 0 (0.0%) |
Income Below Poverty Among Married-Couple vs Single-Parent Households in Cordova
| Children | Married-Couple Families | Single-Parent Households |
| No Children | 0 (0.0%) | 0 (0.0%) |
| 1 or 2 Children | 0 (0.0%) | 0 (0.0%) |
| 3 or 4 Children | 0 (0.0%) | 0 (0.0%) |
| 5 or more Children | 0 (0.0%) | 0 (0.0%) |
| Total | 0 (0.0%) | 0 (0.0%) |
Race in Cordova
The most populous races in Cordova are White / Caucasian (1,715 | 68.4%), Asian (379 | 15.1%), and Two or more Races (264 | 10.5%).
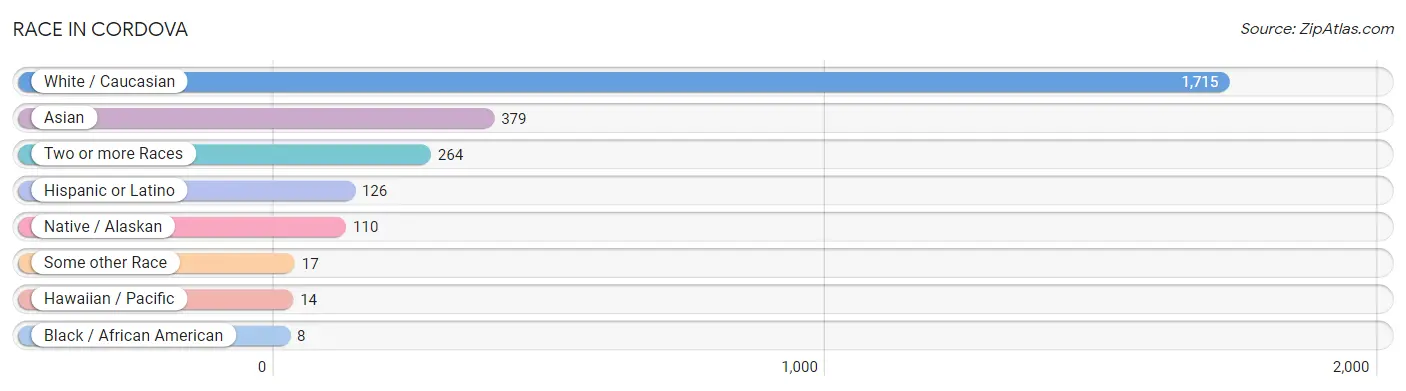
| Race | # Population | % Population |
| Asian | 379 | 15.1% |
| Black / African American | 8 | 0.3% |
| Hawaiian / Pacific | 14 | 0.6% |
| Hispanic or Latino | 126 | 5.0% |
| Native / Alaskan | 110 | 4.4% |
| White / Caucasian | 1,715 | 68.4% |
| Two or more Races | 264 | 10.5% |
| Some other Race | 17 | 0.7% |
| Total | 2,507 | 100.0% |
Ancestry in Cordova
The most populous ancestries reported in Cordova are German (733 | 29.2%), Irish (362 | 14.4%), Korean (362 | 14.4%), Hungarian (137 | 5.5%), and Aleut (116 | 4.6%), together accounting for 68.2% of all Cordova residents.
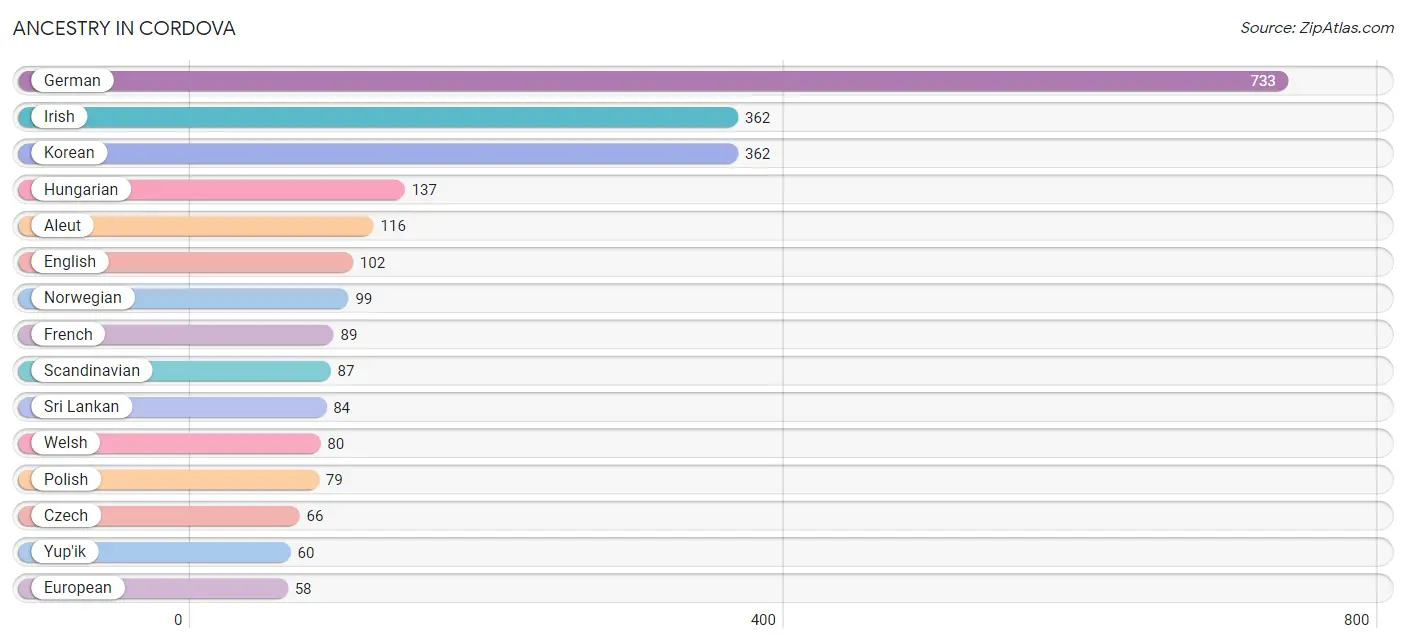
| Ancestry | # Population | % Population |
| Aleut | 116 | 4.6% |
| American | 30 | 1.2% |
| Austrian | 20 | 0.8% |
| Bhutanese | 1 | 0.0% |
| British | 23 | 0.9% |
| Central American | 2 | 0.1% |
| Cherokee | 27 | 1.1% |
| Chippewa | 45 | 1.8% |
| Costa Rican | 2 | 0.1% |
| Czech | 66 | 2.6% |
| Danish | 3 | 0.1% |
| Dutch | 19 | 0.8% |
| Eastern European | 56 | 2.2% |
| Ecuadorian | 41 | 1.6% |
| English | 102 | 4.1% |
| European | 58 | 2.3% |
| Finnish | 22 | 0.9% |
| French | 89 | 3.5% |
| French Canadian | 14 | 0.6% |
| German | 733 | 29.2% |
| Guyanese | 3 | 0.1% |
| Haitian | 2 | 0.1% |
| Hungarian | 137 | 5.5% |
| Irish | 362 | 14.4% |
| Italian | 44 | 1.8% |
| Kenyan | 5 | 0.2% |
| Korean | 362 | 14.4% |
| Mexican | 32 | 1.3% |
| Native Hawaiian | 7 | 0.3% |
| Northern European | 13 | 0.5% |
| Norwegian | 99 | 4.0% |
| Polish | 79 | 3.2% |
| Portuguese | 39 | 1.6% |
| Puerto Rican | 4 | 0.2% |
| Russian | 50 | 2.0% |
| Samoan | 7 | 0.3% |
| Scandinavian | 87 | 3.5% |
| Scotch-Irish | 21 | 0.8% |
| Scottish | 34 | 1.4% |
| South American | 41 | 1.6% |
| Spanish | 45 | 1.8% |
| Sri Lankan | 84 | 3.4% |
| Subsaharan African | 5 | 0.2% |
| Swedish | 17 | 0.7% |
| Swiss | 31 | 1.2% |
| Tlingit-Haida | 11 | 0.4% |
| Welsh | 80 | 3.2% |
| Yup'ik | 60 | 2.4% | View All 48 Rows |
Immigrants in Cordova
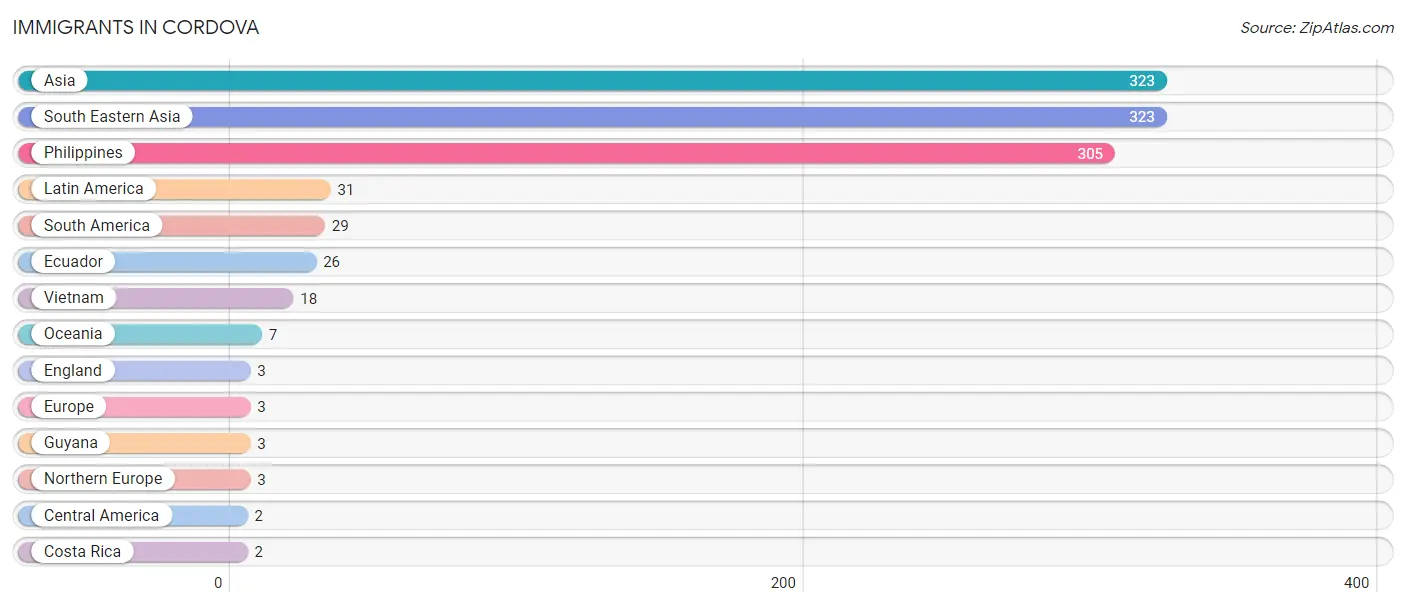
The most numerous immigrant groups reported in Cordova came from Asia (323 | 12.9%), South Eastern Asia (323 | 12.9%), Philippines (305 | 12.2%), Latin America (31 | 1.2%), and South America (29 | 1.2%), together accounting for 40.3% of all Cordova residents.
| Immigration Origin | # Population | % Population |
| Asia | 323 | 12.9% |
| Central America | 2 | 0.1% |
| Costa Rica | 2 | 0.1% |
| Ecuador | 26 | 1.0% |
| England | 3 | 0.1% |
| Europe | 3 | 0.1% |
| Guyana | 3 | 0.1% |
| Latin America | 31 | 1.2% |
| Northern Europe | 3 | 0.1% |
| Oceania | 7 | 0.3% |
| Philippines | 305 | 12.2% |
| South America | 29 | 1.2% |
| South Eastern Asia | 323 | 12.9% |
| Vietnam | 18 | 0.7% | View All 14 Rows |
Sex and Age in Cordova
Sex and Age in Cordova
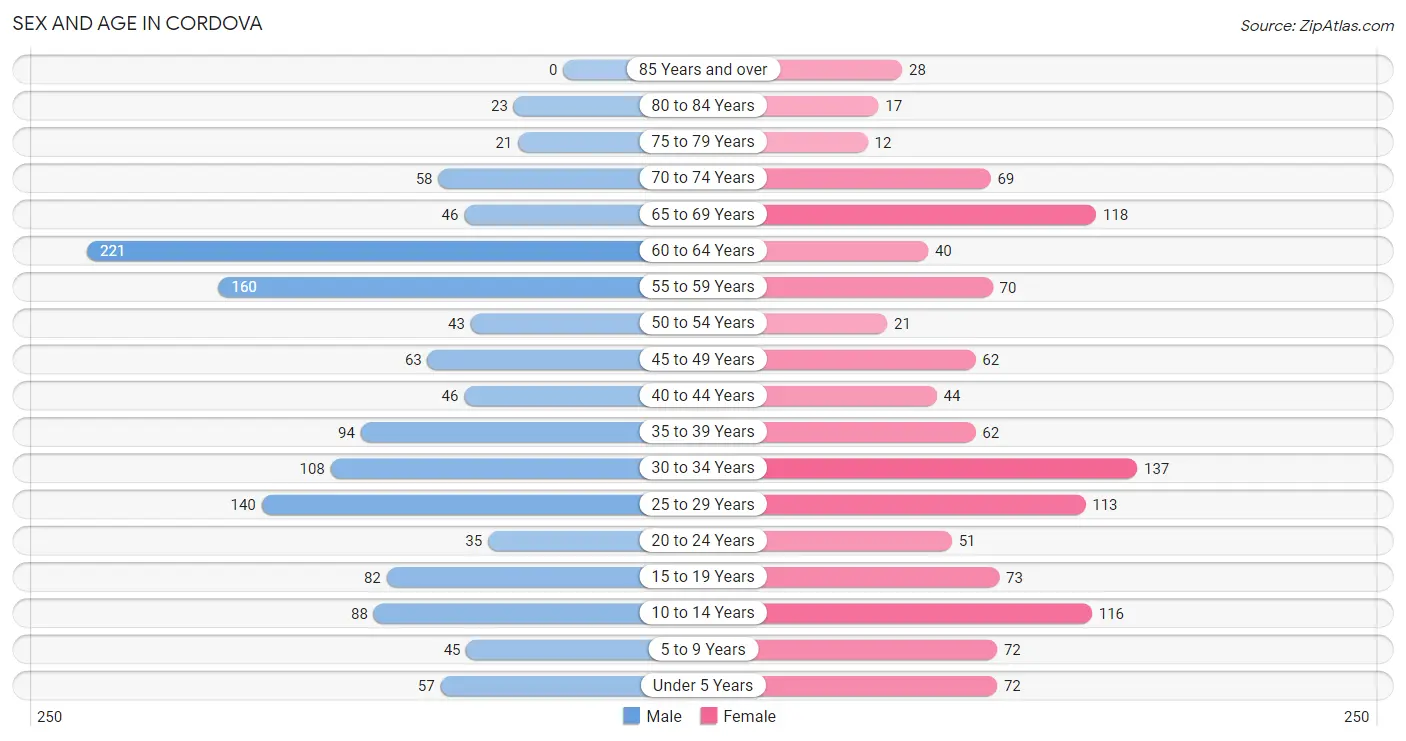
The most populous age groups in Cordova are 60 to 64 Years (221 | 16.6%) for men and 30 to 34 Years (137 | 11.6%) for women.
| Age Bracket | Male | Female |
| Under 5 Years | 57 (4.3%) | 72 (6.1%) |
| 5 to 9 Years | 45 (3.4%) | 72 (6.1%) |
| 10 to 14 Years | 88 (6.6%) | 116 (9.9%) |
| 15 to 19 Years | 82 (6.2%) | 73 (6.2%) |
| 20 to 24 Years | 35 (2.6%) | 51 (4.3%) |
| 25 to 29 Years | 140 (10.5%) | 113 (9.6%) |
| 30 to 34 Years | 108 (8.1%) | 137 (11.6%) |
| 35 to 39 Years | 94 (7.1%) | 62 (5.3%) |
| 40 to 44 Years | 46 (3.5%) | 44 (3.7%) |
| 45 to 49 Years | 63 (4.7%) | 62 (5.3%) |
| 50 to 54 Years | 43 (3.2%) | 21 (1.8%) |
| 55 to 59 Years | 160 (12.0%) | 70 (5.9%) |
| 60 to 64 Years | 221 (16.6%) | 40 (3.4%) |
| 65 to 69 Years | 46 (3.5%) | 118 (10.0%) |
| 70 to 74 Years | 58 (4.4%) | 69 (5.9%) |
| 75 to 79 Years | 21 (1.6%) | 12 (1.0%) |
| 80 to 84 Years | 23 (1.7%) | 17 (1.4%) |
| 85 Years and over | 0 (0.0%) | 28 (2.4%) |
| Total | 1,330 (100.0%) | 1,177 (100.0%) |
Families and Households in Cordova
Median Family Size in Cordova
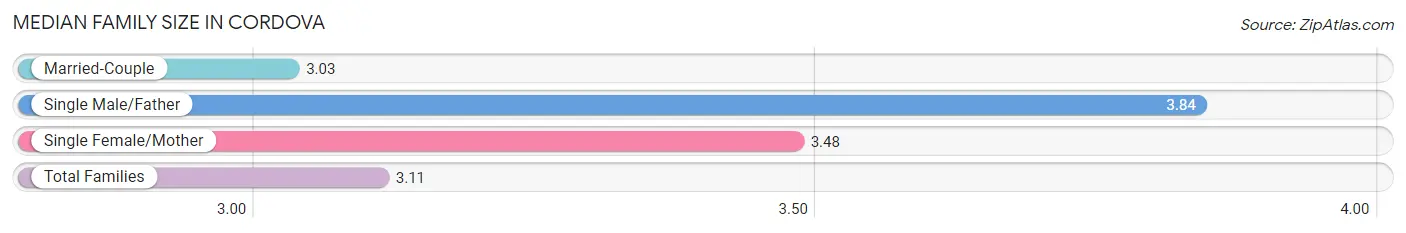
The median family size in Cordova is 3.11 persons per family, with single male/father families (37 | 5.6%) accounting for the largest median family size of 3.84 persons per family. On the other hand, married-couple families (570 | 86.0%) represent the smallest median family size with 3.03 persons per family.
| Family Type | # Families | Family Size |
| Married-Couple | 570 (86.0%) | 3.03 |
| Single Male/Father | 37 (5.6%) | 3.84 |
| Single Female/Mother | 56 (8.5%) | 3.48 |
| Total Families | 663 (100.0%) | 3.11 |
Median Household Size in Cordova
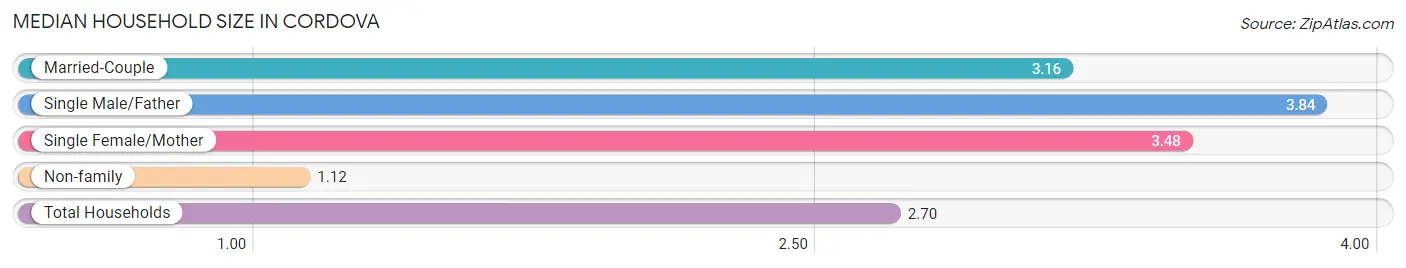
The median household size in Cordova is 2.70 persons per household, with single male/father households (37 | 4.2%) accounting for the largest median household size of 3.84 persons per household. non-family households (220 | 24.9%) represent the smallest median household size with 1.12 persons per household.
| Household Type | # Households | Household Size |
| Married-Couple | 570 (64.5%) | 3.16 |
| Single Male/Father | 37 (4.2%) | 3.84 |
| Single Female/Mother | 56 (6.3%) | 3.48 |
| Non-family | 220 (24.9%) | 1.12 |
| Total Households | 883 (100.0%) | 2.70 |
Household Size by Marriage Status in Cordova
Out of a total of 883 households in Cordova, 663 (75.1%) are family households, while 220 (24.9%) are nonfamily households. The most numerous type of family households are 2-person households, comprising 389, and the most common type of nonfamily households are 1-person households, comprising 199.
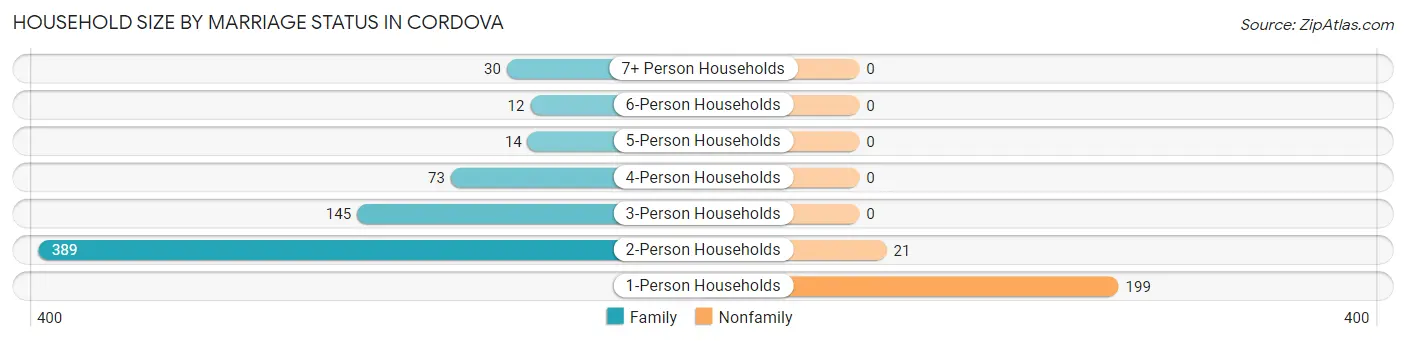
| Household Size | Family Households | Nonfamily Households |
| 1-Person Households | - | 199 (22.5%) |
| 2-Person Households | 389 (44.1%) | 21 (2.4%) |
| 3-Person Households | 145 (16.4%) | 0 (0.0%) |
| 4-Person Households | 73 (8.3%) | 0 (0.0%) |
| 5-Person Households | 14 (1.6%) | 0 (0.0%) |
| 6-Person Households | 12 (1.4%) | 0 (0.0%) |
| 7+ Person Households | 30 (3.4%) | 0 (0.0%) |
| Total | 663 (75.1%) | 220 (24.9%) |
Female Fertility in Cordova
Fertility by Age in Cordova
Average fertility rate in Cordova is 54.0 births per 1,000 women. Women in the age bracket of 20 to 34 years have the highest fertility rate with 96.0 births per 1,000 women. Women in the age bracket of 20 to 34 years acount for 100.0% of all women with births.
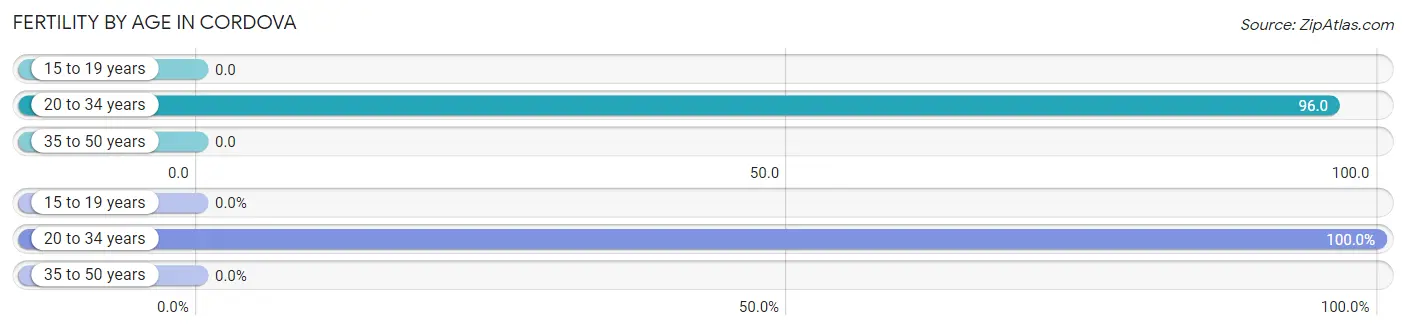
| Age Bracket | Women with Births | Births / 1,000 Women |
| 15 to 19 years | 0 (0.0%) | 0.0 |
| 20 to 34 years | 29 (100.0%) | 96.0 |
| 35 to 50 years | 0 (0.0%) | 0.0 |
| Total | 29 (100.0%) | 54.0 |
Fertility by Age by Marriage Status in Cordova
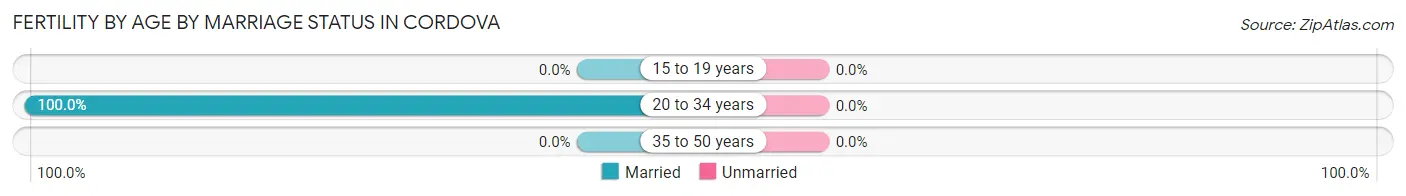
| Age Bracket | Married | Unmarried |
| 15 to 19 years | 0 (0.0%) | 0 (0.0%) |
| 20 to 34 years | 29 (100.0%) | 0 (0.0%) |
| 35 to 50 years | 0 (0.0%) | 0 (0.0%) |
| Total | 29 (100.0%) | 0 (0.0%) |
Fertility by Education in Cordova
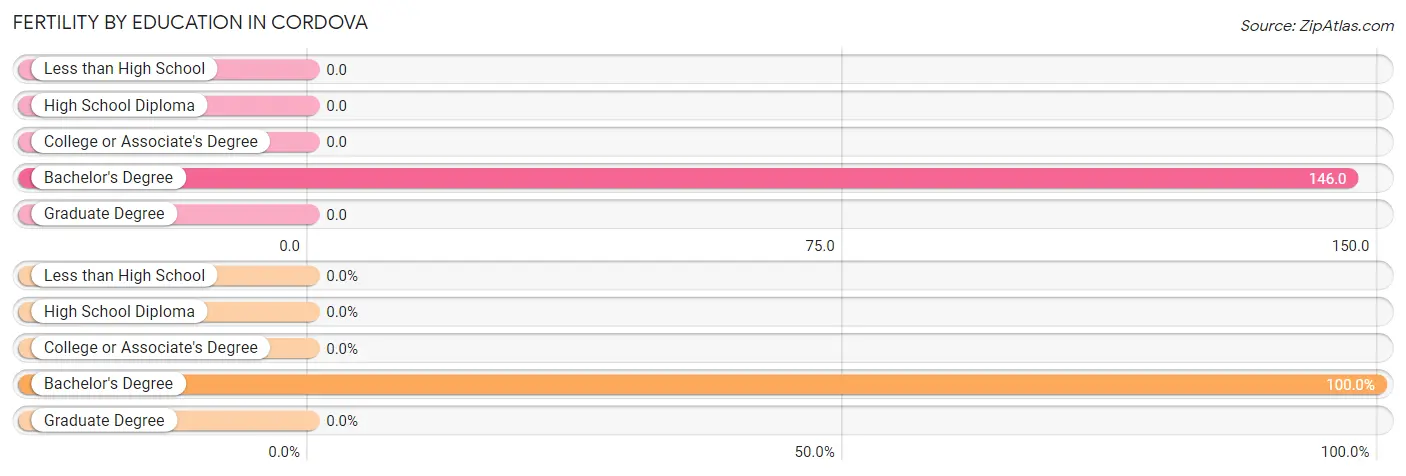
| Educational Attainment | Women with Births | Births / 1,000 Women |
| Less than High School | 0 (0.0%) | 0.0 |
| High School Diploma | 0 (0.0%) | 0.0 |
| College or Associate's Degree | 0 (0.0%) | 0.0 |
| Bachelor's Degree | 29 (100.0%) | 146.0 |
| Graduate Degree | 0 (0.0%) | 0.0 |
| Total | 29 (100.0%) | 54.0 |
Fertility by Education by Marriage Status in Cordova
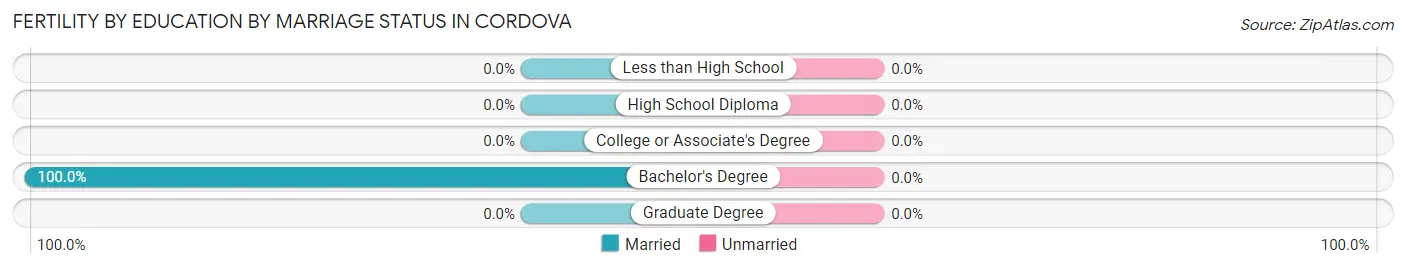
| Educational Attainment | Married | Unmarried |
| Less than High School | 0 (0.0%) | 0 (0.0%) |
| High School Diploma | 0 (0.0%) | 0 (0.0%) |
| College or Associate's Degree | 0 (0.0%) | 0 (0.0%) |
| Bachelor's Degree | 29 (100.0%) | 0 (0.0%) |
| Graduate Degree | 0 (0.0%) | 0 (0.0%) |
| Total | 29 (100.0%) | 0 (0.0%) |
Employment Characteristics in Cordova
Employment by Class of Employer in Cordova
Among the 1,097 employed individuals in Cordova, private company employees (454 | 41.4%), self-employed (not incorporated) (204 | 18.6%), and federal government employees (138 | 12.6%) make up the most common classes of employment.
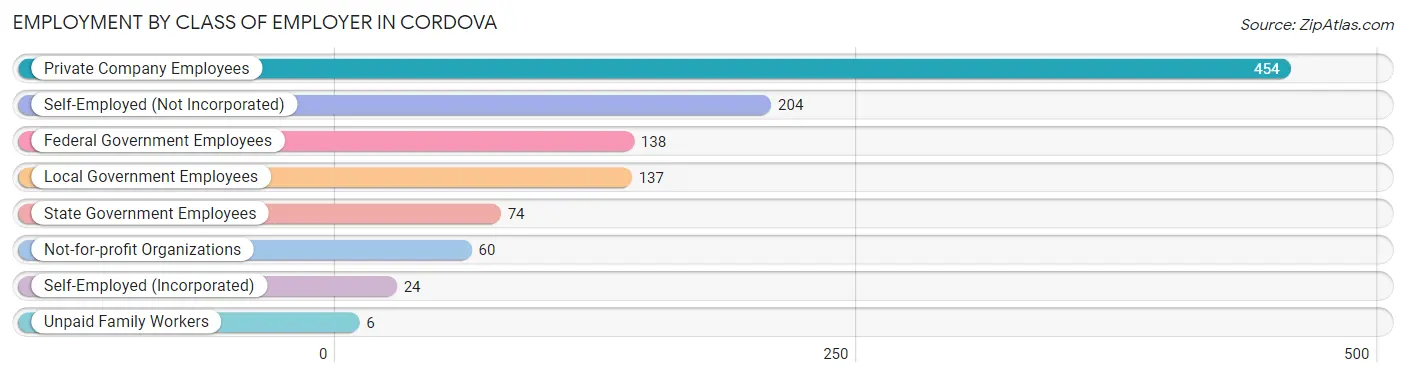
| Employer Class | # Employees | % Employees |
| Private Company Employees | 454 | 41.4% |
| Self-Employed (Incorporated) | 24 | 2.2% |
| Self-Employed (Not Incorporated) | 204 | 18.6% |
| Not-for-profit Organizations | 60 | 5.5% |
| Local Government Employees | 137 | 12.5% |
| State Government Employees | 74 | 6.8% |
| Federal Government Employees | 138 | 12.6% |
| Unpaid Family Workers | 6 | 0.5% |
| Total | 1,097 | 100.0% |
Employment Status by Age in Cordova
According to the labor force statistics for Cordova, out of the total population over 16 years of age (2,014), 65.1% or 1,311 individuals are in the labor force, with 12.1% or 159 of them unemployed. The age group with the highest labor force participation rate is 45 to 54 years, with 88.9% or 168 individuals in the labor force. Within the labor force, the 60 to 64 years age range has the highest percentage of unemployed individuals, with 33.6% or 72 of them being unemployed.
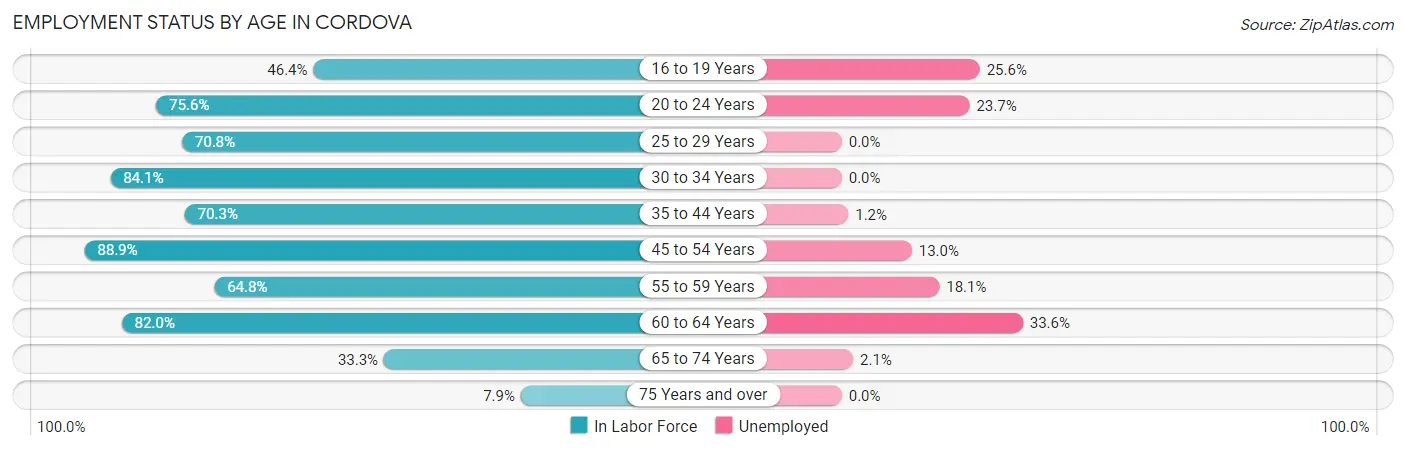
| Age Bracket | In Labor Force | Unemployed |
| 16 to 19 Years | 52 (46.4%) | 13 (25.6%) |
| 20 to 24 Years | 65 (75.6%) | 15 (23.7%) |
| 25 to 29 Years | 179 (70.8%) | 0 (0.0%) |
| 30 to 34 Years | 206 (84.1%) | 0 (0.0%) |
| 35 to 44 Years | 173 (70.3%) | 2 (1.2%) |
| 45 to 54 Years | 168 (88.9%) | 22 (13.0%) |
| 55 to 59 Years | 149 (64.8%) | 27 (18.1%) |
| 60 to 64 Years | 214 (82.0%) | 72 (33.6%) |
| 65 to 74 Years | 97 (33.3%) | 2 (2.1%) |
| 75 Years and over | 8 (7.9%) | 0 (0.0%) |
| Total | 1,311 (65.1%) | 159 (12.1%) |
Employment Status by Educational Attainment in Cordova
According to labor force statistics for Cordova, 76.5% of individuals (1,089) out of the total population between 25 and 64 years of age (1,424) are in the labor force, with 12.0% or 131 of them being unemployed. The group with the highest labor force participation rate are those with the educational attainment of college / associate degree, with 81.6% or 320 individuals in the labor force. Within the labor force, individuals with less than high school education have the highest percentage of unemployment, with 61.1% or 60 of them being unemployed.
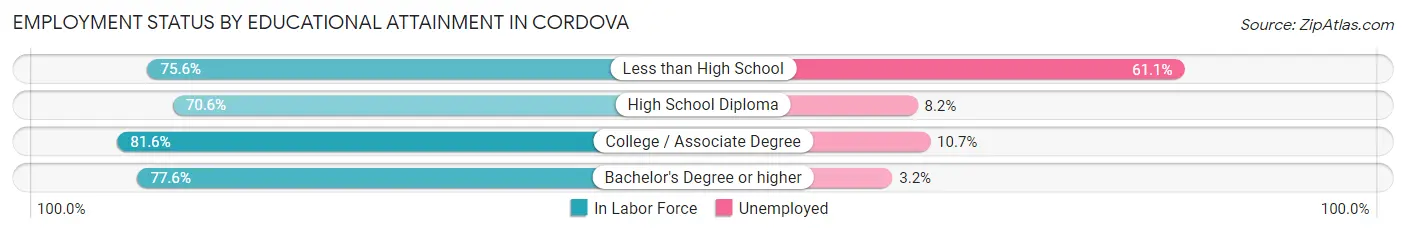
| Educational Attainment | In Labor Force | Unemployed |
| Less than High School | 99 (75.6%) | 80 (61.1%) |
| High School Diploma | 293 (70.6%) | 34 (8.2%) |
| College / Associate Degree | 320 (81.6%) | 42 (10.7%) |
| Bachelor's Degree or higher | 377 (77.6%) | 16 (3.2%) |
| Total | 1,089 (76.5%) | 171 (12.0%) |
Employment Occupations by Sex in Cordova
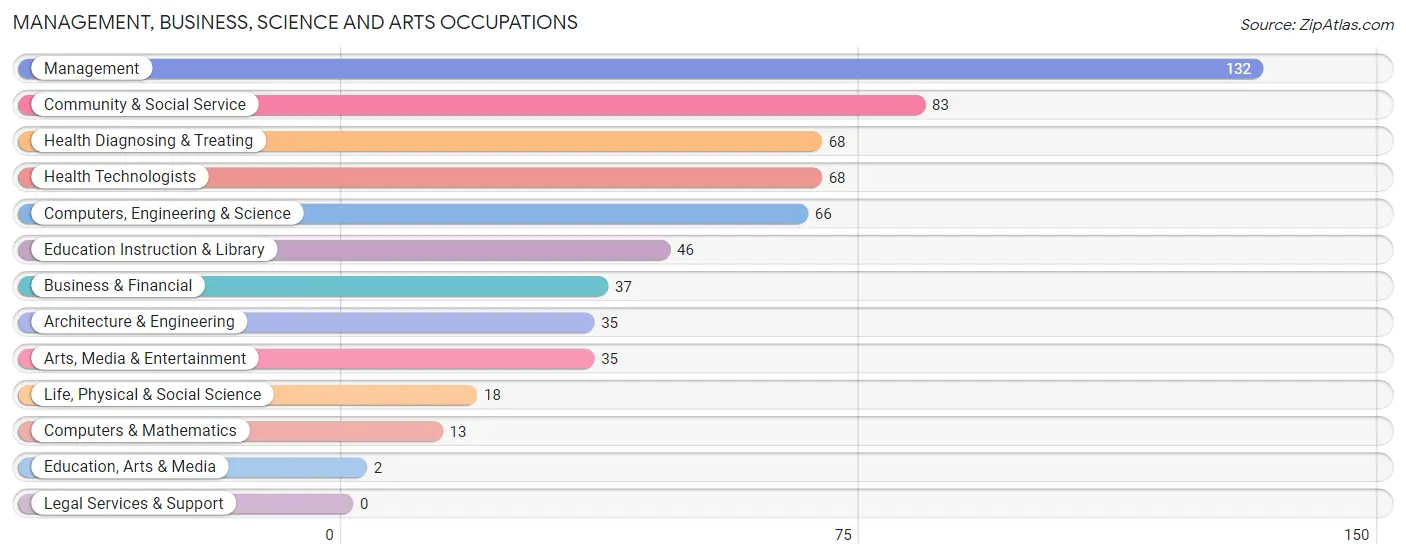
Management, Business, Science and Arts Occupations
The most common Management, Business, Science and Arts occupations in Cordova are Management (132 | 12.2%), Community & Social Service (83 | 7.7%), Health Diagnosing & Treating (68 | 6.3%), Health Technologists (68 | 6.3%), and Computers, Engineering & Science (66 | 6.1%).
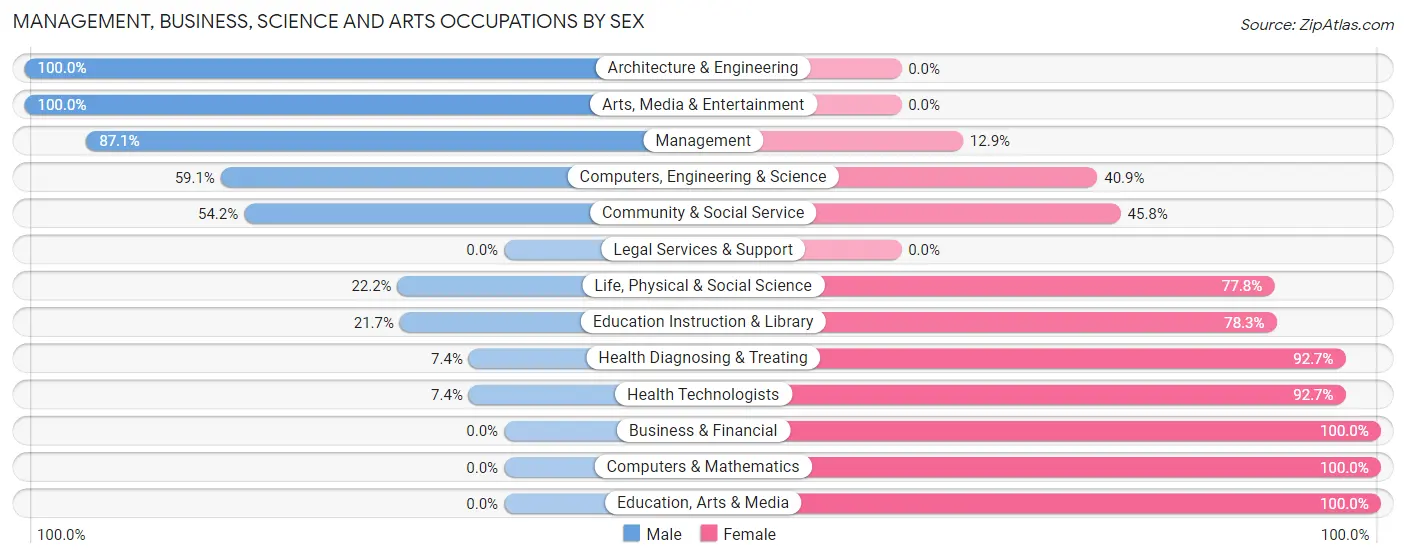
Management, Business, Science and Arts Occupations by Sex
Within the Management, Business, Science and Arts occupations in Cordova, the most male-oriented occupations are Architecture & Engineering (100.0%), Arts, Media & Entertainment (100.0%), and Management (87.1%), while the most female-oriented occupations are Business & Financial (100.0%), Computers & Mathematics (100.0%), and Education, Arts & Media (100.0%).
| Occupation | Male | Female |
| Management | 115 (87.1%) | 17 (12.9%) |
| Business & Financial | 0 (0.0%) | 37 (100.0%) |
| Computers, Engineering & Science | 39 (59.1%) | 27 (40.9%) |
| Computers & Mathematics | 0 (0.0%) | 13 (100.0%) |
| Architecture & Engineering | 35 (100.0%) | 0 (0.0%) |
| Life, Physical & Social Science | 4 (22.2%) | 14 (77.8%) |
| Community & Social Service | 45 (54.2%) | 38 (45.8%) |
| Education, Arts & Media | 0 (0.0%) | 2 (100.0%) |
| Legal Services & Support | 0 (0.0%) | 0 (0.0%) |
| Education Instruction & Library | 10 (21.7%) | 36 (78.3%) |
| Arts, Media & Entertainment | 35 (100.0%) | 0 (0.0%) |
| Health Diagnosing & Treating | 5 (7.3%) | 63 (92.6%) |
| Health Technologists | 5 (7.3%) | 63 (92.6%) |
| Total (Category) | 204 (52.8%) | 182 (47.1%) |
| Total (Overall) | 607 (56.3%) | 471 (43.7%) |
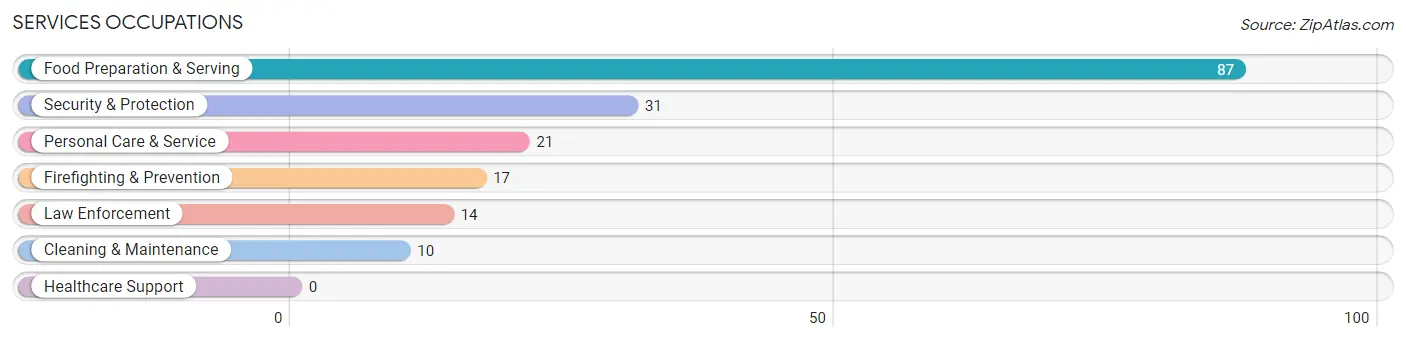
Services Occupations
The most common Services occupations in Cordova are Food Preparation & Serving (87 | 8.1%), Security & Protection (31 | 2.9%), Personal Care & Service (21 | 1.9%), Firefighting & Prevention (17 | 1.6%), and Law Enforcement (14 | 1.3%).
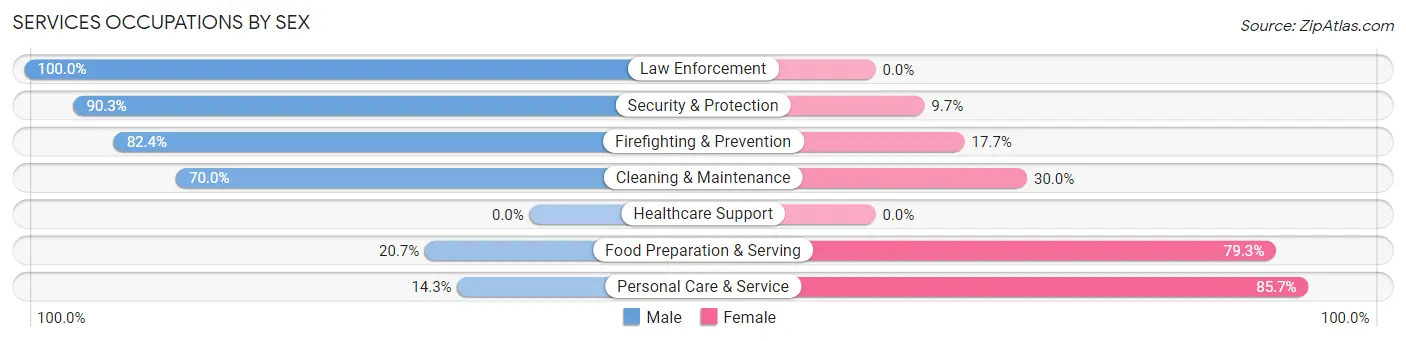
Services Occupations by Sex
Within the Services occupations in Cordova, the most male-oriented occupations are Law Enforcement (100.0%), Security & Protection (90.3%), and Firefighting & Prevention (82.4%), while the most female-oriented occupations are Personal Care & Service (85.7%), Food Preparation & Serving (79.3%), and Cleaning & Maintenance (30.0%).
| Occupation | Male | Female |
| Healthcare Support | 0 (0.0%) | 0 (0.0%) |
| Security & Protection | 28 (90.3%) | 3 (9.7%) |
| Firefighting & Prevention | 14 (82.4%) | 3 (17.6%) |
| Law Enforcement | 14 (100.0%) | 0 (0.0%) |
| Food Preparation & Serving | 18 (20.7%) | 69 (79.3%) |
| Cleaning & Maintenance | 7 (70.0%) | 3 (30.0%) |
| Personal Care & Service | 3 (14.3%) | 18 (85.7%) |
| Total (Category) | 56 (37.6%) | 93 (62.4%) |
| Total (Overall) | 607 (56.3%) | 471 (43.7%) |
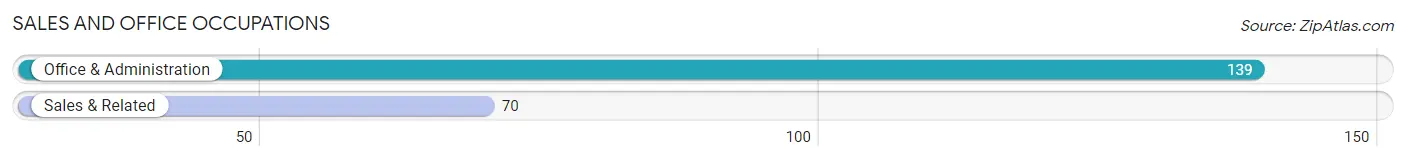
Sales and Office Occupations
The most common Sales and Office occupations in Cordova are Office & Administration (139 | 12.9%), and Sales & Related (70 | 6.5%).
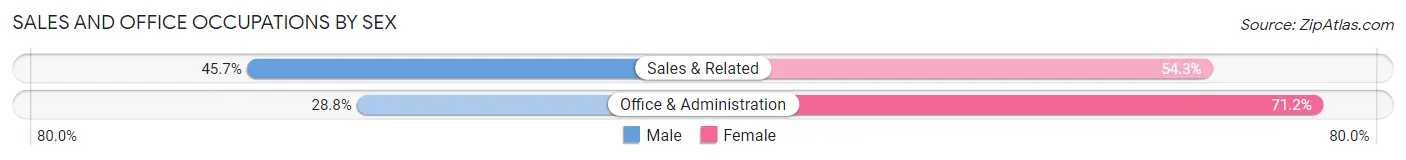
Sales and Office Occupations by Sex
| Occupation | Male | Female |
| Sales & Related | 32 (45.7%) | 38 (54.3%) |
| Office & Administration | 40 (28.8%) | 99 (71.2%) |
| Total (Category) | 72 (34.4%) | 137 (65.5%) |
| Total (Overall) | 607 (56.3%) | 471 (43.7%) |
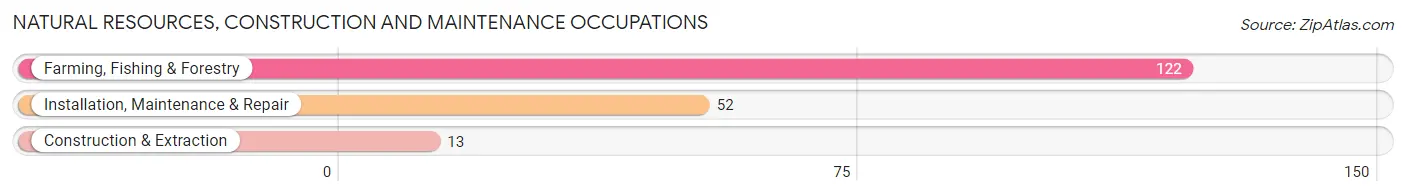
Natural Resources, Construction and Maintenance Occupations
The most common Natural Resources, Construction and Maintenance occupations in Cordova are Farming, Fishing & Forestry (122 | 11.3%), Installation, Maintenance & Repair (52 | 4.8%), and Construction & Extraction (13 | 1.2%).
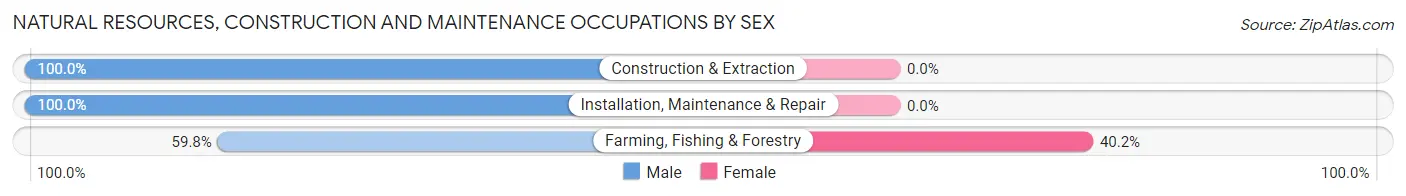
Natural Resources, Construction and Maintenance Occupations by Sex
| Occupation | Male | Female |
| Farming, Fishing & Forestry | 73 (59.8%) | 49 (40.2%) |
| Construction & Extraction | 13 (100.0%) | 0 (0.0%) |
| Installation, Maintenance & Repair | 52 (100.0%) | 0 (0.0%) |
| Total (Category) | 138 (73.8%) | 49 (26.2%) |
| Total (Overall) | 607 (56.3%) | 471 (43.7%) |
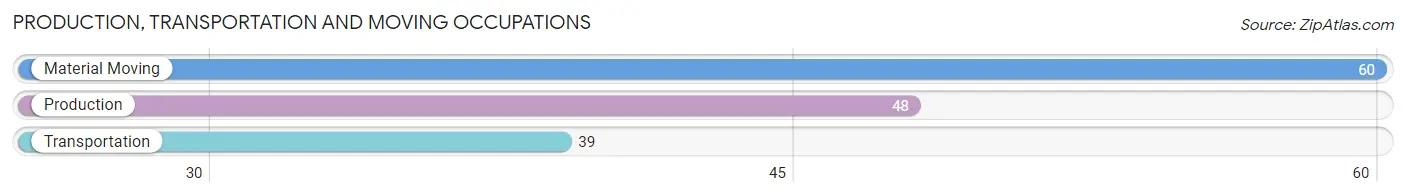
Production, Transportation and Moving Occupations
The most common Production, Transportation and Moving occupations in Cordova are Material Moving (60 | 5.6%), Production (48 | 4.4%), and Transportation (39 | 3.6%).
Production, Transportation and Moving Occupations by Sex
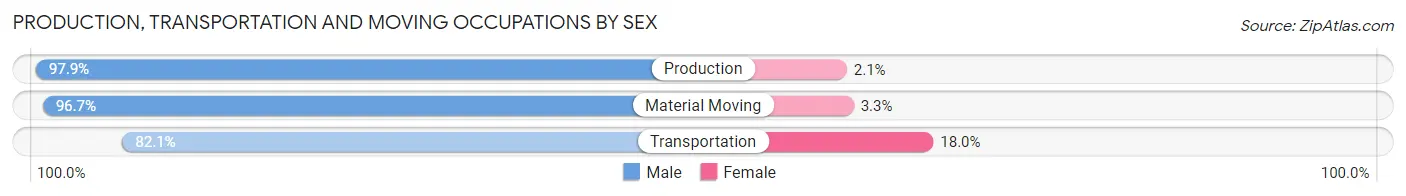
| Occupation | Male | Female |
| Production | 47 (97.9%) | 1 (2.1%) |
| Transportation | 32 (82.1%) | 7 (17.9%) |
| Material Moving | 58 (96.7%) | 2 (3.3%) |
| Total (Category) | 137 (93.2%) | 10 (6.8%) |
| Total (Overall) | 607 (56.3%) | 471 (43.7%) |
Employment Industries by Sex in Cordova
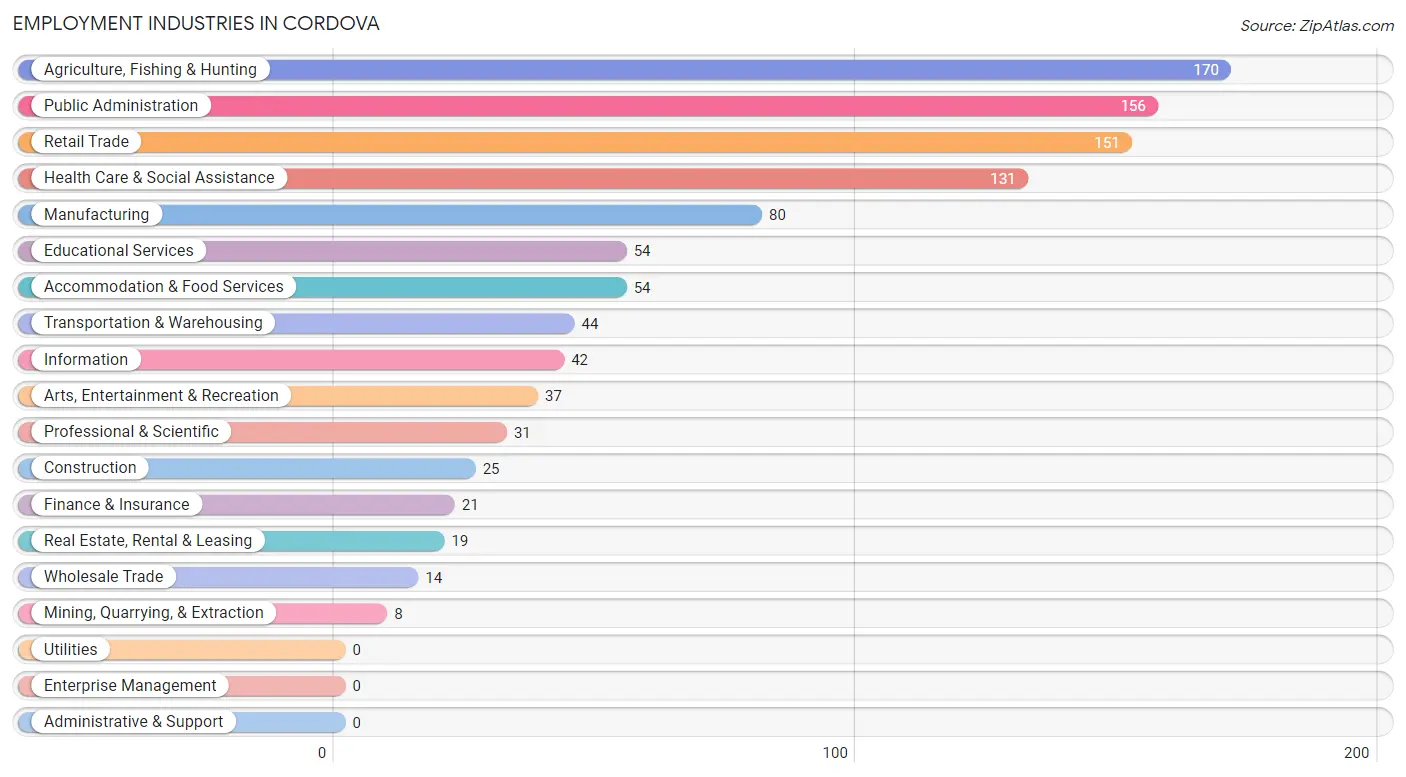
Employment Industries in Cordova
The major employment industries in Cordova include Agriculture, Fishing & Hunting (170 | 15.8%), Public Administration (156 | 14.5%), Retail Trade (151 | 14.0%), Health Care & Social Assistance (131 | 12.1%), and Manufacturing (80 | 7.4%).
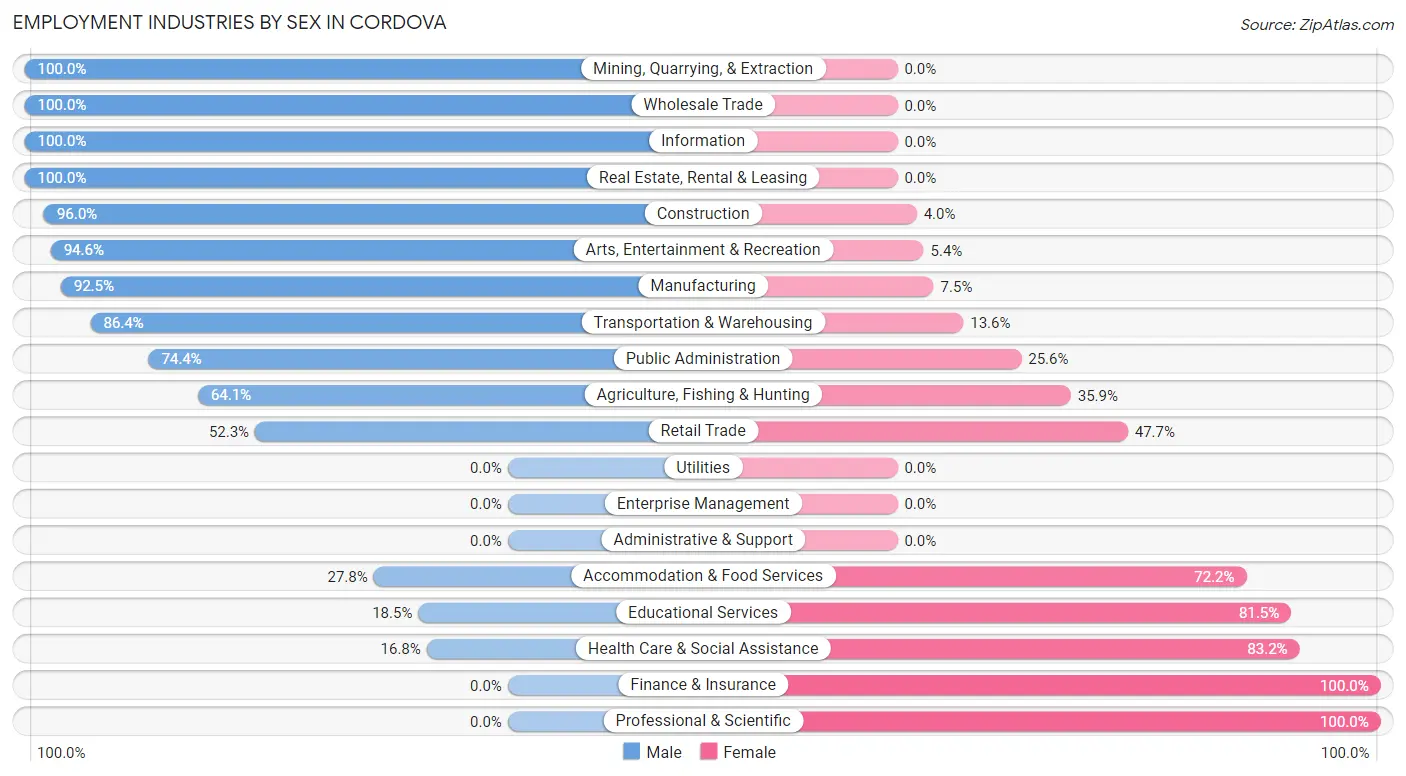
Employment Industries by Sex in Cordova
The Cordova industries that see more men than women are Mining, Quarrying, & Extraction (100.0%), Wholesale Trade (100.0%), and Information (100.0%), whereas the industries that tend to have a higher number of women are Finance & Insurance (100.0%), Professional & Scientific (100.0%), and Health Care & Social Assistance (83.2%).
| Industry | Male | Female |
| Agriculture, Fishing & Hunting | 109 (64.1%) | 61 (35.9%) |
| Mining, Quarrying, & Extraction | 8 (100.0%) | 0 (0.0%) |
| Construction | 24 (96.0%) | 1 (4.0%) |
| Manufacturing | 74 (92.5%) | 6 (7.5%) |
| Wholesale Trade | 14 (100.0%) | 0 (0.0%) |
| Retail Trade | 79 (52.3%) | 72 (47.7%) |
| Transportation & Warehousing | 38 (86.4%) | 6 (13.6%) |
| Utilities | 0 (0.0%) | 0 (0.0%) |
| Information | 42 (100.0%) | 0 (0.0%) |
| Finance & Insurance | 0 (0.0%) | 21 (100.0%) |
| Real Estate, Rental & Leasing | 19 (100.0%) | 0 (0.0%) |
| Professional & Scientific | 0 (0.0%) | 31 (100.0%) |
| Enterprise Management | 0 (0.0%) | 0 (0.0%) |
| Administrative & Support | 0 (0.0%) | 0 (0.0%) |
| Educational Services | 10 (18.5%) | 44 (81.5%) |
| Health Care & Social Assistance | 22 (16.8%) | 109 (83.2%) |
| Arts, Entertainment & Recreation | 35 (94.6%) | 2 (5.4%) |
| Accommodation & Food Services | 15 (27.8%) | 39 (72.2%) |
| Public Administration | 116 (74.4%) | 40 (25.6%) |
| Total | 607 (56.3%) | 471 (43.7%) |
Education in Cordova
School Enrollment in Cordova
The most common levels of schooling among the 495 students in Cordova are middle school (197 | 39.8%), high school (71 | 14.3%), and kindergarten (67 | 13.5%).
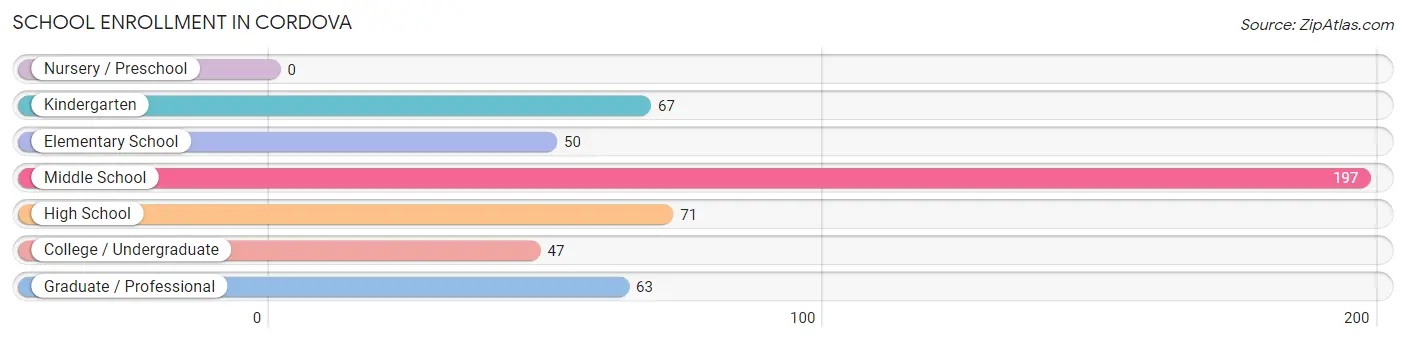
| School Level | # Students | % Students |
| Nursery / Preschool | 0 | 0.0% |
| Kindergarten | 67 | 13.5% |
| Elementary School | 50 | 10.1% |
| Middle School | 197 | 39.8% |
| High School | 71 | 14.3% |
| College / Undergraduate | 47 | 9.5% |
| Graduate / Professional | 63 | 12.7% |
| Total | 495 | 100.0% |
School Enrollment by Age by Funding Source in Cordova
Out of a total of 495 students who are enrolled in schools in Cordova, 120 (24.2%) attend a private institution, while the remaining 375 (75.8%) are enrolled in public schools. The age group of 25 to 34 year olds has the highest likelihood of being enrolled in private schools, with 13 (81.2% in the age bracket) enrolled. Conversely, the age group of 10 to 14 year olds has the lowest likelihood of being enrolled in a private school, with 204 (100.0% in the age bracket) attending a public institution.
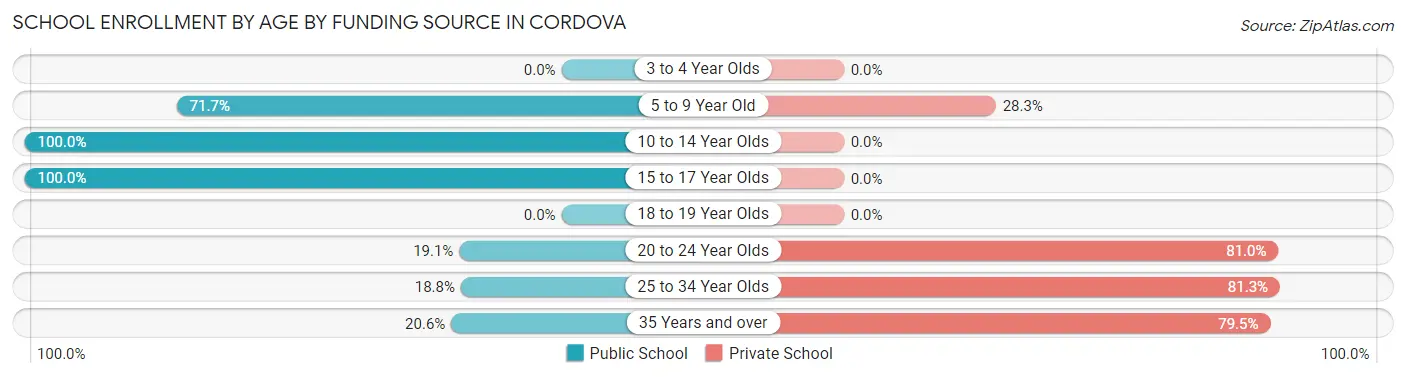
| Age Bracket | Public School | Private School |
| 3 to 4 Year Olds | 0 (0.0%) | 0 (0.0%) |
| 5 to 9 Year Old | 81 (71.7%) | 32 (28.3%) |
| 10 to 14 Year Olds | 204 (100.0%) | 0 (0.0%) |
| 15 to 17 Year Olds | 68 (100.0%) | 0 (0.0%) |
| 18 to 19 Year Olds | 0 (0.0%) | 0 (0.0%) |
| 20 to 24 Year Olds | 4 (19.1%) | 17 (80.9%) |
| 25 to 34 Year Olds | 3 (18.8%) | 13 (81.2%) |
| 35 Years and over | 15 (20.5%) | 58 (79.4%) |
| Total | 375 (75.8%) | 120 (24.2%) |
Educational Attainment by Field of Study in Cordova
Bio, nature & agricultural (138 | 20.6%), science & technology (79 | 11.8%), liberal arts & history (76 | 11.3%), visual & performing arts (68 | 10.2%), and arts & humanities (52 | 7.8%) are the most common fields of study among 670 individuals in Cordova who have obtained a bachelor's degree or higher.
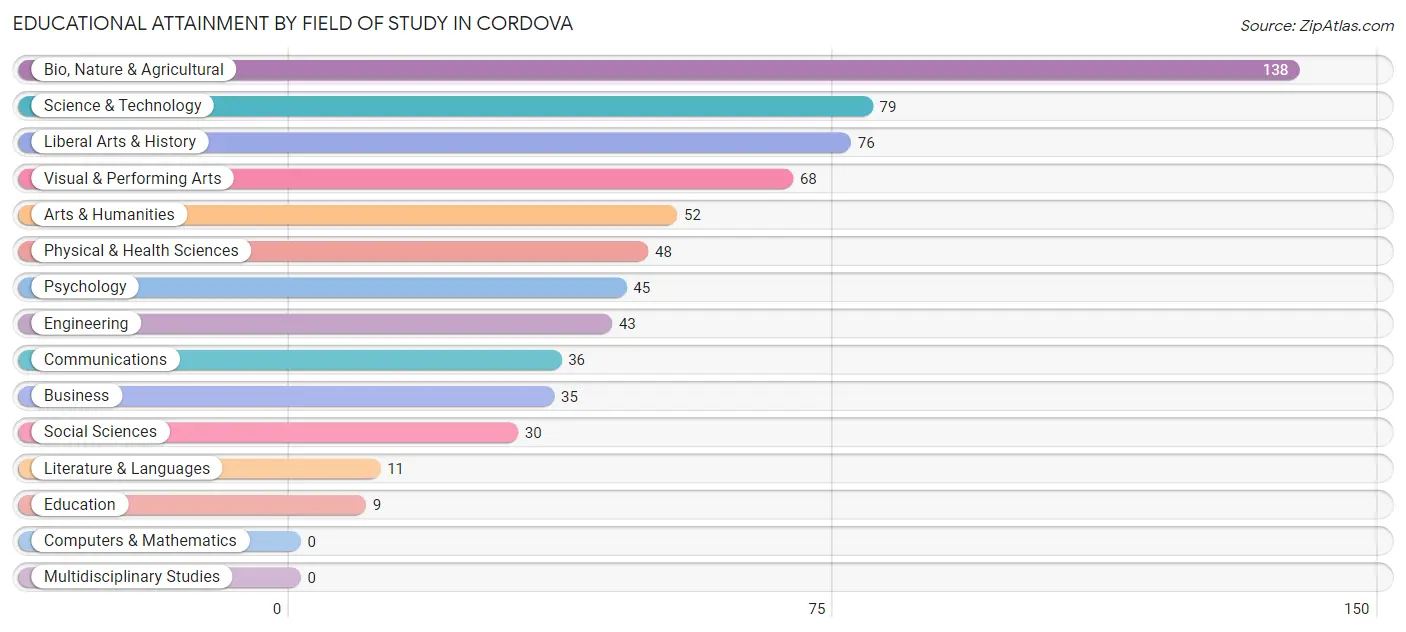
| Field of Study | # Graduates | % Graduates |
| Computers & Mathematics | 0 | 0.0% |
| Bio, Nature & Agricultural | 138 | 20.6% |
| Physical & Health Sciences | 48 | 7.2% |
| Psychology | 45 | 6.7% |
| Social Sciences | 30 | 4.5% |
| Engineering | 43 | 6.4% |
| Multidisciplinary Studies | 0 | 0.0% |
| Science & Technology | 79 | 11.8% |
| Business | 35 | 5.2% |
| Education | 9 | 1.3% |
| Literature & Languages | 11 | 1.6% |
| Liberal Arts & History | 76 | 11.3% |
| Visual & Performing Arts | 68 | 10.2% |
| Communications | 36 | 5.4% |
| Arts & Humanities | 52 | 7.8% |
| Total | 670 | 100.0% |
Transportation & Commute in Cordova
Vehicle Availability by Sex in Cordova
The most prevalent vehicle ownership categories in Cordova are males with 2 vehicles (299, accounting for 49.0%) and females with 2 vehicles (284, making up 73.8%).
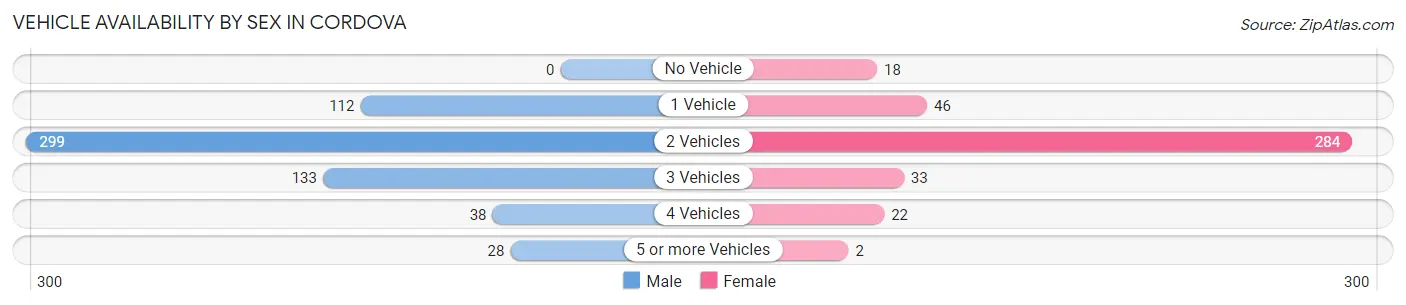
| Vehicles Available | Male | Female |
| No Vehicle | 0 (0.0%) | 18 (4.4%) |
| 1 Vehicle | 112 (18.4%) | 46 (11.4%) |
| 2 Vehicles | 299 (49.0%) | 284 (70.1%) |
| 3 Vehicles | 133 (21.8%) | 33 (8.2%) |
| 4 Vehicles | 38 (6.2%) | 22 (5.4%) |
| 5 or more Vehicles | 28 (4.6%) | 2 (0.5%) |
| Total | 610 (100.0%) | 405 (100.0%) |
Commute Time in Cordova
The most frequently occuring commute durations in Cordova are 5 to 9 minutes (447 commuters, 42.0%), less than 5 minutes (378 commuters, 35.6%), and 10 to 14 minutes (102 commuters, 9.6%).
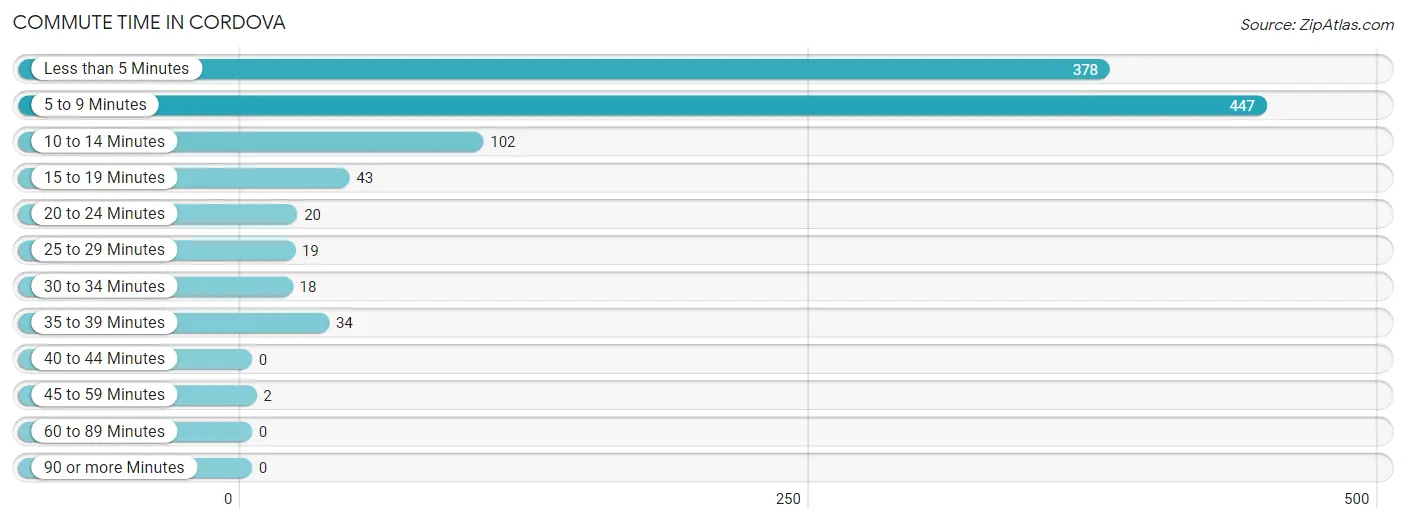
| Commute Time | # Commuters | % Commuters |
| Less than 5 Minutes | 378 | 35.6% |
| 5 to 9 Minutes | 447 | 42.0% |
| 10 to 14 Minutes | 102 | 9.6% |
| 15 to 19 Minutes | 43 | 4.1% |
| 20 to 24 Minutes | 20 | 1.9% |
| 25 to 29 Minutes | 19 | 1.8% |
| 30 to 34 Minutes | 18 | 1.7% |
| 35 to 39 Minutes | 34 | 3.2% |
| 40 to 44 Minutes | 0 | 0.0% |
| 45 to 59 Minutes | 2 | 0.2% |
| 60 to 89 Minutes | 0 | 0.0% |
| 90 or more Minutes | 0 | 0.0% |
Commute Time by Sex in Cordova
The most common commute times in Cordova are 5 to 9 minutes (290 commuters, 46.3%) for males and less than 5 minutes (168 commuters, 38.5%) for females.
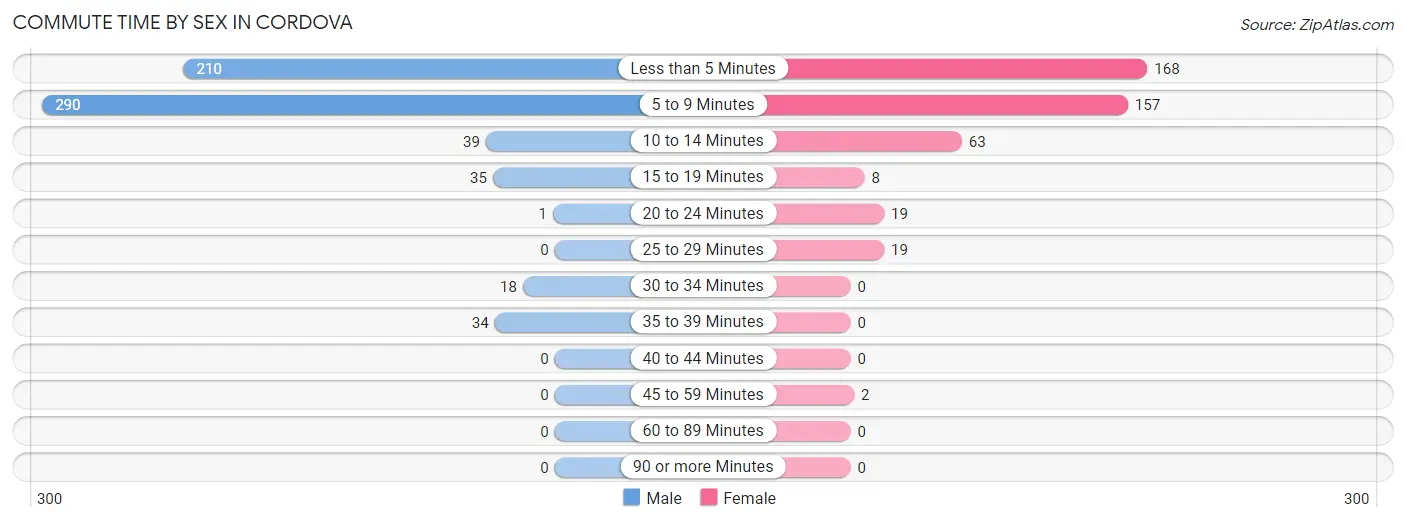
| Commute Time | Male | Female |
| Less than 5 Minutes | 210 (33.5%) | 168 (38.5%) |
| 5 to 9 Minutes | 290 (46.3%) | 157 (36.0%) |
| 10 to 14 Minutes | 39 (6.2%) | 63 (14.4%) |
| 15 to 19 Minutes | 35 (5.6%) | 8 (1.8%) |
| 20 to 24 Minutes | 1 (0.2%) | 19 (4.4%) |
| 25 to 29 Minutes | 0 (0.0%) | 19 (4.4%) |
| 30 to 34 Minutes | 18 (2.9%) | 0 (0.0%) |
| 35 to 39 Minutes | 34 (5.4%) | 0 (0.0%) |
| 40 to 44 Minutes | 0 (0.0%) | 0 (0.0%) |
| 45 to 59 Minutes | 0 (0.0%) | 2 (0.5%) |
| 60 to 89 Minutes | 0 (0.0%) | 0 (0.0%) |
| 90 or more Minutes | 0 (0.0%) | 0 (0.0%) |
Time of Departure to Work by Sex in Cordova
The most frequent times of departure to work in Cordova are 8:00 AM to 8:29 AM (103, 16.4%) for males and 8:00 AM to 8:29 AM (133, 30.5%) for females.
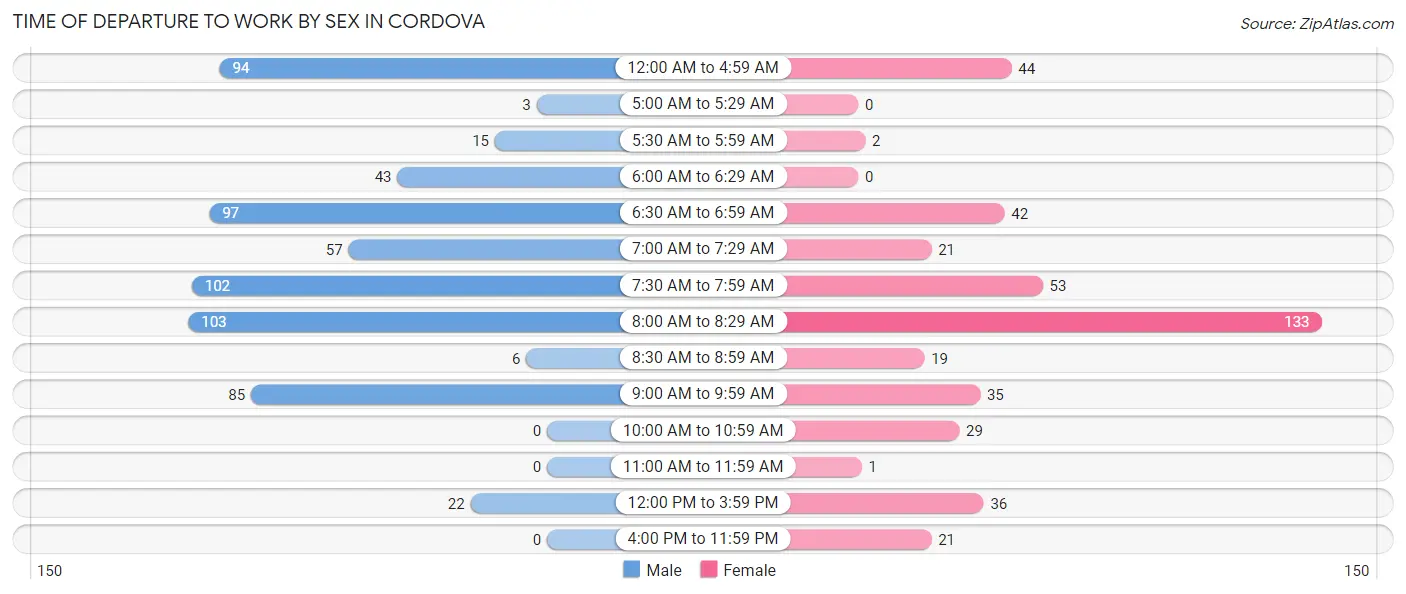
| Time of Departure | Male | Female |
| 12:00 AM to 4:59 AM | 94 (15.0%) | 44 (10.1%) |
| 5:00 AM to 5:29 AM | 3 (0.5%) | 0 (0.0%) |
| 5:30 AM to 5:59 AM | 15 (2.4%) | 2 (0.5%) |
| 6:00 AM to 6:29 AM | 43 (6.9%) | 0 (0.0%) |
| 6:30 AM to 6:59 AM | 97 (15.5%) | 42 (9.6%) |
| 7:00 AM to 7:29 AM | 57 (9.1%) | 21 (4.8%) |
| 7:30 AM to 7:59 AM | 102 (16.3%) | 53 (12.2%) |
| 8:00 AM to 8:29 AM | 103 (16.4%) | 133 (30.5%) |
| 8:30 AM to 8:59 AM | 6 (1.0%) | 19 (4.4%) |
| 9:00 AM to 9:59 AM | 85 (13.6%) | 35 (8.0%) |
| 10:00 AM to 10:59 AM | 0 (0.0%) | 29 (6.7%) |
| 11:00 AM to 11:59 AM | 0 (0.0%) | 1 (0.2%) |
| 12:00 PM to 3:59 PM | 22 (3.5%) | 36 (8.3%) |
| 4:00 PM to 11:59 PM | 0 (0.0%) | 21 (4.8%) |
| Total | 627 (100.0%) | 436 (100.0%) |
Housing Occupancy in Cordova
Occupancy by Ownership in Cordova
Of the total 883 dwellings in Cordova, owner-occupied units account for 590 (66.8%), while renter-occupied units make up 293 (33.2%).
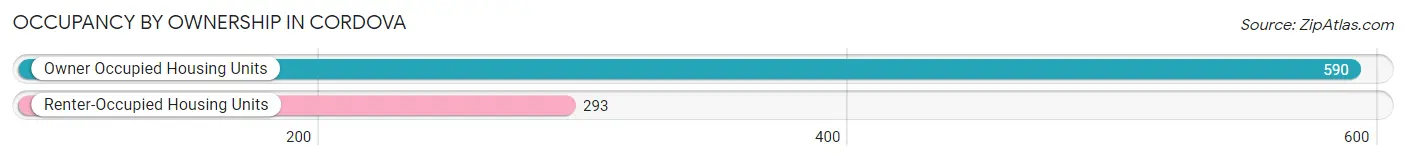
| Occupancy | # Housing Units | % Housing Units |
| Owner Occupied Housing Units | 590 | 66.8% |
| Renter-Occupied Housing Units | 293 | 33.2% |
| Total Occupied Housing Units | 883 | 100.0% |
Occupancy by Household Size in Cordova
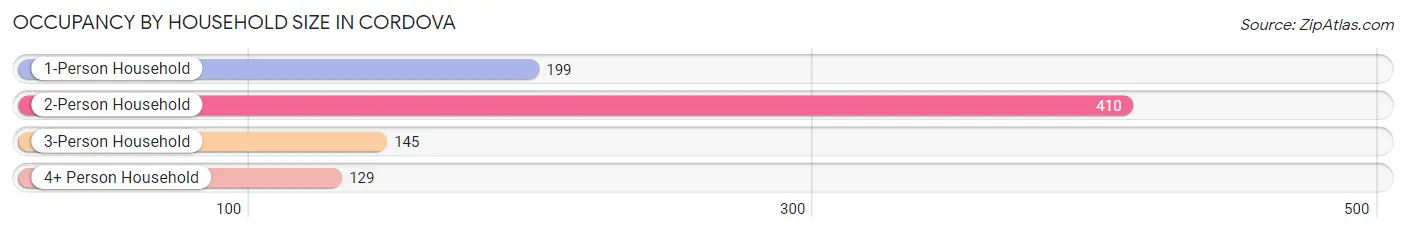
| Household Size | # Housing Units | % Housing Units |
| 1-Person Household | 199 | 22.5% |
| 2-Person Household | 410 | 46.4% |
| 3-Person Household | 145 | 16.4% |
| 4+ Person Household | 129 | 14.6% |
| Total Housing Units | 883 | 100.0% |
Occupancy by Ownership by Household Size in Cordova
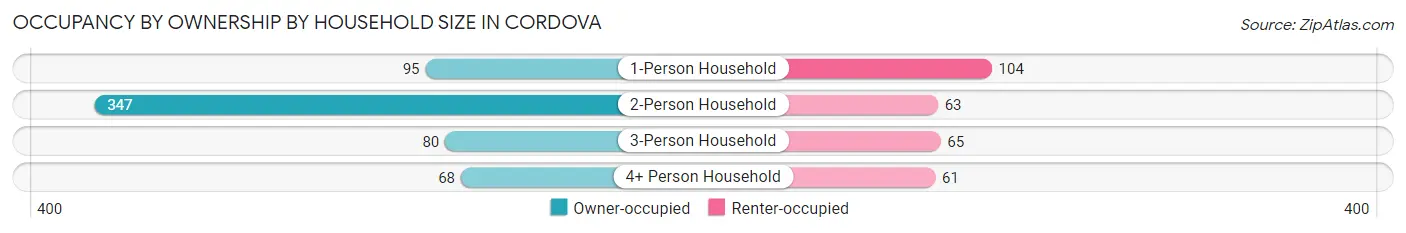
| Household Size | Owner-occupied | Renter-occupied |
| 1-Person Household | 95 (47.7%) | 104 (52.3%) |
| 2-Person Household | 347 (84.6%) | 63 (15.4%) |
| 3-Person Household | 80 (55.2%) | 65 (44.8%) |
| 4+ Person Household | 68 (52.7%) | 61 (47.3%) |
| Total Housing Units | 590 (66.8%) | 293 (33.2%) |
Occupancy by Educational Attainment in Cordova
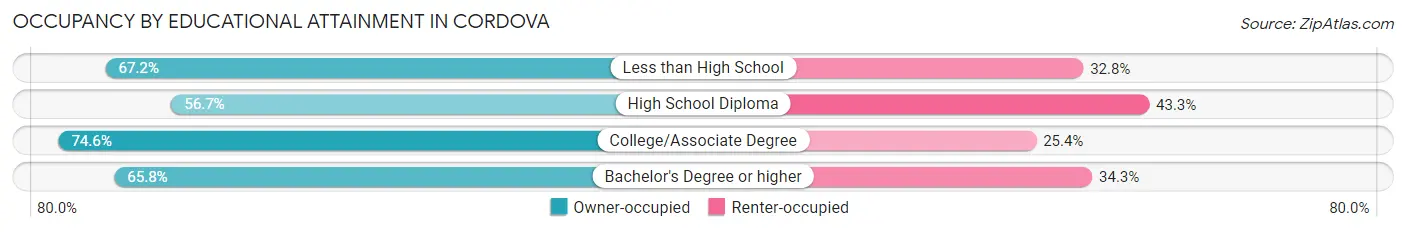
| Household Size | Owner-occupied | Renter-occupied |
| Less than High School | 45 (67.2%) | 22 (32.8%) |
| High School Diploma | 131 (56.7%) | 100 (43.3%) |
| College/Associate Degree | 247 (74.6%) | 84 (25.4%) |
| Bachelor's Degree or higher | 167 (65.7%) | 87 (34.3%) |
Occupancy by Age of Householder in Cordova
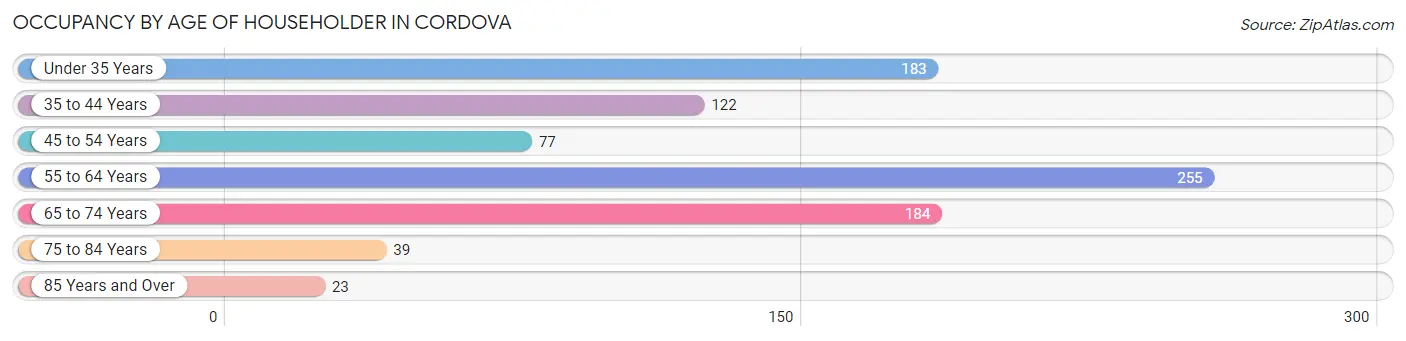
| Age Bracket | # Households | % Households |
| Under 35 Years | 183 | 20.7% |
| 35 to 44 Years | 122 | 13.8% |
| 45 to 54 Years | 77 | 8.7% |
| 55 to 64 Years | 255 | 28.9% |
| 65 to 74 Years | 184 | 20.8% |
| 75 to 84 Years | 39 | 4.4% |
| 85 Years and Over | 23 | 2.6% |
| Total | 883 | 100.0% |
Housing Finances in Cordova
Median Income by Occupancy in Cordova
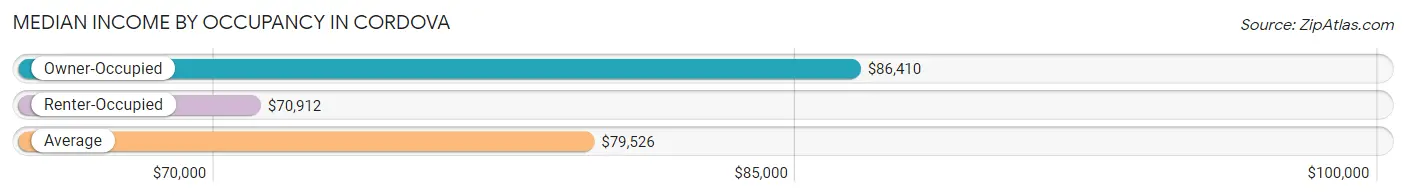
| Occupancy Type | # Households | Median Income |
| Owner-Occupied | 590 (66.8%) | $86,410 |
| Renter-Occupied | 293 (33.2%) | $70,912 |
| Average | 883 (100.0%) | $79,526 |
Occupancy by Householder Income Bracket in Cordova
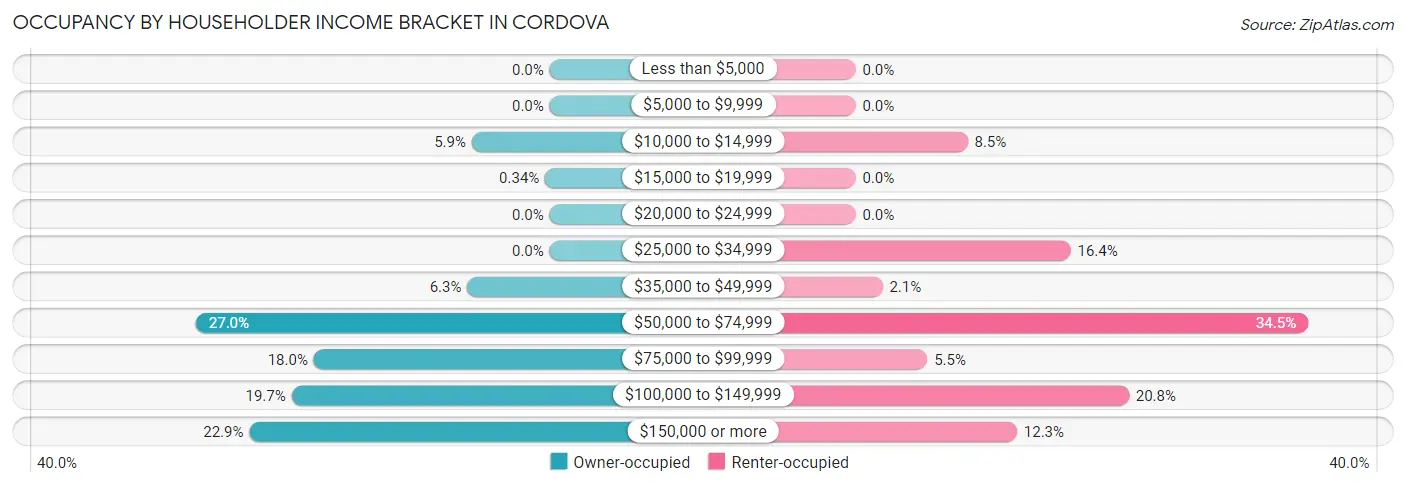
| Income Bracket | Owner-occupied | Renter-occupied |
| Less than $5,000 | 0 (0.0%) | 0 (0.0%) |
| $5,000 to $9,999 | 0 (0.0%) | 0 (0.0%) |
| $10,000 to $14,999 | 35 (5.9%) | 25 (8.5%) |
| $15,000 to $19,999 | 2 (0.3%) | 0 (0.0%) |
| $20,000 to $24,999 | 0 (0.0%) | 0 (0.0%) |
| $25,000 to $34,999 | 0 (0.0%) | 48 (16.4%) |
| $35,000 to $49,999 | 37 (6.3%) | 6 (2.1%) |
| $50,000 to $74,999 | 159 (27.0%) | 101 (34.5%) |
| $75,000 to $99,999 | 106 (18.0%) | 16 (5.5%) |
| $100,000 to $149,999 | 116 (19.7%) | 61 (20.8%) |
| $150,000 or more | 135 (22.9%) | 36 (12.3%) |
| Total | 590 (100.0%) | 293 (100.0%) |
Monthly Housing Cost Tiers in Cordova
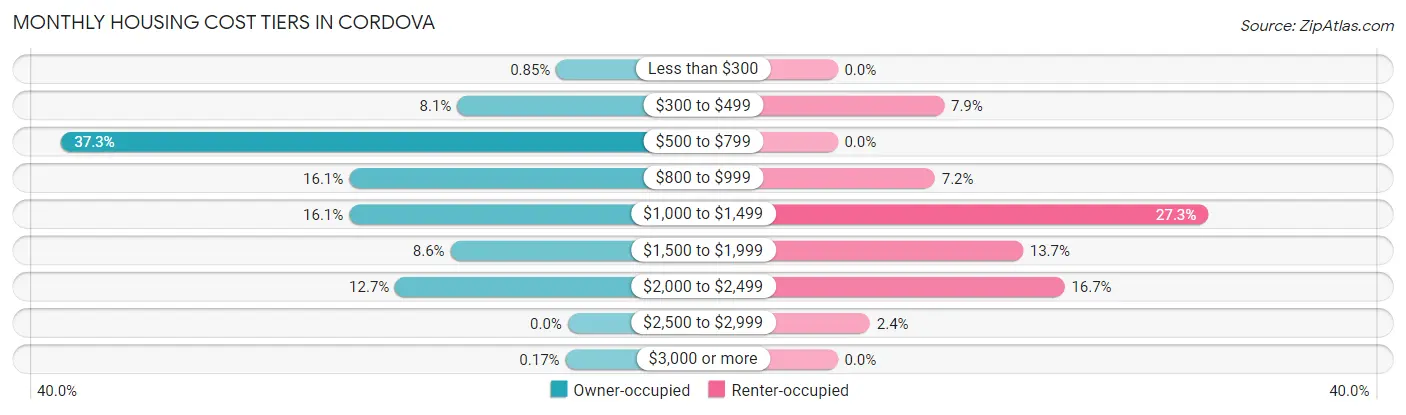
| Monthly Cost | Owner-occupied | Renter-occupied |
| Less than $300 | 5 (0.9%) | 0 (0.0%) |
| $300 to $499 | 48 (8.1%) | 23 (7.9%) |
| $500 to $799 | 220 (37.3%) | 0 (0.0%) |
| $800 to $999 | 95 (16.1%) | 21 (7.2%) |
| $1,000 to $1,499 | 95 (16.1%) | 80 (27.3%) |
| $1,500 to $1,999 | 51 (8.6%) | 40 (13.7%) |
| $2,000 to $2,499 | 75 (12.7%) | 49 (16.7%) |
| $2,500 to $2,999 | 0 (0.0%) | 7 (2.4%) |
| $3,000 or more | 1 (0.2%) | 0 (0.0%) |
| Total | 590 (100.0%) | 293 (100.0%) |
Physical Housing Characteristics in Cordova
Housing Structures in Cordova
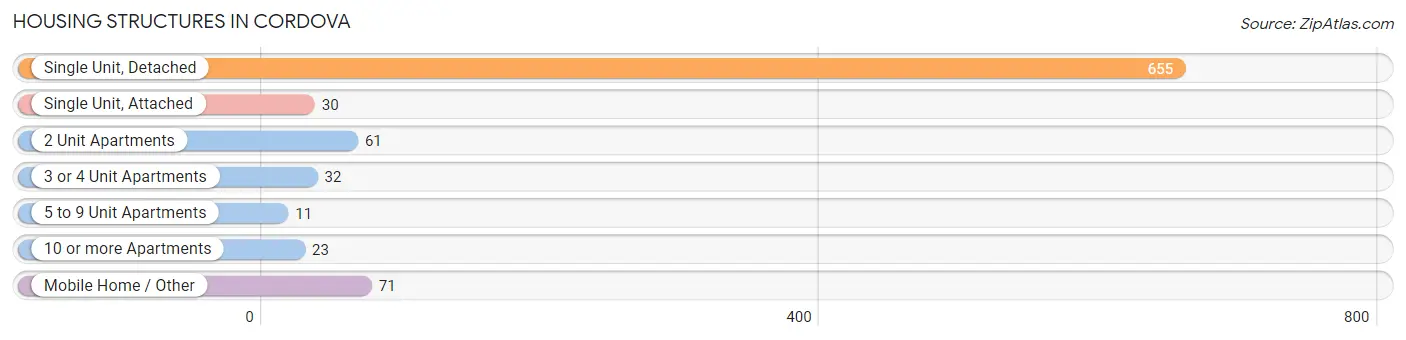
| Structure Type | # Housing Units | % Housing Units |
| Single Unit, Detached | 655 | 74.2% |
| Single Unit, Attached | 30 | 3.4% |
| 2 Unit Apartments | 61 | 6.9% |
| 3 or 4 Unit Apartments | 32 | 3.6% |
| 5 to 9 Unit Apartments | 11 | 1.3% |
| 10 or more Apartments | 23 | 2.6% |
| Mobile Home / Other | 71 | 8.0% |
| Total | 883 | 100.0% |
Housing Structures by Occupancy in Cordova
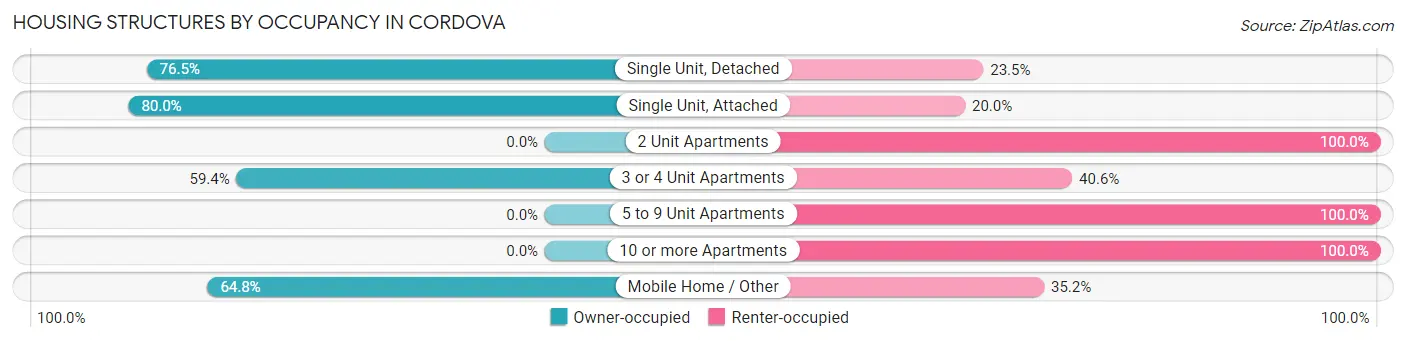
| Structure Type | Owner-occupied | Renter-occupied |
| Single Unit, Detached | 501 (76.5%) | 154 (23.5%) |
| Single Unit, Attached | 24 (80.0%) | 6 (20.0%) |
| 2 Unit Apartments | 0 (0.0%) | 61 (100.0%) |
| 3 or 4 Unit Apartments | 19 (59.4%) | 13 (40.6%) |
| 5 to 9 Unit Apartments | 0 (0.0%) | 11 (100.0%) |
| 10 or more Apartments | 0 (0.0%) | 23 (100.0%) |
| Mobile Home / Other | 46 (64.8%) | 25 (35.2%) |
| Total | 590 (66.8%) | 293 (33.2%) |
Housing Structures by Number of Rooms in Cordova
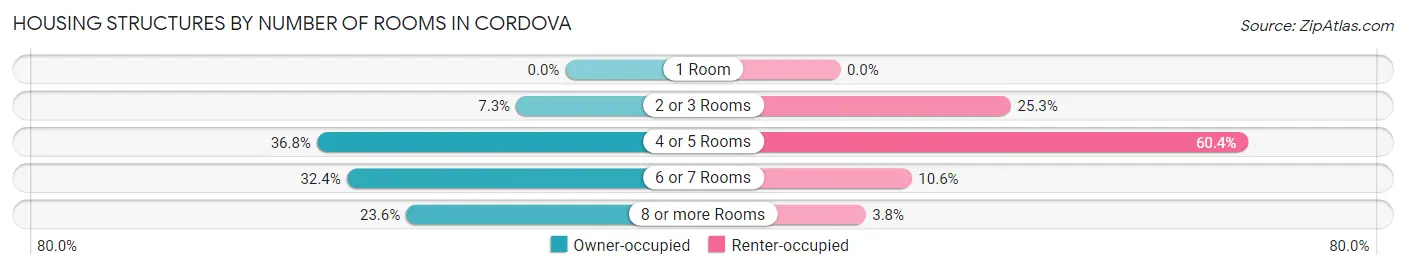
| Number of Rooms | Owner-occupied | Renter-occupied |
| 1 Room | 0 (0.0%) | 0 (0.0%) |
| 2 or 3 Rooms | 43 (7.3%) | 74 (25.3%) |
| 4 or 5 Rooms | 217 (36.8%) | 177 (60.4%) |
| 6 or 7 Rooms | 191 (32.4%) | 31 (10.6%) |
| 8 or more Rooms | 139 (23.6%) | 11 (3.7%) |
| Total | 590 (100.0%) | 293 (100.0%) |
Housing Structure by Heating Type in Cordova
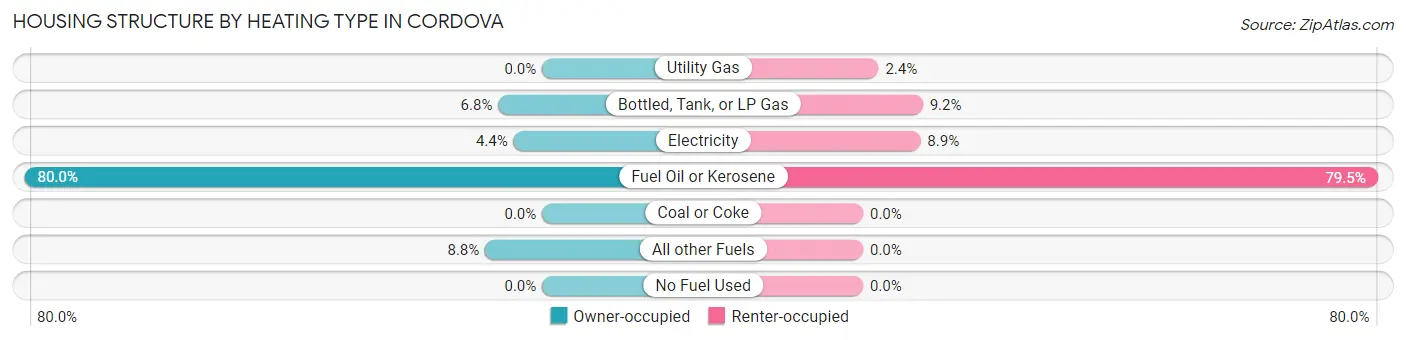
| Heating Type | Owner-occupied | Renter-occupied |
| Utility Gas | 0 (0.0%) | 7 (2.4%) |
| Bottled, Tank, or LP Gas | 40 (6.8%) | 27 (9.2%) |
| Electricity | 26 (4.4%) | 26 (8.9%) |
| Fuel Oil or Kerosene | 472 (80.0%) | 233 (79.5%) |
| Coal or Coke | 0 (0.0%) | 0 (0.0%) |
| All other Fuels | 52 (8.8%) | 0 (0.0%) |
| No Fuel Used | 0 (0.0%) | 0 (0.0%) |
| Total | 590 (100.0%) | 293 (100.0%) |
Household Vehicle Usage in Cordova
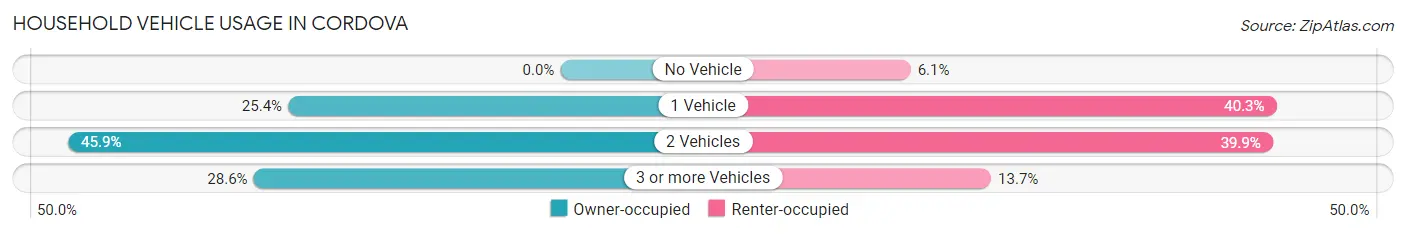
| Vehicles per Household | Owner-occupied | Renter-occupied |
| No Vehicle | 0 (0.0%) | 18 (6.1%) |
| 1 Vehicle | 150 (25.4%) | 118 (40.3%) |
| 2 Vehicles | 271 (45.9%) | 117 (39.9%) |
| 3 or more Vehicles | 169 (28.6%) | 40 (13.7%) |
| Total | 590 (100.0%) | 293 (100.0%) |
Real Estate & Mortgages in Cordova
Real Estate and Mortgage Overview in Cordova
| Characteristic | Without Mortgage | With Mortgage |
| Housing Units | 454 | 136 |
| Median Property Value | $348,800 | $325,400 |
| Median Household Income | $77,586 | $59 |
| Monthly Housing Costs | $706 | $1 |
| Real Estate Taxes | $3,143 | $4 |
Property Value by Mortgage Status in Cordova
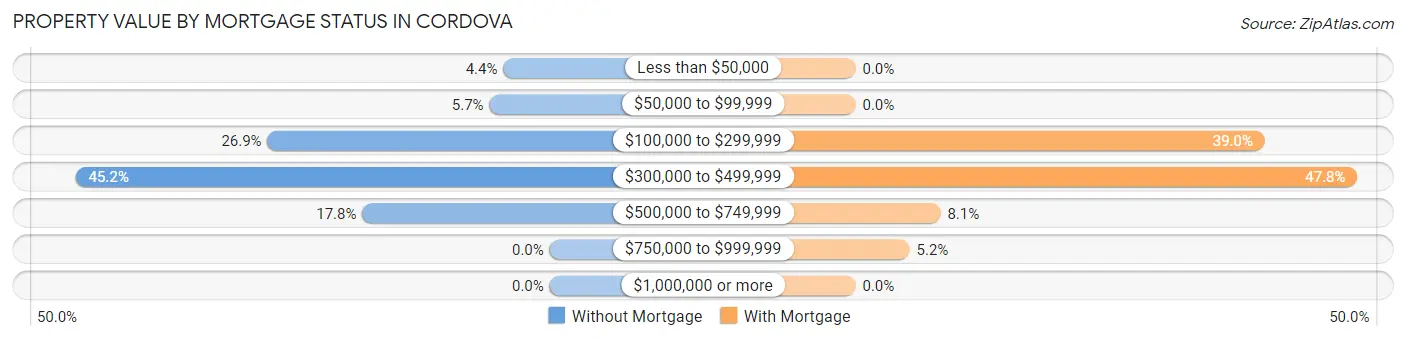
| Property Value | Without Mortgage | With Mortgage |
| Less than $50,000 | 20 (4.4%) | 0 (0.0%) |
| $50,000 to $99,999 | 26 (5.7%) | 0 (0.0%) |
| $100,000 to $299,999 | 122 (26.9%) | 53 (39.0%) |
| $300,000 to $499,999 | 205 (45.2%) | 65 (47.8%) |
| $500,000 to $749,999 | 81 (17.8%) | 11 (8.1%) |
| $750,000 to $999,999 | 0 (0.0%) | 7 (5.1%) |
| $1,000,000 or more | 0 (0.0%) | 0 (0.0%) |
| Total | 454 (100.0%) | 136 (100.0%) |
Household Income by Mortgage Status in Cordova
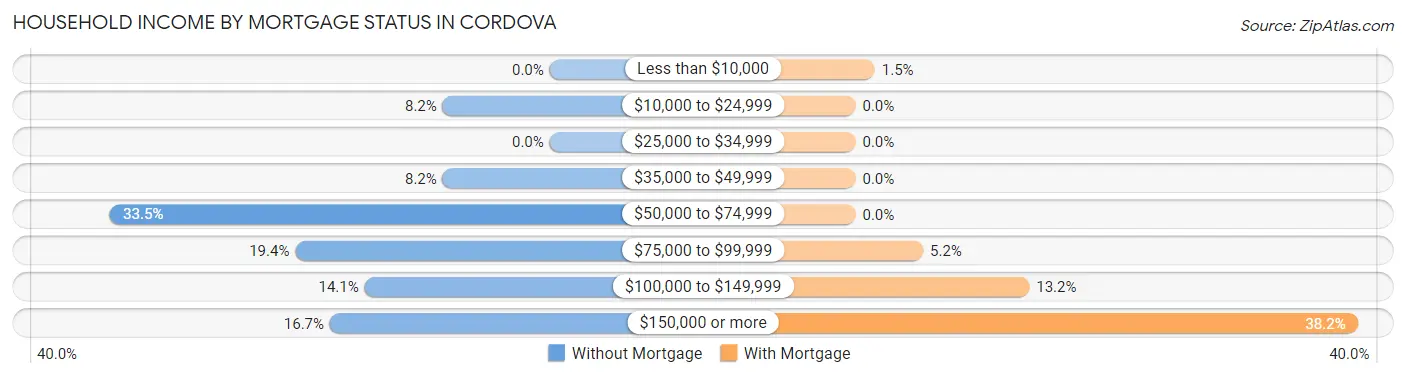
| Household Income | Without Mortgage | With Mortgage |
| Less than $10,000 | 0 (0.0%) | 2 (1.5%) |
| $10,000 to $24,999 | 37 (8.2%) | 0 (0.0%) |
| $25,000 to $34,999 | 0 (0.0%) | 0 (0.0%) |
| $35,000 to $49,999 | 37 (8.2%) | 0 (0.0%) |
| $50,000 to $74,999 | 152 (33.5%) | 0 (0.0%) |
| $75,000 to $99,999 | 88 (19.4%) | 7 (5.1%) |
| $100,000 to $149,999 | 64 (14.1%) | 18 (13.2%) |
| $150,000 or more | 76 (16.7%) | 52 (38.2%) |
| Total | 454 (100.0%) | 136 (100.0%) |
Property Value to Household Income Ratio in Cordova
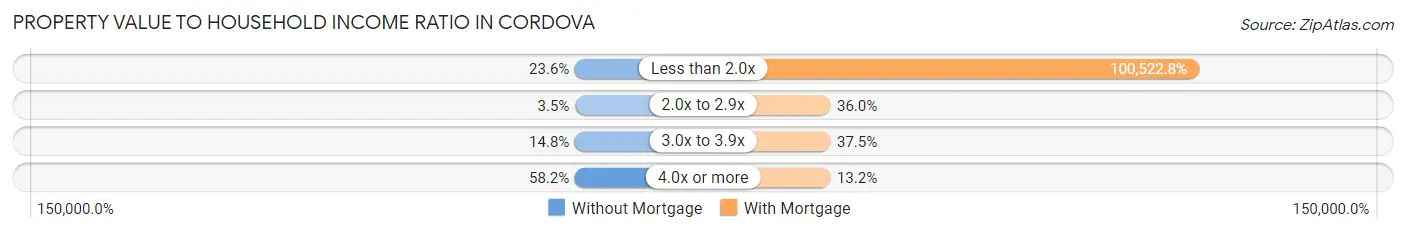
| Value-to-Income Ratio | Without Mortgage | With Mortgage |
| Less than 2.0x | 107 (23.6%) | 136,711 (100,522.8%) |
| 2.0x to 2.9x | 16 (3.5%) | 49 (36.0%) |
| 3.0x to 3.9x | 67 (14.8%) | 51 (37.5%) |
| 4.0x or more | 264 (58.2%) | 18 (13.2%) |
| Total | 454 (100.0%) | 136 (100.0%) |
Real Estate Taxes by Mortgage Status in Cordova
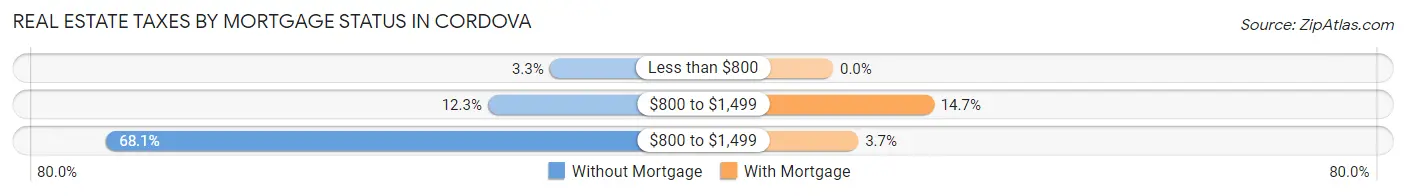
| Property Taxes | Without Mortgage | With Mortgage |
| Less than $800 | 15 (3.3%) | 0 (0.0%) |
| $800 to $1,499 | 56 (12.3%) | 20 (14.7%) |
| $800 to $1,499 | 309 (68.1%) | 5 (3.7%) |
| Total | 454 (100.0%) | 136 (100.0%) |
Health & Disability in Cordova
Health Insurance Coverage by Age in Cordova
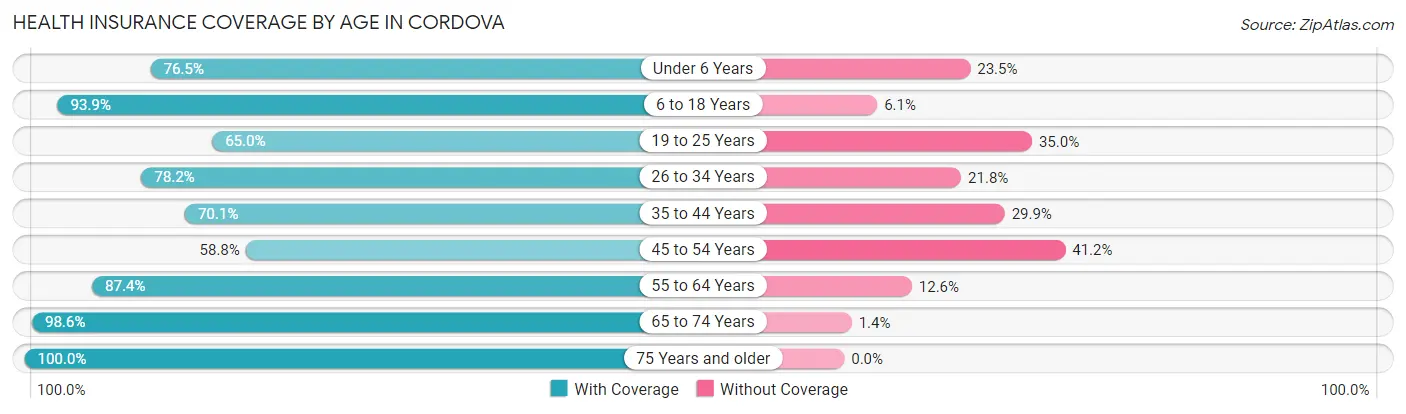
| Age Bracket | With Coverage | Without Coverage |
| Under 6 Years | 127 (76.5%) | 39 (23.5%) |
| 6 to 18 Years | 382 (93.9%) | 25 (6.1%) |
| 19 to 25 Years | 78 (65.0%) | 42 (35.0%) |
| 26 to 34 Years | 323 (78.2%) | 90 (21.8%) |
| 35 to 44 Years | 150 (70.1%) | 64 (29.9%) |
| 45 to 54 Years | 107 (58.8%) | 75 (41.2%) |
| 55 to 64 Years | 423 (87.4%) | 61 (12.6%) |
| 65 to 74 Years | 284 (98.6%) | 4 (1.4%) |
| 75 Years and older | 91 (100.0%) | 0 (0.0%) |
| Total | 1,965 (83.1%) | 400 (16.9%) |
Health Insurance Coverage by Citizenship Status in Cordova
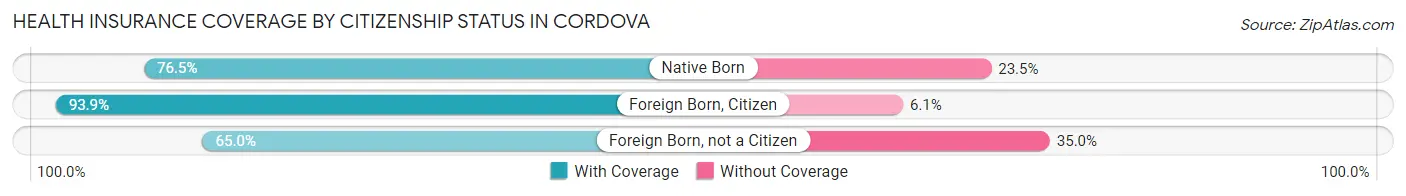
| Citizenship Status | With Coverage | Without Coverage |
| Native Born | 127 (76.5%) | 39 (23.5%) |
| Foreign Born, Citizen | 382 (93.9%) | 25 (6.1%) |
| Foreign Born, not a Citizen | 78 (65.0%) | 42 (35.0%) |
Health Insurance Coverage by Household Income in Cordova
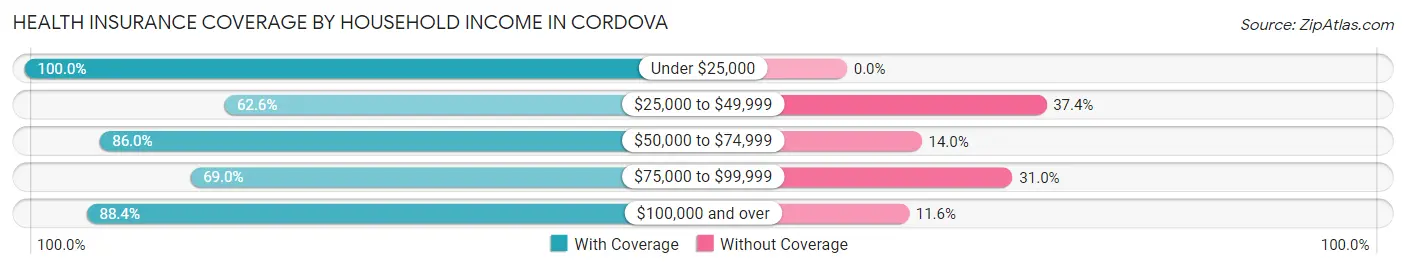
| Household Income | With Coverage | Without Coverage |
| Under $25,000 | 62 (100.0%) | 0 (0.0%) |
| $25,000 to $49,999 | 114 (62.6%) | 68 (37.4%) |
| $50,000 to $74,999 | 430 (86.0%) | 70 (14.0%) |
| $75,000 to $99,999 | 240 (69.0%) | 108 (31.0%) |
| $100,000 and over | 1,096 (88.4%) | 144 (11.6%) |
Public vs Private Health Insurance Coverage by Age in Cordova
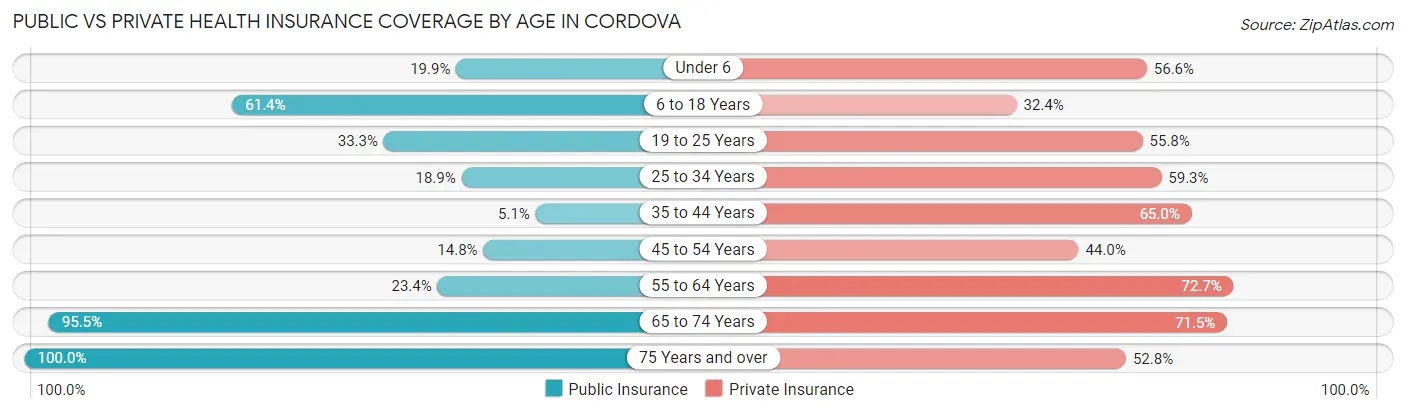
| Age Bracket | Public Insurance | Private Insurance |
| Under 6 | 33 (19.9%) | 94 (56.6%) |
| 6 to 18 Years | 250 (61.4%) | 132 (32.4%) |
| 19 to 25 Years | 40 (33.3%) | 67 (55.8%) |
| 25 to 34 Years | 78 (18.9%) | 245 (59.3%) |
| 35 to 44 Years | 11 (5.1%) | 139 (64.9%) |
| 45 to 54 Years | 27 (14.8%) | 80 (44.0%) |
| 55 to 64 Years | 113 (23.4%) | 352 (72.7%) |
| 65 to 74 Years | 275 (95.5%) | 206 (71.5%) |
| 75 Years and over | 91 (100.0%) | 48 (52.7%) |
| Total | 918 (38.8%) | 1,363 (57.6%) |
Disability Status by Sex by Age in Cordova
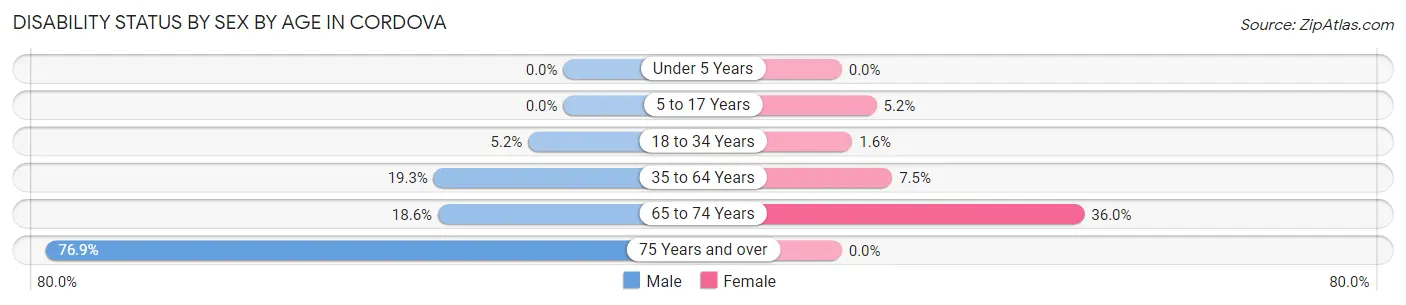
| Age Bracket | Male | Female |
| Under 5 Years | 0 (0.0%) | 0 (0.0%) |
| 5 to 17 Years | 0 (0.0%) | 11 (5.2%) |
| 18 to 34 Years | 14 (5.2%) | 5 (1.6%) |
| 35 to 64 Years | 118 (19.3%) | 20 (7.5%) |
| 65 to 74 Years | 19 (18.6%) | 67 (36.0%) |
| 75 Years and over | 30 (76.9%) | 0 (0.0%) |
Disability Class by Sex by Age in Cordova
Disability Class: Hearing Difficulty
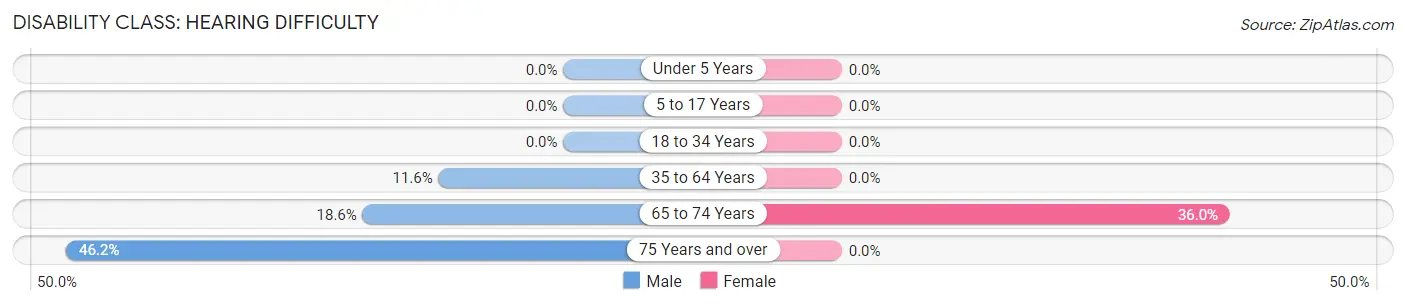
| Age Bracket | Male | Female |
| Under 5 Years | 0 (0.0%) | 0 (0.0%) |
| 5 to 17 Years | 0 (0.0%) | 0 (0.0%) |
| 18 to 34 Years | 0 (0.0%) | 0 (0.0%) |
| 35 to 64 Years | 71 (11.6%) | 0 (0.0%) |
| 65 to 74 Years | 19 (18.6%) | 67 (36.0%) |
| 75 Years and over | 18 (46.2%) | 0 (0.0%) |
Disability Class: Vision Difficulty
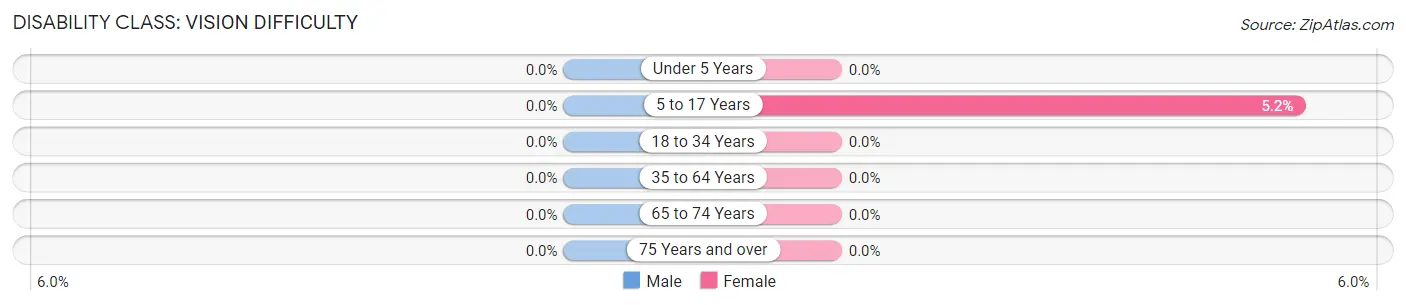
| Age Bracket | Male | Female |
| Under 5 Years | 0 (0.0%) | 0 (0.0%) |
| 5 to 17 Years | 0 (0.0%) | 11 (5.2%) |
| 18 to 34 Years | 0 (0.0%) | 0 (0.0%) |
| 35 to 64 Years | 0 (0.0%) | 0 (0.0%) |
| 65 to 74 Years | 0 (0.0%) | 0 (0.0%) |
| 75 Years and over | 0 (0.0%) | 0 (0.0%) |
Disability Class: Cognitive Difficulty
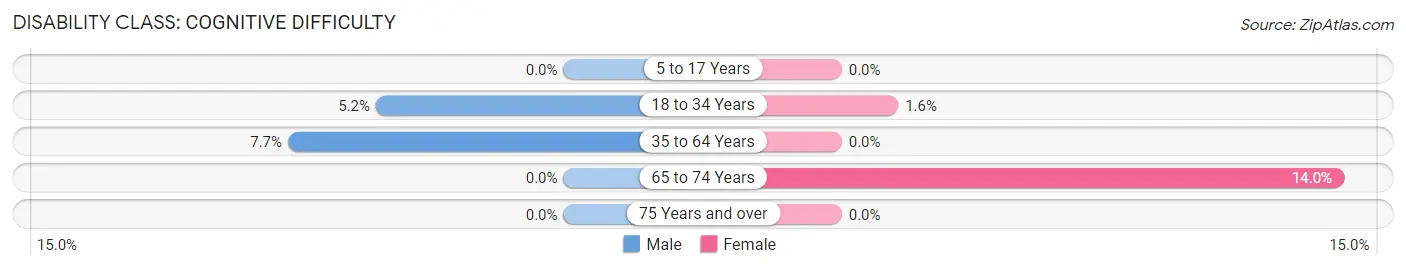
| Age Bracket | Male | Female |
| 5 to 17 Years | 0 (0.0%) | 0 (0.0%) |
| 18 to 34 Years | 14 (5.2%) | 5 (1.6%) |
| 35 to 64 Years | 47 (7.7%) | 0 (0.0%) |
| 65 to 74 Years | 0 (0.0%) | 26 (14.0%) |
| 75 Years and over | 0 (0.0%) | 0 (0.0%) |
Disability Class: Ambulatory Difficulty
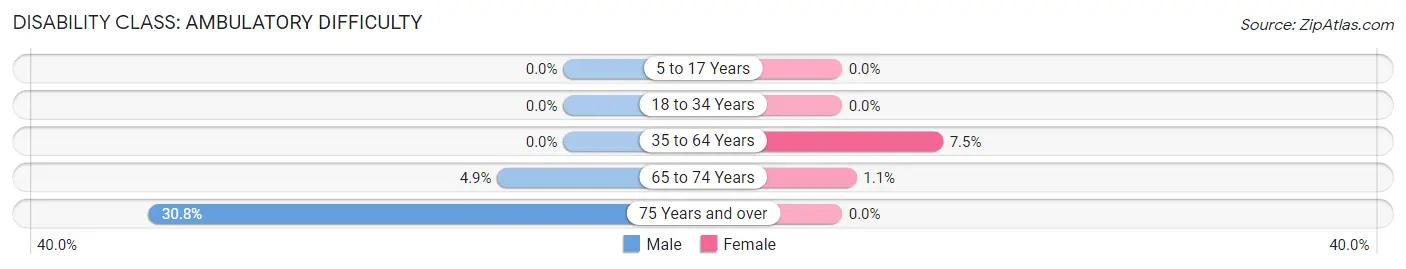
| Age Bracket | Male | Female |
| 5 to 17 Years | 0 (0.0%) | 0 (0.0%) |
| 18 to 34 Years | 0 (0.0%) | 0 (0.0%) |
| 35 to 64 Years | 0 (0.0%) | 20 (7.5%) |
| 65 to 74 Years | 5 (4.9%) | 2 (1.1%) |
| 75 Years and over | 12 (30.8%) | 0 (0.0%) |
Disability Class: Self-Care Difficulty
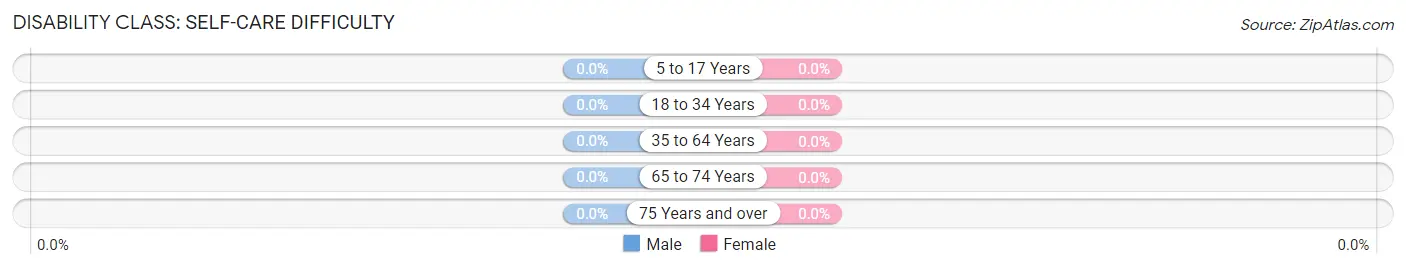
| Age Bracket | Male | Female |
| 5 to 17 Years | 0 (0.0%) | 0 (0.0%) |
| 18 to 34 Years | 0 (0.0%) | 0 (0.0%) |
| 35 to 64 Years | 0 (0.0%) | 0 (0.0%) |
| 65 to 74 Years | 0 (0.0%) | 0 (0.0%) |
| 75 Years and over | 0 (0.0%) | 0 (0.0%) |
Technology Access in Cordova
Computing Device Access in Cordova
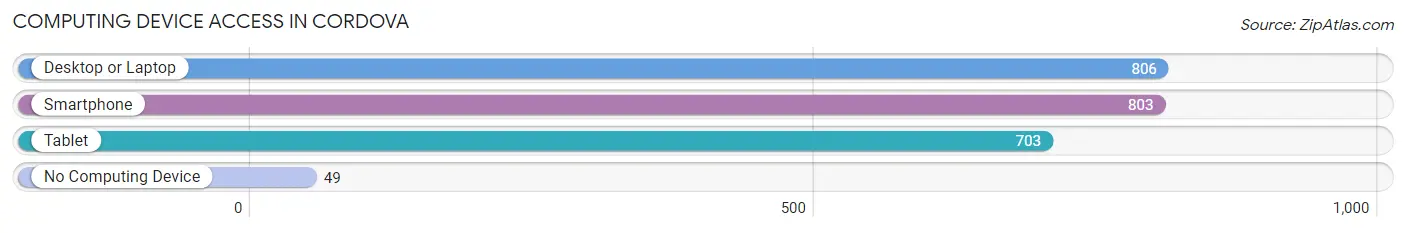
| Device Type | # Households | % Households |
| Desktop or Laptop | 806 | 91.3% |
| Smartphone | 803 | 90.9% |
| Tablet | 703 | 79.6% |
| No Computing Device | 49 | 5.6% |
| Total | 883 | 100.0% |
Internet Access in Cordova
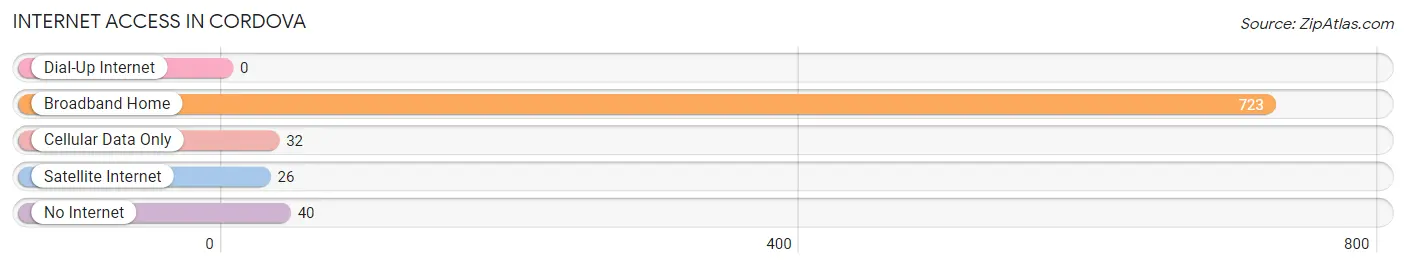
| Internet Type | # Households | % Households |
| Dial-Up Internet | 0 | 0.0% |
| Broadband Home | 723 | 81.9% |
| Cellular Data Only | 32 | 3.6% |
| Satellite Internet | 26 | 2.9% |
| No Internet | 40 | 4.5% |
| Total | 883 | 100.0% |
Cordova Summary
Cordova, Alaska is a small fishing town located on the eastern coast of Prince William Sound. It is situated at the mouth of the Copper River, approximately 110 miles east of Anchorage. The town was founded in 1906 as a fishing port and has since become a major hub for commercial fishing, tourism, and transportation.
Geography
Cordova is located on the eastern coast of Prince William Sound, at the mouth of the Copper River. The town is situated on a narrow strip of land between the Copper River Delta and the Chugach Mountains. The town is surrounded by the waters of the sound, and the nearby Eyak and Orca Inlets. The climate in Cordova is mild and wet, with temperatures ranging from the mid-30s in the winter to the mid-50s in the summer.
Economy
Cordova’s economy is largely based on commercial fishing and tourism. The town is home to several large fishing fleets, which harvest salmon, halibut, and other fish from the waters of Prince William Sound. The seafood industry is the largest employer in the town, and the fish processing plants are a major source of employment. Tourism is also an important part of the local economy, with visitors coming to the town to take advantage of the fishing, hiking, and other outdoor activities.
Demographics
As of the 2010 census, the population of Cordova was 2,239. The town is predominantly white, with a small Native American population. The median household income in Cordova is $50,000, and the median age is 38. The town has a high rate of poverty, with nearly one-third of the population living below the poverty line.
Conclusion
Cordova, Alaska is a small fishing town located on the eastern coast of Prince William Sound. It is home to a large fishing fleet and is a major hub for commercial fishing, tourism, and transportation. The town has a diverse population and a mild climate, and its economy is largely based on fishing and tourism. Cordova is a unique and vibrant community, and its residents are proud of their town’s history and culture.
Common Questions
What is Per Capita Income in Cordova?
Per Capita income in Cordova is $39,962.
What is the Median Family Income in Cordova?
Median Family Income in Cordova is $100,096.
What is the Median Household income in Cordova?
Median Household Income in Cordova is $79,526.
What is Income or Wage Gap in Cordova?
Income or Wage Gap in Cordova is 37.3%.
Women in Cordova earn 62.7 cents for every dollar earned by a man.
What is Inequality or Gini Index in Cordova?
Inequality or Gini Index in Cordova is 0.35.
What is the Total Population of Cordova?
Total Population of Cordova is 2,507.
What is the Total Male Population of Cordova?
Total Male Population of Cordova is 1,330.
What is the Total Female Population of Cordova?
Total Female Population of Cordova is 1,177.
What is the Ratio of Males per 100 Females in Cordova?
There are 113.00 Males per 100 Females in Cordova.
What is the Ratio of Females per 100 Males in Cordova?
There are 88.50 Females per 100 Males in Cordova.
What is the Median Population Age in Cordova?
Median Population Age in Cordova is 36.9 Years.
What is the Average Family Size in Cordova
Average Family Size in Cordova is 3.1 People.
What is the Average Household Size in Cordova
Average Household Size in Cordova is 2.7 People.
How Large is the Labor Force in Cordova?
There are 1,311 People in the Labor Forcein in Cordova.
What is the Percentage of People in the Labor Force in Cordova?
65.1% of People are in the Labor Force in Cordova.
What is the Unemployment Rate in Cordova?
Unemployment Rate in Cordova is 12.1%.