Akutan, AK Map & Demographics
Akutan Map
Akutan Overview
$45,054
PER CAPITA INCOME
$41,250
AVG FAMILY INCOME
$28,750
AVG HOUSEHOLD INCOME
6.1%
WAGE / INCOME GAP [ % ]
93.9¢/ $1
WAGE / INCOME GAP [ $ ]
$1,667
FAMILY INCOME DEFICIT
0.44
INEQUALITY / GINI INDEX
911
TOTAL POPULATION
695
MALE POPULATION
216
FEMALE POPULATION
321.76
MALES / 100 FEMALES
31.08
FEMALES / 100 MALES
40.8
MEDIAN AGE
3.9
AVG FAMILY SIZE
3.0
AVG HOUSEHOLD SIZE
819
LABOR FORCE [ PEOPLE ]
93.1%
PERCENT IN LABOR FORCE
4.3%
UNEMPLOYMENT RATE
Akutan Zip Codes
Akutan Area Codes
Income in Akutan
Income Overview in Akutan
Per Capita Income in Akutan is $45,054, while median incomes of families and households are $41,250 and $28,750 respectively.
| Characteristic | Number | Measure |
| Per Capita Income | 911 | $45,054 |
| Median Family Income | 39 | $41,250 |
| Mean Family Income | 39 | $57,628 |
| Median Household Income | 58 | $28,750 |
| Mean Household Income | 58 | $48,717 |
| Income Deficit | 39 | $1,667 |
| Wage / Income Gap (%) | 911 | 6.15% |
| Wage / Income Gap ($) | 911 | 93.85¢ per $1 |
| Gini / Inequality Index | 911 | 0.44 |
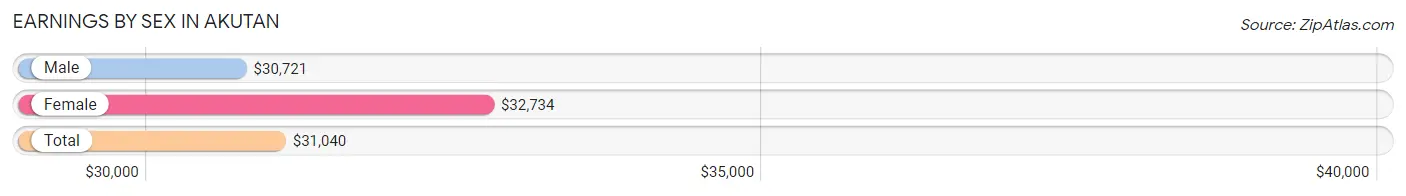
Earnings by Sex in Akutan
Average Earnings in Akutan are $31,040, $30,721 for men and $32,734 for women, a difference of 6.1%.
| Sex | Number | Average Earnings |
| Male | 675 (77.9%) | $30,721 |
| Female | 191 (22.1%) | $32,734 |
| Total | 866 (100.0%) | $31,040 |
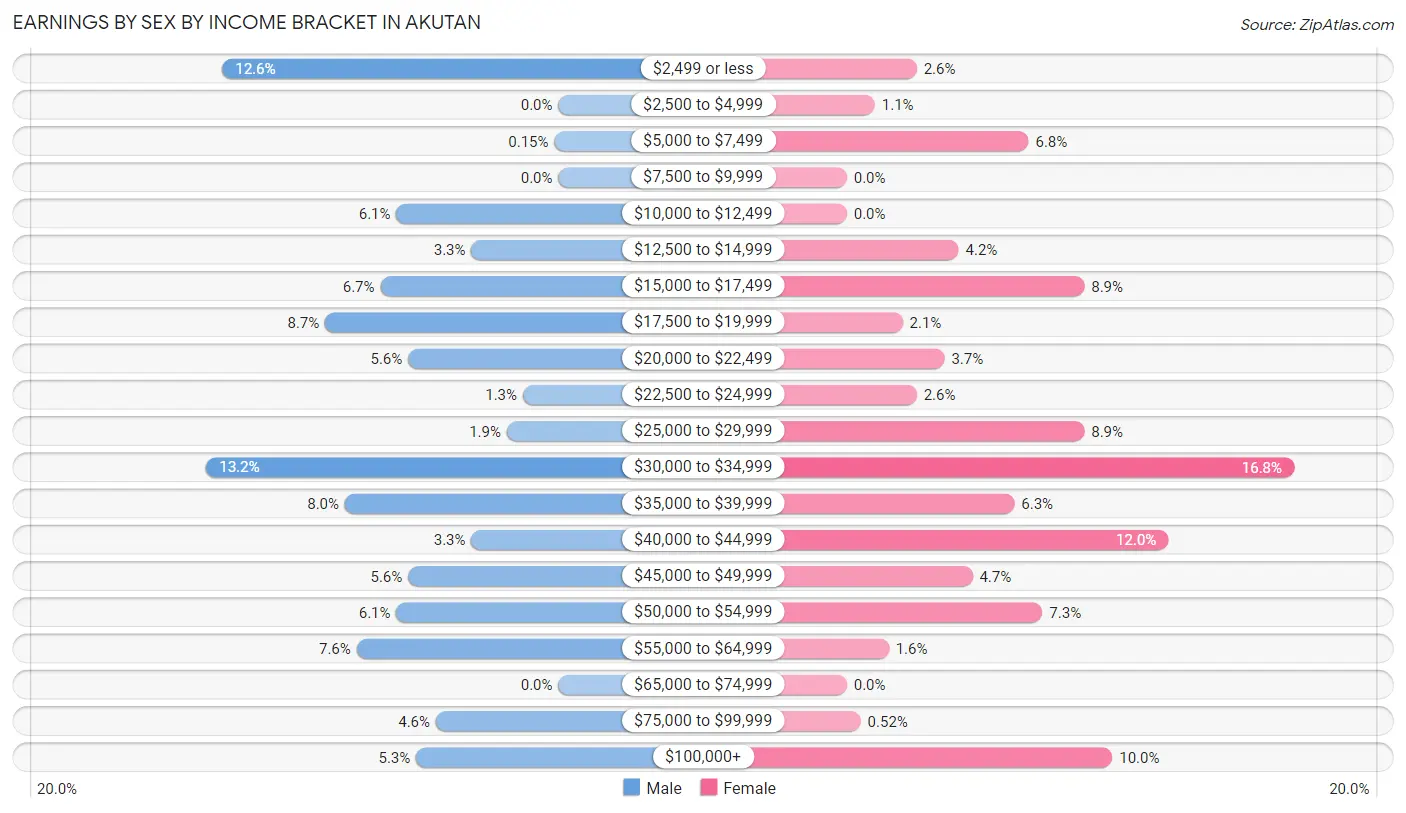
Earnings by Sex by Income Bracket in Akutan
The most common earnings brackets in Akutan are $30,000 to $34,999 for men (89 | 13.2%) and $30,000 to $34,999 for women (32 | 16.8%).
| Income | Male | Female |
| $2,499 or less | 85 (12.6%) | 5 (2.6%) |
| $2,500 to $4,999 | 0 (0.0%) | 2 (1.1%) |
| $5,000 to $7,499 | 1 (0.2%) | 13 (6.8%) |
| $7,500 to $9,999 | 0 (0.0%) | 0 (0.0%) |
| $10,000 to $12,499 | 41 (6.1%) | 0 (0.0%) |
| $12,500 to $14,999 | 22 (3.3%) | 8 (4.2%) |
| $15,000 to $17,499 | 45 (6.7%) | 17 (8.9%) |
| $17,500 to $19,999 | 59 (8.7%) | 4 (2.1%) |
| $20,000 to $22,499 | 38 (5.6%) | 7 (3.7%) |
| $22,500 to $24,999 | 9 (1.3%) | 5 (2.6%) |
| $25,000 to $29,999 | 13 (1.9%) | 17 (8.9%) |
| $30,000 to $34,999 | 89 (13.2%) | 32 (16.8%) |
| $35,000 to $39,999 | 54 (8.0%) | 12 (6.3%) |
| $40,000 to $44,999 | 22 (3.3%) | 23 (12.0%) |
| $45,000 to $49,999 | 38 (5.6%) | 9 (4.7%) |
| $50,000 to $54,999 | 41 (6.1%) | 14 (7.3%) |
| $55,000 to $64,999 | 51 (7.6%) | 3 (1.6%) |
| $65,000 to $74,999 | 0 (0.0%) | 0 (0.0%) |
| $75,000 to $99,999 | 31 (4.6%) | 1 (0.5%) |
| $100,000+ | 36 (5.3%) | 19 (10.0%) |
| Total | 675 (100.0%) | 191 (100.0%) |
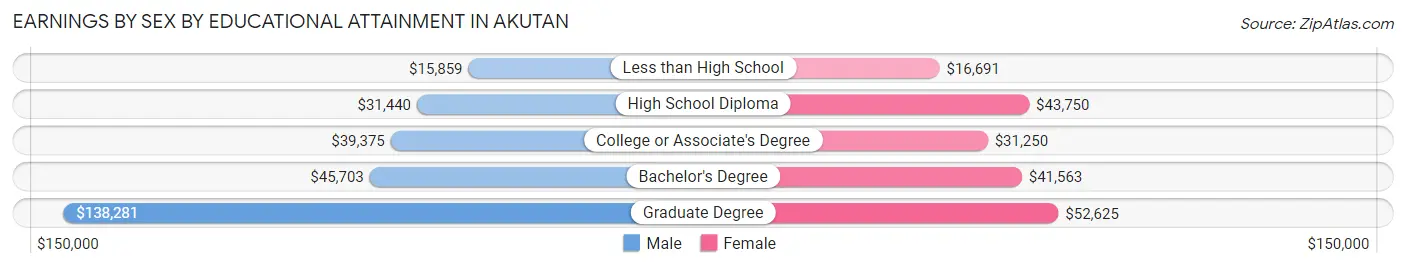
Earnings by Sex by Educational Attainment in Akutan
Average earnings in Akutan are $31,206 for men and $33,438 for women, a difference of 6.7%. Men with an educational attainment of graduate degree enjoy the highest average annual earnings of $138,281, while those with less than high school education earn the least with $15,859. Women with an educational attainment of graduate degree earn the most with the average annual earnings of $52,625, while those with less than high school education have the smallest earnings of $16,691.
| Educational Attainment | Male Income | Female Income |
| Less than High School | $15,859 | $16,691 |
| High School Diploma | $31,440 | $43,750 |
| College or Associate's Degree | $39,375 | $31,250 |
| Bachelor's Degree | $45,703 | $41,563 |
| Graduate Degree | $138,281 | $52,625 |
| Total | $31,206 | $33,438 |
Family Income in Akutan
Family Income Brackets in Akutan
According to the Akutan family income data, there are 12 families falling into the $15,000 to $24,999 income range, which is the most common income bracket and makes up 30.8% of all families.
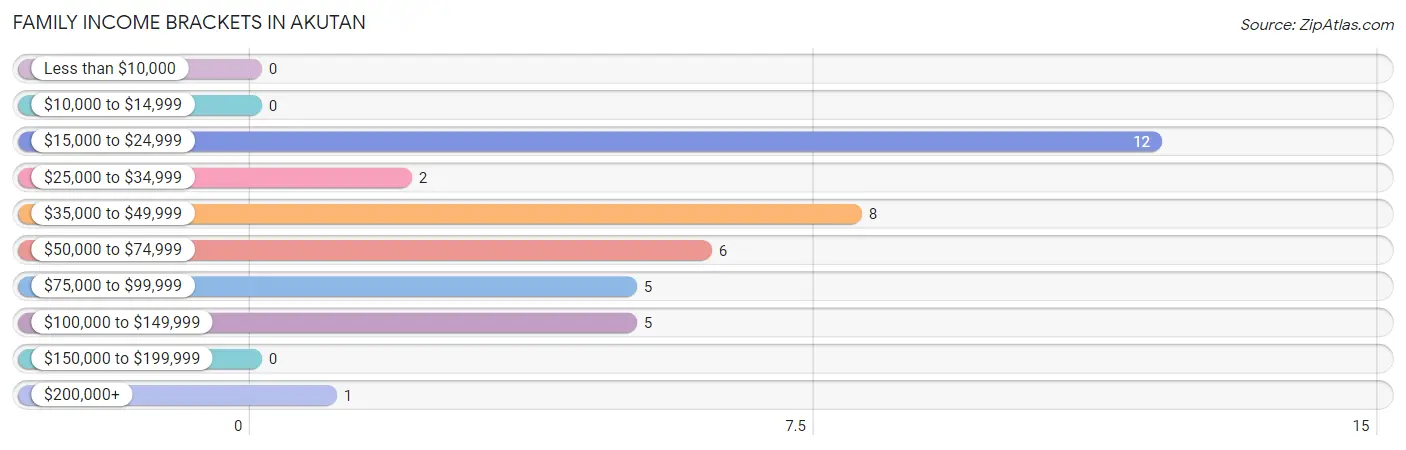
| Income Bracket | # Families | % Families |
| Less than $10,000 | 0 | 0.0% |
| $10,000 to $14,999 | 0 | 0.0% |
| $15,000 to $24,999 | 12 | 30.8% |
| $25,000 to $34,999 | 2 | 5.1% |
| $35,000 to $49,999 | 8 | 20.5% |
| $50,000 to $74,999 | 6 | 15.4% |
| $75,000 to $99,999 | 5 | 12.8% |
| $100,000 to $149,999 | 5 | 12.8% |
| $150,000 to $199,999 | 0 | 0.0% |
| $200,000+ | 1 | 2.6% |
Family Income by Famaliy Size in Akutan
3-person families (12 | 30.8%) account for the highest median family income in Akutan with $38,750 per family, while 3-person families (12 | 30.8%) have the highest median income of $12,917 per family member.
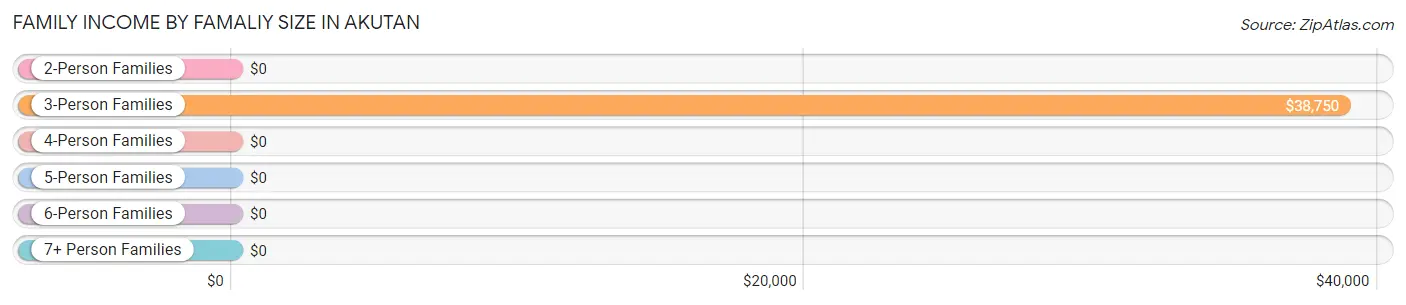
| Income Bracket | # Families | Median Income |
| 2-Person Families | 21 (53.8%) | $0 |
| 3-Person Families | 12 (30.8%) | $38,750 |
| 4-Person Families | 1 (2.6%) | $0 |
| 5-Person Families | 5 (12.8%) | $0 |
| 6-Person Families | 0 (0.0%) | $0 |
| 7+ Person Families | 0 (0.0%) | $0 |
| Total | 39 (100.0%) | $41,250 |
Family Income by Number of Earners in Akutan
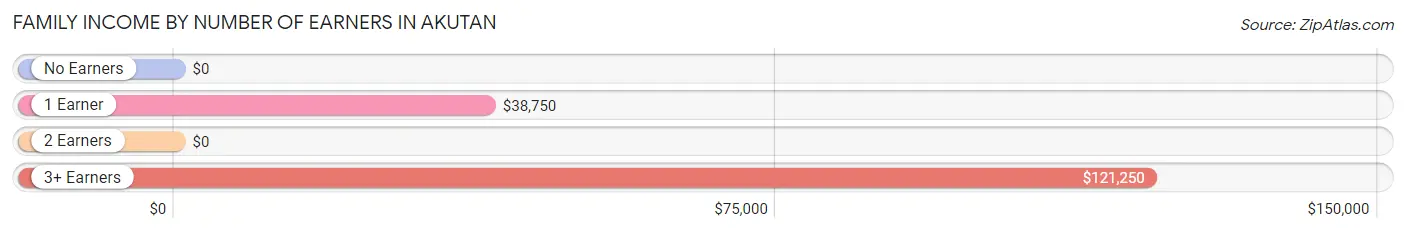
| Number of Earners | # Families | Median Income |
| No Earners | 0 (0.0%) | $0 |
| 1 Earner | 20 (51.3%) | $38,750 |
| 2 Earners | 13 (33.3%) | $0 |
| 3+ Earners | 6 (15.4%) | $121,250 |
| Total | 39 (100.0%) | $41,250 |
Household Income in Akutan
Household Income Brackets in Akutan
With 23 households falling in the category, the $15,000 to $24,999 income range is the most frequent in Akutan, accounting for 39.7% of all households.
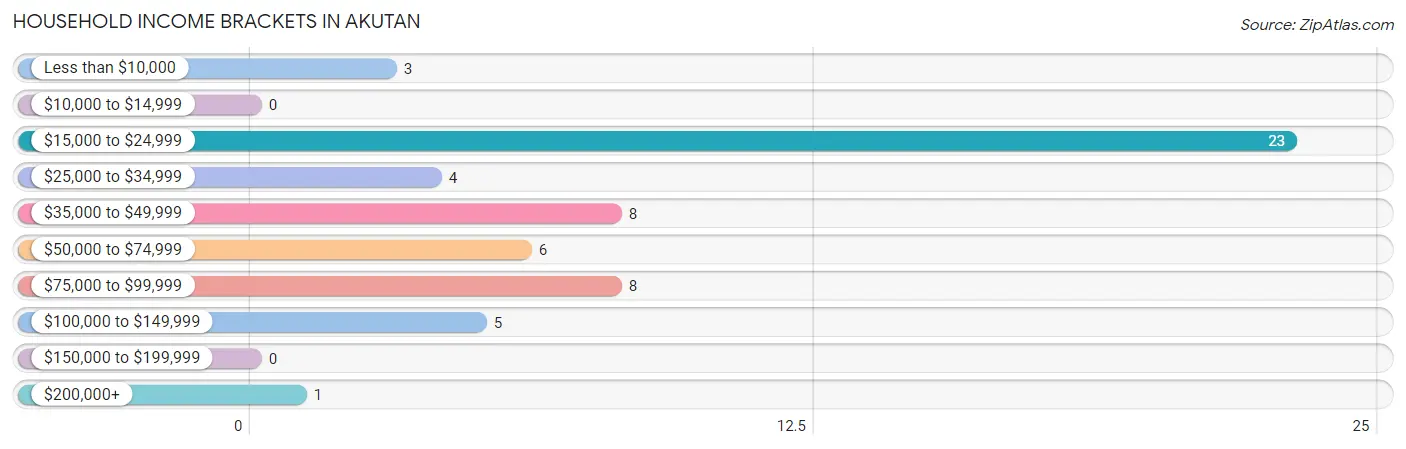
| Income Bracket | # Households | % Households |
| Less than $10,000 | 3 | 5.2% |
| $10,000 to $14,999 | 0 | 0.0% |
| $15,000 to $24,999 | 23 | 39.7% |
| $25,000 to $34,999 | 4 | 6.9% |
| $35,000 to $49,999 | 8 | 13.8% |
| $50,000 to $74,999 | 6 | 10.3% |
| $75,000 to $99,999 | 8 | 13.8% |
| $100,000 to $149,999 | 5 | 8.6% |
| $150,000 to $199,999 | 0 | 0.0% |
| $200,000+ | 1 | 1.7% |
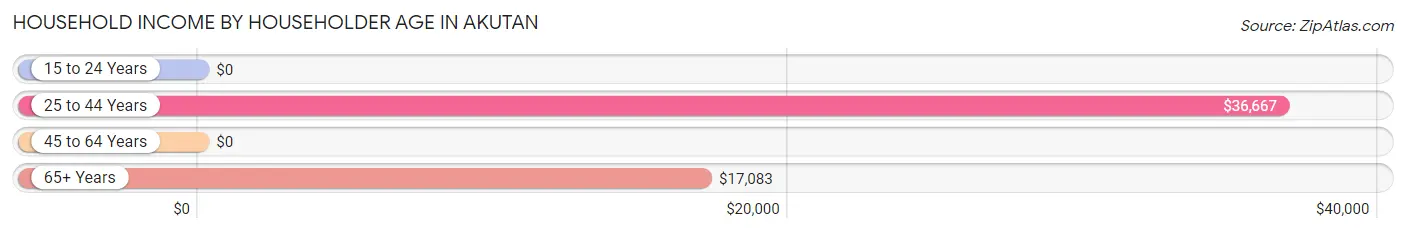
Household Income by Householder Age in Akutan
The median household income in Akutan is $28,750, with the highest median household income of $36,667 found in the 25 to 44 years age bracket for the primary householder. A total of 14 households (24.1%) fall into this category. Meanwhile, the 15 to 24 years age bracket for the primary householder has the lowest median household income of $0, with 5 households (8.6%) in this group.
| Income Bracket | # Households | Median Income |
| 15 to 24 Years | 5 (8.6%) | $0 |
| 25 to 44 Years | 14 (24.1%) | $36,667 |
| 45 to 64 Years | 18 (31.0%) | $0 |
| 65+ Years | 21 (36.2%) | $17,083 |
| Total | 58 (100.0%) | $28,750 |
Poverty in Akutan
Income Below Poverty by Sex and Age in Akutan
With 21.6% poverty level for males and 15.7% for females among the residents of Akutan, 18 to 24 year old males and 65 to 74 year old females are the most vulnerable to poverty, with 28 males (62.2%) and 9 females (45.0%) in their respective age groups living below the poverty level.
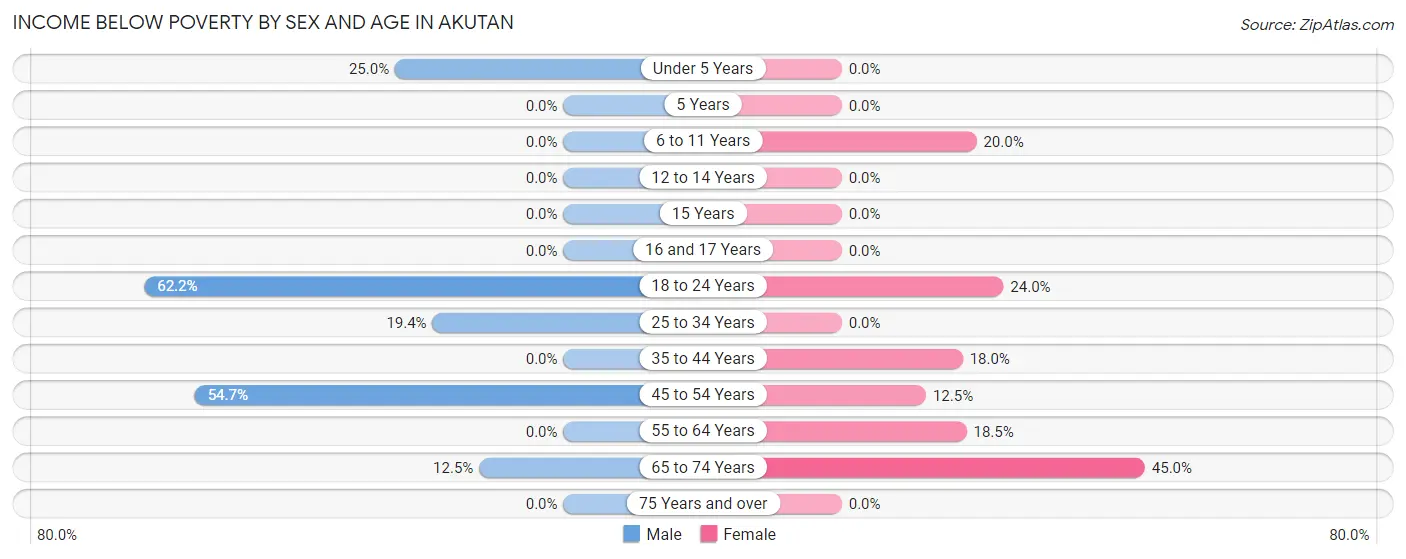
| Age Bracket | Male | Female |
| Under 5 Years | 3 (25.0%) | 0 (0.0%) |
| 5 Years | 0 (0.0%) | 0 (0.0%) |
| 6 to 11 Years | 0 (0.0%) | 2 (20.0%) |
| 12 to 14 Years | 0 (0.0%) | 0 (0.0%) |
| 15 Years | 0 (0.0%) | 0 (0.0%) |
| 16 and 17 Years | 0 (0.0%) | 0 (0.0%) |
| 18 to 24 Years | 28 (62.2%) | 6 (24.0%) |
| 25 to 34 Years | 35 (19.4%) | 0 (0.0%) |
| 35 to 44 Years | 0 (0.0%) | 7 (17.9%) |
| 45 to 54 Years | 81 (54.7%) | 5 (12.5%) |
| 55 to 64 Years | 0 (0.0%) | 5 (18.5%) |
| 65 to 74 Years | 3 (12.5%) | 9 (45.0%) |
| 75 Years and over | 0 (0.0%) | 0 (0.0%) |
| Total | 150 (21.6%) | 34 (15.7%) |
Income Above Poverty by Sex and Age in Akutan
According to the poverty statistics in Akutan, males aged 5 years and females aged under 5 years are the age groups that are most secure financially, with 100.0% of males and 100.0% of females in these age groups living above the poverty line.
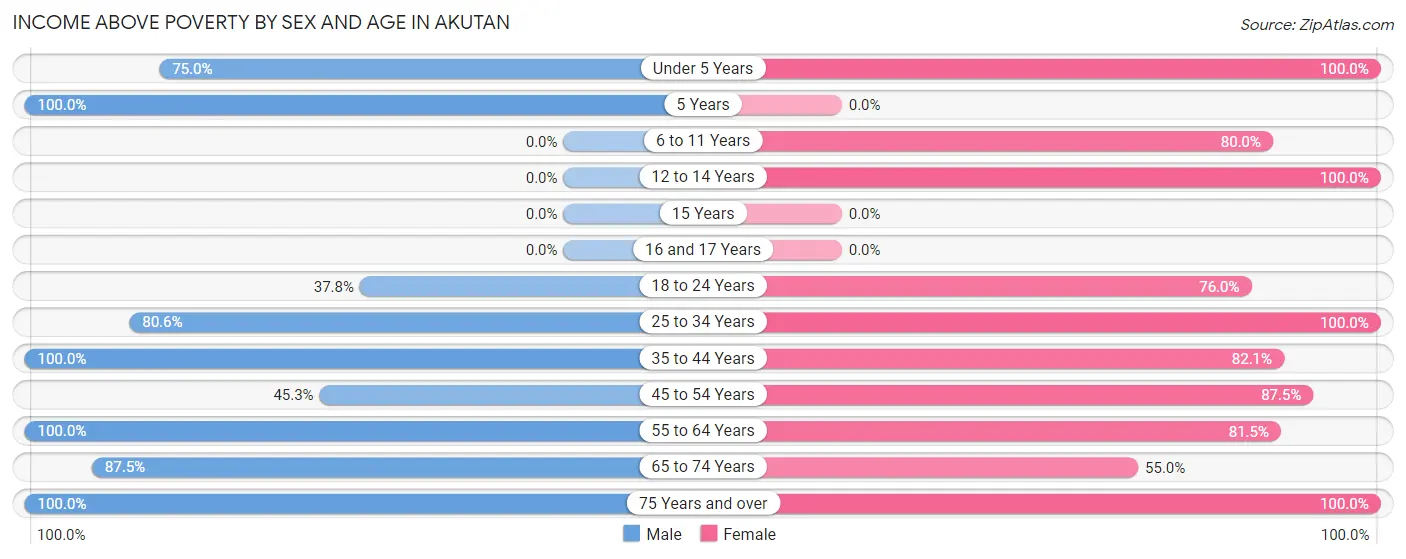
| Age Bracket | Male | Female |
| Under 5 Years | 9 (75.0%) | 4 (100.0%) |
| 5 Years | 2 (100.0%) | 0 (0.0%) |
| 6 to 11 Years | 0 (0.0%) | 8 (80.0%) |
| 12 to 14 Years | 0 (0.0%) | 3 (100.0%) |
| 15 Years | 0 (0.0%) | 0 (0.0%) |
| 16 and 17 Years | 0 (0.0%) | 0 (0.0%) |
| 18 to 24 Years | 17 (37.8%) | 19 (76.0%) |
| 25 to 34 Years | 145 (80.6%) | 42 (100.0%) |
| 35 to 44 Years | 205 (100.0%) | 32 (82.1%) |
| 45 to 54 Years | 67 (45.3%) | 35 (87.5%) |
| 55 to 64 Years | 78 (100.0%) | 22 (81.5%) |
| 65 to 74 Years | 21 (87.5%) | 11 (55.0%) |
| 75 Years and over | 1 (100.0%) | 6 (100.0%) |
| Total | 545 (78.4%) | 182 (84.3%) |
Income Below Poverty Among Married-Couple Families in Akutan
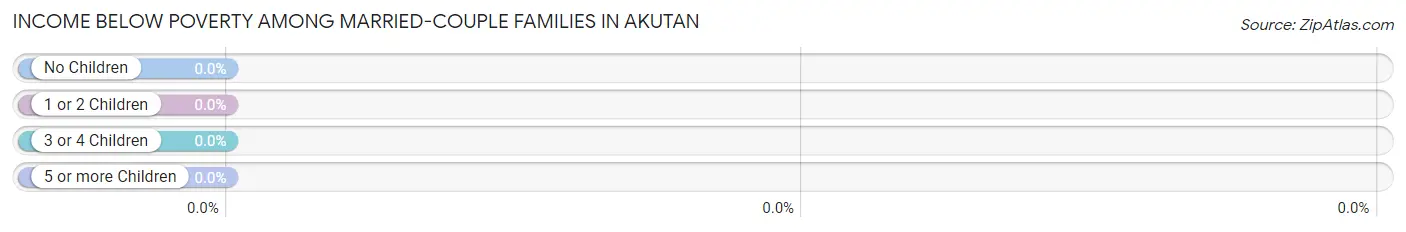
| Children | Above Poverty | Below Poverty |
| No Children | 12 (100.0%) | 0 (0.0%) |
| 1 or 2 Children | 2 (100.0%) | 0 (0.0%) |
| 3 or 4 Children | 0 (0.0%) | 0 (0.0%) |
| 5 or more Children | 0 (0.0%) | 0 (0.0%) |
| Total | 14 (100.0%) | 0 (0.0%) |
Income Below Poverty Among Single-Parent Households in Akutan
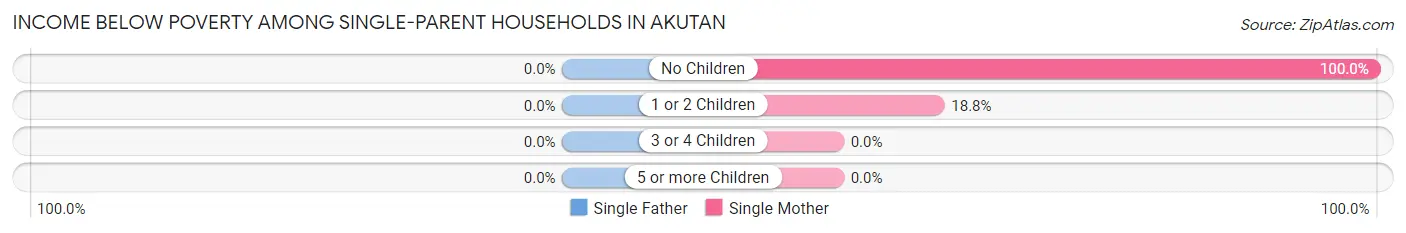
| Children | Single Father | Single Mother |
| No Children | 0 (0.0%) | 9 (100.0%) |
| 1 or 2 Children | 0 (0.0%) | 3 (18.8%) |
| 3 or 4 Children | 0 (0.0%) | 0 (0.0%) |
| 5 or more Children | 0 (0.0%) | 0 (0.0%) |
| Total | 0 (0.0%) | 12 (48.0%) |
Income Below Poverty Among Married-Couple vs Single-Parent Households in Akutan
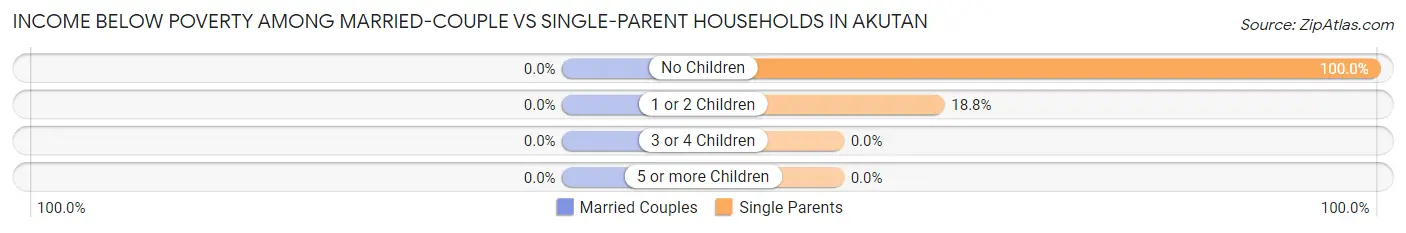
| Children | Married-Couple Families | Single-Parent Households |
| No Children | 0 (0.0%) | 9 (100.0%) |
| 1 or 2 Children | 0 (0.0%) | 3 (18.8%) |
| 3 or 4 Children | 0 (0.0%) | 0 (0.0%) |
| 5 or more Children | 0 (0.0%) | 0 (0.0%) |
| Total | 0 (0.0%) | 12 (48.0%) |
Race in Akutan
The most populous races in Akutan are White / Caucasian (236 | 25.9%), Hispanic or Latino (185 | 20.3%), and Some other Race (158 | 17.3%).
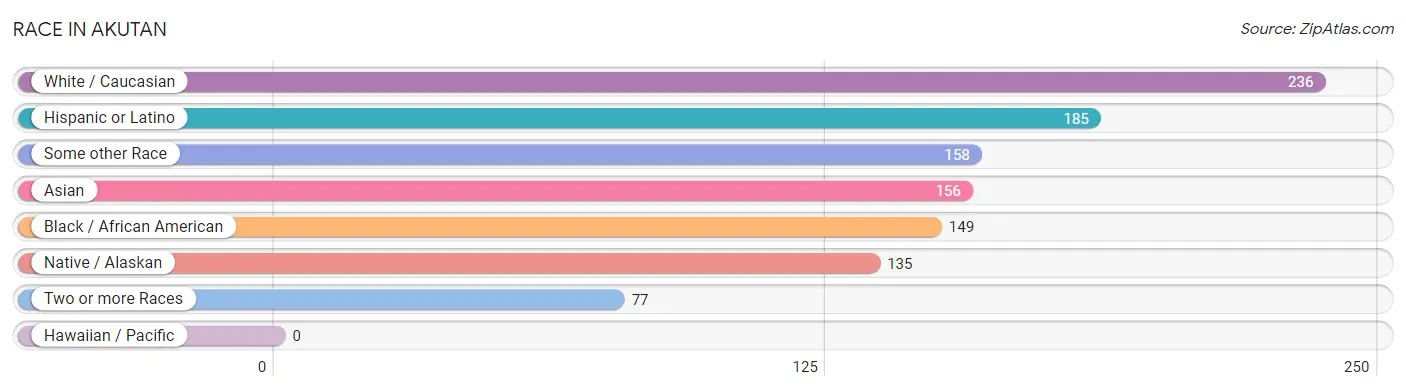
| Race | # Population | % Population |
| Asian | 156 | 17.1% |
| Black / African American | 149 | 16.4% |
| Hawaiian / Pacific | 0 | 0.0% |
| Hispanic or Latino | 185 | 20.3% |
| Native / Alaskan | 135 | 14.8% |
| White / Caucasian | 236 | 25.9% |
| Two or more Races | 77 | 8.5% |
| Some other Race | 158 | 17.3% |
| Total | 911 | 100.0% |
Ancestry in Akutan
The most populous ancestries reported in Akutan are Korean (145 | 15.9%), Mexican (106 | 11.6%), Ukrainian (96 | 10.5%), Aleut (95 | 10.4%), and Subsaharan African (94 | 10.3%), together accounting for 58.9% of all Akutan residents.
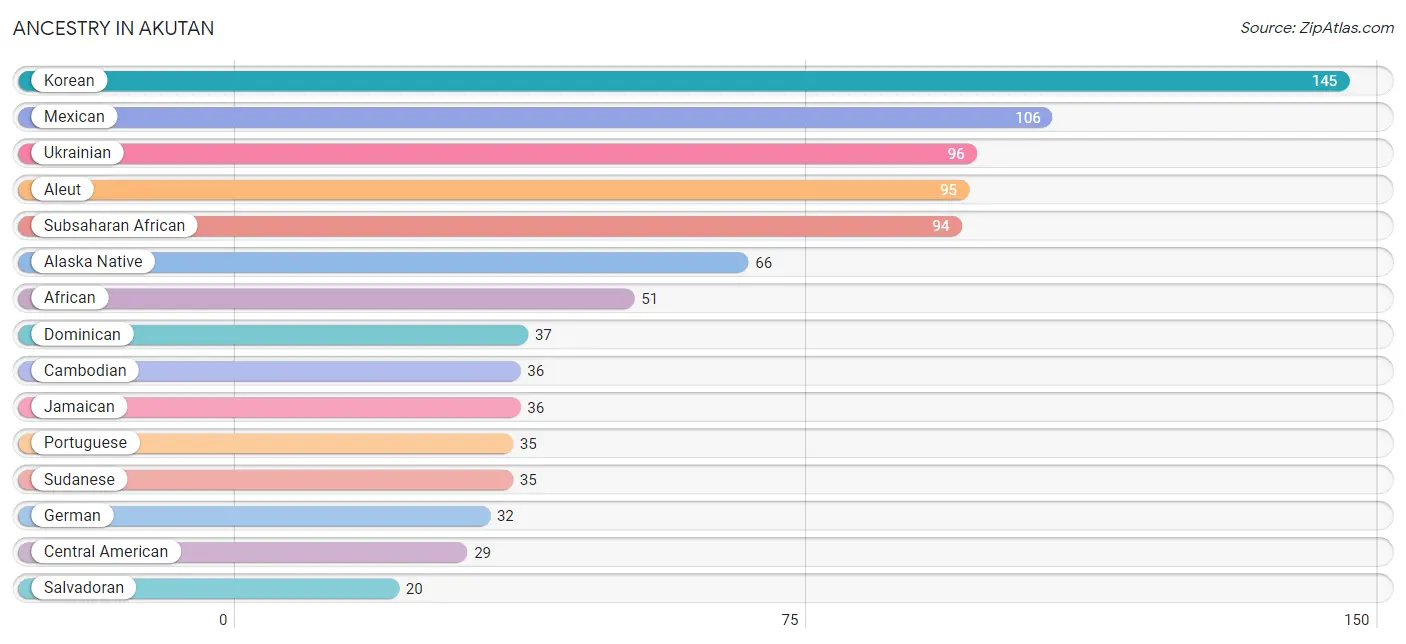
| Ancestry | # Population | % Population |
| African | 51 | 5.6% |
| Alaska Native | 66 | 7.2% |
| Aleut | 95 | 10.4% |
| Bhutanese | 5 | 0.5% |
| British West Indian | 5 | 0.5% |
| Cambodian | 36 | 4.0% |
| Central American | 29 | 3.2% |
| Cuban | 4 | 0.4% |
| Dominican | 37 | 4.1% |
| English | 9 | 1.0% |
| European | 1 | 0.1% |
| German | 32 | 3.5% |
| Guatemalan | 9 | 1.0% |
| Hungarian | 4 | 0.4% |
| Indian (Asian) | 3 | 0.3% |
| Inupiat | 4 | 0.4% |
| Irish | 18 | 2.0% |
| Italian | 3 | 0.3% |
| Jamaican | 36 | 4.0% |
| Korean | 145 | 15.9% |
| Mexican | 106 | 11.6% |
| Norwegian | 8 | 0.9% |
| Portuguese | 35 | 3.8% |
| Puerto Rican | 6 | 0.7% |
| Romanian | 6 | 0.7% |
| Russian | 18 | 2.0% |
| Salvadoran | 20 | 2.2% |
| Scandinavian | 6 | 0.7% |
| Scotch-Irish | 12 | 1.3% |
| Scottish | 7 | 0.8% |
| Somali | 5 | 0.5% |
| Spaniard | 3 | 0.3% |
| Sri Lankan | 9 | 1.0% |
| Subsaharan African | 94 | 10.3% |
| Sudanese | 35 | 3.8% |
| Ukrainian | 96 | 10.5% | View All 36 Rows |
Immigrants in Akutan
The most numerous immigrant groups reported in Akutan came from Latin America (179 | 19.7%), Asia (175 | 19.2%), Eastern Europe (140 | 15.4%), Europe (140 | 15.4%), and South Eastern Asia (134 | 14.7%), together accounting for 84.3% of all Akutan residents.
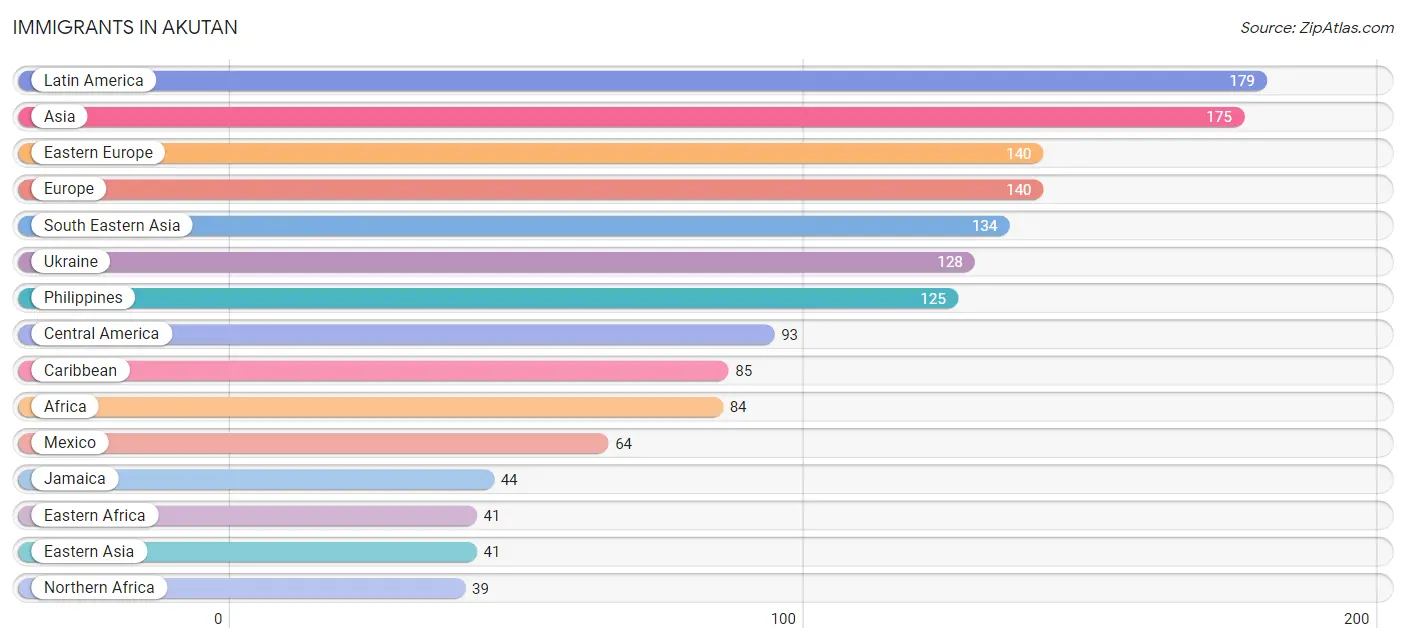
| Immigration Origin | # Population | % Population |
| Africa | 84 | 9.2% |
| Asia | 175 | 19.2% |
| Cameroon | 3 | 0.3% |
| Caribbean | 85 | 9.3% |
| Central America | 93 | 10.2% |
| Cuba | 4 | 0.4% |
| Dominican Republic | 37 | 4.1% |
| Eastern Africa | 41 | 4.5% |
| Eastern Asia | 41 | 4.5% |
| Eastern Europe | 140 | 15.4% |
| El Salvador | 20 | 2.2% |
| Europe | 140 | 15.4% |
| Guatemala | 9 | 1.0% |
| Guyana | 1 | 0.1% |
| Jamaica | 44 | 4.8% |
| Japan | 5 | 0.5% |
| Kenya | 32 | 3.5% |
| Latin America | 179 | 19.7% |
| Mexico | 64 | 7.0% |
| Middle Africa | 3 | 0.3% |
| Moldova | 6 | 0.7% |
| Nigeria | 1 | 0.1% |
| Northern Africa | 39 | 4.3% |
| Philippines | 125 | 13.7% |
| Russia | 6 | 0.7% |
| Somalia | 5 | 0.5% |
| South America | 1 | 0.1% |
| South Eastern Asia | 134 | 14.7% |
| Sudan | 39 | 4.3% |
| Ukraine | 128 | 14.1% |
| Vietnam | 9 | 1.0% |
| Western Africa | 1 | 0.1% | View All 32 Rows |
Sex and Age in Akutan
Sex and Age in Akutan
The most populous age groups in Akutan are 25 to 29 Years (135 | 19.4%) for men and 45 to 49 Years (33 | 15.3%) for women.
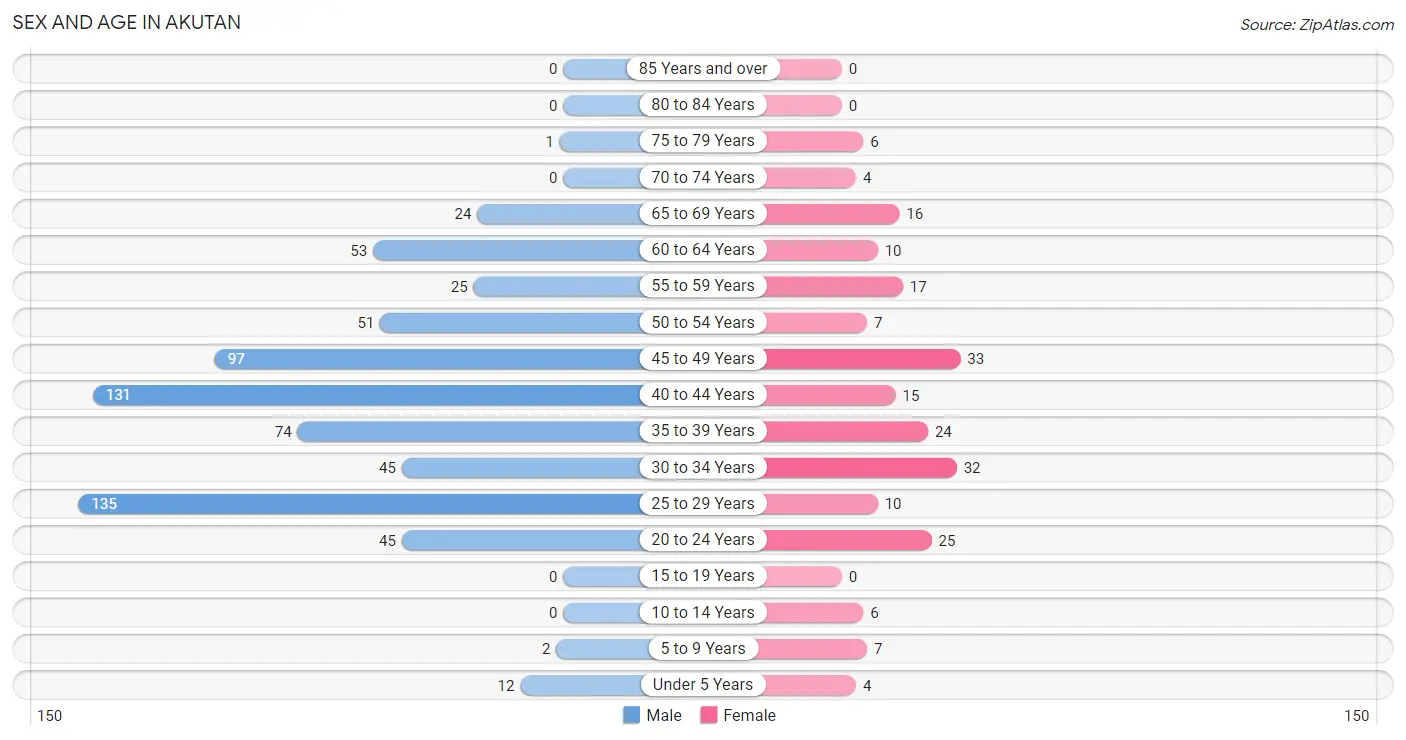
| Age Bracket | Male | Female |
| Under 5 Years | 12 (1.7%) | 4 (1.8%) |
| 5 to 9 Years | 2 (0.3%) | 7 (3.2%) |
| 10 to 14 Years | 0 (0.0%) | 6 (2.8%) |
| 15 to 19 Years | 0 (0.0%) | 0 (0.0%) |
| 20 to 24 Years | 45 (6.5%) | 25 (11.6%) |
| 25 to 29 Years | 135 (19.4%) | 10 (4.6%) |
| 30 to 34 Years | 45 (6.5%) | 32 (14.8%) |
| 35 to 39 Years | 74 (10.6%) | 24 (11.1%) |
| 40 to 44 Years | 131 (18.9%) | 15 (6.9%) |
| 45 to 49 Years | 97 (14.0%) | 33 (15.3%) |
| 50 to 54 Years | 51 (7.3%) | 7 (3.2%) |
| 55 to 59 Years | 25 (3.6%) | 17 (7.9%) |
| 60 to 64 Years | 53 (7.6%) | 10 (4.6%) |
| 65 to 69 Years | 24 (3.5%) | 16 (7.4%) |
| 70 to 74 Years | 0 (0.0%) | 4 (1.8%) |
| 75 to 79 Years | 1 (0.1%) | 6 (2.8%) |
| 80 to 84 Years | 0 (0.0%) | 0 (0.0%) |
| 85 Years and over | 0 (0.0%) | 0 (0.0%) |
| Total | 695 (100.0%) | 216 (100.0%) |
Families and Households in Akutan
Median Family Size in Akutan
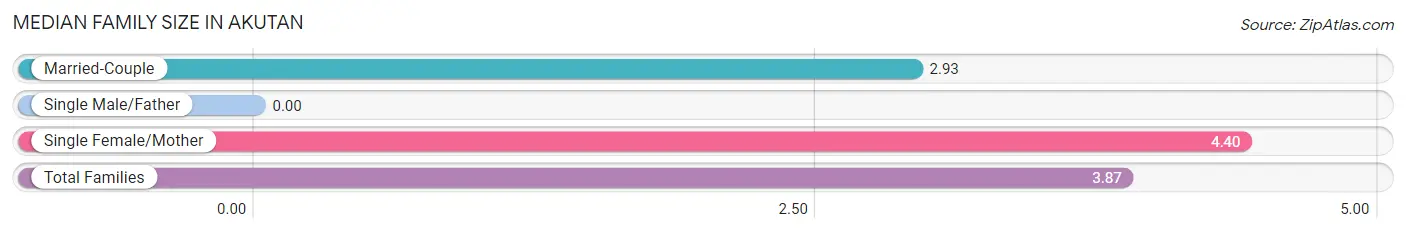
| Family Type | # Families | Family Size |
| Married-Couple | 14 (35.9%) | 2.93 |
| Single Male/Father | 0 (0.0%) | - |
| Single Female/Mother | 25 (64.1%) | 4.40 |
| Total Families | 39 (100.0%) | 3.87 |
Median Household Size in Akutan
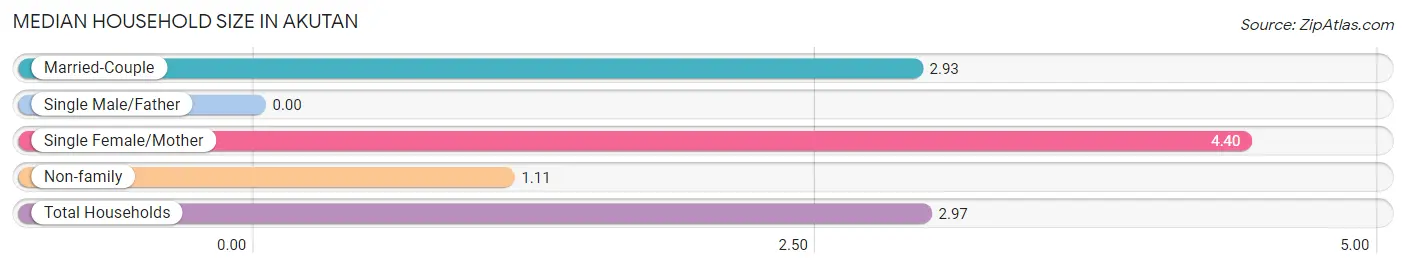
| Household Type | # Households | Household Size |
| Married-Couple | 14 (24.1%) | 2.93 |
| Single Male/Father | 0 (0.0%) | - |
| Single Female/Mother | 25 (43.1%) | 4.40 |
| Non-family | 19 (32.8%) | 1.11 |
| Total Households | 58 (100.0%) | 2.97 |
Household Size by Marriage Status in Akutan
Out of a total of 58 households in Akutan, 39 (67.2%) are family households, while 19 (32.8%) are nonfamily households. The most numerous type of family households are 2-person households, comprising 21, and the most common type of nonfamily households are 1-person households, comprising 16.
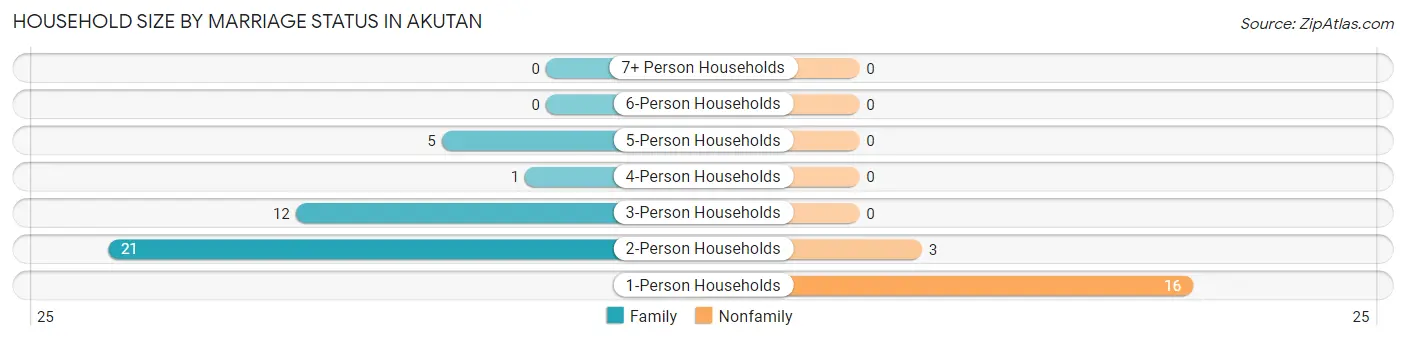
| Household Size | Family Households | Nonfamily Households |
| 1-Person Households | - | 16 (27.6%) |
| 2-Person Households | 21 (36.2%) | 3 (5.2%) |
| 3-Person Households | 12 (20.7%) | 0 (0.0%) |
| 4-Person Households | 1 (1.7%) | 0 (0.0%) |
| 5-Person Households | 5 (8.6%) | 0 (0.0%) |
| 6-Person Households | 0 (0.0%) | 0 (0.0%) |
| 7+ Person Households | 0 (0.0%) | 0 (0.0%) |
| Total | 39 (67.2%) | 19 (32.8%) |
Female Fertility in Akutan
Fertility by Age in Akutan
| Age Bracket | Women with Births | Births / 1,000 Women |
| 15 to 19 years | 0 (0.0%) | 0.0 |
| 20 to 34 years | 0 (0.0%) | 0.0 |
| 35 to 50 years | 0 (0.0%) | 0.0 |
| Total | 0 (0.0%) | 0.0 |
Fertility by Age by Marriage Status in Akutan
| Age Bracket | Married | Unmarried |
| 15 to 19 years | 0 (0.0%) | 0 (0.0%) |
| 20 to 34 years | 0 (0.0%) | 0 (0.0%) |
| 35 to 50 years | 0 (0.0%) | 0 (0.0%) |
| Total | 0 (0.0%) | 0 (0.0%) |
Fertility by Education in Akutan
| Educational Attainment | Women with Births | Births / 1,000 Women |
| Less than High School | 0 (0.0%) | 0.0 |
| High School Diploma | 0 (0.0%) | 0.0 |
| College or Associate's Degree | 0 (0.0%) | 0.0 |
| Bachelor's Degree | 0 (0.0%) | 0.0 |
| Graduate Degree | 0 (0.0%) | 0.0 |
| Total | 0 (0.0%) | 0.0 |
Fertility by Education by Marriage Status in Akutan
| Educational Attainment | Married | Unmarried |
| Less than High School | 0 (0.0%) | 0 (0.0%) |
| High School Diploma | 0 (0.0%) | 0 (0.0%) |
| College or Associate's Degree | 0 (0.0%) | 0 (0.0%) |
| Bachelor's Degree | 0 (0.0%) | 0 (0.0%) |
| Graduate Degree | 0 (0.0%) | 0 (0.0%) |
| Total | 0 (0.0%) | 0 (0.0%) |
Employment Characteristics in Akutan
Employment by Class of Employer in Akutan
Among the 784 employed individuals in Akutan, private company employees (634 | 80.9%), local government employees (67 | 8.6%), and not-for-profit organizations (37 | 4.7%) make up the most common classes of employment.
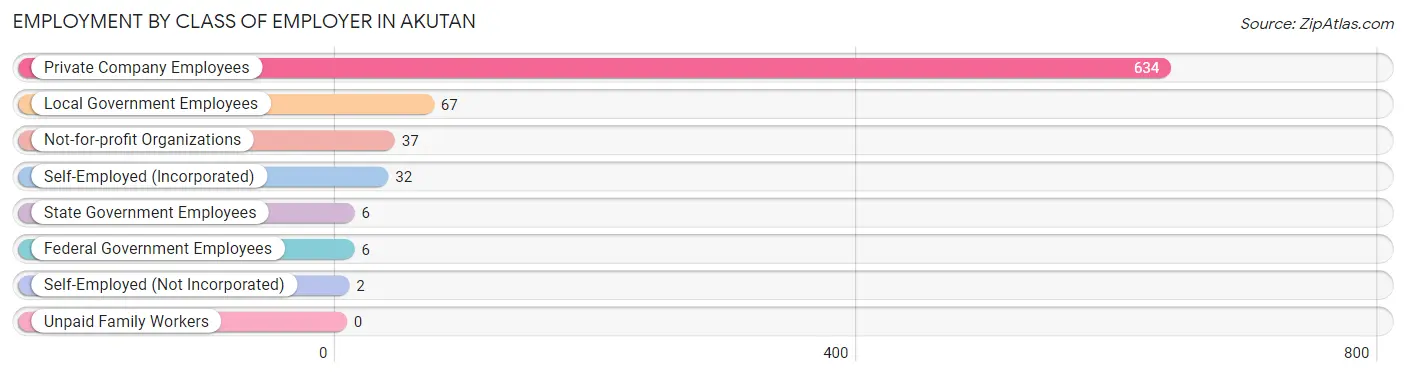
| Employer Class | # Employees | % Employees |
| Private Company Employees | 634 | 80.9% |
| Self-Employed (Incorporated) | 32 | 4.1% |
| Self-Employed (Not Incorporated) | 2 | 0.3% |
| Not-for-profit Organizations | 37 | 4.7% |
| Local Government Employees | 67 | 8.6% |
| State Government Employees | 6 | 0.8% |
| Federal Government Employees | 6 | 0.8% |
| Unpaid Family Workers | 0 | 0.0% |
| Total | 784 | 100.0% |
Employment Status by Age in Akutan
According to the labor force statistics for Akutan, out of the total population over 16 years of age (880), 93.1% or 819 individuals are in the labor force, with 4.3% or 35 of them unemployed. The age group with the highest labor force participation rate is 20 to 24 years, with 100.0% or 70 individuals in the labor force. Within the labor force, the 35 to 44 years age range has the highest percentage of unemployed individuals, with 14.3% or 35 of them being unemployed.
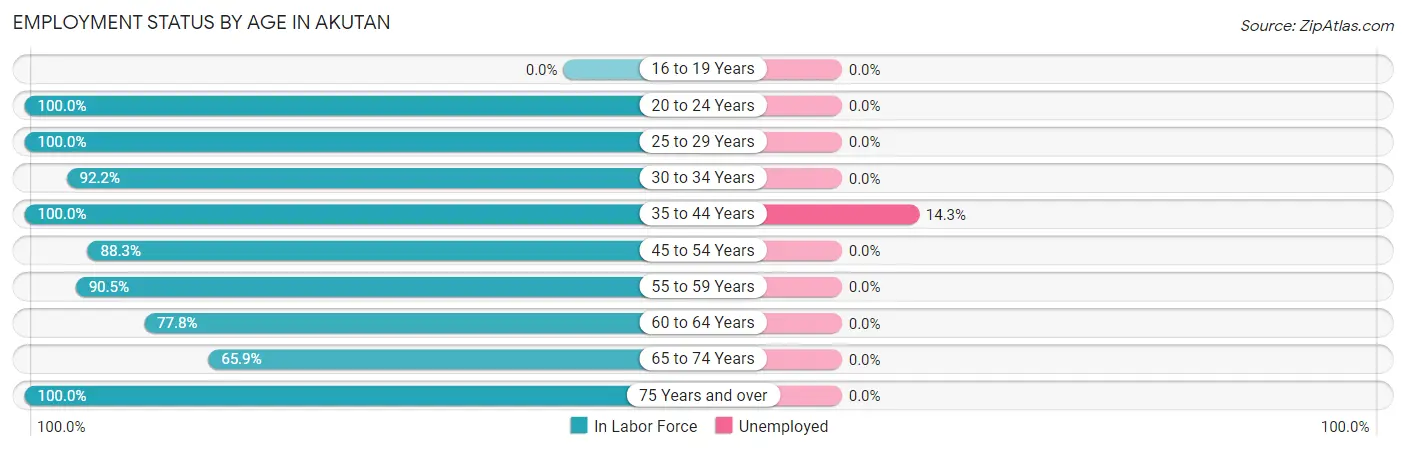
| Age Bracket | In Labor Force | Unemployed |
| 16 to 19 Years | 0 (0.0%) | 0 (0.0%) |
| 20 to 24 Years | 70 (100.0%) | 0 (0.0%) |
| 25 to 29 Years | 145 (100.0%) | 0 (0.0%) |
| 30 to 34 Years | 71 (92.2%) | 0 (0.0%) |
| 35 to 44 Years | 244 (100.0%) | 35 (14.3%) |
| 45 to 54 Years | 166 (88.3%) | 0 (0.0%) |
| 55 to 59 Years | 38 (90.5%) | 0 (0.0%) |
| 60 to 64 Years | 49 (77.8%) | 0 (0.0%) |
| 65 to 74 Years | 29 (65.9%) | 0 (0.0%) |
| 75 Years and over | 7 (100.0%) | 0 (0.0%) |
| Total | 819 (93.1%) | 35 (4.3%) |
Employment Status by Educational Attainment in Akutan
According to labor force statistics for Akutan, 93.9% of individuals (713) out of the total population between 25 and 64 years of age (759) are in the labor force, with 4.9% or 35 of them being unemployed. The group with the highest labor force participation rate are those with the educational attainment of college / associate degree, with 100.0% or 140 individuals in the labor force. Within the labor force, individuals with high school diploma education have the highest percentage of unemployment, with 12.5% or 35 of them being unemployed.
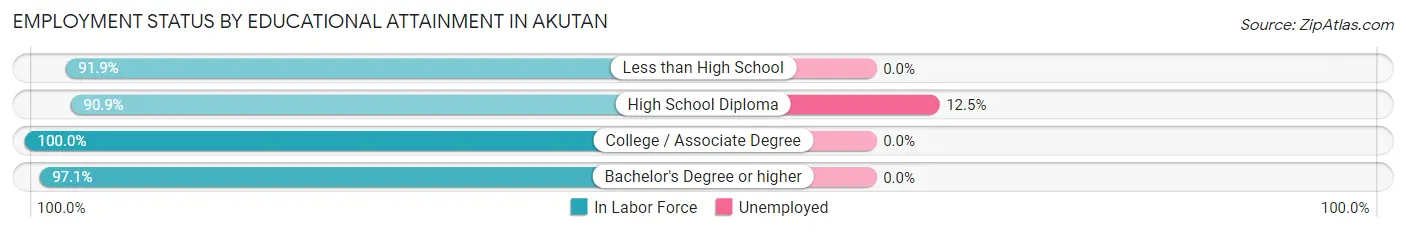
| Educational Attainment | In Labor Force | Unemployed |
| Less than High School | 158 (91.9%) | 0 (0.0%) |
| High School Diploma | 281 (90.9%) | 39 (12.5%) |
| College / Associate Degree | 140 (100.0%) | 0 (0.0%) |
| Bachelor's Degree or higher | 134 (97.1%) | 0 (0.0%) |
| Total | 713 (93.9%) | 37 (4.9%) |
Employment Occupations by Sex in Akutan
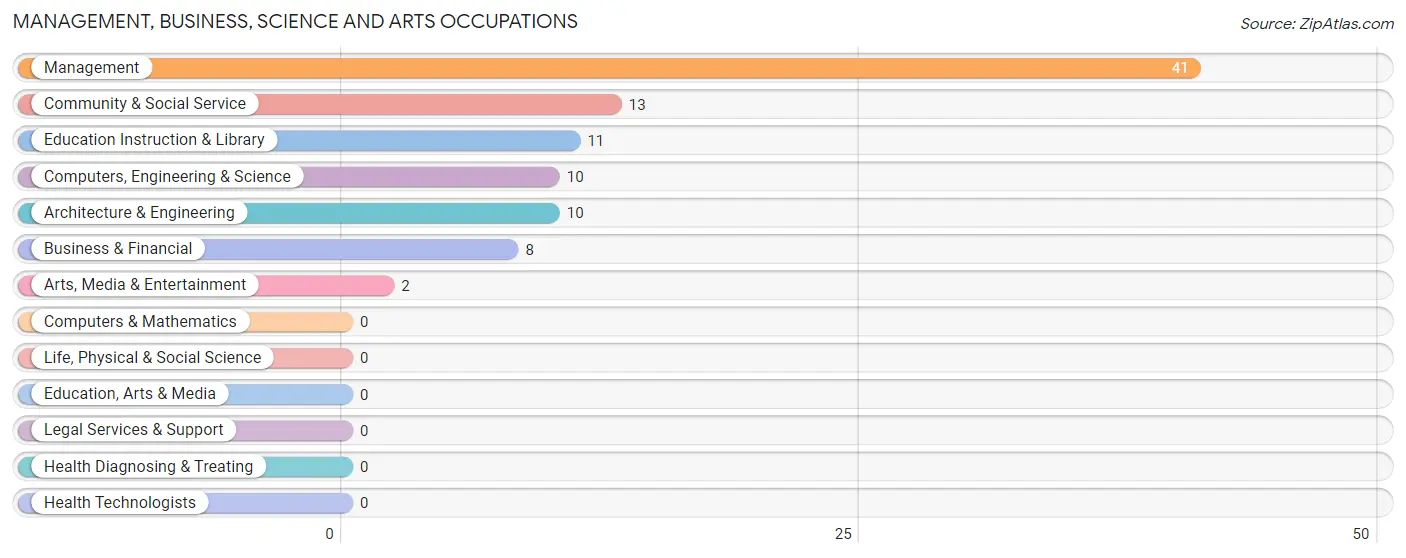
Management, Business, Science and Arts Occupations
The most common Management, Business, Science and Arts occupations in Akutan are Management (41 | 5.2%), Community & Social Service (13 | 1.7%), Education Instruction & Library (11 | 1.4%), Computers, Engineering & Science (10 | 1.3%), and Architecture & Engineering (10 | 1.3%).
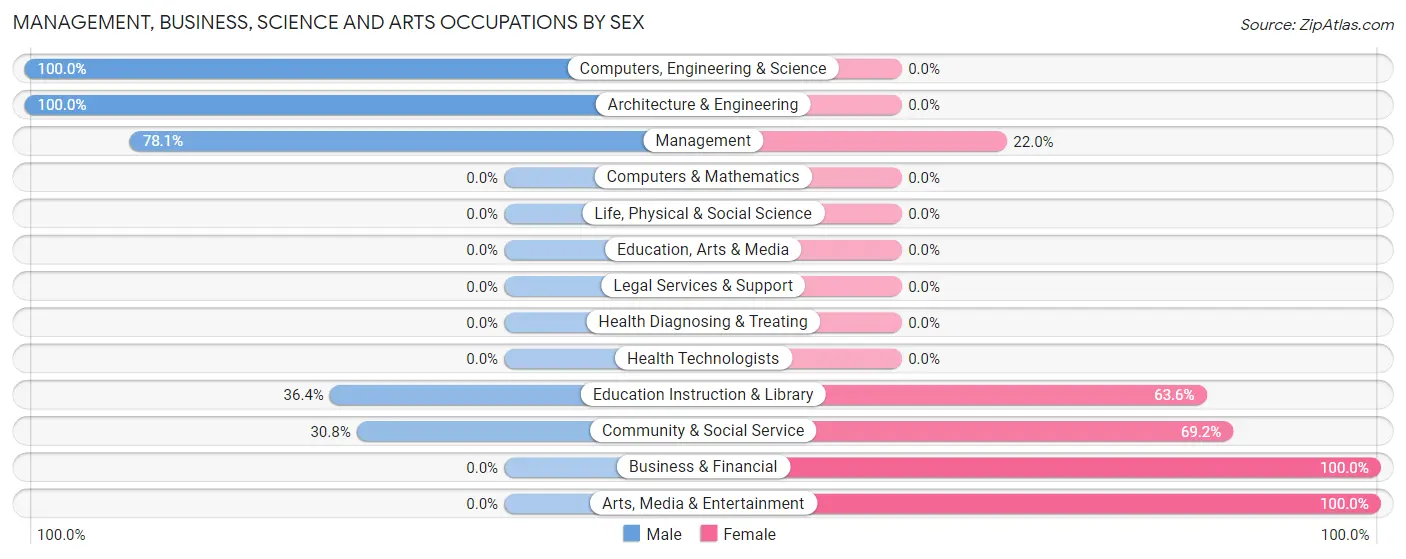
Management, Business, Science and Arts Occupations by Sex
Within the Management, Business, Science and Arts occupations in Akutan, the most male-oriented occupations are Computers, Engineering & Science (100.0%), Architecture & Engineering (100.0%), and Management (78.0%), while the most female-oriented occupations are Business & Financial (100.0%), Arts, Media & Entertainment (100.0%), and Community & Social Service (69.2%).
| Occupation | Male | Female |
| Management | 32 (78.0%) | 9 (22.0%) |
| Business & Financial | 0 (0.0%) | 8 (100.0%) |
| Computers, Engineering & Science | 10 (100.0%) | 0 (0.0%) |
| Computers & Mathematics | 0 (0.0%) | 0 (0.0%) |
| Architecture & Engineering | 10 (100.0%) | 0 (0.0%) |
| Life, Physical & Social Science | 0 (0.0%) | 0 (0.0%) |
| Community & Social Service | 4 (30.8%) | 9 (69.2%) |
| Education, Arts & Media | 0 (0.0%) | 0 (0.0%) |
| Legal Services & Support | 0 (0.0%) | 0 (0.0%) |
| Education Instruction & Library | 4 (36.4%) | 7 (63.6%) |
| Arts, Media & Entertainment | 0 (0.0%) | 2 (100.0%) |
| Health Diagnosing & Treating | 0 (0.0%) | 0 (0.0%) |
| Health Technologists | 0 (0.0%) | 0 (0.0%) |
| Total (Category) | 46 (63.9%) | 26 (36.1%) |
| Total (Overall) | 613 (78.2%) | 171 (21.8%) |
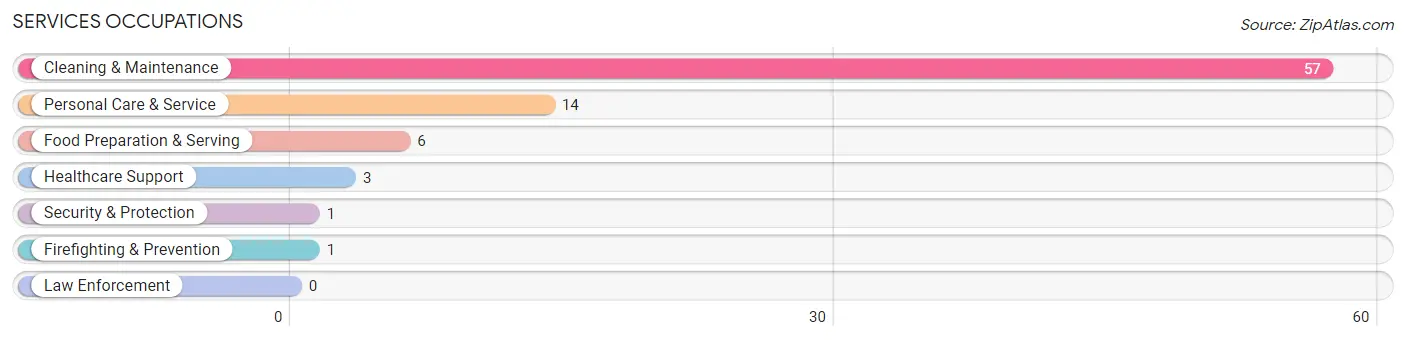
Services Occupations
The most common Services occupations in Akutan are Cleaning & Maintenance (57 | 7.3%), Personal Care & Service (14 | 1.8%), Food Preparation & Serving (6 | 0.8%), Healthcare Support (3 | 0.4%), and Security & Protection (1 | 0.1%).
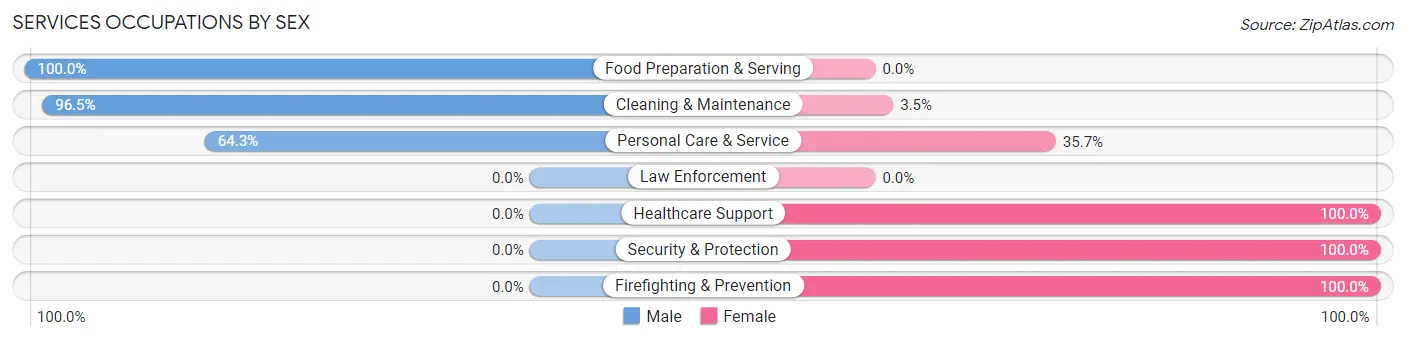
Services Occupations by Sex
Within the Services occupations in Akutan, the most male-oriented occupations are Food Preparation & Serving (100.0%), Cleaning & Maintenance (96.5%), and Personal Care & Service (64.3%), while the most female-oriented occupations are Healthcare Support (100.0%), Security & Protection (100.0%), and Firefighting & Prevention (100.0%).
| Occupation | Male | Female |
| Healthcare Support | 0 (0.0%) | 3 (100.0%) |
| Security & Protection | 0 (0.0%) | 1 (100.0%) |
| Firefighting & Prevention | 0 (0.0%) | 1 (100.0%) |
| Law Enforcement | 0 (0.0%) | 0 (0.0%) |
| Food Preparation & Serving | 6 (100.0%) | 0 (0.0%) |
| Cleaning & Maintenance | 55 (96.5%) | 2 (3.5%) |
| Personal Care & Service | 9 (64.3%) | 5 (35.7%) |
| Total (Category) | 70 (86.4%) | 11 (13.6%) |
| Total (Overall) | 613 (78.2%) | 171 (21.8%) |
Sales and Office Occupations
The most common Sales and Office occupations in Akutan are Office & Administration (22 | 2.8%), and Sales & Related (5 | 0.6%).
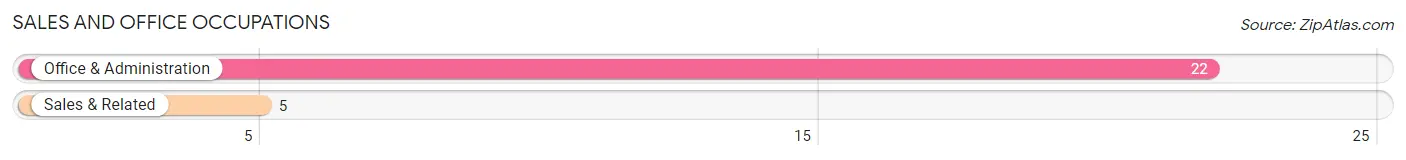
Sales and Office Occupations by Sex
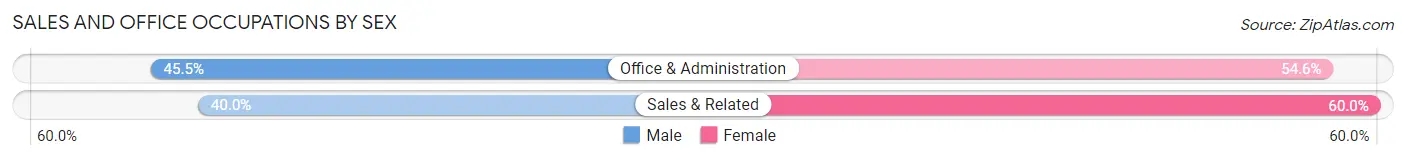
| Occupation | Male | Female |
| Sales & Related | 2 (40.0%) | 3 (60.0%) |
| Office & Administration | 10 (45.5%) | 12 (54.5%) |
| Total (Category) | 12 (44.4%) | 15 (55.6%) |
| Total (Overall) | 613 (78.2%) | 171 (21.8%) |
Natural Resources, Construction and Maintenance Occupations
The most common Natural Resources, Construction and Maintenance occupations in Akutan are Installation, Maintenance & Repair (52 | 6.6%), and Construction & Extraction (32 | 4.1%).
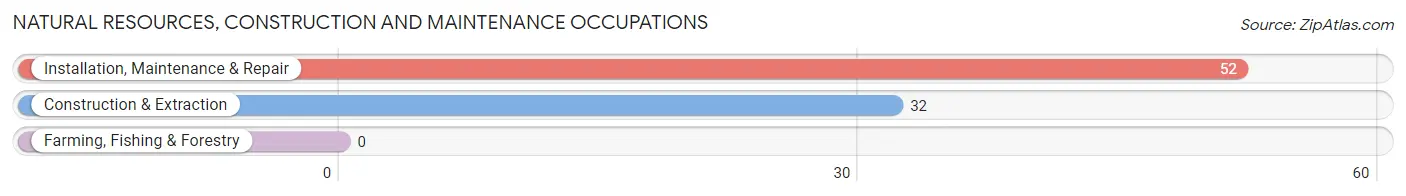
Natural Resources, Construction and Maintenance Occupations by Sex
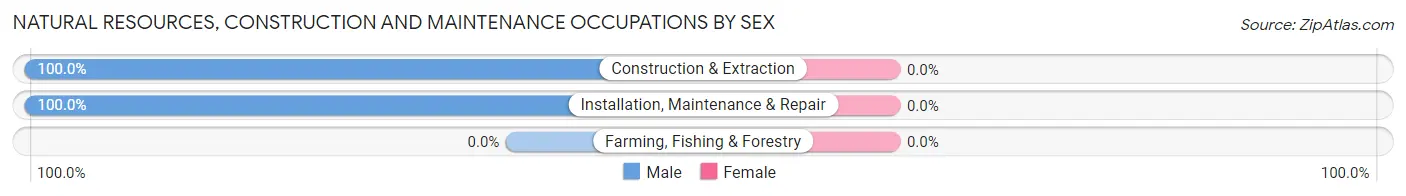
| Occupation | Male | Female |
| Farming, Fishing & Forestry | 0 (0.0%) | 0 (0.0%) |
| Construction & Extraction | 32 (100.0%) | 0 (0.0%) |
| Installation, Maintenance & Repair | 52 (100.0%) | 0 (0.0%) |
| Total (Category) | 84 (100.0%) | 0 (0.0%) |
| Total (Overall) | 613 (78.2%) | 171 (21.8%) |
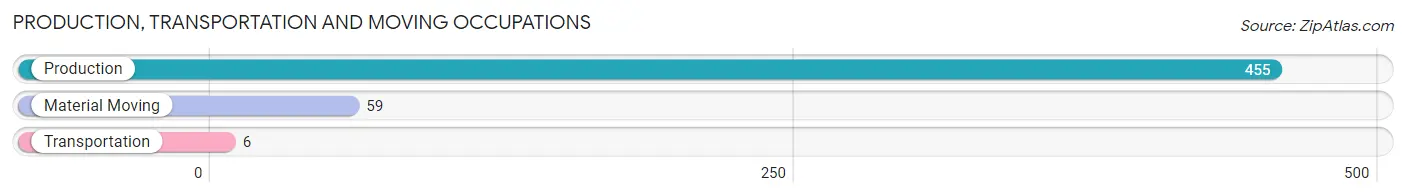
Production, Transportation and Moving Occupations
The most common Production, Transportation and Moving occupations in Akutan are Production (455 | 58.0%), Material Moving (59 | 7.5%), and Transportation (6 | 0.8%).
Production, Transportation and Moving Occupations by Sex
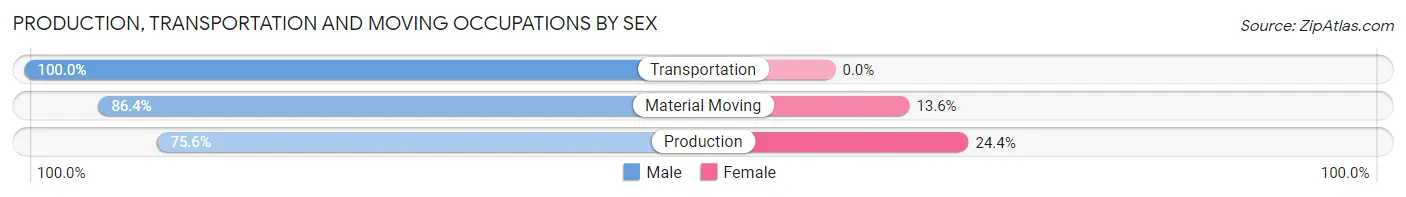
| Occupation | Male | Female |
| Production | 344 (75.6%) | 111 (24.4%) |
| Transportation | 6 (100.0%) | 0 (0.0%) |
| Material Moving | 51 (86.4%) | 8 (13.6%) |
| Total (Category) | 401 (77.1%) | 119 (22.9%) |
| Total (Overall) | 613 (78.2%) | 171 (21.8%) |
Employment Industries by Sex in Akutan
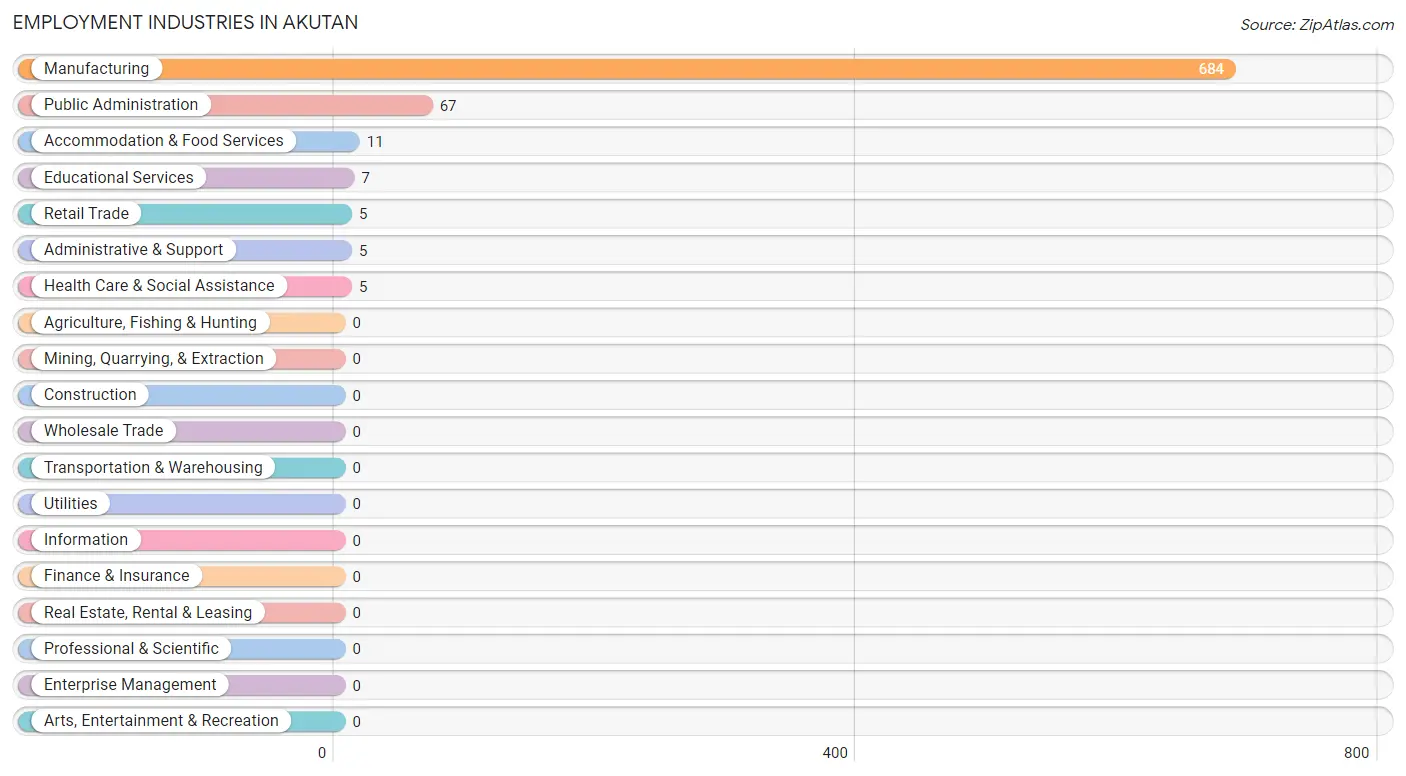
Employment Industries in Akutan
The major employment industries in Akutan include Manufacturing (684 | 87.2%), Public Administration (67 | 8.6%), Accommodation & Food Services (11 | 1.4%), Educational Services (7 | 0.9%), and Retail Trade (5 | 0.6%).
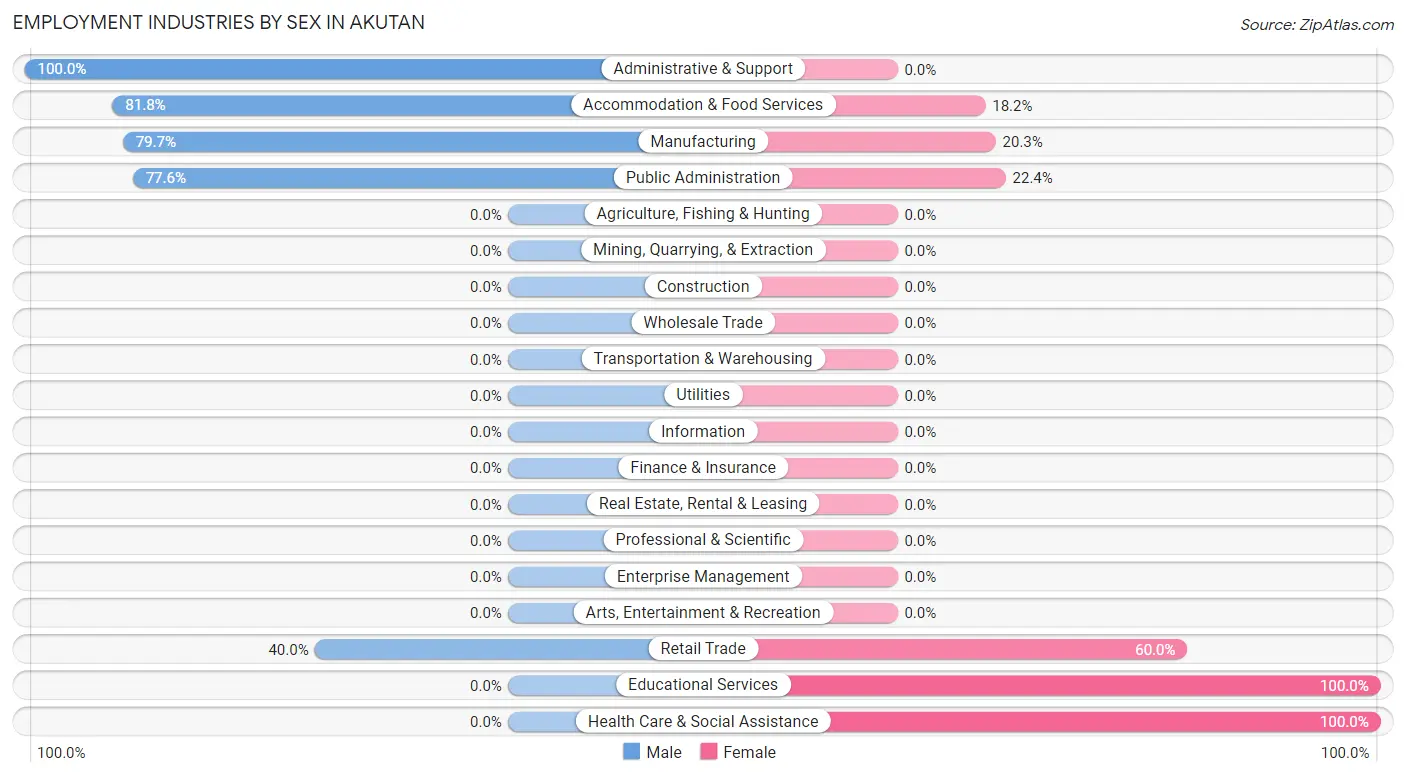
Employment Industries by Sex in Akutan
The Akutan industries that see more men than women are Administrative & Support (100.0%), Accommodation & Food Services (81.8%), and Manufacturing (79.7%), whereas the industries that tend to have a higher number of women are Educational Services (100.0%), Health Care & Social Assistance (100.0%), and Retail Trade (60.0%).
| Industry | Male | Female |
| Agriculture, Fishing & Hunting | 0 (0.0%) | 0 (0.0%) |
| Mining, Quarrying, & Extraction | 0 (0.0%) | 0 (0.0%) |
| Construction | 0 (0.0%) | 0 (0.0%) |
| Manufacturing | 545 (79.7%) | 139 (20.3%) |
| Wholesale Trade | 0 (0.0%) | 0 (0.0%) |
| Retail Trade | 2 (40.0%) | 3 (60.0%) |
| Transportation & Warehousing | 0 (0.0%) | 0 (0.0%) |
| Utilities | 0 (0.0%) | 0 (0.0%) |
| Information | 0 (0.0%) | 0 (0.0%) |
| Finance & Insurance | 0 (0.0%) | 0 (0.0%) |
| Real Estate, Rental & Leasing | 0 (0.0%) | 0 (0.0%) |
| Professional & Scientific | 0 (0.0%) | 0 (0.0%) |
| Enterprise Management | 0 (0.0%) | 0 (0.0%) |
| Administrative & Support | 5 (100.0%) | 0 (0.0%) |
| Educational Services | 0 (0.0%) | 7 (100.0%) |
| Health Care & Social Assistance | 0 (0.0%) | 5 (100.0%) |
| Arts, Entertainment & Recreation | 0 (0.0%) | 0 (0.0%) |
| Accommodation & Food Services | 9 (81.8%) | 2 (18.2%) |
| Public Administration | 52 (77.6%) | 15 (22.4%) |
| Total | 613 (78.2%) | 171 (21.8%) |
Education in Akutan
School Enrollment in Akutan
The most common levels of schooling among the 47 students in Akutan are college / undergraduate (12 | 25.5%), graduate / professional (12 | 25.5%), and elementary school (9 | 19.2%).
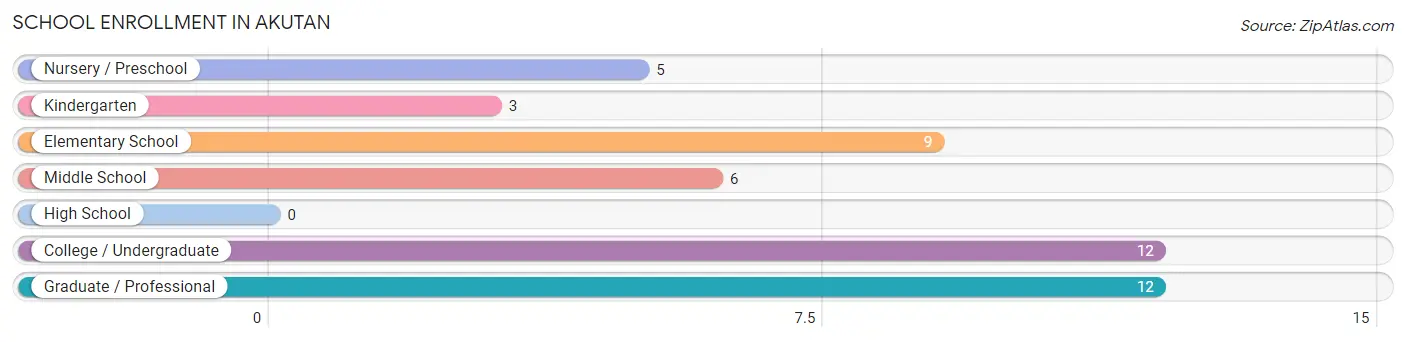
| School Level | # Students | % Students |
| Nursery / Preschool | 5 | 10.6% |
| Kindergarten | 3 | 6.4% |
| Elementary School | 9 | 19.2% |
| Middle School | 6 | 12.8% |
| High School | 0 | 0.0% |
| College / Undergraduate | 12 | 25.5% |
| Graduate / Professional | 12 | 25.5% |
| Total | 47 | 100.0% |
School Enrollment by Age by Funding Source in Akutan
Out of a total of 47 students who are enrolled in schools in Akutan, 10 (21.3%) attend a private institution, while the remaining 37 (78.7%) are enrolled in public schools. The age group of 20 to 24 year olds has the highest likelihood of being enrolled in private schools, with 7 (100.0% in the age bracket) enrolled. Conversely, the age group of 3 to 4 year olds has the lowest likelihood of being enrolled in a private school, with 8 (100.0% in the age bracket) attending a public institution.
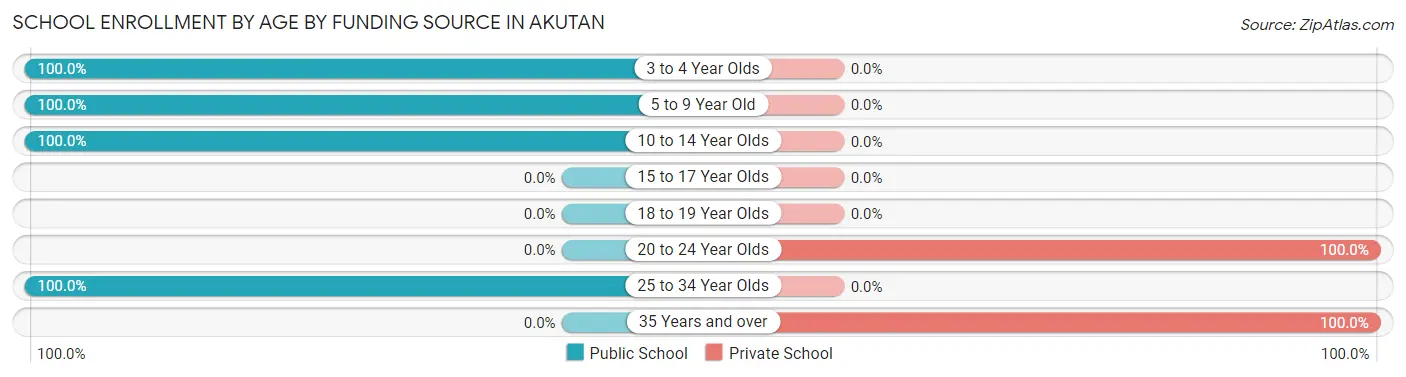
| Age Bracket | Public School | Private School |
| 3 to 4 Year Olds | 8 (100.0%) | 0 (0.0%) |
| 5 to 9 Year Old | 9 (100.0%) | 0 (0.0%) |
| 10 to 14 Year Olds | 6 (100.0%) | 0 (0.0%) |
| 15 to 17 Year Olds | 0 (0.0%) | 0 (0.0%) |
| 18 to 19 Year Olds | 0 (0.0%) | 0 (0.0%) |
| 20 to 24 Year Olds | 0 (0.0%) | 7 (100.0%) |
| 25 to 34 Year Olds | 14 (100.0%) | 0 (0.0%) |
| 35 Years and over | 0 (0.0%) | 3 (100.0%) |
| Total | 37 (78.7%) | 10 (21.3%) |
Educational Attainment by Field of Study in Akutan
Science & technology (74 | 46.3%), social sciences (21 | 13.1%), business (20 | 12.5%), engineering (13 | 8.1%), and bio, nature & agricultural (10 | 6.2%) are the most common fields of study among 160 individuals in Akutan who have obtained a bachelor's degree or higher.
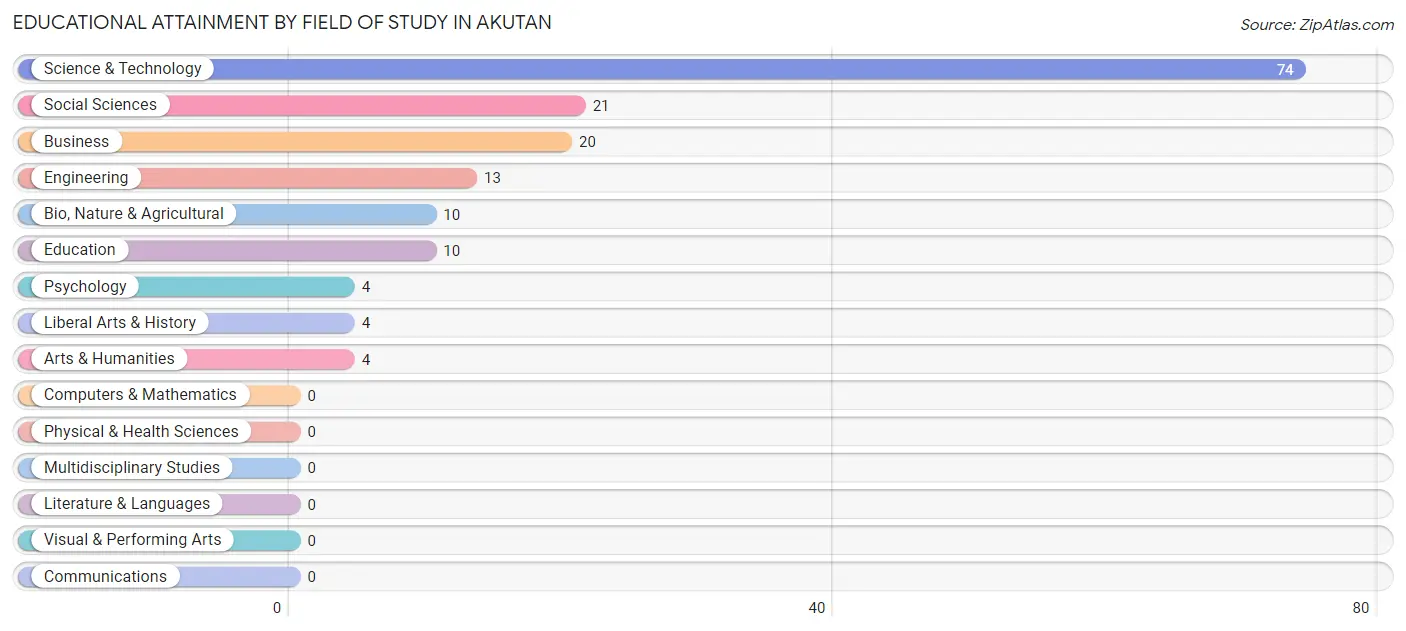
| Field of Study | # Graduates | % Graduates |
| Computers & Mathematics | 0 | 0.0% |
| Bio, Nature & Agricultural | 10 | 6.2% |
| Physical & Health Sciences | 0 | 0.0% |
| Psychology | 4 | 2.5% |
| Social Sciences | 21 | 13.1% |
| Engineering | 13 | 8.1% |
| Multidisciplinary Studies | 0 | 0.0% |
| Science & Technology | 74 | 46.3% |
| Business | 20 | 12.5% |
| Education | 10 | 6.2% |
| Literature & Languages | 0 | 0.0% |
| Liberal Arts & History | 4 | 2.5% |
| Visual & Performing Arts | 0 | 0.0% |
| Communications | 0 | 0.0% |
| Arts & Humanities | 4 | 2.5% |
| Total | 160 | 100.0% |
Transportation & Commute in Akutan
Vehicle Availability by Sex in Akutan
The most prevalent vehicle ownership categories in Akutan are males with no vehicle (63, accounting for 100.0%) and females with no vehicle (34, making up 180.0%).
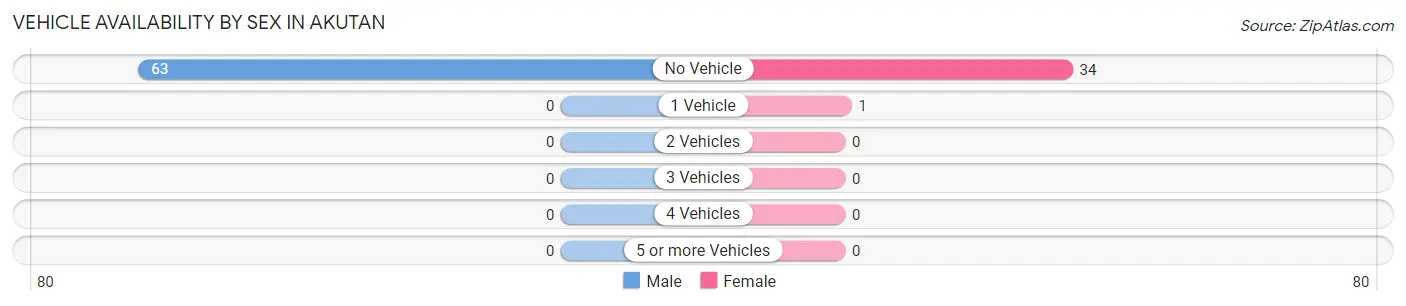
| Vehicles Available | Male | Female |
| No Vehicle | 63 (100.0%) | 34 (97.1%) |
| 1 Vehicle | 0 (0.0%) | 1 (2.9%) |
| 2 Vehicles | 0 (0.0%) | 0 (0.0%) |
| 3 Vehicles | 0 (0.0%) | 0 (0.0%) |
| 4 Vehicles | 0 (0.0%) | 0 (0.0%) |
| 5 or more Vehicles | 0 (0.0%) | 0 (0.0%) |
| Total | 63 (100.0%) | 35 (100.0%) |
Commute Time in Akutan
The most frequently occuring commute durations in Akutan are 5 to 9 minutes (345 commuters, 63.4%), 15 to 19 minutes (74 commuters, 13.6%), and 10 to 14 minutes (63 commuters, 11.6%).
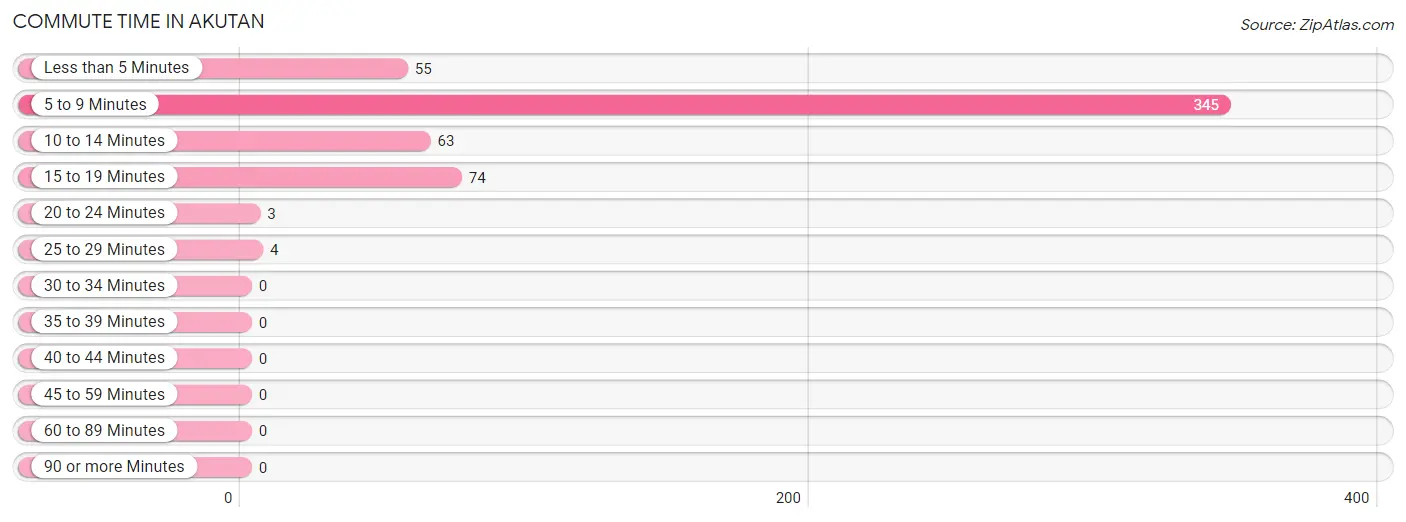
| Commute Time | # Commuters | % Commuters |
| Less than 5 Minutes | 55 | 10.1% |
| 5 to 9 Minutes | 345 | 63.4% |
| 10 to 14 Minutes | 63 | 11.6% |
| 15 to 19 Minutes | 74 | 13.6% |
| 20 to 24 Minutes | 3 | 0.5% |
| 25 to 29 Minutes | 4 | 0.7% |
| 30 to 34 Minutes | 0 | 0.0% |
| 35 to 39 Minutes | 0 | 0.0% |
| 40 to 44 Minutes | 0 | 0.0% |
| 45 to 59 Minutes | 0 | 0.0% |
| 60 to 89 Minutes | 0 | 0.0% |
| 90 or more Minutes | 0 | 0.0% |
Commute Time by Sex in Akutan
The most common commute times in Akutan are 5 to 9 minutes (278 commuters, 65.3%) for males and 5 to 9 minutes (67 commuters, 56.8%) for females.
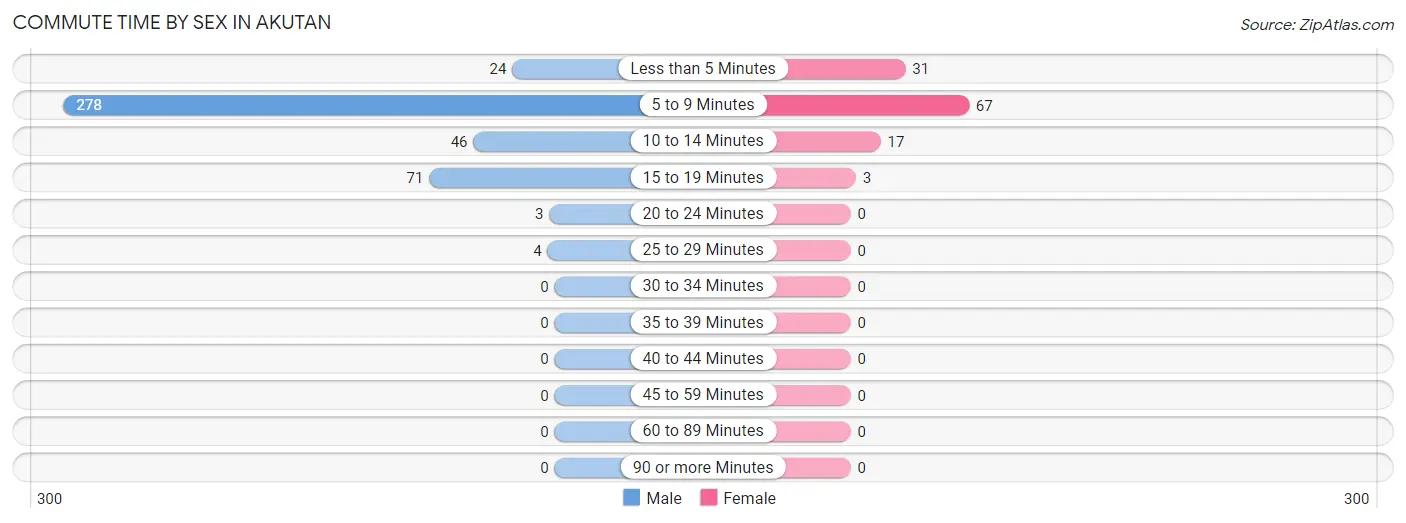
| Commute Time | Male | Female |
| Less than 5 Minutes | 24 (5.6%) | 31 (26.3%) |
| 5 to 9 Minutes | 278 (65.3%) | 67 (56.8%) |
| 10 to 14 Minutes | 46 (10.8%) | 17 (14.4%) |
| 15 to 19 Minutes | 71 (16.7%) | 3 (2.5%) |
| 20 to 24 Minutes | 3 (0.7%) | 0 (0.0%) |
| 25 to 29 Minutes | 4 (0.9%) | 0 (0.0%) |
| 30 to 34 Minutes | 0 (0.0%) | 0 (0.0%) |
| 35 to 39 Minutes | 0 (0.0%) | 0 (0.0%) |
| 40 to 44 Minutes | 0 (0.0%) | 0 (0.0%) |
| 45 to 59 Minutes | 0 (0.0%) | 0 (0.0%) |
| 60 to 89 Minutes | 0 (0.0%) | 0 (0.0%) |
| 90 or more Minutes | 0 (0.0%) | 0 (0.0%) |
Time of Departure to Work by Sex in Akutan
The most frequent times of departure to work in Akutan are 5:30 AM to 5:59 AM (196, 46.0%) for males and 5:30 AM to 5:59 AM (25, 21.2%) for females.
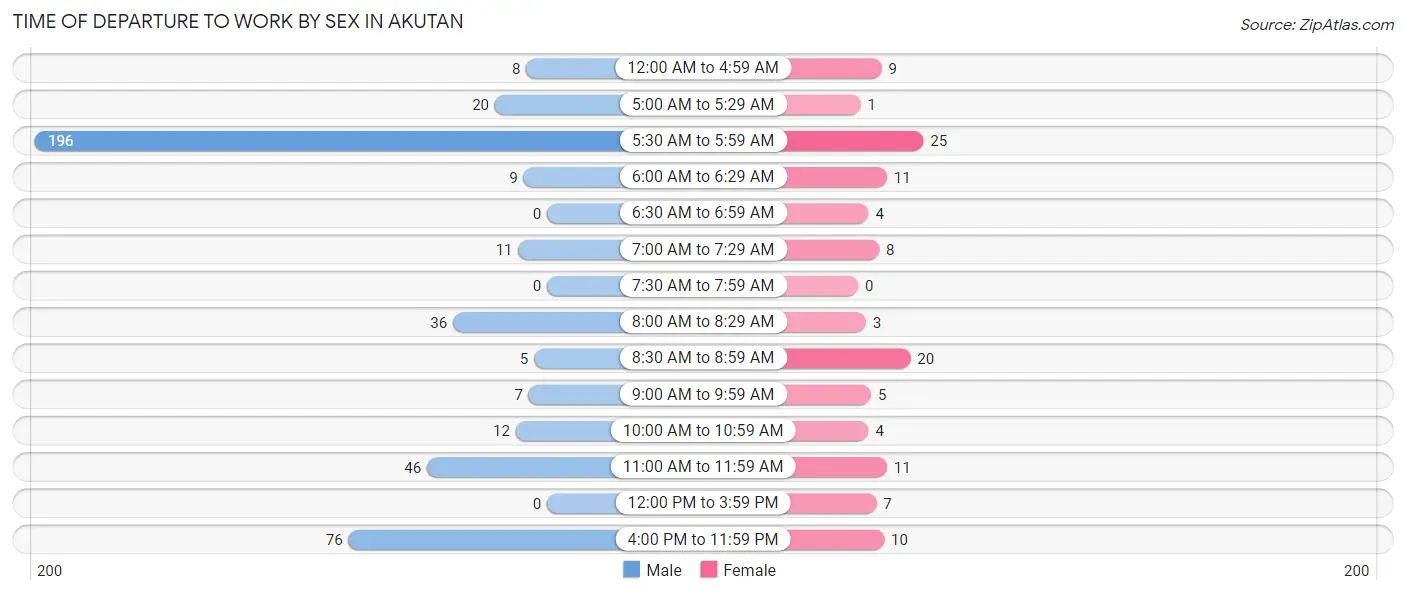
| Time of Departure | Male | Female |
| 12:00 AM to 4:59 AM | 8 (1.9%) | 9 (7.6%) |
| 5:00 AM to 5:29 AM | 20 (4.7%) | 1 (0.9%) |
| 5:30 AM to 5:59 AM | 196 (46.0%) | 25 (21.2%) |
| 6:00 AM to 6:29 AM | 9 (2.1%) | 11 (9.3%) |
| 6:30 AM to 6:59 AM | 0 (0.0%) | 4 (3.4%) |
| 7:00 AM to 7:29 AM | 11 (2.6%) | 8 (6.8%) |
| 7:30 AM to 7:59 AM | 0 (0.0%) | 0 (0.0%) |
| 8:00 AM to 8:29 AM | 36 (8.5%) | 3 (2.5%) |
| 8:30 AM to 8:59 AM | 5 (1.2%) | 20 (17.0%) |
| 9:00 AM to 9:59 AM | 7 (1.6%) | 5 (4.2%) |
| 10:00 AM to 10:59 AM | 12 (2.8%) | 4 (3.4%) |
| 11:00 AM to 11:59 AM | 46 (10.8%) | 11 (9.3%) |
| 12:00 PM to 3:59 PM | 0 (0.0%) | 7 (5.9%) |
| 4:00 PM to 11:59 PM | 76 (17.8%) | 10 (8.5%) |
| Total | 426 (100.0%) | 118 (100.0%) |
Housing Occupancy in Akutan
Occupancy by Ownership in Akutan
Of the total 58 dwellings in Akutan, owner-occupied units account for 30 (51.7%), while renter-occupied units make up 28 (48.3%).
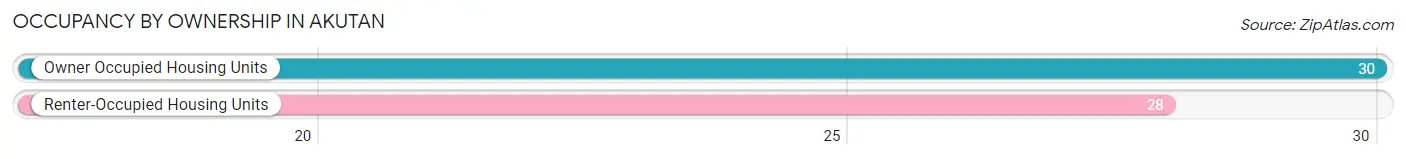
| Occupancy | # Housing Units | % Housing Units |
| Owner Occupied Housing Units | 30 | 51.7% |
| Renter-Occupied Housing Units | 28 | 48.3% |
| Total Occupied Housing Units | 58 | 100.0% |
Occupancy by Household Size in Akutan
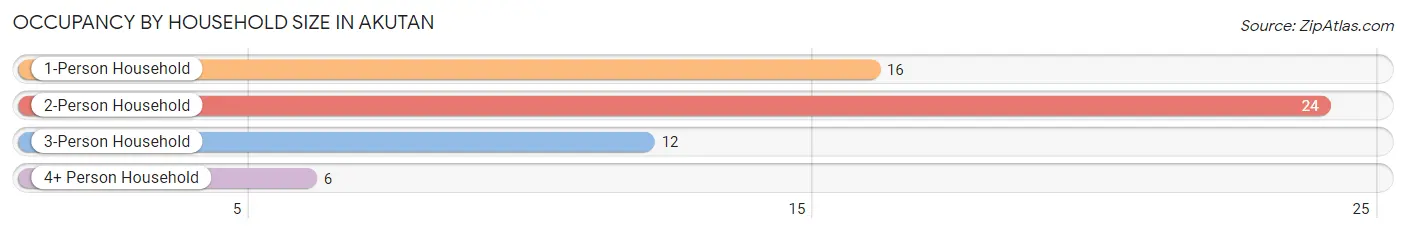
| Household Size | # Housing Units | % Housing Units |
| 1-Person Household | 16 | 27.6% |
| 2-Person Household | 24 | 41.4% |
| 3-Person Household | 12 | 20.7% |
| 4+ Person Household | 6 | 10.3% |
| Total Housing Units | 58 | 100.0% |
Occupancy by Ownership by Household Size in Akutan
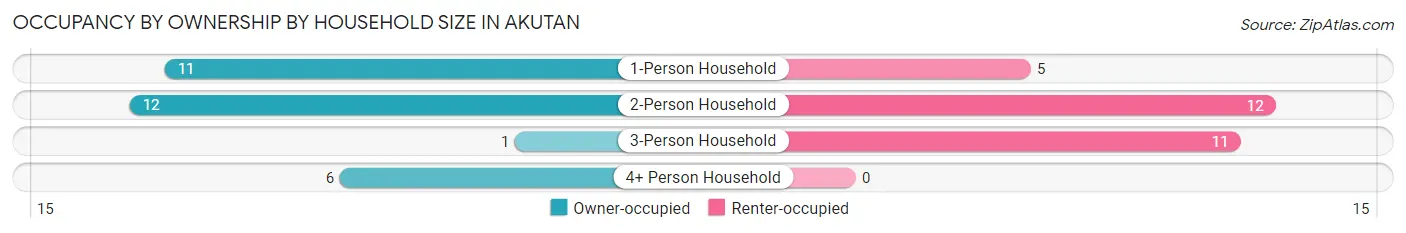
| Household Size | Owner-occupied | Renter-occupied |
| 1-Person Household | 11 (68.8%) | 5 (31.2%) |
| 2-Person Household | 12 (50.0%) | 12 (50.0%) |
| 3-Person Household | 1 (8.3%) | 11 (91.7%) |
| 4+ Person Household | 6 (100.0%) | 0 (0.0%) |
| Total Housing Units | 30 (51.7%) | 28 (48.3%) |
Occupancy by Educational Attainment in Akutan
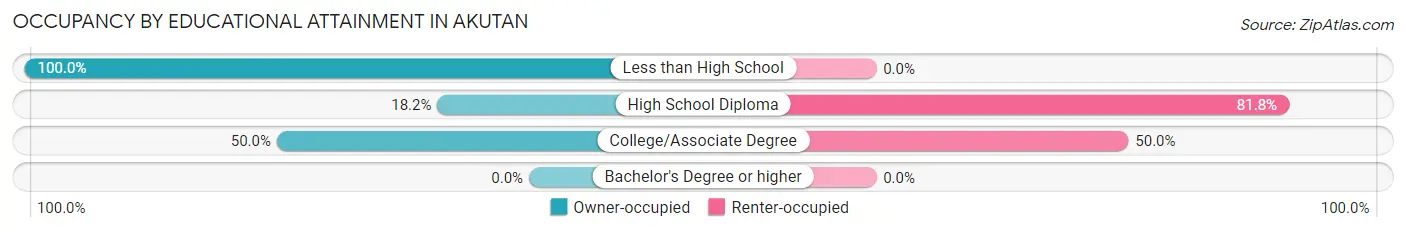
| Household Size | Owner-occupied | Renter-occupied |
| Less than High School | 9 (100.0%) | 0 (0.0%) |
| High School Diploma | 2 (18.2%) | 9 (81.8%) |
| College/Associate Degree | 19 (50.0%) | 19 (50.0%) |
| Bachelor's Degree or higher | 0 (0.0%) | 0 (0.0%) |
Occupancy by Age of Householder in Akutan
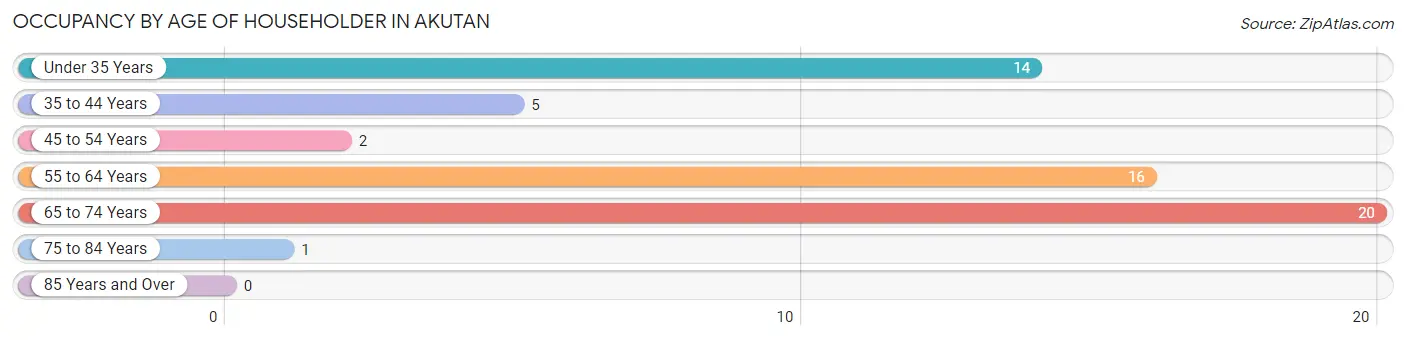
| Age Bracket | # Households | % Households |
| Under 35 Years | 14 | 24.1% |
| 35 to 44 Years | 5 | 8.6% |
| 45 to 54 Years | 2 | 3.5% |
| 55 to 64 Years | 16 | 27.6% |
| 65 to 74 Years | 20 | 34.5% |
| 75 to 84 Years | 1 | 1.7% |
| 85 Years and Over | 0 | 0.0% |
| Total | 58 | 100.0% |
Housing Finances in Akutan
Median Income by Occupancy in Akutan
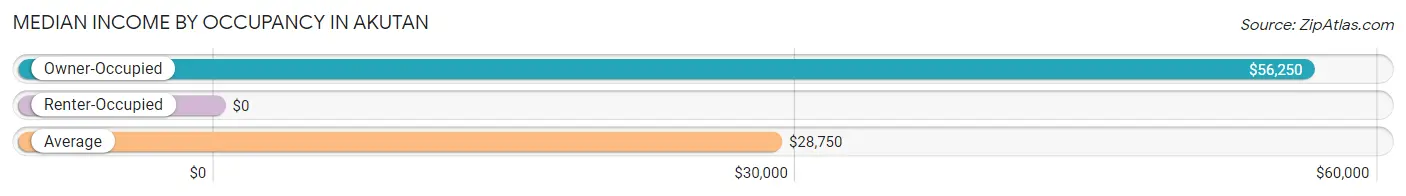
| Occupancy Type | # Households | Median Income |
| Owner-Occupied | 30 (51.7%) | $56,250 |
| Renter-Occupied | 28 (48.3%) | $0 |
| Average | 58 (100.0%) | $28,750 |
Occupancy by Householder Income Bracket in Akutan
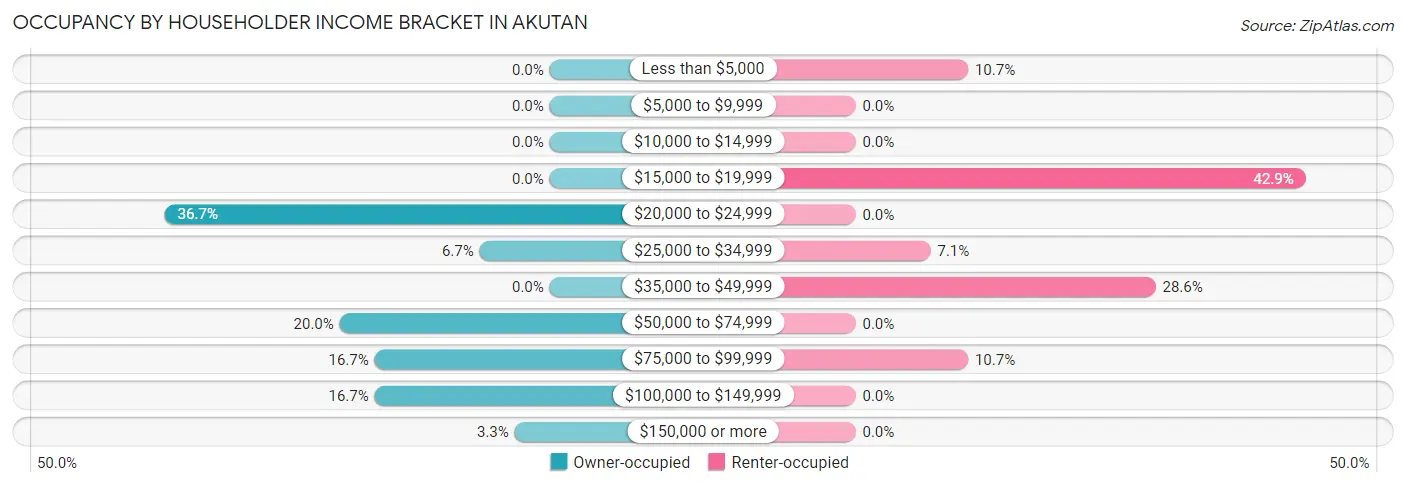
| Income Bracket | Owner-occupied | Renter-occupied |
| Less than $5,000 | 0 (0.0%) | 3 (10.7%) |
| $5,000 to $9,999 | 0 (0.0%) | 0 (0.0%) |
| $10,000 to $14,999 | 0 (0.0%) | 0 (0.0%) |
| $15,000 to $19,999 | 0 (0.0%) | 12 (42.9%) |
| $20,000 to $24,999 | 11 (36.7%) | 0 (0.0%) |
| $25,000 to $34,999 | 2 (6.7%) | 2 (7.1%) |
| $35,000 to $49,999 | 0 (0.0%) | 8 (28.6%) |
| $50,000 to $74,999 | 6 (20.0%) | 0 (0.0%) |
| $75,000 to $99,999 | 5 (16.7%) | 3 (10.7%) |
| $100,000 to $149,999 | 5 (16.7%) | 0 (0.0%) |
| $150,000 or more | 1 (3.3%) | 0 (0.0%) |
| Total | 30 (100.0%) | 28 (100.0%) |
Monthly Housing Cost Tiers in Akutan
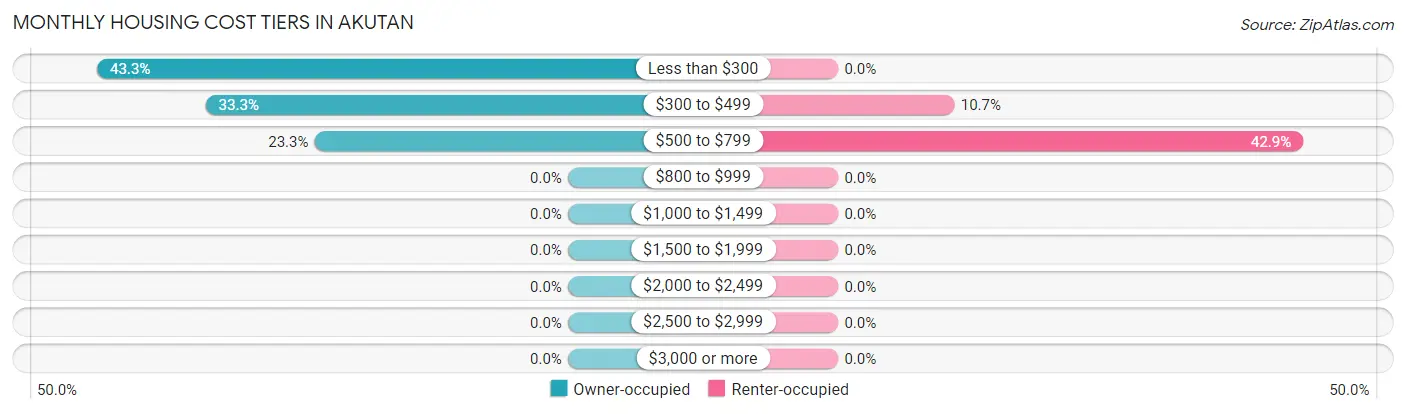
| Monthly Cost | Owner-occupied | Renter-occupied |
| Less than $300 | 13 (43.3%) | 0 (0.0%) |
| $300 to $499 | 10 (33.3%) | 3 (10.7%) |
| $500 to $799 | 7 (23.3%) | 12 (42.9%) |
| $800 to $999 | 0 (0.0%) | 0 (0.0%) |
| $1,000 to $1,499 | 0 (0.0%) | 0 (0.0%) |
| $1,500 to $1,999 | 0 (0.0%) | 0 (0.0%) |
| $2,000 to $2,499 | 0 (0.0%) | 0 (0.0%) |
| $2,500 to $2,999 | 0 (0.0%) | 0 (0.0%) |
| $3,000 or more | 0 (0.0%) | 0 (0.0%) |
| Total | 30 (100.0%) | 28 (100.0%) |
Physical Housing Characteristics in Akutan
Housing Structures in Akutan
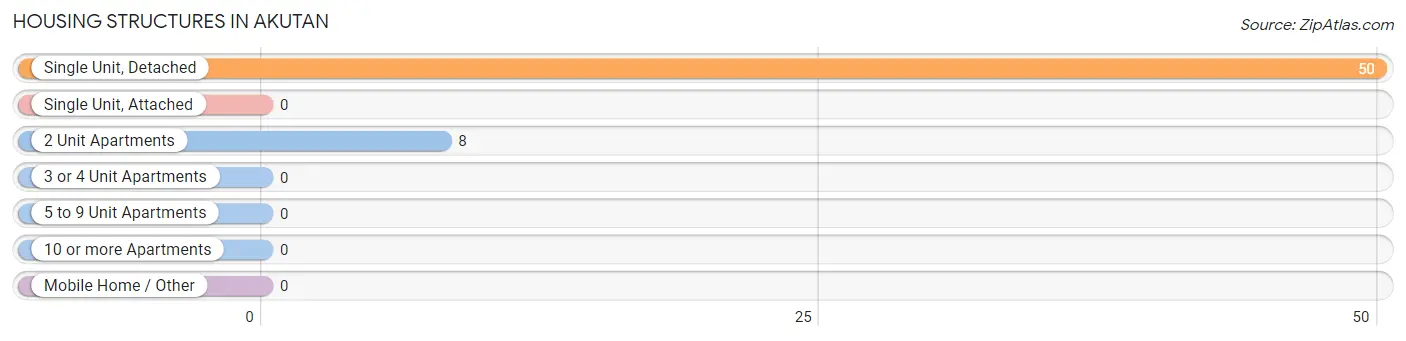
| Structure Type | # Housing Units | % Housing Units |
| Single Unit, Detached | 50 | 86.2% |
| Single Unit, Attached | 0 | 0.0% |
| 2 Unit Apartments | 8 | 13.8% |
| 3 or 4 Unit Apartments | 0 | 0.0% |
| 5 to 9 Unit Apartments | 0 | 0.0% |
| 10 or more Apartments | 0 | 0.0% |
| Mobile Home / Other | 0 | 0.0% |
| Total | 58 | 100.0% |
Housing Structures by Occupancy in Akutan
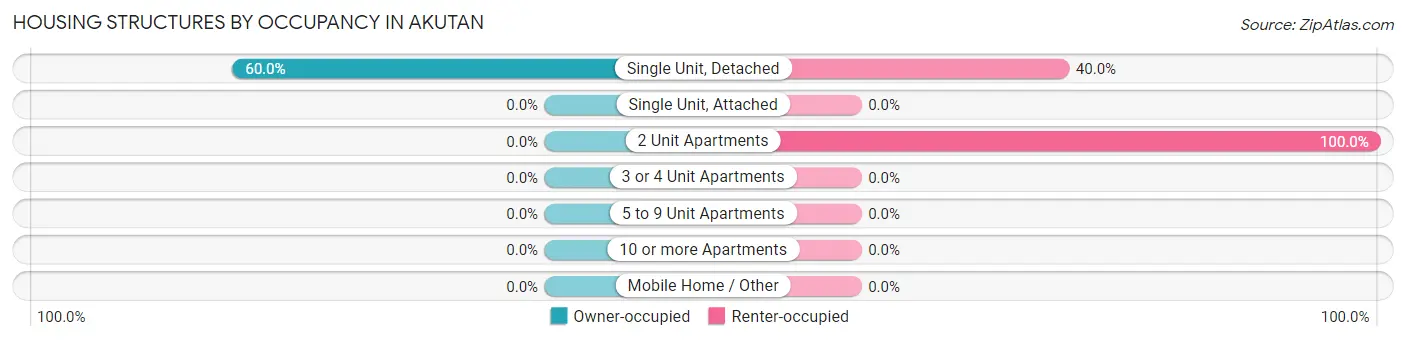
| Structure Type | Owner-occupied | Renter-occupied |
| Single Unit, Detached | 30 (60.0%) | 20 (40.0%) |
| Single Unit, Attached | 0 (0.0%) | 0 (0.0%) |
| 2 Unit Apartments | 0 (0.0%) | 8 (100.0%) |
| 3 or 4 Unit Apartments | 0 (0.0%) | 0 (0.0%) |
| 5 to 9 Unit Apartments | 0 (0.0%) | 0 (0.0%) |
| 10 or more Apartments | 0 (0.0%) | 0 (0.0%) |
| Mobile Home / Other | 0 (0.0%) | 0 (0.0%) |
| Total | 30 (51.7%) | 28 (48.3%) |
Housing Structures by Number of Rooms in Akutan
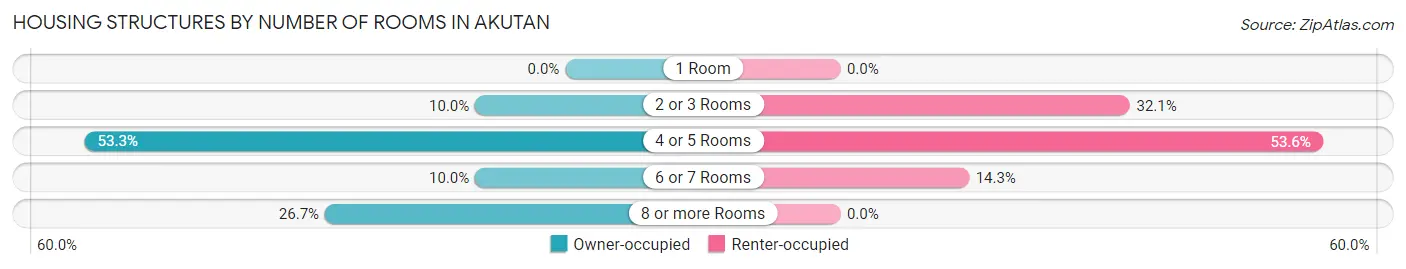
| Number of Rooms | Owner-occupied | Renter-occupied |
| 1 Room | 0 (0.0%) | 0 (0.0%) |
| 2 or 3 Rooms | 3 (10.0%) | 9 (32.1%) |
| 4 or 5 Rooms | 16 (53.3%) | 15 (53.6%) |
| 6 or 7 Rooms | 3 (10.0%) | 4 (14.3%) |
| 8 or more Rooms | 8 (26.7%) | 0 (0.0%) |
| Total | 30 (100.0%) | 28 (100.0%) |
Housing Structure by Heating Type in Akutan
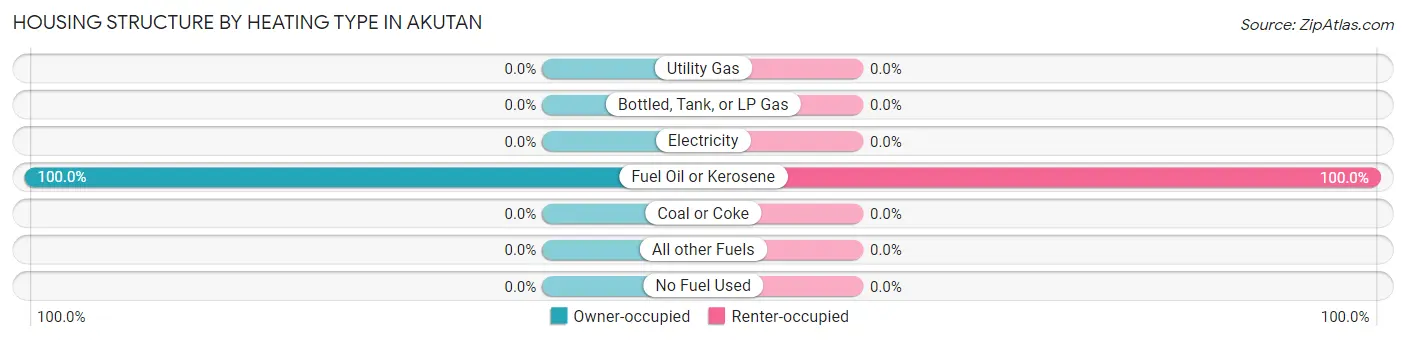
| Heating Type | Owner-occupied | Renter-occupied |
| Utility Gas | 0 (0.0%) | 0 (0.0%) |
| Bottled, Tank, or LP Gas | 0 (0.0%) | 0 (0.0%) |
| Electricity | 0 (0.0%) | 0 (0.0%) |
| Fuel Oil or Kerosene | 30 (100.0%) | 28 (100.0%) |
| Coal or Coke | 0 (0.0%) | 0 (0.0%) |
| All other Fuels | 0 (0.0%) | 0 (0.0%) |
| No Fuel Used | 0 (0.0%) | 0 (0.0%) |
| Total | 30 (100.0%) | 28 (100.0%) |
Household Vehicle Usage in Akutan
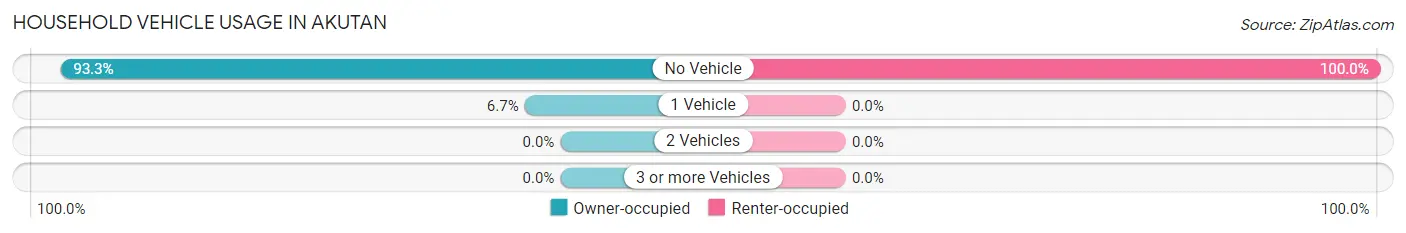
| Vehicles per Household | Owner-occupied | Renter-occupied |
| No Vehicle | 28 (93.3%) | 28 (100.0%) |
| 1 Vehicle | 2 (6.7%) | 0 (0.0%) |
| 2 Vehicles | 0 (0.0%) | 0 (0.0%) |
| 3 or more Vehicles | 0 (0.0%) | 0 (0.0%) |
| Total | 30 (100.0%) | 28 (100.0%) |
Real Estate & Mortgages in Akutan
Real Estate and Mortgage Overview in Akutan
| Characteristic | Without Mortgage | With Mortgage |
| Housing Units | 27 | 3 |
| Median Property Value | $115,600 | $0 |
| Median Household Income | - | - |
| Monthly Housing Costs | $304 | $0 |
| Real Estate Taxes | - | - |
Property Value by Mortgage Status in Akutan
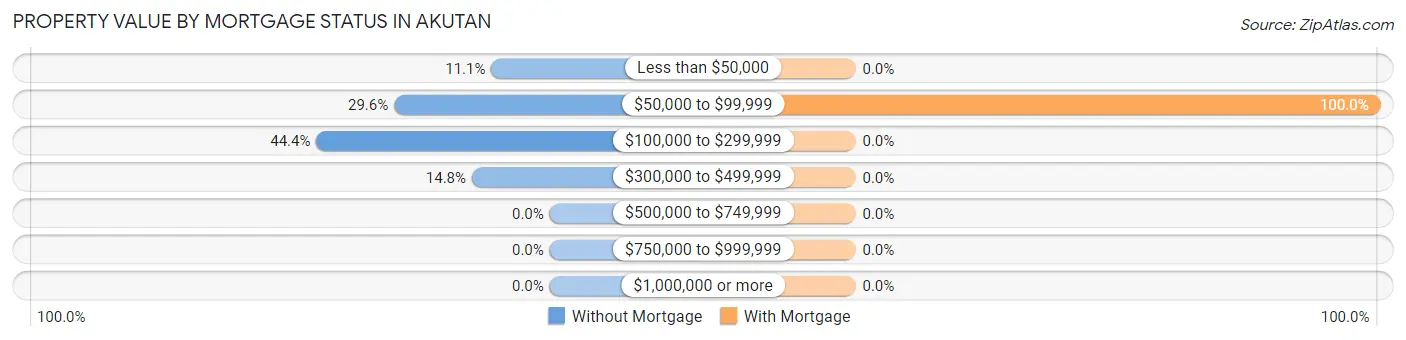
| Property Value | Without Mortgage | With Mortgage |
| Less than $50,000 | 3 (11.1%) | 0 (0.0%) |
| $50,000 to $99,999 | 8 (29.6%) | 3 (100.0%) |
| $100,000 to $299,999 | 12 (44.4%) | 0 (0.0%) |
| $300,000 to $499,999 | 4 (14.8%) | 0 (0.0%) |
| $500,000 to $749,999 | 0 (0.0%) | 0 (0.0%) |
| $750,000 to $999,999 | 0 (0.0%) | 0 (0.0%) |
| $1,000,000 or more | 0 (0.0%) | 0 (0.0%) |
| Total | 27 (100.0%) | 3 (100.0%) |
Household Income by Mortgage Status in Akutan
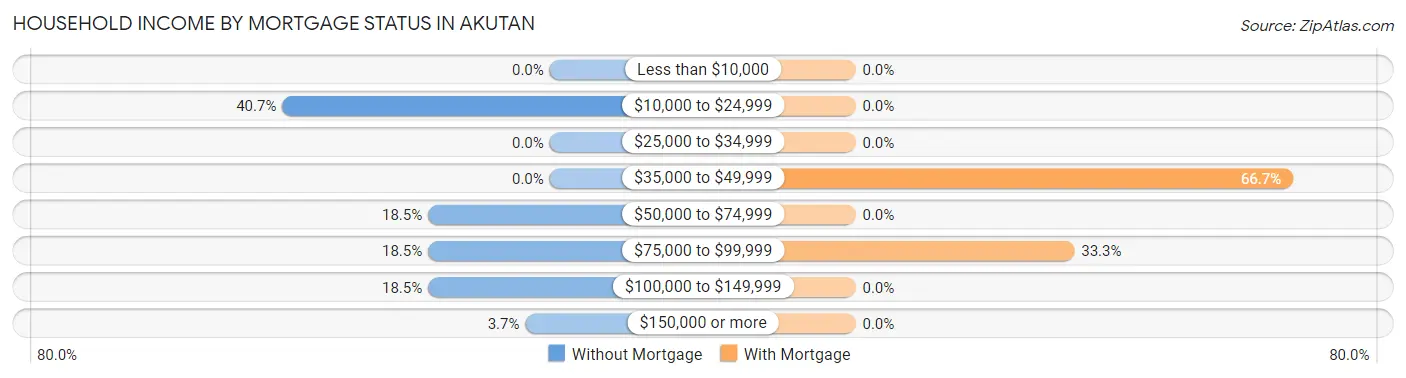
| Household Income | Without Mortgage | With Mortgage |
| Less than $10,000 | 0 (0.0%) | 0 (0.0%) |
| $10,000 to $24,999 | 11 (40.7%) | 0 (0.0%) |
| $25,000 to $34,999 | 0 (0.0%) | 0 (0.0%) |
| $35,000 to $49,999 | 0 (0.0%) | 2 (66.7%) |
| $50,000 to $74,999 | 5 (18.5%) | 0 (0.0%) |
| $75,000 to $99,999 | 5 (18.5%) | 1 (33.3%) |
| $100,000 to $149,999 | 5 (18.5%) | 0 (0.0%) |
| $150,000 or more | 1 (3.7%) | 0 (0.0%) |
| Total | 27 (100.0%) | 3 (100.0%) |
Property Value to Household Income Ratio in Akutan
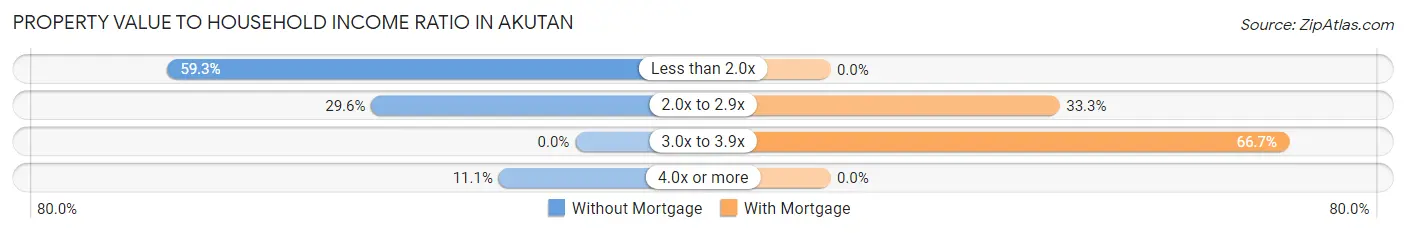
| Value-to-Income Ratio | Without Mortgage | With Mortgage |
| Less than 2.0x | 16 (59.3%) | 0 (0.0%) |
| 2.0x to 2.9x | 8 (29.6%) | 1 (33.3%) |
| 3.0x to 3.9x | 0 (0.0%) | 2 (66.7%) |
| 4.0x or more | 3 (11.1%) | 0 (0.0%) |
| Total | 27 (100.0%) | 3 (100.0%) |
Real Estate Taxes by Mortgage Status in Akutan
| Property Taxes | Without Mortgage | With Mortgage |
| Less than $800 | 0 (0.0%) | 0 (0.0%) |
| $800 to $1,499 | 0 (0.0%) | 0 (0.0%) |
| $800 to $1,499 | 0 (0.0%) | 0 (0.0%) |
| Total | 27 (100.0%) | 3 (100.0%) |
Health & Disability in Akutan
Health Insurance Coverage by Age in Akutan
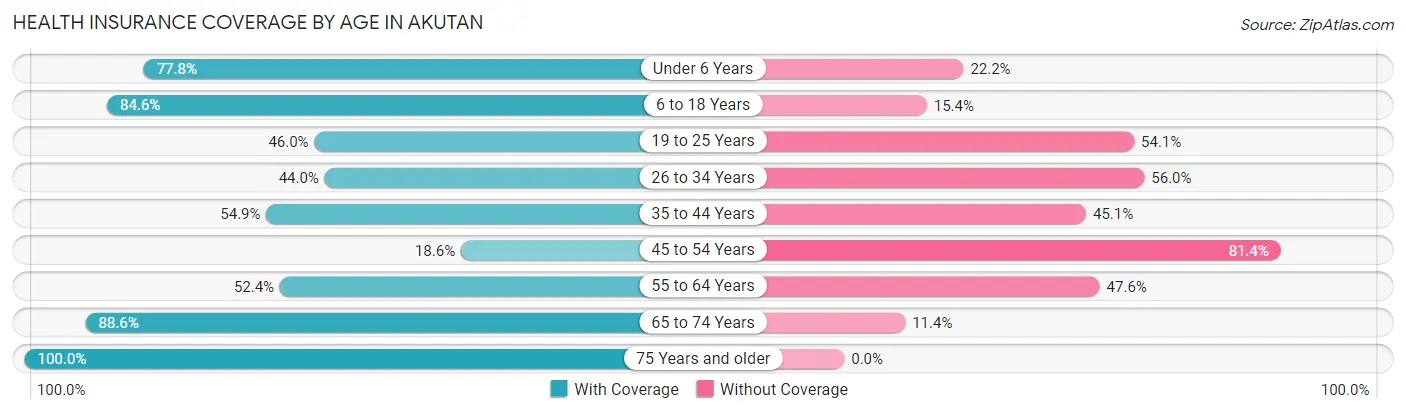
| Age Bracket | With Coverage | Without Coverage |
| Under 6 Years | 14 (77.8%) | 4 (22.2%) |
| 6 to 18 Years | 11 (84.6%) | 2 (15.4%) |
| 19 to 25 Years | 34 (46.0%) | 40 (54.0%) |
| 26 to 34 Years | 96 (44.0%) | 122 (56.0%) |
| 35 to 44 Years | 134 (54.9%) | 110 (45.1%) |
| 45 to 54 Years | 35 (18.6%) | 153 (81.4%) |
| 55 to 64 Years | 55 (52.4%) | 50 (47.6%) |
| 65 to 74 Years | 39 (88.6%) | 5 (11.4%) |
| 75 Years and older | 7 (100.0%) | 0 (0.0%) |
| Total | 425 (46.7%) | 486 (53.3%) |
Health Insurance Coverage by Citizenship Status in Akutan
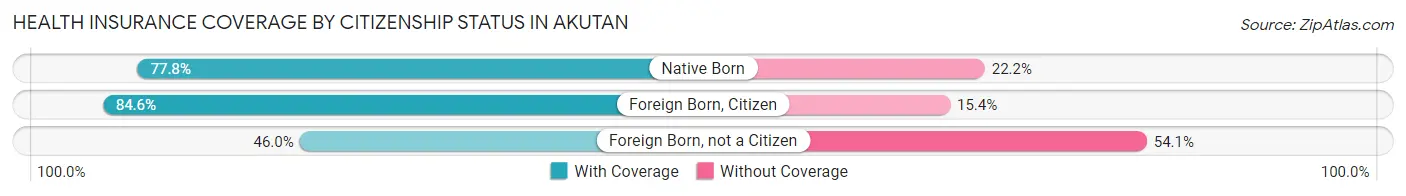
| Citizenship Status | With Coverage | Without Coverage |
| Native Born | 14 (77.8%) | 4 (22.2%) |
| Foreign Born, Citizen | 11 (84.6%) | 2 (15.4%) |
| Foreign Born, not a Citizen | 34 (46.0%) | 40 (54.0%) |
Health Insurance Coverage by Household Income in Akutan
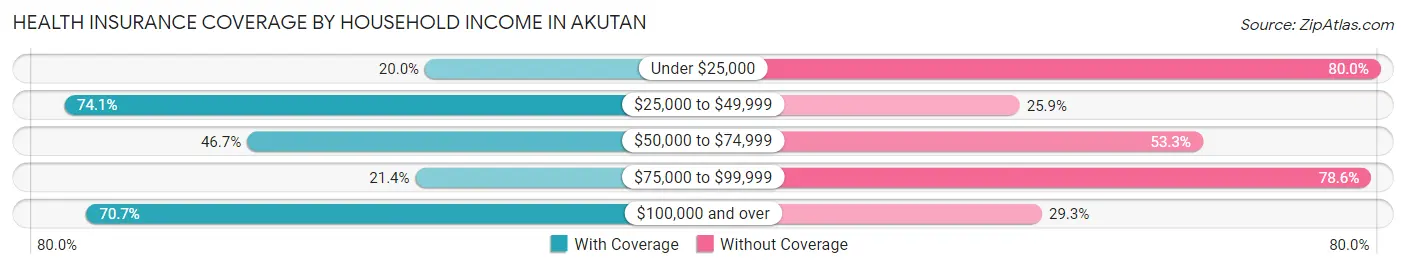
| Household Income | With Coverage | Without Coverage |
| Under $25,000 | 15 (20.0%) | 60 (80.0%) |
| $25,000 to $49,999 | 20 (74.1%) | 7 (25.9%) |
| $50,000 to $74,999 | 7 (46.7%) | 8 (53.3%) |
| $75,000 to $99,999 | 3 (21.4%) | 11 (78.6%) |
| $100,000 and over | 29 (70.7%) | 12 (29.3%) |
Public vs Private Health Insurance Coverage by Age in Akutan
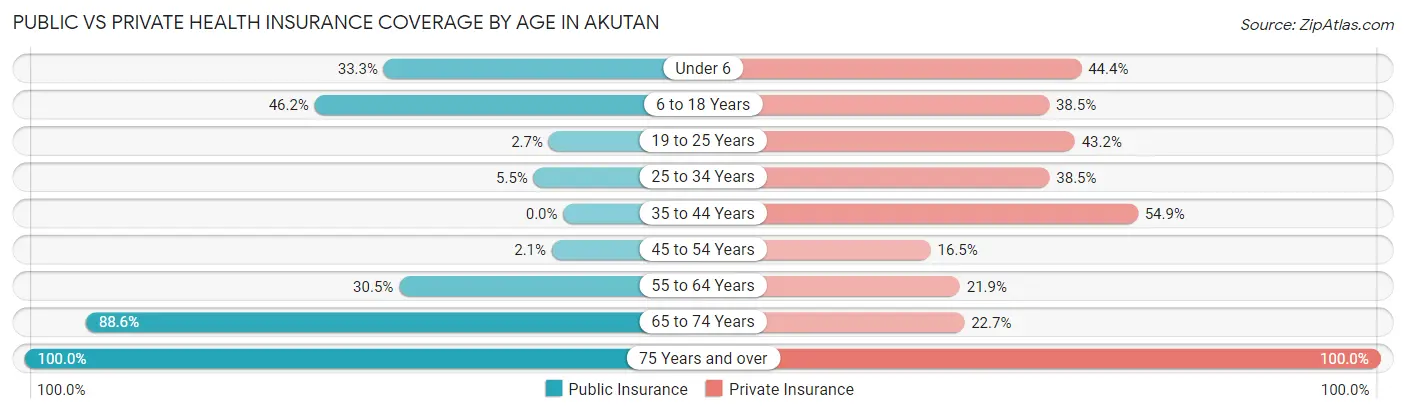
| Age Bracket | Public Insurance | Private Insurance |
| Under 6 | 6 (33.3%) | 8 (44.4%) |
| 6 to 18 Years | 6 (46.2%) | 5 (38.5%) |
| 19 to 25 Years | 2 (2.7%) | 32 (43.2%) |
| 25 to 34 Years | 12 (5.5%) | 84 (38.5%) |
| 35 to 44 Years | 0 (0.0%) | 134 (54.9%) |
| 45 to 54 Years | 4 (2.1%) | 31 (16.5%) |
| 55 to 64 Years | 32 (30.5%) | 23 (21.9%) |
| 65 to 74 Years | 39 (88.6%) | 10 (22.7%) |
| 75 Years and over | 7 (100.0%) | 7 (100.0%) |
| Total | 108 (11.9%) | 334 (36.7%) |
Disability Status by Sex by Age in Akutan
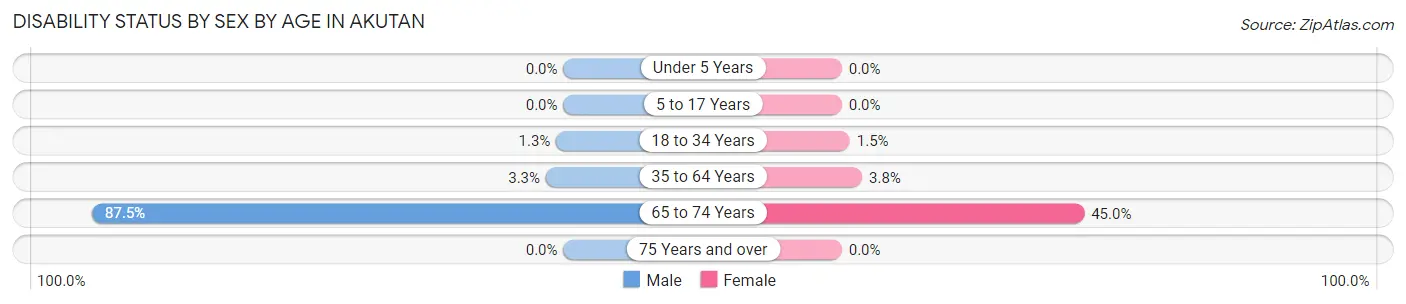
| Age Bracket | Male | Female |
| Under 5 Years | 0 (0.0%) | 0 (0.0%) |
| 5 to 17 Years | 0 (0.0%) | 0 (0.0%) |
| 18 to 34 Years | 3 (1.3%) | 1 (1.5%) |
| 35 to 64 Years | 14 (3.3%) | 4 (3.8%) |
| 65 to 74 Years | 21 (87.5%) | 9 (45.0%) |
| 75 Years and over | 0 (0.0%) | 0 (0.0%) |
Disability Class by Sex by Age in Akutan
Disability Class: Hearing Difficulty
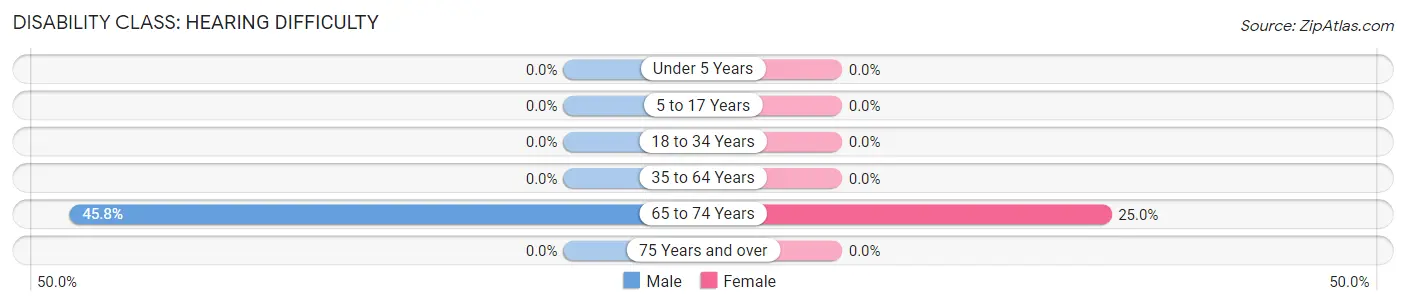
| Age Bracket | Male | Female |
| Under 5 Years | 0 (0.0%) | 0 (0.0%) |
| 5 to 17 Years | 0 (0.0%) | 0 (0.0%) |
| 18 to 34 Years | 0 (0.0%) | 0 (0.0%) |
| 35 to 64 Years | 0 (0.0%) | 0 (0.0%) |
| 65 to 74 Years | 11 (45.8%) | 5 (25.0%) |
| 75 Years and over | 0 (0.0%) | 0 (0.0%) |
Disability Class: Vision Difficulty
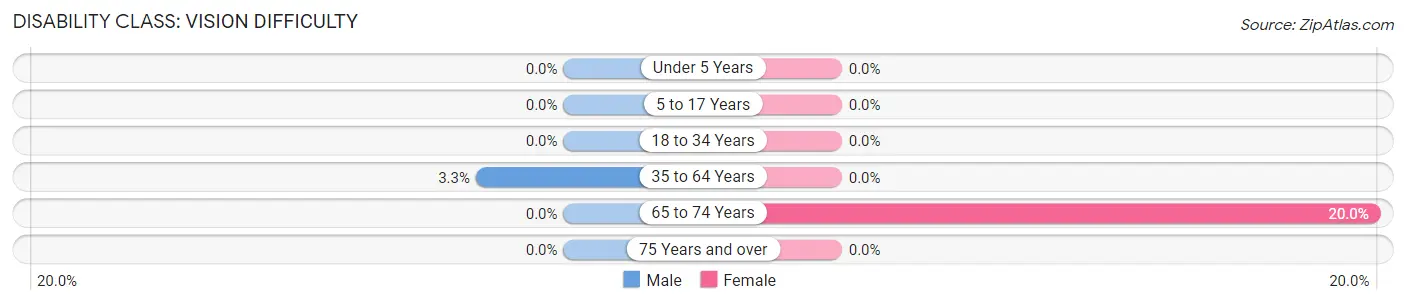
| Age Bracket | Male | Female |
| Under 5 Years | 0 (0.0%) | 0 (0.0%) |
| 5 to 17 Years | 0 (0.0%) | 0 (0.0%) |
| 18 to 34 Years | 0 (0.0%) | 0 (0.0%) |
| 35 to 64 Years | 14 (3.3%) | 0 (0.0%) |
| 65 to 74 Years | 0 (0.0%) | 4 (20.0%) |
| 75 Years and over | 0 (0.0%) | 0 (0.0%) |
Disability Class: Cognitive Difficulty
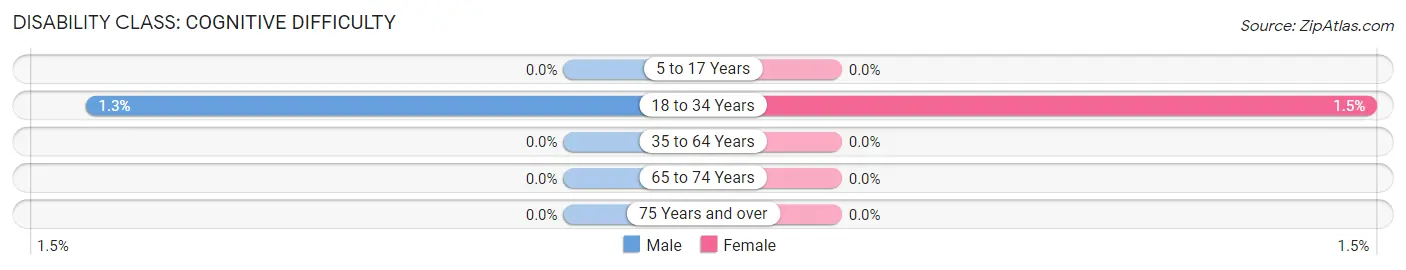
| Age Bracket | Male | Female |
| 5 to 17 Years | 0 (0.0%) | 0 (0.0%) |
| 18 to 34 Years | 3 (1.3%) | 1 (1.5%) |
| 35 to 64 Years | 0 (0.0%) | 0 (0.0%) |
| 65 to 74 Years | 0 (0.0%) | 0 (0.0%) |
| 75 Years and over | 0 (0.0%) | 0 (0.0%) |
Disability Class: Ambulatory Difficulty
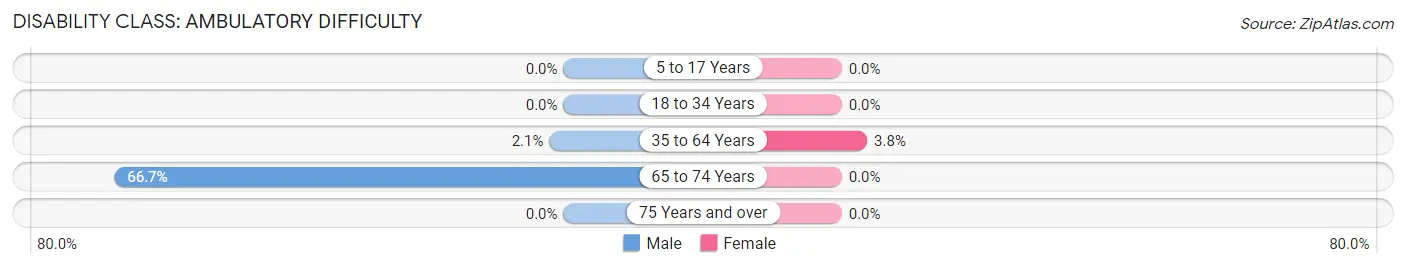
| Age Bracket | Male | Female |
| 5 to 17 Years | 0 (0.0%) | 0 (0.0%) |
| 18 to 34 Years | 0 (0.0%) | 0 (0.0%) |
| 35 to 64 Years | 9 (2.1%) | 4 (3.8%) |
| 65 to 74 Years | 16 (66.7%) | 0 (0.0%) |
| 75 Years and over | 0 (0.0%) | 0 (0.0%) |
Disability Class: Self-Care Difficulty
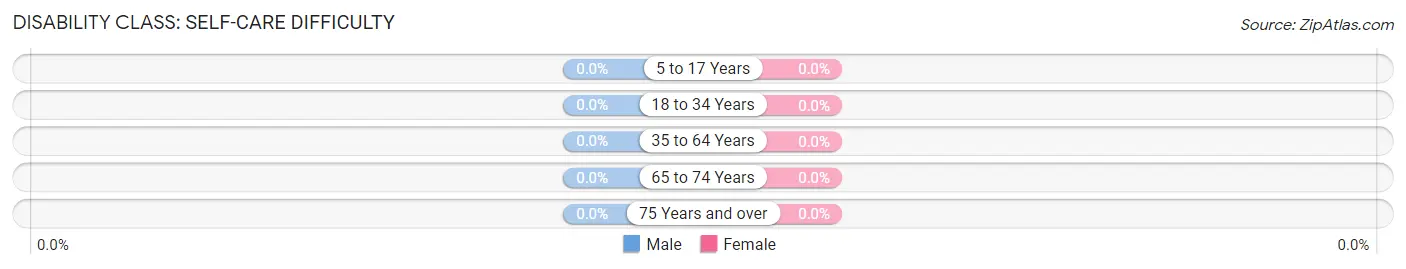
| Age Bracket | Male | Female |
| 5 to 17 Years | 0 (0.0%) | 0 (0.0%) |
| 18 to 34 Years | 0 (0.0%) | 0 (0.0%) |
| 35 to 64 Years | 0 (0.0%) | 0 (0.0%) |
| 65 to 74 Years | 0 (0.0%) | 0 (0.0%) |
| 75 Years and over | 0 (0.0%) | 0 (0.0%) |
Technology Access in Akutan
Computing Device Access in Akutan
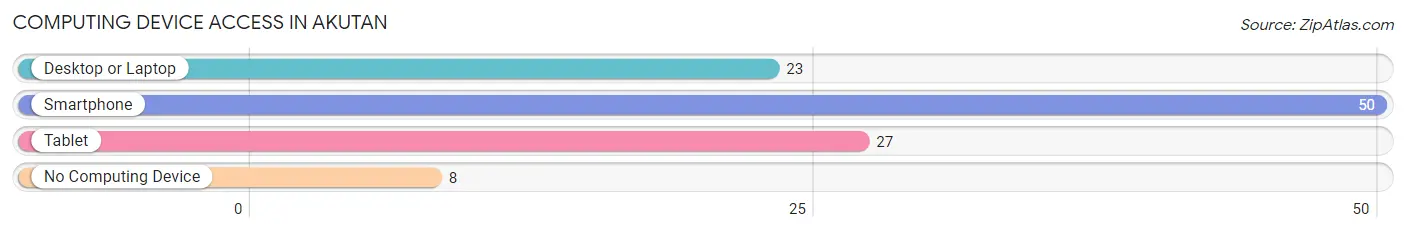
| Device Type | # Households | % Households |
| Desktop or Laptop | 23 | 39.7% |
| Smartphone | 50 | 86.2% |
| Tablet | 27 | 46.6% |
| No Computing Device | 8 | 13.8% |
| Total | 58 | 100.0% |
Internet Access in Akutan
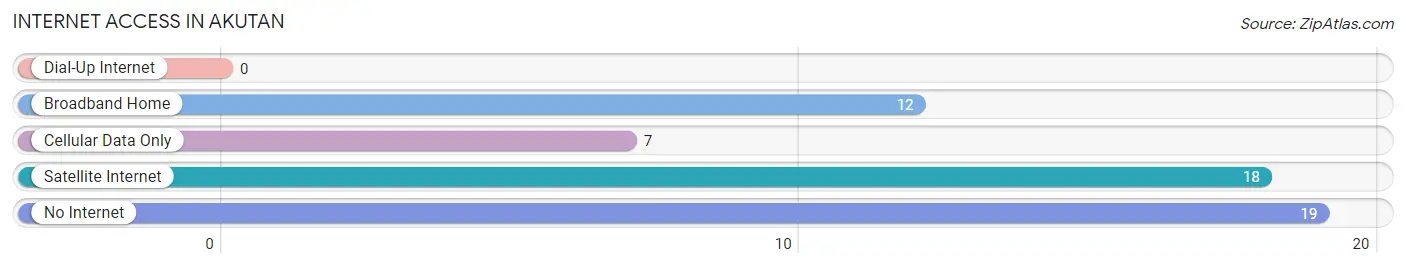
| Internet Type | # Households | % Households |
| Dial-Up Internet | 0 | 0.0% |
| Broadband Home | 12 | 20.7% |
| Cellular Data Only | 7 | 12.1% |
| Satellite Internet | 18 | 31.0% |
| No Internet | 19 | 32.8% |
| Total | 58 | 100.0% |
Akutan Summary
Akutan is a small city located on Akutan Island in the Aleutian Islands of Alaska. It is part of the Aleutians East Borough and has a population of about 500 people. The city is located on the eastern side of the island, and is the only city on the island.
Geography
Akutan is located on the eastern side of Akutan Island, which is part of the Aleutian Islands chain in Alaska. The island is about 25 miles long and 10 miles wide, and is located about 600 miles southwest of Anchorage. The island is mostly mountainous, with the highest peak reaching an elevation of 2,945 feet. The island is surrounded by the Bering Sea to the north and the Pacific Ocean to the south. The climate is generally cool and wet, with temperatures ranging from the mid-30s in the winter to the mid-50s in the summer.
Economy
The economy of Akutan is largely based on fishing and tourism. The city is home to several commercial fishing operations, including a large salmon cannery. The cannery processes and packages salmon for sale in the United States and abroad. The city also has a small tourism industry, with visitors coming to the island to experience the unique wildlife and scenery.
Demographics
As of the 2010 census, the population of Akutan was 498 people. The racial makeup of the city was 95.2% White, 0.2% African American, 0.2% Native American, 0.2% Asian, 0.2% Pacific Islander, 0.2% from other races, and 3.8% from two or more races. The median age was 37.7 years, and the median household income was $45,000.
History
The area around Akutan has been inhabited by the Aleut people for thousands of years. The first European to visit the island was Russian explorer Vitus Bering in 1741. The island was later claimed by the United States in 1867, and in 1884 the first permanent settlement was established. The settlement was named Akutan, after the Aleut word for “place of many fish.”
In the early 1900s, the island was home to a large commercial fishing industry, with several canneries operating on the island. The industry declined in the mid-1900s, and the canneries closed in the 1970s. The city has since become a popular tourist destination, with visitors coming to experience the unique wildlife and scenery.
Conclusion
Akutan is a small city located on Akutan Island in the Aleutian Islands of Alaska. It is part of the Aleutians East Borough and has a population of about 500 people. The economy of Akutan is largely based on fishing and tourism, and the city is home to several commercial fishing operations. The racial makeup of the city is mostly White, with a median age of 37.7 years and a median household income of $45,000. The area around Akutan has been inhabited by the Aleut people for thousands of years, and the first European to visit the island was Russian explorer Vitus Bering in 1741. The city has since become a popular tourist destination, with visitors coming to experience the unique wildlife and scenery.
Common Questions
What is Per Capita Income in Akutan?
Per Capita income in Akutan is $45,054.
What is the Median Family Income in Akutan?
Median Family Income in Akutan is $41,250.
What is the Median Household income in Akutan?
Median Household Income in Akutan is $28,750.
What is Income or Wage Gap in Akutan?
Income or Wage Gap in Akutan is 6.1%.
Women in Akutan earn 93.9 cents for every dollar earned by a man.
What is Family Income Deficit in Akutan?
Family Income Deficit in Akutan is $1,667.
Families that are below poverty line in Akutan earn $1,667 less on average than the poverty threshold level.
What is Inequality or Gini Index in Akutan?
Inequality or Gini Index in Akutan is 0.44.
What is the Total Population of Akutan?
Total Population of Akutan is 911.
What is the Total Male Population of Akutan?
Total Male Population of Akutan is 695.
What is the Total Female Population of Akutan?
Total Female Population of Akutan is 216.
What is the Ratio of Males per 100 Females in Akutan?
There are 321.76 Males per 100 Females in Akutan.
What is the Ratio of Females per 100 Males in Akutan?
There are 31.08 Females per 100 Males in Akutan.
What is the Median Population Age in Akutan?
Median Population Age in Akutan is 40.8 Years.
What is the Average Family Size in Akutan
Average Family Size in Akutan is 3.9 People.
What is the Average Household Size in Akutan
Average Household Size in Akutan is 3.0 People.
How Large is the Labor Force in Akutan?
There are 819 People in the Labor Forcein in Akutan.
What is the Percentage of People in the Labor Force in Akutan?
93.1% of People are in the Labor Force in Akutan.
What is the Unemployment Rate in Akutan?
Unemployment Rate in Akutan is 4.3%.