Oakdale, WI Map & Demographics
Oakdale Map
Oakdale Overview
$45,590
PER CAPITA INCOME
$64,000
AVG FAMILY INCOME
$87,813
AVG HOUSEHOLD INCOME
19.3%
WAGE / INCOME GAP [ % ]
80.7¢/ $1
WAGE / INCOME GAP [ $ ]
$9,825
FAMILY INCOME DEFICIT
0.38
INEQUALITY / GINI INDEX
259
TOTAL POPULATION
117
MALE POPULATION
142
FEMALE POPULATION
82.39
MALES / 100 FEMALES
121.37
FEMALES / 100 MALES
49.9
MEDIAN AGE
3.1
AVG FAMILY SIZE
2.0
AVG HOUSEHOLD SIZE
159
LABOR FORCE [ PEOPLE ]
71.3%
PERCENT IN LABOR FORCE
1.3%
UNEMPLOYMENT RATE
Oakdale Area Codes
Income in Oakdale
Income Overview in Oakdale
Per Capita Income in Oakdale is $45,590, while median incomes of families and households are $64,000 and $87,813 respectively.
| Characteristic | Number | Measure |
| Per Capita Income | 259 | $45,590 |
| Median Family Income | 56 | $64,000 |
| Mean Family Income | 56 | $79,471 |
| Median Household Income | 129 | $87,813 |
| Mean Household Income | 129 | $91,586 |
| Income Deficit | 56 | $9,825 |
| Wage / Income Gap (%) | 259 | 19.34% |
| Wage / Income Gap ($) | 259 | 80.66¢ per $1 |
| Gini / Inequality Index | 259 | 0.38 |
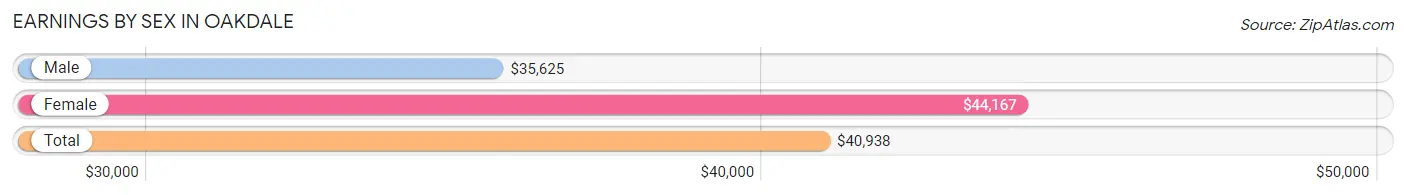
Earnings by Sex in Oakdale
Average Earnings in Oakdale are $40,938, $35,625 for men and $44,167 for women, a difference of 19.3%.
| Sex | Number | Average Earnings |
| Male | 67 (40.6%) | $35,625 |
| Female | 98 (59.4%) | $44,167 |
| Total | 165 (100.0%) | $40,938 |
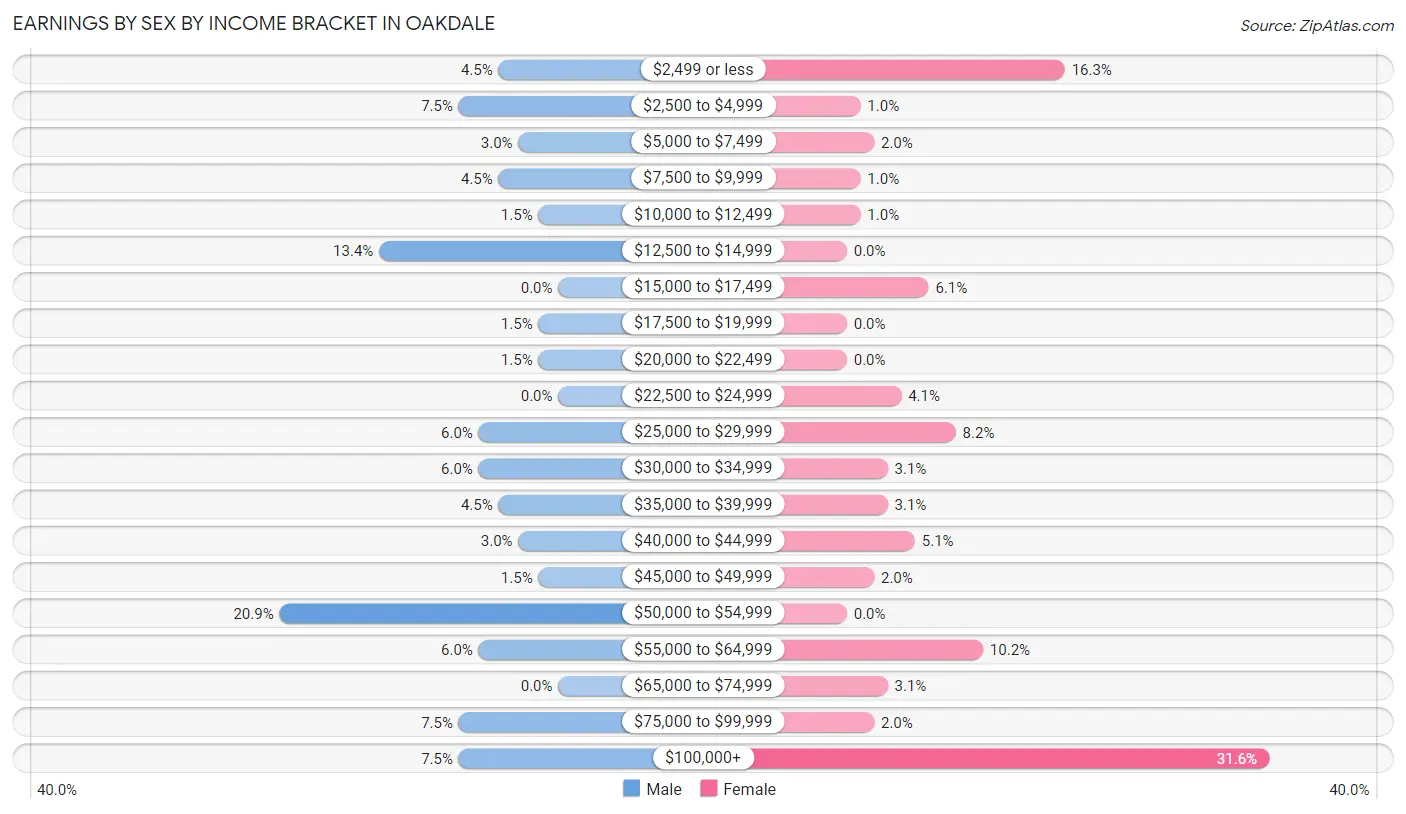
Earnings by Sex by Income Bracket in Oakdale
The most common earnings brackets in Oakdale are $50,000 to $54,999 for men (14 | 20.9%) and $100,000+ for women (31 | 31.6%).
| Income | Male | Female |
| $2,499 or less | 3 (4.5%) | 16 (16.3%) |
| $2,500 to $4,999 | 5 (7.5%) | 1 (1.0%) |
| $5,000 to $7,499 | 2 (3.0%) | 2 (2.0%) |
| $7,500 to $9,999 | 3 (4.5%) | 1 (1.0%) |
| $10,000 to $12,499 | 1 (1.5%) | 1 (1.0%) |
| $12,500 to $14,999 | 9 (13.4%) | 0 (0.0%) |
| $15,000 to $17,499 | 0 (0.0%) | 6 (6.1%) |
| $17,500 to $19,999 | 1 (1.5%) | 0 (0.0%) |
| $20,000 to $22,499 | 1 (1.5%) | 0 (0.0%) |
| $22,500 to $24,999 | 0 (0.0%) | 4 (4.1%) |
| $25,000 to $29,999 | 4 (6.0%) | 8 (8.2%) |
| $30,000 to $34,999 | 4 (6.0%) | 3 (3.1%) |
| $35,000 to $39,999 | 3 (4.5%) | 3 (3.1%) |
| $40,000 to $44,999 | 2 (3.0%) | 5 (5.1%) |
| $45,000 to $49,999 | 1 (1.5%) | 2 (2.0%) |
| $50,000 to $54,999 | 14 (20.9%) | 0 (0.0%) |
| $55,000 to $64,999 | 4 (6.0%) | 10 (10.2%) |
| $65,000 to $74,999 | 0 (0.0%) | 3 (3.1%) |
| $75,000 to $99,999 | 5 (7.5%) | 2 (2.0%) |
| $100,000+ | 5 (7.5%) | 31 (31.6%) |
| Total | 67 (100.0%) | 98 (100.0%) |
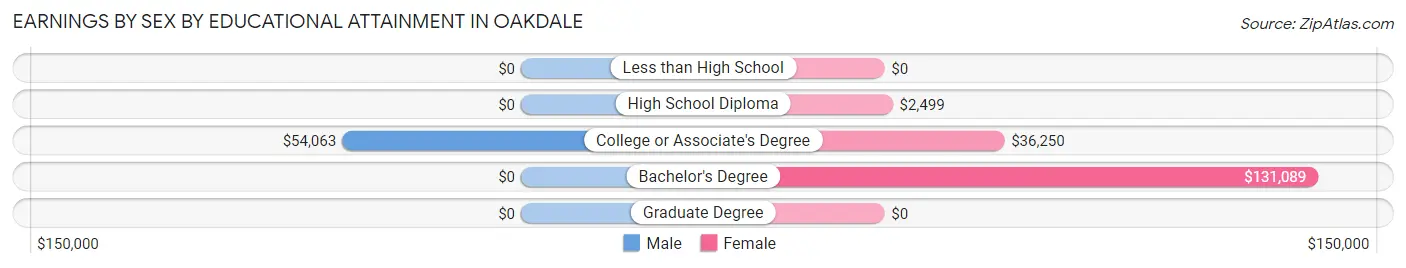
Earnings by Sex by Educational Attainment in Oakdale
| Educational Attainment | Male Income | Female Income |
| Less than High School | - | - |
| High School Diploma | - | - |
| College or Associate's Degree | $54,063 | $36,250 |
| Bachelor's Degree | - | - |
| Graduate Degree | - | - |
| Total | $41,250 | $0 |
Family Income in Oakdale
Family Income Brackets in Oakdale
According to the Oakdale family income data, there are 15 families falling into the $50,000 to $74,999 income range, which is the most common income bracket and makes up 26.8% of all families. Conversely, the less than $10,000 income bracket is the least frequent group with only 1 families (1.8%) belonging to this category.
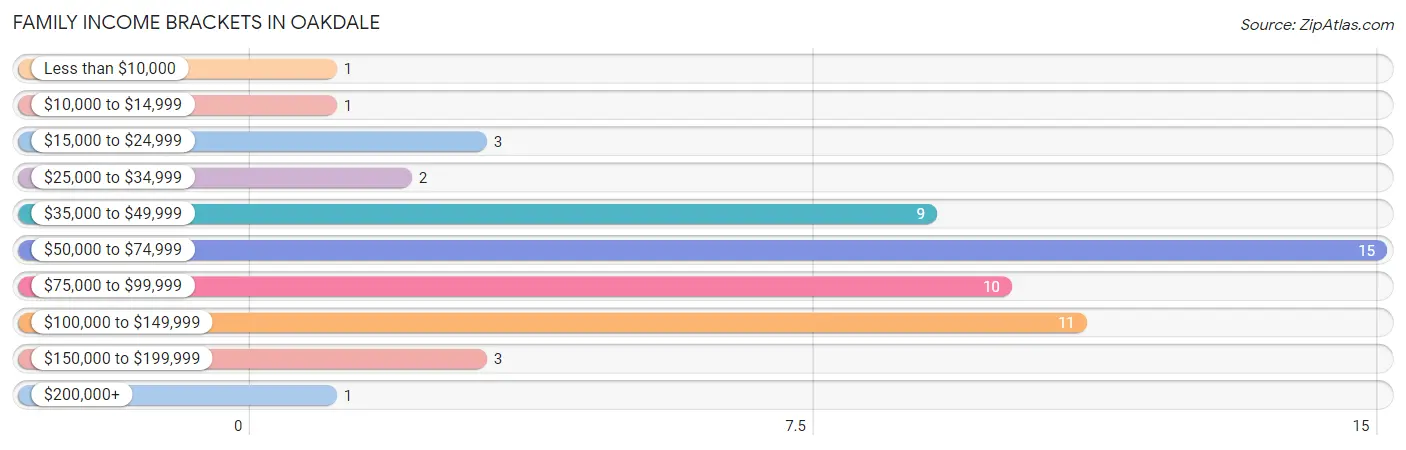
| Income Bracket | # Families | % Families |
| Less than $10,000 | 1 | 1.8% |
| $10,000 to $14,999 | 1 | 1.8% |
| $15,000 to $24,999 | 3 | 5.4% |
| $25,000 to $34,999 | 2 | 3.6% |
| $35,000 to $49,999 | 9 | 16.1% |
| $50,000 to $74,999 | 15 | 26.8% |
| $75,000 to $99,999 | 10 | 17.9% |
| $100,000 to $149,999 | 11 | 19.6% |
| $150,000 to $199,999 | 3 | 5.4% |
| $200,000+ | 1 | 1.8% |
Family Income by Famaliy Size in Oakdale
4-person families (4 | 7.1%) account for the highest median family income in Oakdale with $107,500 per family, while 2-person families (34 | 60.7%) have the highest median income of $38,750 per family member.
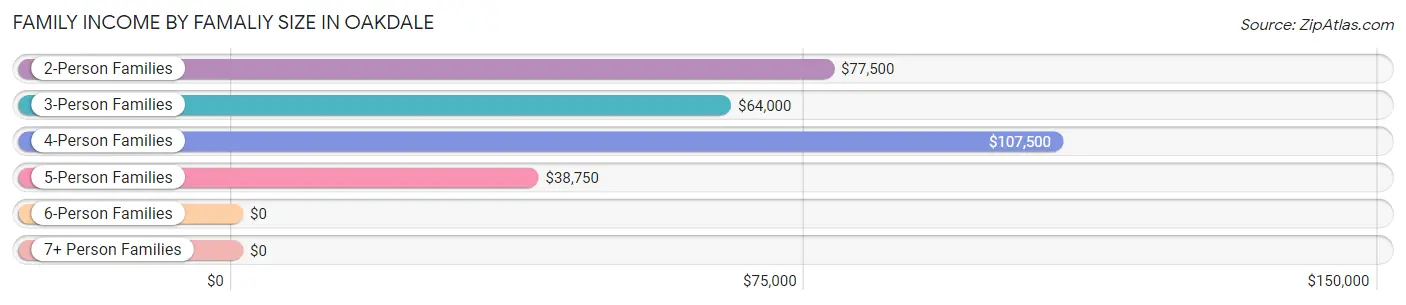
| Income Bracket | # Families | Median Income |
| 2-Person Families | 34 (60.7%) | $77,500 |
| 3-Person Families | 10 (17.9%) | $64,000 |
| 4-Person Families | 4 (7.1%) | $107,500 |
| 5-Person Families | 8 (14.3%) | $38,750 |
| 6-Person Families | 0 (0.0%) | $0 |
| 7+ Person Families | 0 (0.0%) | $0 |
| Total | 56 (100.0%) | $64,000 |
Family Income by Number of Earners in Oakdale
The median family income in Oakdale is $64,000, with families comprising 3+ earners (4) having the highest median family income of $96,250, while families with no earners (6) have the lowest median family income of $47,500, accounting for 7.1% and 10.7% of families, respectively.
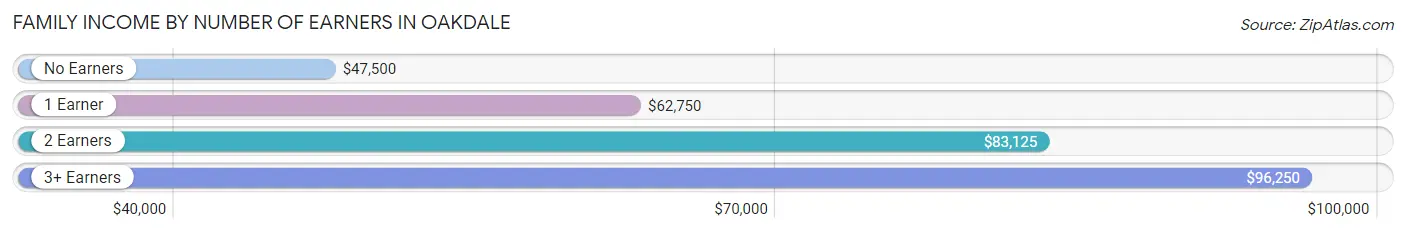
| Number of Earners | # Families | Median Income |
| No Earners | 6 (10.7%) | $47,500 |
| 1 Earner | 15 (26.8%) | $62,750 |
| 2 Earners | 31 (55.4%) | $83,125 |
| 3+ Earners | 4 (7.1%) | $96,250 |
| Total | 56 (100.0%) | $64,000 |
Household Income in Oakdale
Household Income Brackets in Oakdale
With 34 households falling in the category, the $150,000 to $199,999 income range is the most frequent in Oakdale, accounting for 26.4% of all households. In contrast, only 2 households (1.5%) fall into the $200,000+ income bracket, making it the least populous group.
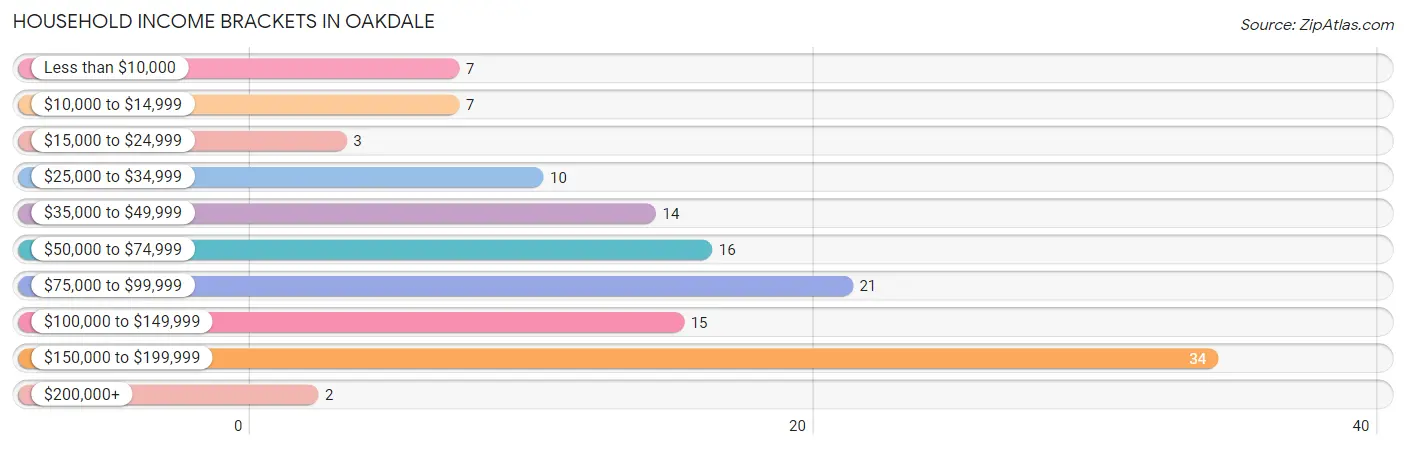
| Income Bracket | # Households | % Households |
| Less than $10,000 | 7 | 5.4% |
| $10,000 to $14,999 | 7 | 5.4% |
| $15,000 to $24,999 | 3 | 2.3% |
| $25,000 to $34,999 | 10 | 7.8% |
| $35,000 to $49,999 | 14 | 10.9% |
| $50,000 to $74,999 | 16 | 12.4% |
| $75,000 to $99,999 | 21 | 16.3% |
| $100,000 to $149,999 | 15 | 11.6% |
| $150,000 to $199,999 | 34 | 26.4% |
| $200,000+ | 2 | 1.6% |
Household Income by Householder Age in Oakdale
The median household income in Oakdale is $87,813, with the highest median household income of $152,944 found in the 65+ years age bracket for the primary householder. A total of 55 households (42.6%) fall into this category. Meanwhile, the 15 to 24 years age bracket for the primary householder has the lowest median household income of $0, with 4 households (3.1%) in this group.
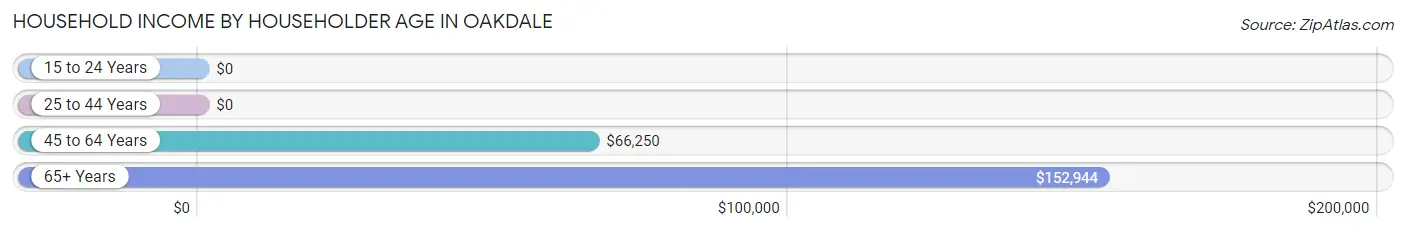
| Income Bracket | # Households | Median Income |
| 15 to 24 Years | 4 (3.1%) | $0 |
| 25 to 44 Years | 7 (5.4%) | $0 |
| 45 to 64 Years | 63 (48.8%) | $66,250 |
| 65+ Years | 55 (42.6%) | $152,944 |
| Total | 129 (100.0%) | $87,813 |
Poverty in Oakdale
Income Below Poverty by Sex and Age in Oakdale
With 13.7% poverty level for males and 7.0% for females among the residents of Oakdale, 6 to 11 year old males and 25 to 34 year old females are the most vulnerable to poverty, with 1 males (33.3%) and 2 females (50.0%) in their respective age groups living below the poverty level.
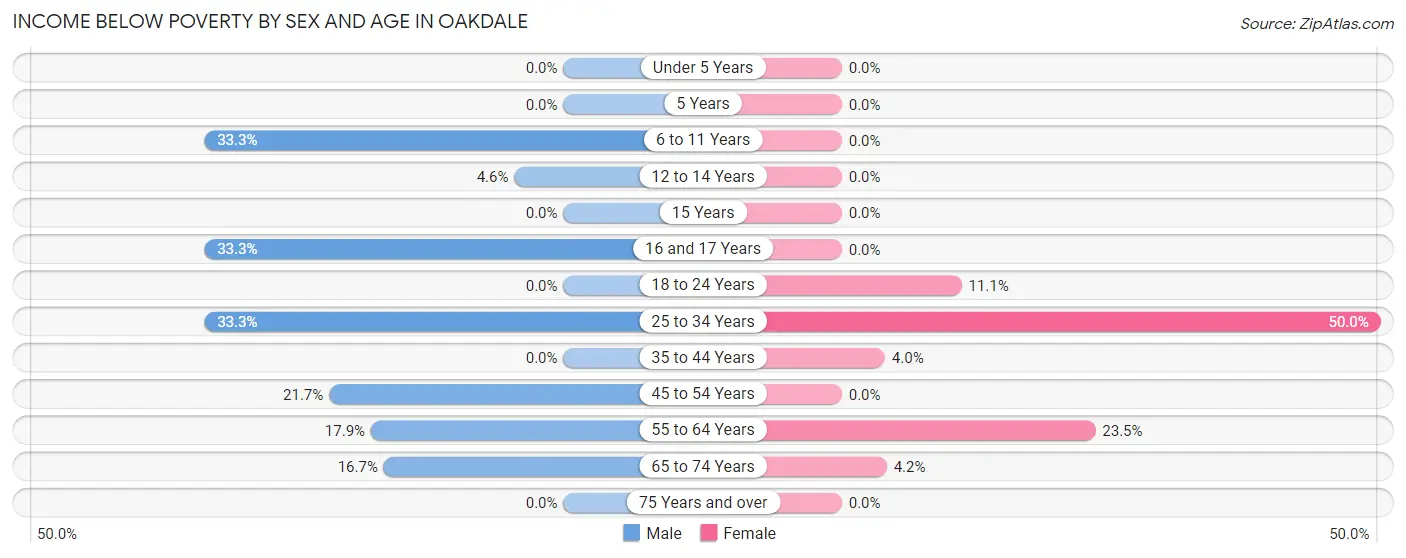
| Age Bracket | Male | Female |
| Under 5 Years | 0 (0.0%) | 0 (0.0%) |
| 5 Years | 0 (0.0%) | 0 (0.0%) |
| 6 to 11 Years | 1 (33.3%) | 0 (0.0%) |
| 12 to 14 Years | 1 (4.5%) | 0 (0.0%) |
| 15 Years | 0 (0.0%) | 0 (0.0%) |
| 16 and 17 Years | 1 (33.3%) | 0 (0.0%) |
| 18 to 24 Years | 0 (0.0%) | 1 (11.1%) |
| 25 to 34 Years | 2 (33.3%) | 2 (50.0%) |
| 35 to 44 Years | 0 (0.0%) | 1 (4.0%) |
| 45 to 54 Years | 5 (21.7%) | 0 (0.0%) |
| 55 to 64 Years | 5 (17.9%) | 4 (23.5%) |
| 65 to 74 Years | 1 (16.7%) | 2 (4.2%) |
| 75 Years and over | 0 (0.0%) | 0 (0.0%) |
| Total | 16 (13.7%) | 10 (7.0%) |
Income Above Poverty by Sex and Age in Oakdale
According to the poverty statistics in Oakdale, males aged 18 to 24 years and females aged under 5 years are the age groups that are most secure financially, with 100.0% of males and 100.0% of females in these age groups living above the poverty line.
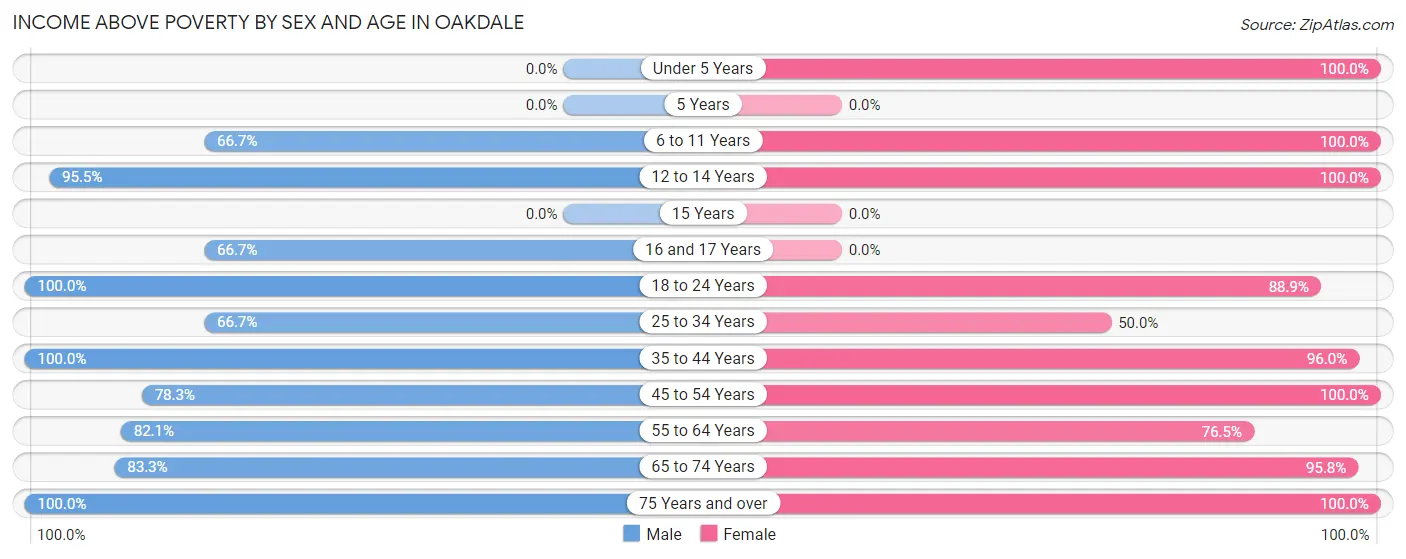
| Age Bracket | Male | Female |
| Under 5 Years | 0 (0.0%) | 2 (100.0%) |
| 5 Years | 0 (0.0%) | 0 (0.0%) |
| 6 to 11 Years | 2 (66.7%) | 8 (100.0%) |
| 12 to 14 Years | 21 (95.5%) | 1 (100.0%) |
| 15 Years | 0 (0.0%) | 0 (0.0%) |
| 16 and 17 Years | 2 (66.7%) | 0 (0.0%) |
| 18 to 24 Years | 13 (100.0%) | 8 (88.9%) |
| 25 to 34 Years | 4 (66.7%) | 2 (50.0%) |
| 35 to 44 Years | 9 (100.0%) | 24 (96.0%) |
| 45 to 54 Years | 18 (78.3%) | 19 (100.0%) |
| 55 to 64 Years | 23 (82.1%) | 13 (76.5%) |
| 65 to 74 Years | 5 (83.3%) | 46 (95.8%) |
| 75 Years and over | 4 (100.0%) | 9 (100.0%) |
| Total | 101 (86.3%) | 132 (93.0%) |
Income Below Poverty Among Married-Couple Families in Oakdale
The poverty statistics for married-couple families in Oakdale show that 9.3% or 4 of the total 43 families live below the poverty line. Families with 3 or 4 children have the highest poverty rate of 100.0%, comprising of 1 families. On the other hand, families with 1 or 2 children have the lowest poverty rate of 0.0%, which includes 0 families.
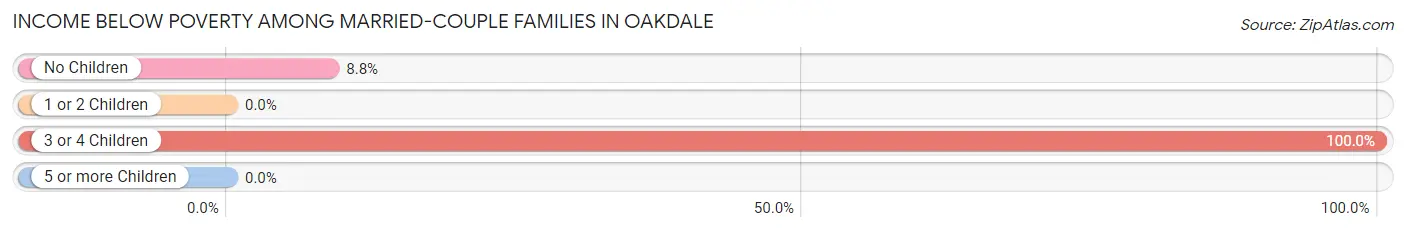
| Children | Above Poverty | Below Poverty |
| No Children | 31 (91.2%) | 3 (8.8%) |
| 1 or 2 Children | 8 (100.0%) | 0 (0.0%) |
| 3 or 4 Children | 0 (0.0%) | 1 (100.0%) |
| 5 or more Children | 0 (0.0%) | 0 (0.0%) |
| Total | 39 (90.7%) | 4 (9.3%) |
Income Below Poverty Among Single-Parent Households in Oakdale
| Children | Single Father | Single Mother |
| No Children | 0 (0.0%) | 0 (0.0%) |
| 1 or 2 Children | 0 (0.0%) | 0 (0.0%) |
| 3 or 4 Children | 0 (0.0%) | 0 (0.0%) |
| 5 or more Children | 0 (0.0%) | 0 (0.0%) |
| Total | 0 (0.0%) | 0 (0.0%) |
Income Below Poverty Among Married-Couple vs Single-Parent Households in Oakdale
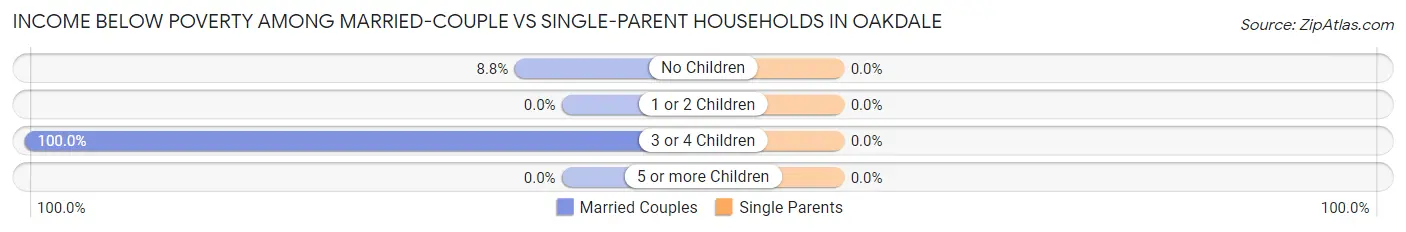
| Children | Married-Couple Families | Single-Parent Households |
| No Children | 3 (8.8%) | 0 (0.0%) |
| 1 or 2 Children | 0 (0.0%) | 0 (0.0%) |
| 3 or 4 Children | 1 (100.0%) | 0 (0.0%) |
| 5 or more Children | 0 (0.0%) | 0 (0.0%) |
| Total | 4 (9.3%) | 0 (0.0%) |
Race in Oakdale
The most populous races in Oakdale are White / Caucasian (221 | 85.3%), Asian (30 | 11.6%), and Hispanic or Latino (7 | 2.7%).
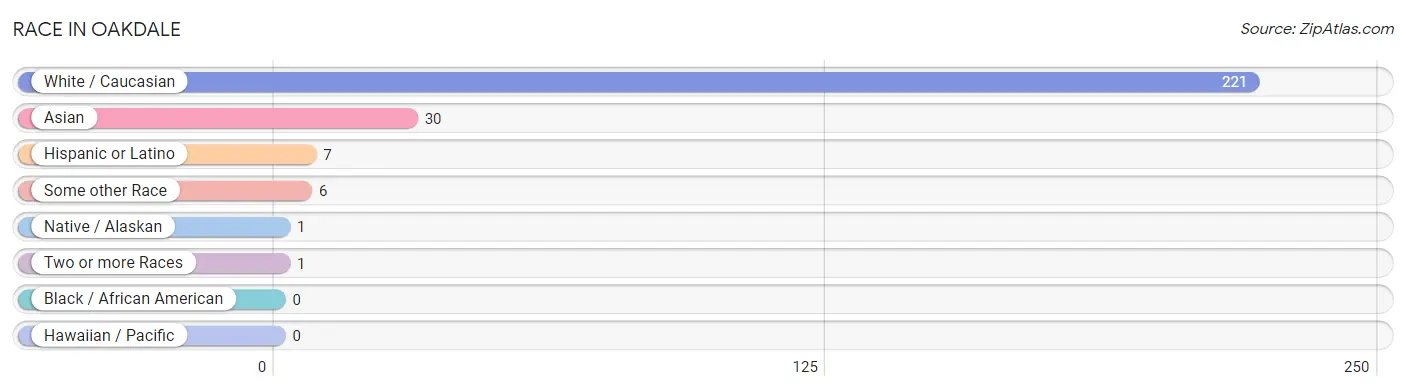
| Race | # Population | % Population |
| Asian | 30 | 11.6% |
| Black / African American | 0 | 0.0% |
| Hawaiian / Pacific | 0 | 0.0% |
| Hispanic or Latino | 7 | 2.7% |
| Native / Alaskan | 1 | 0.4% |
| White / Caucasian | 221 | 85.3% |
| Two or more Races | 1 | 0.4% |
| Some other Race | 6 | 2.3% |
| Total | 259 | 100.0% |
Ancestry in Oakdale
The most populous ancestries reported in Oakdale are German (123 | 47.5%), Norwegian (52 | 20.1%), Irish (46 | 17.8%), Korean (30 | 11.6%), and American (12 | 4.6%), together accounting for 101.5% of all Oakdale residents.
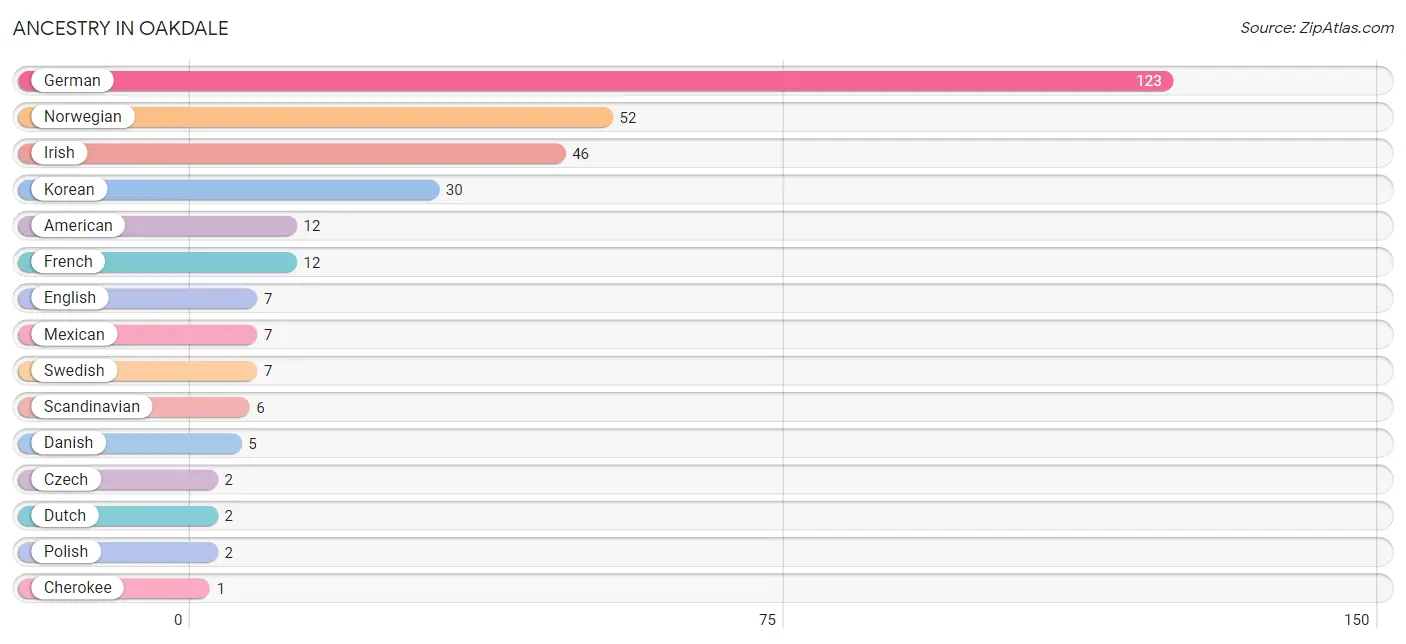
| Ancestry | # Population | % Population |
| American | 12 | 4.6% |
| Cherokee | 1 | 0.4% |
| Czech | 2 | 0.8% |
| Danish | 5 | 1.9% |
| Dutch | 2 | 0.8% |
| English | 7 | 2.7% |
| French | 12 | 4.6% |
| French Canadian | 1 | 0.4% |
| German | 123 | 47.5% |
| Hungarian | 1 | 0.4% |
| Irish | 46 | 17.8% |
| Italian | 1 | 0.4% |
| Korean | 30 | 11.6% |
| Mexican | 7 | 2.7% |
| Norwegian | 52 | 20.1% |
| Polish | 2 | 0.8% |
| Scandinavian | 6 | 2.3% |
| Swedish | 7 | 2.7% | View All 18 Rows |
Immigrants in Oakdale
The most numerous immigrant groups reported in Oakdale came from Asia (30 | 11.6%), Philippines (30 | 11.6%), and South Eastern Asia (30 | 11.6%), together accounting for 34.7% of all Oakdale residents.
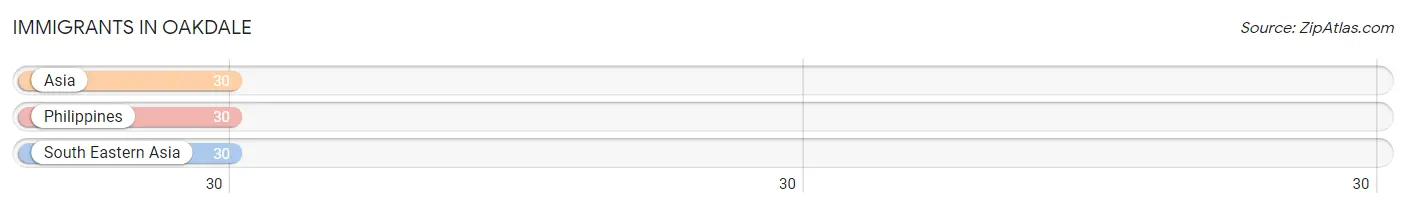
| Immigration Origin | # Population | % Population |
| Asia | 30 | 11.6% |
| Philippines | 30 | 11.6% |
| South Eastern Asia | 30 | 11.6% | View All 3 Rows |
Sex and Age in Oakdale
Sex and Age in Oakdale
The most populous age groups in Oakdale are 10 to 14 Years (22 | 18.8%) for men and 65 to 69 Years (41 | 28.9%) for women.

| Age Bracket | Male | Female |
| Under 5 Years | 0 (0.0%) | 2 (1.4%) |
| 5 to 9 Years | 3 (2.6%) | 2 (1.4%) |
| 10 to 14 Years | 22 (18.8%) | 7 (4.9%) |
| 15 to 19 Years | 6 (5.1%) | 2 (1.4%) |
| 20 to 24 Years | 10 (8.6%) | 7 (4.9%) |
| 25 to 29 Years | 4 (3.4%) | 2 (1.4%) |
| 30 to 34 Years | 2 (1.7%) | 2 (1.4%) |
| 35 to 39 Years | 1 (0.9%) | 2 (1.4%) |
| 40 to 44 Years | 8 (6.8%) | 23 (16.2%) |
| 45 to 49 Years | 12 (10.3%) | 13 (9.1%) |
| 50 to 54 Years | 11 (9.4%) | 6 (4.2%) |
| 55 to 59 Years | 19 (16.2%) | 11 (7.7%) |
| 60 to 64 Years | 9 (7.7%) | 6 (4.2%) |
| 65 to 69 Years | 2 (1.7%) | 41 (28.9%) |
| 70 to 74 Years | 4 (3.4%) | 7 (4.9%) |
| 75 to 79 Years | 2 (1.7%) | 6 (4.2%) |
| 80 to 84 Years | 0 (0.0%) | 2 (1.4%) |
| 85 Years and over | 2 (1.7%) | 1 (0.7%) |
| Total | 117 (100.0%) | 142 (100.0%) |
Families and Households in Oakdale
Median Family Size in Oakdale
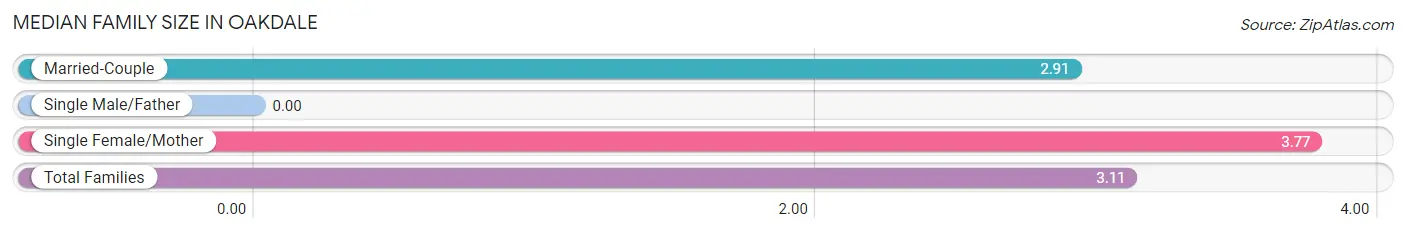
| Family Type | # Families | Family Size |
| Married-Couple | 43 (76.8%) | 2.91 |
| Single Male/Father | 0 (0.0%) | - |
| Single Female/Mother | 13 (23.2%) | 3.77 |
| Total Families | 56 (100.0%) | 3.11 |
Median Household Size in Oakdale
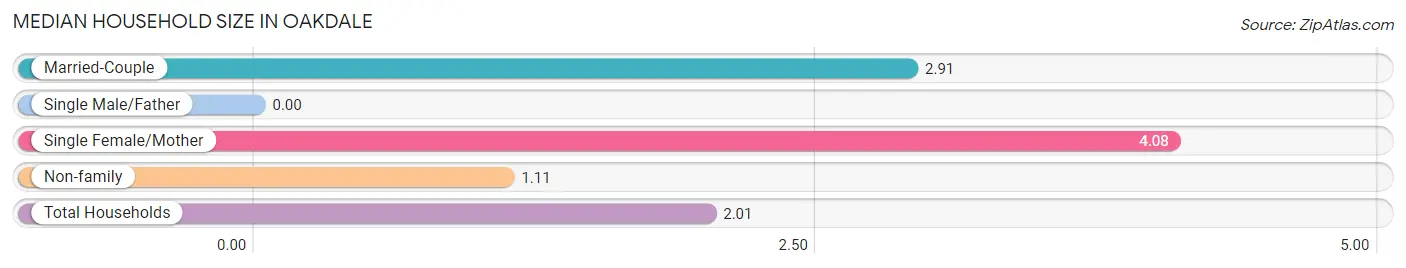
| Household Type | # Households | Household Size |
| Married-Couple | 43 (33.3%) | 2.91 |
| Single Male/Father | 0 (0.0%) | - |
| Single Female/Mother | 13 (10.1%) | 4.08 |
| Non-family | 73 (56.6%) | 1.11 |
| Total Households | 129 (100.0%) | 2.01 |
Household Size by Marriage Status in Oakdale
Out of a total of 129 households in Oakdale, 56 (43.4%) are family households, while 73 (56.6%) are nonfamily households. The most numerous type of family households are 2-person households, comprising 30, and the most common type of nonfamily households are 1-person households, comprising 67.
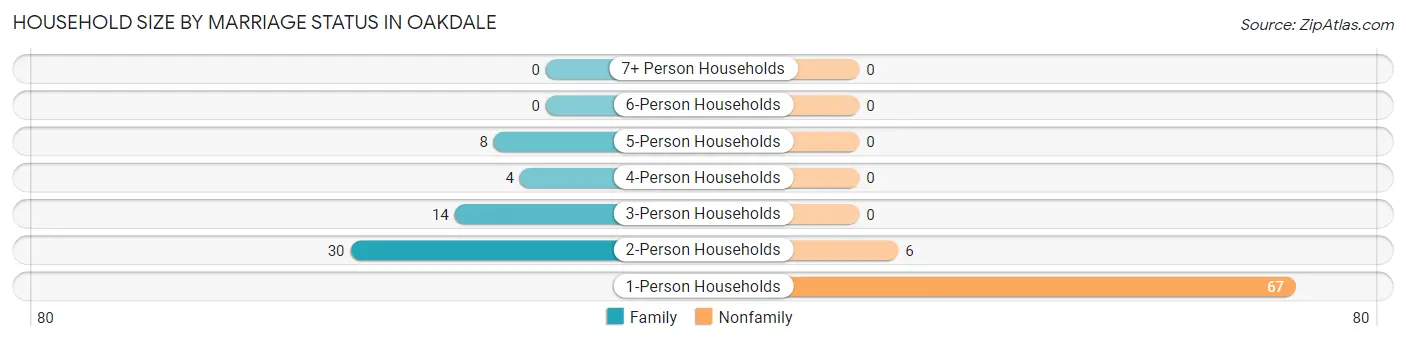
| Household Size | Family Households | Nonfamily Households |
| 1-Person Households | - | 67 (51.9%) |
| 2-Person Households | 30 (23.3%) | 6 (4.6%) |
| 3-Person Households | 14 (10.8%) | 0 (0.0%) |
| 4-Person Households | 4 (3.1%) | 0 (0.0%) |
| 5-Person Households | 8 (6.2%) | 0 (0.0%) |
| 6-Person Households | 0 (0.0%) | 0 (0.0%) |
| 7+ Person Households | 0 (0.0%) | 0 (0.0%) |
| Total | 56 (43.4%) | 73 (56.6%) |
Female Fertility in Oakdale
Fertility by Age in Oakdale
| Age Bracket | Women with Births | Births / 1,000 Women |
| 15 to 19 years | 0 (0.0%) | 0.0 |
| 20 to 34 years | 0 (0.0%) | 0.0 |
| 35 to 50 years | 0 (0.0%) | 0.0 |
| Total | 0 (0.0%) | 0.0 |
Fertility by Age by Marriage Status in Oakdale
| Age Bracket | Married | Unmarried |
| 15 to 19 years | 0 (0.0%) | 0 (0.0%) |
| 20 to 34 years | 0 (0.0%) | 0 (0.0%) |
| 35 to 50 years | 0 (0.0%) | 0 (0.0%) |
| Total | 0 (0.0%) | 0 (0.0%) |
Fertility by Education in Oakdale
| Educational Attainment | Women with Births | Births / 1,000 Women |
| Less than High School | 0 (0.0%) | 0.0 |
| High School Diploma | 0 (0.0%) | 0.0 |
| College or Associate's Degree | 0 (0.0%) | 0.0 |
| Bachelor's Degree | 0 (0.0%) | 0.0 |
| Graduate Degree | 0 (0.0%) | 0.0 |
| Total | 0 (0.0%) | 0.0 |
Fertility by Education by Marriage Status in Oakdale
| Educational Attainment | Married | Unmarried |
| Less than High School | 0 (0.0%) | 0 (0.0%) |
| High School Diploma | 0 (0.0%) | 0 (0.0%) |
| College or Associate's Degree | 0 (0.0%) | 0 (0.0%) |
| Bachelor's Degree | 0 (0.0%) | 0 (0.0%) |
| Graduate Degree | 0 (0.0%) | 0 (0.0%) |
| Total | 0 (0.0%) | 0 (0.0%) |
Employment Characteristics in Oakdale
Employment by Class of Employer in Oakdale
Among the 149 employed individuals in Oakdale, private company employees (102 | 68.5%), self-employed (incorporated) (16 | 10.7%), and federal government employees (11 | 7.4%) make up the most common classes of employment.
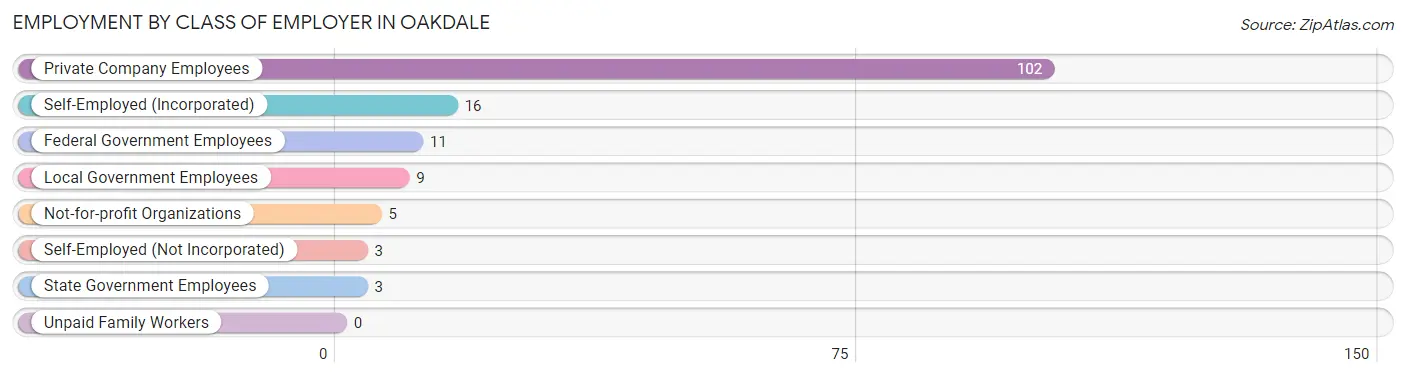
| Employer Class | # Employees | % Employees |
| Private Company Employees | 102 | 68.5% |
| Self-Employed (Incorporated) | 16 | 10.7% |
| Self-Employed (Not Incorporated) | 3 | 2.0% |
| Not-for-profit Organizations | 5 | 3.4% |
| Local Government Employees | 9 | 6.0% |
| State Government Employees | 3 | 2.0% |
| Federal Government Employees | 11 | 7.4% |
| Unpaid Family Workers | 0 | 0.0% |
| Total | 149 | 100.0% |
Employment Status by Age in Oakdale
According to the labor force statistics for Oakdale, out of the total population over 16 years of age (223), 71.3% or 159 individuals are in the labor force, with 1.3% or 2 of them unemployed. The age group with the highest labor force participation rate is 20 to 24 years, with 94.1% or 16 individuals in the labor force. Within the labor force, the 25 to 29 years age range has the highest percentage of unemployed individuals, with 40.0% or 2 of them being unemployed.
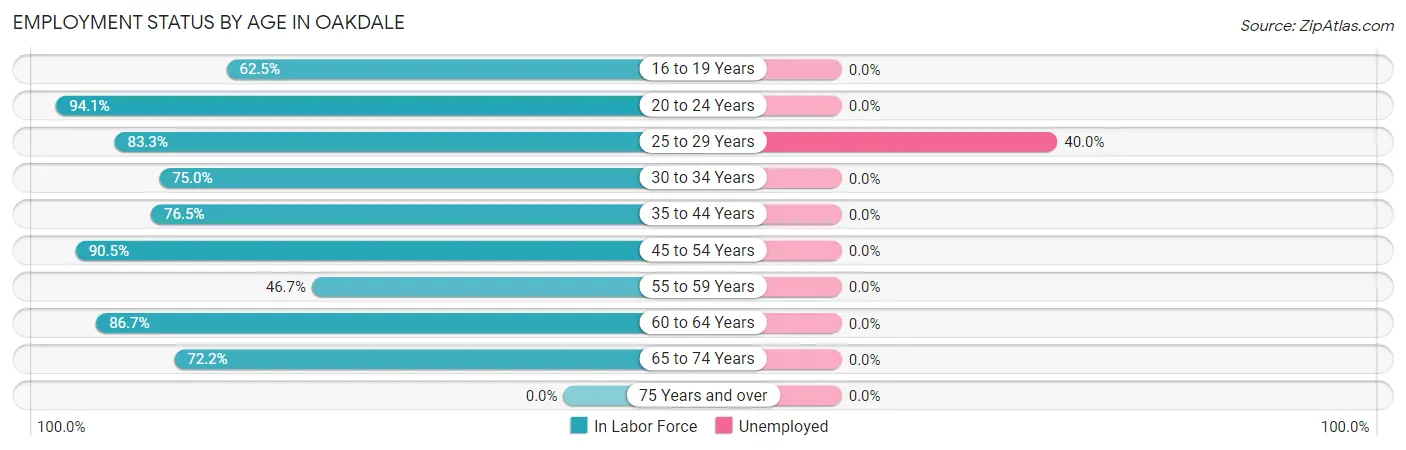
| Age Bracket | In Labor Force | Unemployed |
| 16 to 19 Years | 5 (62.5%) | 0 (0.0%) |
| 20 to 24 Years | 16 (94.1%) | 0 (0.0%) |
| 25 to 29 Years | 5 (83.3%) | 2 (40.0%) |
| 30 to 34 Years | 3 (75.0%) | 0 (0.0%) |
| 35 to 44 Years | 26 (76.5%) | 0 (0.0%) |
| 45 to 54 Years | 38 (90.5%) | 0 (0.0%) |
| 55 to 59 Years | 14 (46.7%) | 0 (0.0%) |
| 60 to 64 Years | 13 (86.7%) | 0 (0.0%) |
| 65 to 74 Years | 39 (72.2%) | 0 (0.0%) |
| 75 Years and over | 0 (0.0%) | 0 (0.0%) |
| Total | 159 (71.3%) | 2 (1.3%) |
Employment Status by Educational Attainment in Oakdale
According to labor force statistics for Oakdale, 75.6% of individuals (99) out of the total population between 25 and 64 years of age (131) are in the labor force, with 2.0% or 2 of them being unemployed. The group with the highest labor force participation rate are those with the educational attainment of college / associate degree, with 90.2% or 46 individuals in the labor force. Within the labor force, individuals with college / associate degree education have the highest percentage of unemployment, with 4.4% or 2 of them being unemployed.
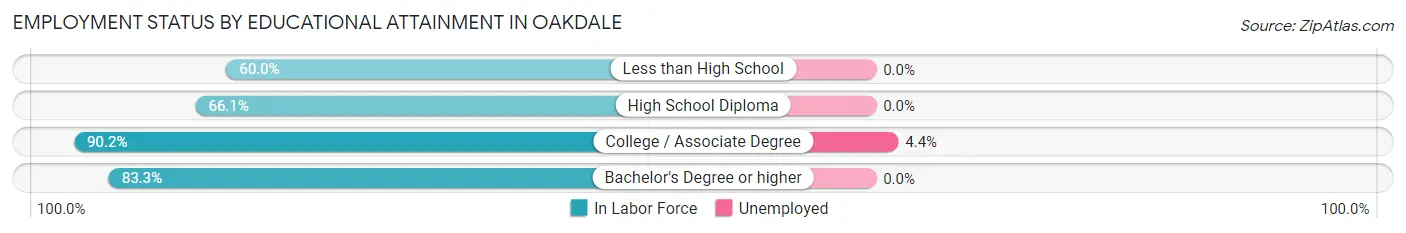
| Educational Attainment | In Labor Force | Unemployed |
| Less than High School | 9 (60.0%) | 0 (0.0%) |
| High School Diploma | 39 (66.1%) | 0 (0.0%) |
| College / Associate Degree | 46 (90.2%) | 2 (4.4%) |
| Bachelor's Degree or higher | 5 (83.3%) | 0 (0.0%) |
| Total | 99 (75.6%) | 3 (2.0%) |
Employment Occupations by Sex in Oakdale
Management, Business, Science and Arts Occupations
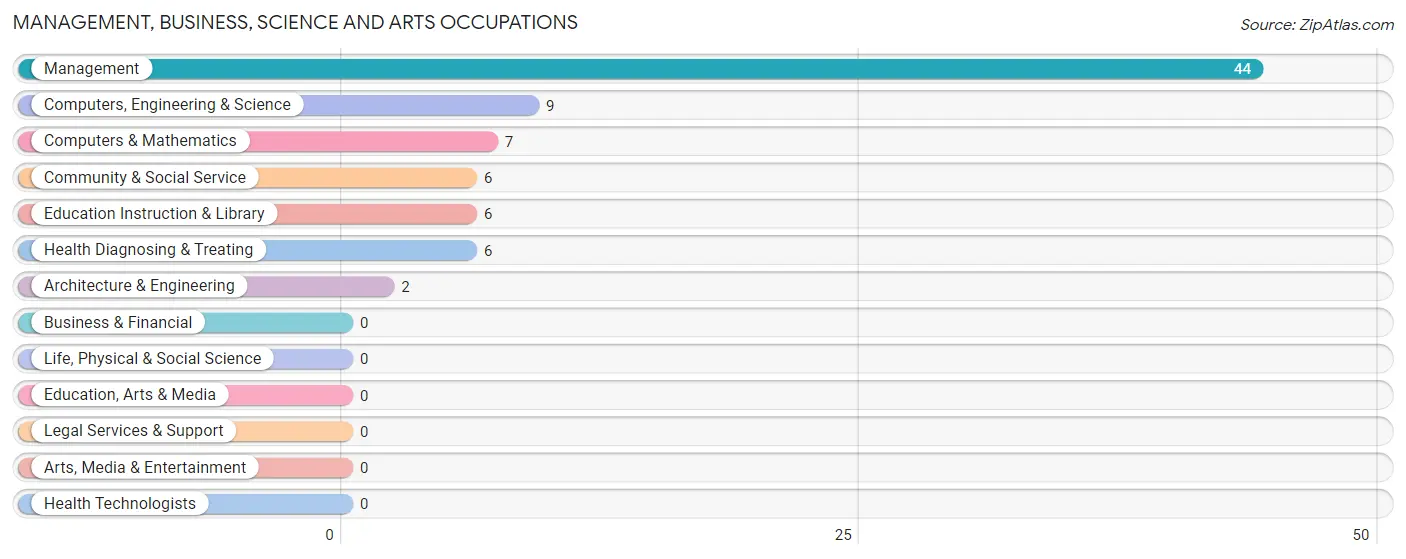
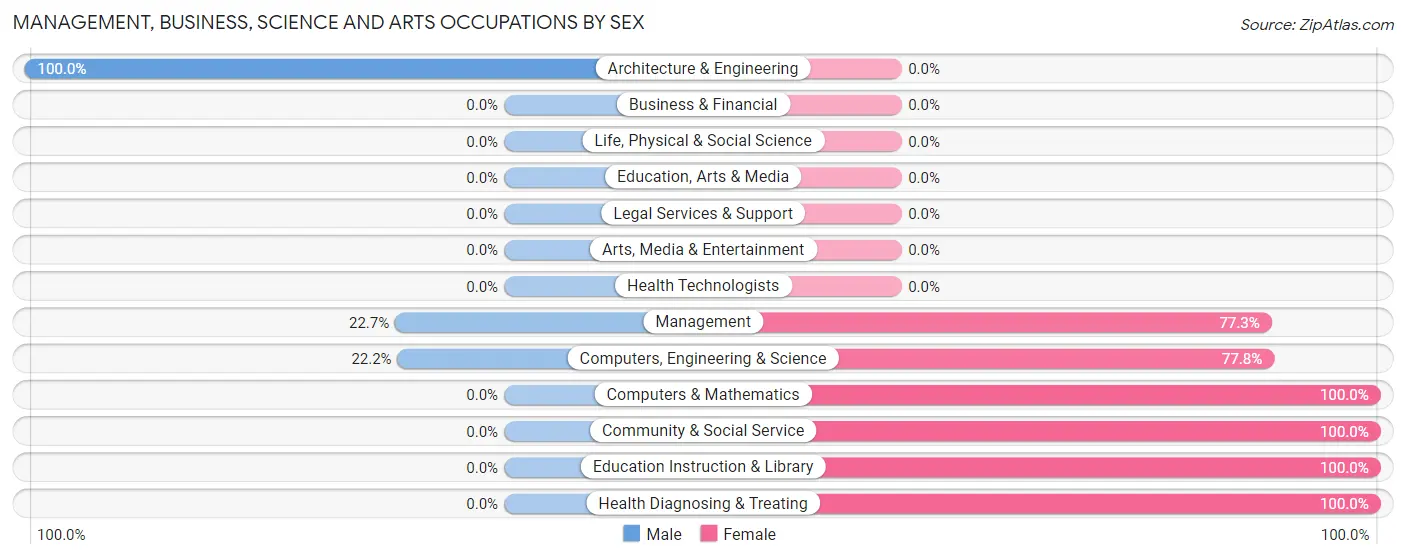
The most common Management, Business, Science and Arts occupations in Oakdale are Management (44 | 28.2%), Computers, Engineering & Science (9 | 5.8%), Computers & Mathematics (7 | 4.5%), Community & Social Service (6 | 3.8%), and Education Instruction & Library (6 | 3.8%).
Management, Business, Science and Arts Occupations by Sex
Within the Management, Business, Science and Arts occupations in Oakdale, the most male-oriented occupations are Architecture & Engineering (100.0%), Management (22.7%), and Computers, Engineering & Science (22.2%), while the most female-oriented occupations are Computers & Mathematics (100.0%), Community & Social Service (100.0%), and Education Instruction & Library (100.0%).
| Occupation | Male | Female |
| Management | 10 (22.7%) | 34 (77.3%) |
| Business & Financial | 0 (0.0%) | 0 (0.0%) |
| Computers, Engineering & Science | 2 (22.2%) | 7 (77.8%) |
| Computers & Mathematics | 0 (0.0%) | 7 (100.0%) |
| Architecture & Engineering | 2 (100.0%) | 0 (0.0%) |
| Life, Physical & Social Science | 0 (0.0%) | 0 (0.0%) |
| Community & Social Service | 0 (0.0%) | 6 (100.0%) |
| Education, Arts & Media | 0 (0.0%) | 0 (0.0%) |
| Legal Services & Support | 0 (0.0%) | 0 (0.0%) |
| Education Instruction & Library | 0 (0.0%) | 6 (100.0%) |
| Arts, Media & Entertainment | 0 (0.0%) | 0 (0.0%) |
| Health Diagnosing & Treating | 0 (0.0%) | 6 (100.0%) |
| Health Technologists | 0 (0.0%) | 0 (0.0%) |
| Total (Category) | 12 (18.5%) | 53 (81.5%) |
| Total (Overall) | 63 (40.4%) | 93 (59.6%) |
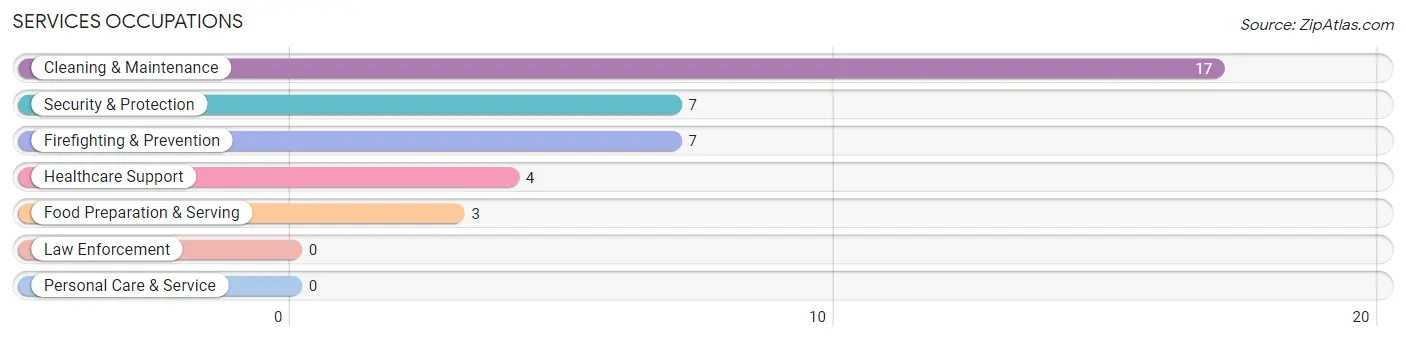
Services Occupations
The most common Services occupations in Oakdale are Cleaning & Maintenance (17 | 10.9%), Security & Protection (7 | 4.5%), Firefighting & Prevention (7 | 4.5%), Healthcare Support (4 | 2.6%), and Food Preparation & Serving (3 | 1.9%).
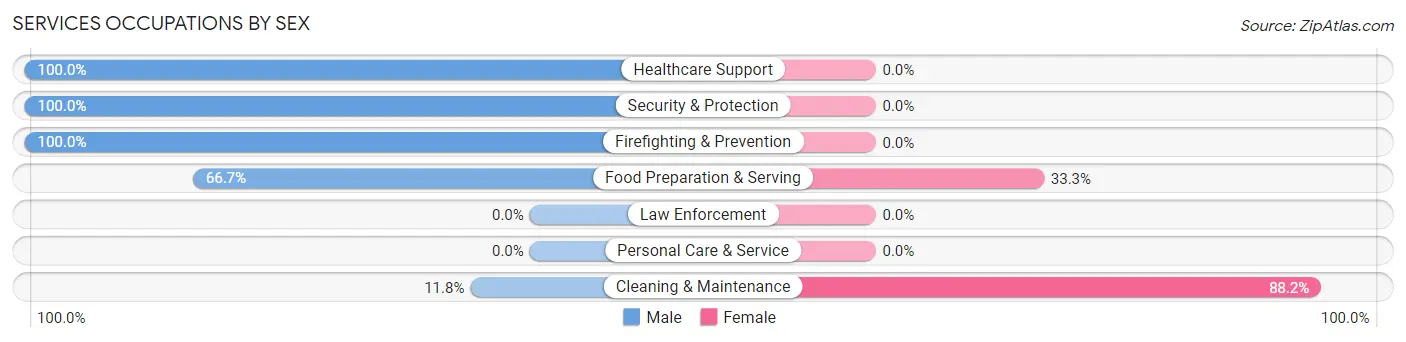
Services Occupations by Sex
Within the Services occupations in Oakdale, the most male-oriented occupations are Healthcare Support (100.0%), Security & Protection (100.0%), and Firefighting & Prevention (100.0%), while the most female-oriented occupations are Cleaning & Maintenance (88.2%), and Food Preparation & Serving (33.3%).
| Occupation | Male | Female |
| Healthcare Support | 4 (100.0%) | 0 (0.0%) |
| Security & Protection | 7 (100.0%) | 0 (0.0%) |
| Firefighting & Prevention | 7 (100.0%) | 0 (0.0%) |
| Law Enforcement | 0 (0.0%) | 0 (0.0%) |
| Food Preparation & Serving | 2 (66.7%) | 1 (33.3%) |
| Cleaning & Maintenance | 2 (11.8%) | 15 (88.2%) |
| Personal Care & Service | 0 (0.0%) | 0 (0.0%) |
| Total (Category) | 15 (48.4%) | 16 (51.6%) |
| Total (Overall) | 63 (40.4%) | 93 (59.6%) |
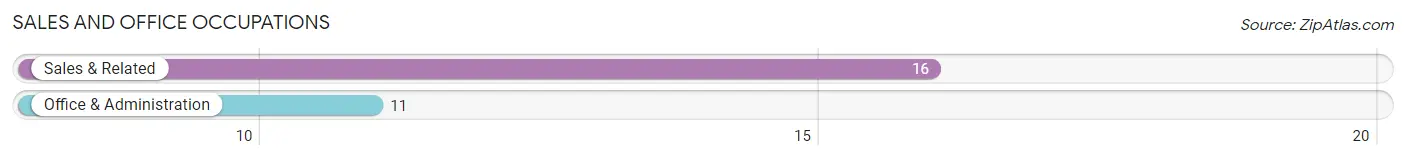
Sales and Office Occupations
The most common Sales and Office occupations in Oakdale are Sales & Related (16 | 10.3%), and Office & Administration (11 | 7.0%).
Sales and Office Occupations by Sex

| Occupation | Male | Female |
| Sales & Related | 9 (56.2%) | 7 (43.8%) |
| Office & Administration | 1 (9.1%) | 10 (90.9%) |
| Total (Category) | 10 (37.0%) | 17 (63.0%) |
| Total (Overall) | 63 (40.4%) | 93 (59.6%) |
Natural Resources, Construction and Maintenance Occupations
The most common Natural Resources, Construction and Maintenance occupations in Oakdale are Farming, Fishing & Forestry (4 | 2.6%), Installation, Maintenance & Repair (4 | 2.6%), and Construction & Extraction (3 | 1.9%).
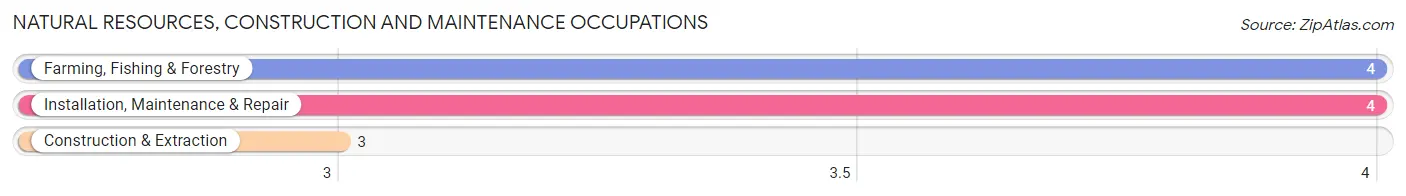
Natural Resources, Construction and Maintenance Occupations by Sex
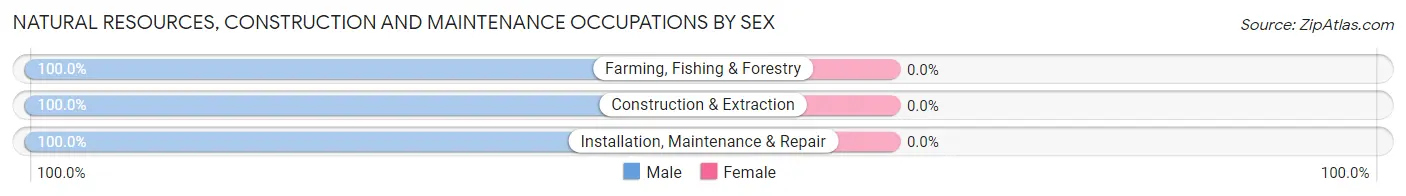
| Occupation | Male | Female |
| Farming, Fishing & Forestry | 4 (100.0%) | 0 (0.0%) |
| Construction & Extraction | 3 (100.0%) | 0 (0.0%) |
| Installation, Maintenance & Repair | 4 (100.0%) | 0 (0.0%) |
| Total (Category) | 11 (100.0%) | 0 (0.0%) |
| Total (Overall) | 63 (40.4%) | 93 (59.6%) |
Production, Transportation and Moving Occupations
The most common Production, Transportation and Moving occupations in Oakdale are Production (16 | 10.3%), Transportation (4 | 2.6%), and Material Moving (2 | 1.3%).
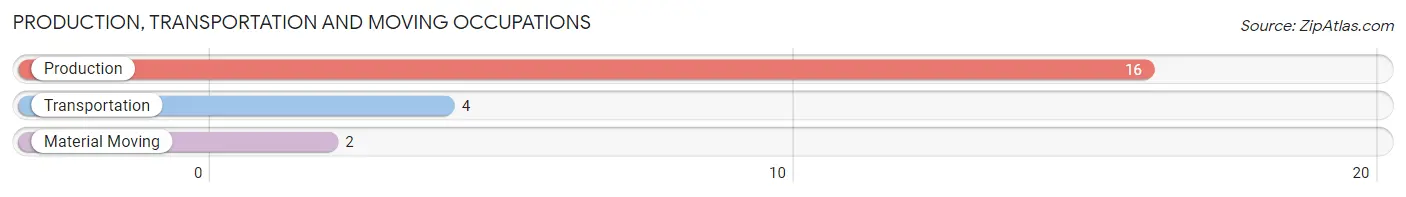
Production, Transportation and Moving Occupations by Sex
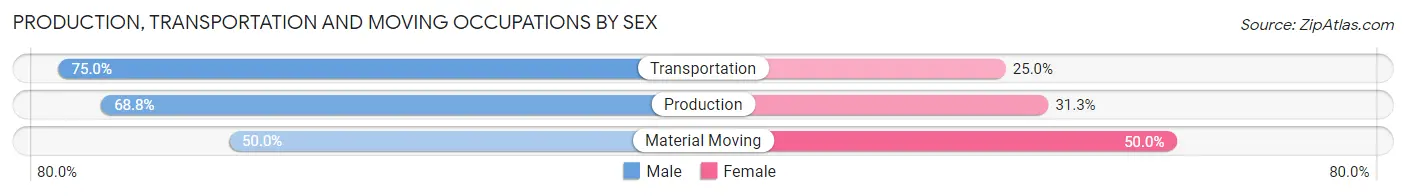
| Occupation | Male | Female |
| Production | 11 (68.8%) | 5 (31.2%) |
| Transportation | 3 (75.0%) | 1 (25.0%) |
| Material Moving | 1 (50.0%) | 1 (50.0%) |
| Total (Category) | 15 (68.2%) | 7 (31.8%) |
| Total (Overall) | 63 (40.4%) | 93 (59.6%) |
Employment Industries by Sex in Oakdale
Employment Industries in Oakdale
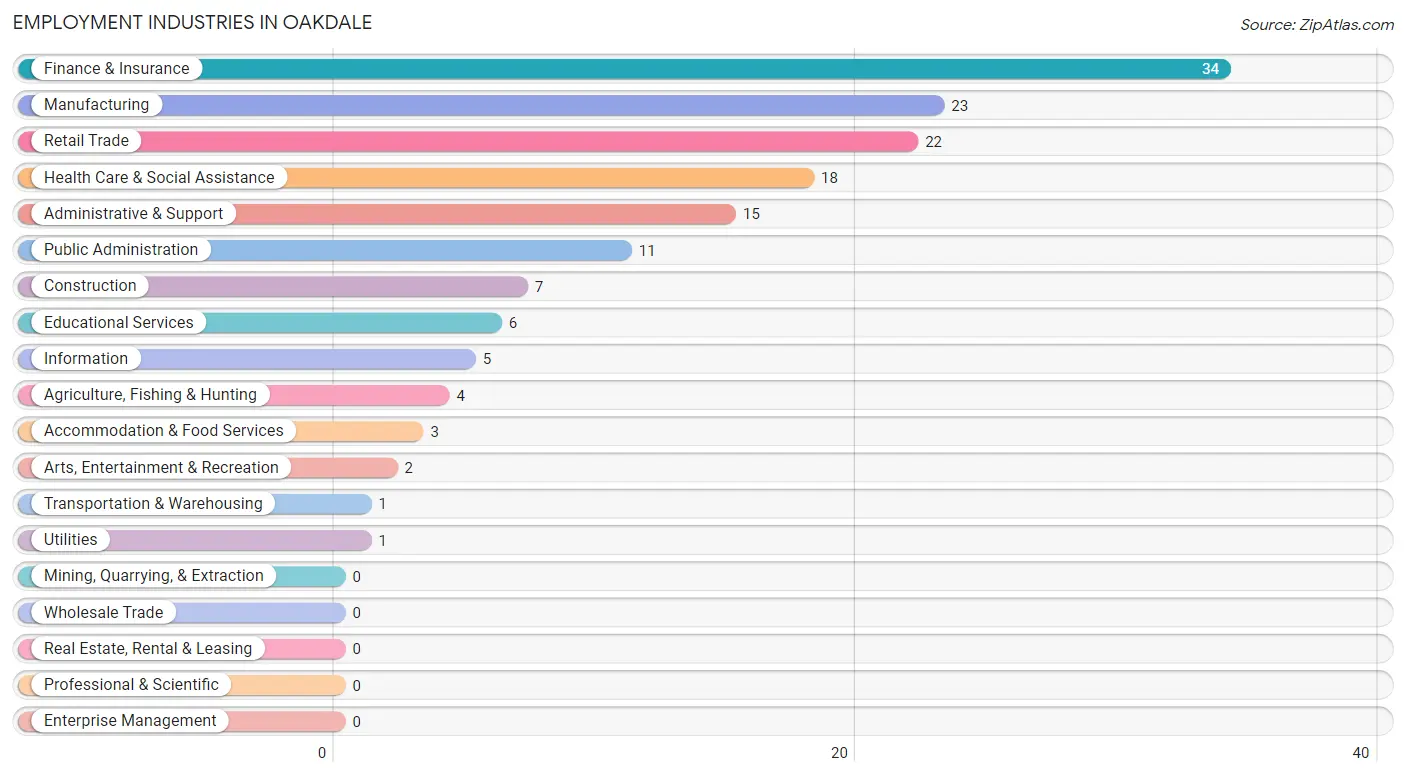
The major employment industries in Oakdale include Finance & Insurance (34 | 21.8%), Manufacturing (23 | 14.7%), Retail Trade (22 | 14.1%), Health Care & Social Assistance (18 | 11.5%), and Administrative & Support (15 | 9.6%).
Employment Industries by Sex in Oakdale
The Oakdale industries that see more men than women are Agriculture, Fishing & Hunting (100.0%), Transportation & Warehousing (100.0%), and Utilities (100.0%), whereas the industries that tend to have a higher number of women are Information (100.0%), Finance & Insurance (100.0%), and Administrative & Support (100.0%).
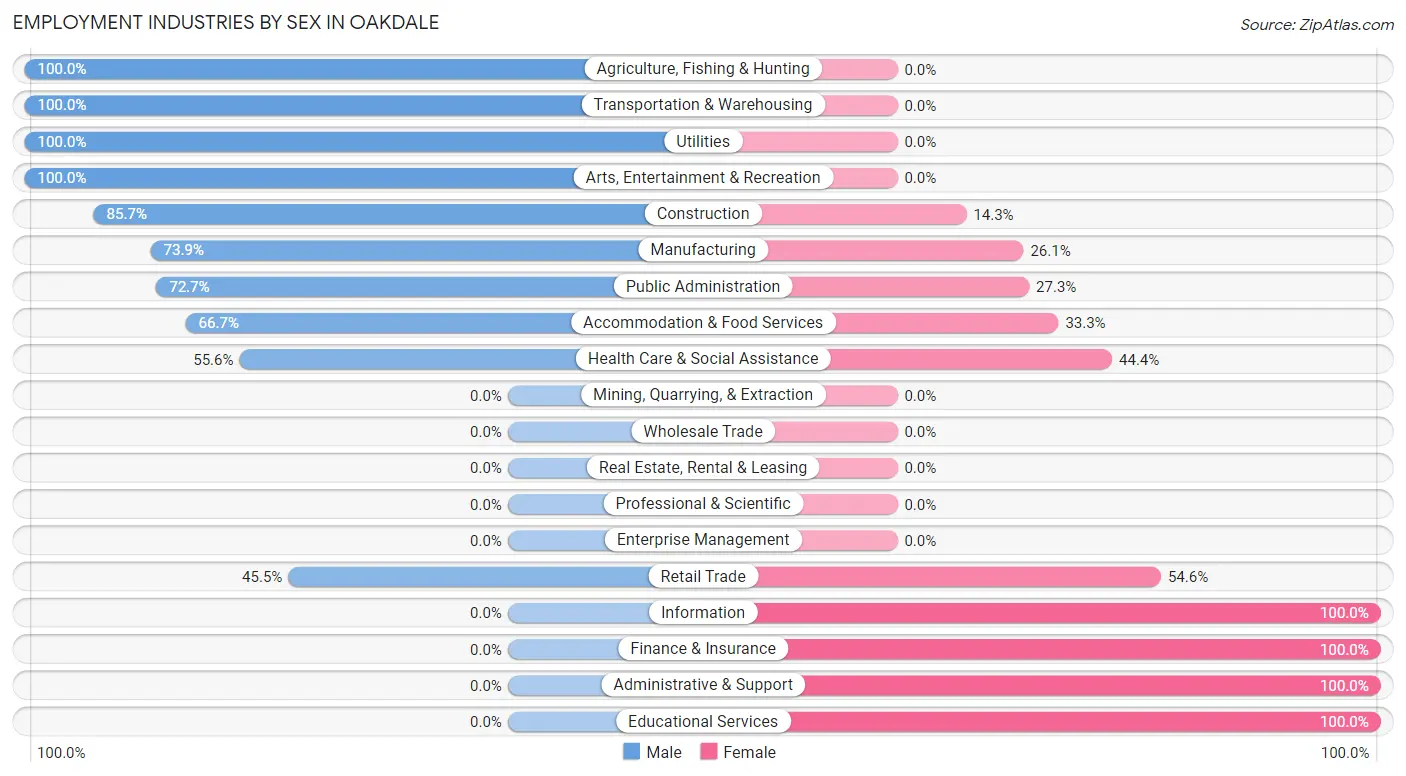
| Industry | Male | Female |
| Agriculture, Fishing & Hunting | 4 (100.0%) | 0 (0.0%) |
| Mining, Quarrying, & Extraction | 0 (0.0%) | 0 (0.0%) |
| Construction | 6 (85.7%) | 1 (14.3%) |
| Manufacturing | 17 (73.9%) | 6 (26.1%) |
| Wholesale Trade | 0 (0.0%) | 0 (0.0%) |
| Retail Trade | 10 (45.5%) | 12 (54.5%) |
| Transportation & Warehousing | 1 (100.0%) | 0 (0.0%) |
| Utilities | 1 (100.0%) | 0 (0.0%) |
| Information | 0 (0.0%) | 5 (100.0%) |
| Finance & Insurance | 0 (0.0%) | 34 (100.0%) |
| Real Estate, Rental & Leasing | 0 (0.0%) | 0 (0.0%) |
| Professional & Scientific | 0 (0.0%) | 0 (0.0%) |
| Enterprise Management | 0 (0.0%) | 0 (0.0%) |
| Administrative & Support | 0 (0.0%) | 15 (100.0%) |
| Educational Services | 0 (0.0%) | 6 (100.0%) |
| Health Care & Social Assistance | 10 (55.6%) | 8 (44.4%) |
| Arts, Entertainment & Recreation | 2 (100.0%) | 0 (0.0%) |
| Accommodation & Food Services | 2 (66.7%) | 1 (33.3%) |
| Public Administration | 8 (72.7%) | 3 (27.3%) |
| Total | 63 (40.4%) | 93 (59.6%) |
Education in Oakdale
School Enrollment in Oakdale
The most common levels of schooling among the 21 students in Oakdale are elementary school (10 | 47.6%), middle school (6 | 28.6%), and high school (4 | 19.1%).
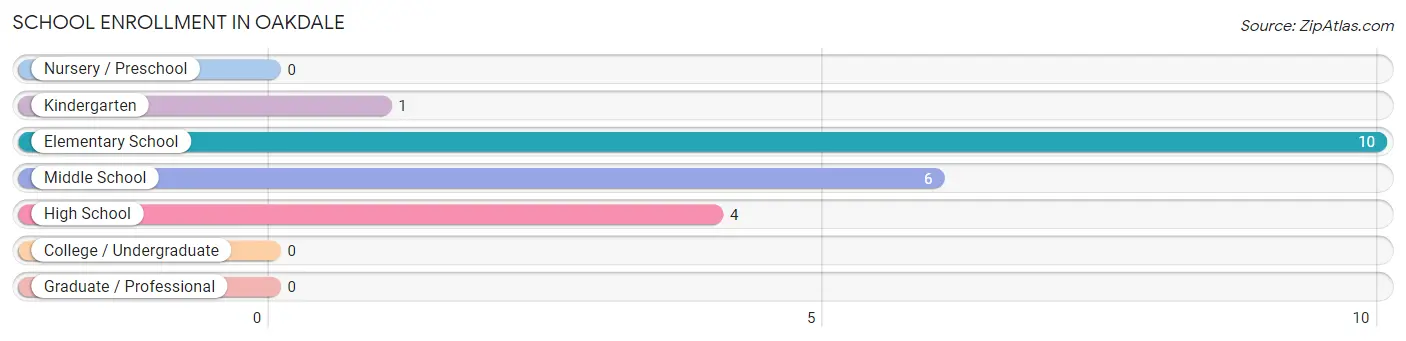
| School Level | # Students | % Students |
| Nursery / Preschool | 0 | 0.0% |
| Kindergarten | 1 | 4.8% |
| Elementary School | 10 | 47.6% |
| Middle School | 6 | 28.6% |
| High School | 4 | 19.1% |
| College / Undergraduate | 0 | 0.0% |
| Graduate / Professional | 0 | 0.0% |
| Total | 21 | 100.0% |
School Enrollment by Age by Funding Source in Oakdale
Out of a total of 21 students who are enrolled in schools in Oakdale, 4 (19.0%) attend a private institution, while the remaining 17 (81.0%) are enrolled in public schools. The age group of 5 to 9 year old has the highest likelihood of being enrolled in private schools, with 4 (80.0% in the age bracket) enrolled. Conversely, the age group of 10 to 14 year olds has the lowest likelihood of being enrolled in a private school, with 13 (100.0% in the age bracket) attending a public institution.
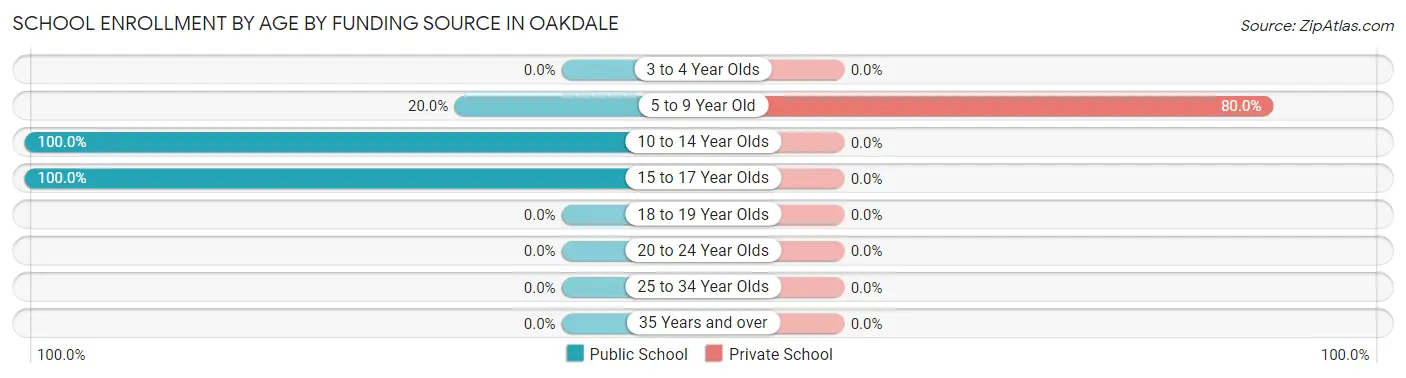
| Age Bracket | Public School | Private School |
| 3 to 4 Year Olds | 0 (0.0%) | 0 (0.0%) |
| 5 to 9 Year Old | 1 (20.0%) | 4 (80.0%) |
| 10 to 14 Year Olds | 13 (100.0%) | 0 (0.0%) |
| 15 to 17 Year Olds | 3 (100.0%) | 0 (0.0%) |
| 18 to 19 Year Olds | 0 (0.0%) | 0 (0.0%) |
| 20 to 24 Year Olds | 0 (0.0%) | 0 (0.0%) |
| 25 to 34 Year Olds | 0 (0.0%) | 0 (0.0%) |
| 35 Years and over | 0 (0.0%) | 0 (0.0%) |
| Total | 17 (81.0%) | 4 (19.0%) |
Educational Attainment by Field of Study in Oakdale
Business (33 | 86.8%), education (2 | 5.3%), arts & humanities (2 | 5.3%), and literature & languages (1 | 2.6%) are the most common fields of study among 38 individuals in Oakdale who have obtained a bachelor's degree or higher.
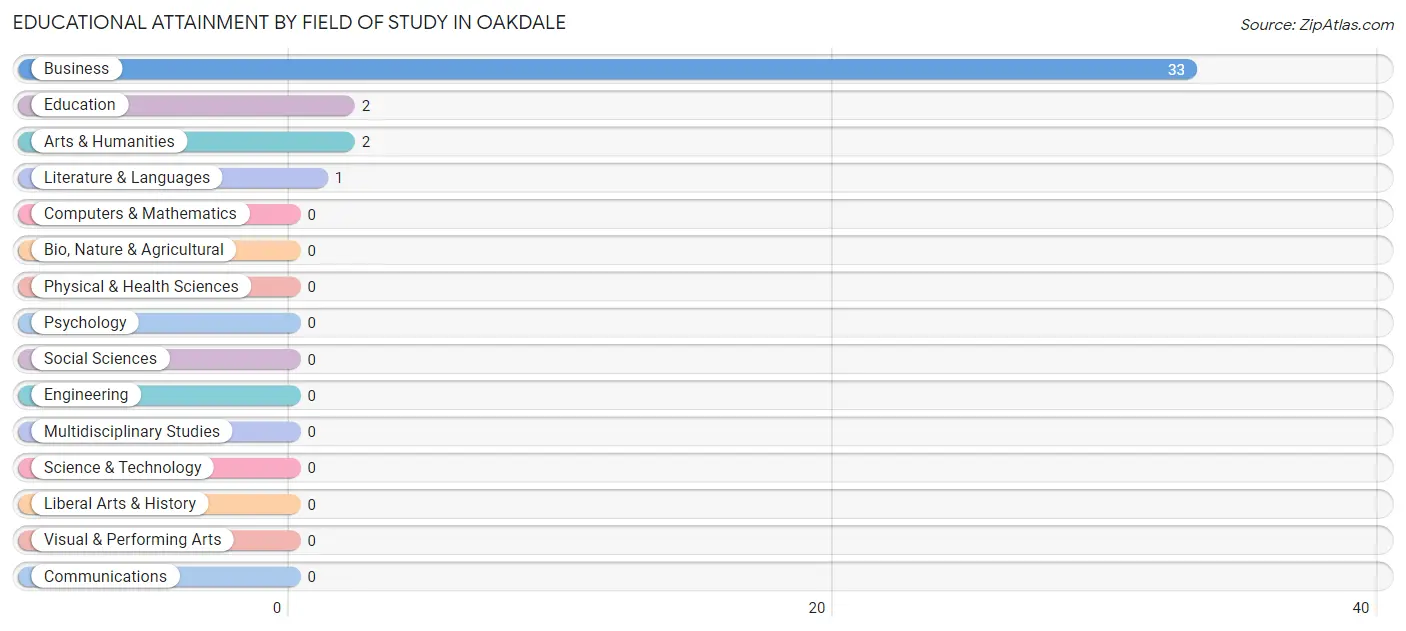
| Field of Study | # Graduates | % Graduates |
| Computers & Mathematics | 0 | 0.0% |
| Bio, Nature & Agricultural | 0 | 0.0% |
| Physical & Health Sciences | 0 | 0.0% |
| Psychology | 0 | 0.0% |
| Social Sciences | 0 | 0.0% |
| Engineering | 0 | 0.0% |
| Multidisciplinary Studies | 0 | 0.0% |
| Science & Technology | 0 | 0.0% |
| Business | 33 | 86.8% |
| Education | 2 | 5.3% |
| Literature & Languages | 1 | 2.6% |
| Liberal Arts & History | 0 | 0.0% |
| Visual & Performing Arts | 0 | 0.0% |
| Communications | 0 | 0.0% |
| Arts & Humanities | 2 | 5.3% |
| Total | 38 | 100.0% |
Transportation & Commute in Oakdale
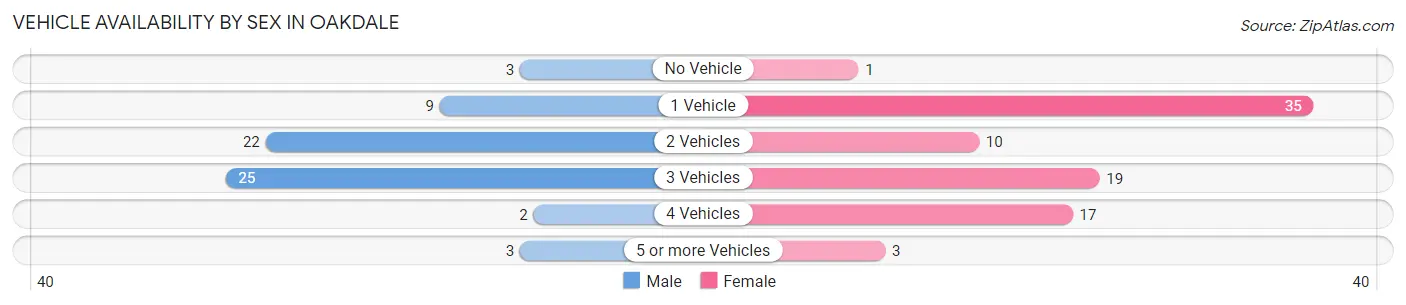
Vehicle Availability by Sex in Oakdale
The most prevalent vehicle ownership categories in Oakdale are males with 3 vehicles (25, accounting for 39.1%) and females with 3 vehicles (19, making up 29.4%).
| Vehicles Available | Male | Female |
| No Vehicle | 3 (4.7%) | 1 (1.2%) |
| 1 Vehicle | 9 (14.1%) | 35 (41.2%) |
| 2 Vehicles | 22 (34.4%) | 10 (11.8%) |
| 3 Vehicles | 25 (39.1%) | 19 (22.4%) |
| 4 Vehicles | 2 (3.1%) | 17 (20.0%) |
| 5 or more Vehicles | 3 (4.7%) | 3 (3.5%) |
| Total | 64 (100.0%) | 85 (100.0%) |
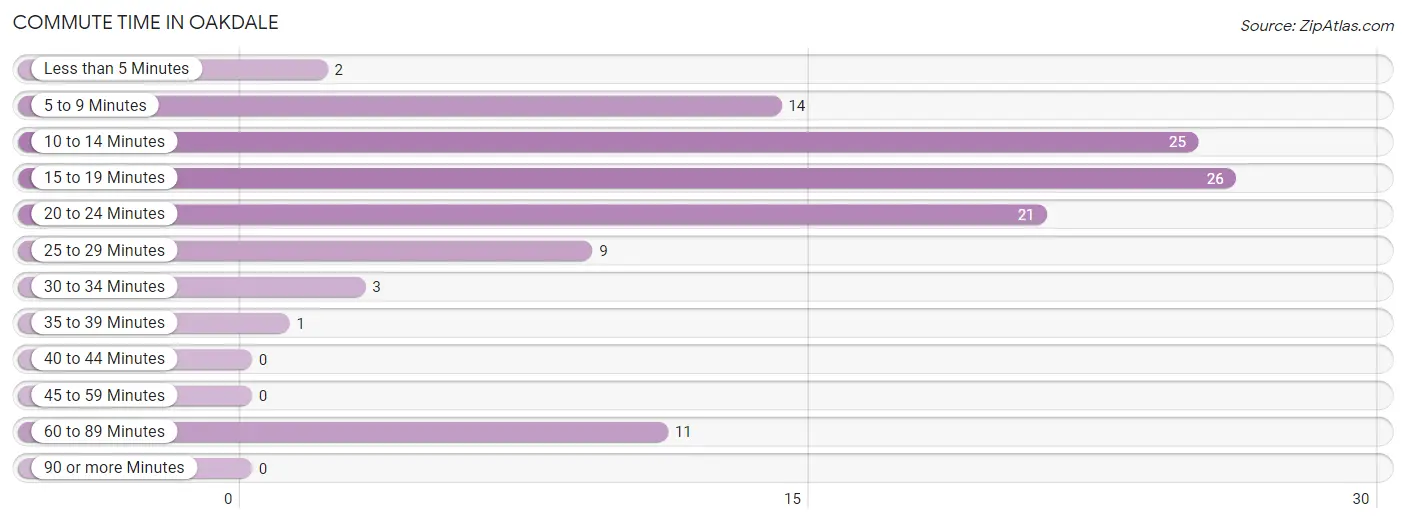
Commute Time in Oakdale
The most frequently occuring commute durations in Oakdale are 15 to 19 minutes (26 commuters, 23.2%), 10 to 14 minutes (25 commuters, 22.3%), and 20 to 24 minutes (21 commuters, 18.8%).
| Commute Time | # Commuters | % Commuters |
| Less than 5 Minutes | 2 | 1.8% |
| 5 to 9 Minutes | 14 | 12.5% |
| 10 to 14 Minutes | 25 | 22.3% |
| 15 to 19 Minutes | 26 | 23.2% |
| 20 to 24 Minutes | 21 | 18.8% |
| 25 to 29 Minutes | 9 | 8.0% |
| 30 to 34 Minutes | 3 | 2.7% |
| 35 to 39 Minutes | 1 | 0.9% |
| 40 to 44 Minutes | 0 | 0.0% |
| 45 to 59 Minutes | 0 | 0.0% |
| 60 to 89 Minutes | 11 | 9.8% |
| 90 or more Minutes | 0 | 0.0% |
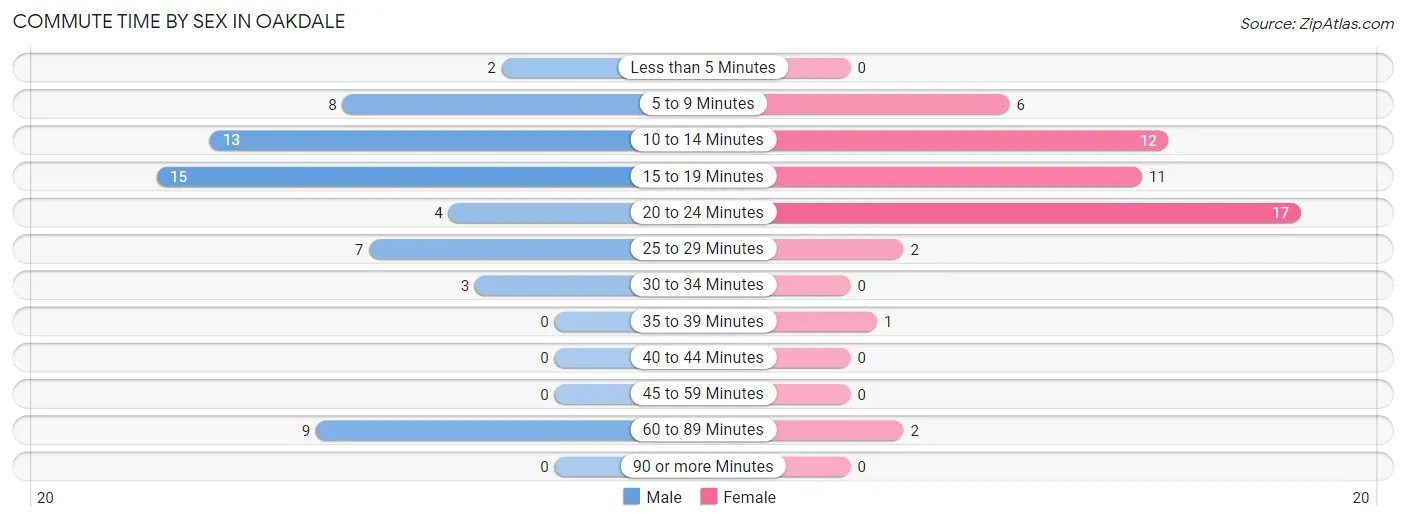
Commute Time by Sex in Oakdale
The most common commute times in Oakdale are 15 to 19 minutes (15 commuters, 24.6%) for males and 20 to 24 minutes (17 commuters, 33.3%) for females.
| Commute Time | Male | Female |
| Less than 5 Minutes | 2 (3.3%) | 0 (0.0%) |
| 5 to 9 Minutes | 8 (13.1%) | 6 (11.8%) |
| 10 to 14 Minutes | 13 (21.3%) | 12 (23.5%) |
| 15 to 19 Minutes | 15 (24.6%) | 11 (21.6%) |
| 20 to 24 Minutes | 4 (6.6%) | 17 (33.3%) |
| 25 to 29 Minutes | 7 (11.5%) | 2 (3.9%) |
| 30 to 34 Minutes | 3 (4.9%) | 0 (0.0%) |
| 35 to 39 Minutes | 0 (0.0%) | 1 (2.0%) |
| 40 to 44 Minutes | 0 (0.0%) | 0 (0.0%) |
| 45 to 59 Minutes | 0 (0.0%) | 0 (0.0%) |
| 60 to 89 Minutes | 9 (14.7%) | 2 (3.9%) |
| 90 or more Minutes | 0 (0.0%) | 0 (0.0%) |
Time of Departure to Work by Sex in Oakdale
The most frequent times of departure to work in Oakdale are 5:30 AM to 5:59 AM (19, 31.1%) for males and 7:30 AM to 7:59 AM (22, 43.1%) for females.
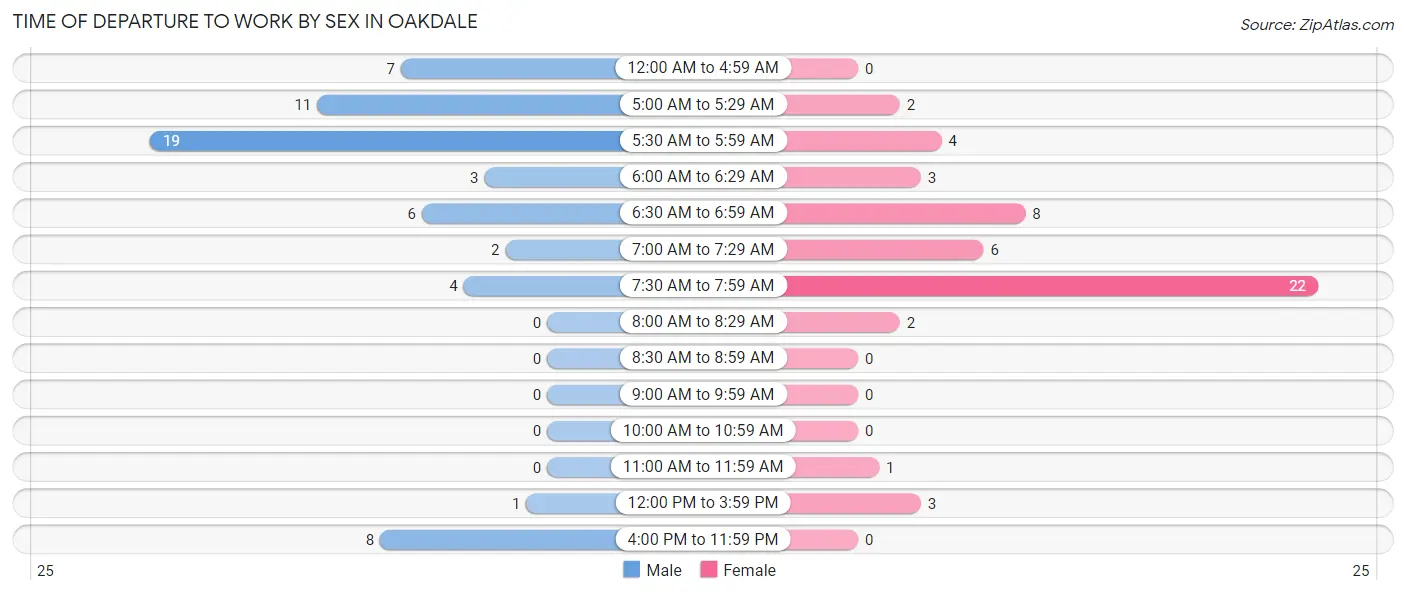
| Time of Departure | Male | Female |
| 12:00 AM to 4:59 AM | 7 (11.5%) | 0 (0.0%) |
| 5:00 AM to 5:29 AM | 11 (18.0%) | 2 (3.9%) |
| 5:30 AM to 5:59 AM | 19 (31.1%) | 4 (7.8%) |
| 6:00 AM to 6:29 AM | 3 (4.9%) | 3 (5.9%) |
| 6:30 AM to 6:59 AM | 6 (9.8%) | 8 (15.7%) |
| 7:00 AM to 7:29 AM | 2 (3.3%) | 6 (11.8%) |
| 7:30 AM to 7:59 AM | 4 (6.6%) | 22 (43.1%) |
| 8:00 AM to 8:29 AM | 0 (0.0%) | 2 (3.9%) |
| 8:30 AM to 8:59 AM | 0 (0.0%) | 0 (0.0%) |
| 9:00 AM to 9:59 AM | 0 (0.0%) | 0 (0.0%) |
| 10:00 AM to 10:59 AM | 0 (0.0%) | 0 (0.0%) |
| 11:00 AM to 11:59 AM | 0 (0.0%) | 1 (2.0%) |
| 12:00 PM to 3:59 PM | 1 (1.6%) | 3 (5.9%) |
| 4:00 PM to 11:59 PM | 8 (13.1%) | 0 (0.0%) |
| Total | 61 (100.0%) | 51 (100.0%) |
Housing Occupancy in Oakdale
Occupancy by Ownership in Oakdale
Of the total 129 dwellings in Oakdale, owner-occupied units account for 111 (86.1%), while renter-occupied units make up 18 (14.0%).
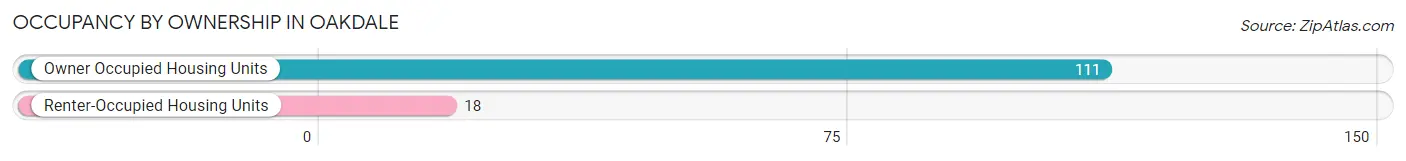
| Occupancy | # Housing Units | % Housing Units |
| Owner Occupied Housing Units | 111 | 86.1% |
| Renter-Occupied Housing Units | 18 | 14.0% |
| Total Occupied Housing Units | 129 | 100.0% |
Occupancy by Household Size in Oakdale
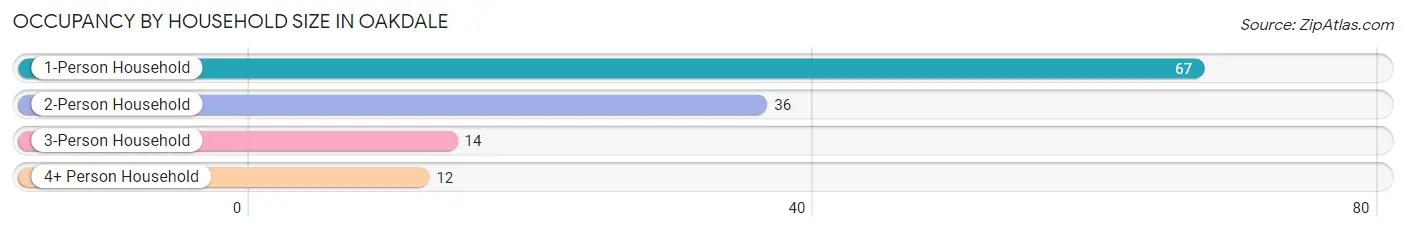
| Household Size | # Housing Units | % Housing Units |
| 1-Person Household | 67 | 51.9% |
| 2-Person Household | 36 | 27.9% |
| 3-Person Household | 14 | 10.8% |
| 4+ Person Household | 12 | 9.3% |
| Total Housing Units | 129 | 100.0% |
Occupancy by Ownership by Household Size in Oakdale
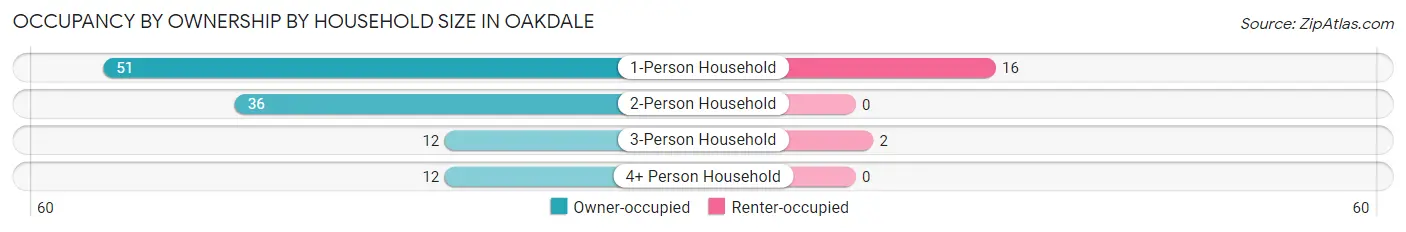
| Household Size | Owner-occupied | Renter-occupied |
| 1-Person Household | 51 (76.1%) | 16 (23.9%) |
| 2-Person Household | 36 (100.0%) | 0 (0.0%) |
| 3-Person Household | 12 (85.7%) | 2 (14.3%) |
| 4+ Person Household | 12 (100.0%) | 0 (0.0%) |
| Total Housing Units | 111 (86.1%) | 18 (14.0%) |
Occupancy by Educational Attainment in Oakdale
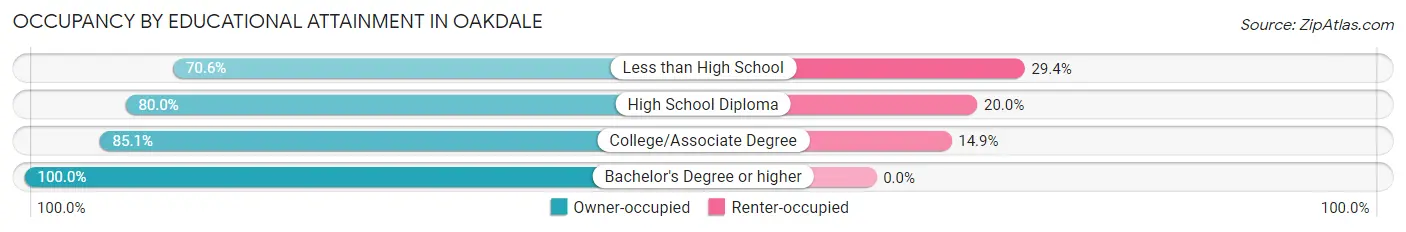
| Household Size | Owner-occupied | Renter-occupied |
| Less than High School | 12 (70.6%) | 5 (29.4%) |
| High School Diploma | 24 (80.0%) | 6 (20.0%) |
| College/Associate Degree | 40 (85.1%) | 7 (14.9%) |
| Bachelor's Degree or higher | 35 (100.0%) | 0 (0.0%) |
Occupancy by Age of Householder in Oakdale
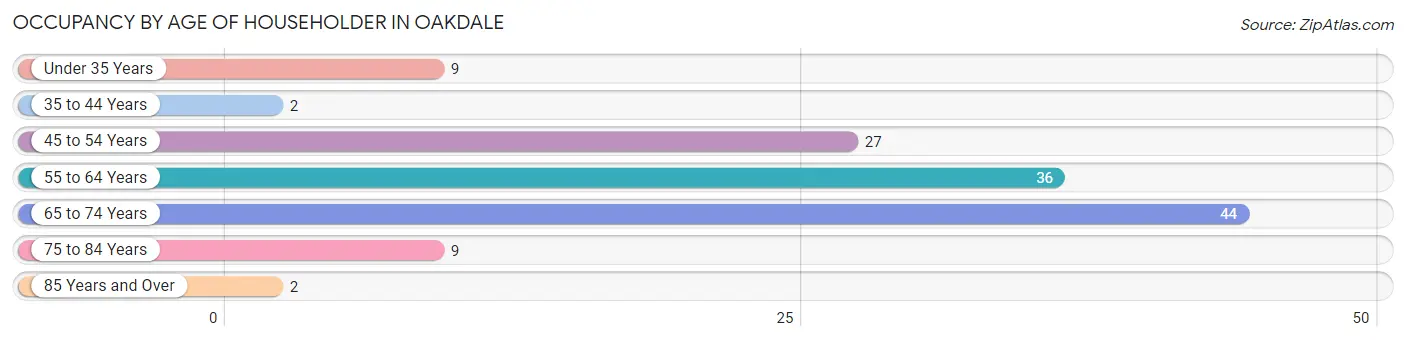
| Age Bracket | # Households | % Households |
| Under 35 Years | 9 | 7.0% |
| 35 to 44 Years | 2 | 1.5% |
| 45 to 54 Years | 27 | 20.9% |
| 55 to 64 Years | 36 | 27.9% |
| 65 to 74 Years | 44 | 34.1% |
| 75 to 84 Years | 9 | 7.0% |
| 85 Years and Over | 2 | 1.5% |
| Total | 129 | 100.0% |
Housing Finances in Oakdale
Median Income by Occupancy in Oakdale
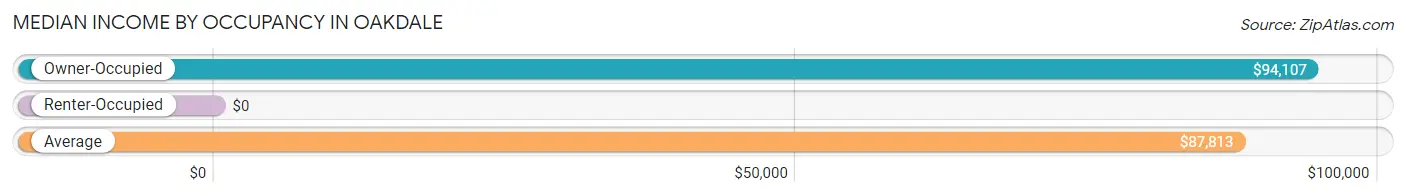
| Occupancy Type | # Households | Median Income |
| Owner-Occupied | 111 (86.1%) | $94,107 |
| Renter-Occupied | 18 (14.0%) | $0 |
| Average | 129 (100.0%) | $87,813 |
Occupancy by Householder Income Bracket in Oakdale
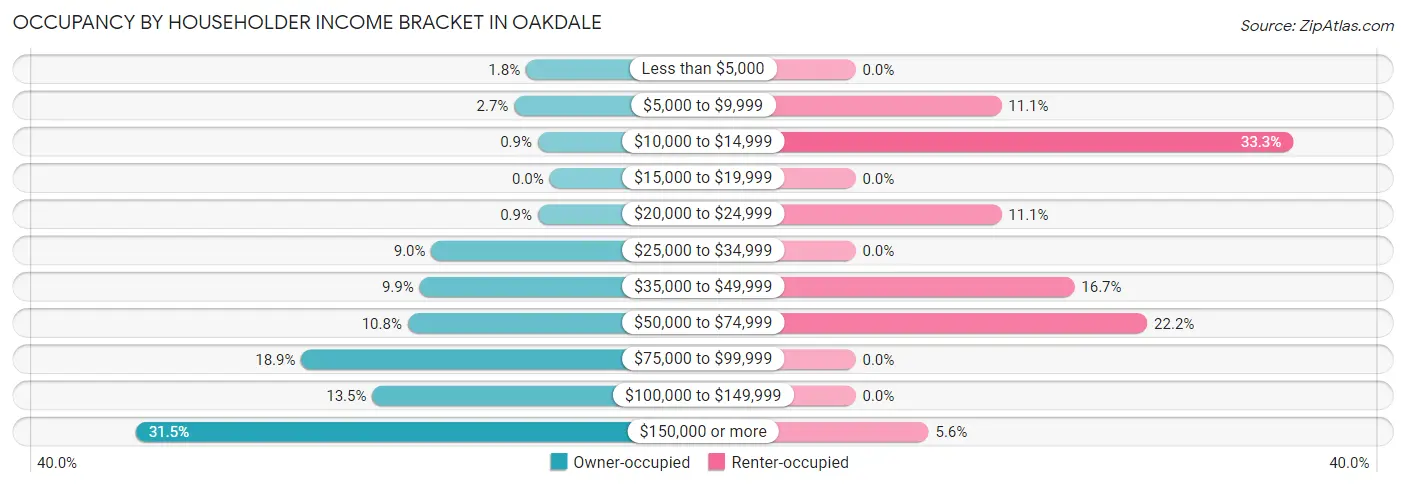
| Income Bracket | Owner-occupied | Renter-occupied |
| Less than $5,000 | 2 (1.8%) | 0 (0.0%) |
| $5,000 to $9,999 | 3 (2.7%) | 2 (11.1%) |
| $10,000 to $14,999 | 1 (0.9%) | 6 (33.3%) |
| $15,000 to $19,999 | 0 (0.0%) | 0 (0.0%) |
| $20,000 to $24,999 | 1 (0.9%) | 2 (11.1%) |
| $25,000 to $34,999 | 10 (9.0%) | 0 (0.0%) |
| $35,000 to $49,999 | 11 (9.9%) | 3 (16.7%) |
| $50,000 to $74,999 | 12 (10.8%) | 4 (22.2%) |
| $75,000 to $99,999 | 21 (18.9%) | 0 (0.0%) |
| $100,000 to $149,999 | 15 (13.5%) | 0 (0.0%) |
| $150,000 or more | 35 (31.5%) | 1 (5.6%) |
| Total | 111 (100.0%) | 18 (100.0%) |
Monthly Housing Cost Tiers in Oakdale
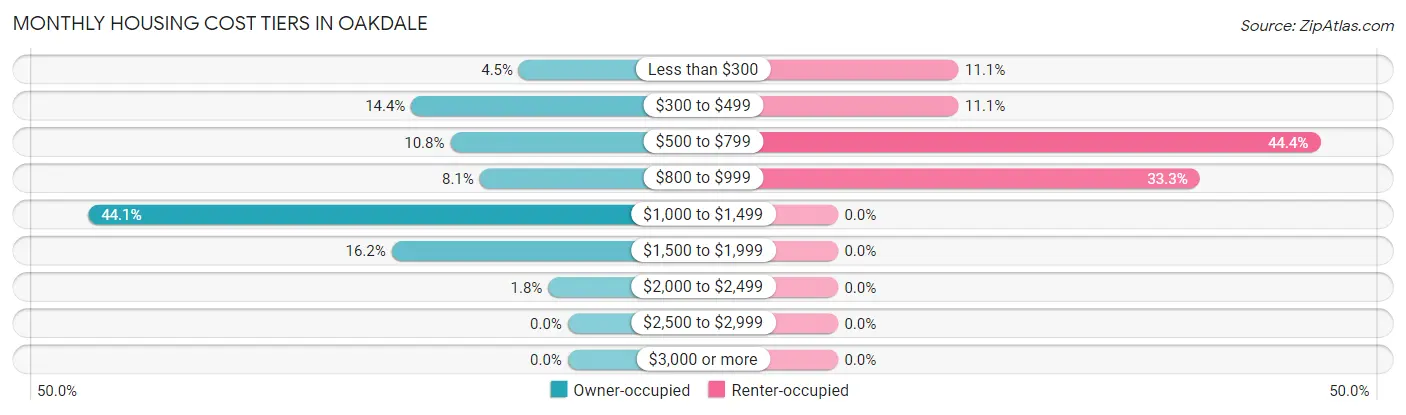
| Monthly Cost | Owner-occupied | Renter-occupied |
| Less than $300 | 5 (4.5%) | 2 (11.1%) |
| $300 to $499 | 16 (14.4%) | 2 (11.1%) |
| $500 to $799 | 12 (10.8%) | 8 (44.4%) |
| $800 to $999 | 9 (8.1%) | 6 (33.3%) |
| $1,000 to $1,499 | 49 (44.1%) | 0 (0.0%) |
| $1,500 to $1,999 | 18 (16.2%) | 0 (0.0%) |
| $2,000 to $2,499 | 2 (1.8%) | 0 (0.0%) |
| $2,500 to $2,999 | 0 (0.0%) | 0 (0.0%) |
| $3,000 or more | 0 (0.0%) | 0 (0.0%) |
| Total | 111 (100.0%) | 18 (100.0%) |
Physical Housing Characteristics in Oakdale
Housing Structures in Oakdale
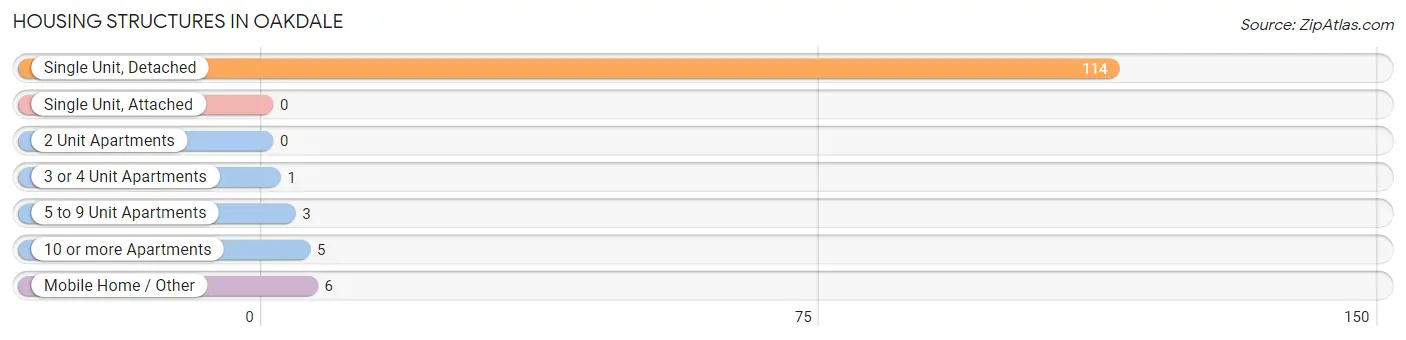
| Structure Type | # Housing Units | % Housing Units |
| Single Unit, Detached | 114 | 88.4% |
| Single Unit, Attached | 0 | 0.0% |
| 2 Unit Apartments | 0 | 0.0% |
| 3 or 4 Unit Apartments | 1 | 0.8% |
| 5 to 9 Unit Apartments | 3 | 2.3% |
| 10 or more Apartments | 5 | 3.9% |
| Mobile Home / Other | 6 | 4.6% |
| Total | 129 | 100.0% |
Housing Structures by Occupancy in Oakdale
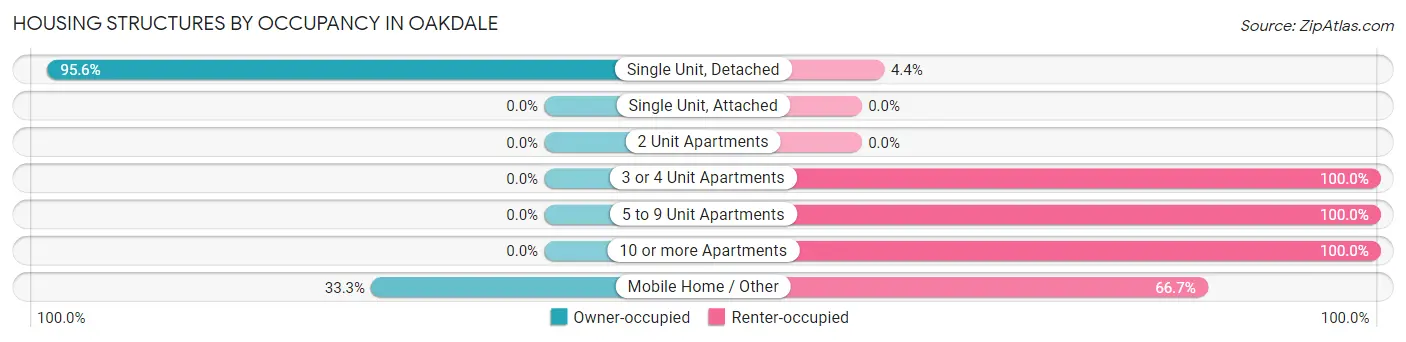
| Structure Type | Owner-occupied | Renter-occupied |
| Single Unit, Detached | 109 (95.6%) | 5 (4.4%) |
| Single Unit, Attached | 0 (0.0%) | 0 (0.0%) |
| 2 Unit Apartments | 0 (0.0%) | 0 (0.0%) |
| 3 or 4 Unit Apartments | 0 (0.0%) | 1 (100.0%) |
| 5 to 9 Unit Apartments | 0 (0.0%) | 3 (100.0%) |
| 10 or more Apartments | 0 (0.0%) | 5 (100.0%) |
| Mobile Home / Other | 2 (33.3%) | 4 (66.7%) |
| Total | 111 (86.1%) | 18 (14.0%) |
Housing Structures by Number of Rooms in Oakdale
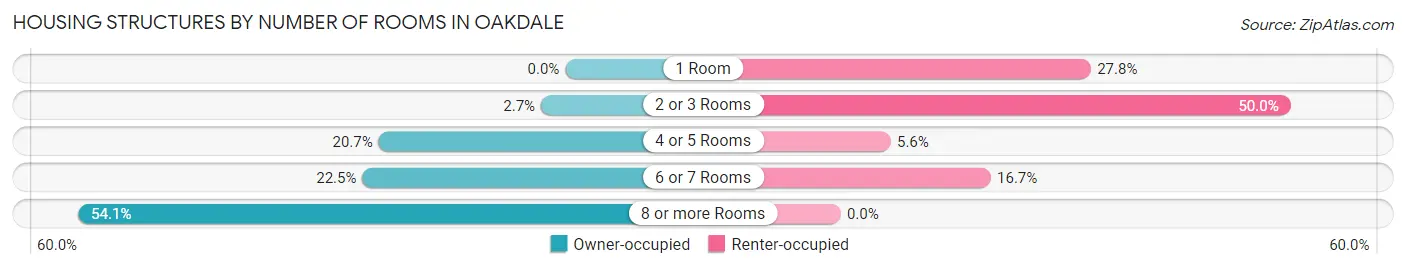
| Number of Rooms | Owner-occupied | Renter-occupied |
| 1 Room | 0 (0.0%) | 5 (27.8%) |
| 2 or 3 Rooms | 3 (2.7%) | 9 (50.0%) |
| 4 or 5 Rooms | 23 (20.7%) | 1 (5.6%) |
| 6 or 7 Rooms | 25 (22.5%) | 3 (16.7%) |
| 8 or more Rooms | 60 (54.0%) | 0 (0.0%) |
| Total | 111 (100.0%) | 18 (100.0%) |
Housing Structure by Heating Type in Oakdale
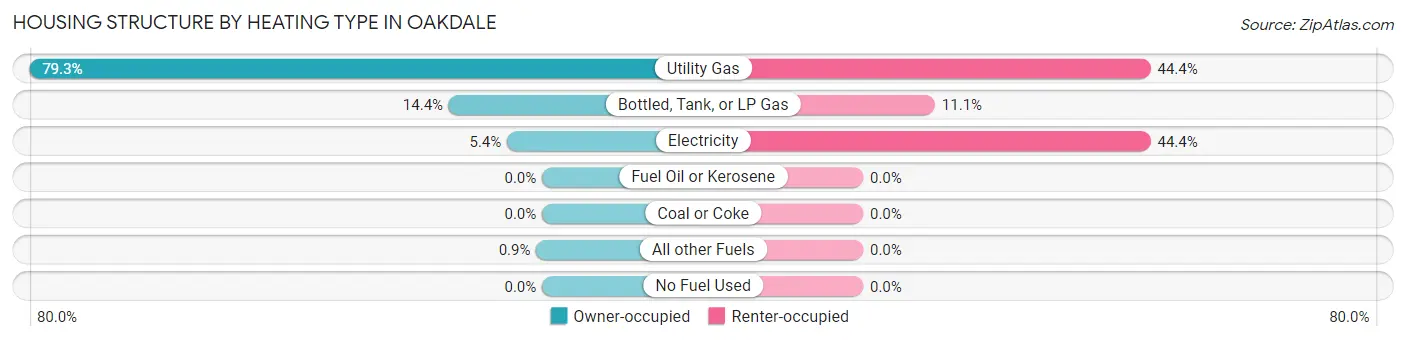
| Heating Type | Owner-occupied | Renter-occupied |
| Utility Gas | 88 (79.3%) | 8 (44.4%) |
| Bottled, Tank, or LP Gas | 16 (14.4%) | 2 (11.1%) |
| Electricity | 6 (5.4%) | 8 (44.4%) |
| Fuel Oil or Kerosene | 0 (0.0%) | 0 (0.0%) |
| Coal or Coke | 0 (0.0%) | 0 (0.0%) |
| All other Fuels | 1 (0.9%) | 0 (0.0%) |
| No Fuel Used | 0 (0.0%) | 0 (0.0%) |
| Total | 111 (100.0%) | 18 (100.0%) |
Household Vehicle Usage in Oakdale
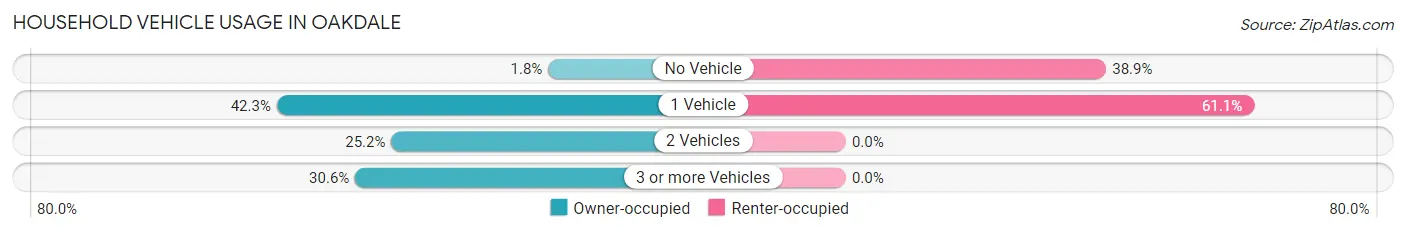
| Vehicles per Household | Owner-occupied | Renter-occupied |
| No Vehicle | 2 (1.8%) | 7 (38.9%) |
| 1 Vehicle | 47 (42.3%) | 11 (61.1%) |
| 2 Vehicles | 28 (25.2%) | 0 (0.0%) |
| 3 or more Vehicles | 34 (30.6%) | 0 (0.0%) |
| Total | 111 (100.0%) | 18 (100.0%) |
Real Estate & Mortgages in Oakdale
Real Estate and Mortgage Overview in Oakdale
| Characteristic | Without Mortgage | With Mortgage |
| Housing Units | 30 | 81 |
| Median Property Value | $95,000 | $203,600 |
| Median Household Income | $38,929 | $33 |
| Monthly Housing Costs | $345 | $0 |
| Real Estate Taxes | $1,536 | $1 |
Property Value by Mortgage Status in Oakdale
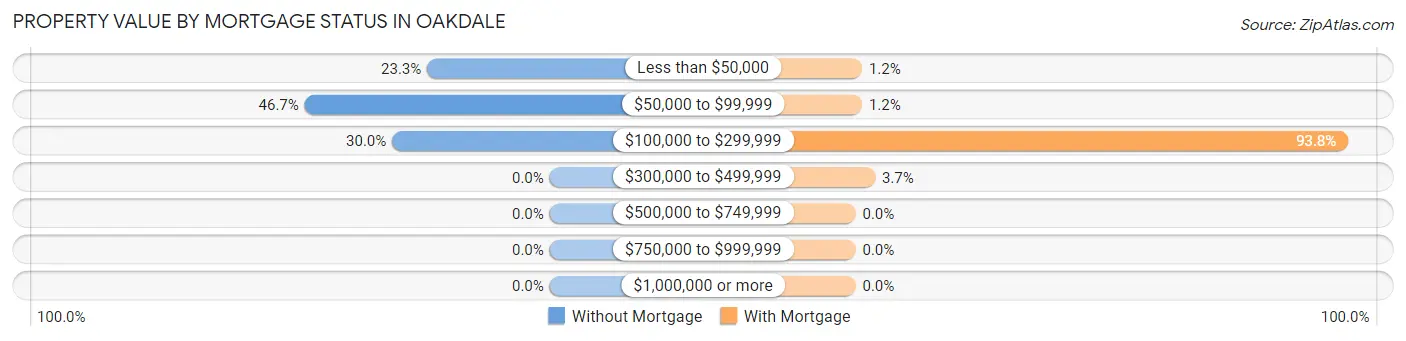
| Property Value | Without Mortgage | With Mortgage |
| Less than $50,000 | 7 (23.3%) | 1 (1.2%) |
| $50,000 to $99,999 | 14 (46.7%) | 1 (1.2%) |
| $100,000 to $299,999 | 9 (30.0%) | 76 (93.8%) |
| $300,000 to $499,999 | 0 (0.0%) | 3 (3.7%) |
| $500,000 to $749,999 | 0 (0.0%) | 0 (0.0%) |
| $750,000 to $999,999 | 0 (0.0%) | 0 (0.0%) |
| $1,000,000 or more | 0 (0.0%) | 0 (0.0%) |
| Total | 30 (100.0%) | 81 (100.0%) |
Household Income by Mortgage Status in Oakdale
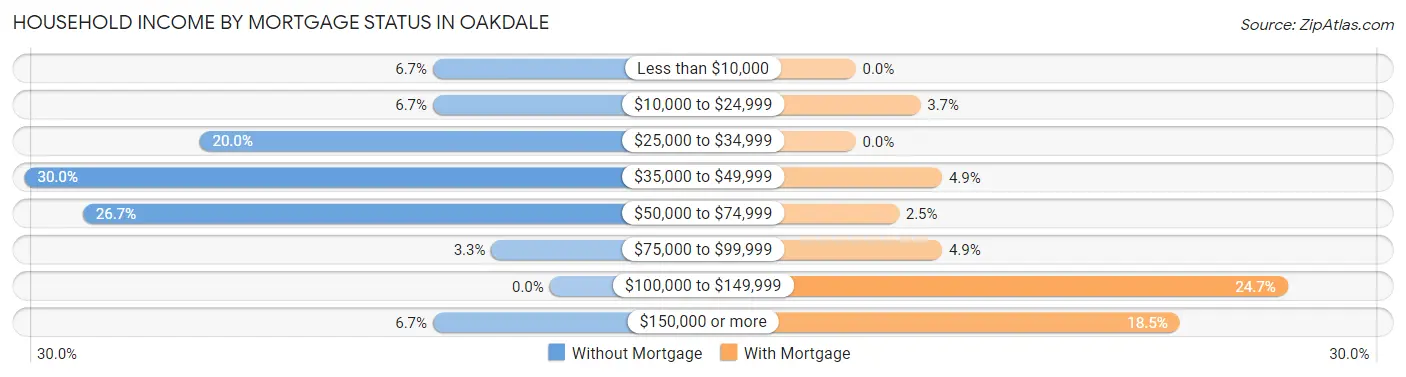
| Household Income | Without Mortgage | With Mortgage |
| Less than $10,000 | 2 (6.7%) | 0 (0.0%) |
| $10,000 to $24,999 | 2 (6.7%) | 3 (3.7%) |
| $25,000 to $34,999 | 6 (20.0%) | 0 (0.0%) |
| $35,000 to $49,999 | 9 (30.0%) | 4 (4.9%) |
| $50,000 to $74,999 | 8 (26.7%) | 2 (2.5%) |
| $75,000 to $99,999 | 1 (3.3%) | 4 (4.9%) |
| $100,000 to $149,999 | 0 (0.0%) | 20 (24.7%) |
| $150,000 or more | 2 (6.7%) | 15 (18.5%) |
| Total | 30 (100.0%) | 81 (100.0%) |
Property Value to Household Income Ratio in Oakdale
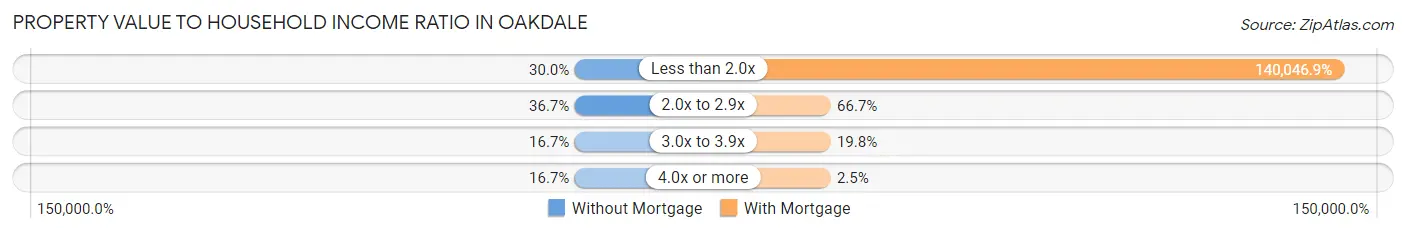
| Value-to-Income Ratio | Without Mortgage | With Mortgage |
| Less than 2.0x | 9 (30.0%) | 113,438 (140,046.9%) |
| 2.0x to 2.9x | 11 (36.7%) | 54 (66.7%) |
| 3.0x to 3.9x | 5 (16.7%) | 16 (19.8%) |
| 4.0x or more | 5 (16.7%) | 2 (2.5%) |
| Total | 30 (100.0%) | 81 (100.0%) |
Real Estate Taxes by Mortgage Status in Oakdale
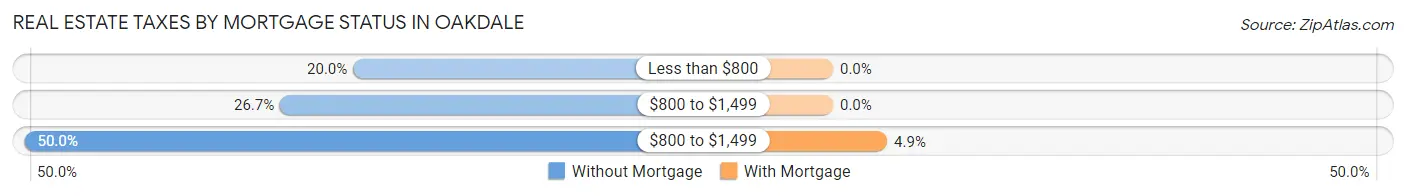
| Property Taxes | Without Mortgage | With Mortgage |
| Less than $800 | 6 (20.0%) | 0 (0.0%) |
| $800 to $1,499 | 8 (26.7%) | 0 (0.0%) |
| $800 to $1,499 | 15 (50.0%) | 4 (4.9%) |
| Total | 30 (100.0%) | 81 (100.0%) |
Health & Disability in Oakdale
Health Insurance Coverage by Age in Oakdale
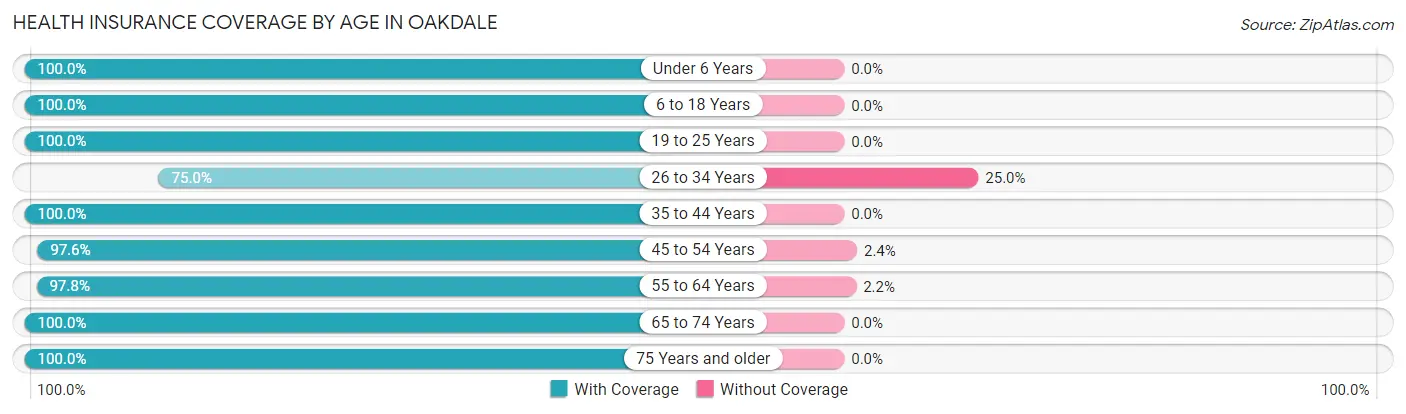
| Age Bracket | With Coverage | Without Coverage |
| Under 6 Years | 2 (100.0%) | 0 (0.0%) |
| 6 to 18 Years | 39 (100.0%) | 0 (0.0%) |
| 19 to 25 Years | 21 (100.0%) | 0 (0.0%) |
| 26 to 34 Years | 6 (75.0%) | 2 (25.0%) |
| 35 to 44 Years | 34 (100.0%) | 0 (0.0%) |
| 45 to 54 Years | 41 (97.6%) | 1 (2.4%) |
| 55 to 64 Years | 44 (97.8%) | 1 (2.2%) |
| 65 to 74 Years | 54 (100.0%) | 0 (0.0%) |
| 75 Years and older | 13 (100.0%) | 0 (0.0%) |
| Total | 254 (98.5%) | 4 (1.5%) |
Health Insurance Coverage by Citizenship Status in Oakdale
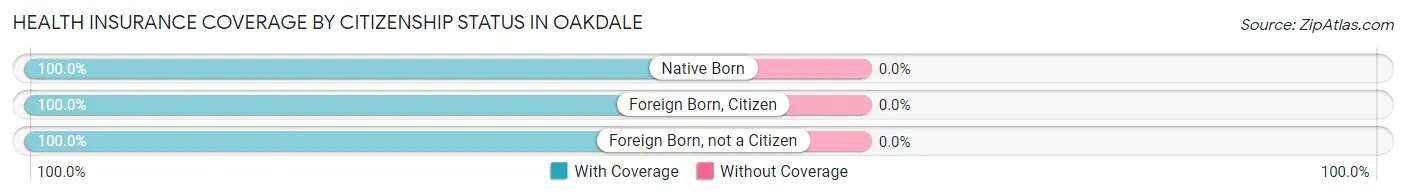
| Citizenship Status | With Coverage | Without Coverage |
| Native Born | 2 (100.0%) | 0 (0.0%) |
| Foreign Born, Citizen | 39 (100.0%) | 0 (0.0%) |
| Foreign Born, not a Citizen | 21 (100.0%) | 0 (0.0%) |
Health Insurance Coverage by Household Income in Oakdale
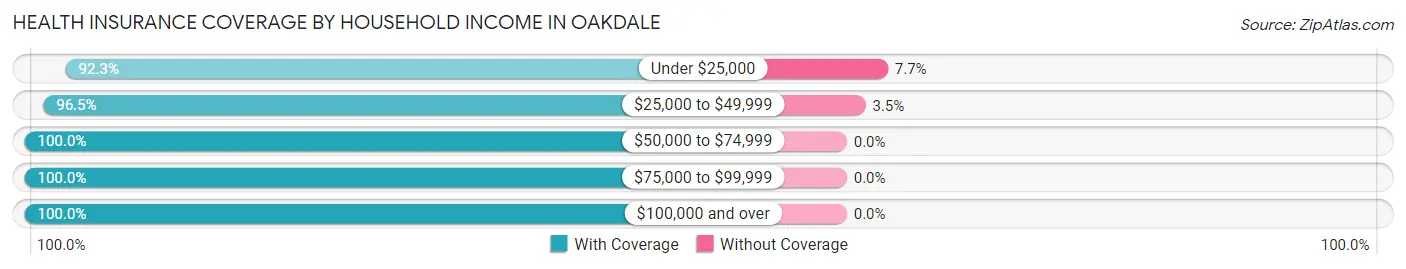
| Household Income | With Coverage | Without Coverage |
| Under $25,000 | 24 (92.3%) | 2 (7.7%) |
| $25,000 to $49,999 | 55 (96.5%) | 2 (3.5%) |
| $50,000 to $74,999 | 50 (100.0%) | 0 (0.0%) |
| $75,000 to $99,999 | 50 (100.0%) | 0 (0.0%) |
| $100,000 and over | 75 (100.0%) | 0 (0.0%) |
Public vs Private Health Insurance Coverage by Age in Oakdale
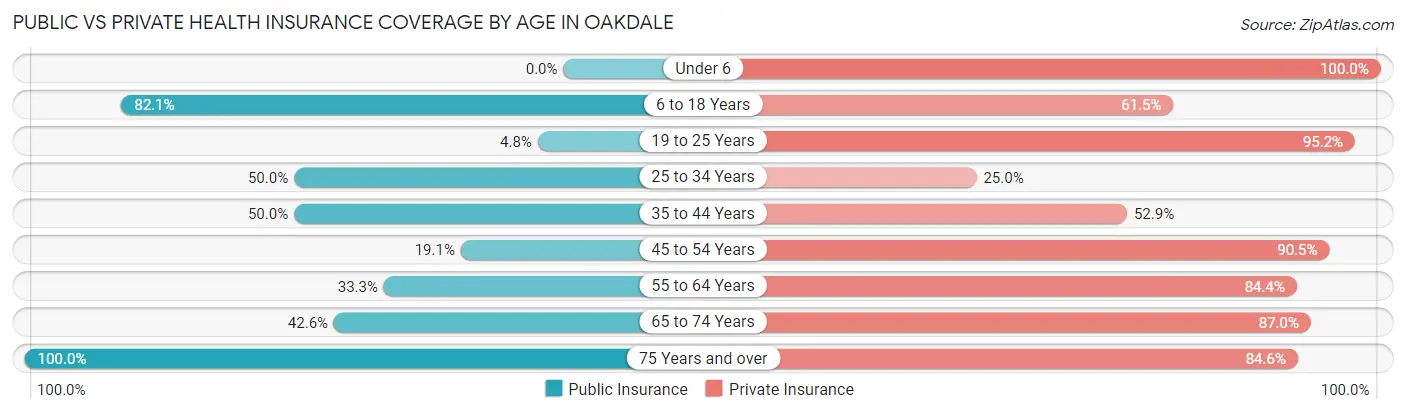
| Age Bracket | Public Insurance | Private Insurance |
| Under 6 | 0 (0.0%) | 2 (100.0%) |
| 6 to 18 Years | 32 (82.1%) | 24 (61.5%) |
| 19 to 25 Years | 1 (4.8%) | 20 (95.2%) |
| 25 to 34 Years | 4 (50.0%) | 2 (25.0%) |
| 35 to 44 Years | 17 (50.0%) | 18 (52.9%) |
| 45 to 54 Years | 8 (19.1%) | 38 (90.5%) |
| 55 to 64 Years | 15 (33.3%) | 38 (84.4%) |
| 65 to 74 Years | 23 (42.6%) | 47 (87.0%) |
| 75 Years and over | 13 (100.0%) | 11 (84.6%) |
| Total | 113 (43.8%) | 200 (77.5%) |
Disability Status by Sex by Age in Oakdale
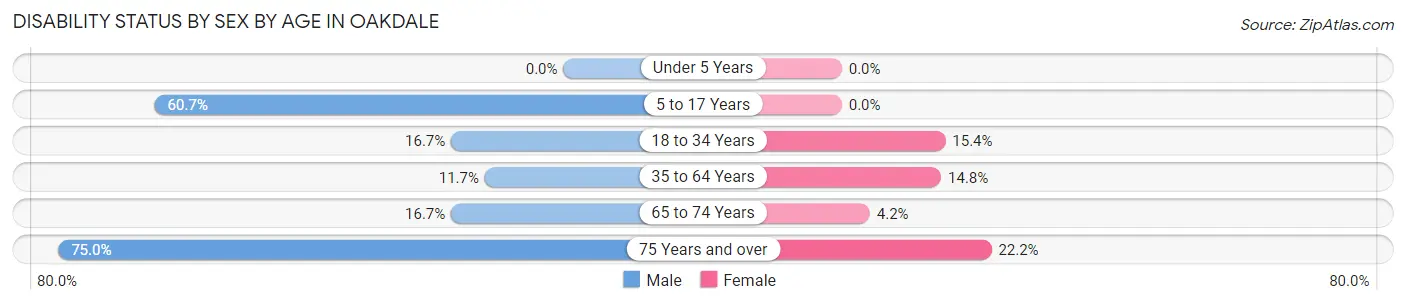
| Age Bracket | Male | Female |
| Under 5 Years | 0 (0.0%) | 0 (0.0%) |
| 5 to 17 Years | 17 (60.7%) | 0 (0.0%) |
| 18 to 34 Years | 3 (16.7%) | 2 (15.4%) |
| 35 to 64 Years | 7 (11.7%) | 9 (14.7%) |
| 65 to 74 Years | 1 (16.7%) | 2 (4.2%) |
| 75 Years and over | 3 (75.0%) | 2 (22.2%) |
Disability Class by Sex by Age in Oakdale
Disability Class: Hearing Difficulty
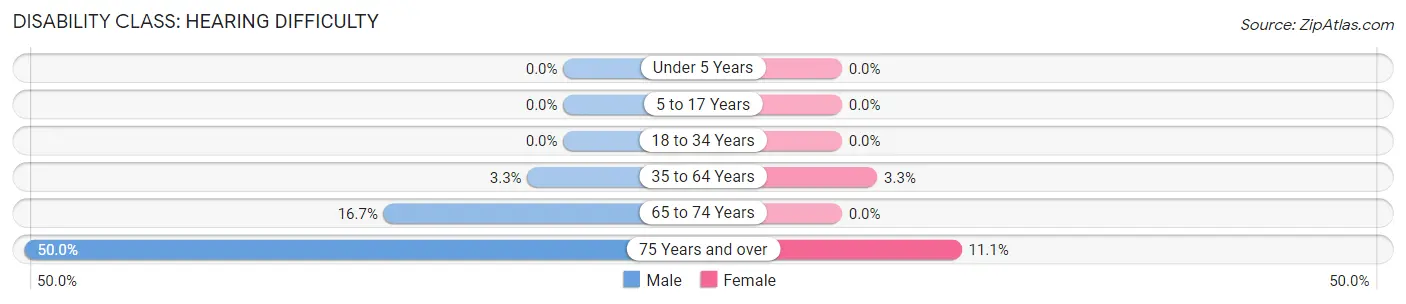
| Age Bracket | Male | Female |
| Under 5 Years | 0 (0.0%) | 0 (0.0%) |
| 5 to 17 Years | 0 (0.0%) | 0 (0.0%) |
| 18 to 34 Years | 0 (0.0%) | 0 (0.0%) |
| 35 to 64 Years | 2 (3.3%) | 2 (3.3%) |
| 65 to 74 Years | 1 (16.7%) | 0 (0.0%) |
| 75 Years and over | 2 (50.0%) | 1 (11.1%) |
Disability Class: Vision Difficulty
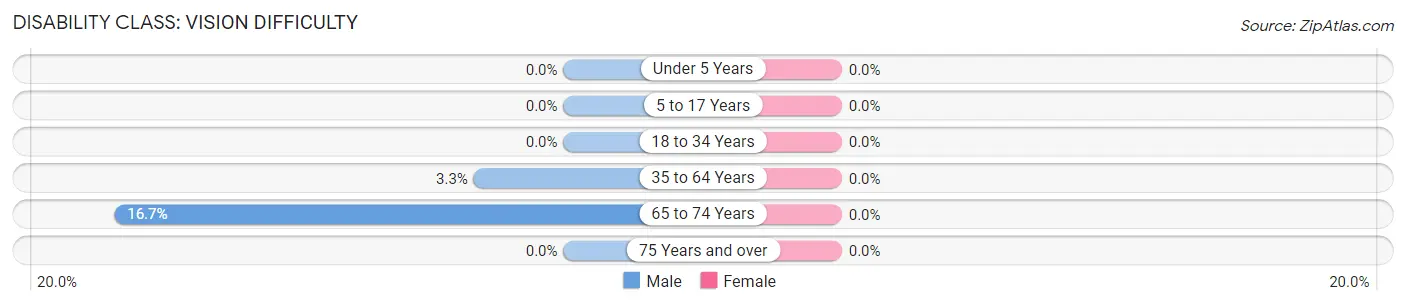
| Age Bracket | Male | Female |
| Under 5 Years | 0 (0.0%) | 0 (0.0%) |
| 5 to 17 Years | 0 (0.0%) | 0 (0.0%) |
| 18 to 34 Years | 0 (0.0%) | 0 (0.0%) |
| 35 to 64 Years | 2 (3.3%) | 0 (0.0%) |
| 65 to 74 Years | 1 (16.7%) | 0 (0.0%) |
| 75 Years and over | 0 (0.0%) | 0 (0.0%) |
Disability Class: Cognitive Difficulty
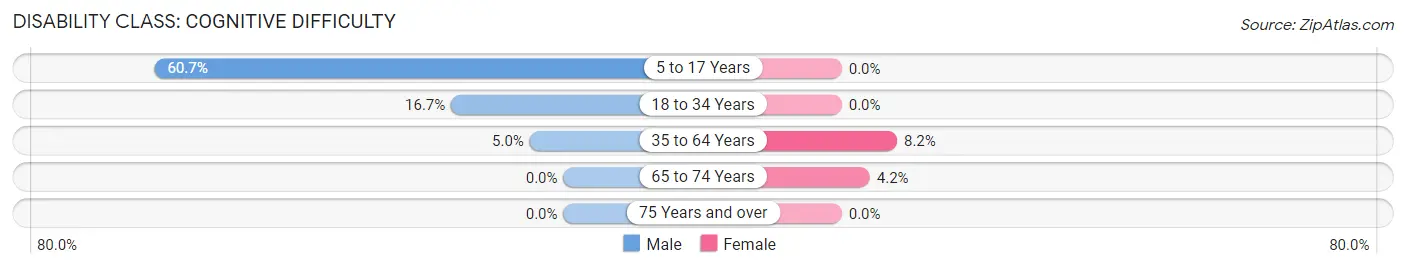
| Age Bracket | Male | Female |
| 5 to 17 Years | 17 (60.7%) | 0 (0.0%) |
| 18 to 34 Years | 3 (16.7%) | 0 (0.0%) |
| 35 to 64 Years | 3 (5.0%) | 5 (8.2%) |
| 65 to 74 Years | 0 (0.0%) | 2 (4.2%) |
| 75 Years and over | 0 (0.0%) | 0 (0.0%) |
Disability Class: Ambulatory Difficulty
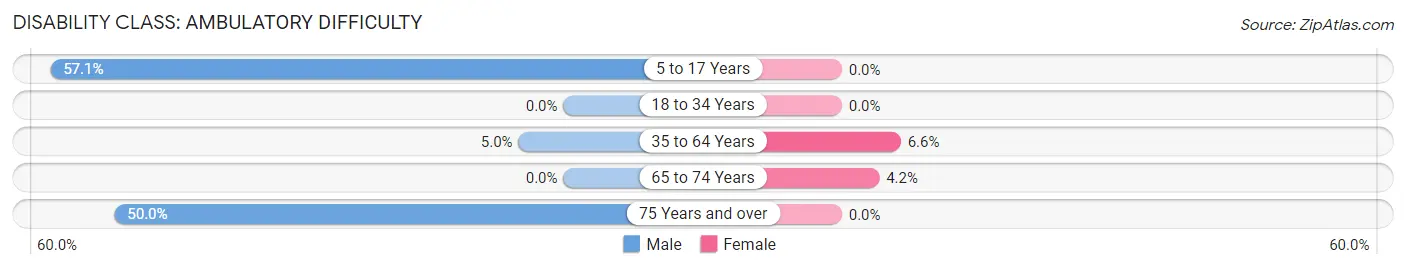
| Age Bracket | Male | Female |
| 5 to 17 Years | 16 (57.1%) | 0 (0.0%) |
| 18 to 34 Years | 0 (0.0%) | 0 (0.0%) |
| 35 to 64 Years | 3 (5.0%) | 4 (6.6%) |
| 65 to 74 Years | 0 (0.0%) | 2 (4.2%) |
| 75 Years and over | 2 (50.0%) | 0 (0.0%) |
Disability Class: Self-Care Difficulty
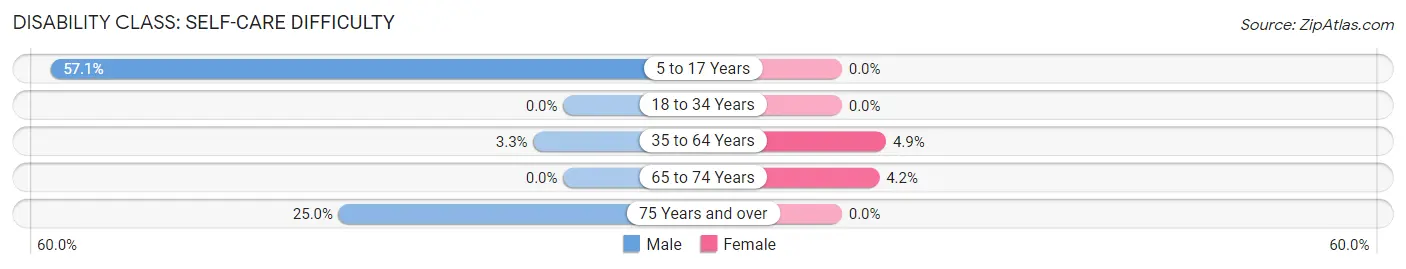
| Age Bracket | Male | Female |
| 5 to 17 Years | 16 (57.1%) | 0 (0.0%) |
| 18 to 34 Years | 0 (0.0%) | 0 (0.0%) |
| 35 to 64 Years | 2 (3.3%) | 3 (4.9%) |
| 65 to 74 Years | 0 (0.0%) | 2 (4.2%) |
| 75 Years and over | 1 (25.0%) | 0 (0.0%) |
Technology Access in Oakdale
Computing Device Access in Oakdale
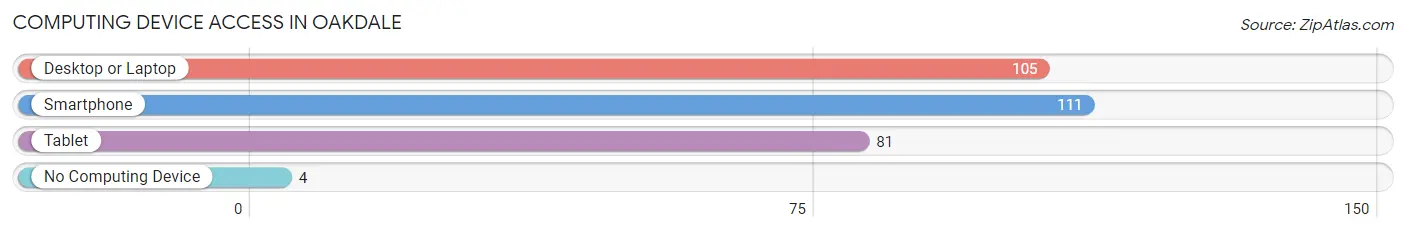
| Device Type | # Households | % Households |
| Desktop or Laptop | 105 | 81.4% |
| Smartphone | 111 | 86.1% |
| Tablet | 81 | 62.8% |
| No Computing Device | 4 | 3.1% |
| Total | 129 | 100.0% |
Internet Access in Oakdale
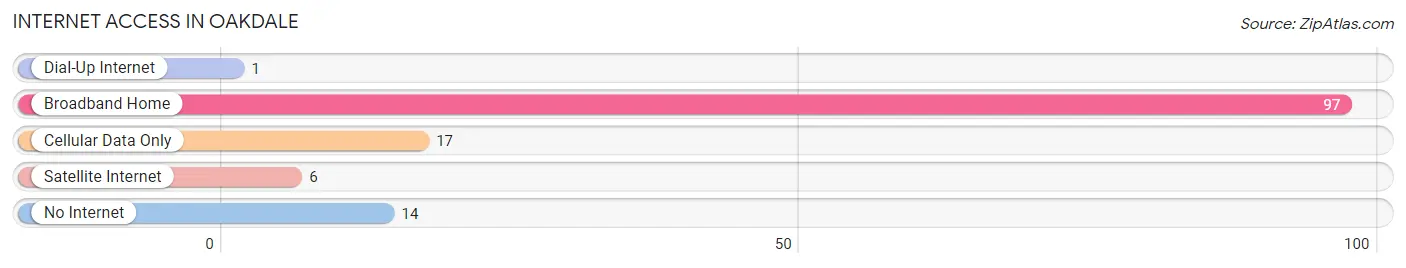
| Internet Type | # Households | % Households |
| Dial-Up Internet | 1 | 0.8% |
| Broadband Home | 97 | 75.2% |
| Cellular Data Only | 17 | 13.2% |
| Satellite Internet | 6 | 4.6% |
| No Internet | 14 | 10.8% |
| Total | 129 | 100.0% |
Oakdale Summary
Oakdale, Wisconsin is a small village located in St. Croix County, Wisconsin. It is situated on the banks of the St. Croix River, just south of the city of Hudson. The village has a population of approximately 1,000 people and is part of the greater Hudson metropolitan area.
History
Oakdale was first settled in 1854 by a group of settlers from New York. The village was originally known as Oakdale Station, as it was a stop on the St. Croix Valley Railroad. The village was officially incorporated in 1876.
In the late 19th century, Oakdale was a thriving agricultural community. The village was home to several large farms, as well as a number of small businesses. The village also had a sawmill, a grist mill, and a creamery.
In the early 20th century, Oakdale began to experience a decline in population. This was due to the decline of the railroad industry, as well as the Great Depression. The village was able to survive, however, and by the 1950s, the population had begun to increase again.
Geography
Oakdale is located in St. Croix County, Wisconsin. It is situated on the banks of the St. Croix River, just south of the city of Hudson. The village is located in a rural area, surrounded by rolling hills and farmland.
The village is located approximately 25 miles east of the city of Minneapolis, Minnesota. It is also located approximately 25 miles west of the city of Eau Claire, Wisconsin.
Economy
The economy of Oakdale is largely based on agriculture. The village is home to several large farms, as well as a number of small businesses. The village also has a sawmill, a grist mill, and a creamery.
In addition to agriculture, Oakdale is also home to a number of small businesses. These include restaurants, retail stores, and service providers. The village also has a number of small manufacturing businesses.
Demographics
As of the 2010 census, the population of Oakdale was 1,000 people. The racial makeup of the village was 97.2% White, 0.7% African American, 0.3% Native American, 0.3% Asian, and 1.5% from other races.
The median household income in Oakdale was $50,000, and the median family income was $54,000. The per capita income was $21,000. Approximately 8.5% of the population was below the poverty line.
Conclusion
Oakdale, Wisconsin is a small village located in St. Croix County, Wisconsin. It is situated on the banks of the St. Croix River, just south of the city of Hudson. The village has a population of approximately 1,000 people and is part of the greater Hudson metropolitan area. The economy of Oakdale is largely based on agriculture, with a number of small businesses also located in the village. The racial makeup of the village is predominantly White, with a small percentage of African American, Native American, and Asian residents. The median household income in Oakdale is $50,000, and the per capita income is $21,000.
Common Questions
What is Per Capita Income in Oakdale?
Per Capita income in Oakdale is $45,590.
What is the Median Family Income in Oakdale?
Median Family Income in Oakdale is $64,000.
What is the Median Household income in Oakdale?
Median Household Income in Oakdale is $87,813.
What is Income or Wage Gap in Oakdale?
Income or Wage Gap in Oakdale is 19.3%.
Women in Oakdale earn 80.7 cents for every dollar earned by a man.
What is Family Income Deficit in Oakdale?
Family Income Deficit in Oakdale is $9,825.
Families that are below poverty line in Oakdale earn $9,825 less on average than the poverty threshold level.
What is Inequality or Gini Index in Oakdale?
Inequality or Gini Index in Oakdale is 0.38.
What is the Total Population of Oakdale?
Total Population of Oakdale is 259.
What is the Total Male Population of Oakdale?
Total Male Population of Oakdale is 117.
What is the Total Female Population of Oakdale?
Total Female Population of Oakdale is 142.
What is the Ratio of Males per 100 Females in Oakdale?
There are 82.39 Males per 100 Females in Oakdale.
What is the Ratio of Females per 100 Males in Oakdale?
There are 121.37 Females per 100 Males in Oakdale.
What is the Median Population Age in Oakdale?
Median Population Age in Oakdale is 49.9 Years.
What is the Average Family Size in Oakdale
Average Family Size in Oakdale is 3.1 People.
What is the Average Household Size in Oakdale
Average Household Size in Oakdale is 2.0 People.
How Large is the Labor Force in Oakdale?
There are 159 People in the Labor Forcein in Oakdale.
What is the Percentage of People in the Labor Force in Oakdale?
71.3% of People are in the Labor Force in Oakdale.
What is the Unemployment Rate in Oakdale?
Unemployment Rate in Oakdale is 1.3%.