Fidelity, IL Map & Demographics
Fidelity Map
Fidelity Overview
$10,585
PER CAPITA INCOME
$44,375
AVG FAMILY INCOME
$43,125
AVG HOUSEHOLD INCOME
0.27
INEQUALITY / GINI INDEX
75
TOTAL POPULATION
34
MALE POPULATION
41
FEMALE POPULATION
82.93
MALES / 100 FEMALES
120.59
FEMALES / 100 MALES
39.5
MEDIAN AGE
3.8
AVG FAMILY SIZE
3.6
AVG HOUSEHOLD SIZE
13
LABOR FORCE [ PEOPLE ]
26.5%
PERCENT IN LABOR FORCE
Fidelity Zip Codes
Fidelity Area Codes
Income in Fidelity
Income Overview in Fidelity
Per Capita Income in Fidelity is $10,585, while median incomes of families and households are $44,375 and $43,125 respectively.
| Characteristic | Number | Measure |
| Per Capita Income | 75 | $10,585 |
| Median Family Income | 19 | $44,375 |
| Mean Family Income | 19 | $40,089 |
| Median Household Income | 21 | $43,125 |
| Mean Household Income | 21 | $38,662 |
| Income Deficit | 19 | $0 |
| Wage / Income Gap (%) | 75 | 0.00% |
| Wage / Income Gap ($) | 75 | 100.00¢ per $1 |
| Gini / Inequality Index | 75 | 0.27 |
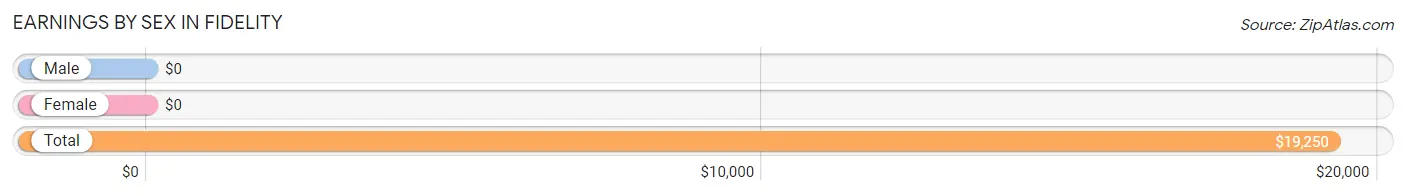
Earnings by Sex in Fidelity
| Sex | Number | Average Earnings |
| Male | 5 (38.5%) | $0 |
| Female | 8 (61.5%) | $0 |
| Total | 13 (100.0%) | $19,250 |
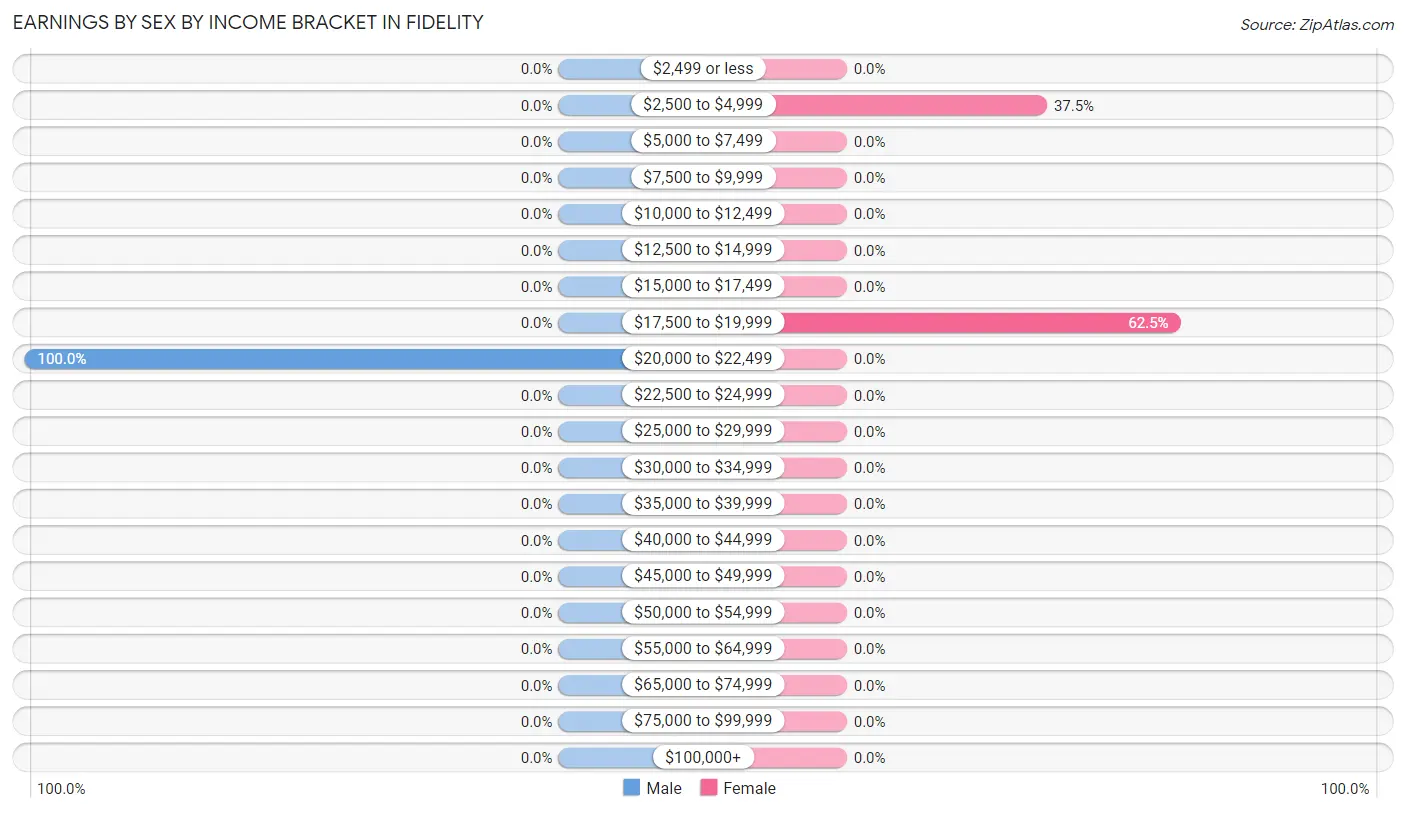
Earnings by Sex by Income Bracket in Fidelity
The most common earnings brackets in Fidelity are $20,000 to $22,499 for men (5 | 100.0%) and $17,500 to $19,999 for women (5 | 62.5%).
| Income | Male | Female |
| $2,499 or less | 0 (0.0%) | 0 (0.0%) |
| $2,500 to $4,999 | 0 (0.0%) | 3 (37.5%) |
| $5,000 to $7,499 | 0 (0.0%) | 0 (0.0%) |
| $7,500 to $9,999 | 0 (0.0%) | 0 (0.0%) |
| $10,000 to $12,499 | 0 (0.0%) | 0 (0.0%) |
| $12,500 to $14,999 | 0 (0.0%) | 0 (0.0%) |
| $15,000 to $17,499 | 0 (0.0%) | 0 (0.0%) |
| $17,500 to $19,999 | 0 (0.0%) | 5 (62.5%) |
| $20,000 to $22,499 | 5 (100.0%) | 0 (0.0%) |
| $22,500 to $24,999 | 0 (0.0%) | 0 (0.0%) |
| $25,000 to $29,999 | 0 (0.0%) | 0 (0.0%) |
| $30,000 to $34,999 | 0 (0.0%) | 0 (0.0%) |
| $35,000 to $39,999 | 0 (0.0%) | 0 (0.0%) |
| $40,000 to $44,999 | 0 (0.0%) | 0 (0.0%) |
| $45,000 to $49,999 | 0 (0.0%) | 0 (0.0%) |
| $50,000 to $54,999 | 0 (0.0%) | 0 (0.0%) |
| $55,000 to $64,999 | 0 (0.0%) | 0 (0.0%) |
| $65,000 to $74,999 | 0 (0.0%) | 0 (0.0%) |
| $75,000 to $99,999 | 0 (0.0%) | 0 (0.0%) |
| $100,000+ | 0 (0.0%) | 0 (0.0%) |
| Total | 5 (100.0%) | 8 (100.0%) |
Earnings by Sex by Educational Attainment in Fidelity
| Educational Attainment | Male Income | Female Income |
| Less than High School | - | - |
| High School Diploma | - | - |
| College or Associate's Degree | - | - |
| Bachelor's Degree | - | - |
| Graduate Degree | - | - |
| Total | - | - |
Family Income in Fidelity
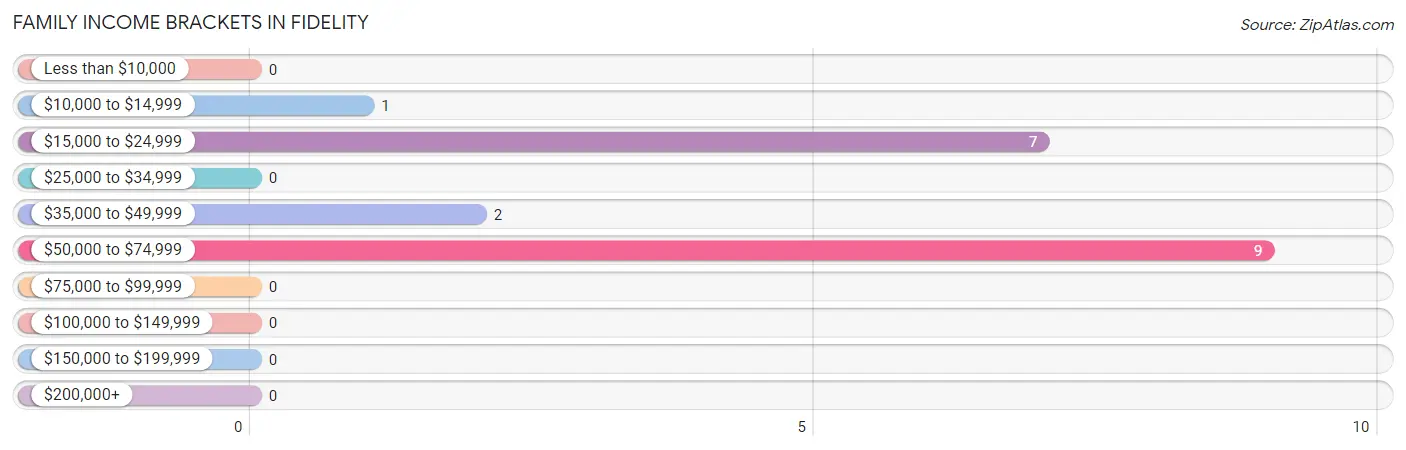
Family Income Brackets in Fidelity
According to the Fidelity family income data, there are 9 families falling into the $50,000 to $74,999 income range, which is the most common income bracket and makes up 47.4% of all families.
| Income Bracket | # Families | % Families |
| Less than $10,000 | 0 | 0.0% |
| $10,000 to $14,999 | 1 | 5.3% |
| $15,000 to $24,999 | 7 | 36.8% |
| $25,000 to $34,999 | 0 | 0.0% |
| $35,000 to $49,999 | 2 | 10.5% |
| $50,000 to $74,999 | 9 | 47.4% |
| $75,000 to $99,999 | 0 | 0.0% |
| $100,000 to $149,999 | 0 | 0.0% |
| $150,000 to $199,999 | 0 | 0.0% |
| $200,000+ | 0 | 0.0% |
Family Income by Famaliy Size in Fidelity
| Income Bracket | # Families | Median Income |
| 2-Person Families | 9 (47.4%) | $0 |
| 3-Person Families | 1 (5.3%) | $0 |
| 4-Person Families | 4 (21.0%) | $0 |
| 5-Person Families | 0 (0.0%) | $0 |
| 6-Person Families | 5 (26.3%) | $0 |
| 7+ Person Families | 0 (0.0%) | $0 |
| Total | 19 (100.0%) | $44,375 |
Family Income by Number of Earners in Fidelity
| Number of Earners | # Families | Median Income |
| No Earners | 10 (52.6%) | $0 |
| 1 Earner | 4 (21.0%) | $0 |
| 2 Earners | 5 (26.3%) | $0 |
| 3+ Earners | 0 (0.0%) | $0 |
| Total | 19 (100.0%) | $44,375 |
Household Income in Fidelity
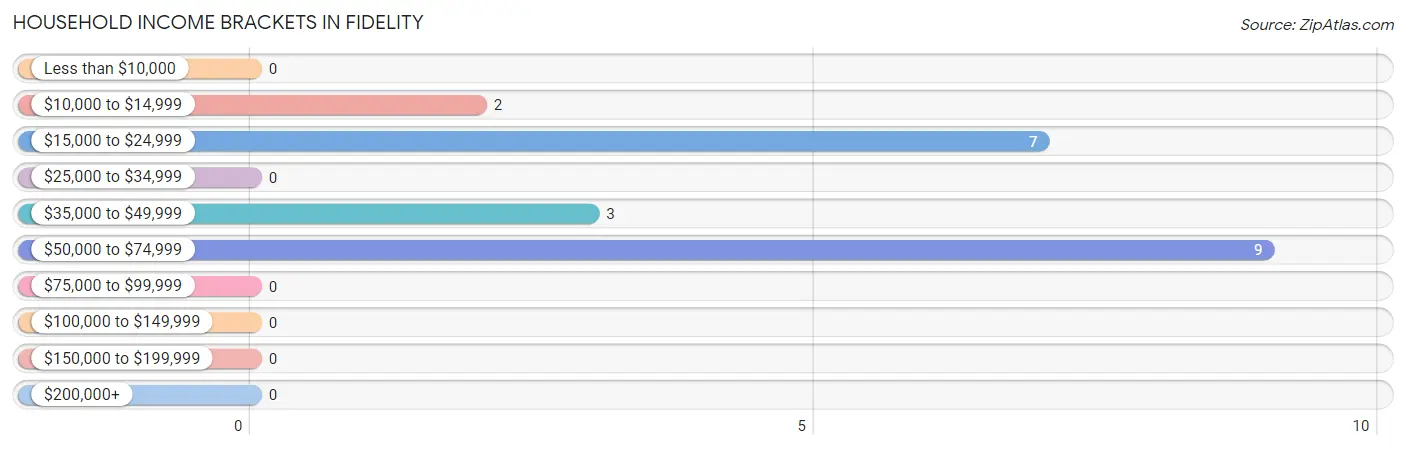
Household Income Brackets in Fidelity
With 9 households falling in the category, the $50,000 to $74,999 income range is the most frequent in Fidelity, accounting for 42.9% of all households.
| Income Bracket | # Households | % Households |
| Less than $10,000 | 0 | 0.0% |
| $10,000 to $14,999 | 2 | 9.5% |
| $15,000 to $24,999 | 7 | 33.3% |
| $25,000 to $34,999 | 0 | 0.0% |
| $35,000 to $49,999 | 3 | 14.3% |
| $50,000 to $74,999 | 9 | 42.9% |
| $75,000 to $99,999 | 0 | 0.0% |
| $100,000 to $149,999 | 0 | 0.0% |
| $150,000 to $199,999 | 0 | 0.0% |
| $200,000+ | 0 | 0.0% |
Household Income by Householder Age in Fidelity
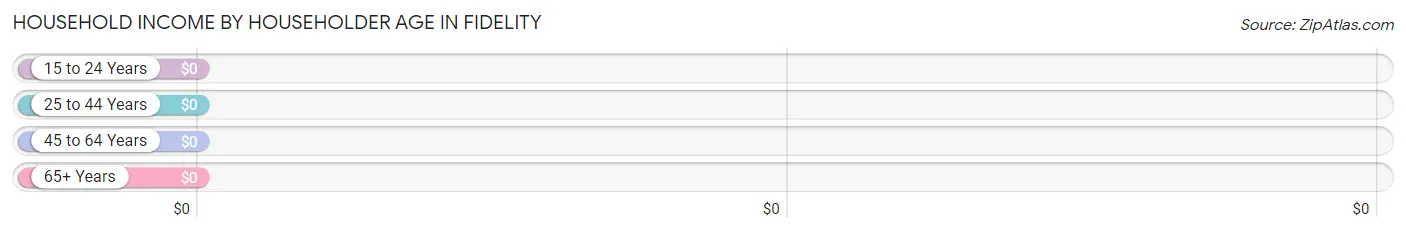
| Income Bracket | # Households | Median Income |
| 15 to 24 Years | 0 (0.0%) | $0 |
| 25 to 44 Years | 5 (23.8%) | $0 |
| 45 to 64 Years | 1 (4.8%) | $0 |
| 65+ Years | 15 (71.4%) | $0 |
| Total | 21 (100.0%) | $43,125 |
Poverty in Fidelity
Income Below Poverty by Sex and Age in Fidelity
With 8.8% poverty level for males and 4.9% for females among the residents of Fidelity, 55 to 64 year old males and 65 to 74 year old females are the most vulnerable to poverty, with 1 males (100.0%) and 1 females (16.7%) in their respective age groups living below the poverty level.
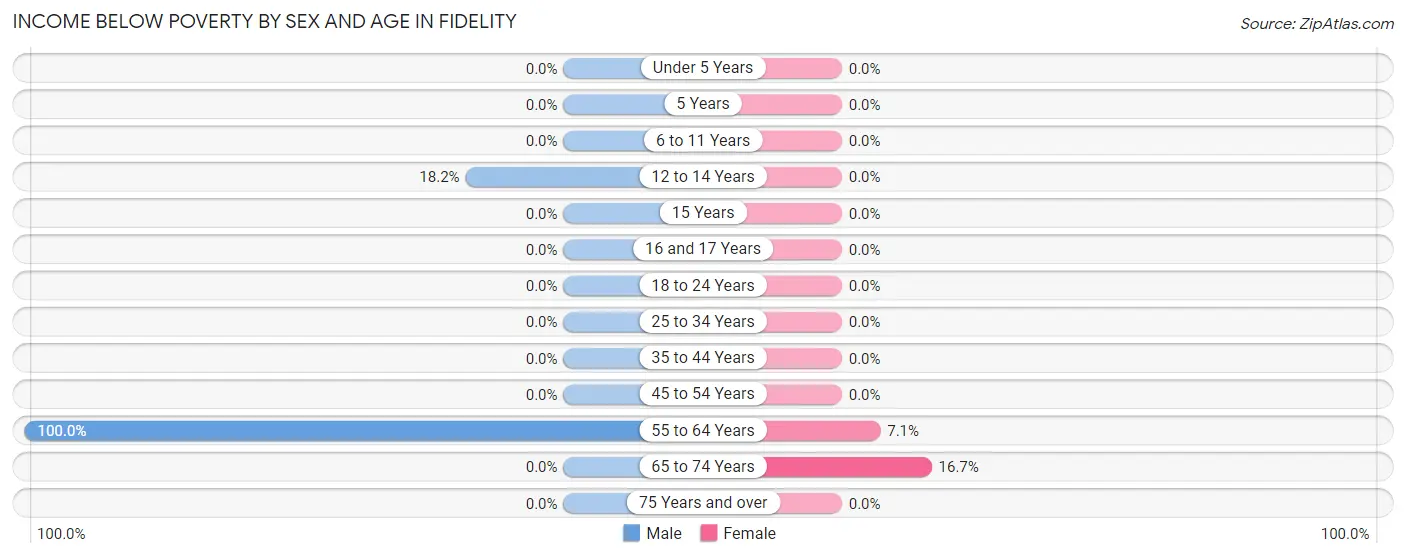
| Age Bracket | Male | Female |
| Under 5 Years | 0 (0.0%) | 0 (0.0%) |
| 5 Years | 0 (0.0%) | 0 (0.0%) |
| 6 to 11 Years | 0 (0.0%) | 0 (0.0%) |
| 12 to 14 Years | 2 (18.2%) | 0 (0.0%) |
| 15 Years | 0 (0.0%) | 0 (0.0%) |
| 16 and 17 Years | 0 (0.0%) | 0 (0.0%) |
| 18 to 24 Years | 0 (0.0%) | 0 (0.0%) |
| 25 to 34 Years | 0 (0.0%) | 0 (0.0%) |
| 35 to 44 Years | 0 (0.0%) | 0 (0.0%) |
| 45 to 54 Years | 0 (0.0%) | 0 (0.0%) |
| 55 to 64 Years | 1 (100.0%) | 1 (7.1%) |
| 65 to 74 Years | 0 (0.0%) | 1 (16.7%) |
| 75 Years and over | 0 (0.0%) | 0 (0.0%) |
| Total | 3 (8.8%) | 2 (4.9%) |
Income Above Poverty by Sex and Age in Fidelity
According to the poverty statistics in Fidelity, males aged 16 and 17 years and females aged 6 to 11 years are the age groups that are most secure financially, with 100.0% of males and 100.0% of females in these age groups living above the poverty line.
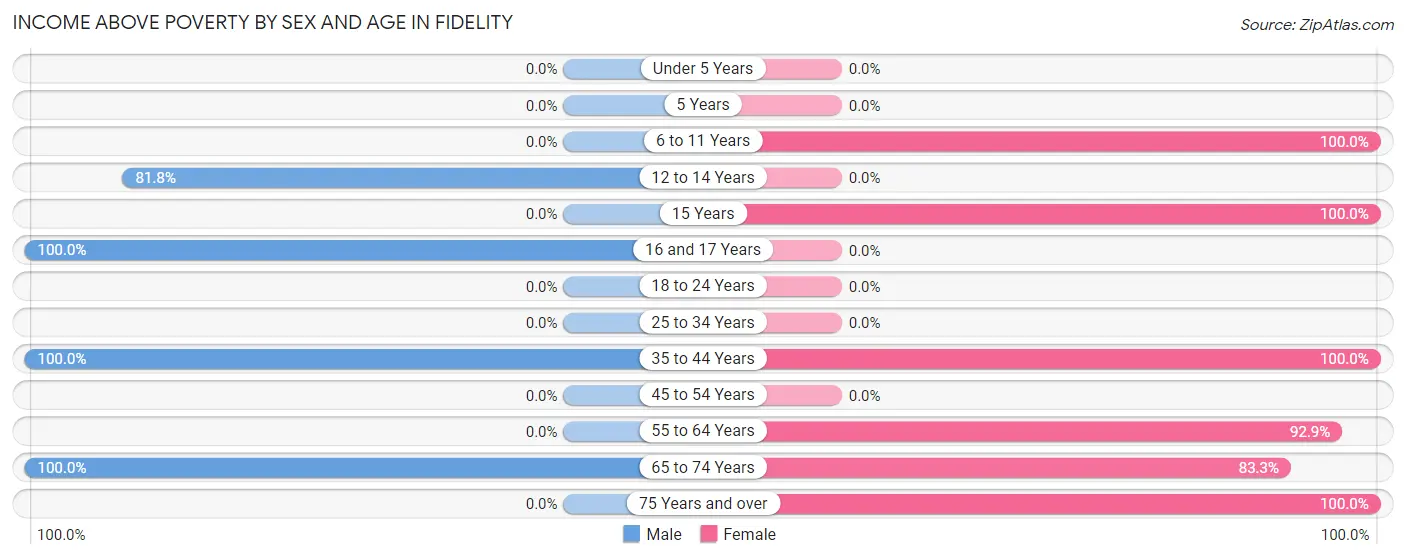
| Age Bracket | Male | Female |
| Under 5 Years | 0 (0.0%) | 0 (0.0%) |
| 5 Years | 0 (0.0%) | 0 (0.0%) |
| 6 to 11 Years | 0 (0.0%) | 7 (100.0%) |
| 12 to 14 Years | 9 (81.8%) | 0 (0.0%) |
| 15 Years | 0 (0.0%) | 8 (100.0%) |
| 16 and 17 Years | 4 (100.0%) | 0 (0.0%) |
| 18 to 24 Years | 0 (0.0%) | 0 (0.0%) |
| 25 to 34 Years | 0 (0.0%) | 0 (0.0%) |
| 35 to 44 Years | 5 (100.0%) | 5 (100.0%) |
| 45 to 54 Years | 0 (0.0%) | 0 (0.0%) |
| 55 to 64 Years | 0 (0.0%) | 13 (92.9%) |
| 65 to 74 Years | 13 (100.0%) | 5 (83.3%) |
| 75 Years and over | 0 (0.0%) | 1 (100.0%) |
| Total | 31 (91.2%) | 39 (95.1%) |
Income Below Poverty Among Married-Couple Families in Fidelity
The poverty statistics for married-couple families in Fidelity show that 5.3% or 1 of the total 19 families live below the poverty line. Families with 1 or 2 children have the highest poverty rate of 20.0%, comprising of 1 families. On the other hand, families with no children have the lowest poverty rate of 0.0%, which includes 0 families.
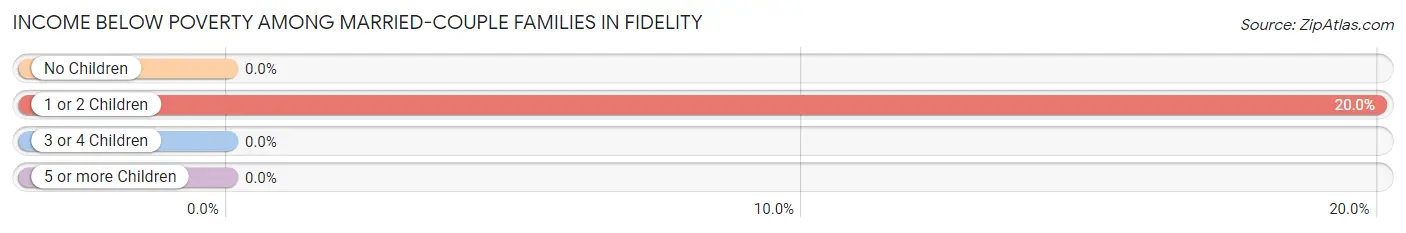
| Children | Above Poverty | Below Poverty |
| No Children | 9 (100.0%) | 0 (0.0%) |
| 1 or 2 Children | 4 (80.0%) | 1 (20.0%) |
| 3 or 4 Children | 5 (100.0%) | 0 (0.0%) |
| 5 or more Children | 0 (0.0%) | 0 (0.0%) |
| Total | 18 (94.7%) | 1 (5.3%) |
Income Below Poverty Among Single-Parent Households in Fidelity
| Children | Single Father | Single Mother |
| No Children | 0 (0.0%) | 0 (0.0%) |
| 1 or 2 Children | 0 (0.0%) | 0 (0.0%) |
| 3 or 4 Children | 0 (0.0%) | 0 (0.0%) |
| 5 or more Children | 0 (0.0%) | 0 (0.0%) |
| Total | 0 (0.0%) | 0 (0.0%) |
Income Below Poverty Among Married-Couple vs Single-Parent Households in Fidelity
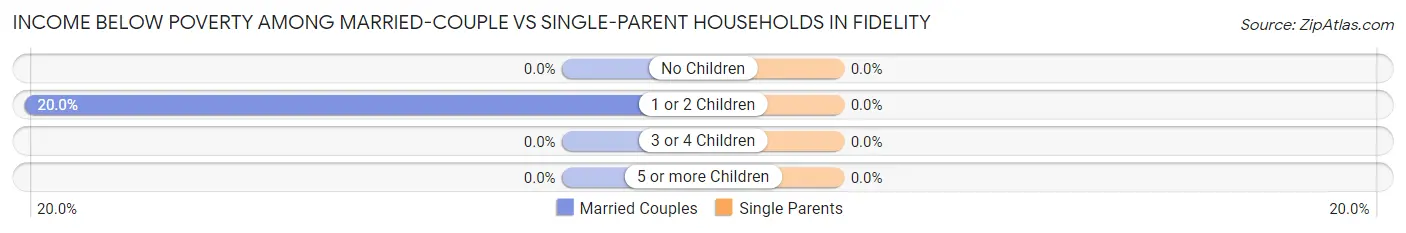
| Children | Married-Couple Families | Single-Parent Households |
| No Children | 0 (0.0%) | 0 (0.0%) |
| 1 or 2 Children | 1 (20.0%) | 0 (0.0%) |
| 3 or 4 Children | 0 (0.0%) | 0 (0.0%) |
| 5 or more Children | 0 (0.0%) | 0 (0.0%) |
| Total | 1 (5.3%) | 0 (0.0%) |
Race in Fidelity
The most populous races in Fidelity are White / Caucasian (62 | 82.7%), and Asian (13 | 17.3%).
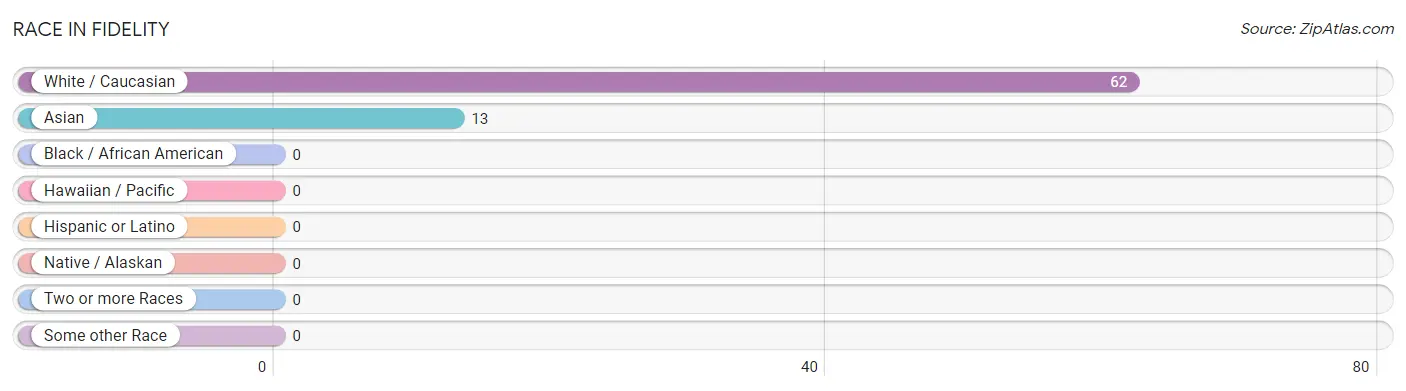
| Race | # Population | % Population |
| Asian | 13 | 17.3% |
| Black / African American | 0 | 0.0% |
| Hawaiian / Pacific | 0 | 0.0% |
| Hispanic or Latino | 0 | 0.0% |
| Native / Alaskan | 0 | 0.0% |
| White / Caucasian | 62 | 82.7% |
| Two or more Races | 0 | 0.0% |
| Some other Race | 0 | 0.0% |
| Total | 75 | 100.0% |
Ancestry in Fidelity
The most populous ancestries reported in Fidelity are Korean (13 | 17.3%), German (2 | 2.7%), American (1 | 1.3%), and English (1 | 1.3%), together accounting for 22.7% of all Fidelity residents.
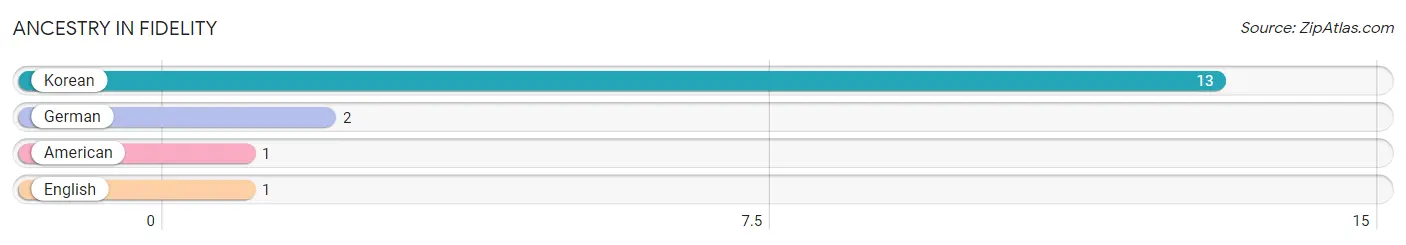
| Ancestry | # Population | % Population |
| American | 1 | 1.3% |
| English | 1 | 1.3% |
| German | 2 | 2.7% |
| Korean | 13 | 17.3% | View All 4 Rows |
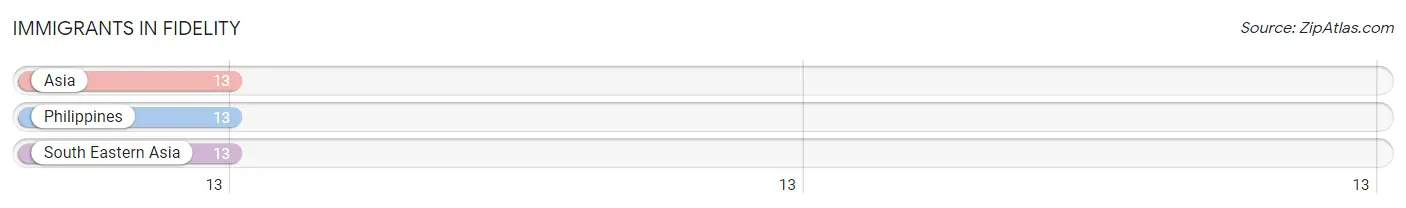
Immigrants in Fidelity
The most numerous immigrant groups reported in Fidelity came from Asia (13 | 17.3%), Philippines (13 | 17.3%), and South Eastern Asia (13 | 17.3%), together accounting for 52.0% of all Fidelity residents.
| Immigration Origin | # Population | % Population |
| Asia | 13 | 17.3% |
| Philippines | 13 | 17.3% |
| South Eastern Asia | 13 | 17.3% | View All 3 Rows |
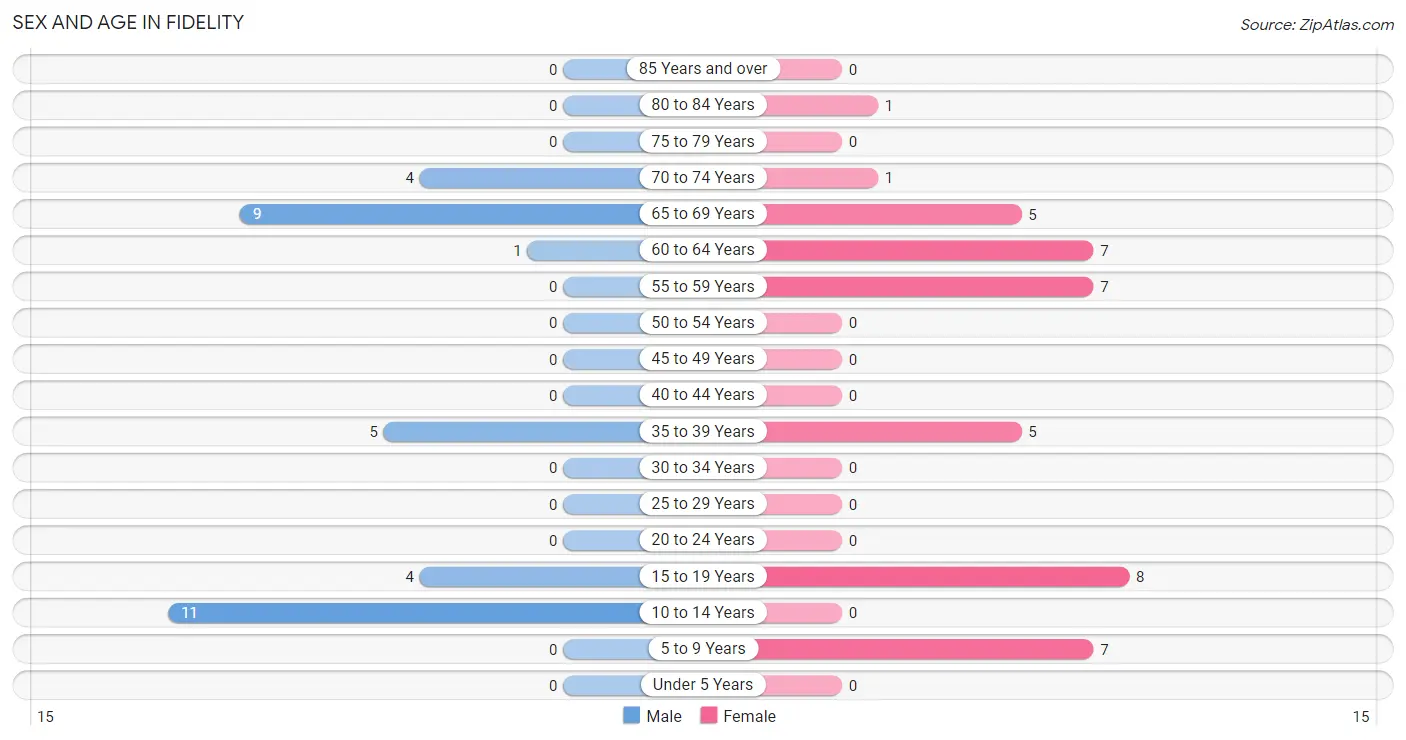
Sex and Age in Fidelity
Sex and Age in Fidelity
The most populous age groups in Fidelity are 10 to 14 Years (11 | 32.4%) for men and 15 to 19 Years (8 | 19.5%) for women.
| Age Bracket | Male | Female |
| Under 5 Years | 0 (0.0%) | 0 (0.0%) |
| 5 to 9 Years | 0 (0.0%) | 7 (17.1%) |
| 10 to 14 Years | 11 (32.4%) | 0 (0.0%) |
| 15 to 19 Years | 4 (11.8%) | 8 (19.5%) |
| 20 to 24 Years | 0 (0.0%) | 0 (0.0%) |
| 25 to 29 Years | 0 (0.0%) | 0 (0.0%) |
| 30 to 34 Years | 0 (0.0%) | 0 (0.0%) |
| 35 to 39 Years | 5 (14.7%) | 5 (12.2%) |
| 40 to 44 Years | 0 (0.0%) | 0 (0.0%) |
| 45 to 49 Years | 0 (0.0%) | 0 (0.0%) |
| 50 to 54 Years | 0 (0.0%) | 0 (0.0%) |
| 55 to 59 Years | 0 (0.0%) | 7 (17.1%) |
| 60 to 64 Years | 1 (2.9%) | 7 (17.1%) |
| 65 to 69 Years | 9 (26.5%) | 5 (12.2%) |
| 70 to 74 Years | 4 (11.8%) | 1 (2.4%) |
| 75 to 79 Years | 0 (0.0%) | 0 (0.0%) |
| 80 to 84 Years | 0 (0.0%) | 1 (2.4%) |
| 85 Years and over | 0 (0.0%) | 0 (0.0%) |
| Total | 34 (100.0%) | 41 (100.0%) |
Families and Households in Fidelity
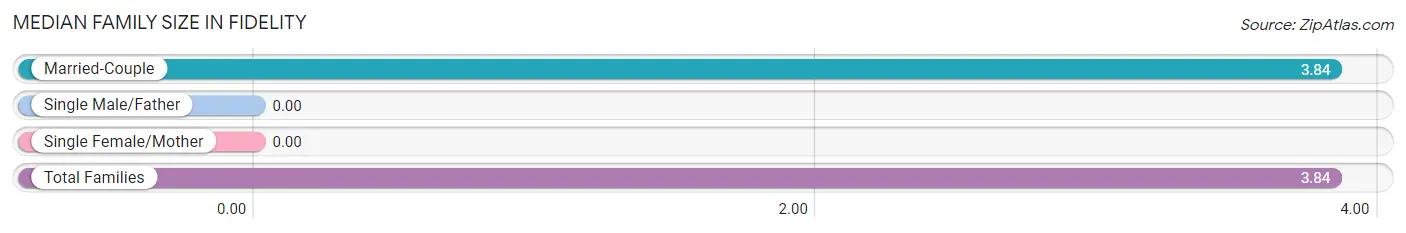
Median Family Size in Fidelity
| Family Type | # Families | Family Size |
| Married-Couple | 19 (100.0%) | 3.84 |
| Single Male/Father | 0 (0.0%) | - |
| Single Female/Mother | 0 (0.0%) | - |
| Total Families | 19 (100.0%) | 3.84 |
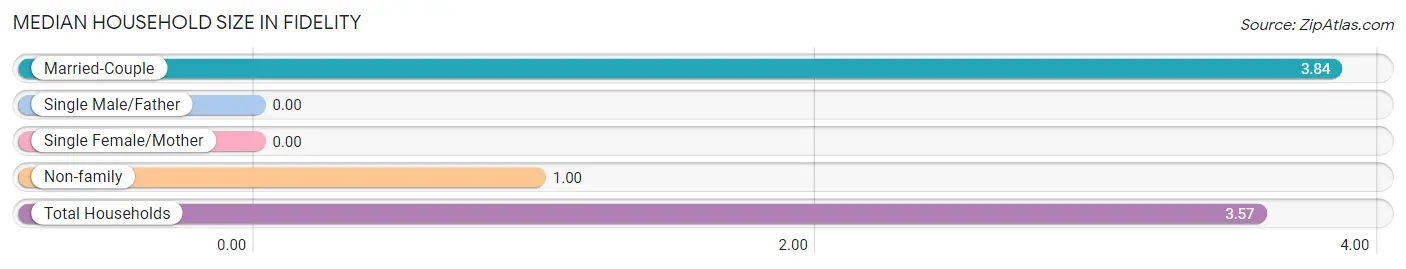
Median Household Size in Fidelity
| Household Type | # Households | Household Size |
| Married-Couple | 19 (90.5%) | 3.84 |
| Single Male/Father | 0 (0.0%) | - |
| Single Female/Mother | 0 (0.0%) | - |
| Non-family | 2 (9.5%) | 1.00 |
| Total Households | 21 (100.0%) | 3.57 |
Household Size by Marriage Status in Fidelity
Out of a total of 21 households in Fidelity, 19 (90.5%) are family households, while 2 (9.5%) are nonfamily households. The most numerous type of family households are 2-person households, comprising 9, and the most common type of nonfamily households are 1-person households, comprising 2.
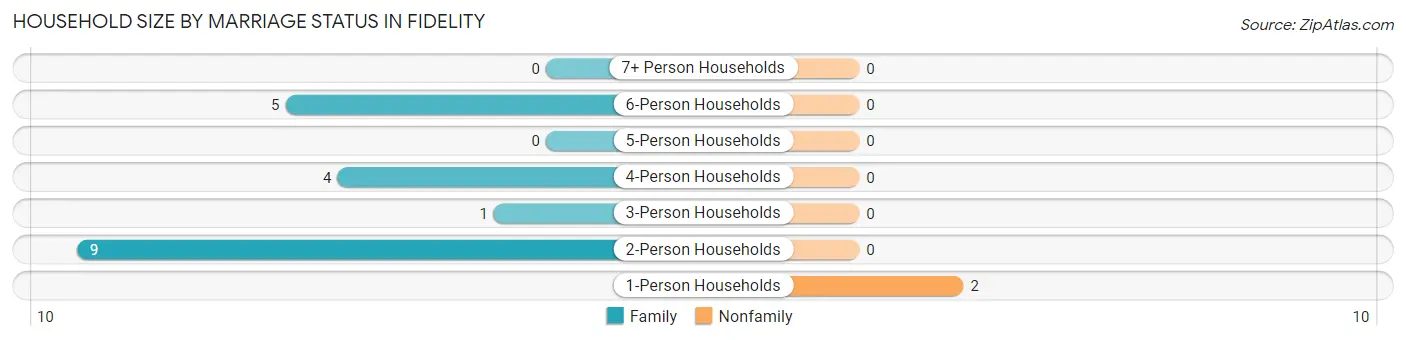
| Household Size | Family Households | Nonfamily Households |
| 1-Person Households | - | 2 (9.5%) |
| 2-Person Households | 9 (42.9%) | 0 (0.0%) |
| 3-Person Households | 1 (4.8%) | 0 (0.0%) |
| 4-Person Households | 4 (19.1%) | 0 (0.0%) |
| 5-Person Households | 0 (0.0%) | 0 (0.0%) |
| 6-Person Households | 5 (23.8%) | 0 (0.0%) |
| 7+ Person Households | 0 (0.0%) | 0 (0.0%) |
| Total | 19 (90.5%) | 2 (9.5%) |
Female Fertility in Fidelity
Fertility by Age in Fidelity
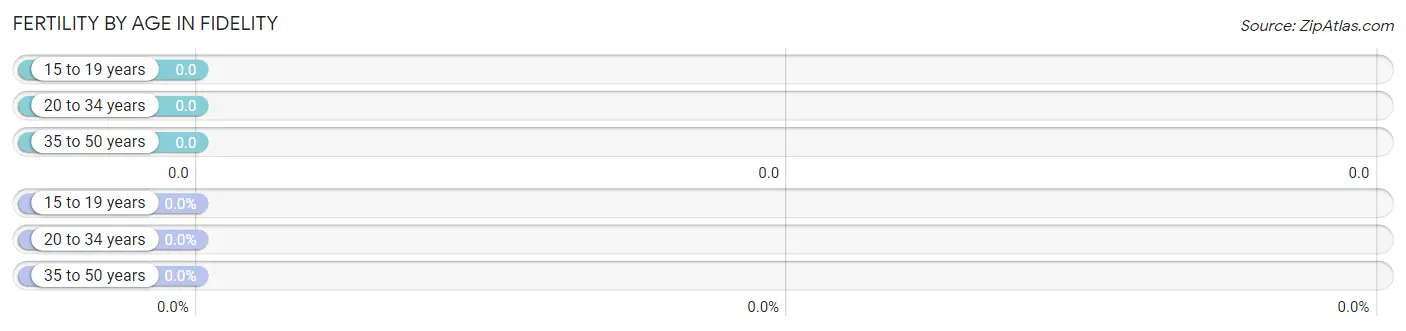
| Age Bracket | Women with Births | Births / 1,000 Women |
| 15 to 19 years | 0 (0.0%) | 0.0 |
| 20 to 34 years | 0 (0.0%) | 0.0 |
| 35 to 50 years | 0 (0.0%) | 0.0 |
| Total | 0 (0.0%) | 0.0 |
Fertility by Age by Marriage Status in Fidelity
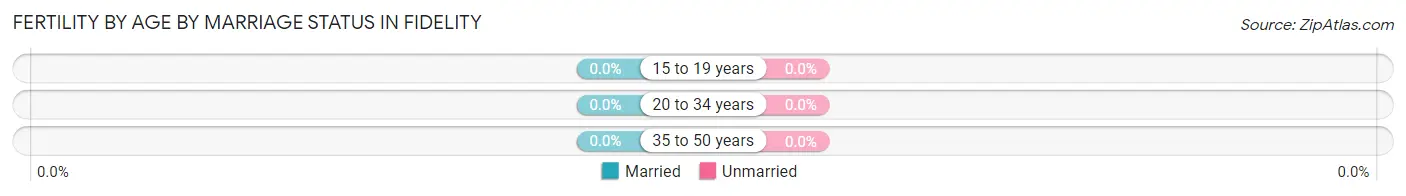
| Age Bracket | Married | Unmarried |
| 15 to 19 years | 0 (0.0%) | 0 (0.0%) |
| 20 to 34 years | 0 (0.0%) | 0 (0.0%) |
| 35 to 50 years | 0 (0.0%) | 0 (0.0%) |
| Total | 0 (0.0%) | 0 (0.0%) |
Fertility by Education in Fidelity
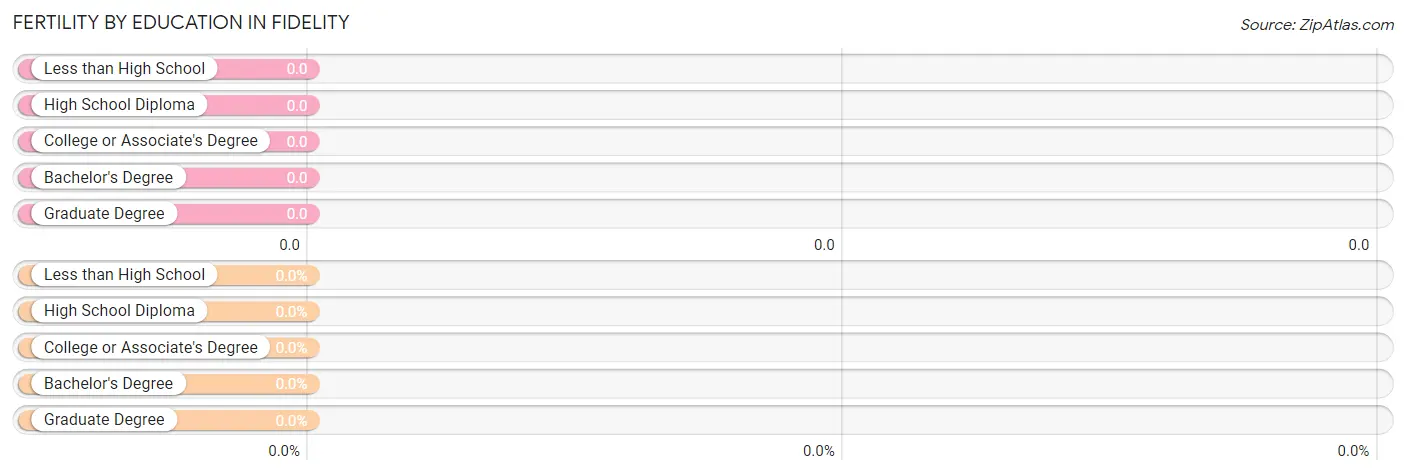
| Educational Attainment | Women with Births | Births / 1,000 Women |
| Less than High School | 0 (0.0%) | 0.0 |
| High School Diploma | 0 (0.0%) | 0.0 |
| College or Associate's Degree | 0 (0.0%) | 0.0 |
| Bachelor's Degree | 0 (0.0%) | 0.0 |
| Graduate Degree | 0 (0.0%) | 0.0 |
| Total | 0 (0.0%) | 0.0 |
Fertility by Education by Marriage Status in Fidelity
| Educational Attainment | Married | Unmarried |
| Less than High School | 0 (0.0%) | 0 (0.0%) |
| High School Diploma | 0 (0.0%) | 0 (0.0%) |
| College or Associate's Degree | 0 (0.0%) | 0 (0.0%) |
| Bachelor's Degree | 0 (0.0%) | 0 (0.0%) |
| Graduate Degree | 0 (0.0%) | 0 (0.0%) |
| Total | 0 (0.0%) | 0 (0.0%) |
Employment Characteristics in Fidelity
Employment by Class of Employer in Fidelity
Among the 13 employed individuals in Fidelity, private company employees (8 | 61.5%), and self-employed (not incorporated) (5 | 38.5%) make up the most common classes of employment.
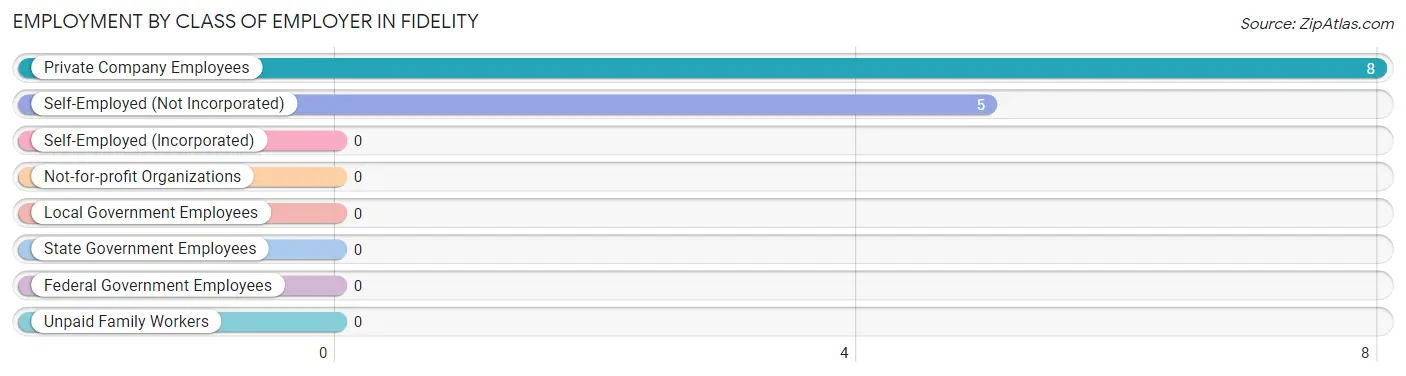
| Employer Class | # Employees | % Employees |
| Private Company Employees | 8 | 61.5% |
| Self-Employed (Incorporated) | 0 | 0.0% |
| Self-Employed (Not Incorporated) | 5 | 38.5% |
| Not-for-profit Organizations | 0 | 0.0% |
| Local Government Employees | 0 | 0.0% |
| State Government Employees | 0 | 0.0% |
| Federal Government Employees | 0 | 0.0% |
| Unpaid Family Workers | 0 | 0.0% |
| Total | 13 | 100.0% |
Employment Status by Age in Fidelity
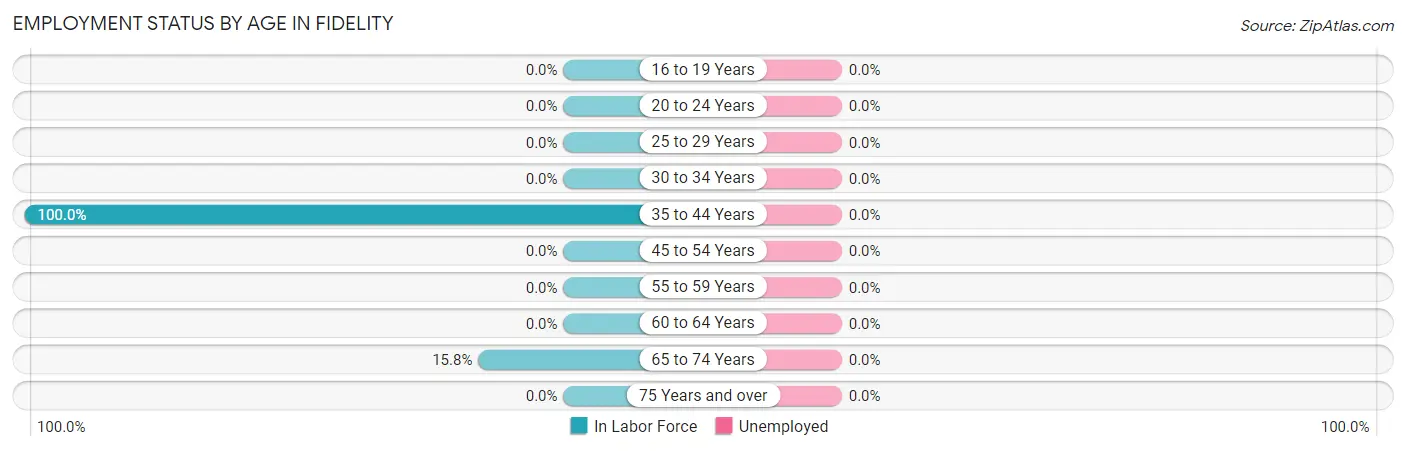
| Age Bracket | In Labor Force | Unemployed |
| 16 to 19 Years | 0 (0.0%) | 0 (0.0%) |
| 20 to 24 Years | 0 (0.0%) | 0 (0.0%) |
| 25 to 29 Years | 0 (0.0%) | 0 (0.0%) |
| 30 to 34 Years | 0 (0.0%) | 0 (0.0%) |
| 35 to 44 Years | 10 (100.0%) | 0 (0.0%) |
| 45 to 54 Years | 0 (0.0%) | 0 (0.0%) |
| 55 to 59 Years | 0 (0.0%) | 0 (0.0%) |
| 60 to 64 Years | 0 (0.0%) | 0 (0.0%) |
| 65 to 74 Years | 3 (15.8%) | 0 (0.0%) |
| 75 Years and over | 0 (0.0%) | 0 (0.0%) |
| Total | 13 (26.5%) | 0 (0.0%) |
Employment Status by Educational Attainment in Fidelity
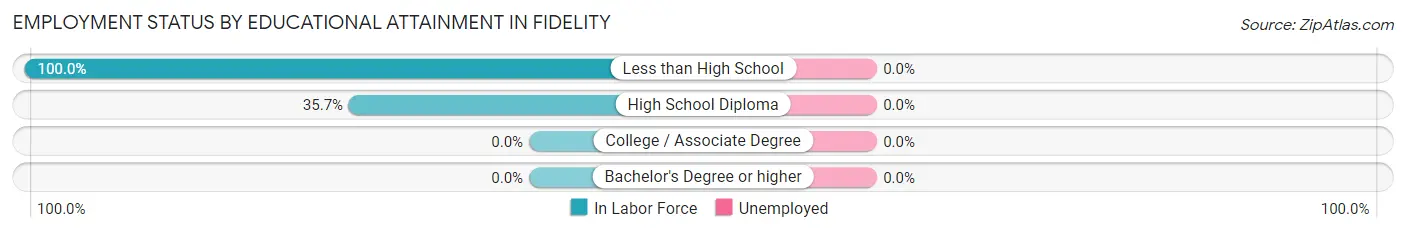
| Educational Attainment | In Labor Force | Unemployed |
| Less than High School | 5 (100.0%) | 0 (0.0%) |
| High School Diploma | 5 (35.7%) | 0 (0.0%) |
| College / Associate Degree | 0 (0.0%) | 0 (0.0%) |
| Bachelor's Degree or higher | 0 (0.0%) | 0 (0.0%) |
| Total | 10 (40.0%) | 0 (0.0%) |
Employment Occupations by Sex in Fidelity
Management, Business, Science and Arts Occupations
Management, Business, Science and Arts Occupations by Sex
| Occupation | Male | Female |
| Management | 0 (0.0%) | 0 (0.0%) |
| Business & Financial | 0 (0.0%) | 0 (0.0%) |
| Computers, Engineering & Science | 0 (0.0%) | 0 (0.0%) |
| Computers & Mathematics | 0 (0.0%) | 0 (0.0%) |
| Architecture & Engineering | 0 (0.0%) | 0 (0.0%) |
| Life, Physical & Social Science | 0 (0.0%) | 0 (0.0%) |
| Community & Social Service | 0 (0.0%) | 0 (0.0%) |
| Education, Arts & Media | 0 (0.0%) | 0 (0.0%) |
| Legal Services & Support | 0 (0.0%) | 0 (0.0%) |
| Education Instruction & Library | 0 (0.0%) | 0 (0.0%) |
| Arts, Media & Entertainment | 0 (0.0%) | 0 (0.0%) |
| Health Diagnosing & Treating | 0 (0.0%) | 0 (0.0%) |
| Health Technologists | 0 (0.0%) | 0 (0.0%) |
| Total (Category) | 0 (0.0%) | 0 (0.0%) |
| Total (Overall) | 5 (38.5%) | 8 (61.5%) |
Services Occupations
The most common Services occupations in Fidelity are , and Cleaning & Maintenance (5 | 38.5%).
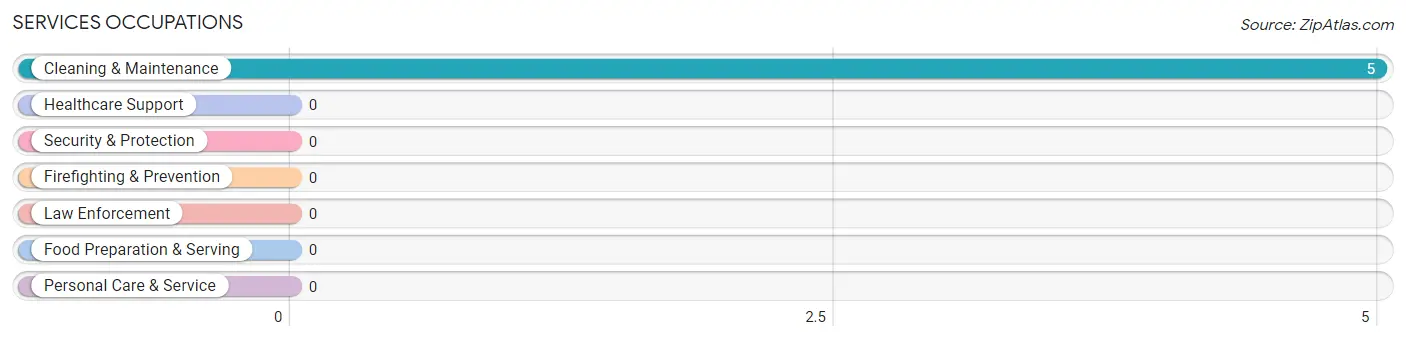
Services Occupations by Sex
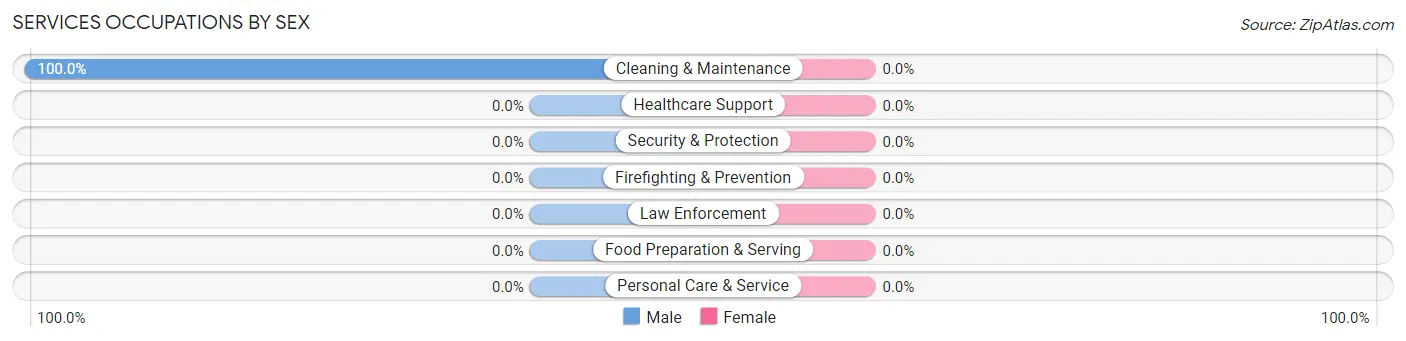
| Occupation | Male | Female |
| Healthcare Support | 0 (0.0%) | 0 (0.0%) |
| Security & Protection | 0 (0.0%) | 0 (0.0%) |
| Firefighting & Prevention | 0 (0.0%) | 0 (0.0%) |
| Law Enforcement | 0 (0.0%) | 0 (0.0%) |
| Food Preparation & Serving | 0 (0.0%) | 0 (0.0%) |
| Cleaning & Maintenance | 5 (100.0%) | 0 (0.0%) |
| Personal Care & Service | 0 (0.0%) | 0 (0.0%) |
| Total (Category) | 5 (100.0%) | 0 (0.0%) |
| Total (Overall) | 5 (38.5%) | 8 (61.5%) |
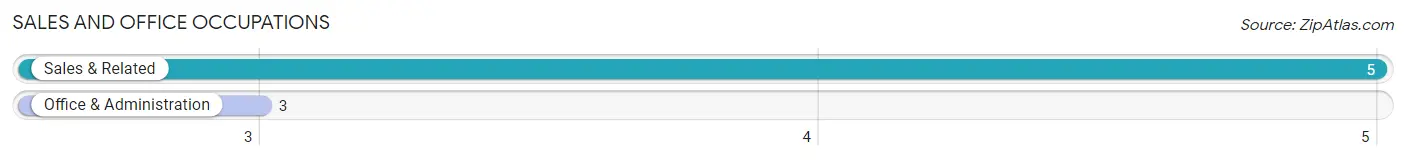
Sales and Office Occupations
The most common Sales and Office occupations in Fidelity are Sales & Related (5 | 38.5%), and Office & Administration (3 | 23.1%).
Sales and Office Occupations by Sex

| Occupation | Male | Female |
| Sales & Related | 0 (0.0%) | 5 (100.0%) |
| Office & Administration | 0 (0.0%) | 3 (100.0%) |
| Total (Category) | 0 (0.0%) | 8 (100.0%) |
| Total (Overall) | 5 (38.5%) | 8 (61.5%) |
Natural Resources, Construction and Maintenance Occupations
Natural Resources, Construction and Maintenance Occupations by Sex
| Occupation | Male | Female |
| Farming, Fishing & Forestry | 0 (0.0%) | 0 (0.0%) |
| Construction & Extraction | 0 (0.0%) | 0 (0.0%) |
| Installation, Maintenance & Repair | 0 (0.0%) | 0 (0.0%) |
| Total (Category) | 0 (0.0%) | 0 (0.0%) |
| Total (Overall) | 5 (38.5%) | 8 (61.5%) |
Production, Transportation and Moving Occupations
Production, Transportation and Moving Occupations by Sex
| Occupation | Male | Female |
| Production | 0 (0.0%) | 0 (0.0%) |
| Transportation | 0 (0.0%) | 0 (0.0%) |
| Material Moving | 0 (0.0%) | 0 (0.0%) |
| Total (Category) | 0 (0.0%) | 0 (0.0%) |
| Total (Overall) | 5 (38.5%) | 8 (61.5%) |
Employment Industries by Sex in Fidelity
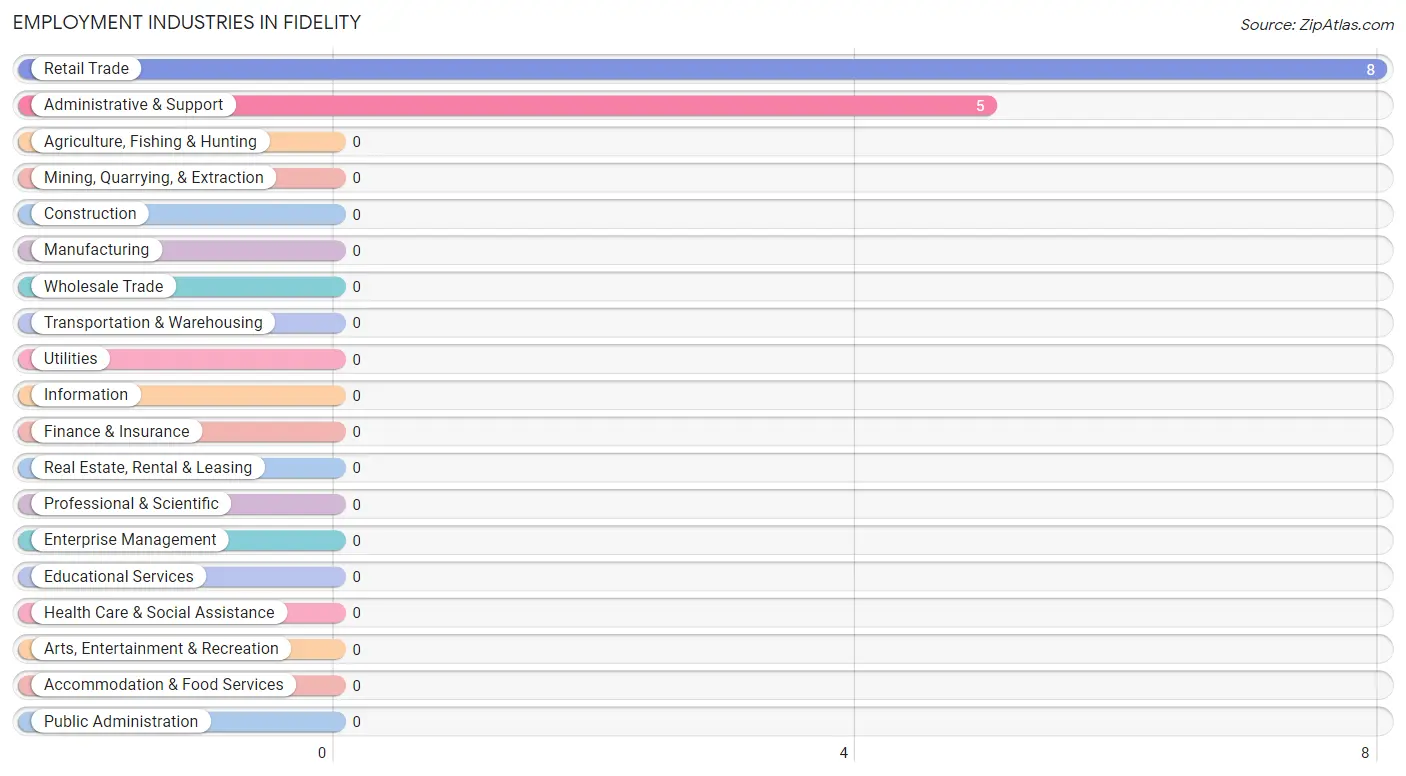
Employment Industries in Fidelity
The major employment industries in Fidelity include Retail Trade (8 | 61.5%), and Administrative & Support (5 | 38.5%).
Employment Industries by Sex in Fidelity
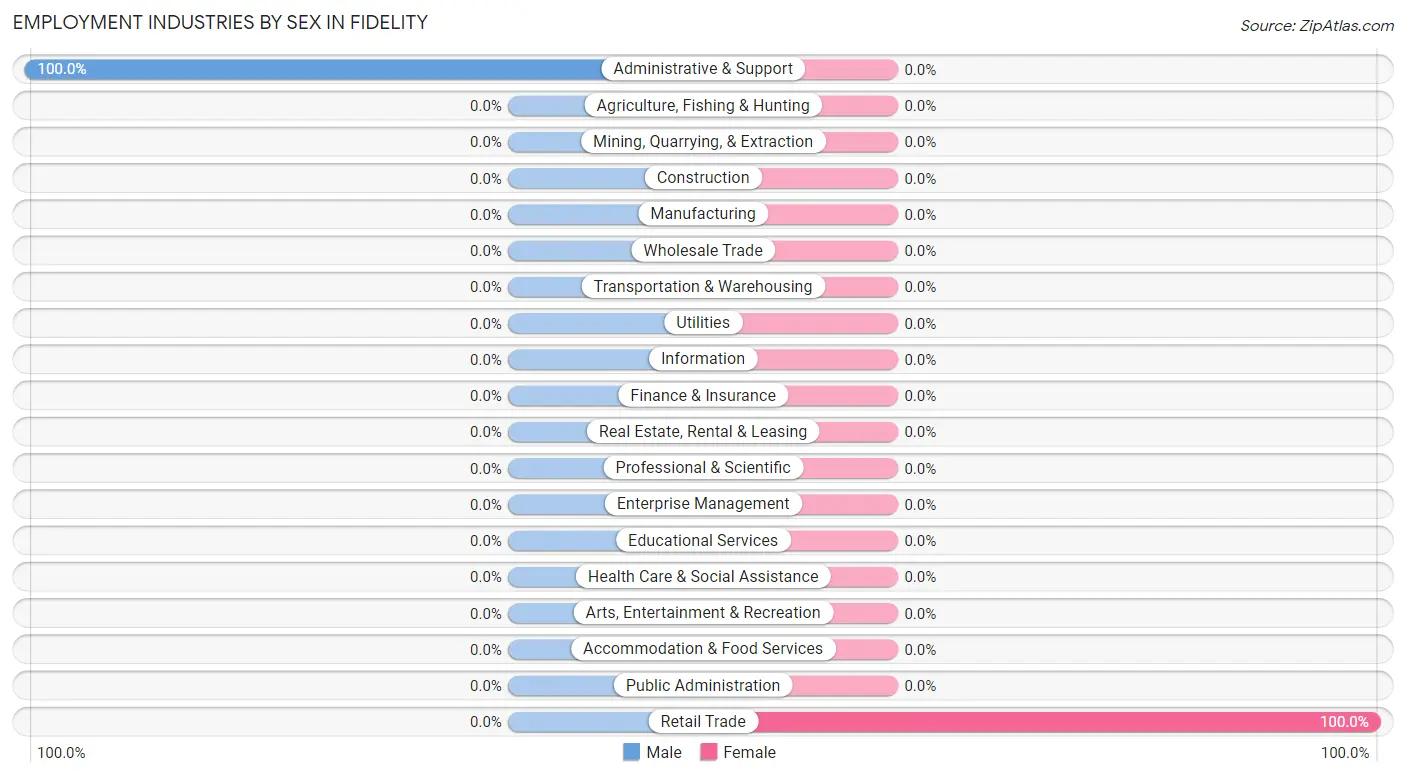
| Industry | Male | Female |
| Agriculture, Fishing & Hunting | 0 (0.0%) | 0 (0.0%) |
| Mining, Quarrying, & Extraction | 0 (0.0%) | 0 (0.0%) |
| Construction | 0 (0.0%) | 0 (0.0%) |
| Manufacturing | 0 (0.0%) | 0 (0.0%) |
| Wholesale Trade | 0 (0.0%) | 0 (0.0%) |
| Retail Trade | 0 (0.0%) | 8 (100.0%) |
| Transportation & Warehousing | 0 (0.0%) | 0 (0.0%) |
| Utilities | 0 (0.0%) | 0 (0.0%) |
| Information | 0 (0.0%) | 0 (0.0%) |
| Finance & Insurance | 0 (0.0%) | 0 (0.0%) |
| Real Estate, Rental & Leasing | 0 (0.0%) | 0 (0.0%) |
| Professional & Scientific | 0 (0.0%) | 0 (0.0%) |
| Enterprise Management | 0 (0.0%) | 0 (0.0%) |
| Administrative & Support | 5 (100.0%) | 0 (0.0%) |
| Educational Services | 0 (0.0%) | 0 (0.0%) |
| Health Care & Social Assistance | 0 (0.0%) | 0 (0.0%) |
| Arts, Entertainment & Recreation | 0 (0.0%) | 0 (0.0%) |
| Accommodation & Food Services | 0 (0.0%) | 0 (0.0%) |
| Public Administration | 0 (0.0%) | 0 (0.0%) |
| Total | 5 (38.5%) | 8 (61.5%) |
Education in Fidelity
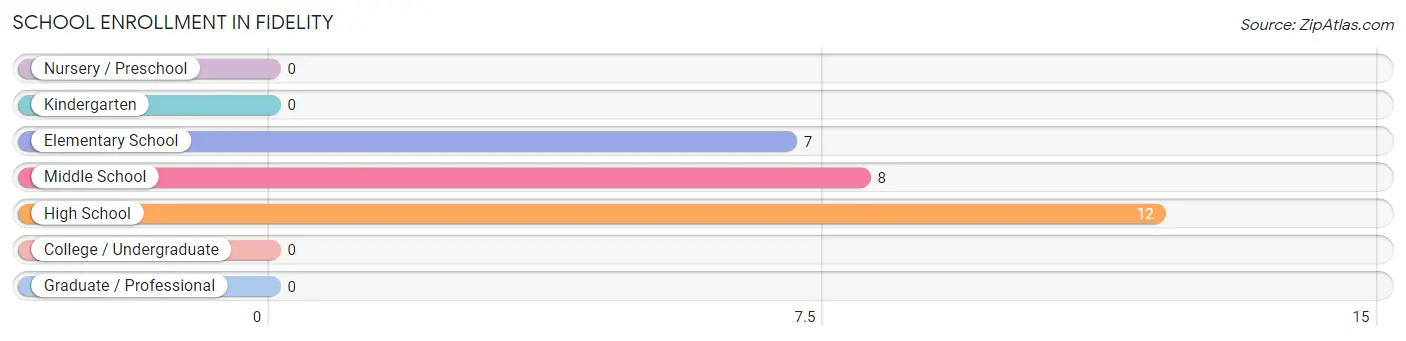
School Enrollment in Fidelity
The most common levels of schooling among the 27 students in Fidelity are high school (12 | 44.4%), middle school (8 | 29.6%), and elementary school (7 | 25.9%).
| School Level | # Students | % Students |
| Nursery / Preschool | 0 | 0.0% |
| Kindergarten | 0 | 0.0% |
| Elementary School | 7 | 25.9% |
| Middle School | 8 | 29.6% |
| High School | 12 | 44.4% |
| College / Undergraduate | 0 | 0.0% |
| Graduate / Professional | 0 | 0.0% |
| Total | 27 | 100.0% |
School Enrollment by Age by Funding Source in Fidelity
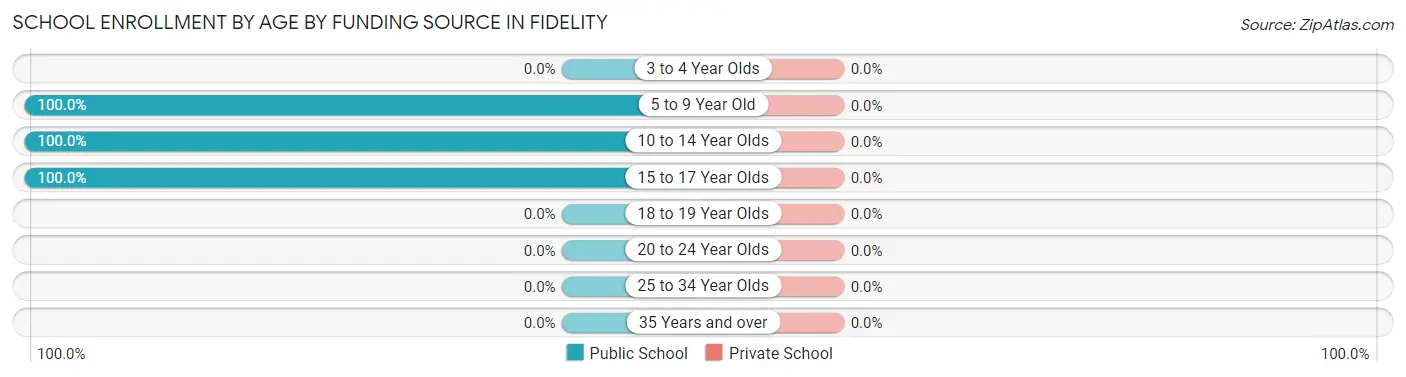
| Age Bracket | Public School | Private School |
| 3 to 4 Year Olds | 0 (0.0%) | 0 (0.0%) |
| 5 to 9 Year Old | 7 (100.0%) | 0 (0.0%) |
| 10 to 14 Year Olds | 8 (100.0%) | 0 (0.0%) |
| 15 to 17 Year Olds | 12 (100.0%) | 0 (0.0%) |
| 18 to 19 Year Olds | 0 (0.0%) | 0 (0.0%) |
| 20 to 24 Year Olds | 0 (0.0%) | 0 (0.0%) |
| 25 to 34 Year Olds | 0 (0.0%) | 0 (0.0%) |
| 35 Years and over | 0 (0.0%) | 0 (0.0%) |
| Total | 27 (100.0%) | 0 (0.0%) |
Educational Attainment by Field of Study in Fidelity
, and social sciences (7 | 100.0%) are the most common fields of study among 7 individuals in Fidelity who have obtained a bachelor's degree or higher.
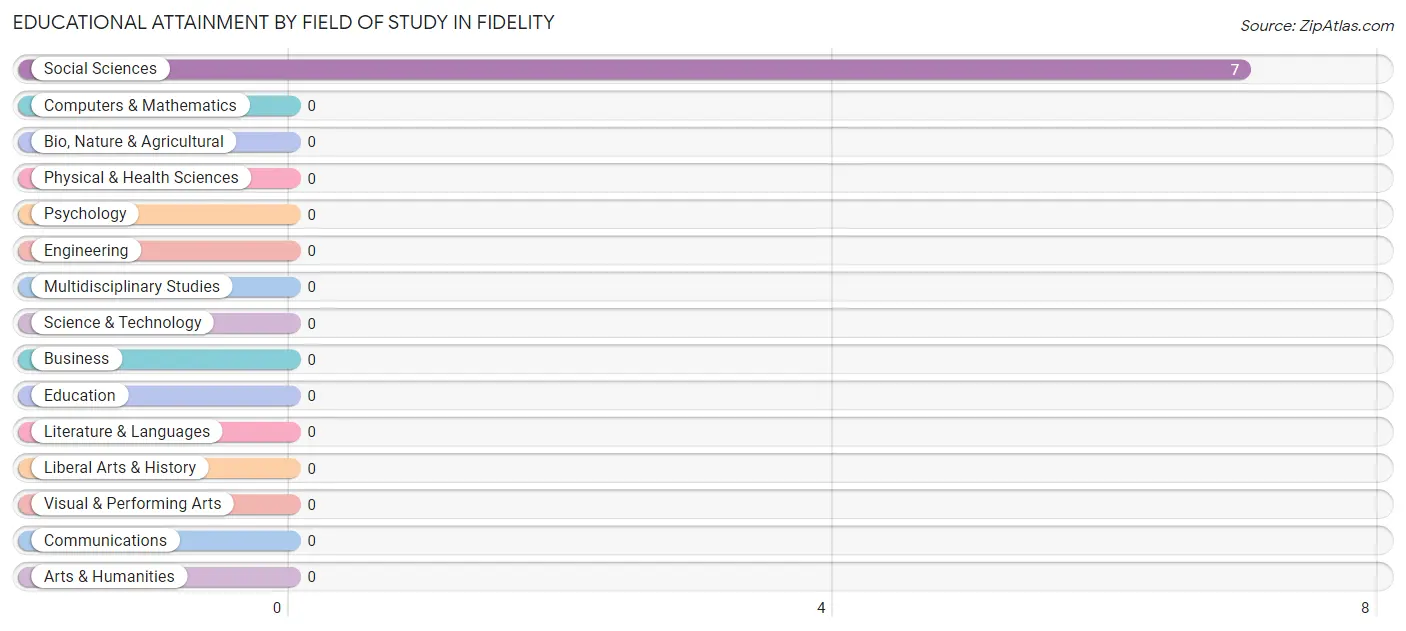
| Field of Study | # Graduates | % Graduates |
| Computers & Mathematics | 0 | 0.0% |
| Bio, Nature & Agricultural | 0 | 0.0% |
| Physical & Health Sciences | 0 | 0.0% |
| Psychology | 0 | 0.0% |
| Social Sciences | 7 | 100.0% |
| Engineering | 0 | 0.0% |
| Multidisciplinary Studies | 0 | 0.0% |
| Science & Technology | 0 | 0.0% |
| Business | 0 | 0.0% |
| Education | 0 | 0.0% |
| Literature & Languages | 0 | 0.0% |
| Liberal Arts & History | 0 | 0.0% |
| Visual & Performing Arts | 0 | 0.0% |
| Communications | 0 | 0.0% |
| Arts & Humanities | 0 | 0.0% |
| Total | 7 | 100.0% |
Transportation & Commute in Fidelity
Vehicle Availability by Sex in Fidelity
The most prevalent vehicle ownership categories in Fidelity are males with 3 vehicles (5, accounting for 100.0%) and females with 3 vehicles (5, making up 62.5%).
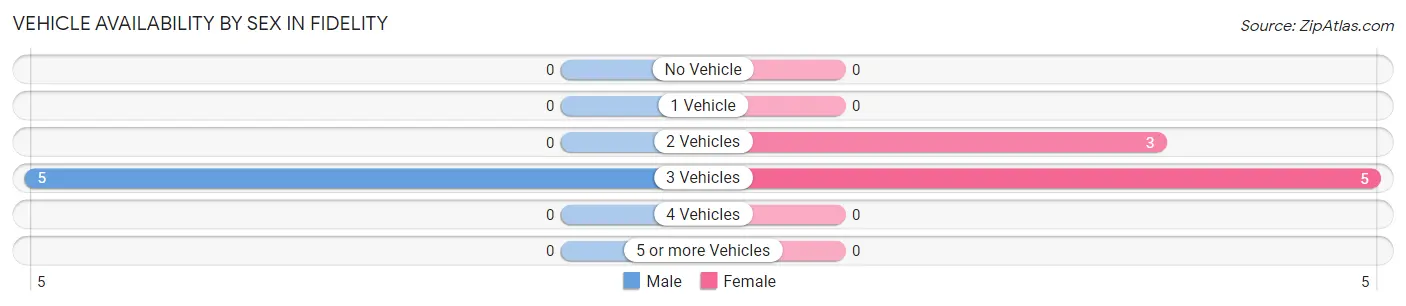
| Vehicles Available | Male | Female |
| No Vehicle | 0 (0.0%) | 0 (0.0%) |
| 1 Vehicle | 0 (0.0%) | 0 (0.0%) |
| 2 Vehicles | 0 (0.0%) | 3 (37.5%) |
| 3 Vehicles | 5 (100.0%) | 5 (62.5%) |
| 4 Vehicles | 0 (0.0%) | 0 (0.0%) |
| 5 or more Vehicles | 0 (0.0%) | 0 (0.0%) |
| Total | 5 (100.0%) | 8 (100.0%) |
Commute Time in Fidelity
The most frequently occuring commute durations in Fidelity are less than 5 minutes (5 commuters, 38.5%), 30 to 34 minutes (5 commuters, 38.5%), and 15 to 19 minutes (3 commuters, 23.1%).
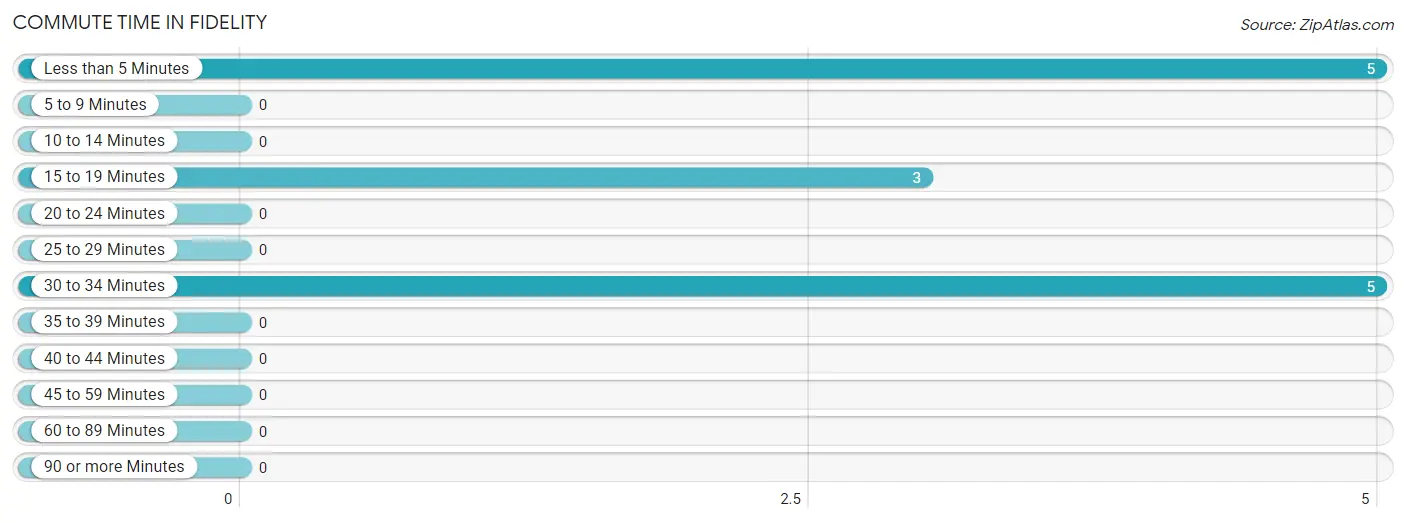
| Commute Time | # Commuters | % Commuters |
| Less than 5 Minutes | 5 | 38.5% |
| 5 to 9 Minutes | 0 | 0.0% |
| 10 to 14 Minutes | 0 | 0.0% |
| 15 to 19 Minutes | 3 | 23.1% |
| 20 to 24 Minutes | 0 | 0.0% |
| 25 to 29 Minutes | 0 | 0.0% |
| 30 to 34 Minutes | 5 | 38.5% |
| 35 to 39 Minutes | 0 | 0.0% |
| 40 to 44 Minutes | 0 | 0.0% |
| 45 to 59 Minutes | 0 | 0.0% |
| 60 to 89 Minutes | 0 | 0.0% |
| 90 or more Minutes | 0 | 0.0% |
Commute Time by Sex in Fidelity
The most common commute times in Fidelity are 30 to 34 minutes (5 commuters, 100.0%) for males and less than 5 minutes (5 commuters, 62.5%) for females.
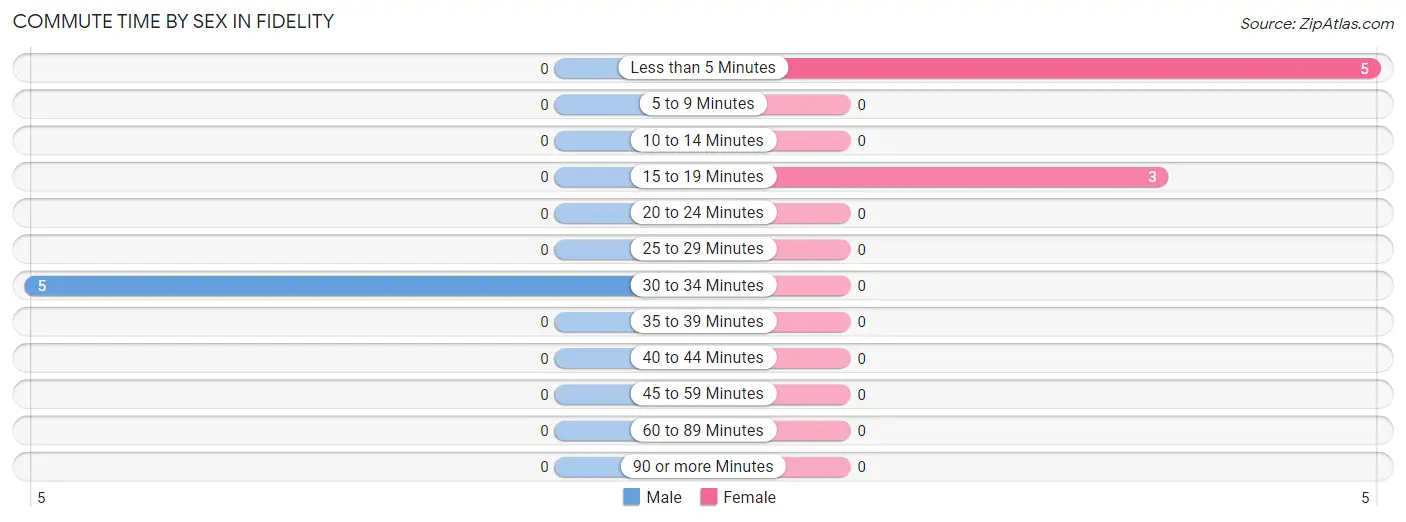
| Commute Time | Male | Female |
| Less than 5 Minutes | 0 (0.0%) | 5 (62.5%) |
| 5 to 9 Minutes | 0 (0.0%) | 0 (0.0%) |
| 10 to 14 Minutes | 0 (0.0%) | 0 (0.0%) |
| 15 to 19 Minutes | 0 (0.0%) | 3 (37.5%) |
| 20 to 24 Minutes | 0 (0.0%) | 0 (0.0%) |
| 25 to 29 Minutes | 0 (0.0%) | 0 (0.0%) |
| 30 to 34 Minutes | 5 (100.0%) | 0 (0.0%) |
| 35 to 39 Minutes | 0 (0.0%) | 0 (0.0%) |
| 40 to 44 Minutes | 0 (0.0%) | 0 (0.0%) |
| 45 to 59 Minutes | 0 (0.0%) | 0 (0.0%) |
| 60 to 89 Minutes | 0 (0.0%) | 0 (0.0%) |
| 90 or more Minutes | 0 (0.0%) | 0 (0.0%) |
Time of Departure to Work by Sex in Fidelity
The most frequent times of departure to work in Fidelity are 10:00 AM to 10:59 AM (5, 100.0%) for males and 9:00 AM to 9:59 AM (8, 100.0%) for females.
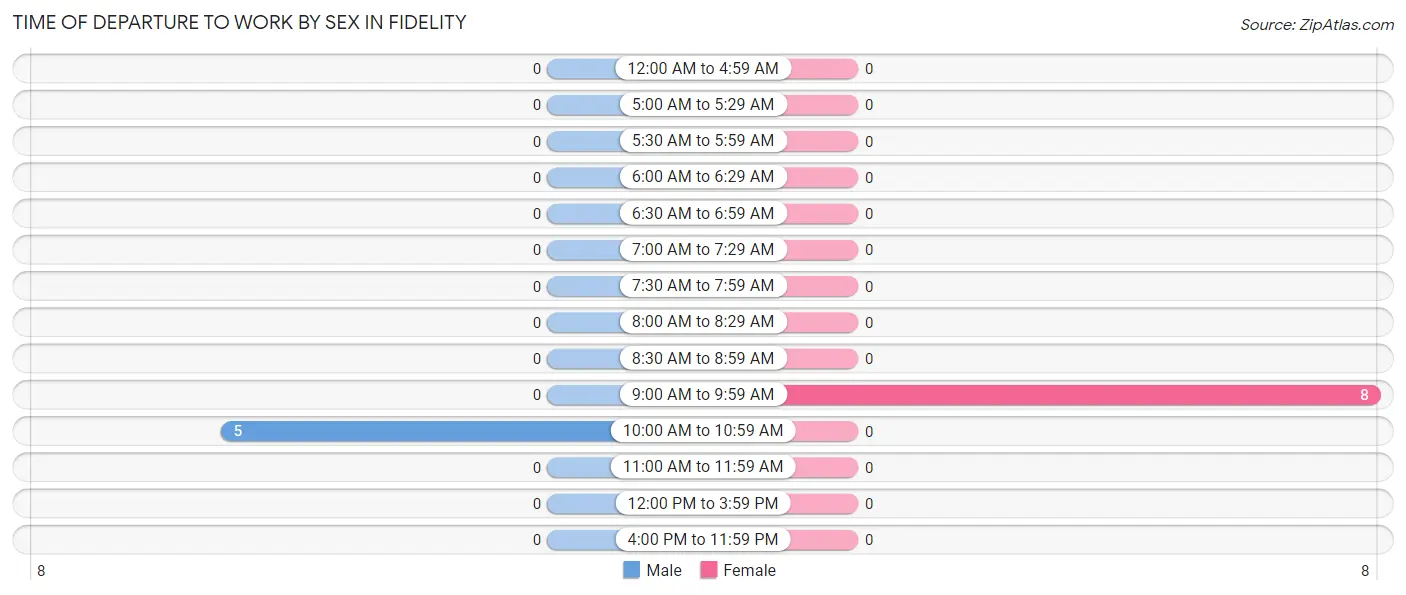
| Time of Departure | Male | Female |
| 12:00 AM to 4:59 AM | 0 (0.0%) | 0 (0.0%) |
| 5:00 AM to 5:29 AM | 0 (0.0%) | 0 (0.0%) |
| 5:30 AM to 5:59 AM | 0 (0.0%) | 0 (0.0%) |
| 6:00 AM to 6:29 AM | 0 (0.0%) | 0 (0.0%) |
| 6:30 AM to 6:59 AM | 0 (0.0%) | 0 (0.0%) |
| 7:00 AM to 7:29 AM | 0 (0.0%) | 0 (0.0%) |
| 7:30 AM to 7:59 AM | 0 (0.0%) | 0 (0.0%) |
| 8:00 AM to 8:29 AM | 0 (0.0%) | 0 (0.0%) |
| 8:30 AM to 8:59 AM | 0 (0.0%) | 0 (0.0%) |
| 9:00 AM to 9:59 AM | 0 (0.0%) | 8 (100.0%) |
| 10:00 AM to 10:59 AM | 5 (100.0%) | 0 (0.0%) |
| 11:00 AM to 11:59 AM | 0 (0.0%) | 0 (0.0%) |
| 12:00 PM to 3:59 PM | 0 (0.0%) | 0 (0.0%) |
| 4:00 PM to 11:59 PM | 0 (0.0%) | 0 (0.0%) |
| Total | 5 (100.0%) | 8 (100.0%) |
Housing Occupancy in Fidelity
Occupancy by Ownership in Fidelity
Of the total 21 dwellings in Fidelity, owner-occupied units account for 14 (66.7%), while renter-occupied units make up 7 (33.3%).
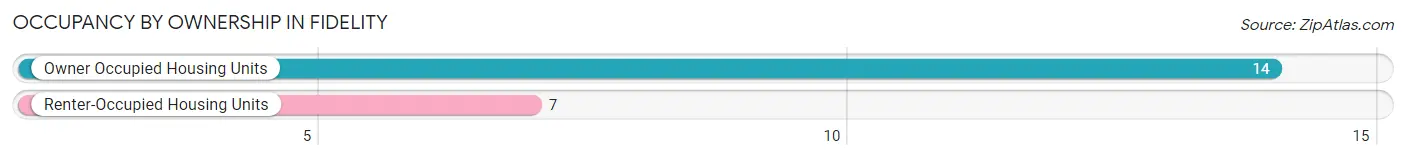
| Occupancy | # Housing Units | % Housing Units |
| Owner Occupied Housing Units | 14 | 66.7% |
| Renter-Occupied Housing Units | 7 | 33.3% |
| Total Occupied Housing Units | 21 | 100.0% |
Occupancy by Household Size in Fidelity
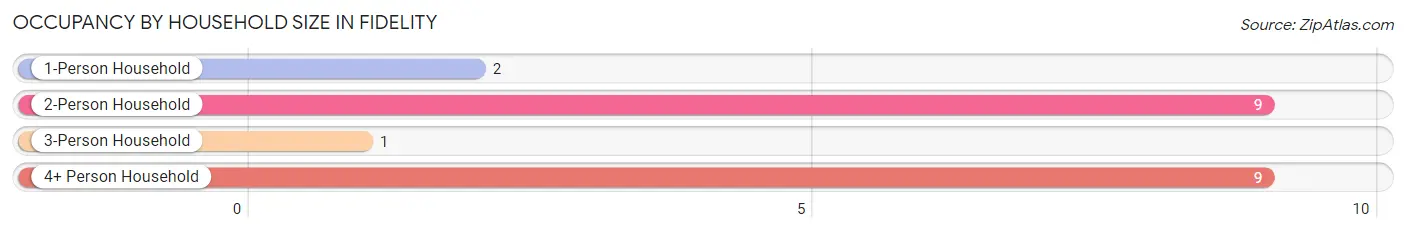
| Household Size | # Housing Units | % Housing Units |
| 1-Person Household | 2 | 9.5% |
| 2-Person Household | 9 | 42.9% |
| 3-Person Household | 1 | 4.8% |
| 4+ Person Household | 9 | 42.9% |
| Total Housing Units | 21 | 100.0% |
Occupancy by Ownership by Household Size in Fidelity
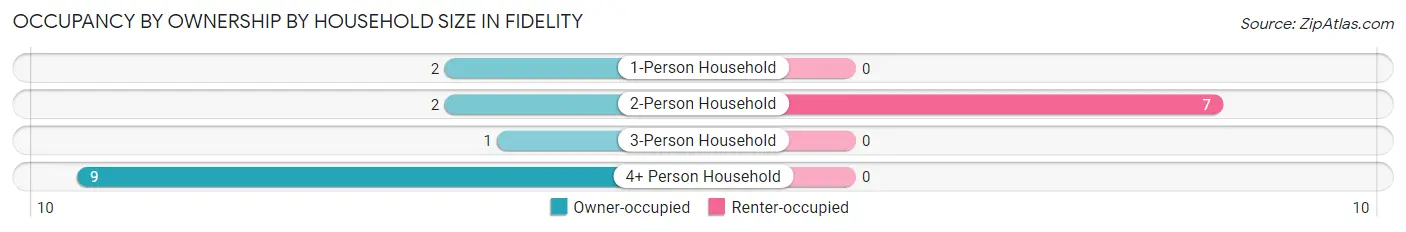
| Household Size | Owner-occupied | Renter-occupied |
| 1-Person Household | 2 (100.0%) | 0 (0.0%) |
| 2-Person Household | 2 (22.2%) | 7 (77.8%) |
| 3-Person Household | 1 (100.0%) | 0 (0.0%) |
| 4+ Person Household | 9 (100.0%) | 0 (0.0%) |
| Total Housing Units | 14 (66.7%) | 7 (33.3%) |
Occupancy by Educational Attainment in Fidelity
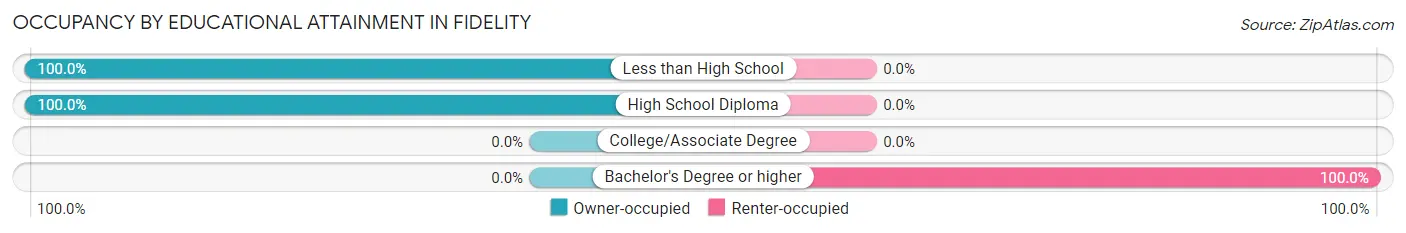
| Household Size | Owner-occupied | Renter-occupied |
| Less than High School | 4 (100.0%) | 0 (0.0%) |
| High School Diploma | 10 (100.0%) | 0 (0.0%) |
| College/Associate Degree | 0 (0.0%) | 0 (0.0%) |
| Bachelor's Degree or higher | 0 (0.0%) | 7 (100.0%) |
Occupancy by Age of Householder in Fidelity
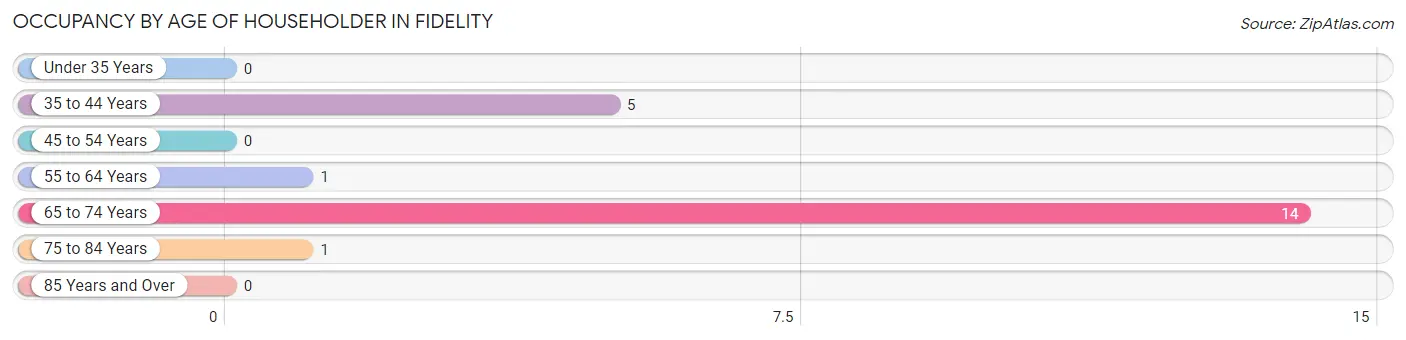
| Age Bracket | # Households | % Households |
| Under 35 Years | 0 | 0.0% |
| 35 to 44 Years | 5 | 23.8% |
| 45 to 54 Years | 0 | 0.0% |
| 55 to 64 Years | 1 | 4.8% |
| 65 to 74 Years | 14 | 66.7% |
| 75 to 84 Years | 1 | 4.8% |
| 85 Years and Over | 0 | 0.0% |
| Total | 21 | 100.0% |
Housing Finances in Fidelity
Median Income by Occupancy in Fidelity
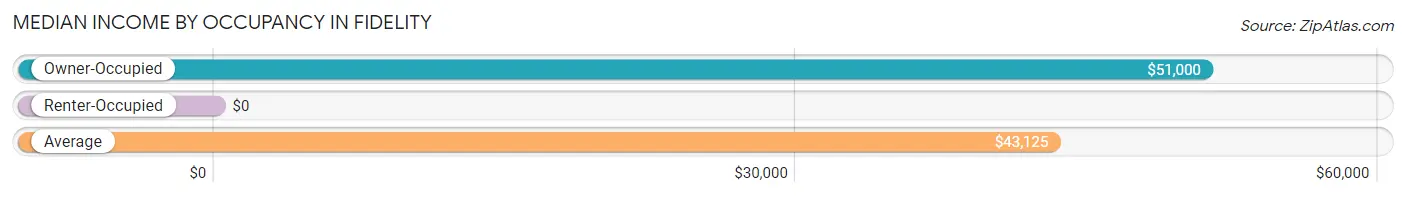
| Occupancy Type | # Households | Median Income |
| Owner-Occupied | 14 (66.7%) | $51,000 |
| Renter-Occupied | 7 (33.3%) | $0 |
| Average | 21 (100.0%) | $43,125 |
Occupancy by Householder Income Bracket in Fidelity
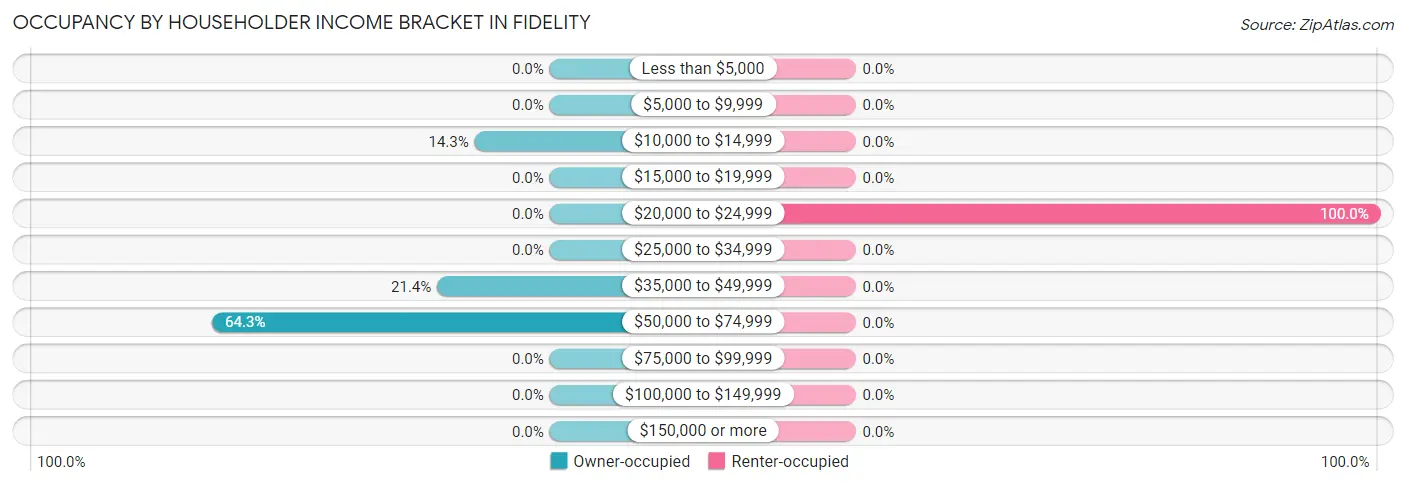
| Income Bracket | Owner-occupied | Renter-occupied |
| Less than $5,000 | 0 (0.0%) | 0 (0.0%) |
| $5,000 to $9,999 | 0 (0.0%) | 0 (0.0%) |
| $10,000 to $14,999 | 2 (14.3%) | 0 (0.0%) |
| $15,000 to $19,999 | 0 (0.0%) | 0 (0.0%) |
| $20,000 to $24,999 | 0 (0.0%) | 7 (100.0%) |
| $25,000 to $34,999 | 0 (0.0%) | 0 (0.0%) |
| $35,000 to $49,999 | 3 (21.4%) | 0 (0.0%) |
| $50,000 to $74,999 | 9 (64.3%) | 0 (0.0%) |
| $75,000 to $99,999 | 0 (0.0%) | 0 (0.0%) |
| $100,000 to $149,999 | 0 (0.0%) | 0 (0.0%) |
| $150,000 or more | 0 (0.0%) | 0 (0.0%) |
| Total | 14 (100.0%) | 7 (100.0%) |
Monthly Housing Cost Tiers in Fidelity
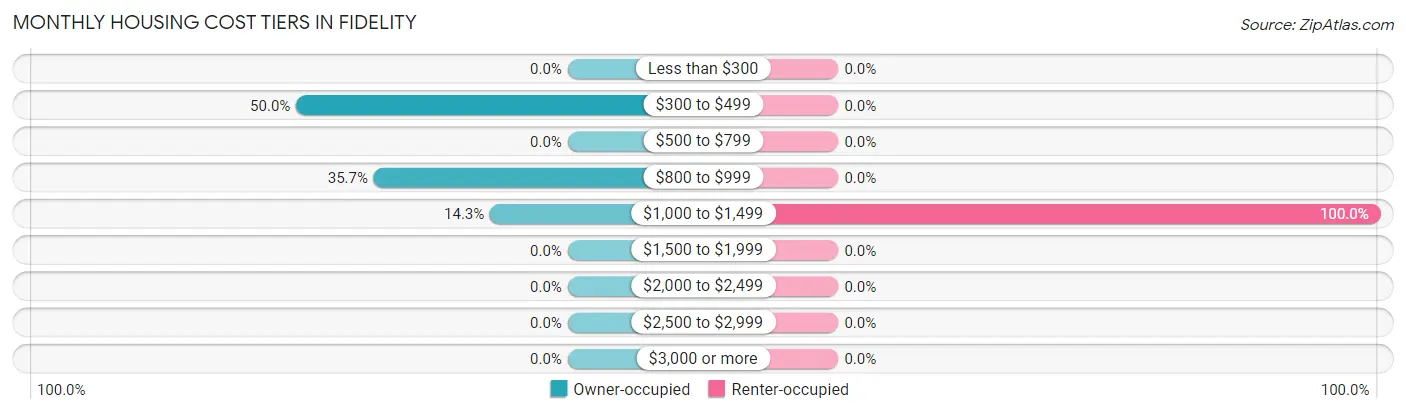
| Monthly Cost | Owner-occupied | Renter-occupied |
| Less than $300 | 0 (0.0%) | 0 (0.0%) |
| $300 to $499 | 7 (50.0%) | 0 (0.0%) |
| $500 to $799 | 0 (0.0%) | 0 (0.0%) |
| $800 to $999 | 5 (35.7%) | 0 (0.0%) |
| $1,000 to $1,499 | 2 (14.3%) | 7 (100.0%) |
| $1,500 to $1,999 | 0 (0.0%) | 0 (0.0%) |
| $2,000 to $2,499 | 0 (0.0%) | 0 (0.0%) |
| $2,500 to $2,999 | 0 (0.0%) | 0 (0.0%) |
| $3,000 or more | 0 (0.0%) | 0 (0.0%) |
| Total | 14 (100.0%) | 7 (100.0%) |
Physical Housing Characteristics in Fidelity
Housing Structures in Fidelity
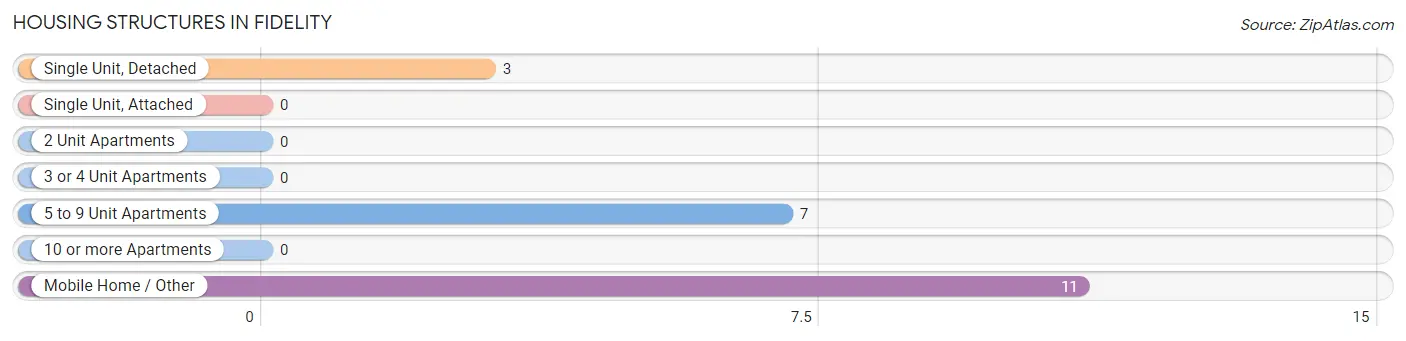
| Structure Type | # Housing Units | % Housing Units |
| Single Unit, Detached | 3 | 14.3% |
| Single Unit, Attached | 0 | 0.0% |
| 2 Unit Apartments | 0 | 0.0% |
| 3 or 4 Unit Apartments | 0 | 0.0% |
| 5 to 9 Unit Apartments | 7 | 33.3% |
| 10 or more Apartments | 0 | 0.0% |
| Mobile Home / Other | 11 | 52.4% |
| Total | 21 | 100.0% |
Housing Structures by Occupancy in Fidelity
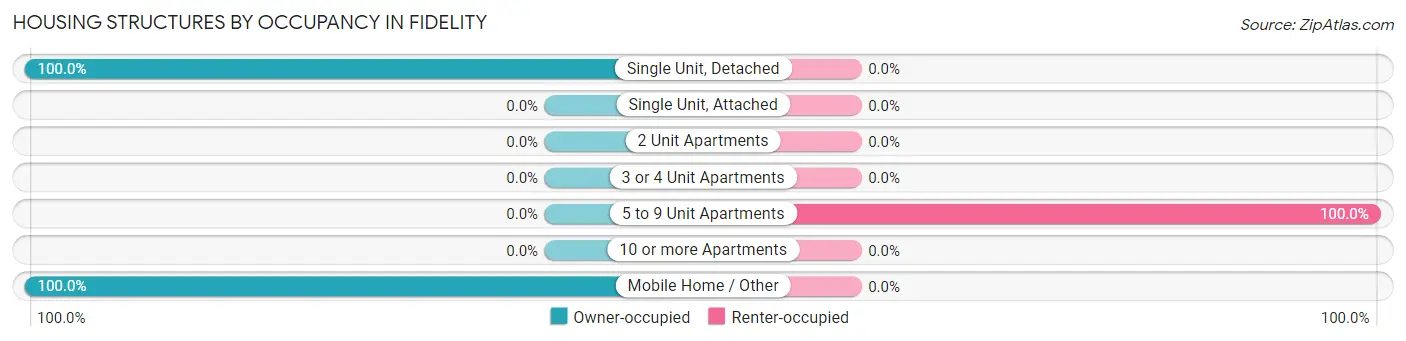
| Structure Type | Owner-occupied | Renter-occupied |
| Single Unit, Detached | 3 (100.0%) | 0 (0.0%) |
| Single Unit, Attached | 0 (0.0%) | 0 (0.0%) |
| 2 Unit Apartments | 0 (0.0%) | 0 (0.0%) |
| 3 or 4 Unit Apartments | 0 (0.0%) | 0 (0.0%) |
| 5 to 9 Unit Apartments | 0 (0.0%) | 7 (100.0%) |
| 10 or more Apartments | 0 (0.0%) | 0 (0.0%) |
| Mobile Home / Other | 11 (100.0%) | 0 (0.0%) |
| Total | 14 (66.7%) | 7 (33.3%) |
Housing Structures by Number of Rooms in Fidelity
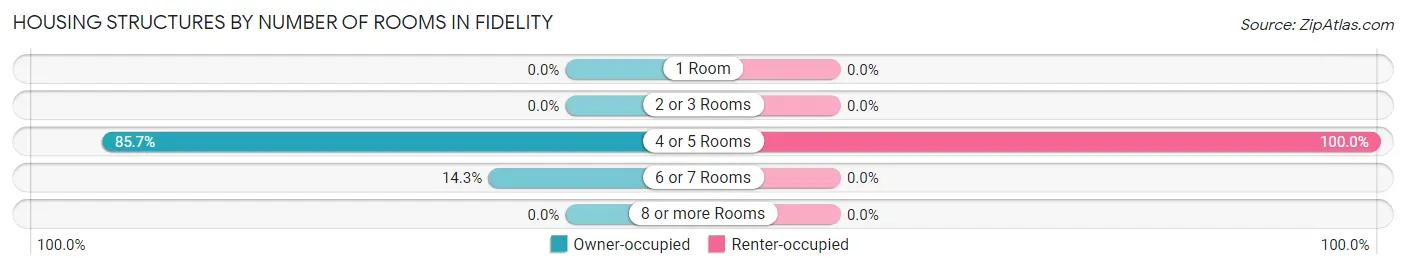
| Number of Rooms | Owner-occupied | Renter-occupied |
| 1 Room | 0 (0.0%) | 0 (0.0%) |
| 2 or 3 Rooms | 0 (0.0%) | 0 (0.0%) |
| 4 or 5 Rooms | 12 (85.7%) | 7 (100.0%) |
| 6 or 7 Rooms | 2 (14.3%) | 0 (0.0%) |
| 8 or more Rooms | 0 (0.0%) | 0 (0.0%) |
| Total | 14 (100.0%) | 7 (100.0%) |
Housing Structure by Heating Type in Fidelity
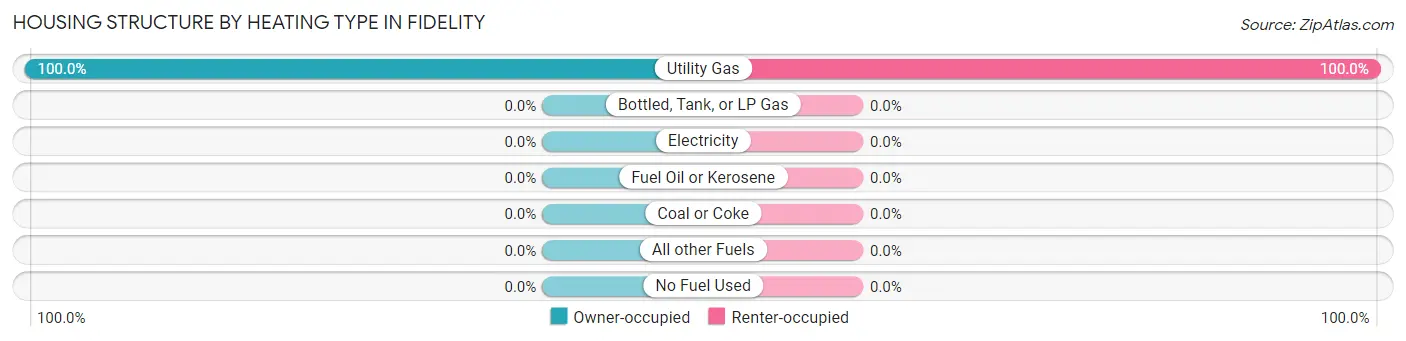
| Heating Type | Owner-occupied | Renter-occupied |
| Utility Gas | 14 (100.0%) | 7 (100.0%) |
| Bottled, Tank, or LP Gas | 0 (0.0%) | 0 (0.0%) |
| Electricity | 0 (0.0%) | 0 (0.0%) |
| Fuel Oil or Kerosene | 0 (0.0%) | 0 (0.0%) |
| Coal or Coke | 0 (0.0%) | 0 (0.0%) |
| All other Fuels | 0 (0.0%) | 0 (0.0%) |
| No Fuel Used | 0 (0.0%) | 0 (0.0%) |
| Total | 14 (100.0%) | 7 (100.0%) |
Household Vehicle Usage in Fidelity
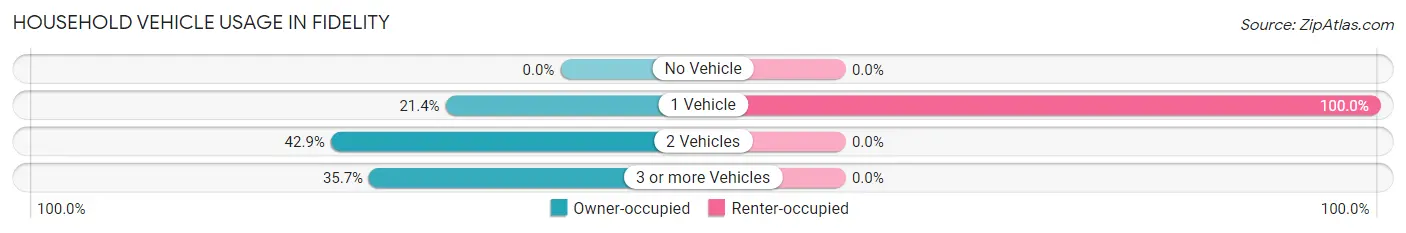
| Vehicles per Household | Owner-occupied | Renter-occupied |
| No Vehicle | 0 (0.0%) | 0 (0.0%) |
| 1 Vehicle | 3 (21.4%) | 7 (100.0%) |
| 2 Vehicles | 6 (42.9%) | 0 (0.0%) |
| 3 or more Vehicles | 5 (35.7%) | 0 (0.0%) |
| Total | 14 (100.0%) | 7 (100.0%) |
Real Estate & Mortgages in Fidelity
Real Estate and Mortgage Overview in Fidelity
| Characteristic | Without Mortgage | With Mortgage |
| Housing Units | 7 | 7 |
| Median Property Value | - | - |
| Median Household Income | - | - |
| Monthly Housing Costs | $442 | $0 |
| Real Estate Taxes | $338 | $0 |
Property Value by Mortgage Status in Fidelity
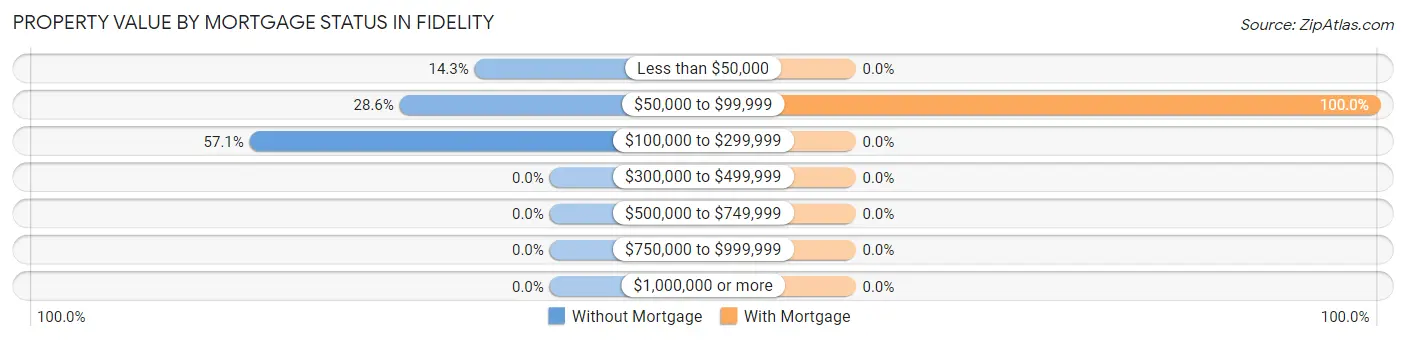
| Property Value | Without Mortgage | With Mortgage |
| Less than $50,000 | 1 (14.3%) | 0 (0.0%) |
| $50,000 to $99,999 | 2 (28.6%) | 7 (100.0%) |
| $100,000 to $299,999 | 4 (57.1%) | 0 (0.0%) |
| $300,000 to $499,999 | 0 (0.0%) | 0 (0.0%) |
| $500,000 to $749,999 | 0 (0.0%) | 0 (0.0%) |
| $750,000 to $999,999 | 0 (0.0%) | 0 (0.0%) |
| $1,000,000 or more | 0 (0.0%) | 0 (0.0%) |
| Total | 7 (100.0%) | 7 (100.0%) |
Household Income by Mortgage Status in Fidelity
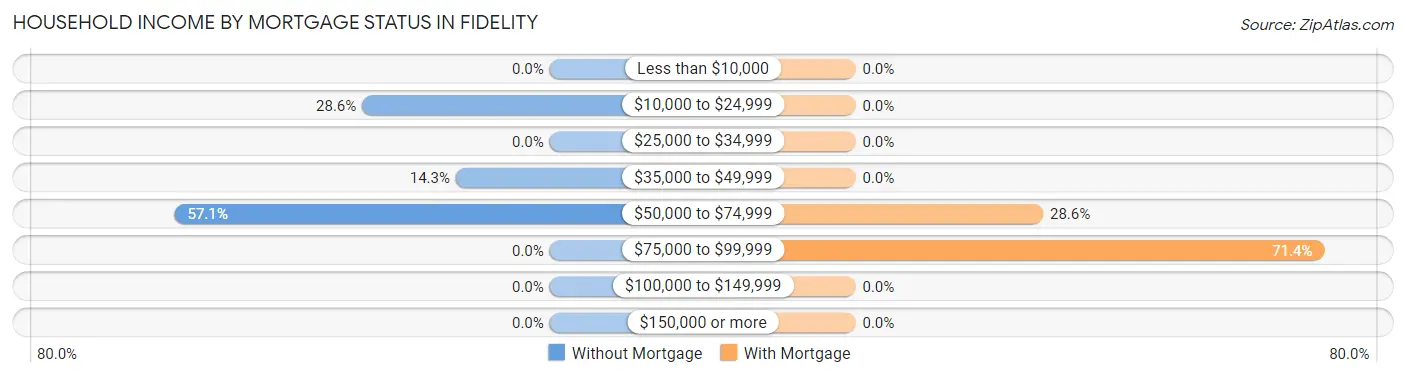
| Household Income | Without Mortgage | With Mortgage |
| Less than $10,000 | 0 (0.0%) | 0 (0.0%) |
| $10,000 to $24,999 | 2 (28.6%) | 0 (0.0%) |
| $25,000 to $34,999 | 0 (0.0%) | 0 (0.0%) |
| $35,000 to $49,999 | 1 (14.3%) | 0 (0.0%) |
| $50,000 to $74,999 | 4 (57.1%) | 2 (28.6%) |
| $75,000 to $99,999 | 0 (0.0%) | 5 (71.4%) |
| $100,000 to $149,999 | 0 (0.0%) | 0 (0.0%) |
| $150,000 or more | 0 (0.0%) | 0 (0.0%) |
| Total | 7 (100.0%) | 7 (100.0%) |
Property Value to Household Income Ratio in Fidelity
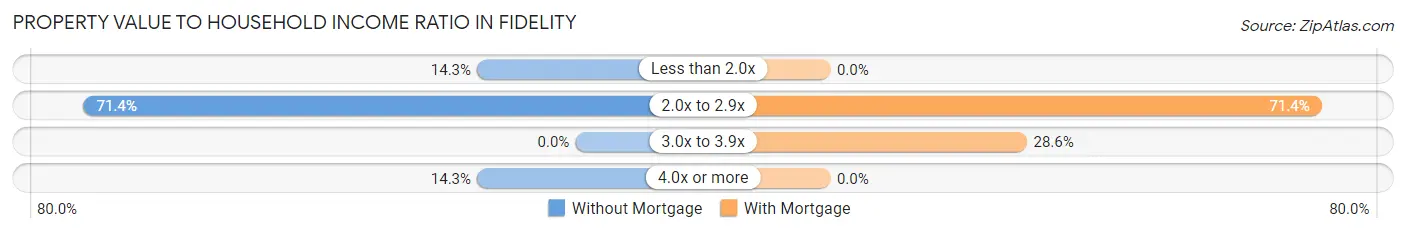
| Value-to-Income Ratio | Without Mortgage | With Mortgage |
| Less than 2.0x | 1 (14.3%) | 0 (0.0%) |
| 2.0x to 2.9x | 5 (71.4%) | 5 (71.4%) |
| 3.0x to 3.9x | 0 (0.0%) | 2 (28.6%) |
| 4.0x or more | 1 (14.3%) | 0 (0.0%) |
| Total | 7 (100.0%) | 7 (100.0%) |
Real Estate Taxes by Mortgage Status in Fidelity
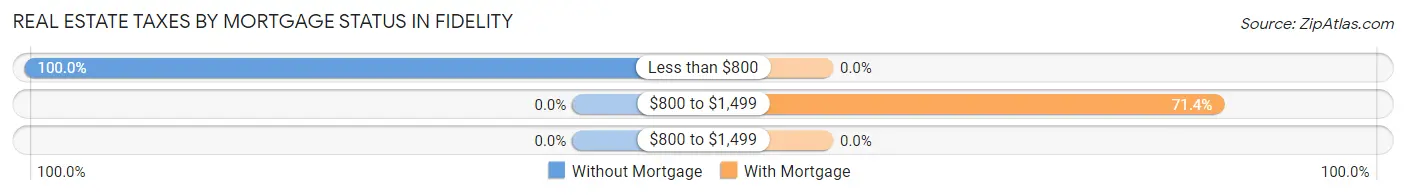
| Property Taxes | Without Mortgage | With Mortgage |
| Less than $800 | 7 (100.0%) | 0 (0.0%) |
| $800 to $1,499 | 0 (0.0%) | 5 (71.4%) |
| $800 to $1,499 | 0 (0.0%) | 0 (0.0%) |
| Total | 7 (100.0%) | 7 (100.0%) |
Health & Disability in Fidelity
Health Insurance Coverage by Age in Fidelity
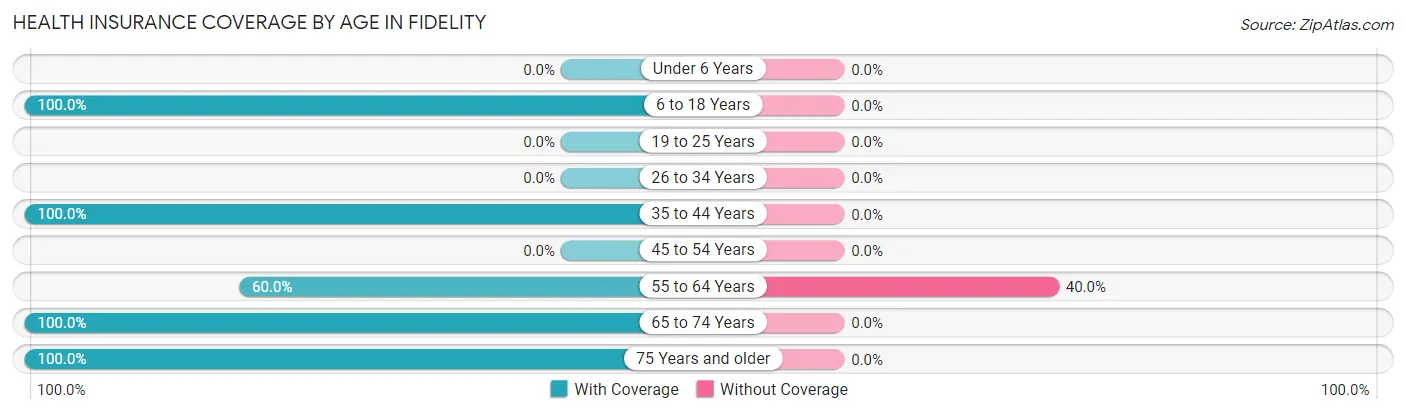
| Age Bracket | With Coverage | Without Coverage |
| Under 6 Years | 0 (0.0%) | 0 (0.0%) |
| 6 to 18 Years | 30 (100.0%) | 0 (0.0%) |
| 19 to 25 Years | 0 (0.0%) | 0 (0.0%) |
| 26 to 34 Years | 0 (0.0%) | 0 (0.0%) |
| 35 to 44 Years | 10 (100.0%) | 0 (0.0%) |
| 45 to 54 Years | 0 (0.0%) | 0 (0.0%) |
| 55 to 64 Years | 9 (60.0%) | 6 (40.0%) |
| 65 to 74 Years | 19 (100.0%) | 0 (0.0%) |
| 75 Years and older | 1 (100.0%) | 0 (0.0%) |
| Total | 69 (92.0%) | 6 (8.0%) |
Health Insurance Coverage by Citizenship Status in Fidelity
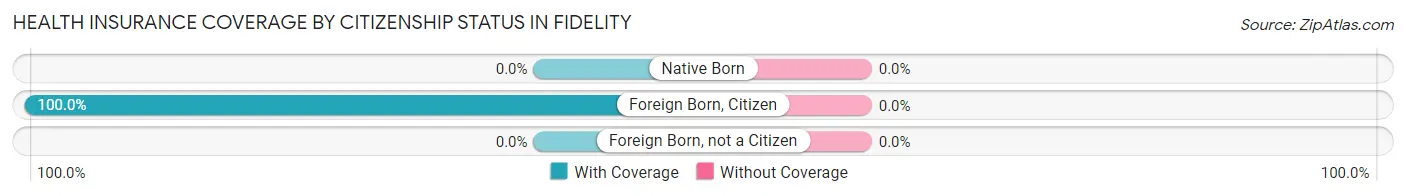
| Citizenship Status | With Coverage | Without Coverage |
| Native Born | 0 (0.0%) | 0 (0.0%) |
| Foreign Born, Citizen | 30 (100.0%) | 0 (0.0%) |
| Foreign Born, not a Citizen | 0 (0.0%) | 0 (0.0%) |
Health Insurance Coverage by Household Income in Fidelity
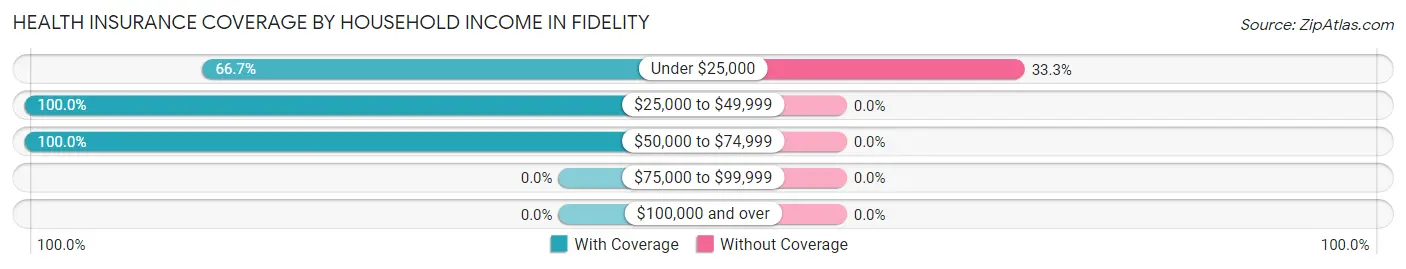
| Household Income | With Coverage | Without Coverage |
| Under $25,000 | 12 (66.7%) | 6 (33.3%) |
| $25,000 to $49,999 | 5 (100.0%) | 0 (0.0%) |
| $50,000 to $74,999 | 52 (100.0%) | 0 (0.0%) |
| $75,000 to $99,999 | 0 (0.0%) | 0 (0.0%) |
| $100,000 and over | 0 (0.0%) | 0 (0.0%) |
Public vs Private Health Insurance Coverage by Age in Fidelity
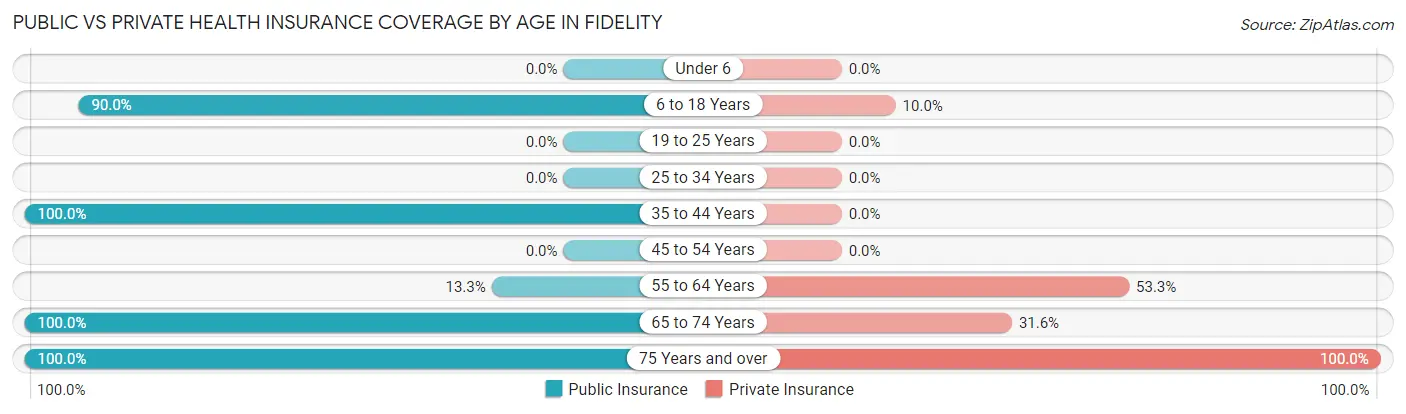
| Age Bracket | Public Insurance | Private Insurance |
| Under 6 | 0 (0.0%) | 0 (0.0%) |
| 6 to 18 Years | 27 (90.0%) | 3 (10.0%) |
| 19 to 25 Years | 0 (0.0%) | 0 (0.0%) |
| 25 to 34 Years | 0 (0.0%) | 0 (0.0%) |
| 35 to 44 Years | 10 (100.0%) | 0 (0.0%) |
| 45 to 54 Years | 0 (0.0%) | 0 (0.0%) |
| 55 to 64 Years | 2 (13.3%) | 8 (53.3%) |
| 65 to 74 Years | 19 (100.0%) | 6 (31.6%) |
| 75 Years and over | 1 (100.0%) | 1 (100.0%) |
| Total | 59 (78.7%) | 18 (24.0%) |
Disability Status by Sex by Age in Fidelity
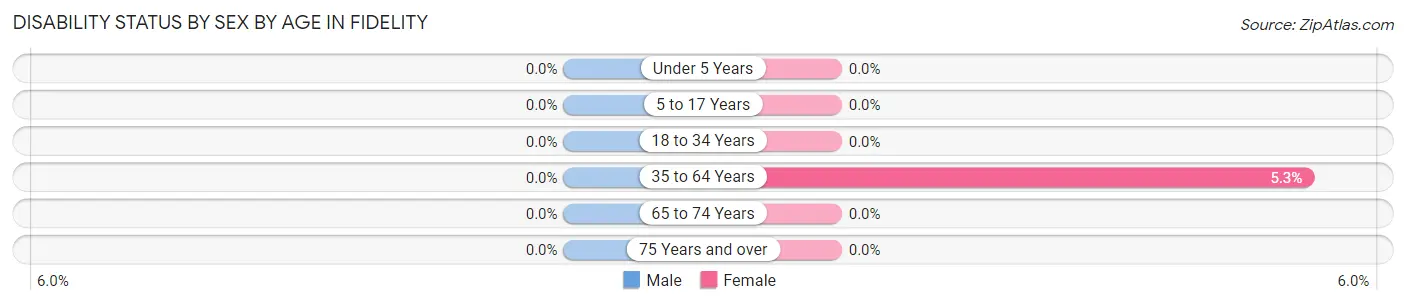
| Age Bracket | Male | Female |
| Under 5 Years | 0 (0.0%) | 0 (0.0%) |
| 5 to 17 Years | 0 (0.0%) | 0 (0.0%) |
| 18 to 34 Years | 0 (0.0%) | 0 (0.0%) |
| 35 to 64 Years | 0 (0.0%) | 1 (5.3%) |
| 65 to 74 Years | 0 (0.0%) | 0 (0.0%) |
| 75 Years and over | 0 (0.0%) | 0 (0.0%) |
Disability Class by Sex by Age in Fidelity
Disability Class: Hearing Difficulty
| Age Bracket | Male | Female |
| Under 5 Years | 0 (0.0%) | 0 (0.0%) |
| 5 to 17 Years | 0 (0.0%) | 0 (0.0%) |
| 18 to 34 Years | 0 (0.0%) | 0 (0.0%) |
| 35 to 64 Years | 0 (0.0%) | 0 (0.0%) |
| 65 to 74 Years | 0 (0.0%) | 0 (0.0%) |
| 75 Years and over | 0 (0.0%) | 0 (0.0%) |
Disability Class: Vision Difficulty
| Age Bracket | Male | Female |
| Under 5 Years | 0 (0.0%) | 0 (0.0%) |
| 5 to 17 Years | 0 (0.0%) | 0 (0.0%) |
| 18 to 34 Years | 0 (0.0%) | 0 (0.0%) |
| 35 to 64 Years | 0 (0.0%) | 0 (0.0%) |
| 65 to 74 Years | 0 (0.0%) | 0 (0.0%) |
| 75 Years and over | 0 (0.0%) | 0 (0.0%) |
Disability Class: Cognitive Difficulty

| Age Bracket | Male | Female |
| 5 to 17 Years | 0 (0.0%) | 0 (0.0%) |
| 18 to 34 Years | 0 (0.0%) | 0 (0.0%) |
| 35 to 64 Years | 0 (0.0%) | 0 (0.0%) |
| 65 to 74 Years | 0 (0.0%) | 0 (0.0%) |
| 75 Years and over | 0 (0.0%) | 0 (0.0%) |
Disability Class: Ambulatory Difficulty
| Age Bracket | Male | Female |
| 5 to 17 Years | 0 (0.0%) | 0 (0.0%) |
| 18 to 34 Years | 0 (0.0%) | 0 (0.0%) |
| 35 to 64 Years | 0 (0.0%) | 1 (5.3%) |
| 65 to 74 Years | 0 (0.0%) | 0 (0.0%) |
| 75 Years and over | 0 (0.0%) | 0 (0.0%) |
Disability Class: Self-Care Difficulty
| Age Bracket | Male | Female |
| 5 to 17 Years | 0 (0.0%) | 0 (0.0%) |
| 18 to 34 Years | 0 (0.0%) | 0 (0.0%) |
| 35 to 64 Years | 0 (0.0%) | 0 (0.0%) |
| 65 to 74 Years | 0 (0.0%) | 0 (0.0%) |
| 75 Years and over | 0 (0.0%) | 0 (0.0%) |
Technology Access in Fidelity
Computing Device Access in Fidelity
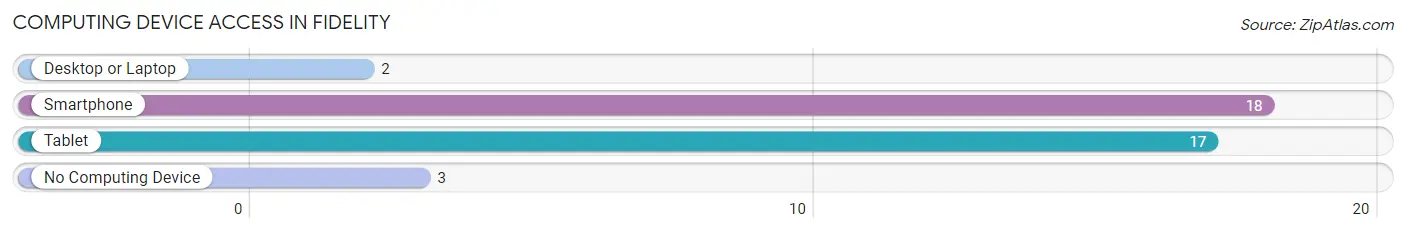
| Device Type | # Households | % Households |
| Desktop or Laptop | 2 | 9.5% |
| Smartphone | 18 | 85.7% |
| Tablet | 17 | 80.9% |
| No Computing Device | 3 | 14.3% |
| Total | 21 | 100.0% |
Internet Access in Fidelity
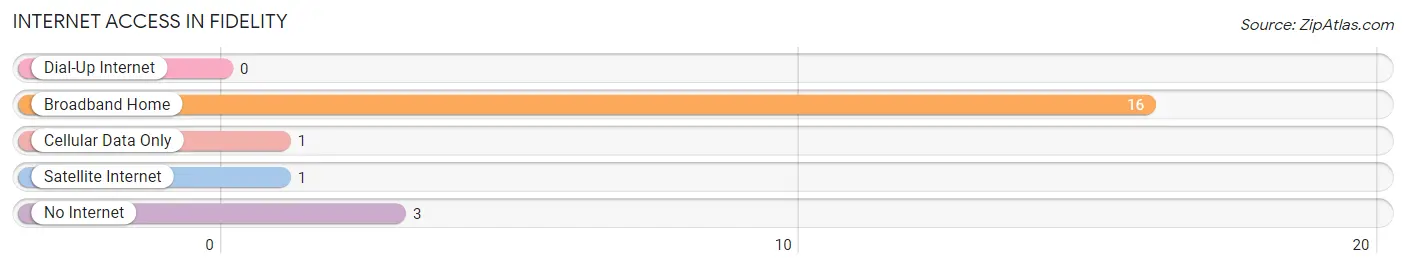
| Internet Type | # Households | % Households |
| Dial-Up Internet | 0 | 0.0% |
| Broadband Home | 16 | 76.2% |
| Cellular Data Only | 1 | 4.8% |
| Satellite Internet | 1 | 4.8% |
| No Internet | 3 | 14.3% |
| Total | 21 | 100.0% |
Fidelity Summary
Fidelity, Illinois is a small village located in the northeastern corner of the state, in Jo Daviess County. It is situated on the banks of the Apple River, and is surrounded by rolling hills and farmland. The village has a population of just over 500 people, and is a quiet, rural community.
History
Fidelity was founded in 1845 by a group of settlers from New York. The village was named after the Fidelity Insurance Company, which had provided the settlers with financial assistance to purchase the land. The village was incorporated in 1856, and the first post office was established in 1857.
The village grew slowly over the years, and by the turn of the century, it had a population of just over 500 people. The village was primarily an agricultural community, with most of the residents working on the farms that surrounded the village.
Geography
Fidelity is located in the northeastern corner of the state, in Jo Daviess County. It is situated on the banks of the Apple River, and is surrounded by rolling hills and farmland. The village is located about 25 miles from the Wisconsin border, and about 50 miles from the Mississippi River.
The village is located in a temperate climate, with hot summers and cold winters. The average temperature in the summer is around 75 degrees Fahrenheit, and the average temperature in the winter is around 25 degrees Fahrenheit.
Economy
The economy of Fidelity is primarily based on agriculture. The village is surrounded by farms, and many of the residents work on these farms. The village also has a few small businesses, including a grocery store, a hardware store, and a few restaurants.
The village also has a few tourist attractions, including a museum, a winery, and a golf course. These attractions bring in visitors from all over the state, and help to boost the local economy.
Demographics
As of the 2010 census, the population of Fidelity was 514 people. The racial makeup of the village was 97.3% White, 0.6% African American, 0.2% Native American, 0.4% Asian, and 1.5% from other races. The median household income was $45,000, and the median family income was $50,000.
Conclusion
Fidelity, Illinois is a small village located in the northeastern corner of the state, in Jo Daviess County. It is a quiet, rural community, with a population of just over 500 people. The village is primarily an agricultural community, with most of the residents working on the farms that surround the village. The village also has a few small businesses, and a few tourist attractions, which help to boost the local economy.
Common Questions
What is Per Capita Income in Fidelity?
Per Capita income in Fidelity is $10,585.
What is the Median Family Income in Fidelity?
Median Family Income in Fidelity is $44,375.
What is the Median Household income in Fidelity?
Median Household Income in Fidelity is $43,125.
What is Inequality or Gini Index in Fidelity?
Inequality or Gini Index in Fidelity is 0.27.
What is the Total Population of Fidelity?
Total Population of Fidelity is 75.
What is the Total Male Population of Fidelity?
Total Male Population of Fidelity is 34.
What is the Total Female Population of Fidelity?
Total Female Population of Fidelity is 41.
What is the Ratio of Males per 100 Females in Fidelity?
There are 82.93 Males per 100 Females in Fidelity.
What is the Ratio of Females per 100 Males in Fidelity?
There are 120.59 Females per 100 Males in Fidelity.
What is the Median Population Age in Fidelity?
Median Population Age in Fidelity is 39.5 Years.
What is the Average Family Size in Fidelity
Average Family Size in Fidelity is 3.8 People.
What is the Average Household Size in Fidelity
Average Household Size in Fidelity is 3.6 People.
How Large is the Labor Force in Fidelity?
There are 13 People in the Labor Forcein in Fidelity.
What is the Percentage of People in the Labor Force in Fidelity?
26.5% of People are in the Labor Force in Fidelity.