Adak, AK Map & Demographics
Adak Map
Adak Overview
$57,458
PER CAPITA INCOME
$82,500
AVG FAMILY INCOME
$90,114
AVG HOUSEHOLD INCOME
0.42
INEQUALITY / GINI INDEX
248
TOTAL POPULATION
173
MALE POPULATION
75
FEMALE POPULATION
230.67
MALES / 100 FEMALES
43.35
FEMALES / 100 MALES
50.1
MEDIAN AGE
3.5
AVG FAMILY SIZE
3.2
AVG HOUSEHOLD SIZE
196
LABOR FORCE [ PEOPLE ]
90.7%
PERCENT IN LABOR FORCE
1.5%
UNEMPLOYMENT RATE
Adak Zip Codes
Adak Area Codes
Income in Adak
Income Overview in Adak
Per Capita Income in Adak is $57,458, while median incomes of families and households are $82,500 and $90,114 respectively.
| Characteristic | Number | Measure |
| Per Capita Income | 248 | $57,458 |
| Median Family Income | 26 | $82,500 |
| Mean Family Income | 26 | $107,150 |
| Median Household Income | 77 | $90,114 |
| Mean Household Income | 77 | $107,074 |
| Income Deficit | 26 | $0 |
| Wage / Income Gap (%) | 248 | 0.00% |
| Wage / Income Gap ($) | 248 | 100.00¢ per $1 |
| Gini / Inequality Index | 248 | 0.42 |
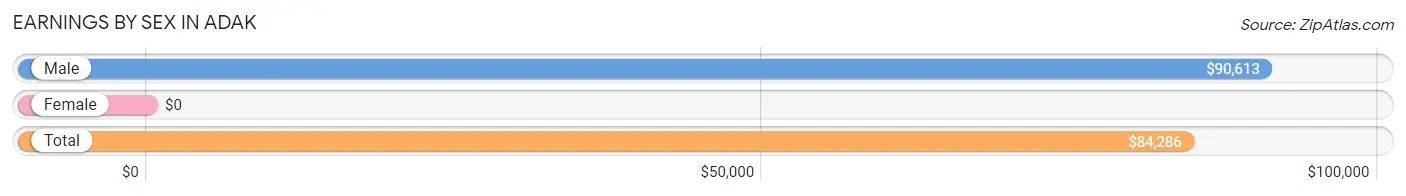
Earnings by Sex in Adak
| Sex | Number | Average Earnings |
| Male | 146 (74.5%) | $90,613 |
| Female | 50 (25.5%) | $0 |
| Total | 196 (100.0%) | $84,286 |
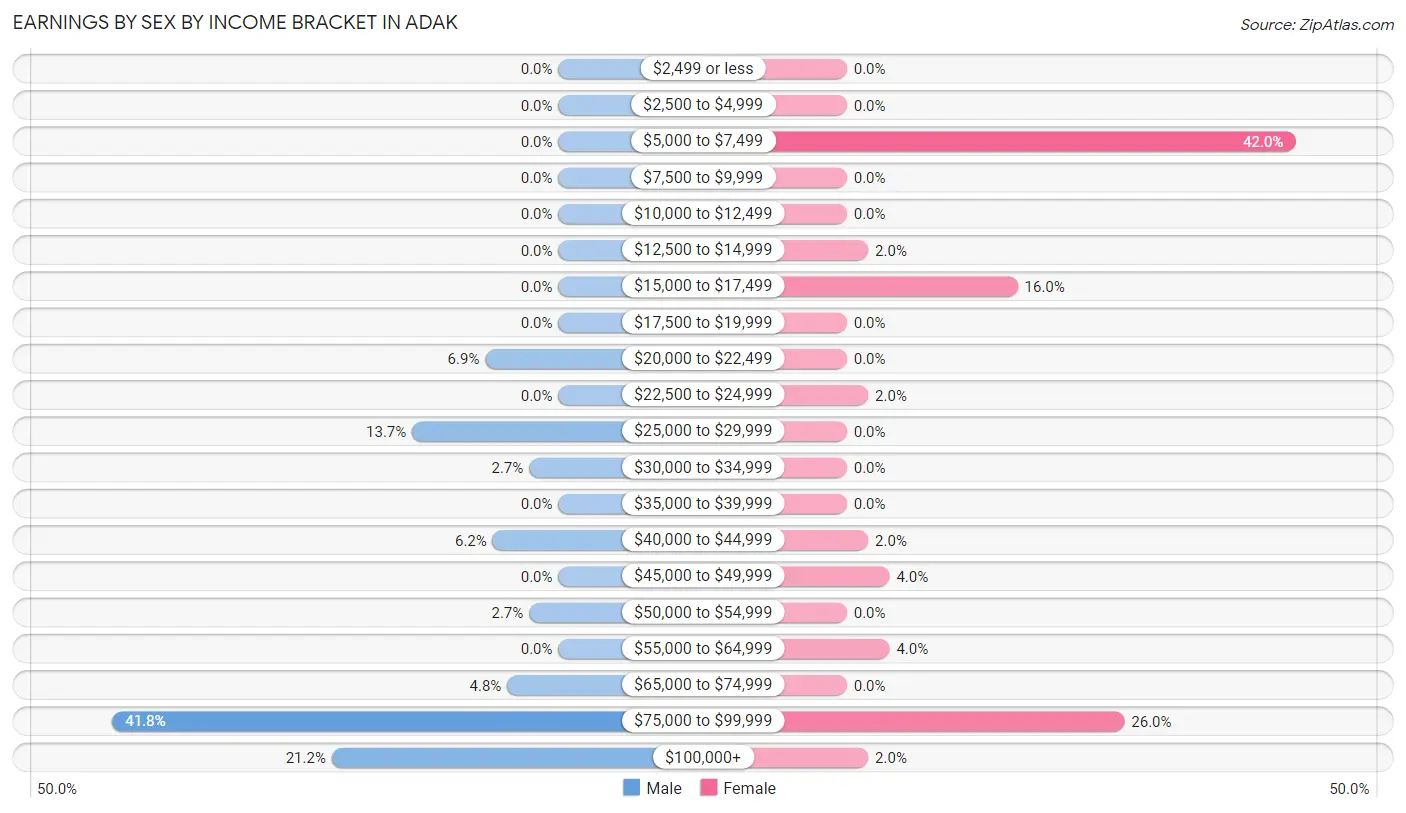
Earnings by Sex by Income Bracket in Adak
The most common earnings brackets in Adak are $75,000 to $99,999 for men (61 | 41.8%) and $5,000 to $7,499 for women (21 | 42.0%).
| Income | Male | Female |
| $2,499 or less | 0 (0.0%) | 0 (0.0%) |
| $2,500 to $4,999 | 0 (0.0%) | 0 (0.0%) |
| $5,000 to $7,499 | 0 (0.0%) | 21 (42.0%) |
| $7,500 to $9,999 | 0 (0.0%) | 0 (0.0%) |
| $10,000 to $12,499 | 0 (0.0%) | 0 (0.0%) |
| $12,500 to $14,999 | 0 (0.0%) | 1 (2.0%) |
| $15,000 to $17,499 | 0 (0.0%) | 8 (16.0%) |
| $17,500 to $19,999 | 0 (0.0%) | 0 (0.0%) |
| $20,000 to $22,499 | 10 (6.9%) | 0 (0.0%) |
| $22,500 to $24,999 | 0 (0.0%) | 1 (2.0%) |
| $25,000 to $29,999 | 20 (13.7%) | 0 (0.0%) |
| $30,000 to $34,999 | 4 (2.7%) | 0 (0.0%) |
| $35,000 to $39,999 | 0 (0.0%) | 0 (0.0%) |
| $40,000 to $44,999 | 9 (6.2%) | 1 (2.0%) |
| $45,000 to $49,999 | 0 (0.0%) | 2 (4.0%) |
| $50,000 to $54,999 | 4 (2.7%) | 0 (0.0%) |
| $55,000 to $64,999 | 0 (0.0%) | 2 (4.0%) |
| $65,000 to $74,999 | 7 (4.8%) | 0 (0.0%) |
| $75,000 to $99,999 | 61 (41.8%) | 13 (26.0%) |
| $100,000+ | 31 (21.2%) | 1 (2.0%) |
| Total | 146 (100.0%) | 50 (100.0%) |
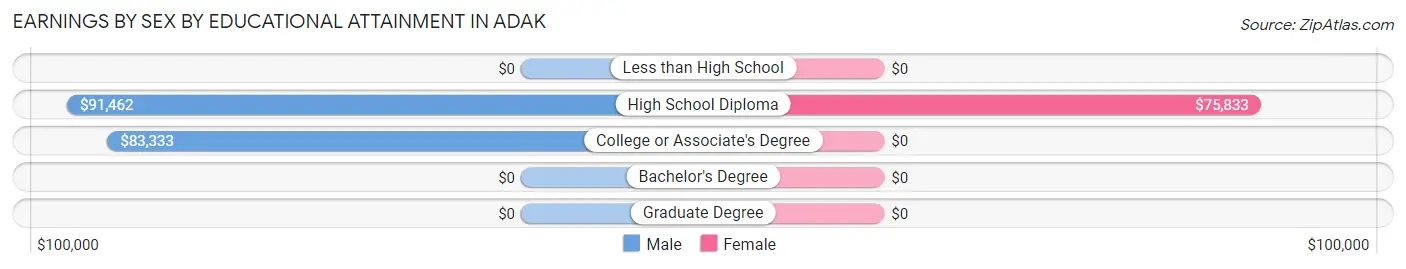
Earnings by Sex by Educational Attainment in Adak
Average earnings in Adak are $90,660 for men and $67,500 for women, a difference of 25.6%. Men with an educational attainment of high school diploma enjoy the highest average annual earnings of $91,462, while those with college or associate's degree education earn the least with $83,333. Women with an educational attainment of high school diploma earn the most with the average annual earnings of $75,833, while those with high school diploma education have the smallest earnings of $75,833.
| Educational Attainment | Male Income | Female Income |
| Less than High School | - | - |
| High School Diploma | $91,462 | $75,833 |
| College or Associate's Degree | $83,333 | $0 |
| Bachelor's Degree | - | - |
| Graduate Degree | - | - |
| Total | $90,660 | $67,500 |
Family Income in Adak
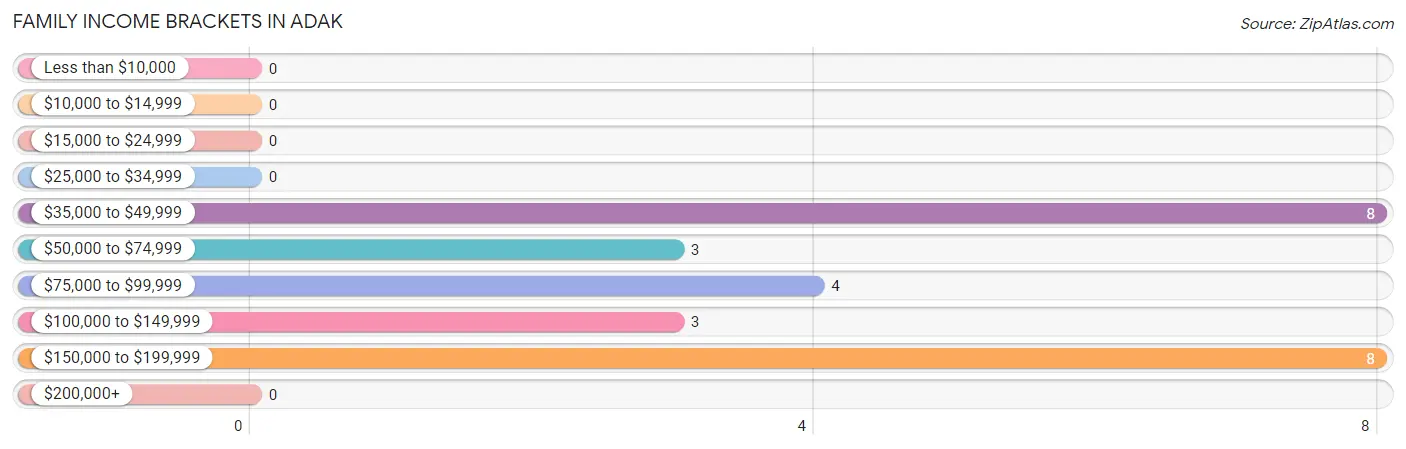
Family Income Brackets in Adak
According to the Adak family income data, there are 8 families falling into the $35,000 to $49,999 income range, which is the most common income bracket and makes up 30.8% of all families.
| Income Bracket | # Families | % Families |
| Less than $10,000 | 0 | 0.0% |
| $10,000 to $14,999 | 0 | 0.0% |
| $15,000 to $24,999 | 0 | 0.0% |
| $25,000 to $34,999 | 0 | 0.0% |
| $35,000 to $49,999 | 8 | 30.8% |
| $50,000 to $74,999 | 3 | 11.5% |
| $75,000 to $99,999 | 4 | 15.4% |
| $100,000 to $149,999 | 3 | 11.5% |
| $150,000 to $199,999 | 8 | 30.8% |
| $200,000+ | 0 | 0.0% |
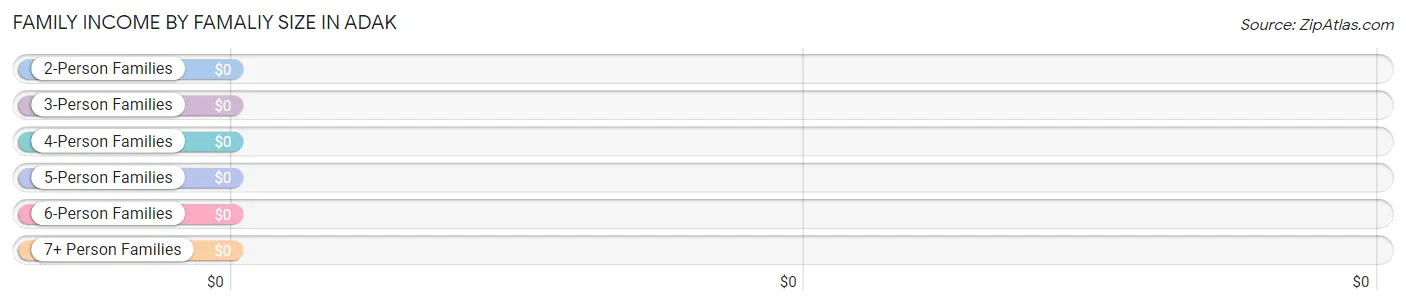
Family Income by Famaliy Size in Adak
| Income Bracket | # Families | Median Income |
| 2-Person Families | 22 (84.6%) | $0 |
| 3-Person Families | 1 (3.8%) | $0 |
| 4-Person Families | 3 (11.5%) | $0 |
| 5-Person Families | 0 (0.0%) | $0 |
| 6-Person Families | 0 (0.0%) | $0 |
| 7+ Person Families | 0 (0.0%) | $0 |
| Total | 26 (100.0%) | $82,500 |
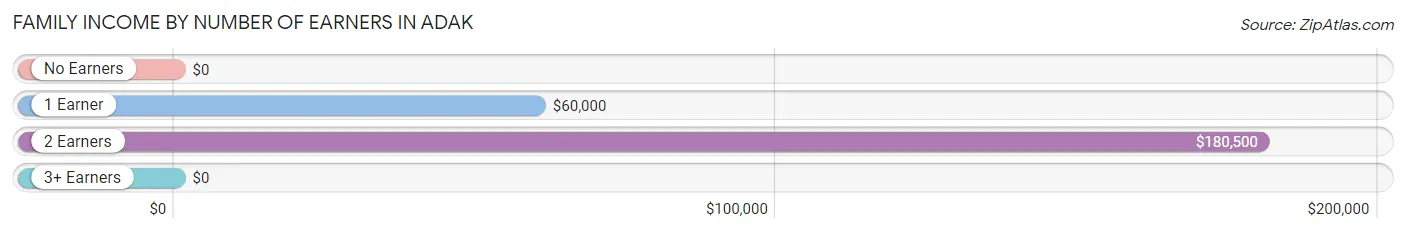
Family Income by Number of Earners in Adak
| Number of Earners | # Families | Median Income |
| No Earners | 2 (7.7%) | $0 |
| 1 Earner | 16 (61.5%) | $60,000 |
| 2 Earners | 8 (30.8%) | $180,500 |
| 3+ Earners | 0 (0.0%) | $0 |
| Total | 26 (100.0%) | $82,500 |
Household Income in Adak
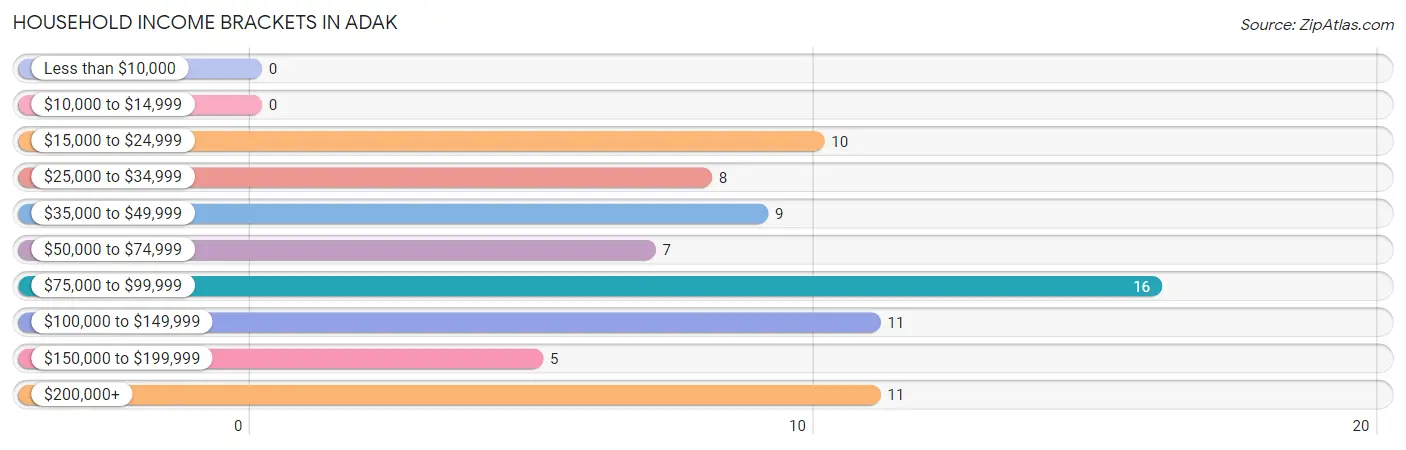
Household Income Brackets in Adak
With 16 households falling in the category, the $75,000 to $99,999 income range is the most frequent in Adak, accounting for 20.8% of all households.
| Income Bracket | # Households | % Households |
| Less than $10,000 | 0 | 0.0% |
| $10,000 to $14,999 | 0 | 0.0% |
| $15,000 to $24,999 | 10 | 13.0% |
| $25,000 to $34,999 | 8 | 10.4% |
| $35,000 to $49,999 | 9 | 11.7% |
| $50,000 to $74,999 | 7 | 9.1% |
| $75,000 to $99,999 | 16 | 20.8% |
| $100,000 to $149,999 | 11 | 14.3% |
| $150,000 to $199,999 | 5 | 6.5% |
| $200,000+ | 11 | 14.3% |
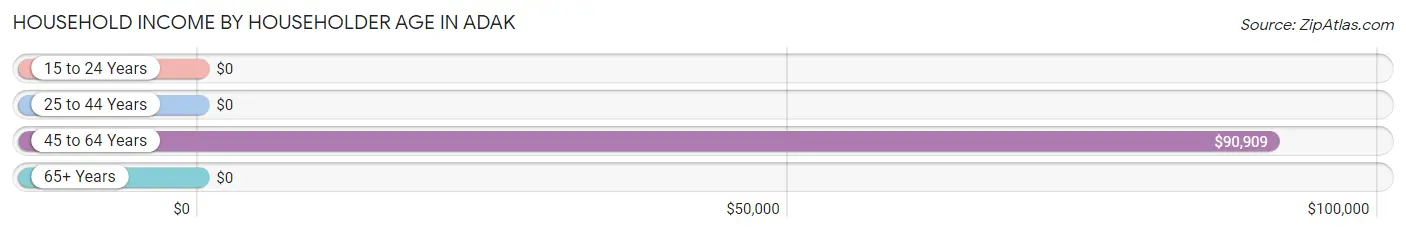
Household Income by Householder Age in Adak
The median household income in Adak is $90,114, with the highest median household income of $90,909 found in the 45 to 64 years age bracket for the primary householder. A total of 58 households (75.3%) fall into this category. Meanwhile, the 15 to 24 years age bracket for the primary householder has the lowest median household income of $0, with 1 households (1.3%) in this group.
| Income Bracket | # Households | Median Income |
| 15 to 24 Years | 1 (1.3%) | $0 |
| 25 to 44 Years | 9 (11.7%) | $0 |
| 45 to 64 Years | 58 (75.3%) | $90,909 |
| 65+ Years | 9 (11.7%) | $0 |
| Total | 77 (100.0%) | $90,114 |
Poverty in Adak
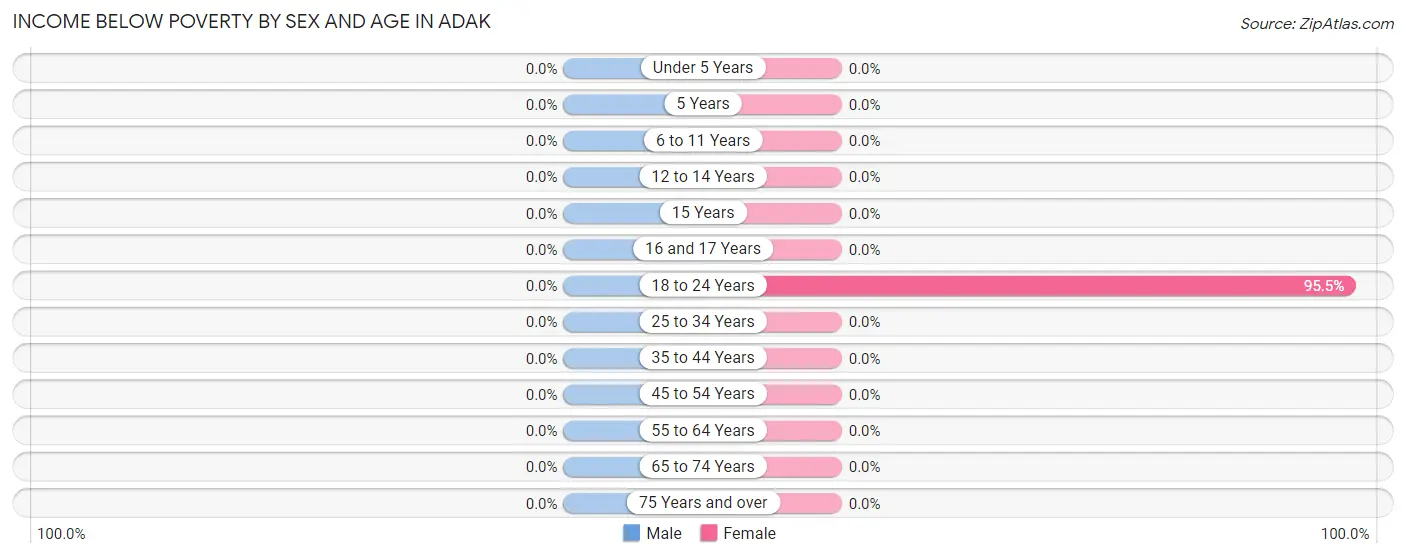
Income Below Poverty by Sex and Age in Adak
| Age Bracket | Male | Female |
| Under 5 Years | 0 (0.0%) | 0 (0.0%) |
| 5 Years | 0 (0.0%) | 0 (0.0%) |
| 6 to 11 Years | 0 (0.0%) | 0 (0.0%) |
| 12 to 14 Years | 0 (0.0%) | 0 (0.0%) |
| 15 Years | 0 (0.0%) | 0 (0.0%) |
| 16 and 17 Years | 0 (0.0%) | 0 (0.0%) |
| 18 to 24 Years | 0 (0.0%) | 21 (95.5%) |
| 25 to 34 Years | 0 (0.0%) | 0 (0.0%) |
| 35 to 44 Years | 0 (0.0%) | 0 (0.0%) |
| 45 to 54 Years | 0 (0.0%) | 0 (0.0%) |
| 55 to 64 Years | 0 (0.0%) | 0 (0.0%) |
| 65 to 74 Years | 0 (0.0%) | 0 (0.0%) |
| 75 Years and over | 0 (0.0%) | 0 (0.0%) |
| Total | 0 (0.0%) | 21 (28.0%) |
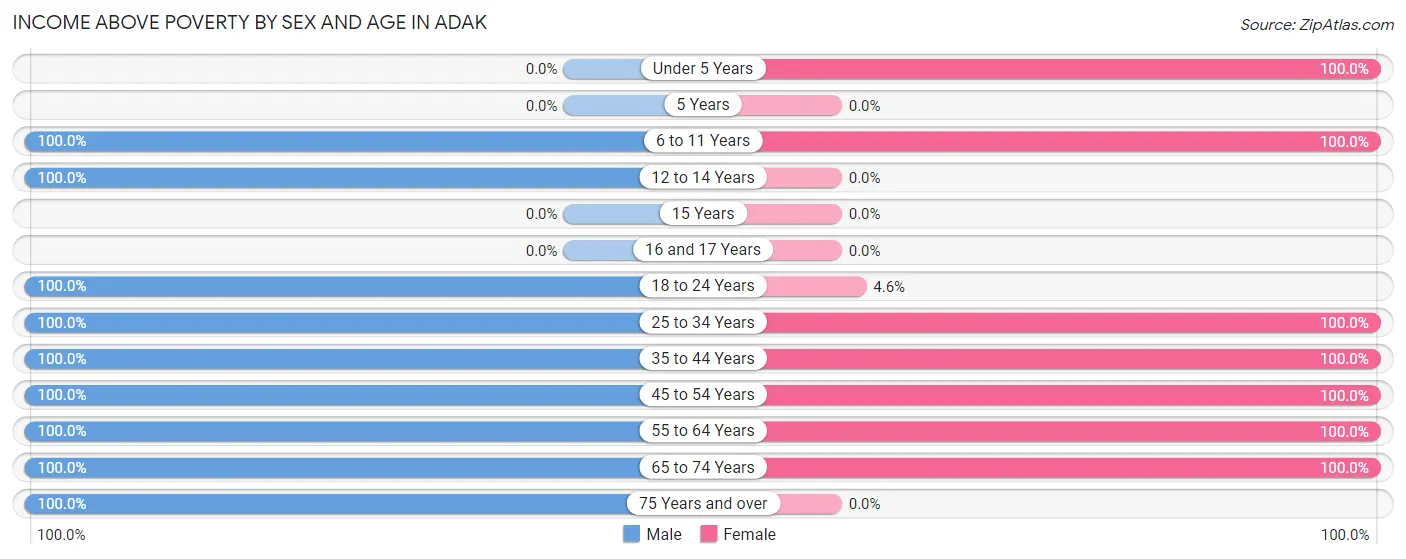
Income Above Poverty by Sex and Age in Adak
According to the poverty statistics in Adak, males aged 6 to 11 years and females aged under 5 years are the age groups that are most secure financially, with 100.0% of males and 100.0% of females in these age groups living above the poverty line.
| Age Bracket | Male | Female |
| Under 5 Years | 0 (0.0%) | 2 (100.0%) |
| 5 Years | 0 (0.0%) | 0 (0.0%) |
| 6 to 11 Years | 10 (100.0%) | 10 (100.0%) |
| 12 to 14 Years | 10 (100.0%) | 0 (0.0%) |
| 15 Years | 0 (0.0%) | 0 (0.0%) |
| 16 and 17 Years | 0 (0.0%) | 0 (0.0%) |
| 18 to 24 Years | 4 (100.0%) | 1 (4.5%) |
| 25 to 34 Years | 41 (100.0%) | 1 (100.0%) |
| 35 to 44 Years | 5 (100.0%) | 2 (100.0%) |
| 45 to 54 Years | 82 (100.0%) | 7 (100.0%) |
| 55 to 64 Years | 16 (100.0%) | 23 (100.0%) |
| 65 to 74 Years | 1 (100.0%) | 8 (100.0%) |
| 75 Years and over | 4 (100.0%) | 0 (0.0%) |
| Total | 173 (100.0%) | 54 (72.0%) |
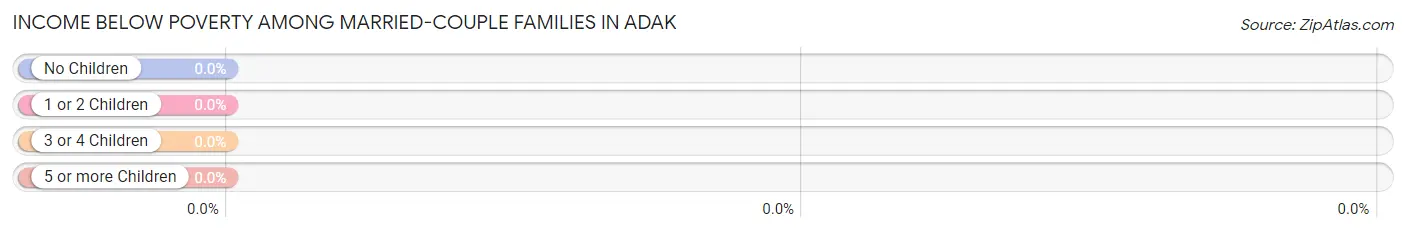
Income Below Poverty Among Married-Couple Families in Adak
| Children | Above Poverty | Below Poverty |
| No Children | 20 (100.0%) | 0 (0.0%) |
| 1 or 2 Children | 1 (100.0%) | 0 (0.0%) |
| 3 or 4 Children | 0 (0.0%) | 0 (0.0%) |
| 5 or more Children | 0 (0.0%) | 0 (0.0%) |
| Total | 21 (100.0%) | 0 (0.0%) |
Income Below Poverty Among Single-Parent Households in Adak
| Children | Single Father | Single Mother |
| No Children | 0 (0.0%) | 0 (0.0%) |
| 1 or 2 Children | 0 (0.0%) | 0 (0.0%) |
| 3 or 4 Children | 0 (0.0%) | 0 (0.0%) |
| 5 or more Children | 0 (0.0%) | 0 (0.0%) |
| Total | 0 (0.0%) | 0 (0.0%) |
Income Below Poverty Among Married-Couple vs Single-Parent Households in Adak
| Children | Married-Couple Families | Single-Parent Households |
| No Children | 0 (0.0%) | 0 (0.0%) |
| 1 or 2 Children | 0 (0.0%) | 0 (0.0%) |
| 3 or 4 Children | 0 (0.0%) | 0 (0.0%) |
| 5 or more Children | 0 (0.0%) | 0 (0.0%) |
| Total | 0 (0.0%) | 0 (0.0%) |
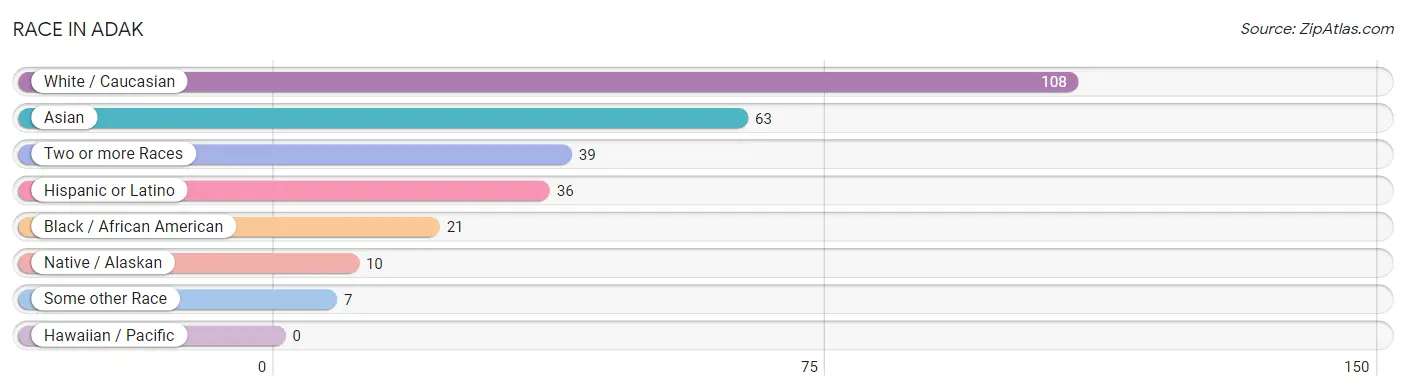
Race in Adak
The most populous races in Adak are White / Caucasian (108 | 43.5%), Asian (63 | 25.4%), and Two or more Races (39 | 15.7%).
| Race | # Population | % Population |
| Asian | 63 | 25.4% |
| Black / African American | 21 | 8.5% |
| Hawaiian / Pacific | 0 | 0.0% |
| Hispanic or Latino | 36 | 14.5% |
| Native / Alaskan | 10 | 4.0% |
| White / Caucasian | 108 | 43.5% |
| Two or more Races | 39 | 15.7% |
| Some other Race | 7 | 2.8% |
| Total | 248 | 100.0% |
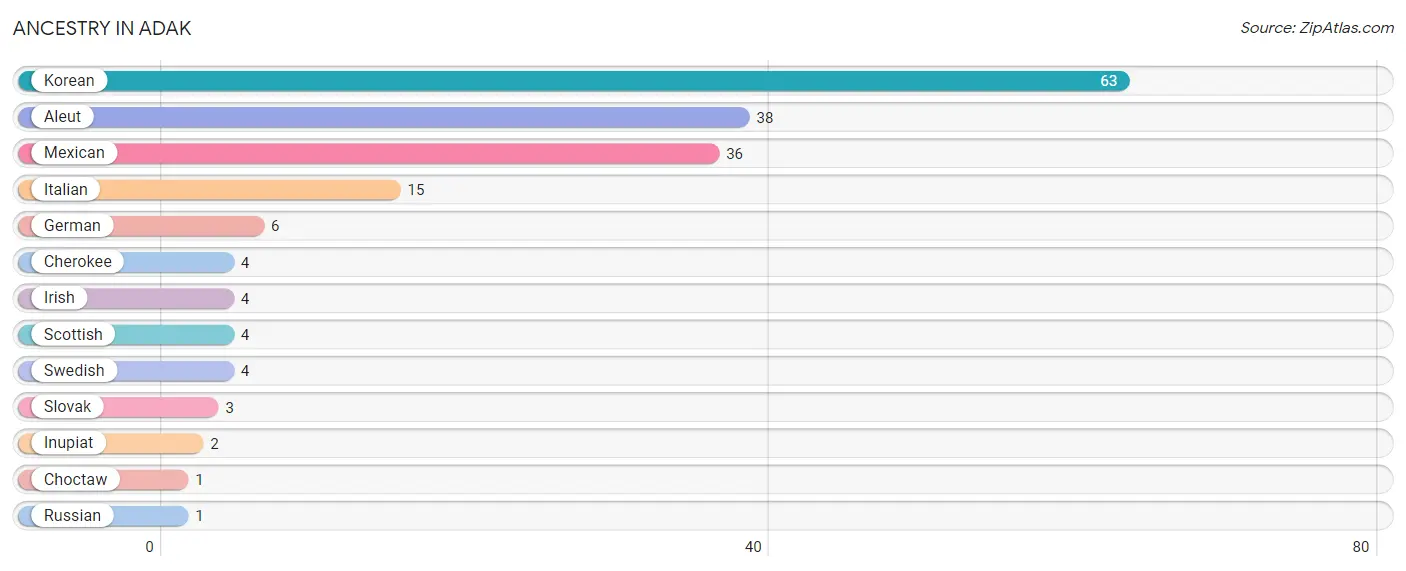
Ancestry in Adak
The most populous ancestries reported in Adak are Korean (63 | 25.4%), Aleut (38 | 15.3%), Mexican (36 | 14.5%), Italian (15 | 6.0%), and German (6 | 2.4%), together accounting for 63.7% of all Adak residents.
| Ancestry | # Population | % Population |
| Aleut | 38 | 15.3% |
| Cherokee | 4 | 1.6% |
| Choctaw | 1 | 0.4% |
| German | 6 | 2.4% |
| Inupiat | 2 | 0.8% |
| Irish | 4 | 1.6% |
| Italian | 15 | 6.0% |
| Korean | 63 | 25.4% |
| Mexican | 36 | 14.5% |
| Russian | 1 | 0.4% |
| Scottish | 4 | 1.6% |
| Slovak | 3 | 1.2% |
| Swedish | 4 | 1.6% | View All 13 Rows |
Immigrants in Adak
The most numerous immigrant groups reported in Adak came from Asia (63 | 25.4%), Philippines (63 | 25.4%), South Eastern Asia (63 | 25.4%), Central America (7 | 2.8%), and Latin America (7 | 2.8%), together accounting for 81.8% of all Adak residents.
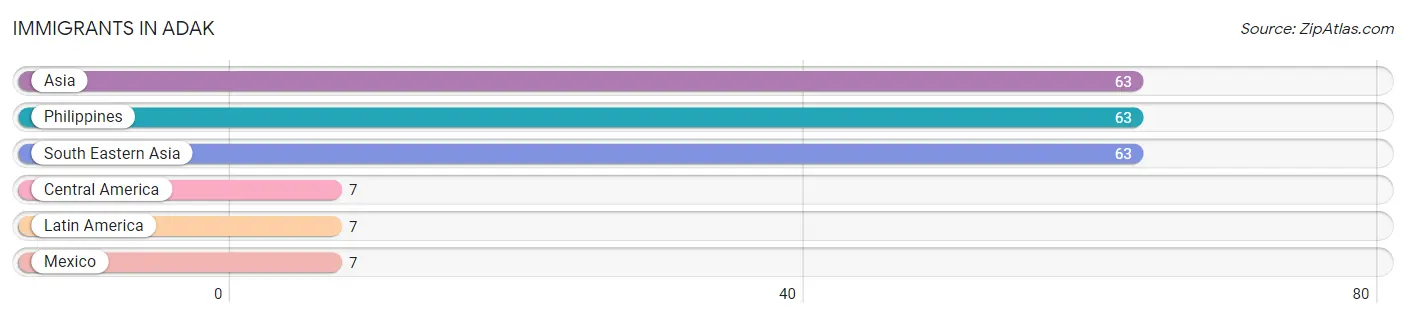
| Immigration Origin | # Population | % Population |
| Asia | 63 | 25.4% |
| Central America | 7 | 2.8% |
| Latin America | 7 | 2.8% |
| Mexico | 7 | 2.8% |
| Philippines | 63 | 25.4% |
| South Eastern Asia | 63 | 25.4% | View All 6 Rows |
Sex and Age in Adak
Sex and Age in Adak
The most populous age groups in Adak are 50 to 54 Years (71 | 41.0%) for men and 20 to 24 Years (21 | 28.0%) for women.
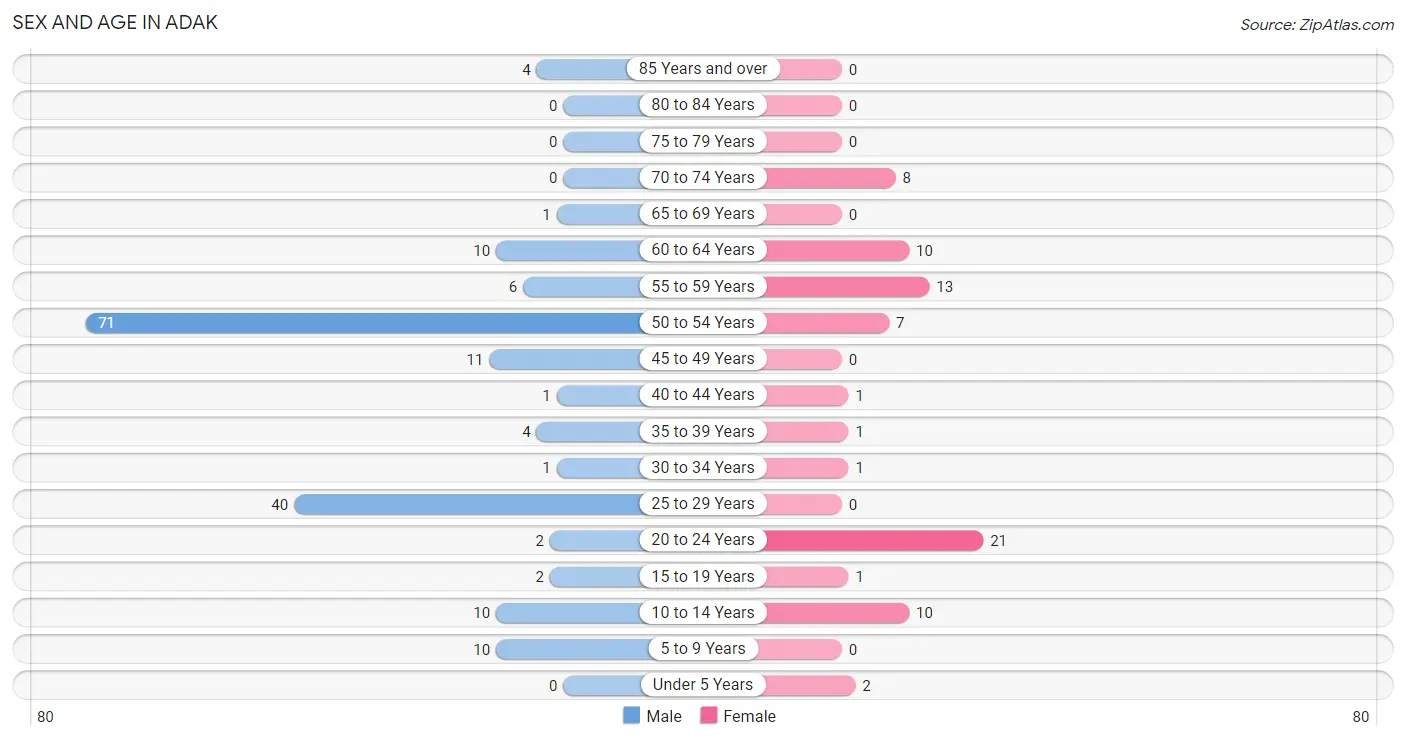
| Age Bracket | Male | Female |
| Under 5 Years | 0 (0.0%) | 2 (2.7%) |
| 5 to 9 Years | 10 (5.8%) | 0 (0.0%) |
| 10 to 14 Years | 10 (5.8%) | 10 (13.3%) |
| 15 to 19 Years | 2 (1.2%) | 1 (1.3%) |
| 20 to 24 Years | 2 (1.2%) | 21 (28.0%) |
| 25 to 29 Years | 40 (23.1%) | 0 (0.0%) |
| 30 to 34 Years | 1 (0.6%) | 1 (1.3%) |
| 35 to 39 Years | 4 (2.3%) | 1 (1.3%) |
| 40 to 44 Years | 1 (0.6%) | 1 (1.3%) |
| 45 to 49 Years | 11 (6.4%) | 0 (0.0%) |
| 50 to 54 Years | 71 (41.0%) | 7 (9.3%) |
| 55 to 59 Years | 6 (3.5%) | 13 (17.3%) |
| 60 to 64 Years | 10 (5.8%) | 10 (13.3%) |
| 65 to 69 Years | 1 (0.6%) | 0 (0.0%) |
| 70 to 74 Years | 0 (0.0%) | 8 (10.7%) |
| 75 to 79 Years | 0 (0.0%) | 0 (0.0%) |
| 80 to 84 Years | 0 (0.0%) | 0 (0.0%) |
| 85 Years and over | 4 (2.3%) | 0 (0.0%) |
| Total | 173 (100.0%) | 75 (100.0%) |
Families and Households in Adak
Median Family Size in Adak
The median family size in Adak is 3.50 persons per family, with single male/father families (3 | 11.5%) accounting for the largest median family size of 10.67 persons per family. On the other hand, married-couple families (21 | 80.8%) represent the smallest median family size with 2.52 persons per family.
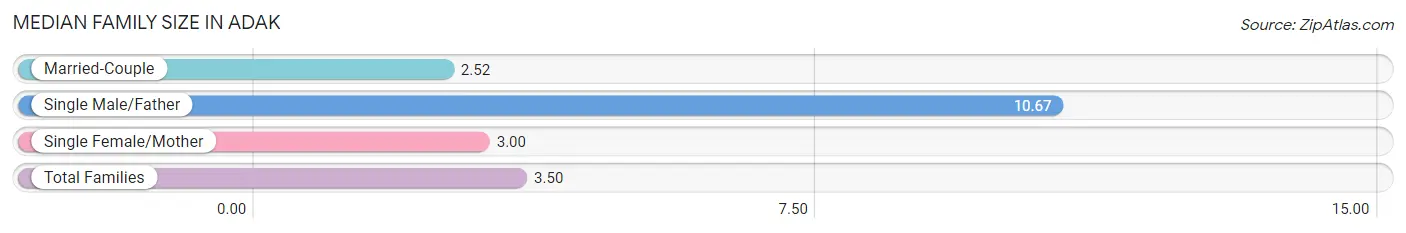
| Family Type | # Families | Family Size |
| Married-Couple | 21 (80.8%) | 2.52 |
| Single Male/Father | 3 (11.5%) | 10.67 |
| Single Female/Mother | 2 (7.7%) | 3.00 |
| Total Families | 26 (100.0%) | 3.50 |
Median Household Size in Adak
The median household size in Adak is 3.22 persons per household, with single male/father households (3 | 3.9%) accounting for the largest median household size of 11 persons per household. non-family households (51 | 66.2%) represent the smallest median household size with 2.22 persons per household.
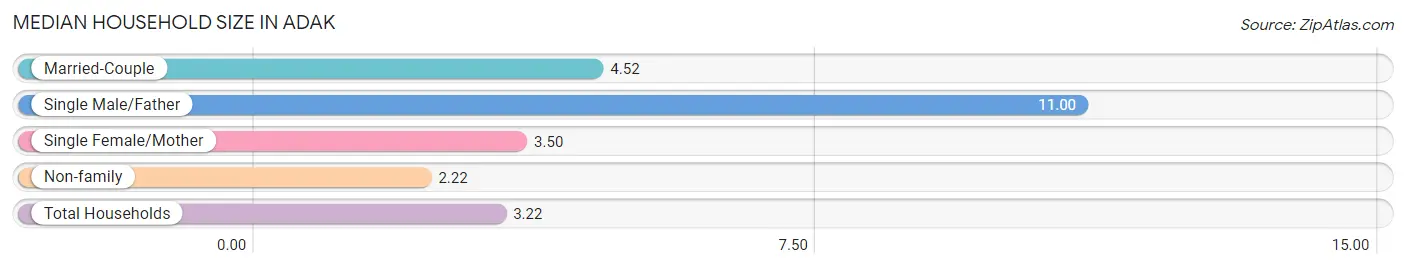
| Household Type | # Households | Household Size |
| Married-Couple | 21 (27.3%) | 4.52 |
| Single Male/Father | 3 (3.9%) | 11.00 |
| Single Female/Mother | 2 (2.6%) | 3.50 |
| Non-family | 51 (66.2%) | 2.22 |
| Total Households | 77 (100.0%) | 3.22 |
Household Size by Marriage Status in Adak
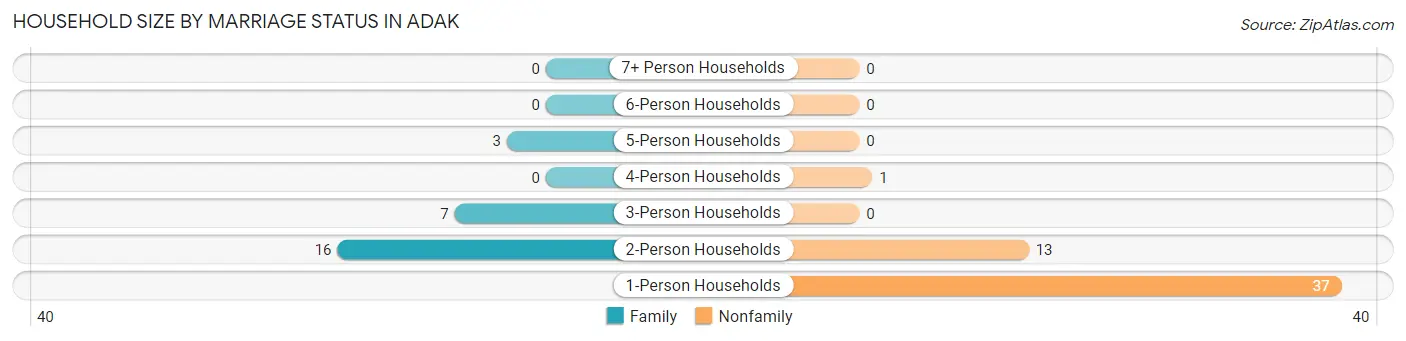
Out of a total of 77 households in Adak, 26 (33.8%) are family households, while 51 (66.2%) are nonfamily households. The most numerous type of family households are 2-person households, comprising 16, and the most common type of nonfamily households are 1-person households, comprising 37.
| Household Size | Family Households | Nonfamily Households |
| 1-Person Households | - | 37 (48.0%) |
| 2-Person Households | 16 (20.8%) | 13 (16.9%) |
| 3-Person Households | 7 (9.1%) | 0 (0.0%) |
| 4-Person Households | 0 (0.0%) | 1 (1.3%) |
| 5-Person Households | 3 (3.9%) | 0 (0.0%) |
| 6-Person Households | 0 (0.0%) | 0 (0.0%) |
| 7+ Person Households | 0 (0.0%) | 0 (0.0%) |
| Total | 26 (33.8%) | 51 (66.2%) |
Female Fertility in Adak
Fertility by Age in Adak
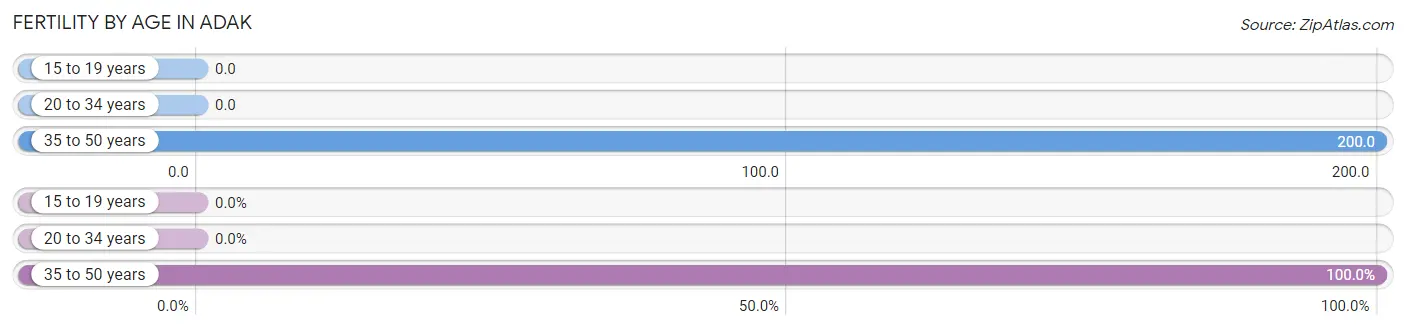
Average fertility rate in Adak is 36.0 births per 1,000 women. Women in the age bracket of 35 to 50 years have the highest fertility rate with 200.0 births per 1,000 women. Women in the age bracket of 35 to 50 years acount for 100.0% of all women with births.
| Age Bracket | Women with Births | Births / 1,000 Women |
| 15 to 19 years | 0 (0.0%) | 0.0 |
| 20 to 34 years | 0 (0.0%) | 0.0 |
| 35 to 50 years | 1 (100.0%) | 200.0 |
| Total | 1 (100.0%) | 36.0 |
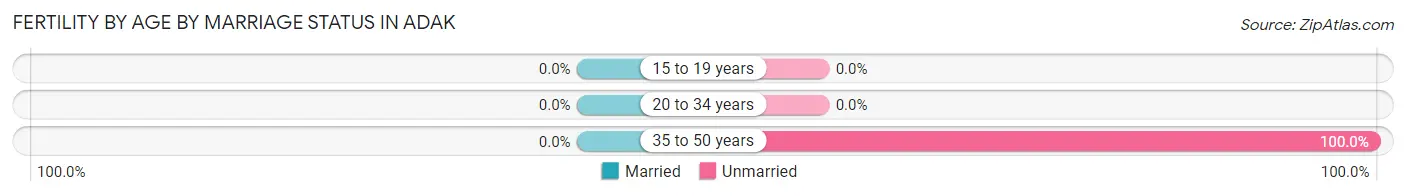
Fertility by Age by Marriage Status in Adak
| Age Bracket | Married | Unmarried |
| 15 to 19 years | 0 (0.0%) | 0 (0.0%) |
| 20 to 34 years | 0 (0.0%) | 0 (0.0%) |
| 35 to 50 years | 0 (0.0%) | 1 (100.0%) |
| Total | 0 (0.0%) | 1 (100.0%) |
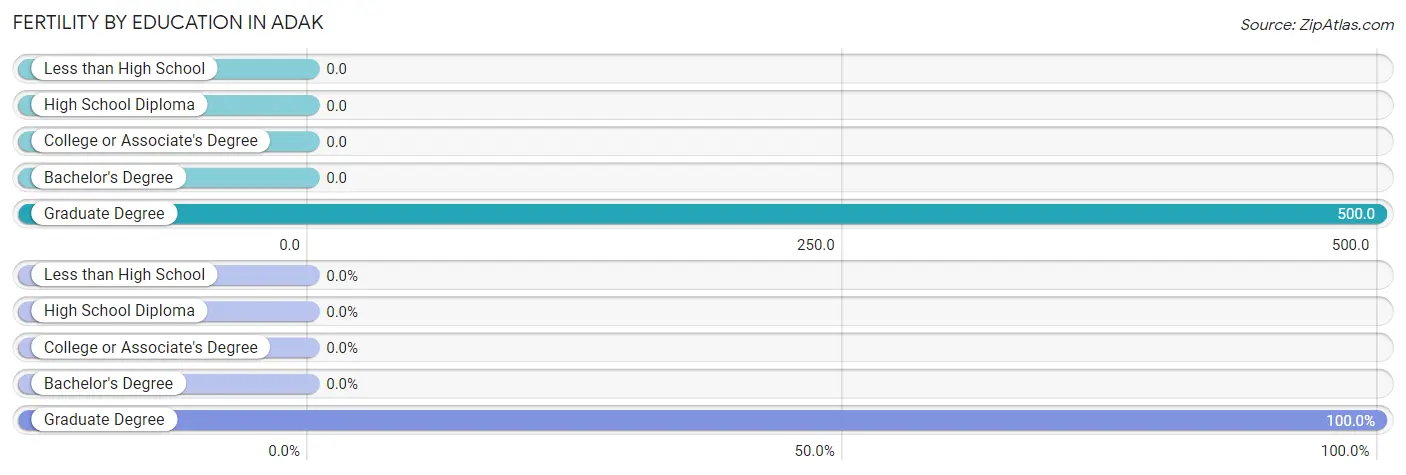
Fertility by Education in Adak
| Educational Attainment | Women with Births | Births / 1,000 Women |
| Less than High School | 0 (0.0%) | 0.0 |
| High School Diploma | 0 (0.0%) | 0.0 |
| College or Associate's Degree | 0 (0.0%) | 0.0 |
| Bachelor's Degree | 0 (0.0%) | 0.0 |
| Graduate Degree | 1 (100.0%) | 500.0 |
| Total | 1 (100.0%) | 36.0 |
Fertility by Education by Marriage Status in Adak
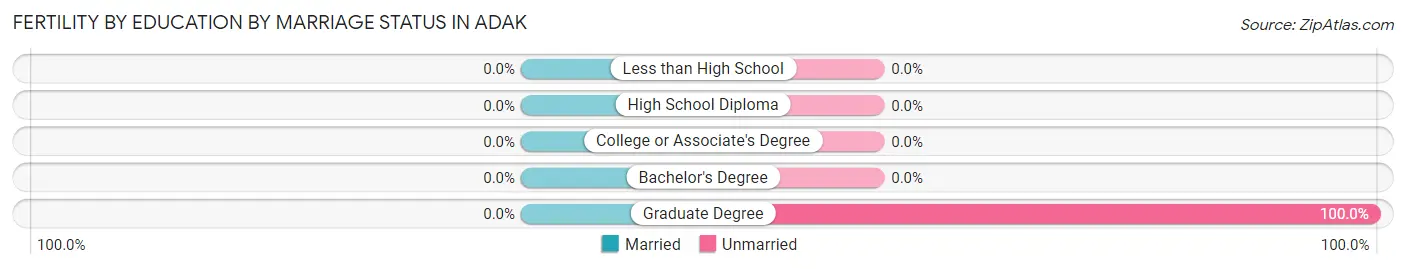
| Educational Attainment | Married | Unmarried |
| Less than High School | 0 (0.0%) | 0 (0.0%) |
| High School Diploma | 0 (0.0%) | 0 (0.0%) |
| College or Associate's Degree | 0 (0.0%) | 0 (0.0%) |
| Bachelor's Degree | 0 (0.0%) | 0 (0.0%) |
| Graduate Degree | 0 (0.0%) | 1 (100.0%) |
| Total | 0 (0.0%) | 1 (100.0%) |
Employment Characteristics in Adak
Employment by Class of Employer in Adak
Among the 193 employed individuals in Adak, private company employees (162 | 83.9%), local government employees (13 | 6.7%), and federal government employees (8 | 4.2%) make up the most common classes of employment.
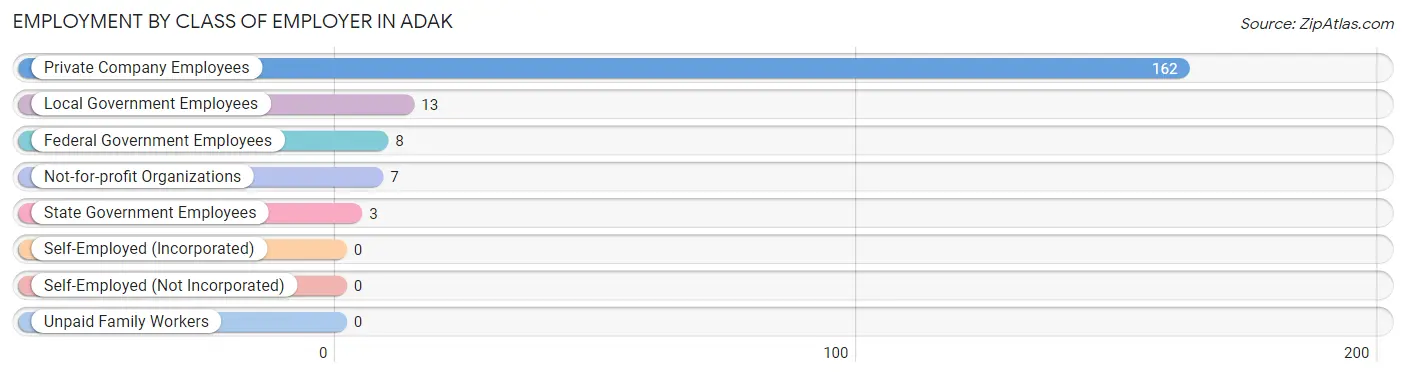
| Employer Class | # Employees | % Employees |
| Private Company Employees | 162 | 83.9% |
| Self-Employed (Incorporated) | 0 | 0.0% |
| Self-Employed (Not Incorporated) | 0 | 0.0% |
| Not-for-profit Organizations | 7 | 3.6% |
| Local Government Employees | 13 | 6.7% |
| State Government Employees | 3 | 1.5% |
| Federal Government Employees | 8 | 4.2% |
| Unpaid Family Workers | 0 | 0.0% |
| Total | 193 | 100.0% |
Employment Status by Age in Adak
According to the labor force statistics for Adak, out of the total population over 16 years of age (216), 90.7% or 196 individuals are in the labor force, with 1.5% or 3 of them unemployed. The age group with the highest labor force participation rate is 20 to 24 years, with 100.0% or 23 individuals in the labor force. Within the labor force, the 55 to 59 years age range has the highest percentage of unemployed individuals, with 18.8% or 3 of them being unemployed.
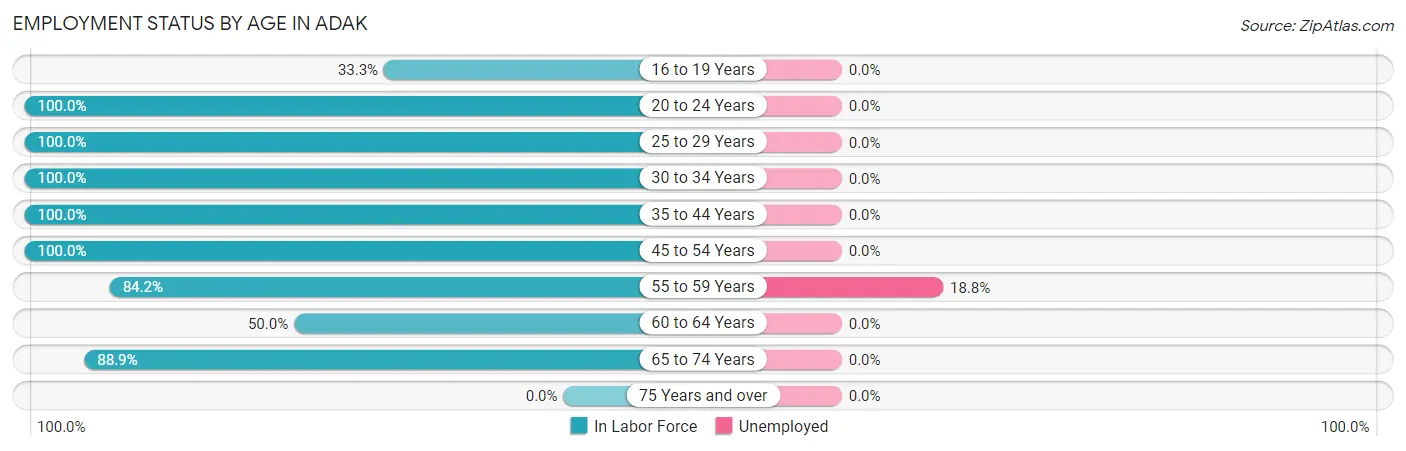
| Age Bracket | In Labor Force | Unemployed |
| 16 to 19 Years | 1 (33.3%) | 0 (0.0%) |
| 20 to 24 Years | 23 (100.0%) | 0 (0.0%) |
| 25 to 29 Years | 40 (100.0%) | 0 (0.0%) |
| 30 to 34 Years | 2 (100.0%) | 0 (0.0%) |
| 35 to 44 Years | 7 (100.0%) | 0 (0.0%) |
| 45 to 54 Years | 89 (100.0%) | 0 (0.0%) |
| 55 to 59 Years | 16 (84.2%) | 3 (18.8%) |
| 60 to 64 Years | 10 (50.0%) | 0 (0.0%) |
| 65 to 74 Years | 8 (88.9%) | 0 (0.0%) |
| 75 Years and over | 0 (0.0%) | 0 (0.0%) |
| Total | 196 (90.7%) | 3 (1.5%) |
Employment Status by Educational Attainment in Adak
According to labor force statistics for Adak, 92.7% of individuals (164) out of the total population between 25 and 64 years of age (177) are in the labor force, with 1.8% or 3 of them being unemployed. The group with the highest labor force participation rate are those with the educational attainment of less than high school, with 100.0% or 23 individuals in the labor force. Within the labor force, individuals with college / associate degree education have the highest percentage of unemployment, with 8.6% or 3 of them being unemployed.
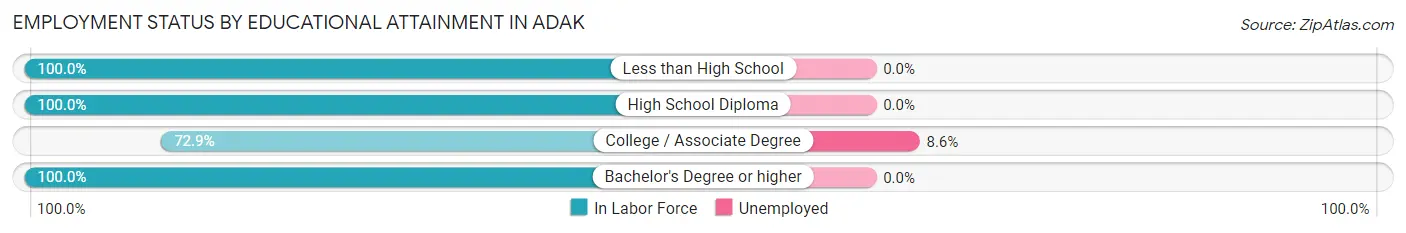
| Educational Attainment | In Labor Force | Unemployed |
| Less than High School | 23 (100.0%) | 0 (0.0%) |
| High School Diploma | 92 (100.0%) | 0 (0.0%) |
| College / Associate Degree | 35 (72.9%) | 4 (8.6%) |
| Bachelor's Degree or higher | 14 (100.0%) | 0 (0.0%) |
| Total | 164 (92.7%) | 3 (1.8%) |
Employment Occupations by Sex in Adak
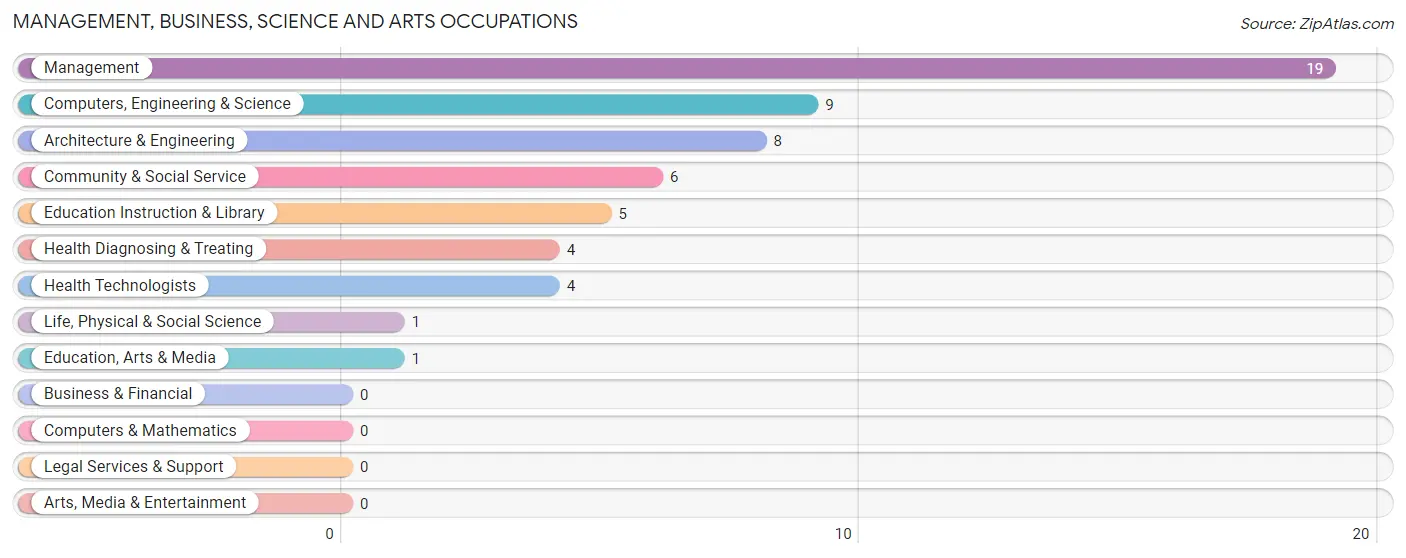
Management, Business, Science and Arts Occupations
The most common Management, Business, Science and Arts occupations in Adak are Management (19 | 9.8%), Computers, Engineering & Science (9 | 4.7%), Architecture & Engineering (8 | 4.2%), Community & Social Service (6 | 3.1%), and Education Instruction & Library (5 | 2.6%).
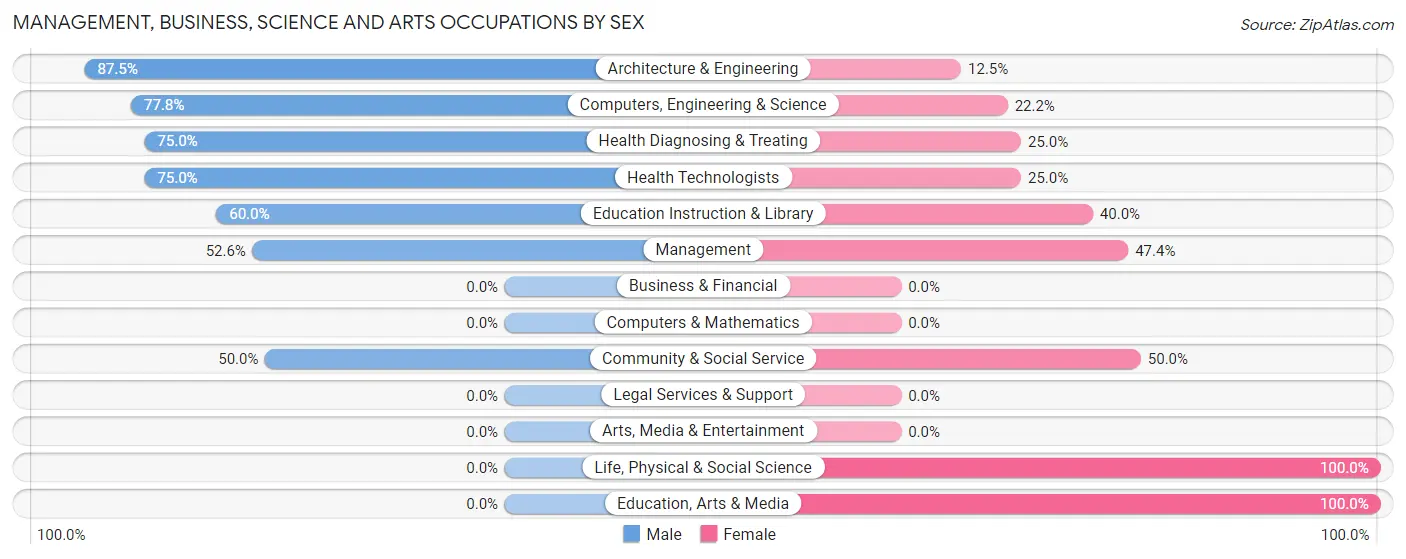
Management, Business, Science and Arts Occupations by Sex
Within the Management, Business, Science and Arts occupations in Adak, the most male-oriented occupations are Architecture & Engineering (87.5%), Computers, Engineering & Science (77.8%), and Health Diagnosing & Treating (75.0%), while the most female-oriented occupations are Life, Physical & Social Science (100.0%), Education, Arts & Media (100.0%), and Community & Social Service (50.0%).
| Occupation | Male | Female |
| Management | 10 (52.6%) | 9 (47.4%) |
| Business & Financial | 0 (0.0%) | 0 (0.0%) |
| Computers, Engineering & Science | 7 (77.8%) | 2 (22.2%) |
| Computers & Mathematics | 0 (0.0%) | 0 (0.0%) |
| Architecture & Engineering | 7 (87.5%) | 1 (12.5%) |
| Life, Physical & Social Science | 0 (0.0%) | 1 (100.0%) |
| Community & Social Service | 3 (50.0%) | 3 (50.0%) |
| Education, Arts & Media | 0 (0.0%) | 1 (100.0%) |
| Legal Services & Support | 0 (0.0%) | 0 (0.0%) |
| Education Instruction & Library | 3 (60.0%) | 2 (40.0%) |
| Arts, Media & Entertainment | 0 (0.0%) | 0 (0.0%) |
| Health Diagnosing & Treating | 3 (75.0%) | 1 (25.0%) |
| Health Technologists | 3 (75.0%) | 1 (25.0%) |
| Total (Category) | 23 (60.5%) | 15 (39.5%) |
| Total (Overall) | 143 (74.1%) | 50 (25.9%) |
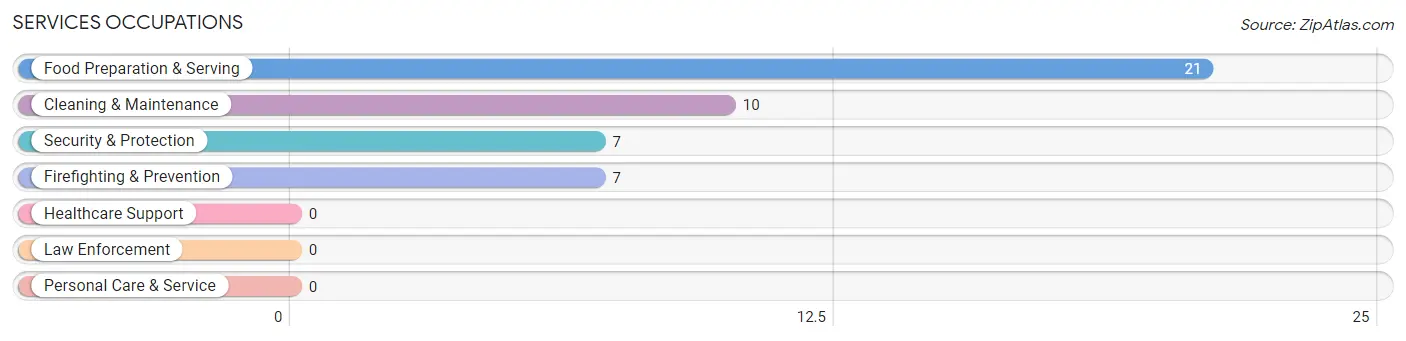
Services Occupations
The most common Services occupations in Adak are Food Preparation & Serving (21 | 10.9%), Cleaning & Maintenance (10 | 5.2%), Security & Protection (7 | 3.6%), and Firefighting & Prevention (7 | 3.6%).
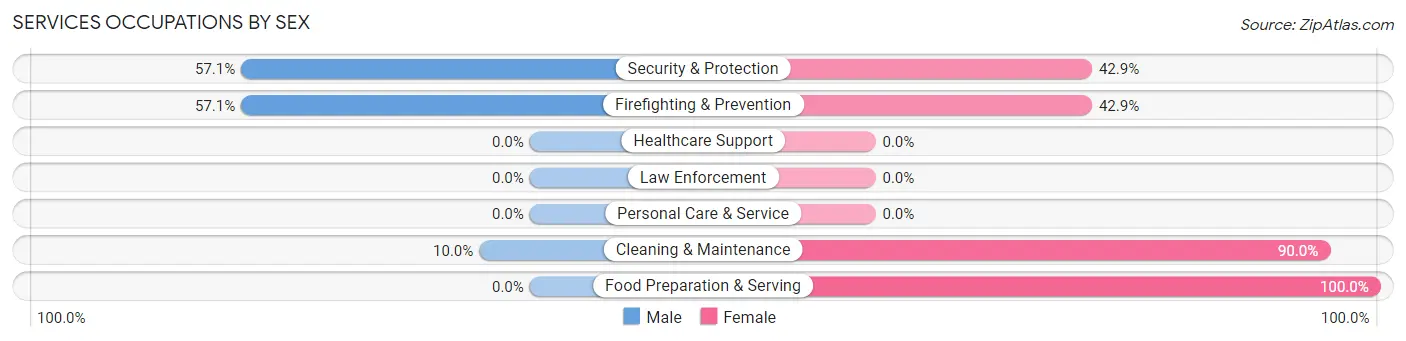
Services Occupations by Sex
Within the Services occupations in Adak, the most male-oriented occupations are Security & Protection (57.1%), Firefighting & Prevention (57.1%), and Cleaning & Maintenance (10.0%), while the most female-oriented occupations are Food Preparation & Serving (100.0%), Cleaning & Maintenance (90.0%), and Security & Protection (42.9%).
| Occupation | Male | Female |
| Healthcare Support | 0 (0.0%) | 0 (0.0%) |
| Security & Protection | 4 (57.1%) | 3 (42.9%) |
| Firefighting & Prevention | 4 (57.1%) | 3 (42.9%) |
| Law Enforcement | 0 (0.0%) | 0 (0.0%) |
| Food Preparation & Serving | 0 (0.0%) | 21 (100.0%) |
| Cleaning & Maintenance | 1 (10.0%) | 9 (90.0%) |
| Personal Care & Service | 0 (0.0%) | 0 (0.0%) |
| Total (Category) | 5 (13.2%) | 33 (86.8%) |
| Total (Overall) | 143 (74.1%) | 50 (25.9%) |
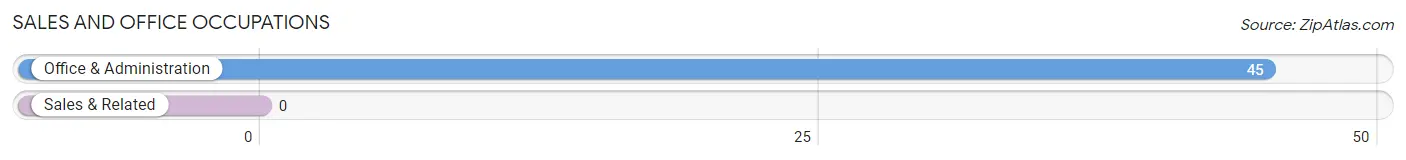
Sales and Office Occupations
The most common Sales and Office occupations in Adak are , and Office & Administration (45 | 23.3%).
Sales and Office Occupations by Sex
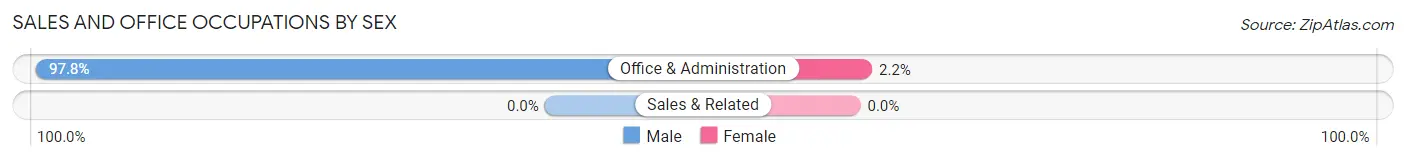
| Occupation | Male | Female |
| Sales & Related | 0 (0.0%) | 0 (0.0%) |
| Office & Administration | 44 (97.8%) | 1 (2.2%) |
| Total (Category) | 44 (97.8%) | 1 (2.2%) |
| Total (Overall) | 143 (74.1%) | 50 (25.9%) |
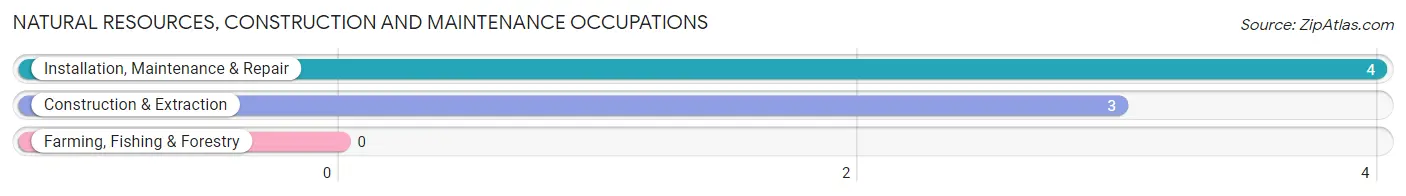
Natural Resources, Construction and Maintenance Occupations
The most common Natural Resources, Construction and Maintenance occupations in Adak are Installation, Maintenance & Repair (4 | 2.1%), and Construction & Extraction (3 | 1.5%).
Natural Resources, Construction and Maintenance Occupations by Sex
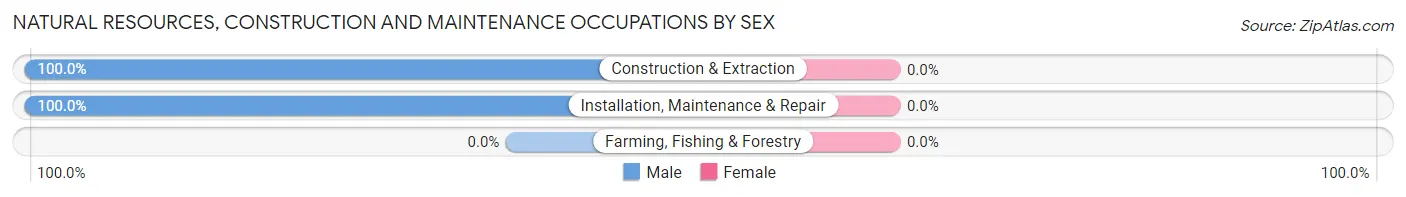
| Occupation | Male | Female |
| Farming, Fishing & Forestry | 0 (0.0%) | 0 (0.0%) |
| Construction & Extraction | 3 (100.0%) | 0 (0.0%) |
| Installation, Maintenance & Repair | 4 (100.0%) | 0 (0.0%) |
| Total (Category) | 7 (100.0%) | 0 (0.0%) |
| Total (Overall) | 143 (74.1%) | 50 (25.9%) |
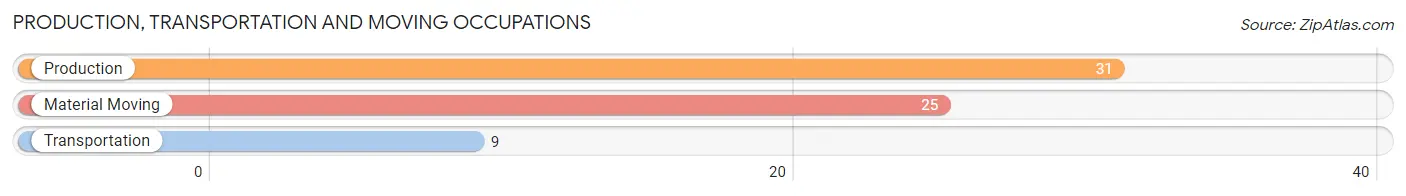
Production, Transportation and Moving Occupations
The most common Production, Transportation and Moving occupations in Adak are Production (31 | 16.1%), Material Moving (25 | 13.0%), and Transportation (9 | 4.7%).
Production, Transportation and Moving Occupations by Sex
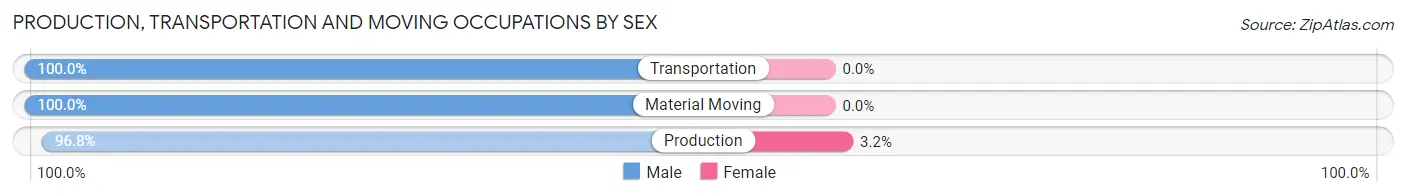
| Occupation | Male | Female |
| Production | 30 (96.8%) | 1 (3.2%) |
| Transportation | 9 (100.0%) | 0 (0.0%) |
| Material Moving | 25 (100.0%) | 0 (0.0%) |
| Total (Category) | 64 (98.5%) | 1 (1.5%) |
| Total (Overall) | 143 (74.1%) | 50 (25.9%) |
Employment Industries by Sex in Adak
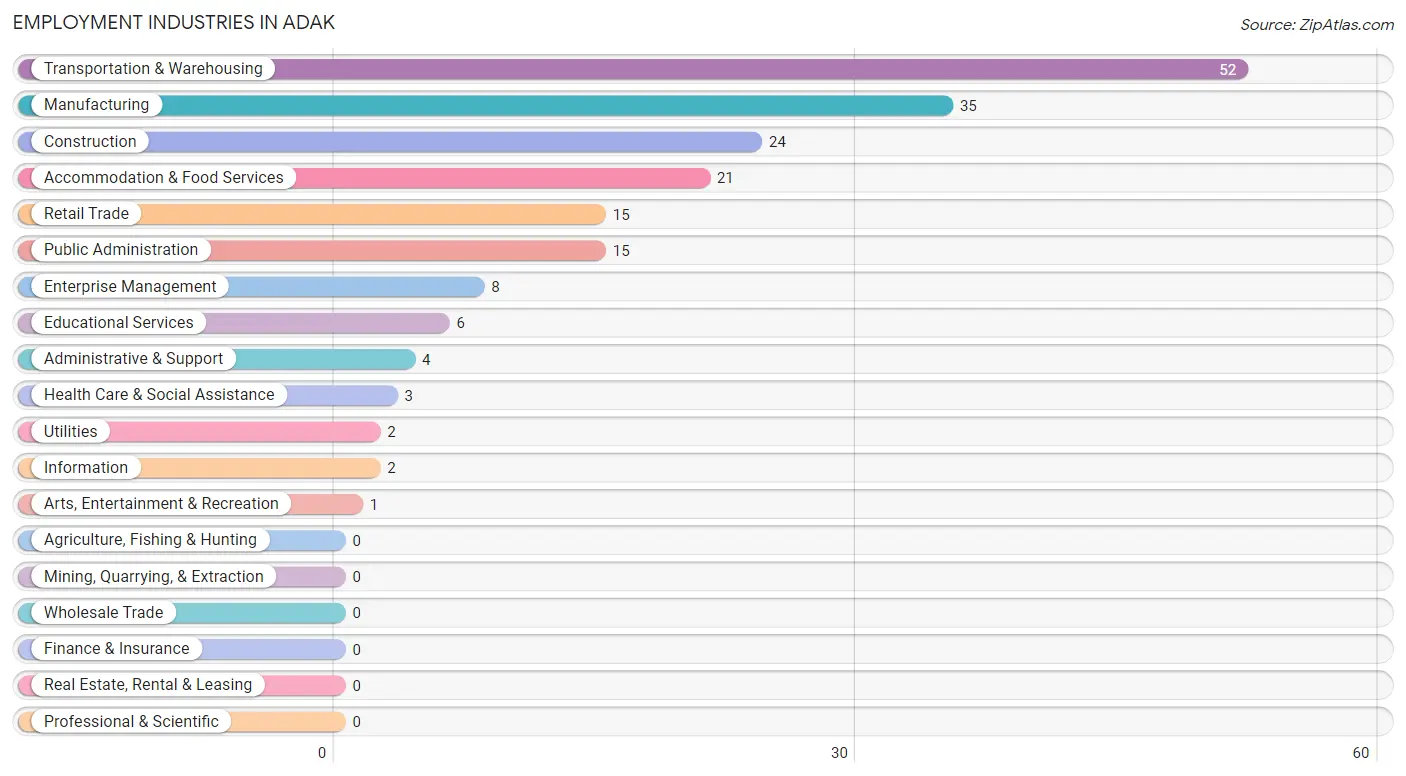
Employment Industries in Adak
The major employment industries in Adak include Transportation & Warehousing (52 | 26.9%), Manufacturing (35 | 18.1%), Construction (24 | 12.4%), Accommodation & Food Services (21 | 10.9%), and Retail Trade (15 | 7.8%).
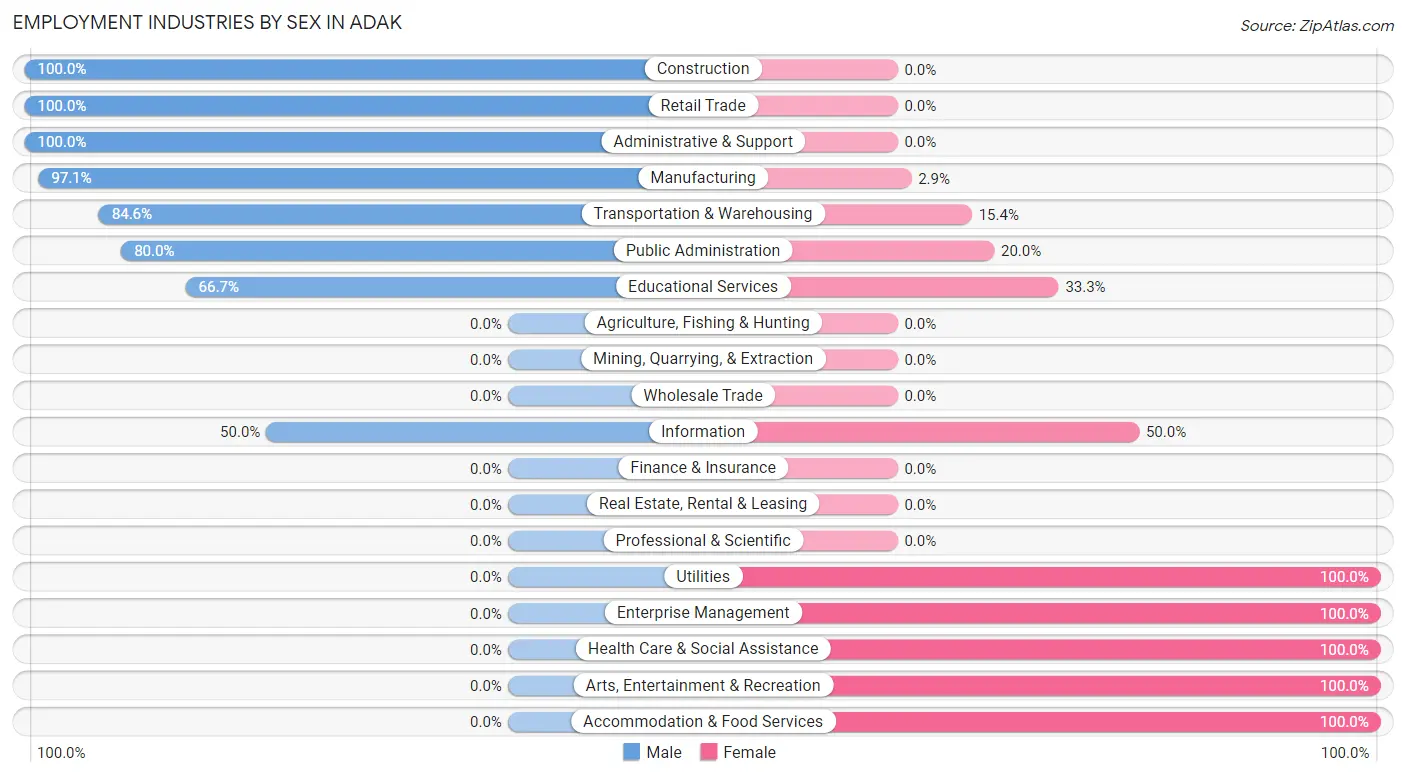
Employment Industries by Sex in Adak
The Adak industries that see more men than women are Construction (100.0%), Retail Trade (100.0%), and Administrative & Support (100.0%), whereas the industries that tend to have a higher number of women are Utilities (100.0%), Enterprise Management (100.0%), and Health Care & Social Assistance (100.0%).
| Industry | Male | Female |
| Agriculture, Fishing & Hunting | 0 (0.0%) | 0 (0.0%) |
| Mining, Quarrying, & Extraction | 0 (0.0%) | 0 (0.0%) |
| Construction | 24 (100.0%) | 0 (0.0%) |
| Manufacturing | 34 (97.1%) | 1 (2.9%) |
| Wholesale Trade | 0 (0.0%) | 0 (0.0%) |
| Retail Trade | 15 (100.0%) | 0 (0.0%) |
| Transportation & Warehousing | 44 (84.6%) | 8 (15.4%) |
| Utilities | 0 (0.0%) | 2 (100.0%) |
| Information | 1 (50.0%) | 1 (50.0%) |
| Finance & Insurance | 0 (0.0%) | 0 (0.0%) |
| Real Estate, Rental & Leasing | 0 (0.0%) | 0 (0.0%) |
| Professional & Scientific | 0 (0.0%) | 0 (0.0%) |
| Enterprise Management | 0 (0.0%) | 8 (100.0%) |
| Administrative & Support | 4 (100.0%) | 0 (0.0%) |
| Educational Services | 4 (66.7%) | 2 (33.3%) |
| Health Care & Social Assistance | 0 (0.0%) | 3 (100.0%) |
| Arts, Entertainment & Recreation | 0 (0.0%) | 1 (100.0%) |
| Accommodation & Food Services | 0 (0.0%) | 21 (100.0%) |
| Public Administration | 12 (80.0%) | 3 (20.0%) |
| Total | 143 (74.1%) | 50 (25.9%) |
Education in Adak
School Enrollment in Adak
The most common levels of schooling among the 32 students in Adak are middle school (19 | 59.4%), elementary school (10 | 31.2%), and high school (3 | 9.4%).
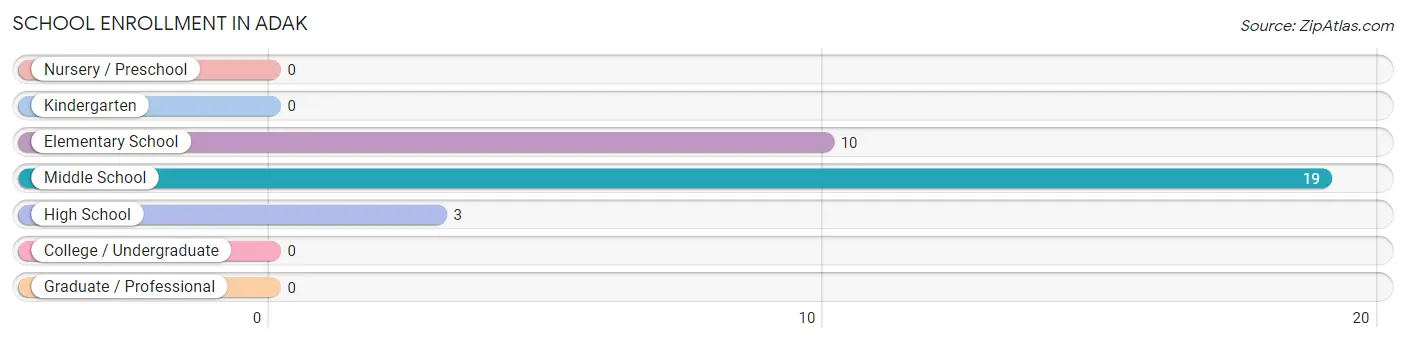
| School Level | # Students | % Students |
| Nursery / Preschool | 0 | 0.0% |
| Kindergarten | 0 | 0.0% |
| Elementary School | 10 | 31.2% |
| Middle School | 19 | 59.4% |
| High School | 3 | 9.4% |
| College / Undergraduate | 0 | 0.0% |
| Graduate / Professional | 0 | 0.0% |
| Total | 32 | 100.0% |
School Enrollment by Age by Funding Source in Adak
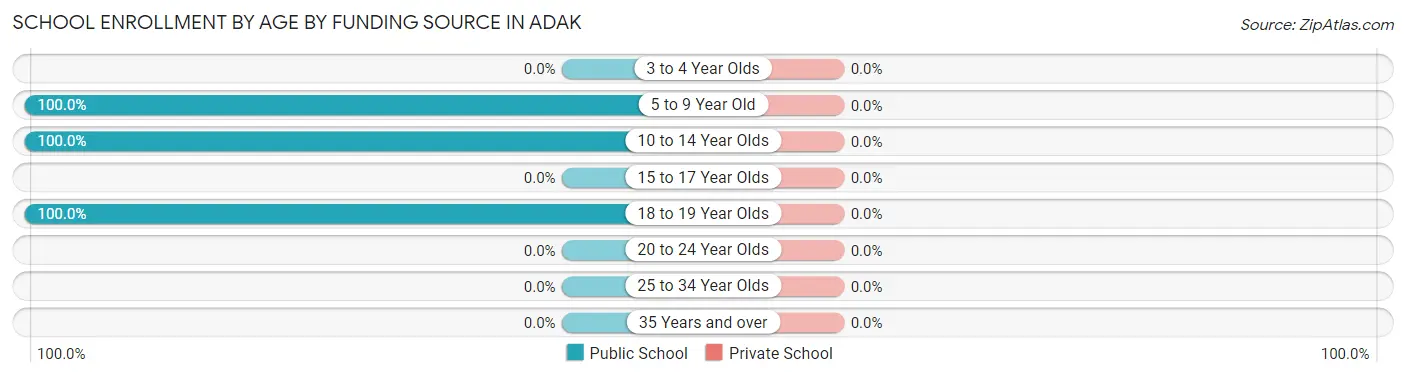
| Age Bracket | Public School | Private School |
| 3 to 4 Year Olds | 0 (0.0%) | 0 (0.0%) |
| 5 to 9 Year Old | 10 (100.0%) | 0 (0.0%) |
| 10 to 14 Year Olds | 20 (100.0%) | 0 (0.0%) |
| 15 to 17 Year Olds | 0 (0.0%) | 0 (0.0%) |
| 18 to 19 Year Olds | 2 (100.0%) | 0 (0.0%) |
| 20 to 24 Year Olds | 0 (0.0%) | 0 (0.0%) |
| 25 to 34 Year Olds | 0 (0.0%) | 0 (0.0%) |
| 35 Years and over | 0 (0.0%) | 0 (0.0%) |
| Total | 32 (100.0%) | 0 (0.0%) |
Educational Attainment by Field of Study in Adak
Social sciences (4 | 26.7%), science & technology (4 | 26.7%), literature & languages (3 | 20.0%), education (2 | 13.3%), and bio, nature & agricultural (1 | 6.7%) are the most common fields of study among 15 individuals in Adak who have obtained a bachelor's degree or higher.
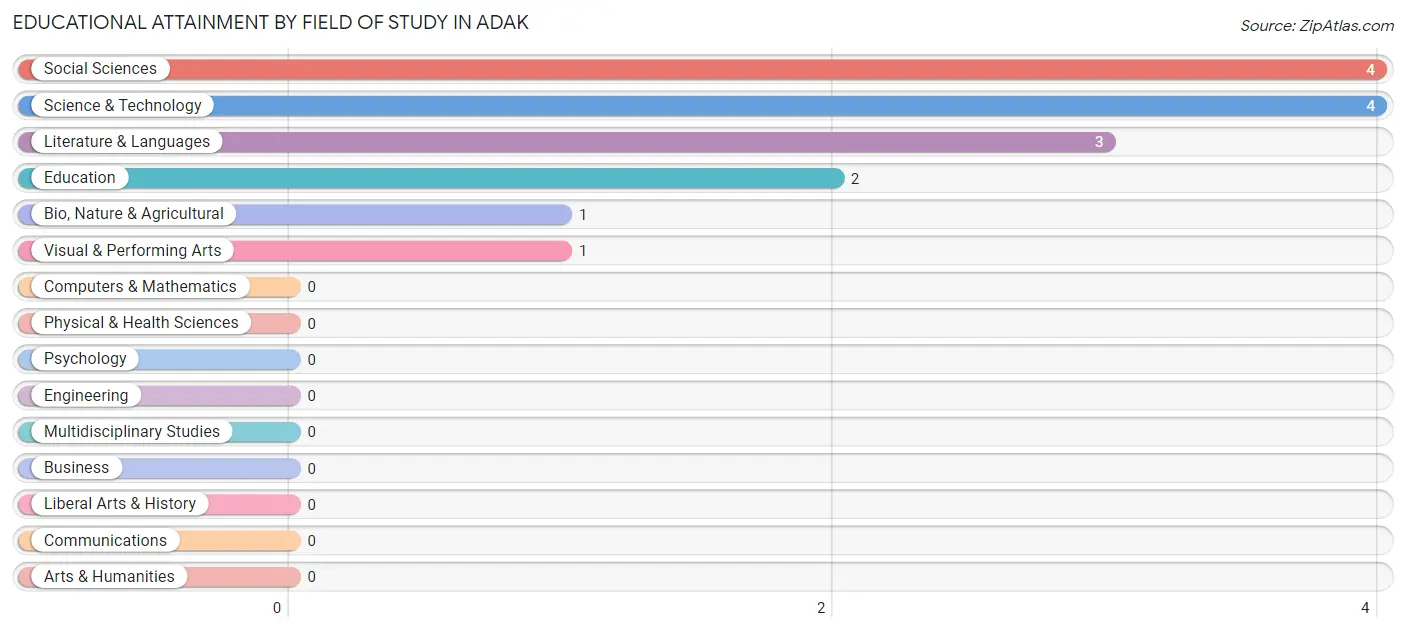
| Field of Study | # Graduates | % Graduates |
| Computers & Mathematics | 0 | 0.0% |
| Bio, Nature & Agricultural | 1 | 6.7% |
| Physical & Health Sciences | 0 | 0.0% |
| Psychology | 0 | 0.0% |
| Social Sciences | 4 | 26.7% |
| Engineering | 0 | 0.0% |
| Multidisciplinary Studies | 0 | 0.0% |
| Science & Technology | 4 | 26.7% |
| Business | 0 | 0.0% |
| Education | 2 | 13.3% |
| Literature & Languages | 3 | 20.0% |
| Liberal Arts & History | 0 | 0.0% |
| Visual & Performing Arts | 1 | 6.7% |
| Communications | 0 | 0.0% |
| Arts & Humanities | 0 | 0.0% |
| Total | 15 | 100.0% |
Transportation & Commute in Adak
Vehicle Availability by Sex in Adak
The most prevalent vehicle ownership categories in Adak are males with 1 vehicle (75, accounting for 52.4%) and females with 1 vehicle (38, making up 150.0%).
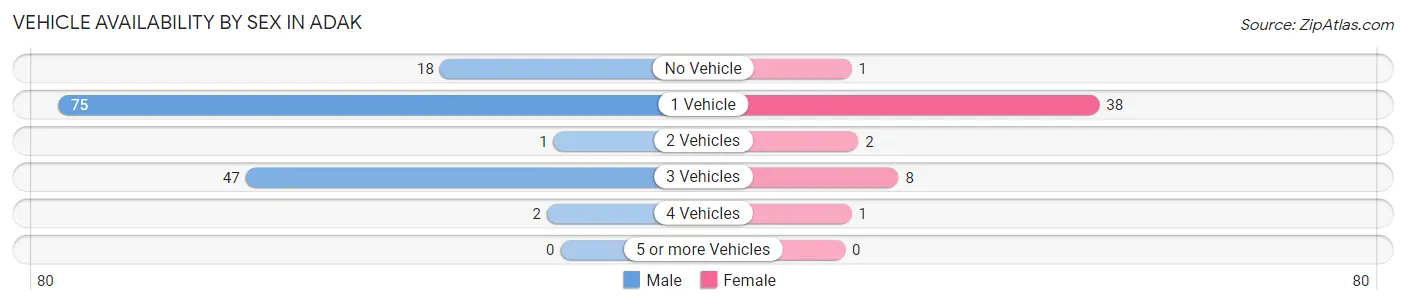
| Vehicles Available | Male | Female |
| No Vehicle | 18 (12.6%) | 1 (2.0%) |
| 1 Vehicle | 75 (52.4%) | 38 (76.0%) |
| 2 Vehicles | 1 (0.7%) | 2 (4.0%) |
| 3 Vehicles | 47 (32.9%) | 8 (16.0%) |
| 4 Vehicles | 2 (1.4%) | 1 (2.0%) |
| 5 or more Vehicles | 0 (0.0%) | 0 (0.0%) |
| Total | 143 (100.0%) | 50 (100.0%) |
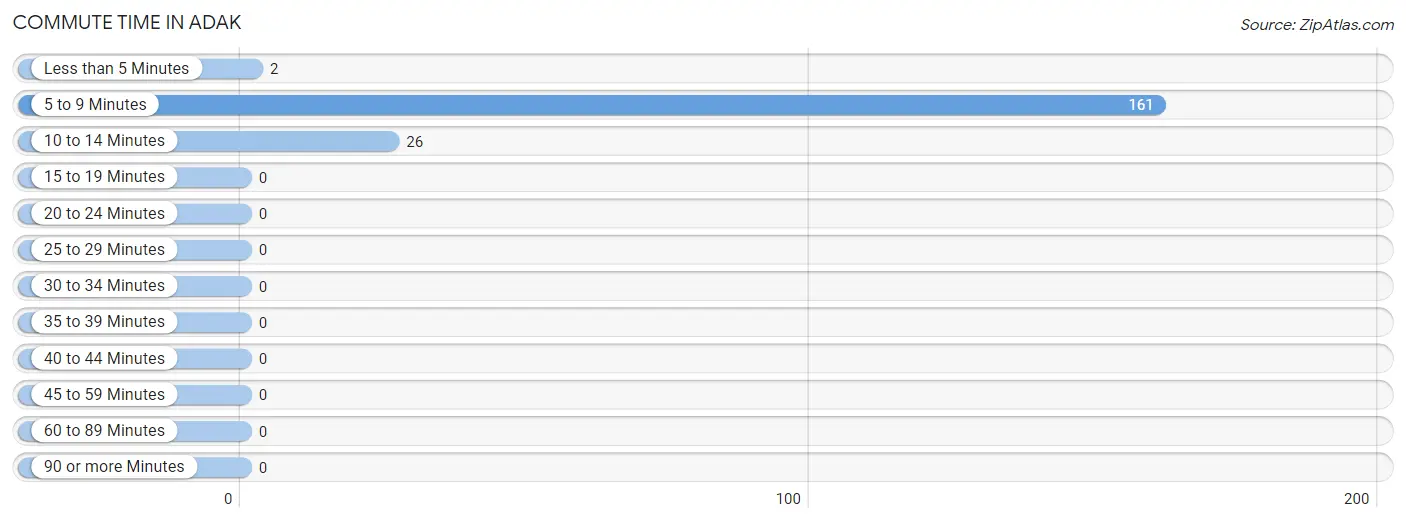
Commute Time in Adak
The most frequently occuring commute durations in Adak are 5 to 9 minutes (161 commuters, 85.2%), 10 to 14 minutes (26 commuters, 13.8%), and less than 5 minutes (2 commuters, 1.1%).
| Commute Time | # Commuters | % Commuters |
| Less than 5 Minutes | 2 | 1.1% |
| 5 to 9 Minutes | 161 | 85.2% |
| 10 to 14 Minutes | 26 | 13.8% |
| 15 to 19 Minutes | 0 | 0.0% |
| 20 to 24 Minutes | 0 | 0.0% |
| 25 to 29 Minutes | 0 | 0.0% |
| 30 to 34 Minutes | 0 | 0.0% |
| 35 to 39 Minutes | 0 | 0.0% |
| 40 to 44 Minutes | 0 | 0.0% |
| 45 to 59 Minutes | 0 | 0.0% |
| 60 to 89 Minutes | 0 | 0.0% |
| 90 or more Minutes | 0 | 0.0% |
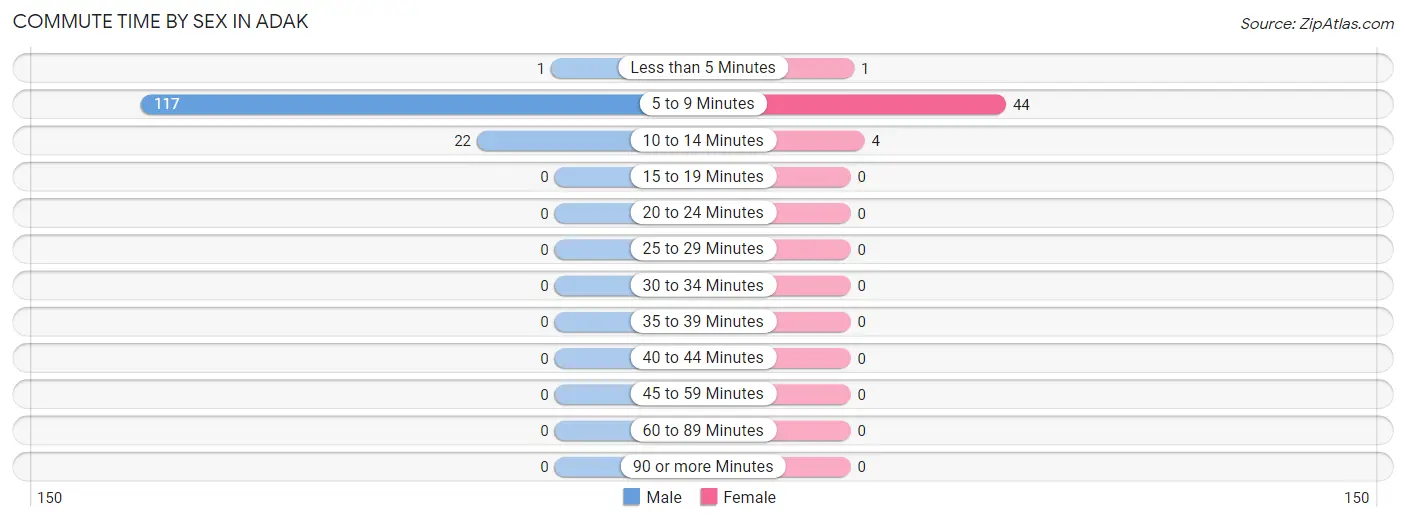
Commute Time by Sex in Adak
The most common commute times in Adak are 5 to 9 minutes (117 commuters, 83.6%) for males and 5 to 9 minutes (44 commuters, 89.8%) for females.
| Commute Time | Male | Female |
| Less than 5 Minutes | 1 (0.7%) | 1 (2.0%) |
| 5 to 9 Minutes | 117 (83.6%) | 44 (89.8%) |
| 10 to 14 Minutes | 22 (15.7%) | 4 (8.2%) |
| 15 to 19 Minutes | 0 (0.0%) | 0 (0.0%) |
| 20 to 24 Minutes | 0 (0.0%) | 0 (0.0%) |
| 25 to 29 Minutes | 0 (0.0%) | 0 (0.0%) |
| 30 to 34 Minutes | 0 (0.0%) | 0 (0.0%) |
| 35 to 39 Minutes | 0 (0.0%) | 0 (0.0%) |
| 40 to 44 Minutes | 0 (0.0%) | 0 (0.0%) |
| 45 to 59 Minutes | 0 (0.0%) | 0 (0.0%) |
| 60 to 89 Minutes | 0 (0.0%) | 0 (0.0%) |
| 90 or more Minutes | 0 (0.0%) | 0 (0.0%) |
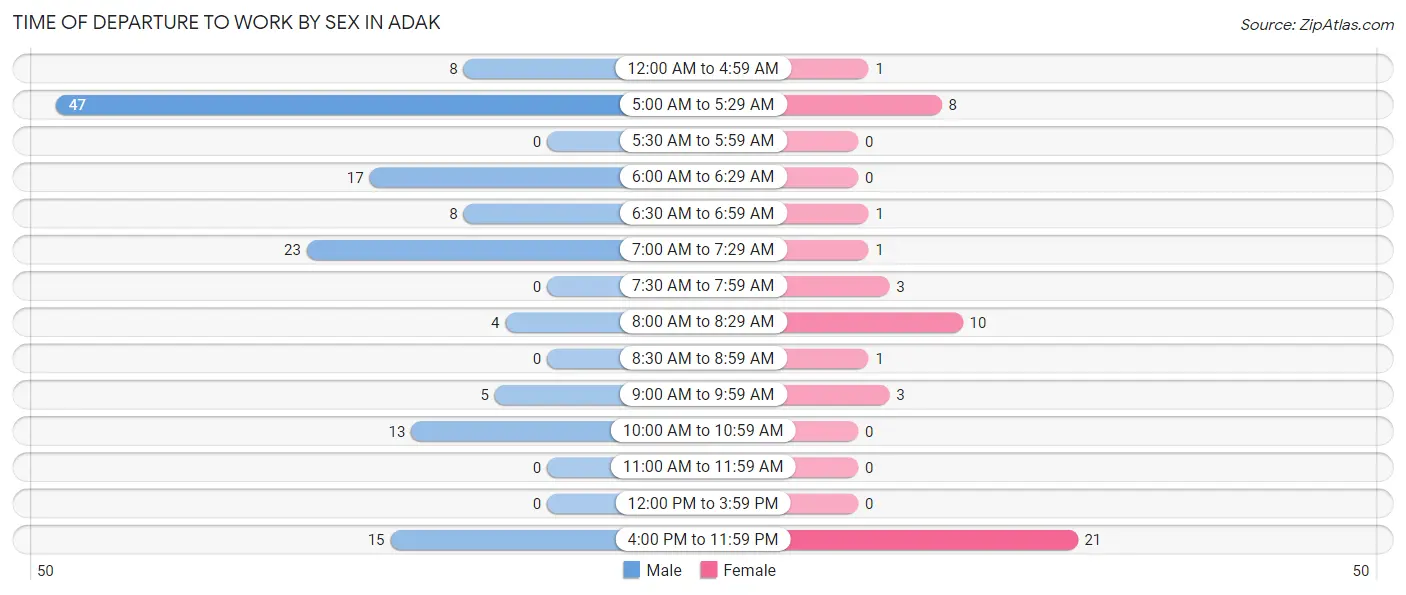
Time of Departure to Work by Sex in Adak
The most frequent times of departure to work in Adak are 5:00 AM to 5:29 AM (47, 33.6%) for males and 4:00 PM to 11:59 PM (21, 42.9%) for females.
| Time of Departure | Male | Female |
| 12:00 AM to 4:59 AM | 8 (5.7%) | 1 (2.0%) |
| 5:00 AM to 5:29 AM | 47 (33.6%) | 8 (16.3%) |
| 5:30 AM to 5:59 AM | 0 (0.0%) | 0 (0.0%) |
| 6:00 AM to 6:29 AM | 17 (12.1%) | 0 (0.0%) |
| 6:30 AM to 6:59 AM | 8 (5.7%) | 1 (2.0%) |
| 7:00 AM to 7:29 AM | 23 (16.4%) | 1 (2.0%) |
| 7:30 AM to 7:59 AM | 0 (0.0%) | 3 (6.1%) |
| 8:00 AM to 8:29 AM | 4 (2.9%) | 10 (20.4%) |
| 8:30 AM to 8:59 AM | 0 (0.0%) | 1 (2.0%) |
| 9:00 AM to 9:59 AM | 5 (3.6%) | 3 (6.1%) |
| 10:00 AM to 10:59 AM | 13 (9.3%) | 0 (0.0%) |
| 11:00 AM to 11:59 AM | 0 (0.0%) | 0 (0.0%) |
| 12:00 PM to 3:59 PM | 0 (0.0%) | 0 (0.0%) |
| 4:00 PM to 11:59 PM | 15 (10.7%) | 21 (42.9%) |
| Total | 140 (100.0%) | 49 (100.0%) |
Housing Occupancy in Adak
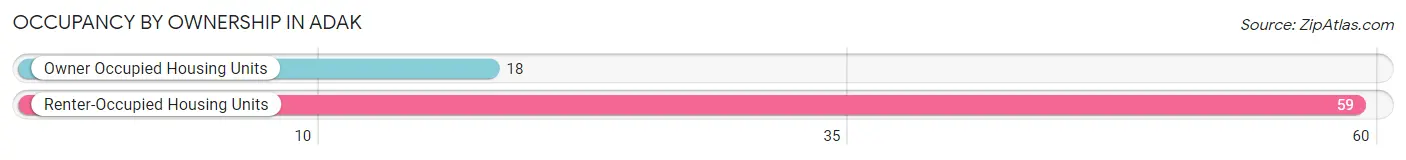
Occupancy by Ownership in Adak
Of the total 77 dwellings in Adak, owner-occupied units account for 18 (23.4%), while renter-occupied units make up 59 (76.6%).
| Occupancy | # Housing Units | % Housing Units |
| Owner Occupied Housing Units | 18 | 23.4% |
| Renter-Occupied Housing Units | 59 | 76.6% |
| Total Occupied Housing Units | 77 | 100.0% |
Occupancy by Household Size in Adak
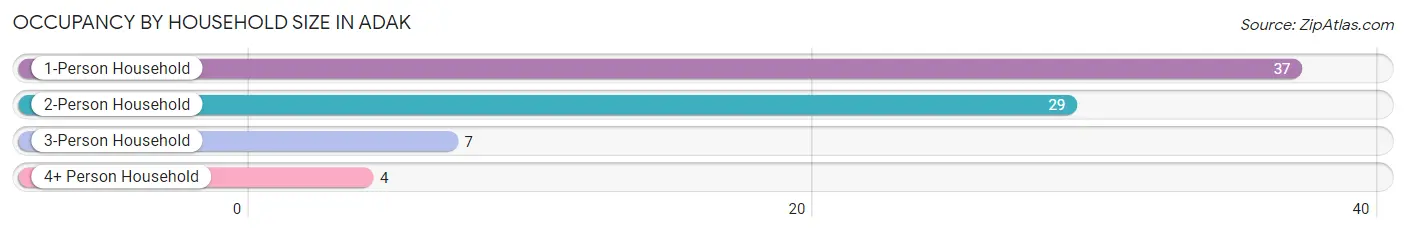
| Household Size | # Housing Units | % Housing Units |
| 1-Person Household | 37 | 48.0% |
| 2-Person Household | 29 | 37.7% |
| 3-Person Household | 7 | 9.1% |
| 4+ Person Household | 4 | 5.2% |
| Total Housing Units | 77 | 100.0% |
Occupancy by Ownership by Household Size in Adak
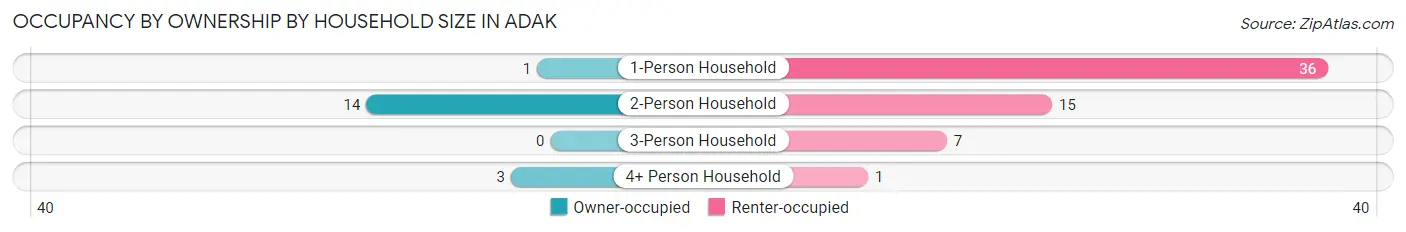
| Household Size | Owner-occupied | Renter-occupied |
| 1-Person Household | 1 (2.7%) | 36 (97.3%) |
| 2-Person Household | 14 (48.3%) | 15 (51.7%) |
| 3-Person Household | 0 (0.0%) | 7 (100.0%) |
| 4+ Person Household | 3 (75.0%) | 1 (25.0%) |
| Total Housing Units | 18 (23.4%) | 59 (76.6%) |
Occupancy by Educational Attainment in Adak
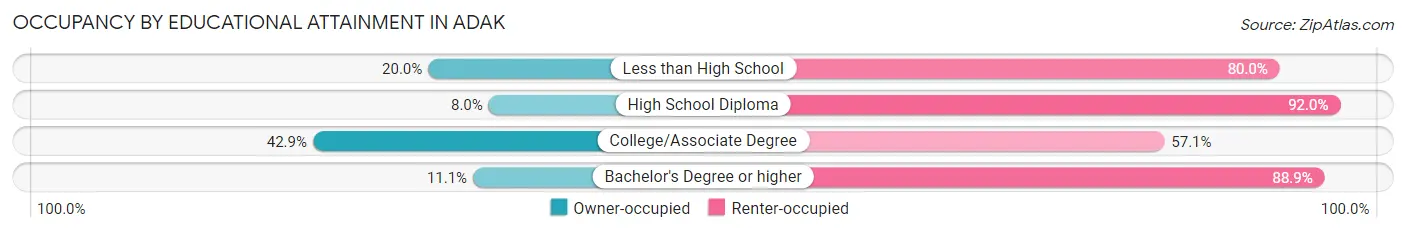
| Household Size | Owner-occupied | Renter-occupied |
| Less than High School | 3 (20.0%) | 12 (80.0%) |
| High School Diploma | 2 (8.0%) | 23 (92.0%) |
| College/Associate Degree | 12 (42.9%) | 16 (57.1%) |
| Bachelor's Degree or higher | 1 (11.1%) | 8 (88.9%) |
Occupancy by Age of Householder in Adak
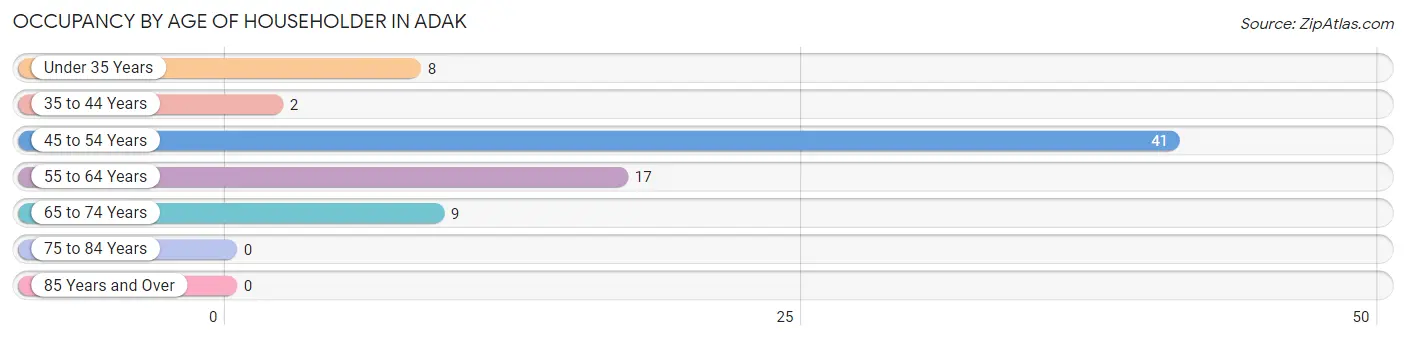
| Age Bracket | # Households | % Households |
| Under 35 Years | 8 | 10.4% |
| 35 to 44 Years | 2 | 2.6% |
| 45 to 54 Years | 41 | 53.2% |
| 55 to 64 Years | 17 | 22.1% |
| 65 to 74 Years | 9 | 11.7% |
| 75 to 84 Years | 0 | 0.0% |
| 85 Years and Over | 0 | 0.0% |
| Total | 77 | 100.0% |
Housing Finances in Adak
Median Income by Occupancy in Adak
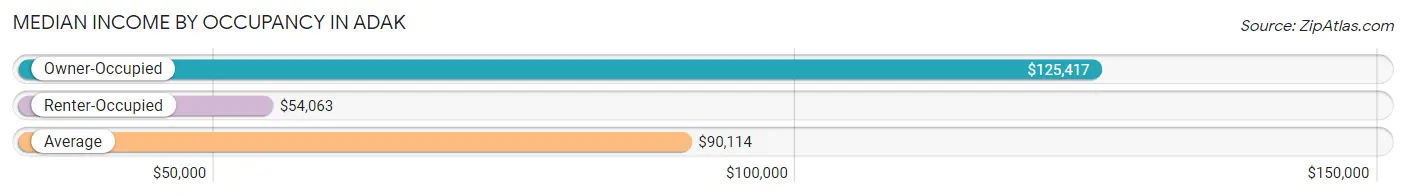
| Occupancy Type | # Households | Median Income |
| Owner-Occupied | 18 (23.4%) | $125,417 |
| Renter-Occupied | 59 (76.6%) | $54,063 |
| Average | 77 (100.0%) | $90,114 |
Occupancy by Householder Income Bracket in Adak
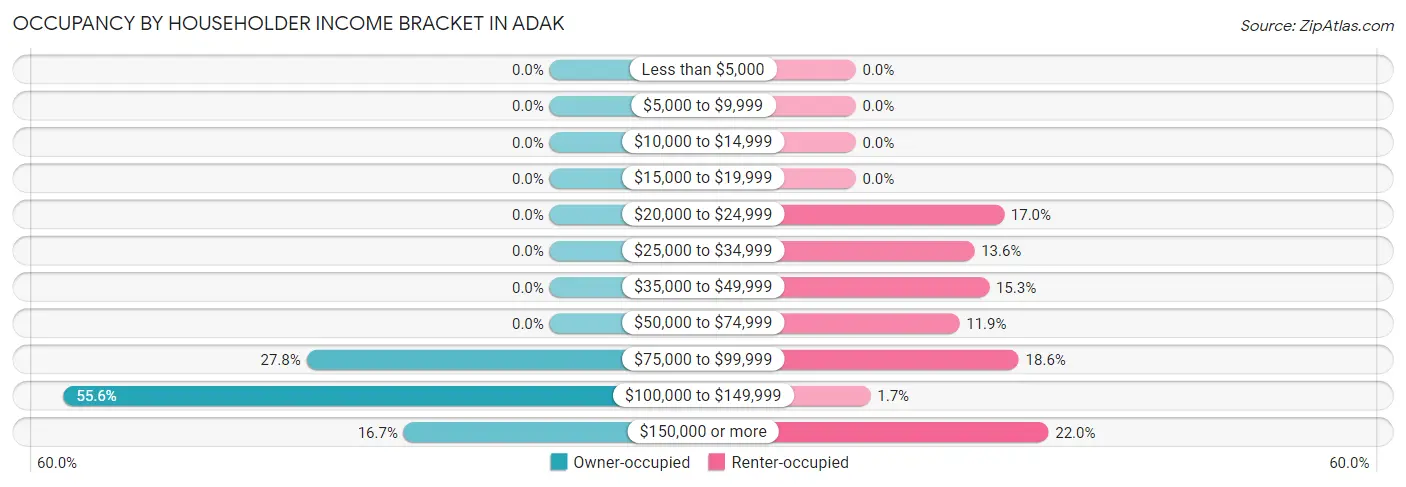
| Income Bracket | Owner-occupied | Renter-occupied |
| Less than $5,000 | 0 (0.0%) | 0 (0.0%) |
| $5,000 to $9,999 | 0 (0.0%) | 0 (0.0%) |
| $10,000 to $14,999 | 0 (0.0%) | 0 (0.0%) |
| $15,000 to $19,999 | 0 (0.0%) | 0 (0.0%) |
| $20,000 to $24,999 | 0 (0.0%) | 10 (17.0%) |
| $25,000 to $34,999 | 0 (0.0%) | 8 (13.6%) |
| $35,000 to $49,999 | 0 (0.0%) | 9 (15.2%) |
| $50,000 to $74,999 | 0 (0.0%) | 7 (11.9%) |
| $75,000 to $99,999 | 5 (27.8%) | 11 (18.6%) |
| $100,000 to $149,999 | 10 (55.6%) | 1 (1.7%) |
| $150,000 or more | 3 (16.7%) | 13 (22.0%) |
| Total | 18 (100.0%) | 59 (100.0%) |
Monthly Housing Cost Tiers in Adak
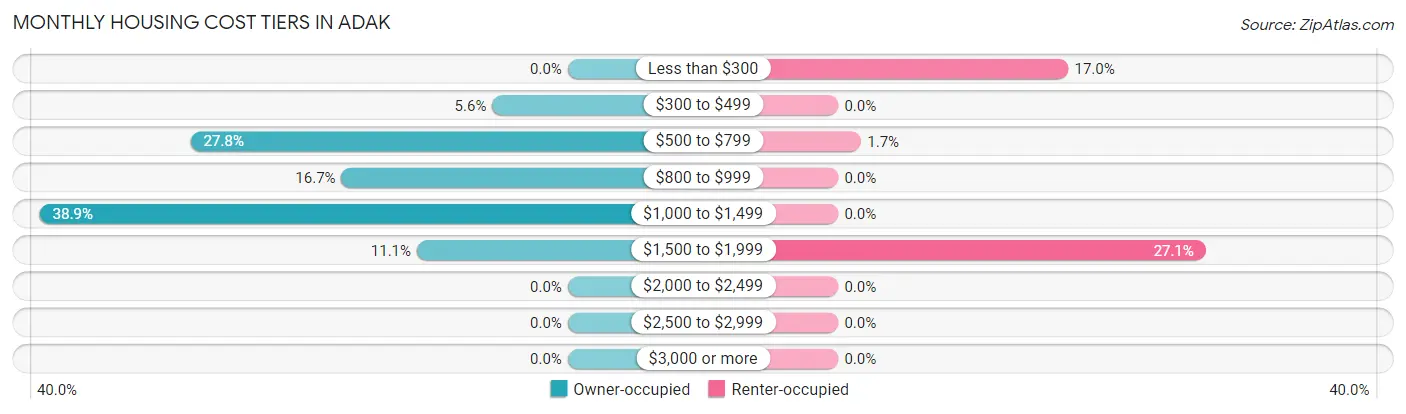
| Monthly Cost | Owner-occupied | Renter-occupied |
| Less than $300 | 0 (0.0%) | 10 (17.0%) |
| $300 to $499 | 1 (5.6%) | 0 (0.0%) |
| $500 to $799 | 5 (27.8%) | 1 (1.7%) |
| $800 to $999 | 3 (16.7%) | 0 (0.0%) |
| $1,000 to $1,499 | 7 (38.9%) | 0 (0.0%) |
| $1,500 to $1,999 | 2 (11.1%) | 16 (27.1%) |
| $2,000 to $2,499 | 0 (0.0%) | 0 (0.0%) |
| $2,500 to $2,999 | 0 (0.0%) | 0 (0.0%) |
| $3,000 or more | 0 (0.0%) | 0 (0.0%) |
| Total | 18 (100.0%) | 59 (100.0%) |
Physical Housing Characteristics in Adak
Housing Structures in Adak
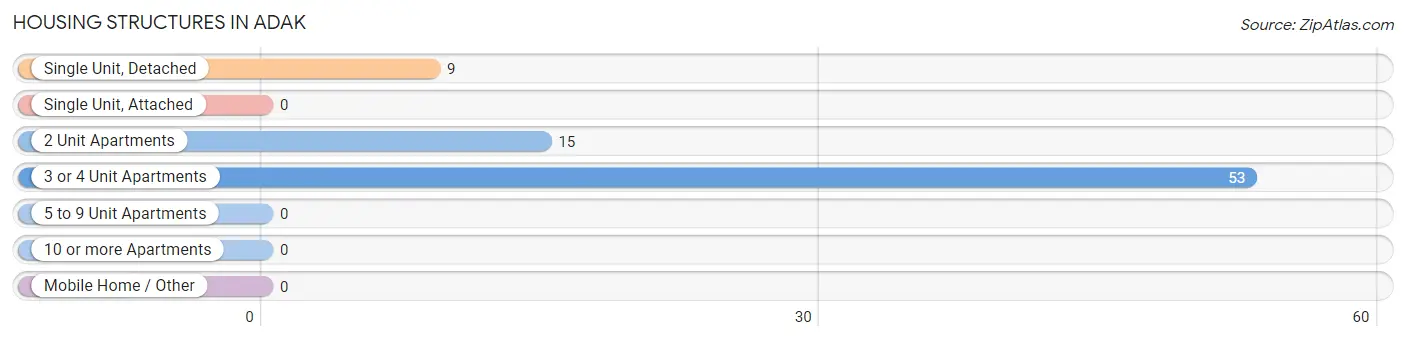
| Structure Type | # Housing Units | % Housing Units |
| Single Unit, Detached | 9 | 11.7% |
| Single Unit, Attached | 0 | 0.0% |
| 2 Unit Apartments | 15 | 19.5% |
| 3 or 4 Unit Apartments | 53 | 68.8% |
| 5 to 9 Unit Apartments | 0 | 0.0% |
| 10 or more Apartments | 0 | 0.0% |
| Mobile Home / Other | 0 | 0.0% |
| Total | 77 | 100.0% |
Housing Structures by Occupancy in Adak
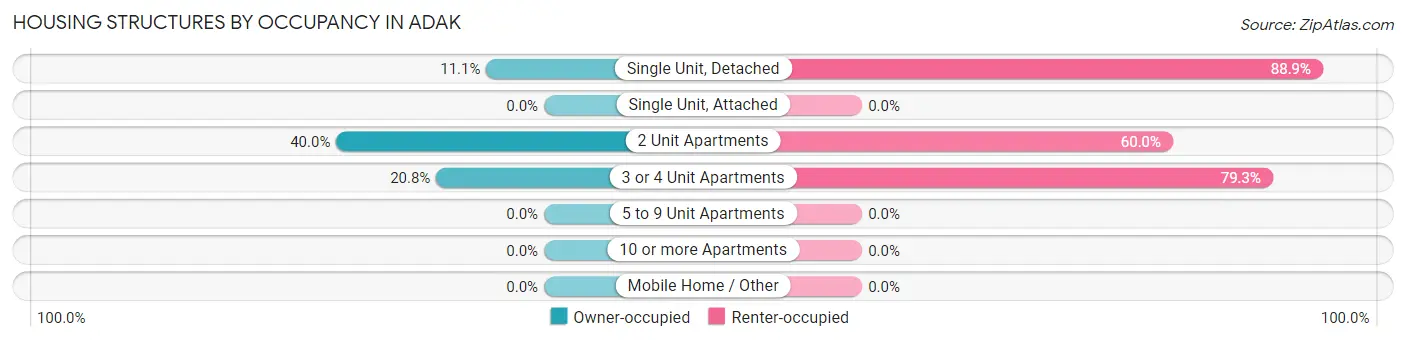
| Structure Type | Owner-occupied | Renter-occupied |
| Single Unit, Detached | 1 (11.1%) | 8 (88.9%) |
| Single Unit, Attached | 0 (0.0%) | 0 (0.0%) |
| 2 Unit Apartments | 6 (40.0%) | 9 (60.0%) |
| 3 or 4 Unit Apartments | 11 (20.7%) | 42 (79.2%) |
| 5 to 9 Unit Apartments | 0 (0.0%) | 0 (0.0%) |
| 10 or more Apartments | 0 (0.0%) | 0 (0.0%) |
| Mobile Home / Other | 0 (0.0%) | 0 (0.0%) |
| Total | 18 (23.4%) | 59 (76.6%) |
Housing Structures by Number of Rooms in Adak
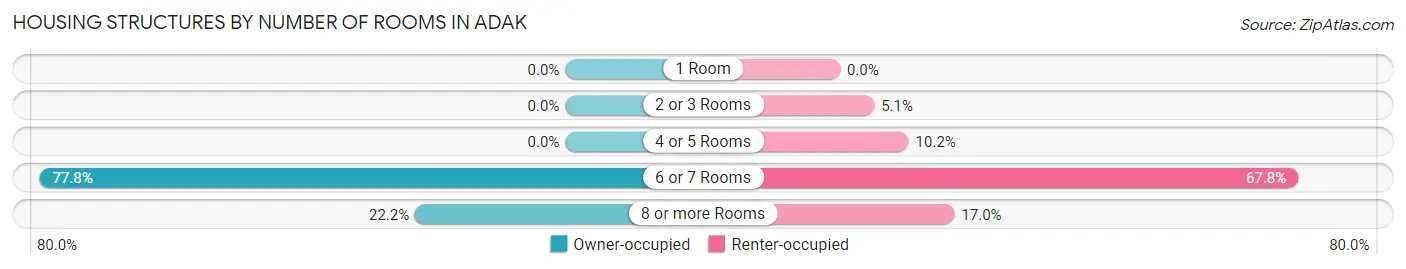
| Number of Rooms | Owner-occupied | Renter-occupied |
| 1 Room | 0 (0.0%) | 0 (0.0%) |
| 2 or 3 Rooms | 0 (0.0%) | 3 (5.1%) |
| 4 or 5 Rooms | 0 (0.0%) | 6 (10.2%) |
| 6 or 7 Rooms | 14 (77.8%) | 40 (67.8%) |
| 8 or more Rooms | 4 (22.2%) | 10 (17.0%) |
| Total | 18 (100.0%) | 59 (100.0%) |
Housing Structure by Heating Type in Adak
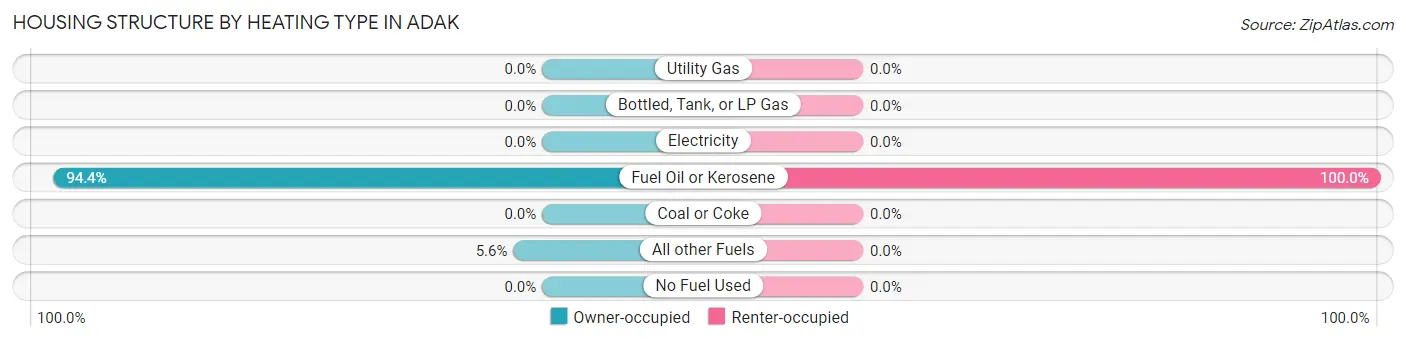
| Heating Type | Owner-occupied | Renter-occupied |
| Utility Gas | 0 (0.0%) | 0 (0.0%) |
| Bottled, Tank, or LP Gas | 0 (0.0%) | 0 (0.0%) |
| Electricity | 0 (0.0%) | 0 (0.0%) |
| Fuel Oil or Kerosene | 17 (94.4%) | 59 (100.0%) |
| Coal or Coke | 0 (0.0%) | 0 (0.0%) |
| All other Fuels | 1 (5.6%) | 0 (0.0%) |
| No Fuel Used | 0 (0.0%) | 0 (0.0%) |
| Total | 18 (100.0%) | 59 (100.0%) |
Household Vehicle Usage in Adak
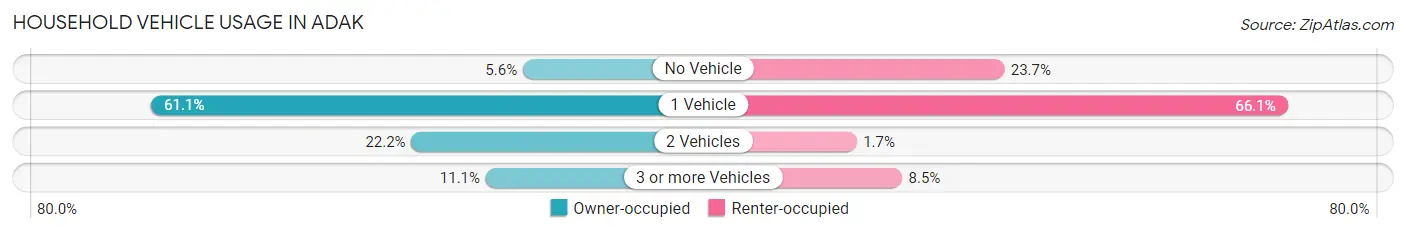
| Vehicles per Household | Owner-occupied | Renter-occupied |
| No Vehicle | 1 (5.6%) | 14 (23.7%) |
| 1 Vehicle | 11 (61.1%) | 39 (66.1%) |
| 2 Vehicles | 4 (22.2%) | 1 (1.7%) |
| 3 or more Vehicles | 2 (11.1%) | 5 (8.5%) |
| Total | 18 (100.0%) | 59 (100.0%) |
Real Estate & Mortgages in Adak
Real Estate and Mortgage Overview in Adak
| Characteristic | Without Mortgage | With Mortgage |
| Housing Units | 18 | 0 |
| Median Property Value | $61,700 | $0 |
| Median Household Income | $125,417 | $0 |
| Monthly Housing Costs | $1,050 | $0 |
| Real Estate Taxes | - | - |
Property Value by Mortgage Status in Adak
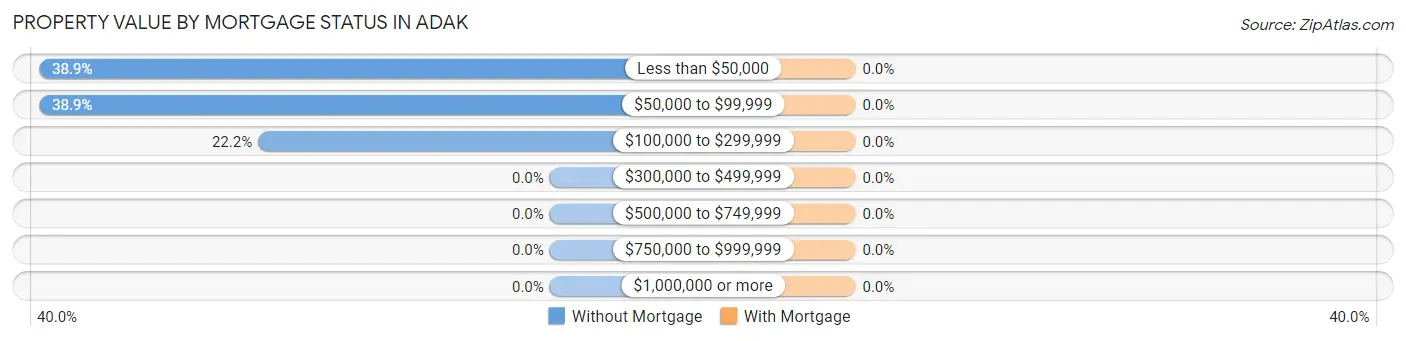
| Property Value | Without Mortgage | With Mortgage |
| Less than $50,000 | 7 (38.9%) | 0 (0.0%) |
| $50,000 to $99,999 | 7 (38.9%) | 0 (0.0%) |
| $100,000 to $299,999 | 4 (22.2%) | 0 (0.0%) |
| $300,000 to $499,999 | 0 (0.0%) | 0 (0.0%) |
| $500,000 to $749,999 | 0 (0.0%) | 0 (0.0%) |
| $750,000 to $999,999 | 0 (0.0%) | 0 (0.0%) |
| $1,000,000 or more | 0 (0.0%) | 0 (0.0%) |
| Total | 18 (100.0%) | 0 (0.0%) |
Household Income by Mortgage Status in Adak
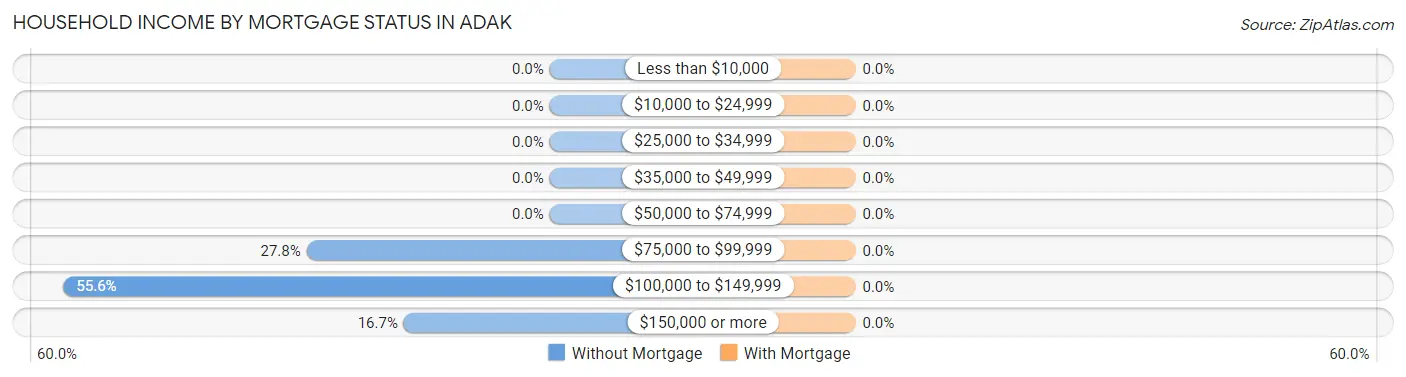
| Household Income | Without Mortgage | With Mortgage |
| Less than $10,000 | 0 (0.0%) | 0 (0.0%) |
| $10,000 to $24,999 | 0 (0.0%) | 0 (0.0%) |
| $25,000 to $34,999 | 0 (0.0%) | 0 (0.0%) |
| $35,000 to $49,999 | 0 (0.0%) | 0 (0.0%) |
| $50,000 to $74,999 | 0 (0.0%) | 0 (0.0%) |
| $75,000 to $99,999 | 5 (27.8%) | 0 (0.0%) |
| $100,000 to $149,999 | 10 (55.6%) | 0 (0.0%) |
| $150,000 or more | 3 (16.7%) | 0 (0.0%) |
| Total | 18 (100.0%) | 0 (0.0%) |
Property Value to Household Income Ratio in Adak
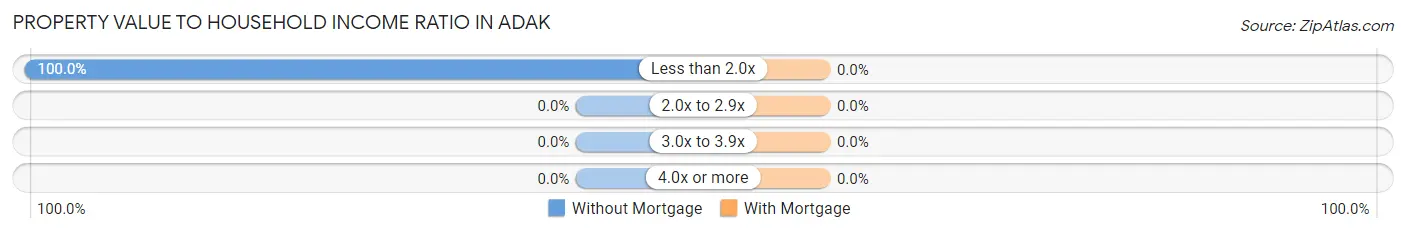
| Value-to-Income Ratio | Without Mortgage | With Mortgage |
| Less than 2.0x | 18 (100.0%) | 0 (0.0%) |
| 2.0x to 2.9x | 0 (0.0%) | 0 (0.0%) |
| 3.0x to 3.9x | 0 (0.0%) | 0 (0.0%) |
| 4.0x or more | 0 (0.0%) | 0 (0.0%) |
| Total | 18 (100.0%) | 0 (0.0%) |
Real Estate Taxes by Mortgage Status in Adak
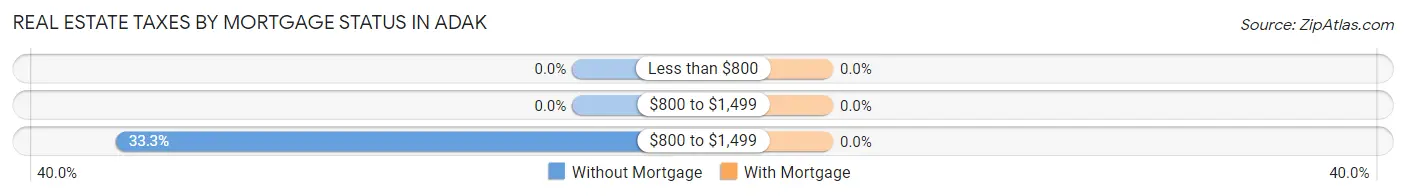
| Property Taxes | Without Mortgage | With Mortgage |
| Less than $800 | 0 (0.0%) | 0 (0.0%) |
| $800 to $1,499 | 0 (0.0%) | 0 (0.0%) |
| $800 to $1,499 | 6 (33.3%) | 0 (0.0%) |
| Total | 18 (100.0%) | 0 (0.0%) |
Health & Disability in Adak
Health Insurance Coverage by Age in Adak
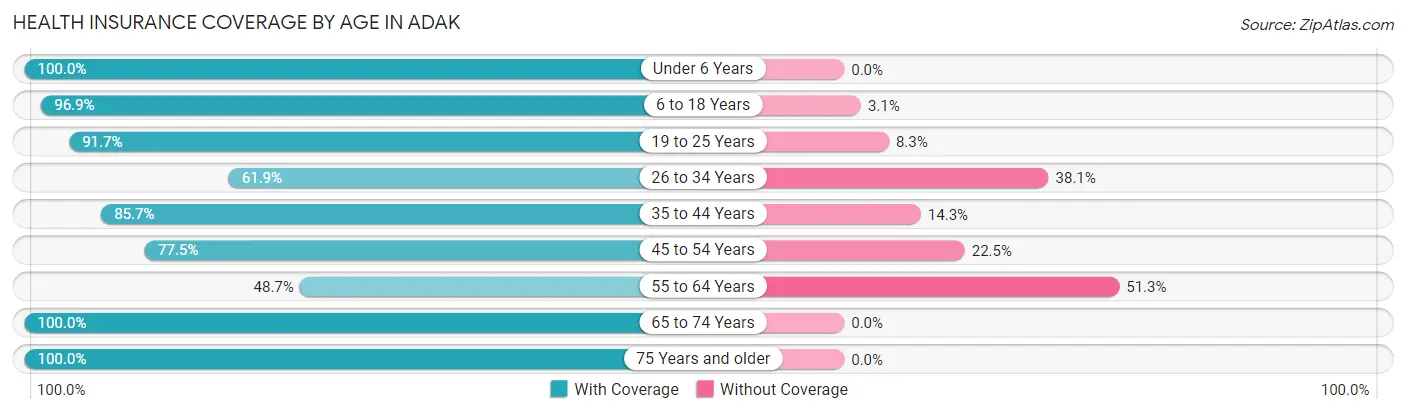
| Age Bracket | With Coverage | Without Coverage |
| Under 6 Years | 2 (100.0%) | 0 (0.0%) |
| 6 to 18 Years | 31 (96.9%) | 1 (3.1%) |
| 19 to 25 Years | 22 (91.7%) | 2 (8.3%) |
| 26 to 34 Years | 26 (61.9%) | 16 (38.1%) |
| 35 to 44 Years | 6 (85.7%) | 1 (14.3%) |
| 45 to 54 Years | 69 (77.5%) | 20 (22.5%) |
| 55 to 64 Years | 19 (48.7%) | 20 (51.3%) |
| 65 to 74 Years | 9 (100.0%) | 0 (0.0%) |
| 75 Years and older | 4 (100.0%) | 0 (0.0%) |
| Total | 188 (75.8%) | 60 (24.2%) |
Health Insurance Coverage by Citizenship Status in Adak
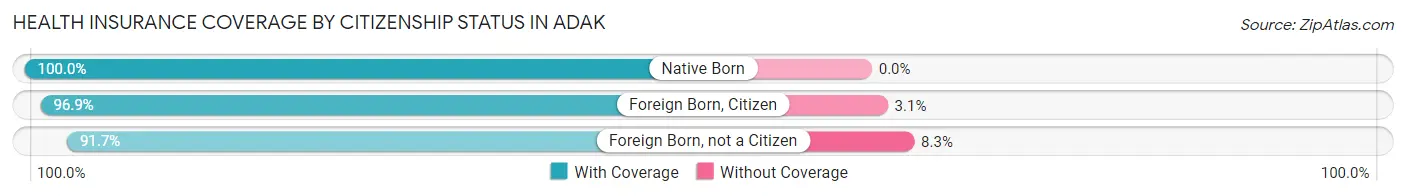
| Citizenship Status | With Coverage | Without Coverage |
| Native Born | 2 (100.0%) | 0 (0.0%) |
| Foreign Born, Citizen | 31 (96.9%) | 1 (3.1%) |
| Foreign Born, not a Citizen | 22 (91.7%) | 2 (8.3%) |
Health Insurance Coverage by Household Income in Adak
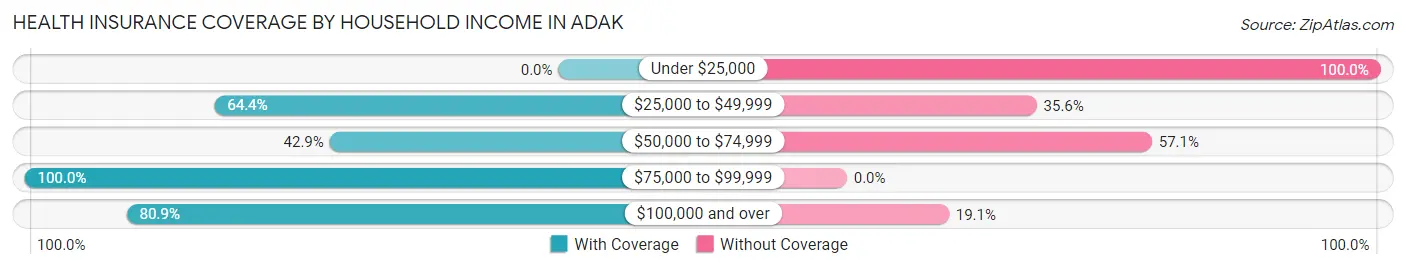
| Household Income | With Coverage | Without Coverage |
| Under $25,000 | 0 (0.0%) | 10 (100.0%) |
| $25,000 to $49,999 | 29 (64.4%) | 16 (35.6%) |
| $50,000 to $74,999 | 3 (42.9%) | 4 (57.1%) |
| $75,000 to $99,999 | 29 (100.0%) | 0 (0.0%) |
| $100,000 and over | 127 (80.9%) | 30 (19.1%) |
Public vs Private Health Insurance Coverage by Age in Adak
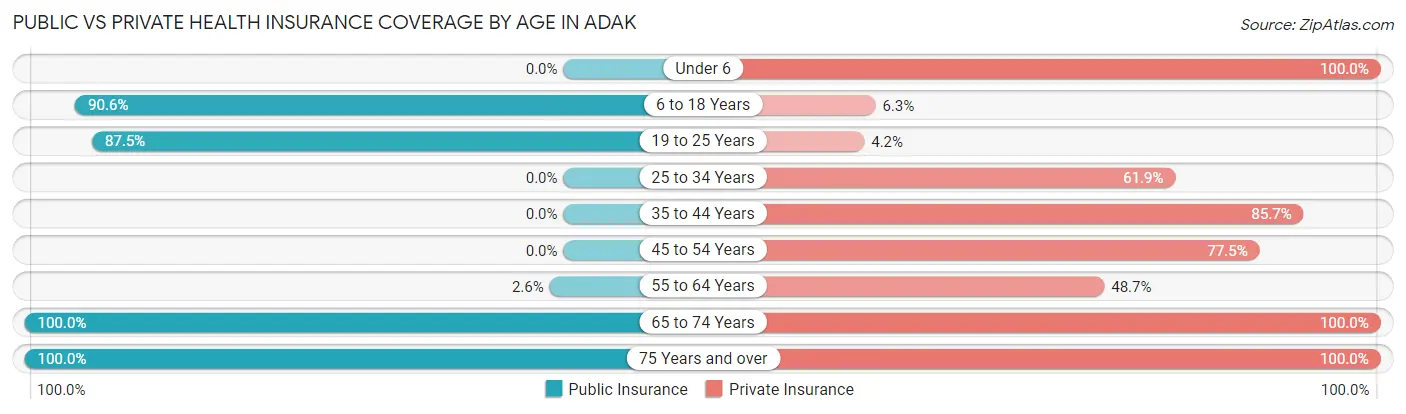
| Age Bracket | Public Insurance | Private Insurance |
| Under 6 | 0 (0.0%) | 2 (100.0%) |
| 6 to 18 Years | 29 (90.6%) | 2 (6.2%) |
| 19 to 25 Years | 21 (87.5%) | 1 (4.2%) |
| 25 to 34 Years | 0 (0.0%) | 26 (61.9%) |
| 35 to 44 Years | 0 (0.0%) | 6 (85.7%) |
| 45 to 54 Years | 0 (0.0%) | 69 (77.5%) |
| 55 to 64 Years | 1 (2.6%) | 19 (48.7%) |
| 65 to 74 Years | 9 (100.0%) | 9 (100.0%) |
| 75 Years and over | 4 (100.0%) | 4 (100.0%) |
| Total | 64 (25.8%) | 138 (55.6%) |
Disability Status by Sex by Age in Adak
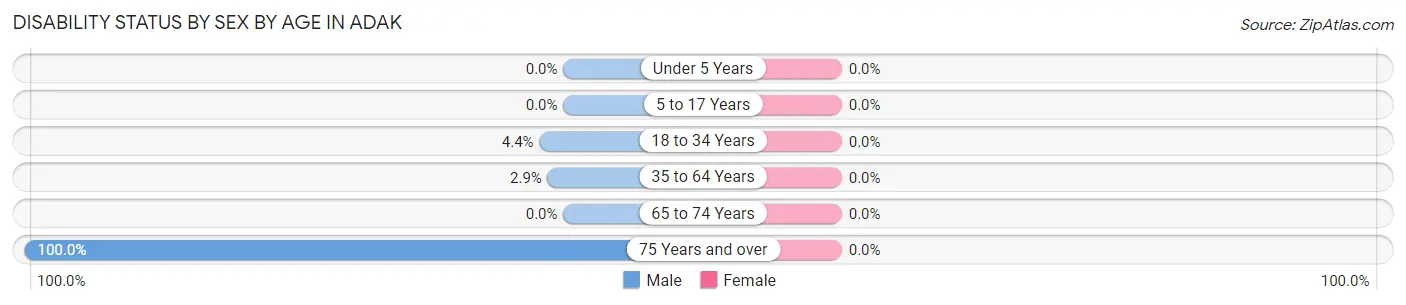
| Age Bracket | Male | Female |
| Under 5 Years | 0 (0.0%) | 0 (0.0%) |
| 5 to 17 Years | 0 (0.0%) | 0 (0.0%) |
| 18 to 34 Years | 2 (4.4%) | 0 (0.0%) |
| 35 to 64 Years | 3 (2.9%) | 0 (0.0%) |
| 65 to 74 Years | 0 (0.0%) | 0 (0.0%) |
| 75 Years and over | 4 (100.0%) | 0 (0.0%) |
Disability Class by Sex by Age in Adak
Disability Class: Hearing Difficulty
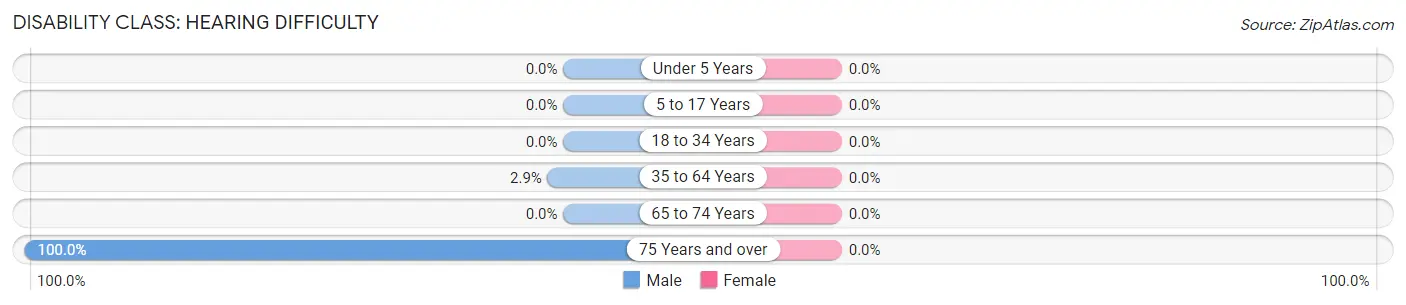
| Age Bracket | Male | Female |
| Under 5 Years | 0 (0.0%) | 0 (0.0%) |
| 5 to 17 Years | 0 (0.0%) | 0 (0.0%) |
| 18 to 34 Years | 0 (0.0%) | 0 (0.0%) |
| 35 to 64 Years | 3 (2.9%) | 0 (0.0%) |
| 65 to 74 Years | 0 (0.0%) | 0 (0.0%) |
| 75 Years and over | 4 (100.0%) | 0 (0.0%) |
Disability Class: Vision Difficulty
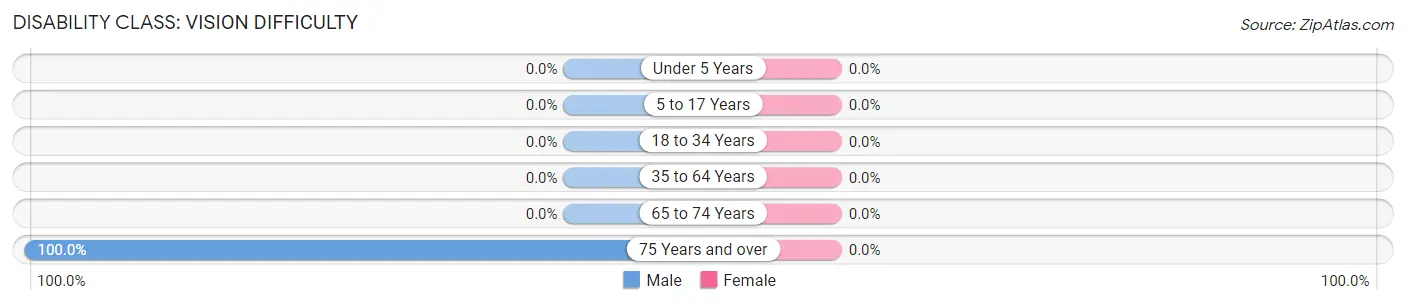
| Age Bracket | Male | Female |
| Under 5 Years | 0 (0.0%) | 0 (0.0%) |
| 5 to 17 Years | 0 (0.0%) | 0 (0.0%) |
| 18 to 34 Years | 0 (0.0%) | 0 (0.0%) |
| 35 to 64 Years | 0 (0.0%) | 0 (0.0%) |
| 65 to 74 Years | 0 (0.0%) | 0 (0.0%) |
| 75 Years and over | 4 (100.0%) | 0 (0.0%) |
Disability Class: Cognitive Difficulty
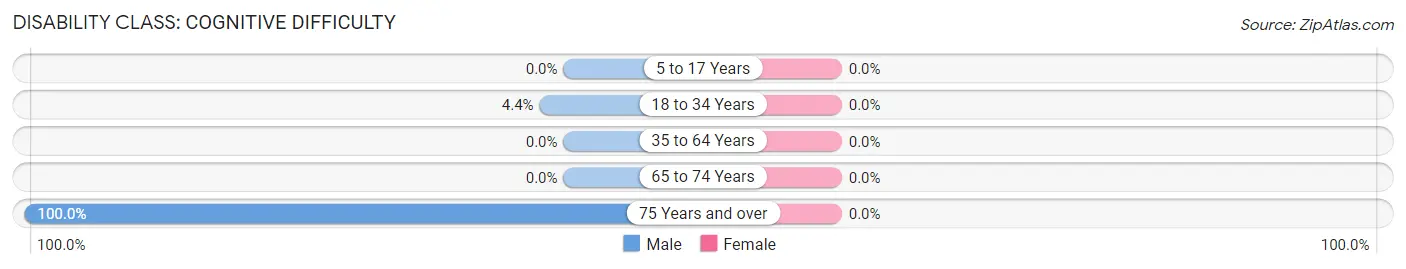
| Age Bracket | Male | Female |
| 5 to 17 Years | 0 (0.0%) | 0 (0.0%) |
| 18 to 34 Years | 2 (4.4%) | 0 (0.0%) |
| 35 to 64 Years | 0 (0.0%) | 0 (0.0%) |
| 65 to 74 Years | 0 (0.0%) | 0 (0.0%) |
| 75 Years and over | 4 (100.0%) | 0 (0.0%) |
Disability Class: Ambulatory Difficulty
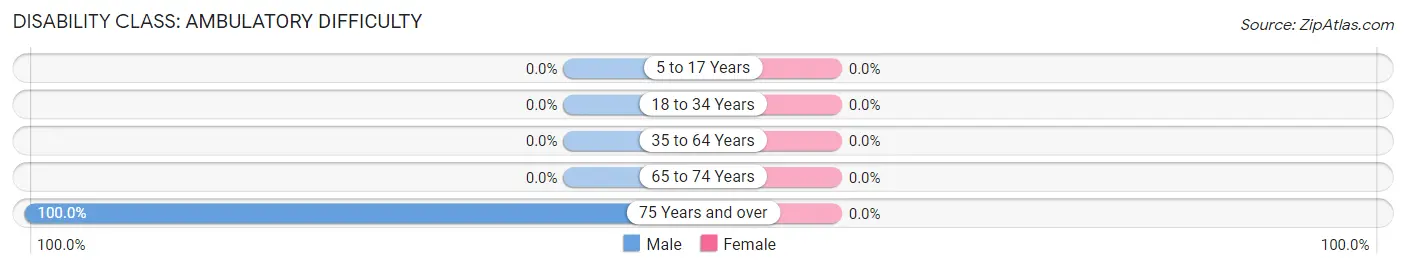
| Age Bracket | Male | Female |
| 5 to 17 Years | 0 (0.0%) | 0 (0.0%) |
| 18 to 34 Years | 0 (0.0%) | 0 (0.0%) |
| 35 to 64 Years | 0 (0.0%) | 0 (0.0%) |
| 65 to 74 Years | 0 (0.0%) | 0 (0.0%) |
| 75 Years and over | 4 (100.0%) | 0 (0.0%) |
Disability Class: Self-Care Difficulty
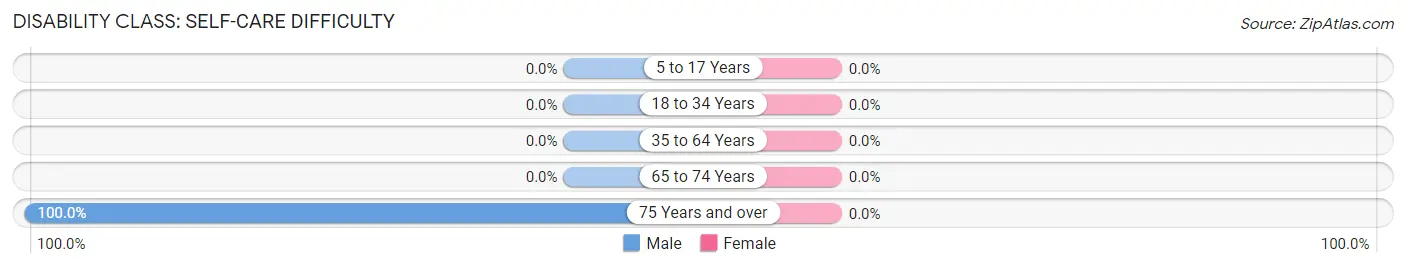
| Age Bracket | Male | Female |
| 5 to 17 Years | 0 (0.0%) | 0 (0.0%) |
| 18 to 34 Years | 0 (0.0%) | 0 (0.0%) |
| 35 to 64 Years | 0 (0.0%) | 0 (0.0%) |
| 65 to 74 Years | 0 (0.0%) | 0 (0.0%) |
| 75 Years and over | 4 (100.0%) | 0 (0.0%) |
Technology Access in Adak
Computing Device Access in Adak
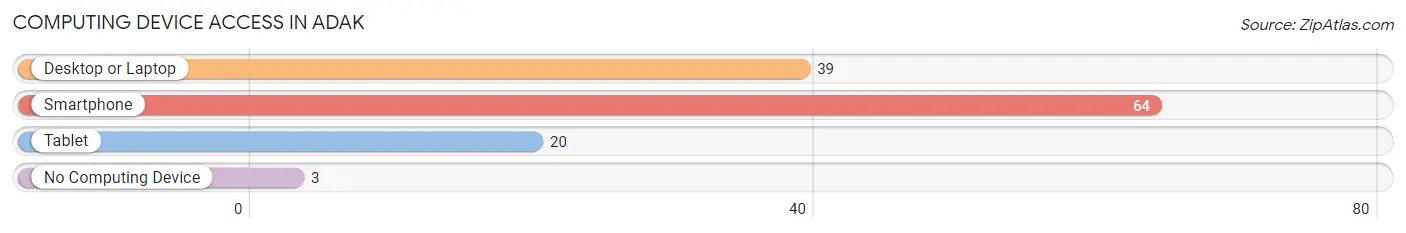
| Device Type | # Households | % Households |
| Desktop or Laptop | 39 | 50.6% |
| Smartphone | 64 | 83.1% |
| Tablet | 20 | 26.0% |
| No Computing Device | 3 | 3.9% |
| Total | 77 | 100.0% |
Internet Access in Adak
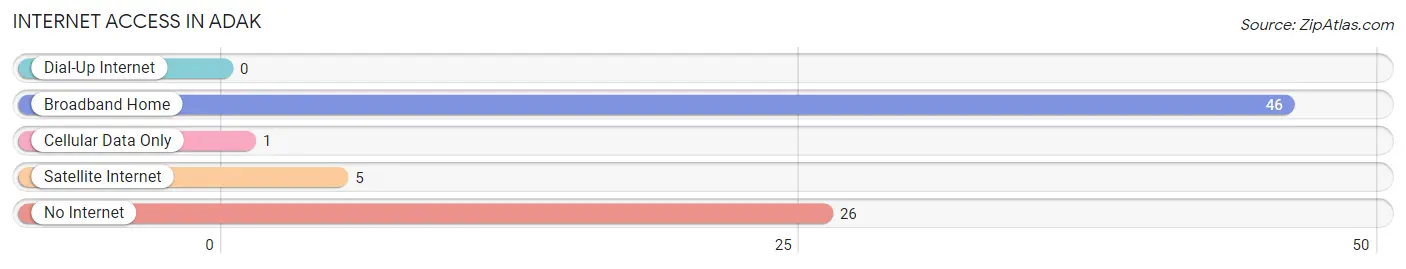
| Internet Type | # Households | % Households |
| Dial-Up Internet | 0 | 0.0% |
| Broadband Home | 46 | 59.7% |
| Cellular Data Only | 1 | 1.3% |
| Satellite Internet | 5 | 6.5% |
| No Internet | 26 | 33.8% |
| Total | 77 | 100.0% |
Adak Summary
Adak is a small island located in the Aleutian Islands of Alaska. It is the southernmost city in the United States and the only incorporated city in the Aleutian Islands. Adak is located about 1,200 miles southwest of Anchorage and is the largest city in the Aleutian Islands. The island is about 45 square miles in size and has a population of about 300 people.
Geography
Adak is located on the western side of the Aleutian Islands, about 1,200 miles southwest of Anchorage. The island is about 45 square miles in size and is surrounded by the Bering Sea to the north and the Pacific Ocean to the south. The island is mostly mountainous, with the highest peak being Mount Adagdak at 2,325 feet. The island is also home to several lakes, including Lake Adagdak, Lake Kupreanof, and Lake Tanaga.
The climate of Adak is generally cool and wet, with temperatures ranging from the mid-30s in the winter to the mid-50s in the summer. The island receives an average of about 40 inches of precipitation per year, with most of it falling in the form of snow.
Economy
Adak’s economy is largely based on fishing and tourism. The island is home to several commercial fishing operations, which harvest a variety of species including salmon, halibut, cod, and crab. The island also has a small tourism industry, with visitors coming to experience the unique wildlife and scenery of the Aleutian Islands.
The island is also home to a U.S. Navy base, which was established in 1942 and is now home to the Naval Air Facility Adak. The base provides jobs for many of the island’s residents and is a major contributor to the local economy.
Demographics
As of the 2010 census, Adak had a population of 326 people. The population is largely Aleut, with about 75% of the population identifying as such. The remaining 25% of the population is made up of other ethnicities, including White, Asian, and Hispanic.
The median household income in Adak is $45,000, which is slightly lower than the median household income for Alaska as a whole. The median age of the population is 37.5 years, and the unemployment rate is about 8%.
Conclusion
Adak is a small island located in the Aleutian Islands of Alaska. It is the southernmost city in the United States and the only incorporated city in the Aleutian Islands. Adak is home to a population of about 300 people, most of whom are Aleut. The island’s economy is largely based on fishing and tourism, and it is also home to a U.S. Navy base. The median household income in Adak is $45,000, and the median age of the population is 37.5 years. Adak is a unique and beautiful place, and it is an important part of Alaska’s history and culture.
Common Questions
What is Per Capita Income in Adak?
Per Capita income in Adak is $57,458.
What is the Median Family Income in Adak?
Median Family Income in Adak is $82,500.
What is the Median Household income in Adak?
Median Household Income in Adak is $90,114.
What is Inequality or Gini Index in Adak?
Inequality or Gini Index in Adak is 0.42.
What is the Total Population of Adak?
Total Population of Adak is 248.
What is the Total Male Population of Adak?
Total Male Population of Adak is 173.
What is the Total Female Population of Adak?
Total Female Population of Adak is 75.
What is the Ratio of Males per 100 Females in Adak?
There are 230.67 Males per 100 Females in Adak.
What is the Ratio of Females per 100 Males in Adak?
There are 43.35 Females per 100 Males in Adak.
What is the Median Population Age in Adak?
Median Population Age in Adak is 50.1 Years.
What is the Average Family Size in Adak
Average Family Size in Adak is 3.5 People.
What is the Average Household Size in Adak
Average Household Size in Adak is 3.2 People.
How Large is the Labor Force in Adak?
There are 196 People in the Labor Forcein in Adak.
What is the Percentage of People in the Labor Force in Adak?
90.7% of People are in the Labor Force in Adak.
What is the Unemployment Rate in Adak?
Unemployment Rate in Adak is 1.5%.