King Cove, AK Map & Demographics
King Cove Map
King Cove Overview
$40,796
PER CAPITA INCOME
$73,250
AVG FAMILY INCOME
$79,844
AVG HOUSEHOLD INCOME
38.9%
WAGE / INCOME GAP [ % ]
61.1¢/ $1
WAGE / INCOME GAP [ $ ]
0.33
INEQUALITY / GINI INDEX
1,108
TOTAL POPULATION
651
MALE POPULATION
457
FEMALE POPULATION
142.45
MALES / 100 FEMALES
70.20
FEMALES / 100 MALES
38.2
MEDIAN AGE
3.3
AVG FAMILY SIZE
2.4
AVG HOUSEHOLD SIZE
711
LABOR FORCE [ PEOPLE ]
76.3%
PERCENT IN LABOR FORCE
6.9%
UNEMPLOYMENT RATE
King Cove Zip Codes
King Cove Area Codes
Income in King Cove
Income Overview in King Cove
Per Capita Income in King Cove is $40,796, while median incomes of families and households are $73,250 and $79,844 respectively.
| Characteristic | Number | Measure |
| Per Capita Income | 1,108 | $40,796 |
| Median Family Income | 177 | $73,250 |
| Mean Family Income | 177 | $77,166 |
| Median Household Income | 358 | $79,844 |
| Mean Household Income | 358 | $83,262 |
| Income Deficit | 177 | $0 |
| Wage / Income Gap (%) | 1,108 | 38.94% |
| Wage / Income Gap ($) | 1,108 | 61.06¢ per $1 |
| Gini / Inequality Index | 1,108 | 0.33 |
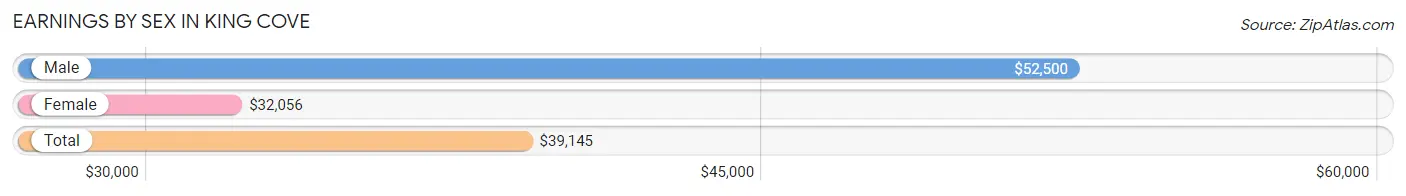
Earnings by Sex in King Cove
Average Earnings in King Cove are $39,145, $52,500 for men and $32,056 for women, a difference of 38.9%.
| Sex | Number | Average Earnings |
| Male | 494 (63.6%) | $52,500 |
| Female | 283 (36.4%) | $32,056 |
| Total | 777 (100.0%) | $39,145 |
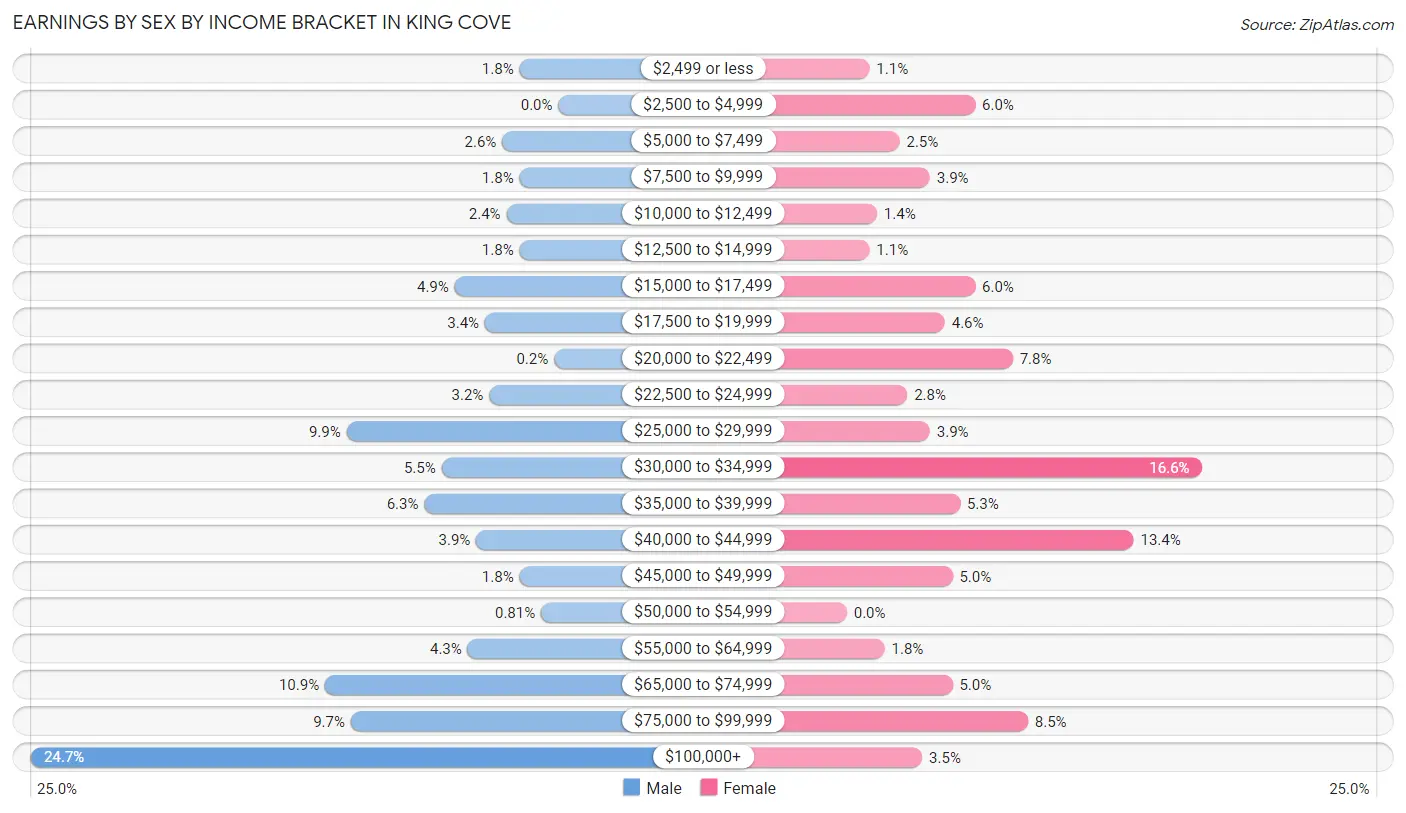
Earnings by Sex by Income Bracket in King Cove
The most common earnings brackets in King Cove are $100,000+ for men (122 | 24.7%) and $30,000 to $34,999 for women (47 | 16.6%).
| Income | Male | Female |
| $2,499 or less | 9 (1.8%) | 3 (1.1%) |
| $2,500 to $4,999 | 0 (0.0%) | 17 (6.0%) |
| $5,000 to $7,499 | 13 (2.6%) | 7 (2.5%) |
| $7,500 to $9,999 | 9 (1.8%) | 11 (3.9%) |
| $10,000 to $12,499 | 12 (2.4%) | 4 (1.4%) |
| $12,500 to $14,999 | 9 (1.8%) | 3 (1.1%) |
| $15,000 to $17,499 | 24 (4.9%) | 17 (6.0%) |
| $17,500 to $19,999 | 17 (3.4%) | 13 (4.6%) |
| $20,000 to $22,499 | 1 (0.2%) | 22 (7.8%) |
| $22,500 to $24,999 | 16 (3.2%) | 8 (2.8%) |
| $25,000 to $29,999 | 49 (9.9%) | 11 (3.9%) |
| $30,000 to $34,999 | 27 (5.5%) | 47 (16.6%) |
| $35,000 to $39,999 | 31 (6.3%) | 15 (5.3%) |
| $40,000 to $44,999 | 19 (3.8%) | 38 (13.4%) |
| $45,000 to $49,999 | 9 (1.8%) | 14 (5.0%) |
| $50,000 to $54,999 | 4 (0.8%) | 0 (0.0%) |
| $55,000 to $64,999 | 21 (4.3%) | 5 (1.8%) |
| $65,000 to $74,999 | 54 (10.9%) | 14 (5.0%) |
| $75,000 to $99,999 | 48 (9.7%) | 24 (8.5%) |
| $100,000+ | 122 (24.7%) | 10 (3.5%) |
| Total | 494 (100.0%) | 283 (100.0%) |
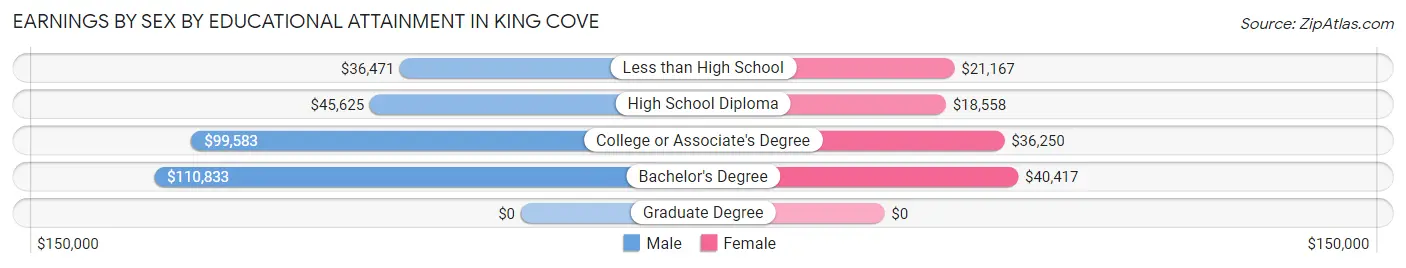
Earnings by Sex by Educational Attainment in King Cove
Average earnings in King Cove are $66,382 for men and $31,413 for women, a difference of 52.7%. Men with an educational attainment of bachelor's degree enjoy the highest average annual earnings of $110,833, while those with less than high school education earn the least with $36,471. Women with an educational attainment of bachelor's degree earn the most with the average annual earnings of $40,417, while those with high school diploma education have the smallest earnings of $18,558.
| Educational Attainment | Male Income | Female Income |
| Less than High School | $36,471 | $21,167 |
| High School Diploma | $45,625 | $18,558 |
| College or Associate's Degree | $99,583 | $36,250 |
| Bachelor's Degree | $110,833 | $40,417 |
| Graduate Degree | - | - |
| Total | $66,382 | $31,413 |
Family Income in King Cove
Family Income Brackets in King Cove
According to the King Cove family income data, there are 35 families falling into the $35,000 to $49,999 income range, which is the most common income bracket and makes up 19.8% of all families.
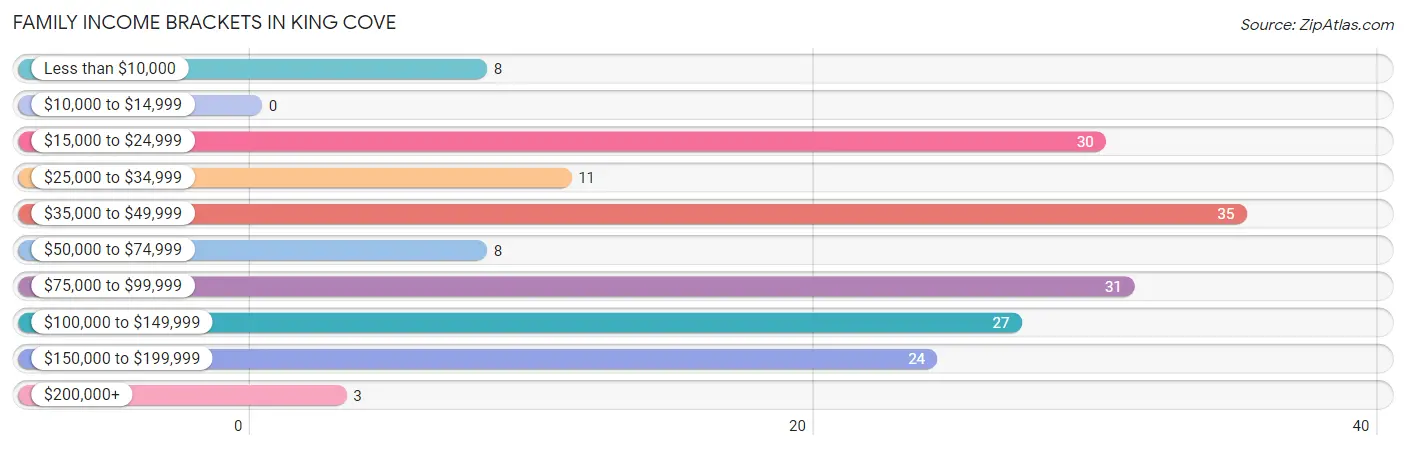
| Income Bracket | # Families | % Families |
| Less than $10,000 | 8 | 4.5% |
| $10,000 to $14,999 | 0 | 0.0% |
| $15,000 to $24,999 | 30 | 16.9% |
| $25,000 to $34,999 | 11 | 6.2% |
| $35,000 to $49,999 | 35 | 19.8% |
| $50,000 to $74,999 | 8 | 4.5% |
| $75,000 to $99,999 | 31 | 17.5% |
| $100,000 to $149,999 | 27 | 15.3% |
| $150,000 to $199,999 | 24 | 13.6% |
| $200,000+ | 3 | 1.7% |
Family Income by Famaliy Size in King Cove
6-person families (5 | 2.8%) account for the highest median family income in King Cove with $104,375 per family, while 2-person families (66 | 37.3%) have the highest median income of $46,346 per family member.
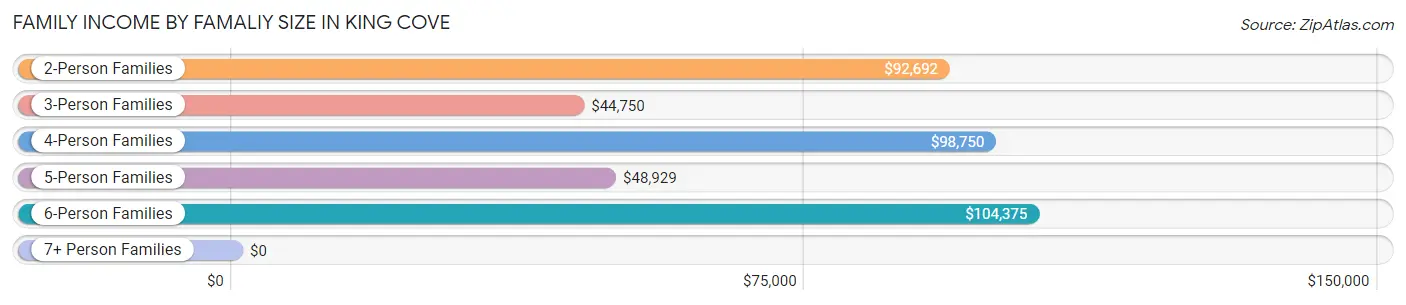
| Income Bracket | # Families | Median Income |
| 2-Person Families | 66 (37.3%) | $92,692 |
| 3-Person Families | 47 (26.6%) | $44,750 |
| 4-Person Families | 33 (18.6%) | $98,750 |
| 5-Person Families | 26 (14.7%) | $48,929 |
| 6-Person Families | 5 (2.8%) | $104,375 |
| 7+ Person Families | 0 (0.0%) | $0 |
| Total | 177 (100.0%) | $73,250 |
Family Income by Number of Earners in King Cove
The median family income in King Cove is $73,250, with families comprising 2 earners (73) having the highest median family income of $112,813, while families with no earners (10) have the lowest median family income of $20,000, accounting for 41.2% and 5.7% of families, respectively.
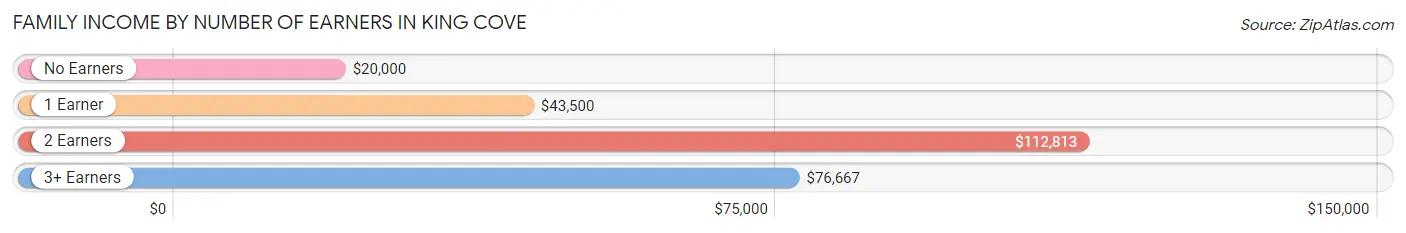
| Number of Earners | # Families | Median Income |
| No Earners | 10 (5.7%) | $20,000 |
| 1 Earner | 82 (46.3%) | $43,500 |
| 2 Earners | 73 (41.2%) | $112,813 |
| 3+ Earners | 12 (6.8%) | $76,667 |
| Total | 177 (100.0%) | $73,250 |
Household Income in King Cove
Household Income Brackets in King Cove
With 93 households falling in the category, the $100,000 to $149,999 income range is the most frequent in King Cove, accounting for 26.0% of all households. In contrast, only 7 households (2.0%) fall into the $200,000+ income bracket, making it the least populous group.
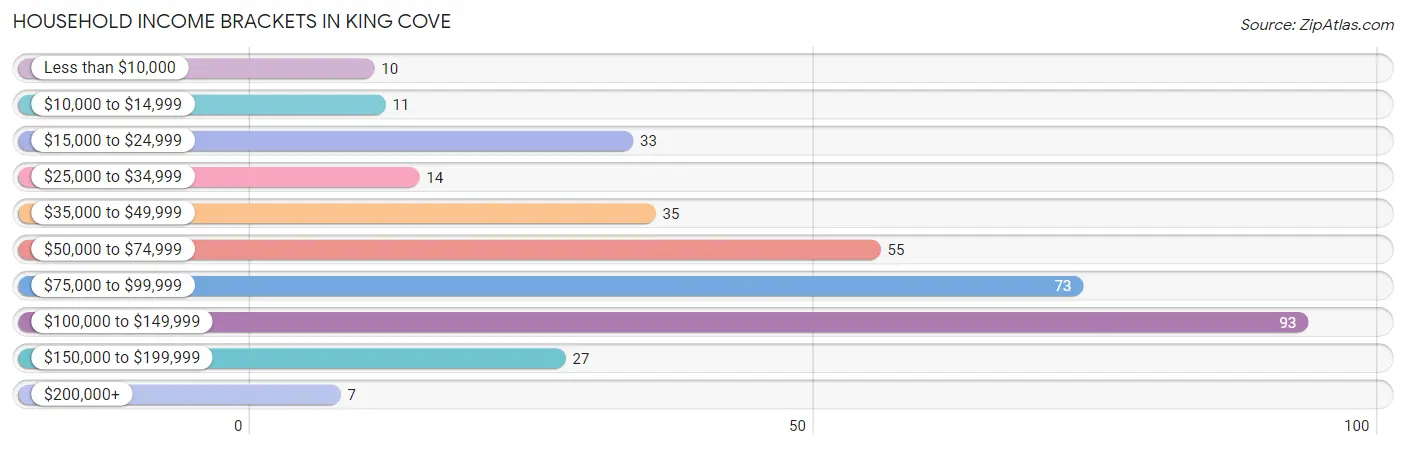
| Income Bracket | # Households | % Households |
| Less than $10,000 | 10 | 2.8% |
| $10,000 to $14,999 | 11 | 3.1% |
| $15,000 to $24,999 | 33 | 9.2% |
| $25,000 to $34,999 | 14 | 3.9% |
| $35,000 to $49,999 | 35 | 9.8% |
| $50,000 to $74,999 | 55 | 15.4% |
| $75,000 to $99,999 | 73 | 20.4% |
| $100,000 to $149,999 | 93 | 26.0% |
| $150,000 to $199,999 | 27 | 7.5% |
| $200,000+ | 7 | 2.0% |
Household Income by Householder Age in King Cove
The median household income in King Cove is $79,844, with the highest median household income of $105,313 found in the 45 to 64 years age bracket for the primary householder. A total of 128 households (35.7%) fall into this category. Meanwhile, the 65+ years age bracket for the primary householder has the lowest median household income of $55,368, with 99 households (27.7%) in this group.
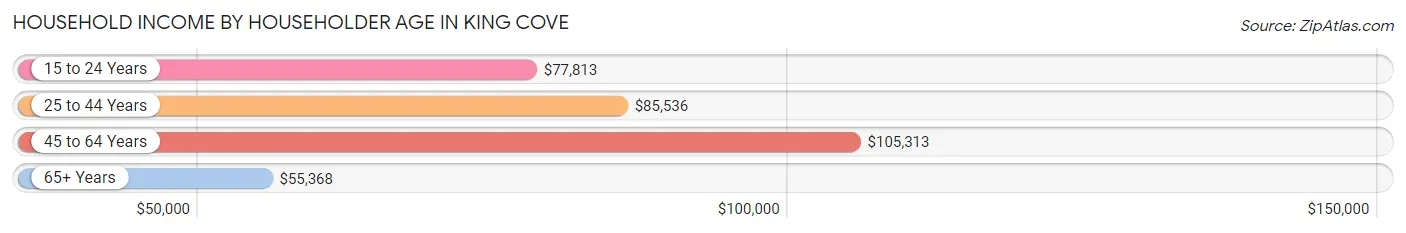
| Income Bracket | # Households | Median Income |
| 15 to 24 Years | 36 (10.1%) | $77,813 |
| 25 to 44 Years | 95 (26.5%) | $85,536 |
| 45 to 64 Years | 128 (35.7%) | $105,313 |
| 65+ Years | 99 (27.7%) | $55,368 |
| Total | 358 (100.0%) | $79,844 |
Poverty in King Cove
Income Below Poverty by Sex and Age in King Cove
With 11.4% poverty level for males and 14.9% for females among the residents of King Cove, 5 year old males and 25 to 34 year old females are the most vulnerable to poverty, with 7 males (77.8%) and 21 females (48.8%) in their respective age groups living below the poverty level.
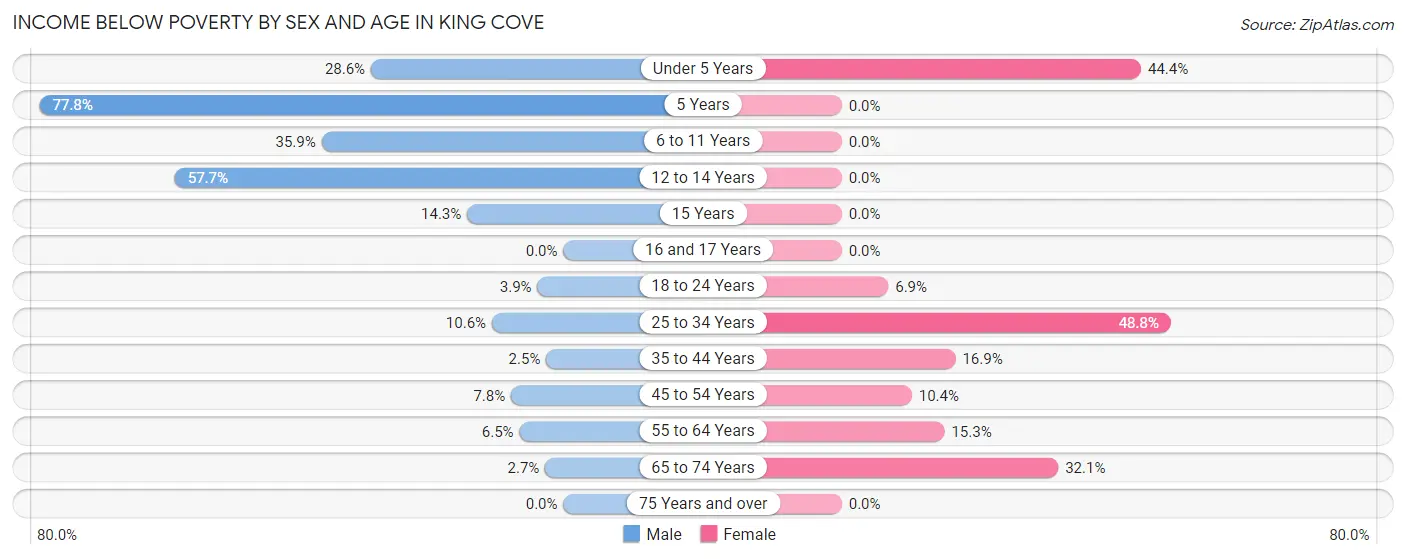
| Age Bracket | Male | Female |
| Under 5 Years | 8 (28.6%) | 4 (44.4%) |
| 5 Years | 7 (77.8%) | 0 (0.0%) |
| 6 to 11 Years | 14 (35.9%) | 0 (0.0%) |
| 12 to 14 Years | 15 (57.7%) | 0 (0.0%) |
| 15 Years | 2 (14.3%) | 0 (0.0%) |
| 16 and 17 Years | 0 (0.0%) | 0 (0.0%) |
| 18 to 24 Years | 3 (3.8%) | 4 (6.9%) |
| 25 to 34 Years | 7 (10.6%) | 21 (48.8%) |
| 35 to 44 Years | 3 (2.5%) | 13 (16.9%) |
| 45 to 54 Years | 8 (7.8%) | 8 (10.4%) |
| 55 to 64 Years | 6 (6.5%) | 9 (15.2%) |
| 65 to 74 Years | 1 (2.7%) | 9 (32.1%) |
| 75 Years and over | 0 (0.0%) | 0 (0.0%) |
| Total | 74 (11.4%) | 68 (14.9%) |
Income Above Poverty by Sex and Age in King Cove
According to the poverty statistics in King Cove, males aged 16 and 17 years and females aged 5 years are the age groups that are most secure financially, with 100.0% of males and 100.0% of females in these age groups living above the poverty line.
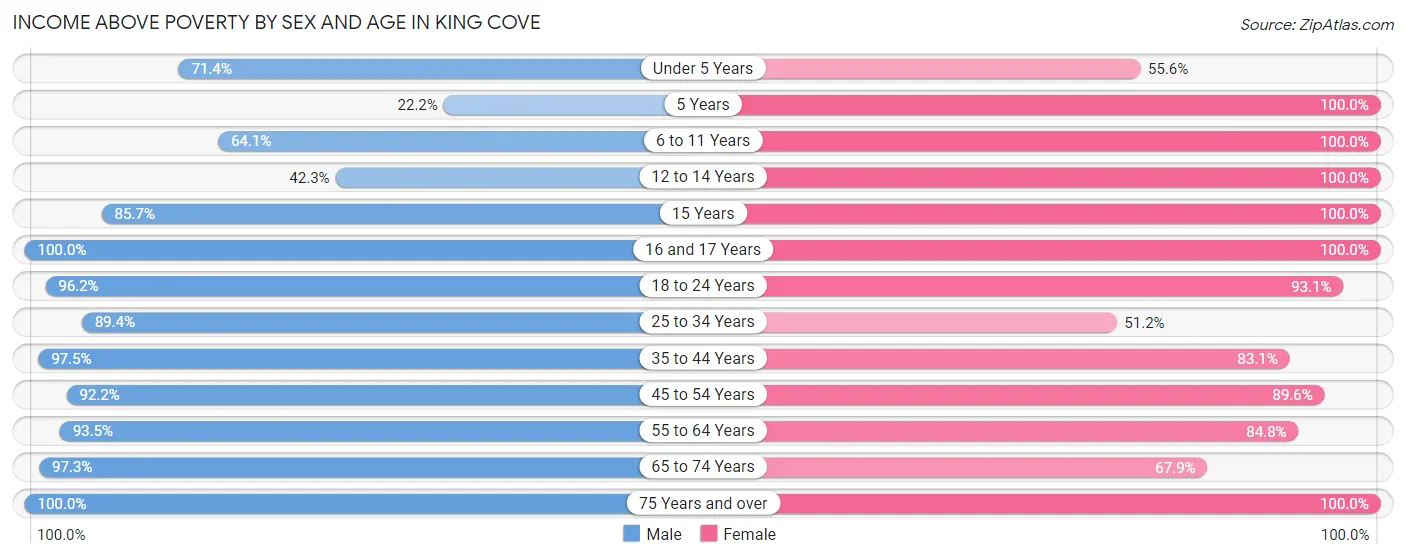
| Age Bracket | Male | Female |
| Under 5 Years | 20 (71.4%) | 5 (55.6%) |
| 5 Years | 2 (22.2%) | 4 (100.0%) |
| 6 to 11 Years | 25 (64.1%) | 17 (100.0%) |
| 12 to 14 Years | 11 (42.3%) | 20 (100.0%) |
| 15 Years | 12 (85.7%) | 9 (100.0%) |
| 16 and 17 Years | 8 (100.0%) | 22 (100.0%) |
| 18 to 24 Years | 75 (96.2%) | 54 (93.1%) |
| 25 to 34 Years | 59 (89.4%) | 22 (51.2%) |
| 35 to 44 Years | 115 (97.5%) | 64 (83.1%) |
| 45 to 54 Years | 95 (92.2%) | 69 (89.6%) |
| 55 to 64 Years | 86 (93.5%) | 50 (84.8%) |
| 65 to 74 Years | 36 (97.3%) | 19 (67.9%) |
| 75 Years and over | 32 (100.0%) | 34 (100.0%) |
| Total | 576 (88.6%) | 389 (85.1%) |
Income Below Poverty Among Married-Couple Families in King Cove
| Children | Above Poverty | Below Poverty |
| No Children | 52 (100.0%) | 0 (0.0%) |
| 1 or 2 Children | 36 (100.0%) | 0 (0.0%) |
| 3 or 4 Children | 12 (100.0%) | 0 (0.0%) |
| 5 or more Children | 0 (0.0%) | 0 (0.0%) |
| Total | 100 (100.0%) | 0 (0.0%) |
Income Below Poverty Among Single-Parent Households in King Cove
According to the poverty data in King Cove, 17.1% or 7 single-father households and 75.0% or 27 single-mother households are living below the poverty line. Among single-father households, those with no children have the highest poverty rate, with 4 households (57.1%) experiencing poverty. Likewise, among single-mother households, those with 3 or 4 children have the highest poverty rate, with 11 households (100.0%) falling below the poverty line.
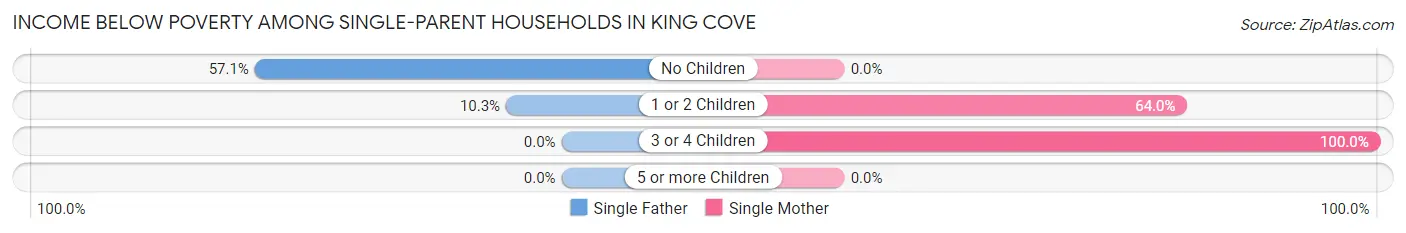
| Children | Single Father | Single Mother |
| No Children | 4 (57.1%) | 0 (0.0%) |
| 1 or 2 Children | 3 (10.3%) | 16 (64.0%) |
| 3 or 4 Children | 0 (0.0%) | 11 (100.0%) |
| 5 or more Children | 0 (0.0%) | 0 (0.0%) |
| Total | 7 (17.1%) | 27 (75.0%) |
Income Below Poverty Among Married-Couple vs Single-Parent Households in King Cove
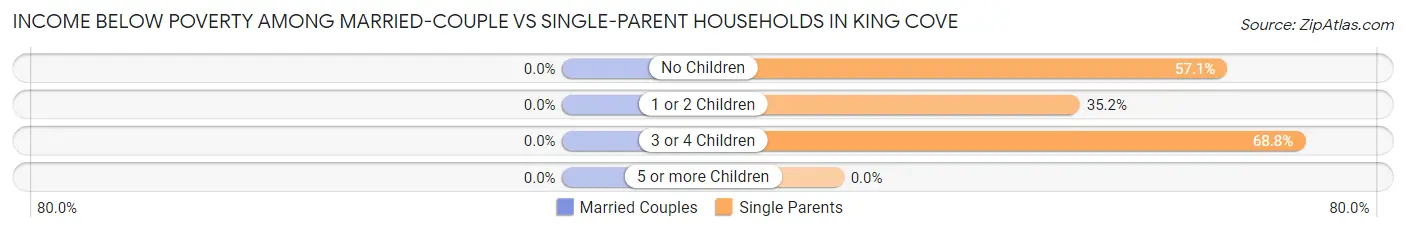
| Children | Married-Couple Families | Single-Parent Households |
| No Children | 0 (0.0%) | 4 (57.1%) |
| 1 or 2 Children | 0 (0.0%) | 19 (35.2%) |
| 3 or 4 Children | 0 (0.0%) | 11 (68.8%) |
| 5 or more Children | 0 (0.0%) | 0 (0.0%) |
| Total | 0 (0.0%) | 34 (44.2%) |
Race in King Cove
The most populous races in King Cove are Native / Alaskan (546 | 49.3%), Asian (255 | 23.0%), and White / Caucasian (140 | 12.6%).
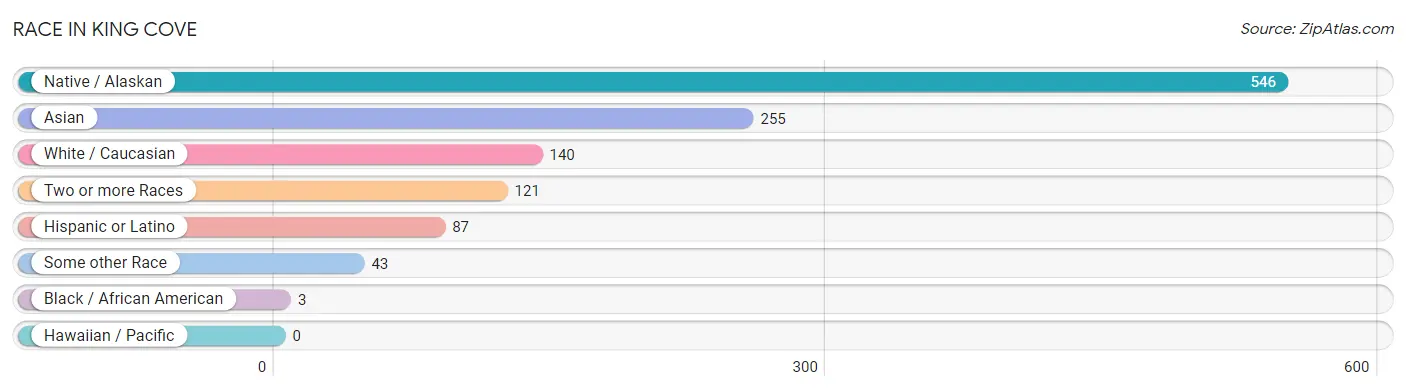
| Race | # Population | % Population |
| Asian | 255 | 23.0% |
| Black / African American | 3 | 0.3% |
| Hawaiian / Pacific | 0 | 0.0% |
| Hispanic or Latino | 87 | 7.9% |
| Native / Alaskan | 546 | 49.3% |
| White / Caucasian | 140 | 12.6% |
| Two or more Races | 121 | 10.9% |
| Some other Race | 43 | 3.9% |
| Total | 1,108 | 100.0% |
Ancestry in King Cove
The most populous ancestries reported in King Cove are Aleut (584 | 52.7%), Korean (259 | 23.4%), Russian (131 | 11.8%), German (112 | 10.1%), and Mexican (68 | 6.1%), together accounting for 104.2% of all King Cove residents.
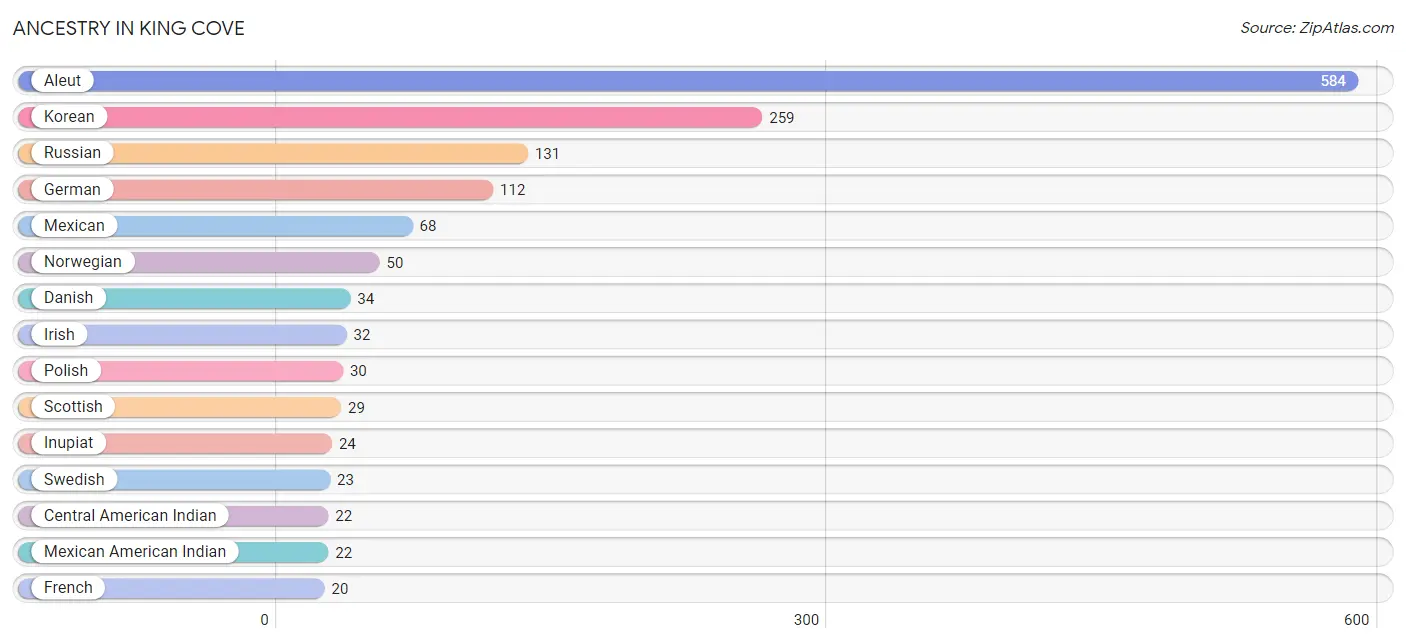
| Ancestry | # Population | % Population |
| African | 7 | 0.6% |
| Alaskan Athabascan | 14 | 1.3% |
| Aleut | 584 | 52.7% |
| Austrian | 8 | 0.7% |
| British | 3 | 0.3% |
| Burmese | 10 | 0.9% |
| Canadian | 3 | 0.3% |
| Central American | 2 | 0.2% |
| Central American Indian | 22 | 2.0% |
| Cherokee | 4 | 0.4% |
| Chippewa | 15 | 1.3% |
| Creek | 3 | 0.3% |
| Danish | 34 | 3.1% |
| Dominican | 3 | 0.3% |
| Eastern European | 3 | 0.3% |
| English | 15 | 1.3% |
| European | 13 | 1.2% |
| French | 20 | 1.8% |
| French Canadian | 8 | 0.7% |
| German | 112 | 10.1% |
| Indian (Asian) | 6 | 0.5% |
| Inupiat | 24 | 2.2% |
| Irish | 32 | 2.9% |
| Italian | 1 | 0.1% |
| Jamaican | 2 | 0.2% |
| Korean | 259 | 23.4% |
| Lithuanian | 3 | 0.3% |
| Mexican | 68 | 6.1% |
| Mexican American Indian | 22 | 2.0% |
| Norwegian | 50 | 4.5% |
| Polish | 30 | 2.7% |
| Portuguese | 3 | 0.3% |
| Puerto Rican | 8 | 0.7% |
| Russian | 131 | 11.8% |
| Salvadoran | 2 | 0.2% |
| Samoan | 3 | 0.3% |
| Scandinavian | 3 | 0.3% |
| Scotch-Irish | 15 | 1.3% |
| Scottish | 29 | 2.6% |
| Spaniard | 6 | 0.5% |
| Subsaharan African | 7 | 0.6% |
| Swedish | 23 | 2.1% |
| Ukrainian | 2 | 0.2% |
| Welsh | 8 | 0.7% | View All 44 Rows |
Immigrants in King Cove
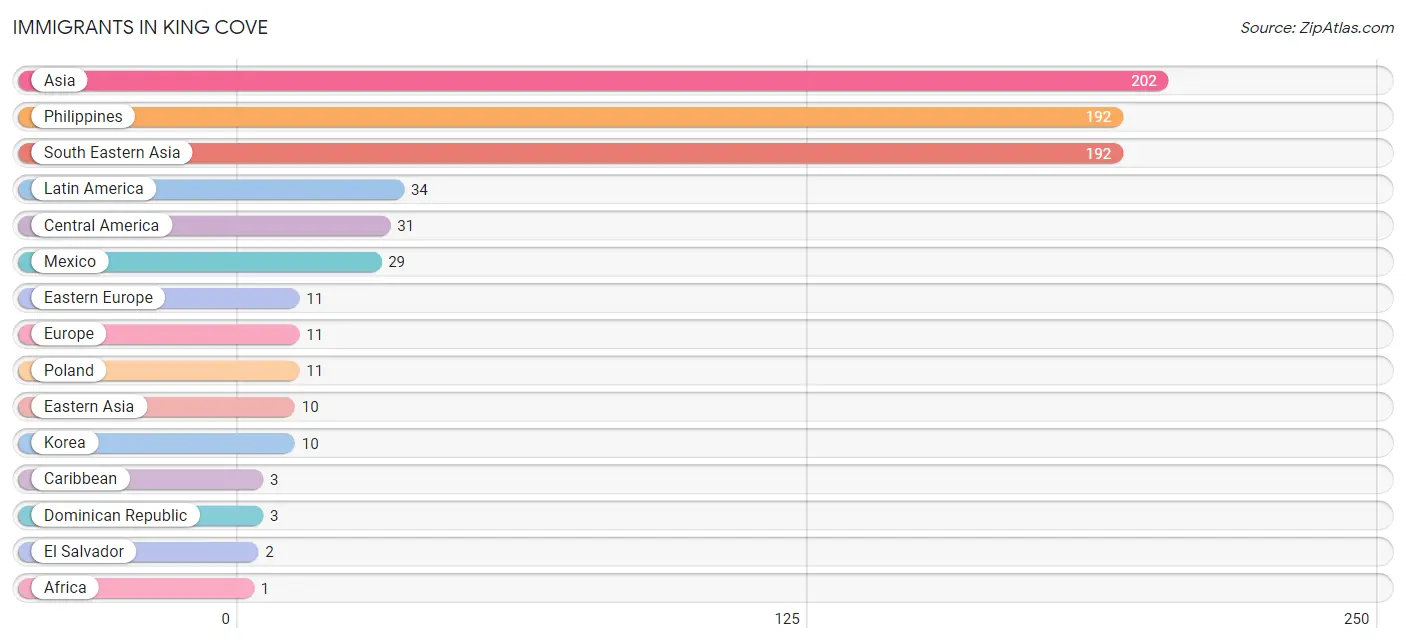
The most numerous immigrant groups reported in King Cove came from Asia (202 | 18.2%), Philippines (192 | 17.3%), South Eastern Asia (192 | 17.3%), Latin America (34 | 3.1%), and Central America (31 | 2.8%), together accounting for 58.8% of all King Cove residents.
| Immigration Origin | # Population | % Population |
| Africa | 1 | 0.1% |
| Asia | 202 | 18.2% |
| Caribbean | 3 | 0.3% |
| Central America | 31 | 2.8% |
| Dominican Republic | 3 | 0.3% |
| Eastern Asia | 10 | 0.9% |
| Eastern Europe | 11 | 1.0% |
| El Salvador | 2 | 0.2% |
| Europe | 11 | 1.0% |
| Korea | 10 | 0.9% |
| Latin America | 34 | 3.1% |
| Mexico | 29 | 2.6% |
| Northern Africa | 1 | 0.1% |
| Philippines | 192 | 17.3% |
| Poland | 11 | 1.0% |
| South Eastern Asia | 192 | 17.3% |
| Sudan | 1 | 0.1% | View All 17 Rows |
Sex and Age in King Cove
Sex and Age in King Cove
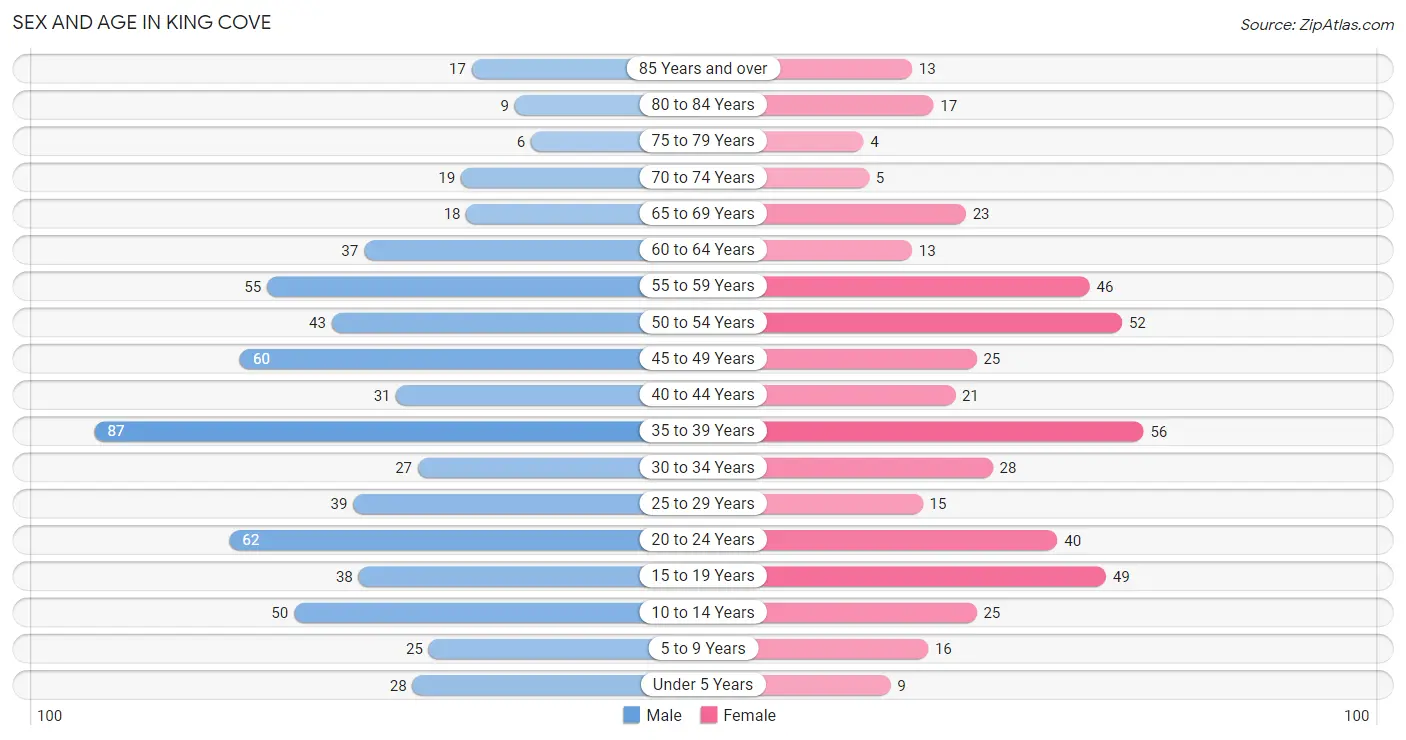
The most populous age groups in King Cove are 35 to 39 Years (87 | 13.4%) for men and 35 to 39 Years (56 | 12.2%) for women.
| Age Bracket | Male | Female |
| Under 5 Years | 28 (4.3%) | 9 (2.0%) |
| 5 to 9 Years | 25 (3.8%) | 16 (3.5%) |
| 10 to 14 Years | 50 (7.7%) | 25 (5.5%) |
| 15 to 19 Years | 38 (5.8%) | 49 (10.7%) |
| 20 to 24 Years | 62 (9.5%) | 40 (8.7%) |
| 25 to 29 Years | 39 (6.0%) | 15 (3.3%) |
| 30 to 34 Years | 27 (4.2%) | 28 (6.1%) |
| 35 to 39 Years | 87 (13.4%) | 56 (12.2%) |
| 40 to 44 Years | 31 (4.8%) | 21 (4.6%) |
| 45 to 49 Years | 60 (9.2%) | 25 (5.5%) |
| 50 to 54 Years | 43 (6.6%) | 52 (11.4%) |
| 55 to 59 Years | 55 (8.5%) | 46 (10.1%) |
| 60 to 64 Years | 37 (5.7%) | 13 (2.8%) |
| 65 to 69 Years | 18 (2.8%) | 23 (5.0%) |
| 70 to 74 Years | 19 (2.9%) | 5 (1.1%) |
| 75 to 79 Years | 6 (0.9%) | 4 (0.9%) |
| 80 to 84 Years | 9 (1.4%) | 17 (3.7%) |
| 85 Years and over | 17 (2.6%) | 13 (2.8%) |
| Total | 651 (100.0%) | 457 (100.0%) |
Families and Households in King Cove
Median Family Size in King Cove
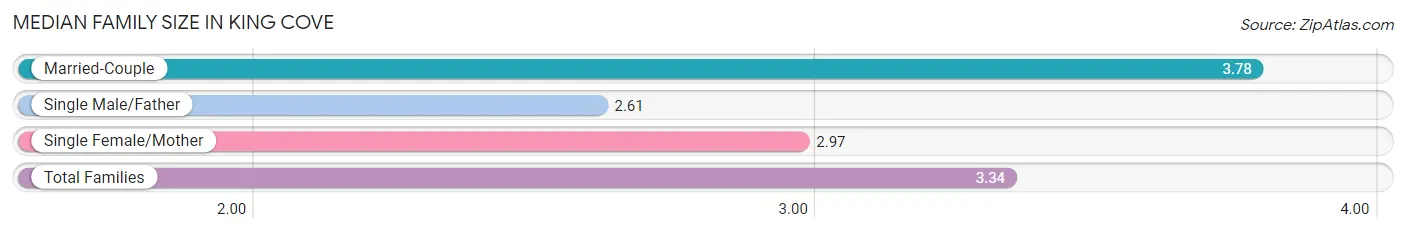
The median family size in King Cove is 3.34 persons per family, with married-couple families (100 | 56.5%) accounting for the largest median family size of 3.78 persons per family. On the other hand, single male/father families (41 | 23.2%) represent the smallest median family size with 2.61 persons per family.
| Family Type | # Families | Family Size |
| Married-Couple | 100 (56.5%) | 3.78 |
| Single Male/Father | 41 (23.2%) | 2.61 |
| Single Female/Mother | 36 (20.3%) | 2.97 |
| Total Families | 177 (100.0%) | 3.34 |
Median Household Size in King Cove
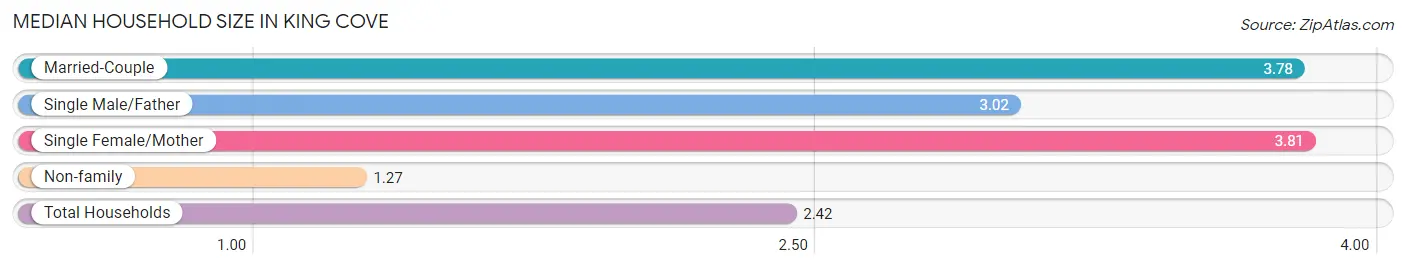
The median household size in King Cove is 2.42 persons per household, with single female/mother households (36 | 10.1%) accounting for the largest median household size of 3.81 persons per household. non-family households (181 | 50.6%) represent the smallest median household size with 1.27 persons per household.
| Household Type | # Households | Household Size |
| Married-Couple | 100 (27.9%) | 3.78 |
| Single Male/Father | 41 (11.5%) | 3.02 |
| Single Female/Mother | 36 (10.1%) | 3.81 |
| Non-family | 181 (50.6%) | 1.27 |
| Total Households | 358 (100.0%) | 2.42 |
Household Size by Marriage Status in King Cove
Out of a total of 358 households in King Cove, 177 (49.4%) are family households, while 181 (50.6%) are nonfamily households. The most numerous type of family households are 2-person households, comprising 55, and the most common type of nonfamily households are 1-person households, comprising 141.
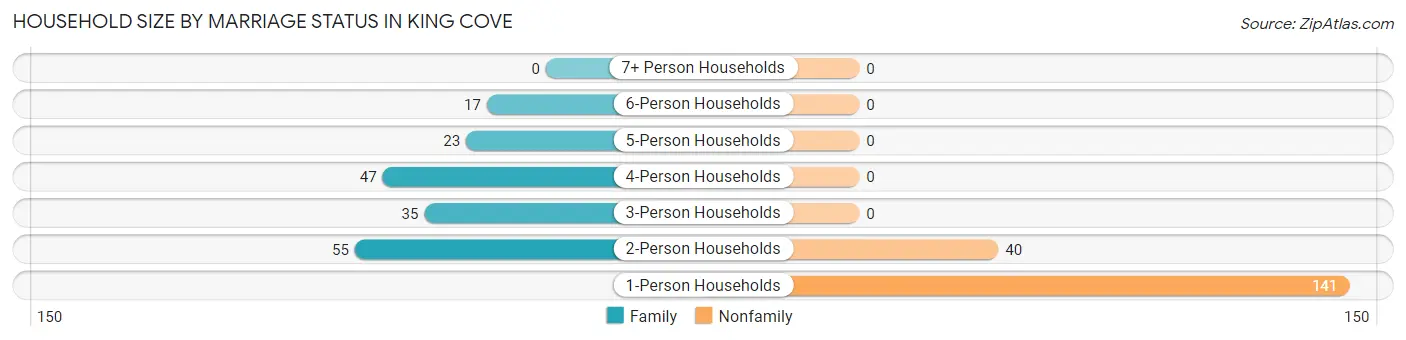
| Household Size | Family Households | Nonfamily Households |
| 1-Person Households | - | 141 (39.4%) |
| 2-Person Households | 55 (15.4%) | 40 (11.2%) |
| 3-Person Households | 35 (9.8%) | 0 (0.0%) |
| 4-Person Households | 47 (13.1%) | 0 (0.0%) |
| 5-Person Households | 23 (6.4%) | 0 (0.0%) |
| 6-Person Households | 17 (4.8%) | 0 (0.0%) |
| 7+ Person Households | 0 (0.0%) | 0 (0.0%) |
| Total | 177 (49.4%) | 181 (50.6%) |
Female Fertility in King Cove
Fertility by Age in King Cove
Average fertility rate in King Cove is 24.0 births per 1,000 women. Women in the age bracket of 20 to 34 years have the highest fertility rate with 72.0 births per 1,000 women. Women in the age bracket of 20 to 34 years acount for 100.0% of all women with births.
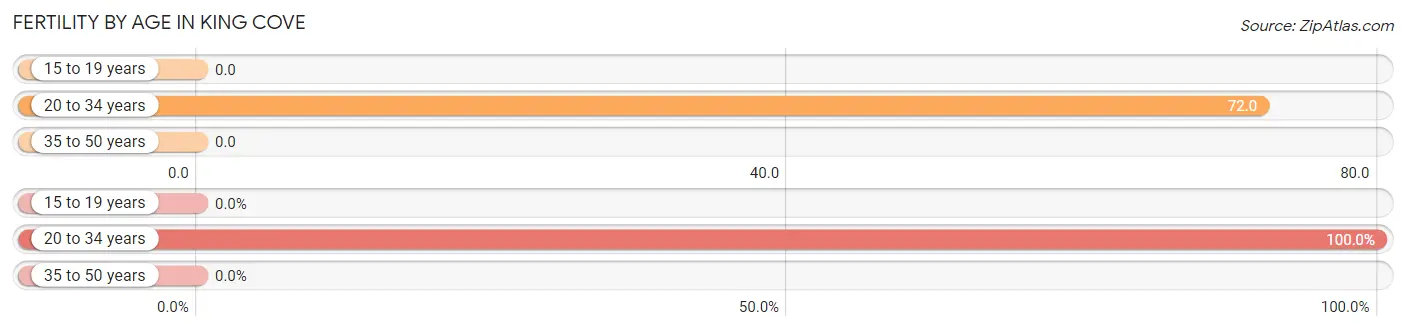
| Age Bracket | Women with Births | Births / 1,000 Women |
| 15 to 19 years | 0 (0.0%) | 0.0 |
| 20 to 34 years | 6 (100.0%) | 72.0 |
| 35 to 50 years | 0 (0.0%) | 0.0 |
| Total | 6 (100.0%) | 24.0 |
Fertility by Age by Marriage Status in King Cove
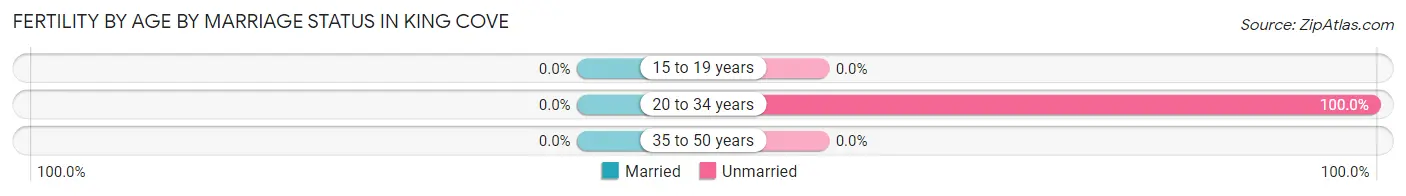
| Age Bracket | Married | Unmarried |
| 15 to 19 years | 0 (0.0%) | 0 (0.0%) |
| 20 to 34 years | 0 (0.0%) | 6 (100.0%) |
| 35 to 50 years | 0 (0.0%) | 0 (0.0%) |
| Total | 0 (0.0%) | 6 (100.0%) |
Fertility by Education in King Cove
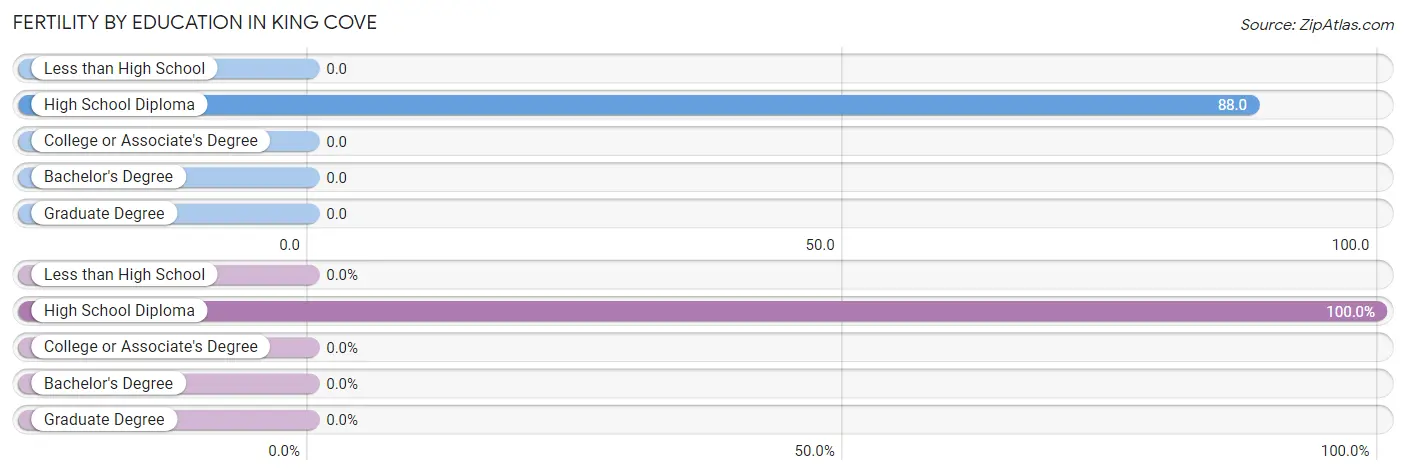
| Educational Attainment | Women with Births | Births / 1,000 Women |
| Less than High School | 0 (0.0%) | 0.0 |
| High School Diploma | 6 (100.0%) | 88.0 |
| College or Associate's Degree | 0 (0.0%) | 0.0 |
| Bachelor's Degree | 0 (0.0%) | 0.0 |
| Graduate Degree | 0 (0.0%) | 0.0 |
| Total | 6 (100.0%) | 24.0 |
Fertility by Education by Marriage Status in King Cove
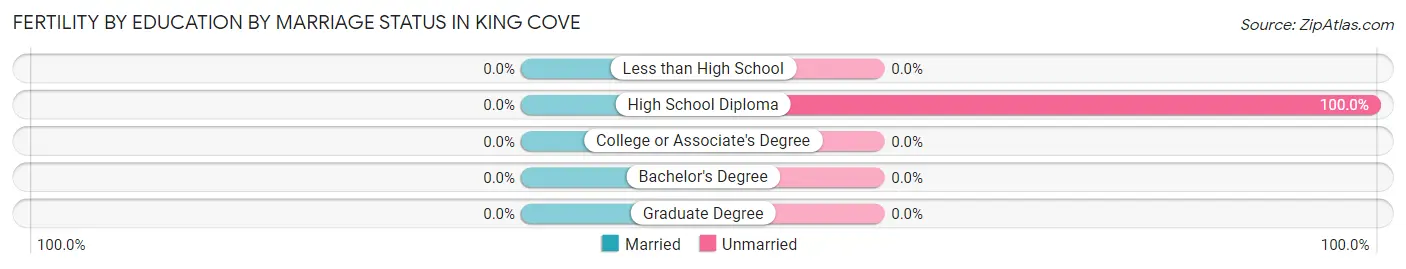
| Educational Attainment | Married | Unmarried |
| Less than High School | 0 (0.0%) | 0 (0.0%) |
| High School Diploma | 0 (0.0%) | 6 (100.0%) |
| College or Associate's Degree | 0 (0.0%) | 0 (0.0%) |
| Bachelor's Degree | 0 (0.0%) | 0 (0.0%) |
| Graduate Degree | 0 (0.0%) | 0 (0.0%) |
| Total | 0 (0.0%) | 6 (100.0%) |
Employment Characteristics in King Cove
Employment by Class of Employer in King Cove
Among the 642 employed individuals in King Cove, private company employees (450 | 70.1%), local government employees (99 | 15.4%), and self-employed (not incorporated) (54 | 8.4%) make up the most common classes of employment.
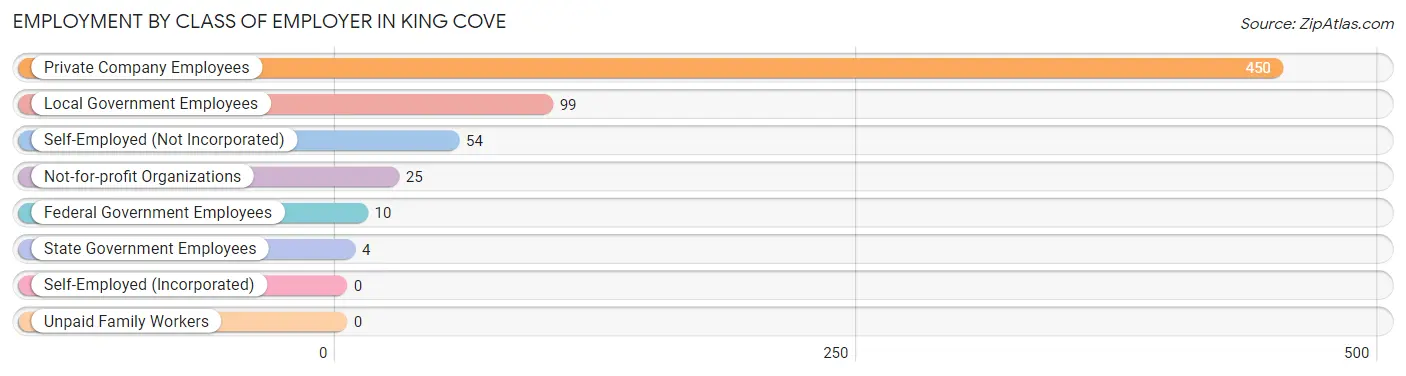
| Employer Class | # Employees | % Employees |
| Private Company Employees | 450 | 70.1% |
| Self-Employed (Incorporated) | 0 | 0.0% |
| Self-Employed (Not Incorporated) | 54 | 8.4% |
| Not-for-profit Organizations | 25 | 3.9% |
| Local Government Employees | 99 | 15.4% |
| State Government Employees | 4 | 0.6% |
| Federal Government Employees | 10 | 1.6% |
| Unpaid Family Workers | 0 | 0.0% |
| Total | 642 | 100.0% |
Employment Status by Age in King Cove
According to the labor force statistics for King Cove, out of the total population over 16 years of age (932), 76.3% or 711 individuals are in the labor force, with 6.9% or 49 of them unemployed. The age group with the highest labor force participation rate is 35 to 44 years, with 89.2% or 174 individuals in the labor force. Within the labor force, the 16 to 19 years age range has the highest percentage of unemployed individuals, with 100.0% or 9 of them being unemployed.
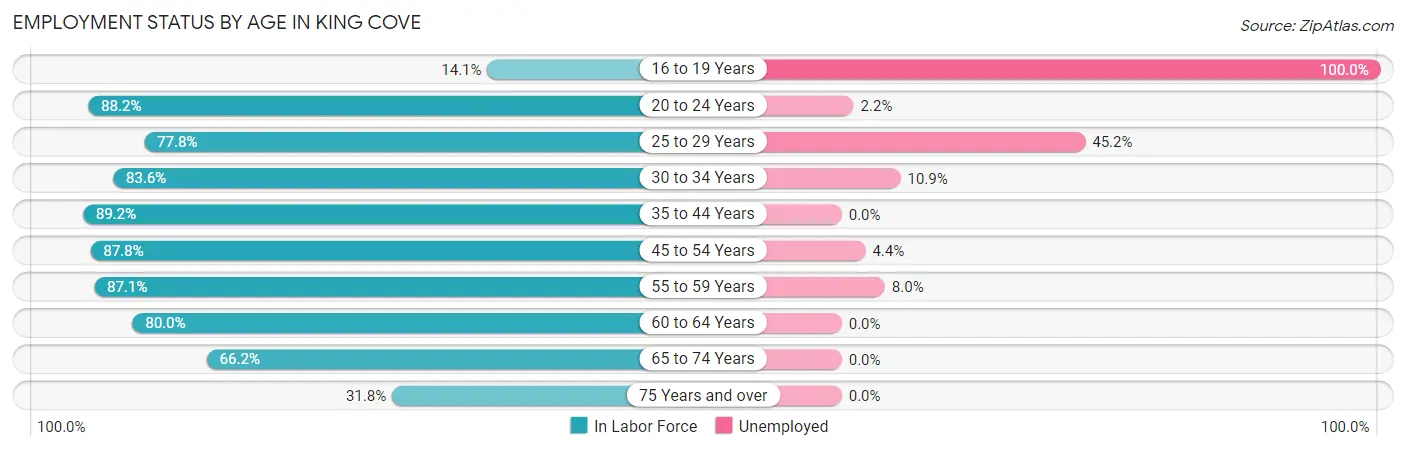
| Age Bracket | In Labor Force | Unemployed |
| 16 to 19 Years | 9 (14.1%) | 9 (100.0%) |
| 20 to 24 Years | 90 (88.2%) | 2 (2.2%) |
| 25 to 29 Years | 42 (77.8%) | 19 (45.2%) |
| 30 to 34 Years | 46 (83.6%) | 5 (10.9%) |
| 35 to 44 Years | 174 (89.2%) | 0 (0.0%) |
| 45 to 54 Years | 158 (87.8%) | 7 (4.4%) |
| 55 to 59 Years | 88 (87.1%) | 7 (8.0%) |
| 60 to 64 Years | 40 (80.0%) | 0 (0.0%) |
| 65 to 74 Years | 43 (66.2%) | 0 (0.0%) |
| 75 Years and over | 21 (31.8%) | 0 (0.0%) |
| Total | 711 (76.3%) | 49 (6.9%) |
Employment Status by Educational Attainment in King Cove
According to labor force statistics for King Cove, 86.3% of individuals (548) out of the total population between 25 and 64 years of age (635) are in the labor force, with 6.9% or 38 of them being unemployed. The group with the highest labor force participation rate are those with the educational attainment of college / associate degree, with 96.1% or 174 individuals in the labor force. Within the labor force, individuals with high school diploma education have the highest percentage of unemployment, with 13.1% or 32 of them being unemployed.
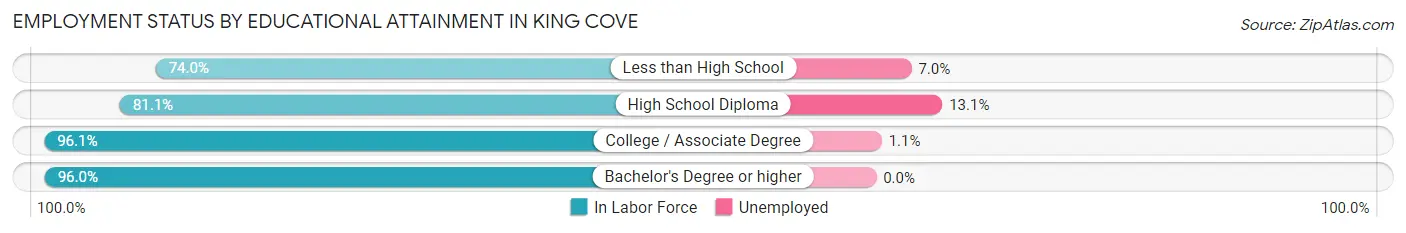
| Educational Attainment | In Labor Force | Unemployed |
| Less than High School | 57 (74.0%) | 5 (7.0%) |
| High School Diploma | 245 (81.1%) | 40 (13.1%) |
| College / Associate Degree | 174 (96.1%) | 2 (1.1%) |
| Bachelor's Degree or higher | 72 (96.0%) | 0 (0.0%) |
| Total | 548 (86.3%) | 44 (6.9%) |
Employment Occupations by Sex in King Cove
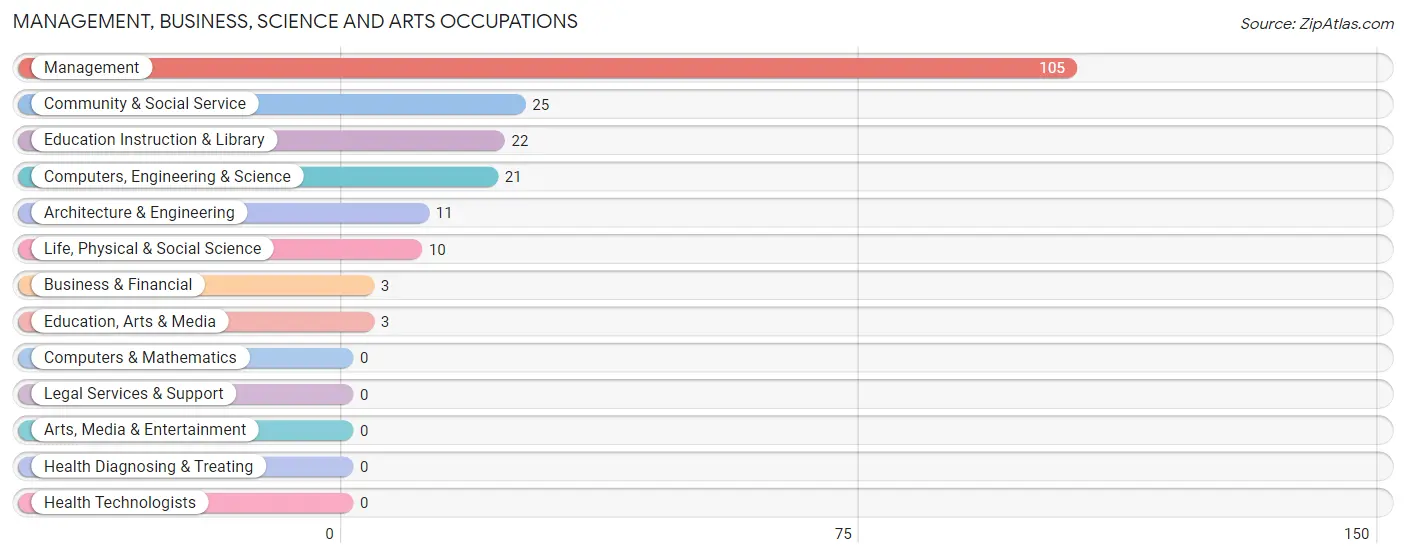
Management, Business, Science and Arts Occupations
The most common Management, Business, Science and Arts occupations in King Cove are Management (105 | 15.9%), Community & Social Service (25 | 3.8%), Education Instruction & Library (22 | 3.3%), Computers, Engineering & Science (21 | 3.2%), and Architecture & Engineering (11 | 1.7%).
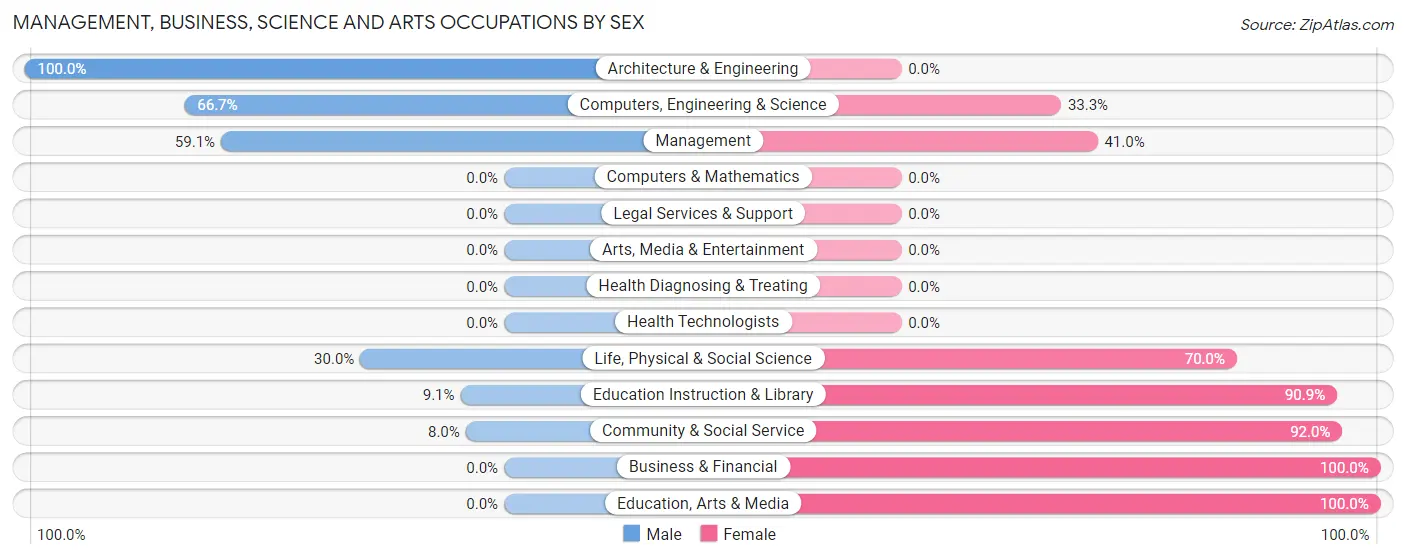
Management, Business, Science and Arts Occupations by Sex
Within the Management, Business, Science and Arts occupations in King Cove, the most male-oriented occupations are Architecture & Engineering (100.0%), Computers, Engineering & Science (66.7%), and Management (59.1%), while the most female-oriented occupations are Business & Financial (100.0%), Education, Arts & Media (100.0%), and Community & Social Service (92.0%).
| Occupation | Male | Female |
| Management | 62 (59.1%) | 43 (40.9%) |
| Business & Financial | 0 (0.0%) | 3 (100.0%) |
| Computers, Engineering & Science | 14 (66.7%) | 7 (33.3%) |
| Computers & Mathematics | 0 (0.0%) | 0 (0.0%) |
| Architecture & Engineering | 11 (100.0%) | 0 (0.0%) |
| Life, Physical & Social Science | 3 (30.0%) | 7 (70.0%) |
| Community & Social Service | 2 (8.0%) | 23 (92.0%) |
| Education, Arts & Media | 0 (0.0%) | 3 (100.0%) |
| Legal Services & Support | 0 (0.0%) | 0 (0.0%) |
| Education Instruction & Library | 2 (9.1%) | 20 (90.9%) |
| Arts, Media & Entertainment | 0 (0.0%) | 0 (0.0%) |
| Health Diagnosing & Treating | 0 (0.0%) | 0 (0.0%) |
| Health Technologists | 0 (0.0%) | 0 (0.0%) |
| Total (Category) | 78 (50.6%) | 76 (49.3%) |
| Total (Overall) | 405 (61.2%) | 257 (38.8%) |
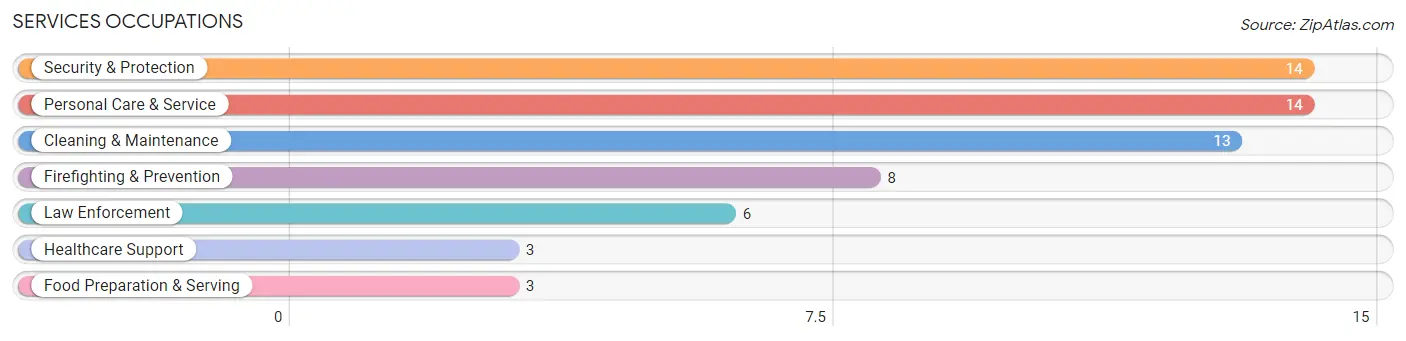
Services Occupations
The most common Services occupations in King Cove are Security & Protection (14 | 2.1%), Personal Care & Service (14 | 2.1%), Cleaning & Maintenance (13 | 2.0%), Firefighting & Prevention (8 | 1.2%), and Law Enforcement (6 | 0.9%).
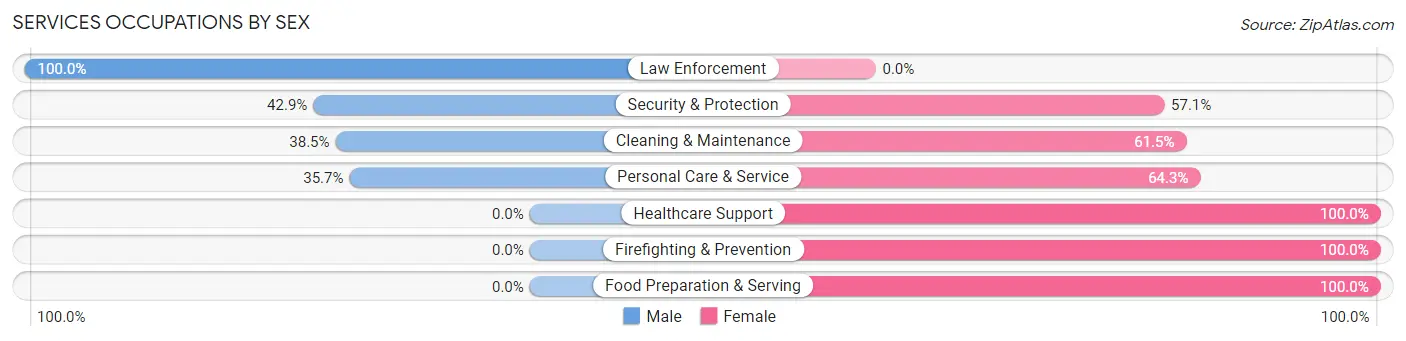
Services Occupations by Sex
Within the Services occupations in King Cove, the most male-oriented occupations are Law Enforcement (100.0%), Security & Protection (42.9%), and Cleaning & Maintenance (38.5%), while the most female-oriented occupations are Healthcare Support (100.0%), Firefighting & Prevention (100.0%), and Food Preparation & Serving (100.0%).
| Occupation | Male | Female |
| Healthcare Support | 0 (0.0%) | 3 (100.0%) |
| Security & Protection | 6 (42.9%) | 8 (57.1%) |
| Firefighting & Prevention | 0 (0.0%) | 8 (100.0%) |
| Law Enforcement | 6 (100.0%) | 0 (0.0%) |
| Food Preparation & Serving | 0 (0.0%) | 3 (100.0%) |
| Cleaning & Maintenance | 5 (38.5%) | 8 (61.5%) |
| Personal Care & Service | 5 (35.7%) | 9 (64.3%) |
| Total (Category) | 16 (34.0%) | 31 (66.0%) |
| Total (Overall) | 405 (61.2%) | 257 (38.8%) |
Sales and Office Occupations
The most common Sales and Office occupations in King Cove are Office & Administration (63 | 9.5%), and Sales & Related (33 | 5.0%).
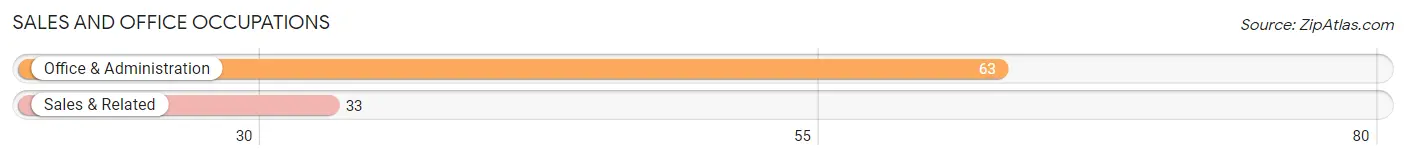
Sales and Office Occupations by Sex
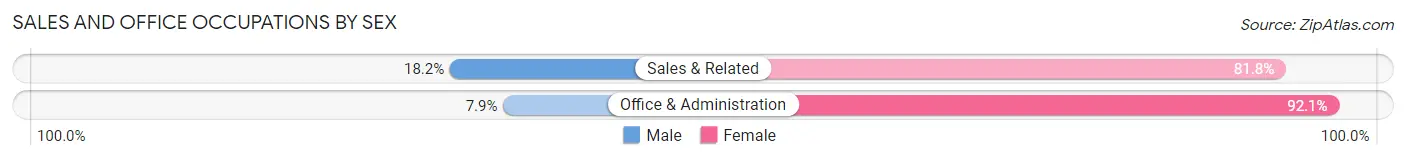
| Occupation | Male | Female |
| Sales & Related | 6 (18.2%) | 27 (81.8%) |
| Office & Administration | 5 (7.9%) | 58 (92.1%) |
| Total (Category) | 11 (11.5%) | 85 (88.5%) |
| Total (Overall) | 405 (61.2%) | 257 (38.8%) |
Natural Resources, Construction and Maintenance Occupations
The most common Natural Resources, Construction and Maintenance occupations in King Cove are Construction & Extraction (62 | 9.4%), Farming, Fishing & Forestry (40 | 6.0%), and Installation, Maintenance & Repair (15 | 2.3%).
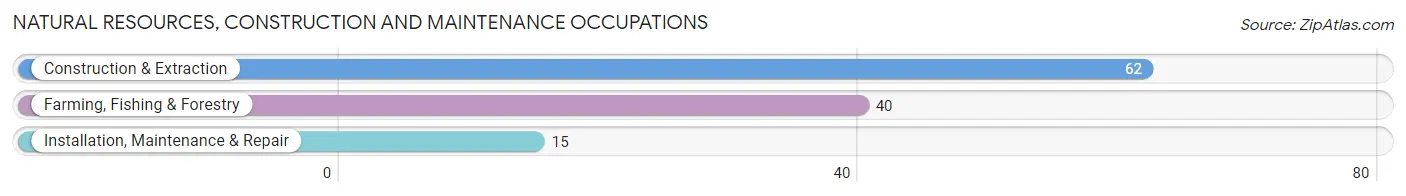
Natural Resources, Construction and Maintenance Occupations by Sex
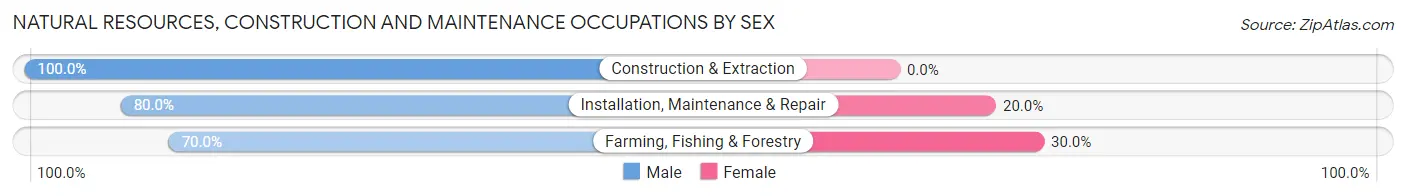
| Occupation | Male | Female |
| Farming, Fishing & Forestry | 28 (70.0%) | 12 (30.0%) |
| Construction & Extraction | 62 (100.0%) | 0 (0.0%) |
| Installation, Maintenance & Repair | 12 (80.0%) | 3 (20.0%) |
| Total (Category) | 102 (87.2%) | 15 (12.8%) |
| Total (Overall) | 405 (61.2%) | 257 (38.8%) |
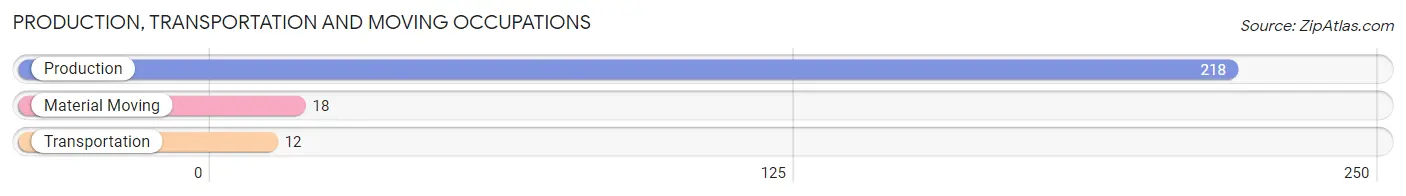
Production, Transportation and Moving Occupations
The most common Production, Transportation and Moving occupations in King Cove are Production (218 | 32.9%), Material Moving (18 | 2.7%), and Transportation (12 | 1.8%).
Production, Transportation and Moving Occupations by Sex
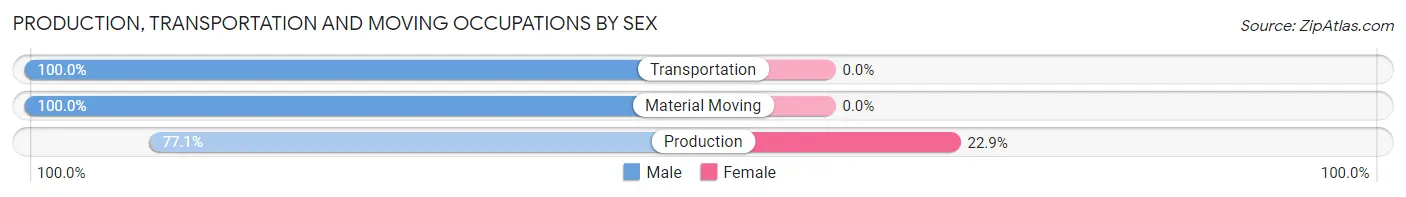
| Occupation | Male | Female |
| Production | 168 (77.1%) | 50 (22.9%) |
| Transportation | 12 (100.0%) | 0 (0.0%) |
| Material Moving | 18 (100.0%) | 0 (0.0%) |
| Total (Category) | 198 (79.8%) | 50 (20.2%) |
| Total (Overall) | 405 (61.2%) | 257 (38.8%) |
Employment Industries by Sex in King Cove
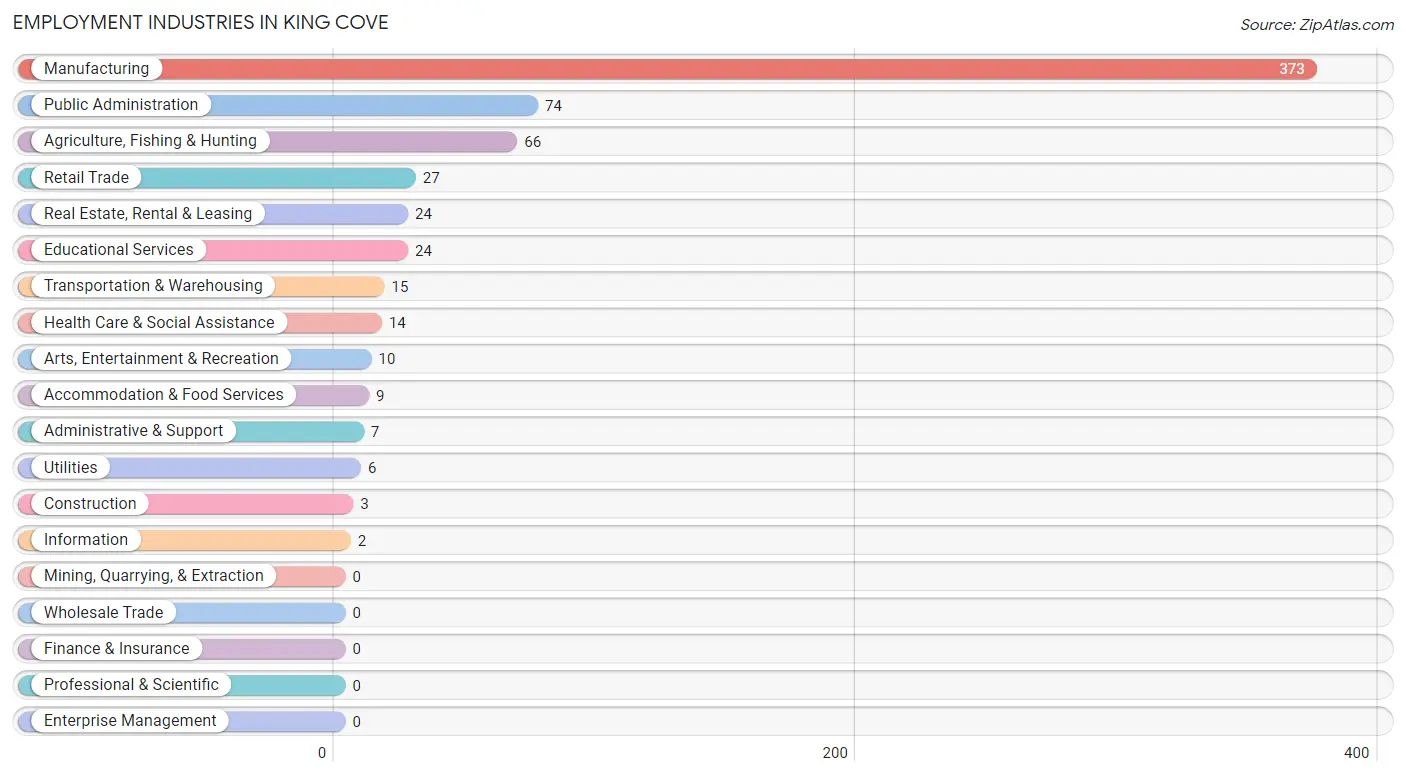
Employment Industries in King Cove
The major employment industries in King Cove include Manufacturing (373 | 56.3%), Public Administration (74 | 11.2%), Agriculture, Fishing & Hunting (66 | 10.0%), Retail Trade (27 | 4.1%), and Real Estate, Rental & Leasing (24 | 3.6%).
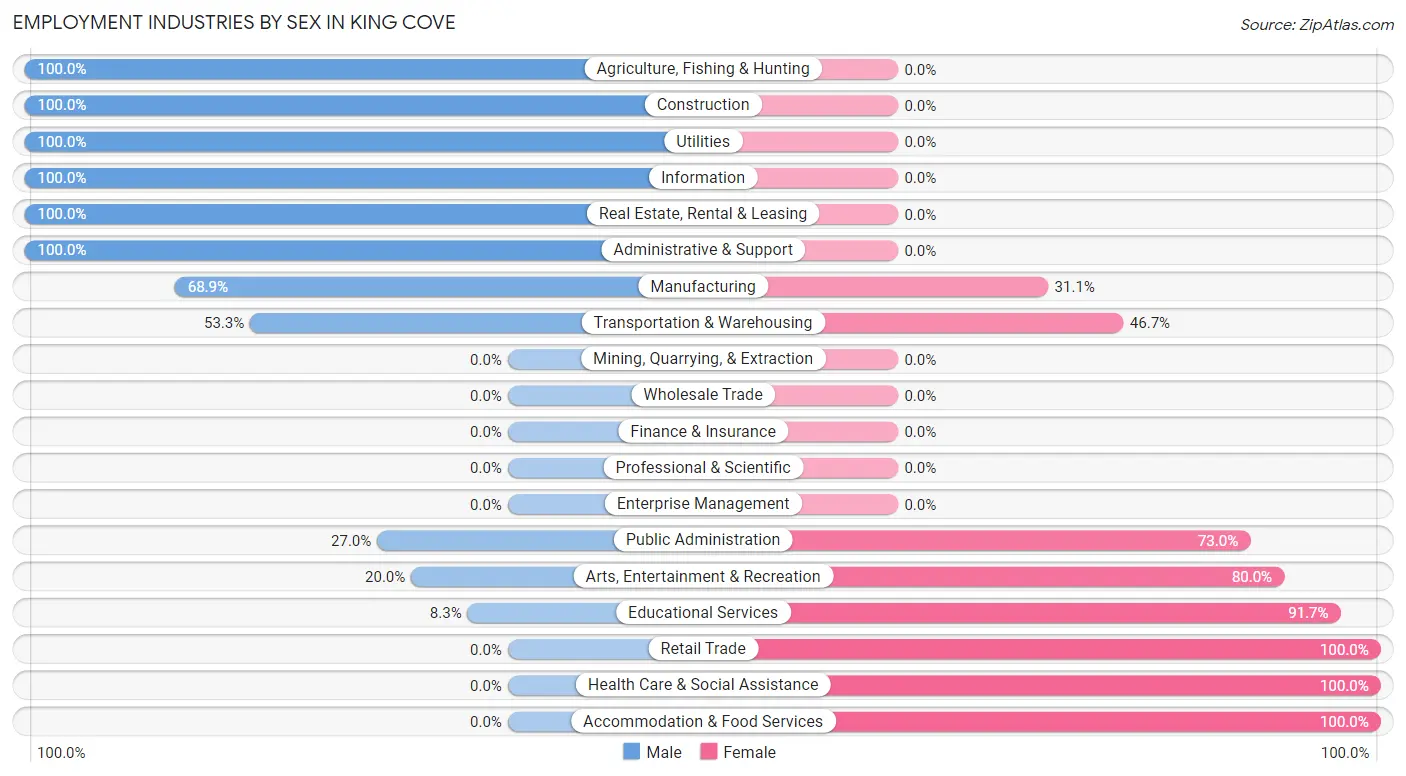
Employment Industries by Sex in King Cove
The King Cove industries that see more men than women are Agriculture, Fishing & Hunting (100.0%), Construction (100.0%), and Utilities (100.0%), whereas the industries that tend to have a higher number of women are Retail Trade (100.0%), Health Care & Social Assistance (100.0%), and Accommodation & Food Services (100.0%).
| Industry | Male | Female |
| Agriculture, Fishing & Hunting | 66 (100.0%) | 0 (0.0%) |
| Mining, Quarrying, & Extraction | 0 (0.0%) | 0 (0.0%) |
| Construction | 3 (100.0%) | 0 (0.0%) |
| Manufacturing | 257 (68.9%) | 116 (31.1%) |
| Wholesale Trade | 0 (0.0%) | 0 (0.0%) |
| Retail Trade | 0 (0.0%) | 27 (100.0%) |
| Transportation & Warehousing | 8 (53.3%) | 7 (46.7%) |
| Utilities | 6 (100.0%) | 0 (0.0%) |
| Information | 2 (100.0%) | 0 (0.0%) |
| Finance & Insurance | 0 (0.0%) | 0 (0.0%) |
| Real Estate, Rental & Leasing | 24 (100.0%) | 0 (0.0%) |
| Professional & Scientific | 0 (0.0%) | 0 (0.0%) |
| Enterprise Management | 0 (0.0%) | 0 (0.0%) |
| Administrative & Support | 7 (100.0%) | 0 (0.0%) |
| Educational Services | 2 (8.3%) | 22 (91.7%) |
| Health Care & Social Assistance | 0 (0.0%) | 14 (100.0%) |
| Arts, Entertainment & Recreation | 2 (20.0%) | 8 (80.0%) |
| Accommodation & Food Services | 0 (0.0%) | 9 (100.0%) |
| Public Administration | 20 (27.0%) | 54 (73.0%) |
| Total | 405 (61.2%) | 257 (38.8%) |
Education in King Cove
School Enrollment in King Cove
The most common levels of schooling among the 222 students in King Cove are high school (63 | 28.4%), middle school (61 | 27.5%), and college / undergraduate (41 | 18.5%).
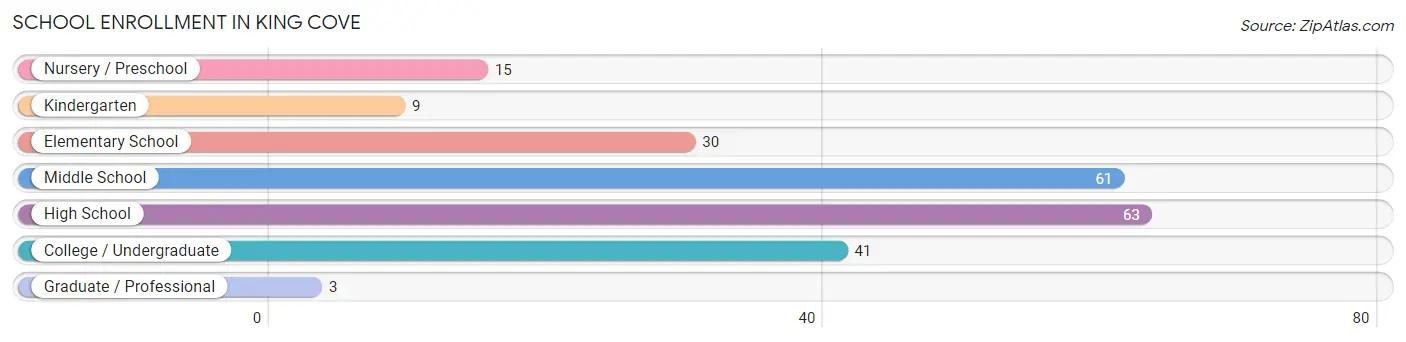
| School Level | # Students | % Students |
| Nursery / Preschool | 15 | 6.8% |
| Kindergarten | 9 | 4.1% |
| Elementary School | 30 | 13.5% |
| Middle School | 61 | 27.5% |
| High School | 63 | 28.4% |
| College / Undergraduate | 41 | 18.5% |
| Graduate / Professional | 3 | 1.3% |
| Total | 222 | 100.0% |
School Enrollment by Age by Funding Source in King Cove
Out of a total of 222 students who are enrolled in schools in King Cove, 6 (2.7%) attend a private institution, while the remaining 216 (97.3%) are enrolled in public schools. The age group of 3 to 4 year olds has the highest likelihood of being enrolled in private schools, with 1 (10.0% in the age bracket) enrolled. Conversely, the age group of 5 to 9 year old has the lowest likelihood of being enrolled in a private school, with 40 (100.0% in the age bracket) attending a public institution.
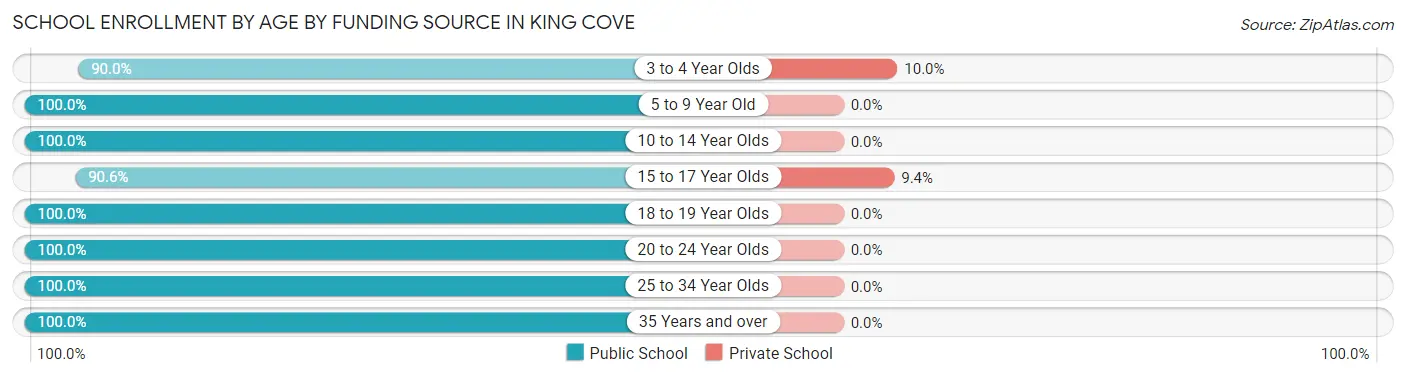
| Age Bracket | Public School | Private School |
| 3 to 4 Year Olds | 9 (90.0%) | 1 (10.0%) |
| 5 to 9 Year Old | 40 (100.0%) | 0 (0.0%) |
| 10 to 14 Year Olds | 75 (100.0%) | 0 (0.0%) |
| 15 to 17 Year Olds | 48 (90.6%) | 5 (9.4%) |
| 18 to 19 Year Olds | 21 (100.0%) | 0 (0.0%) |
| 20 to 24 Year Olds | 5 (100.0%) | 0 (0.0%) |
| 25 to 34 Year Olds | 3 (100.0%) | 0 (0.0%) |
| 35 Years and over | 15 (100.0%) | 0 (0.0%) |
| Total | 216 (97.3%) | 6 (2.7%) |
Educational Attainment by Field of Study in King Cove
Business (37 | 43.5%), bio, nature & agricultural (13 | 15.3%), education (9 | 10.6%), science & technology (8 | 9.4%), and social sciences (5 | 5.9%) are the most common fields of study among 85 individuals in King Cove who have obtained a bachelor's degree or higher.
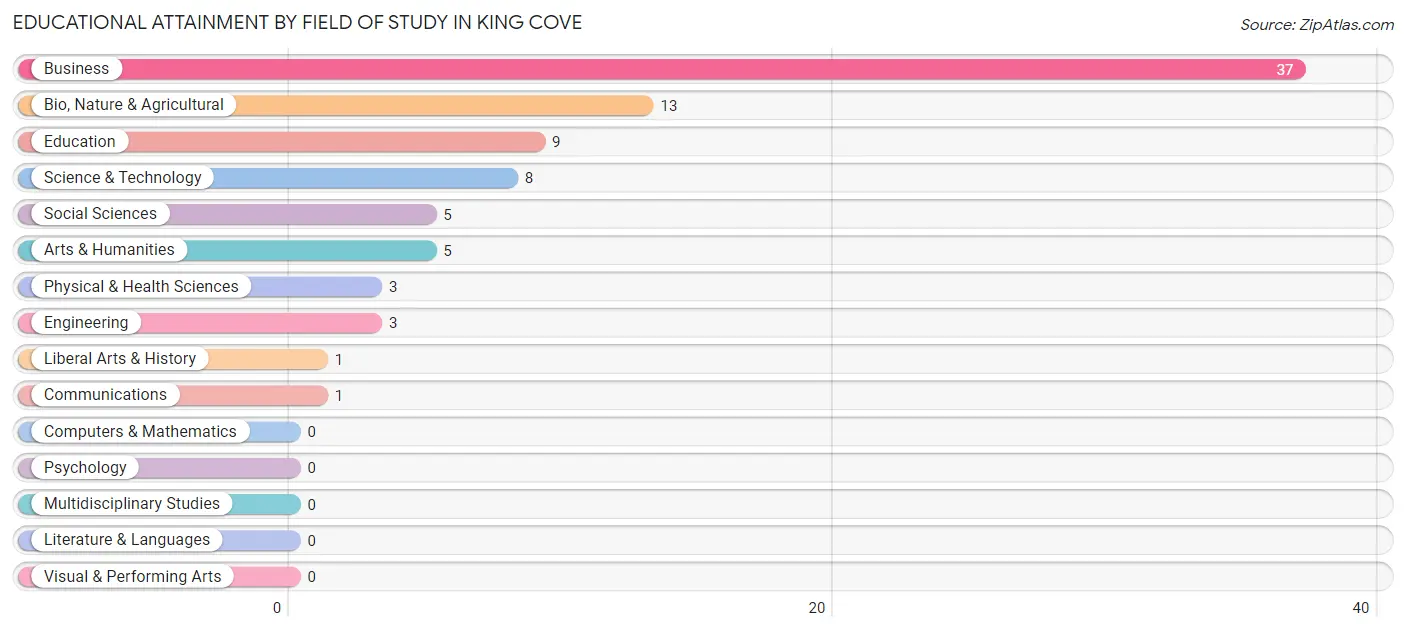
| Field of Study | # Graduates | % Graduates |
| Computers & Mathematics | 0 | 0.0% |
| Bio, Nature & Agricultural | 13 | 15.3% |
| Physical & Health Sciences | 3 | 3.5% |
| Psychology | 0 | 0.0% |
| Social Sciences | 5 | 5.9% |
| Engineering | 3 | 3.5% |
| Multidisciplinary Studies | 0 | 0.0% |
| Science & Technology | 8 | 9.4% |
| Business | 37 | 43.5% |
| Education | 9 | 10.6% |
| Literature & Languages | 0 | 0.0% |
| Liberal Arts & History | 1 | 1.2% |
| Visual & Performing Arts | 0 | 0.0% |
| Communications | 1 | 1.2% |
| Arts & Humanities | 5 | 5.9% |
| Total | 85 | 100.0% |
Transportation & Commute in King Cove
Vehicle Availability by Sex in King Cove
The most prevalent vehicle ownership categories in King Cove are males with no vehicle (114, accounting for 46.7%) and females with no vehicle (43, making up 69.5%).
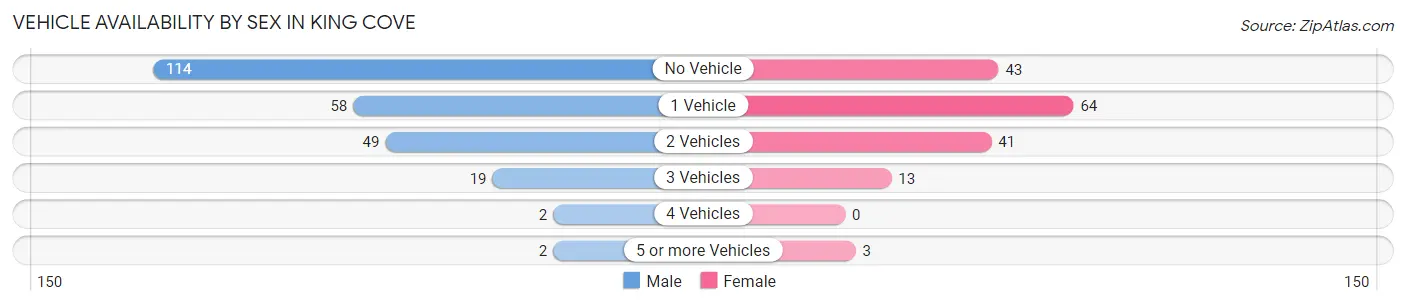
| Vehicles Available | Male | Female |
| No Vehicle | 114 (46.7%) | 43 (26.2%) |
| 1 Vehicle | 58 (23.8%) | 64 (39.0%) |
| 2 Vehicles | 49 (20.1%) | 41 (25.0%) |
| 3 Vehicles | 19 (7.8%) | 13 (7.9%) |
| 4 Vehicles | 2 (0.8%) | 0 (0.0%) |
| 5 or more Vehicles | 2 (0.8%) | 3 (1.8%) |
| Total | 244 (100.0%) | 164 (100.0%) |
Commute Time in King Cove
The most frequently occuring commute durations in King Cove are 5 to 9 minutes (349 commuters, 57.1%), less than 5 minutes (199 commuters, 32.6%), and 10 to 14 minutes (30 commuters, 4.9%).
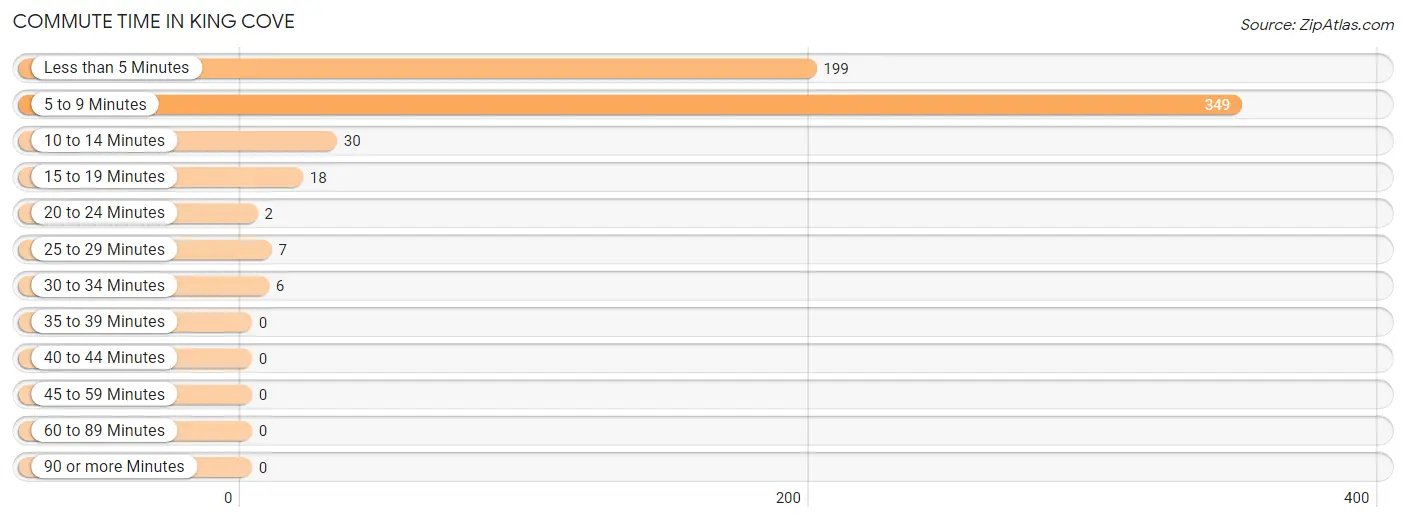
| Commute Time | # Commuters | % Commuters |
| Less than 5 Minutes | 199 | 32.6% |
| 5 to 9 Minutes | 349 | 57.1% |
| 10 to 14 Minutes | 30 | 4.9% |
| 15 to 19 Minutes | 18 | 2.9% |
| 20 to 24 Minutes | 2 | 0.3% |
| 25 to 29 Minutes | 7 | 1.1% |
| 30 to 34 Minutes | 6 | 1.0% |
| 35 to 39 Minutes | 0 | 0.0% |
| 40 to 44 Minutes | 0 | 0.0% |
| 45 to 59 Minutes | 0 | 0.0% |
| 60 to 89 Minutes | 0 | 0.0% |
| 90 or more Minutes | 0 | 0.0% |
Commute Time by Sex in King Cove
The most common commute times in King Cove are 5 to 9 minutes (209 commuters, 55.4%) for males and 5 to 9 minutes (140 commuters, 59.8%) for females.
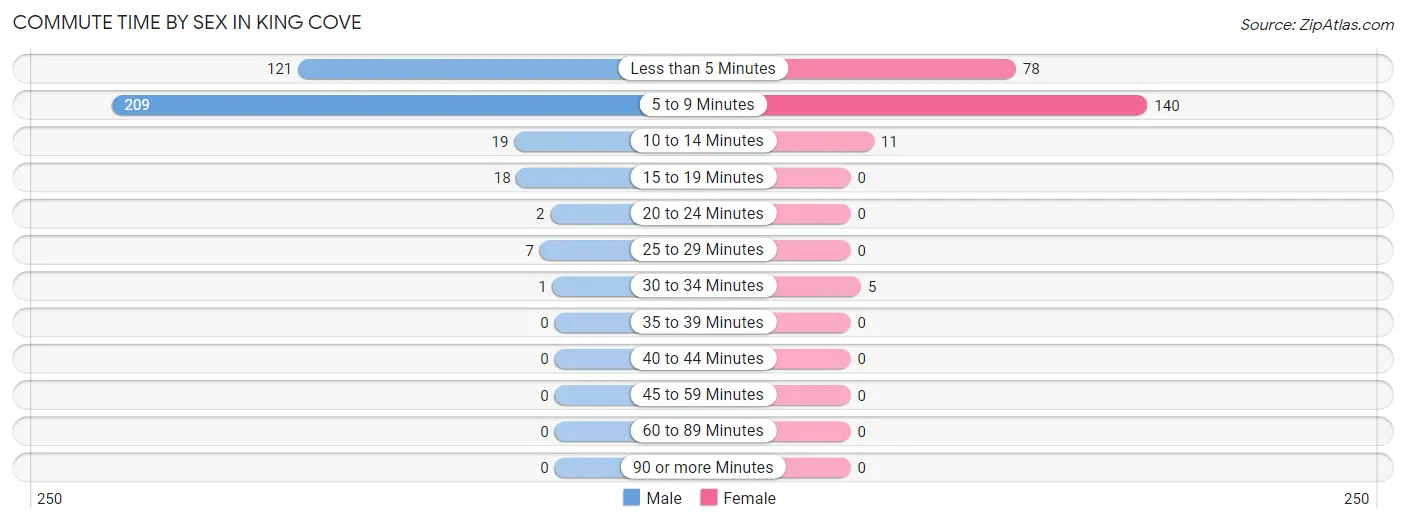
| Commute Time | Male | Female |
| Less than 5 Minutes | 121 (32.1%) | 78 (33.3%) |
| 5 to 9 Minutes | 209 (55.4%) | 140 (59.8%) |
| 10 to 14 Minutes | 19 (5.0%) | 11 (4.7%) |
| 15 to 19 Minutes | 18 (4.8%) | 0 (0.0%) |
| 20 to 24 Minutes | 2 (0.5%) | 0 (0.0%) |
| 25 to 29 Minutes | 7 (1.9%) | 0 (0.0%) |
| 30 to 34 Minutes | 1 (0.3%) | 5 (2.1%) |
| 35 to 39 Minutes | 0 (0.0%) | 0 (0.0%) |
| 40 to 44 Minutes | 0 (0.0%) | 0 (0.0%) |
| 45 to 59 Minutes | 0 (0.0%) | 0 (0.0%) |
| 60 to 89 Minutes | 0 (0.0%) | 0 (0.0%) |
| 90 or more Minutes | 0 (0.0%) | 0 (0.0%) |
Time of Departure to Work by Sex in King Cove
The most frequent times of departure to work in King Cove are 5:30 AM to 5:59 AM (148, 39.3%) for males and 7:30 AM to 7:59 AM (63, 26.9%) for females.
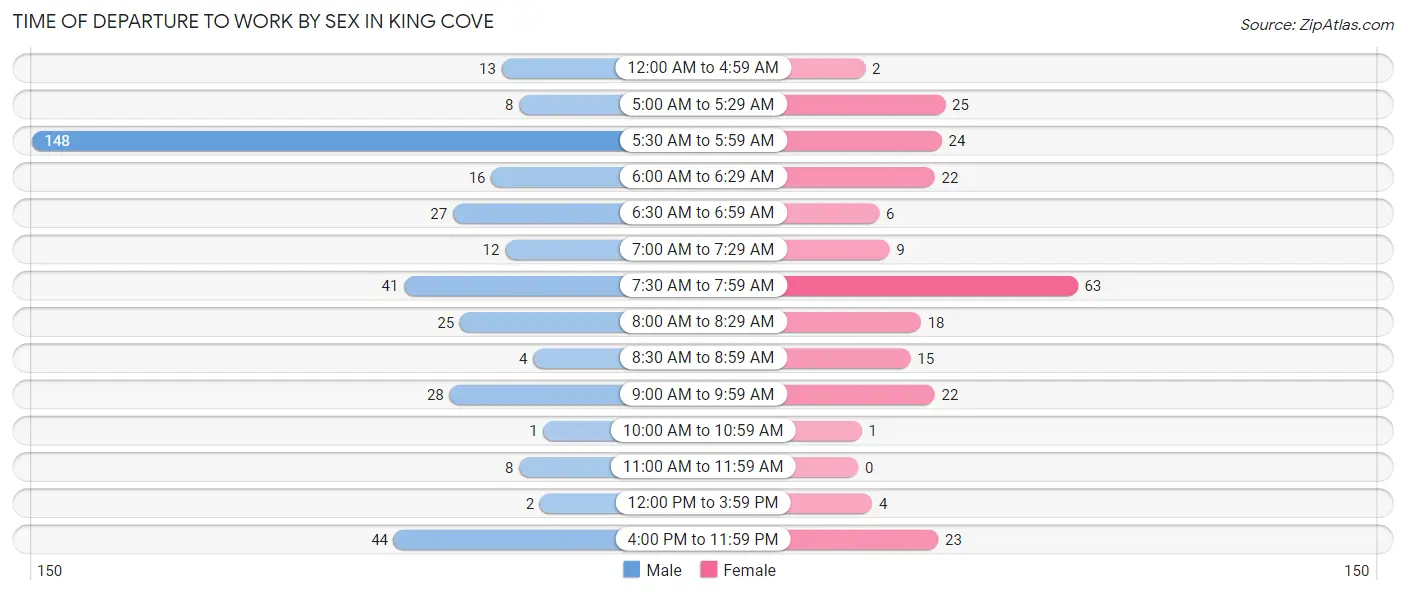
| Time of Departure | Male | Female |
| 12:00 AM to 4:59 AM | 13 (3.5%) | 2 (0.9%) |
| 5:00 AM to 5:29 AM | 8 (2.1%) | 25 (10.7%) |
| 5:30 AM to 5:59 AM | 148 (39.3%) | 24 (10.3%) |
| 6:00 AM to 6:29 AM | 16 (4.2%) | 22 (9.4%) |
| 6:30 AM to 6:59 AM | 27 (7.2%) | 6 (2.6%) |
| 7:00 AM to 7:29 AM | 12 (3.2%) | 9 (3.8%) |
| 7:30 AM to 7:59 AM | 41 (10.9%) | 63 (26.9%) |
| 8:00 AM to 8:29 AM | 25 (6.6%) | 18 (7.7%) |
| 8:30 AM to 8:59 AM | 4 (1.1%) | 15 (6.4%) |
| 9:00 AM to 9:59 AM | 28 (7.4%) | 22 (9.4%) |
| 10:00 AM to 10:59 AM | 1 (0.3%) | 1 (0.4%) |
| 11:00 AM to 11:59 AM | 8 (2.1%) | 0 (0.0%) |
| 12:00 PM to 3:59 PM | 2 (0.5%) | 4 (1.7%) |
| 4:00 PM to 11:59 PM | 44 (11.7%) | 23 (9.8%) |
| Total | 377 (100.0%) | 234 (100.0%) |
Housing Occupancy in King Cove
Occupancy by Ownership in King Cove
Of the total 358 dwellings in King Cove, owner-occupied units account for 187 (52.2%), while renter-occupied units make up 171 (47.8%).
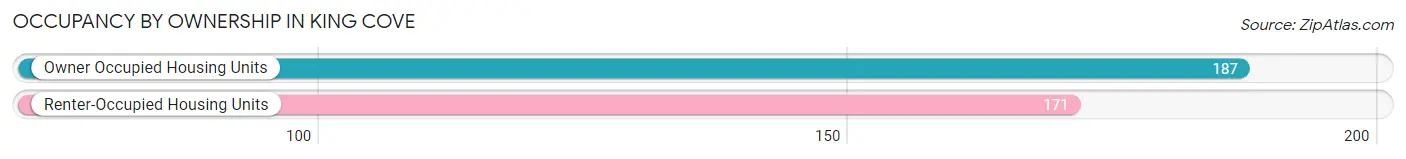
| Occupancy | # Housing Units | % Housing Units |
| Owner Occupied Housing Units | 187 | 52.2% |
| Renter-Occupied Housing Units | 171 | 47.8% |
| Total Occupied Housing Units | 358 | 100.0% |
Occupancy by Household Size in King Cove
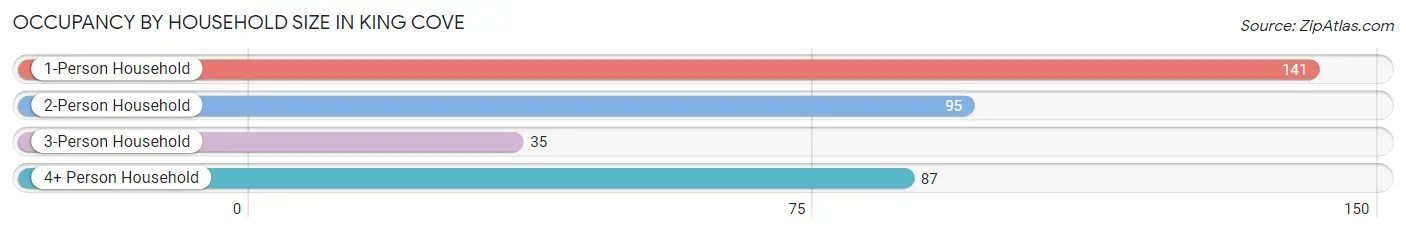
| Household Size | # Housing Units | % Housing Units |
| 1-Person Household | 141 | 39.4% |
| 2-Person Household | 95 | 26.5% |
| 3-Person Household | 35 | 9.8% |
| 4+ Person Household | 87 | 24.3% |
| Total Housing Units | 358 | 100.0% |
Occupancy by Ownership by Household Size in King Cove
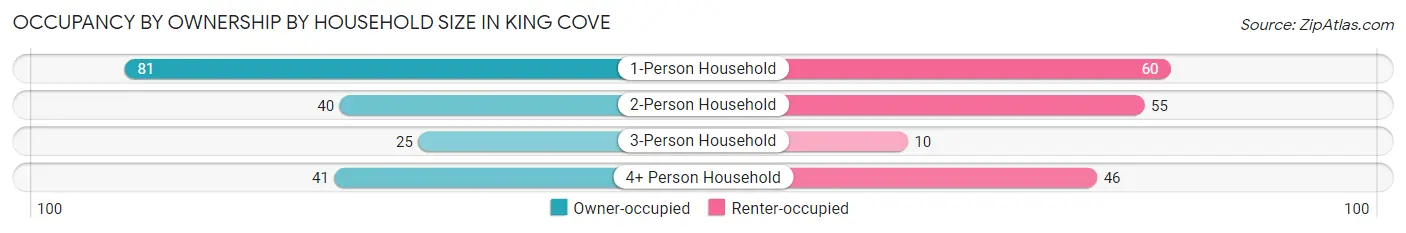
| Household Size | Owner-occupied | Renter-occupied |
| 1-Person Household | 81 (57.5%) | 60 (42.5%) |
| 2-Person Household | 40 (42.1%) | 55 (57.9%) |
| 3-Person Household | 25 (71.4%) | 10 (28.6%) |
| 4+ Person Household | 41 (47.1%) | 46 (52.9%) |
| Total Housing Units | 187 (52.2%) | 171 (47.8%) |
Occupancy by Educational Attainment in King Cove
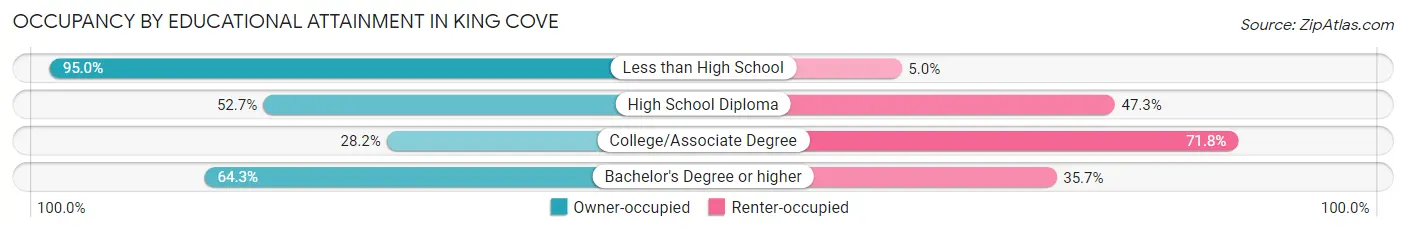
| Household Size | Owner-occupied | Renter-occupied |
| Less than High School | 57 (95.0%) | 3 (5.0%) |
| High School Diploma | 77 (52.7%) | 69 (47.3%) |
| College/Associate Degree | 35 (28.2%) | 89 (71.8%) |
| Bachelor's Degree or higher | 18 (64.3%) | 10 (35.7%) |
Occupancy by Age of Householder in King Cove
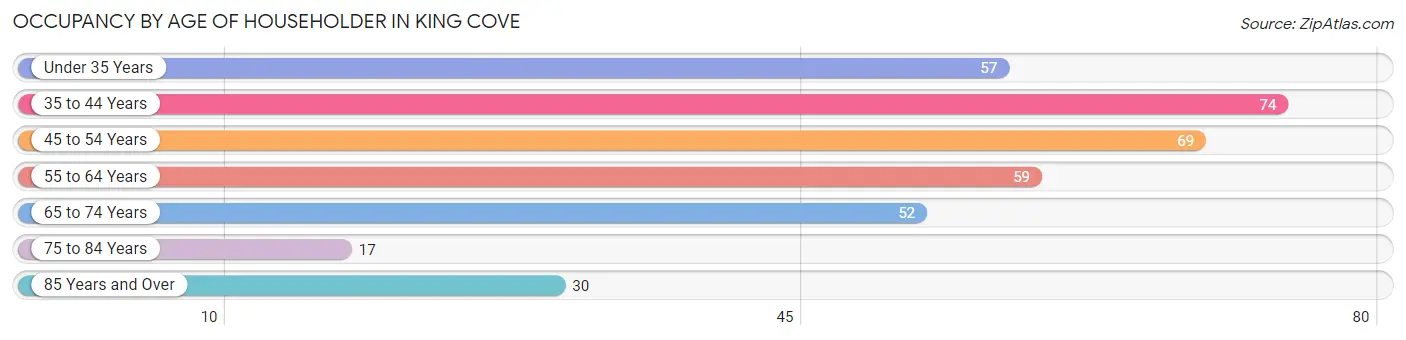
| Age Bracket | # Households | % Households |
| Under 35 Years | 57 | 15.9% |
| 35 to 44 Years | 74 | 20.7% |
| 45 to 54 Years | 69 | 19.3% |
| 55 to 64 Years | 59 | 16.5% |
| 65 to 74 Years | 52 | 14.5% |
| 75 to 84 Years | 17 | 4.8% |
| 85 Years and Over | 30 | 8.4% |
| Total | 358 | 100.0% |
Housing Finances in King Cove
Median Income by Occupancy in King Cove
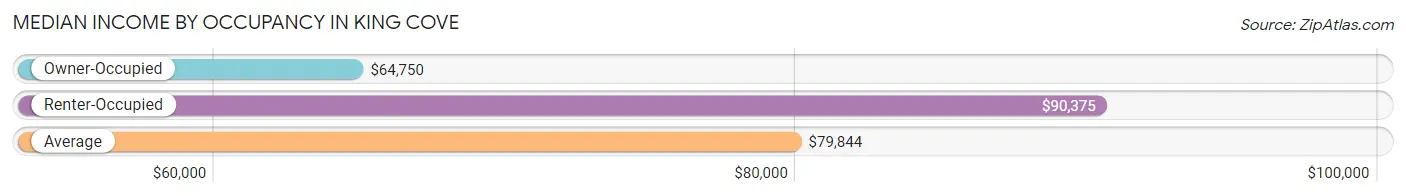
| Occupancy Type | # Households | Median Income |
| Owner-Occupied | 187 (52.2%) | $64,750 |
| Renter-Occupied | 171 (47.8%) | $90,375 |
| Average | 358 (100.0%) | $79,844 |
Occupancy by Householder Income Bracket in King Cove
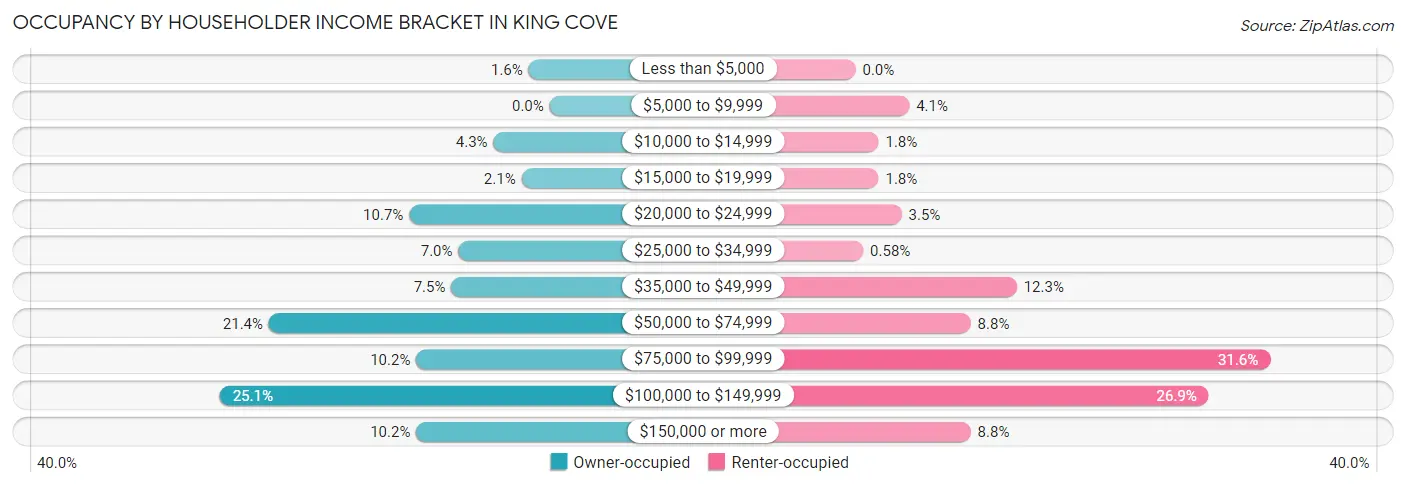
| Income Bracket | Owner-occupied | Renter-occupied |
| Less than $5,000 | 3 (1.6%) | 0 (0.0%) |
| $5,000 to $9,999 | 0 (0.0%) | 7 (4.1%) |
| $10,000 to $14,999 | 8 (4.3%) | 3 (1.8%) |
| $15,000 to $19,999 | 4 (2.1%) | 3 (1.8%) |
| $20,000 to $24,999 | 20 (10.7%) | 6 (3.5%) |
| $25,000 to $34,999 | 13 (7.0%) | 1 (0.6%) |
| $35,000 to $49,999 | 14 (7.5%) | 21 (12.3%) |
| $50,000 to $74,999 | 40 (21.4%) | 15 (8.8%) |
| $75,000 to $99,999 | 19 (10.2%) | 54 (31.6%) |
| $100,000 to $149,999 | 47 (25.1%) | 46 (26.9%) |
| $150,000 or more | 19 (10.2%) | 15 (8.8%) |
| Total | 187 (100.0%) | 171 (100.0%) |
Monthly Housing Cost Tiers in King Cove
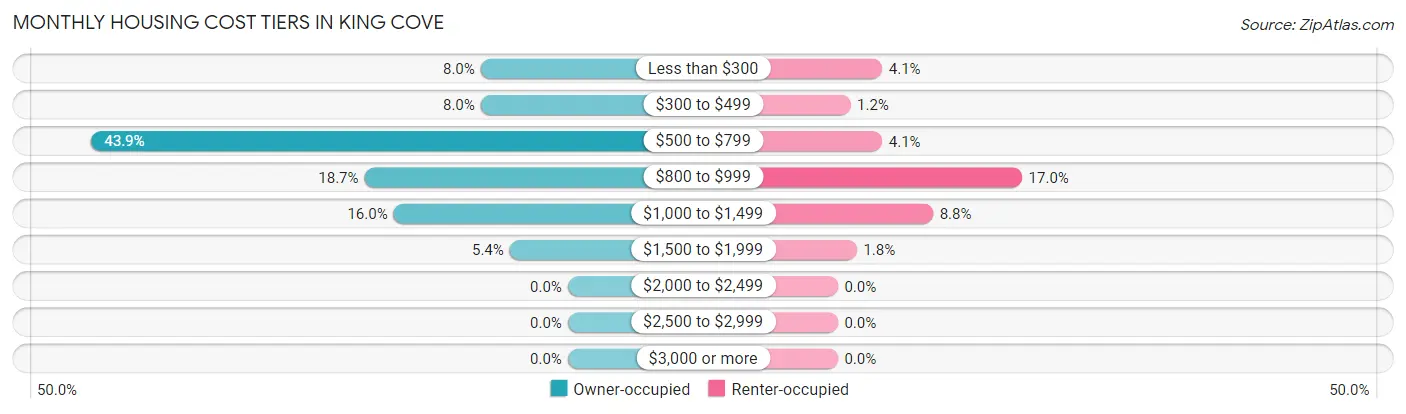
| Monthly Cost | Owner-occupied | Renter-occupied |
| Less than $300 | 15 (8.0%) | 7 (4.1%) |
| $300 to $499 | 15 (8.0%) | 2 (1.2%) |
| $500 to $799 | 82 (43.9%) | 7 (4.1%) |
| $800 to $999 | 35 (18.7%) | 29 (17.0%) |
| $1,000 to $1,499 | 30 (16.0%) | 15 (8.8%) |
| $1,500 to $1,999 | 10 (5.3%) | 3 (1.8%) |
| $2,000 to $2,499 | 0 (0.0%) | 0 (0.0%) |
| $2,500 to $2,999 | 0 (0.0%) | 0 (0.0%) |
| $3,000 or more | 0 (0.0%) | 0 (0.0%) |
| Total | 187 (100.0%) | 171 (100.0%) |
Physical Housing Characteristics in King Cove
Housing Structures in King Cove
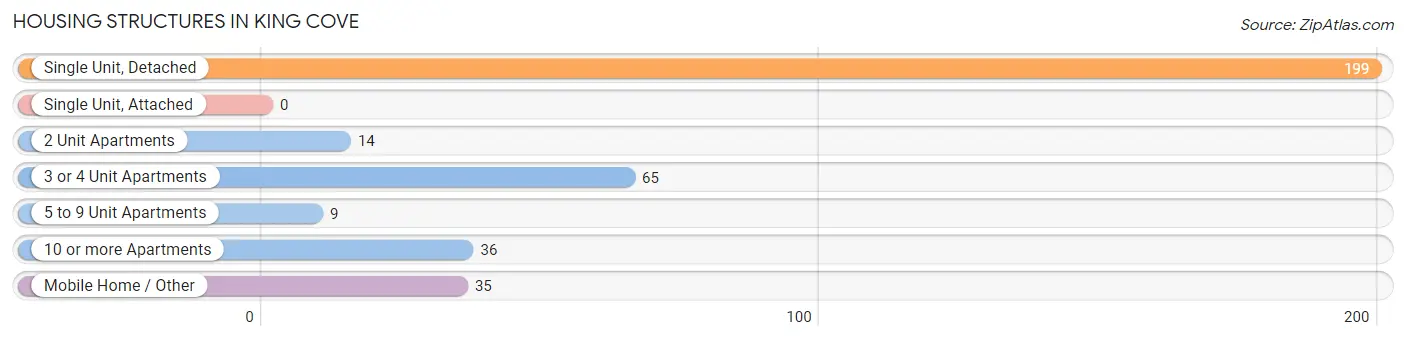
| Structure Type | # Housing Units | % Housing Units |
| Single Unit, Detached | 199 | 55.6% |
| Single Unit, Attached | 0 | 0.0% |
| 2 Unit Apartments | 14 | 3.9% |
| 3 or 4 Unit Apartments | 65 | 18.2% |
| 5 to 9 Unit Apartments | 9 | 2.5% |
| 10 or more Apartments | 36 | 10.1% |
| Mobile Home / Other | 35 | 9.8% |
| Total | 358 | 100.0% |
Housing Structures by Occupancy in King Cove
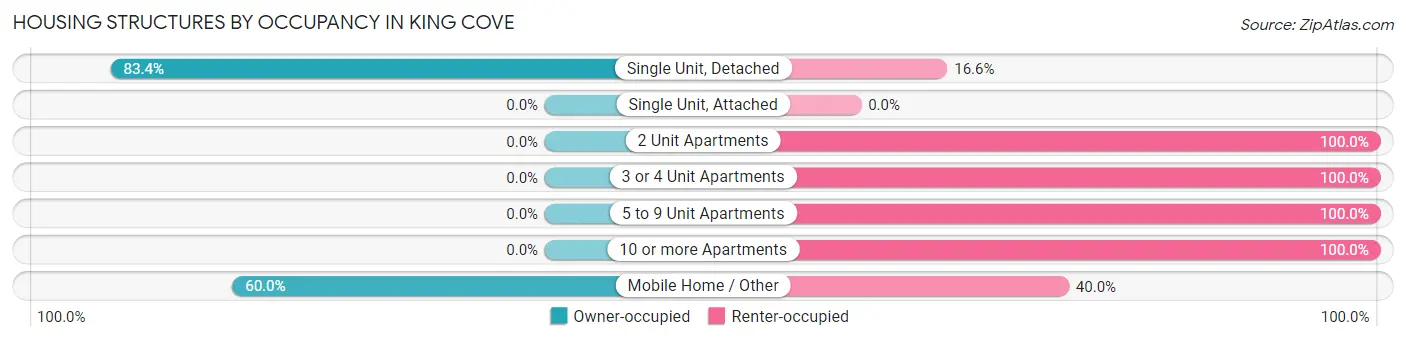
| Structure Type | Owner-occupied | Renter-occupied |
| Single Unit, Detached | 166 (83.4%) | 33 (16.6%) |
| Single Unit, Attached | 0 (0.0%) | 0 (0.0%) |
| 2 Unit Apartments | 0 (0.0%) | 14 (100.0%) |
| 3 or 4 Unit Apartments | 0 (0.0%) | 65 (100.0%) |
| 5 to 9 Unit Apartments | 0 (0.0%) | 9 (100.0%) |
| 10 or more Apartments | 0 (0.0%) | 36 (100.0%) |
| Mobile Home / Other | 21 (60.0%) | 14 (40.0%) |
| Total | 187 (52.2%) | 171 (47.8%) |
Housing Structures by Number of Rooms in King Cove
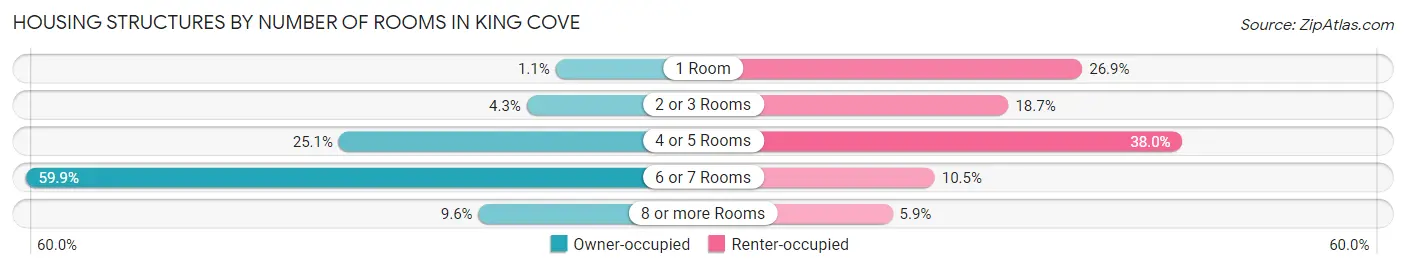
| Number of Rooms | Owner-occupied | Renter-occupied |
| 1 Room | 2 (1.1%) | 46 (26.9%) |
| 2 or 3 Rooms | 8 (4.3%) | 32 (18.7%) |
| 4 or 5 Rooms | 47 (25.1%) | 65 (38.0%) |
| 6 or 7 Rooms | 112 (59.9%) | 18 (10.5%) |
| 8 or more Rooms | 18 (9.6%) | 10 (5.9%) |
| Total | 187 (100.0%) | 171 (100.0%) |
Housing Structure by Heating Type in King Cove
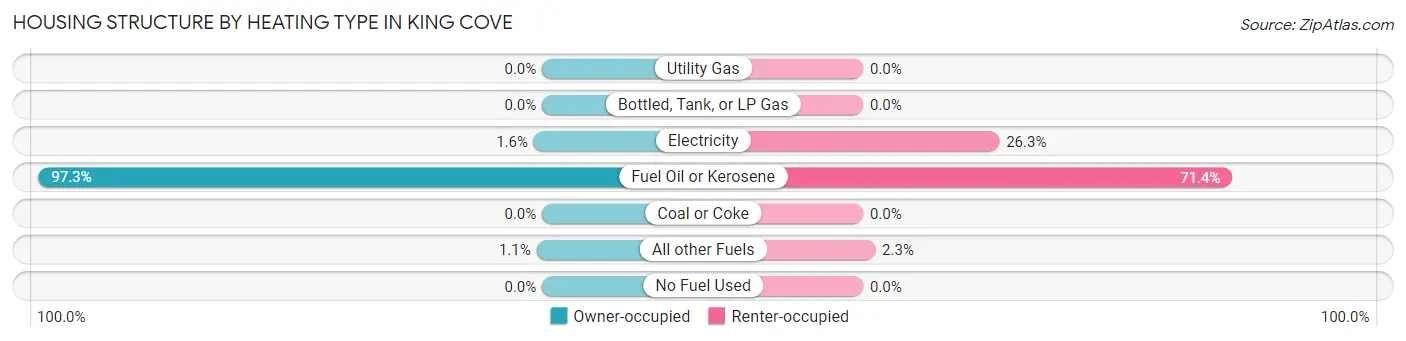
| Heating Type | Owner-occupied | Renter-occupied |
| Utility Gas | 0 (0.0%) | 0 (0.0%) |
| Bottled, Tank, or LP Gas | 0 (0.0%) | 0 (0.0%) |
| Electricity | 3 (1.6%) | 45 (26.3%) |
| Fuel Oil or Kerosene | 182 (97.3%) | 122 (71.4%) |
| Coal or Coke | 0 (0.0%) | 0 (0.0%) |
| All other Fuels | 2 (1.1%) | 4 (2.3%) |
| No Fuel Used | 0 (0.0%) | 0 (0.0%) |
| Total | 187 (100.0%) | 171 (100.0%) |
Household Vehicle Usage in King Cove
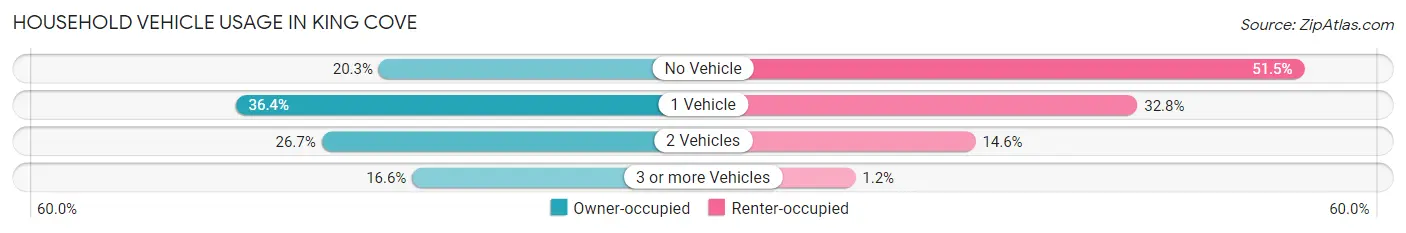
| Vehicles per Household | Owner-occupied | Renter-occupied |
| No Vehicle | 38 (20.3%) | 88 (51.5%) |
| 1 Vehicle | 68 (36.4%) | 56 (32.8%) |
| 2 Vehicles | 50 (26.7%) | 25 (14.6%) |
| 3 or more Vehicles | 31 (16.6%) | 2 (1.2%) |
| Total | 187 (100.0%) | 171 (100.0%) |
Real Estate & Mortgages in King Cove
Real Estate and Mortgage Overview in King Cove
| Characteristic | Without Mortgage | With Mortgage |
| Housing Units | 145 | 42 |
| Median Property Value | $118,500 | $117,300 |
| Median Household Income | $60,417 | $3 |
| Monthly Housing Costs | $698 | $0 |
| Real Estate Taxes | - | - |
Property Value by Mortgage Status in King Cove
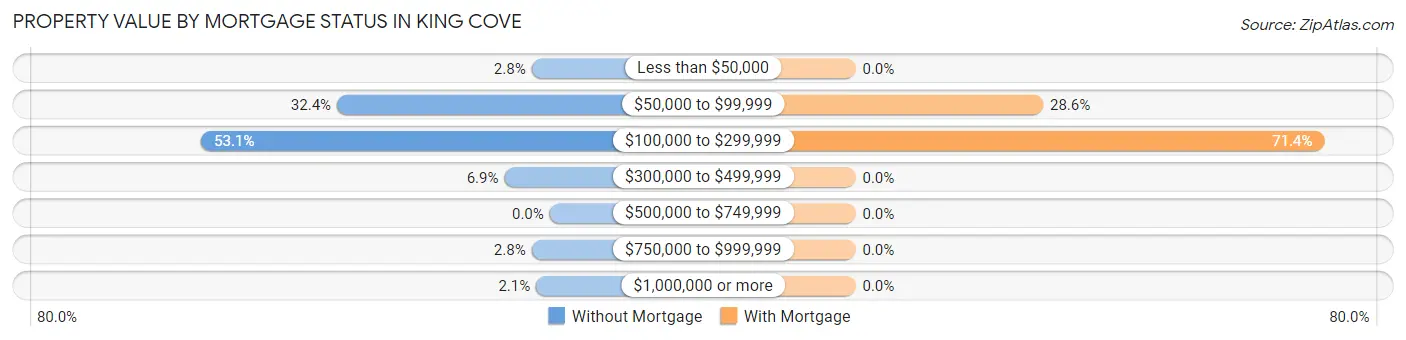
| Property Value | Without Mortgage | With Mortgage |
| Less than $50,000 | 4 (2.8%) | 0 (0.0%) |
| $50,000 to $99,999 | 47 (32.4%) | 12 (28.6%) |
| $100,000 to $299,999 | 77 (53.1%) | 30 (71.4%) |
| $300,000 to $499,999 | 10 (6.9%) | 0 (0.0%) |
| $500,000 to $749,999 | 0 (0.0%) | 0 (0.0%) |
| $750,000 to $999,999 | 4 (2.8%) | 0 (0.0%) |
| $1,000,000 or more | 3 (2.1%) | 0 (0.0%) |
| Total | 145 (100.0%) | 42 (100.0%) |
Household Income by Mortgage Status in King Cove
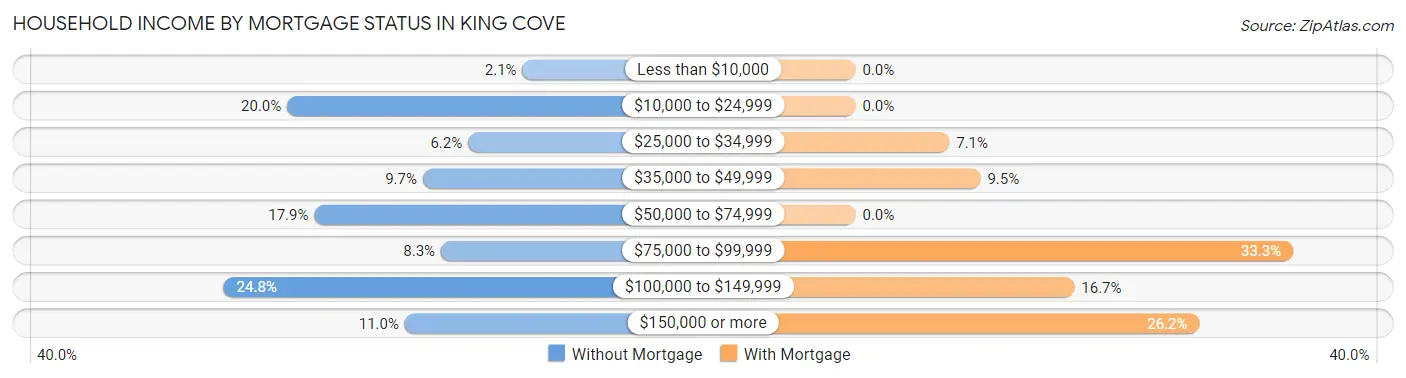
| Household Income | Without Mortgage | With Mortgage |
| Less than $10,000 | 3 (2.1%) | 0 (0.0%) |
| $10,000 to $24,999 | 29 (20.0%) | 0 (0.0%) |
| $25,000 to $34,999 | 9 (6.2%) | 3 (7.1%) |
| $35,000 to $49,999 | 14 (9.7%) | 4 (9.5%) |
| $50,000 to $74,999 | 26 (17.9%) | 0 (0.0%) |
| $75,000 to $99,999 | 12 (8.3%) | 14 (33.3%) |
| $100,000 to $149,999 | 36 (24.8%) | 7 (16.7%) |
| $150,000 or more | 16 (11.0%) | 11 (26.2%) |
| Total | 145 (100.0%) | 42 (100.0%) |
Property Value to Household Income Ratio in King Cove
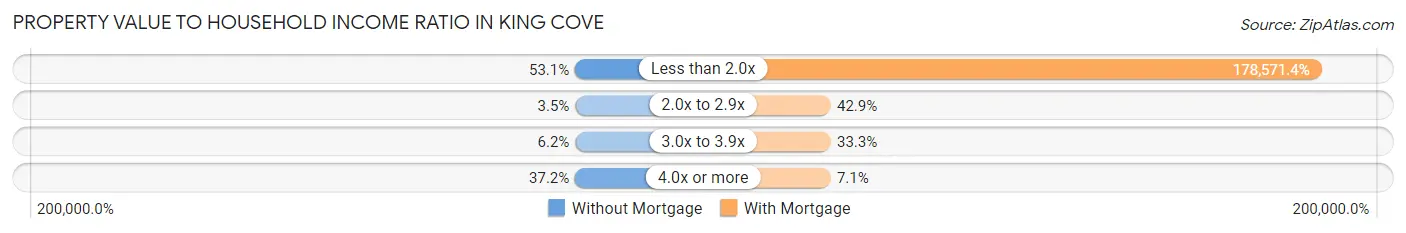
| Value-to-Income Ratio | Without Mortgage | With Mortgage |
| Less than 2.0x | 77 (53.1%) | 75,000 (178,571.4%) |
| 2.0x to 2.9x | 5 (3.5%) | 18 (42.9%) |
| 3.0x to 3.9x | 9 (6.2%) | 14 (33.3%) |
| 4.0x or more | 54 (37.2%) | 3 (7.1%) |
| Total | 145 (100.0%) | 42 (100.0%) |
Real Estate Taxes by Mortgage Status in King Cove
| Property Taxes | Without Mortgage | With Mortgage |
| Less than $800 | 0 (0.0%) | 0 (0.0%) |
| $800 to $1,499 | 0 (0.0%) | 0 (0.0%) |
| $800 to $1,499 | 0 (0.0%) | 0 (0.0%) |
| Total | 145 (100.0%) | 42 (100.0%) |
Health & Disability in King Cove
Health Insurance Coverage by Age in King Cove
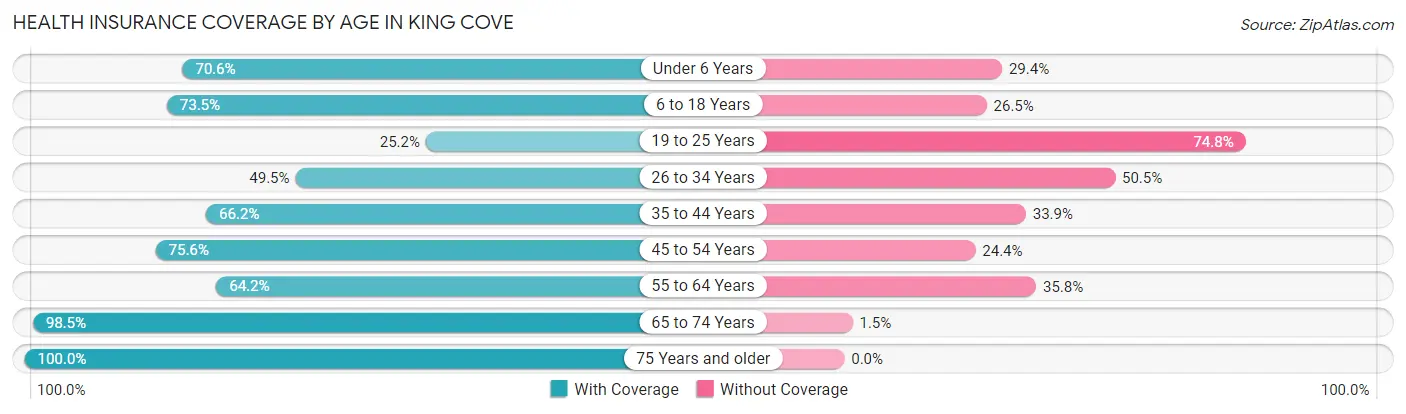
| Age Bracket | With Coverage | Without Coverage |
| Under 6 Years | 36 (70.6%) | 15 (29.4%) |
| 6 to 18 Years | 119 (73.5%) | 43 (26.5%) |
| 19 to 25 Years | 34 (25.2%) | 101 (74.8%) |
| 26 to 34 Years | 51 (49.5%) | 52 (50.5%) |
| 35 to 44 Years | 129 (66.1%) | 66 (33.9%) |
| 45 to 54 Years | 136 (75.6%) | 44 (24.4%) |
| 55 to 64 Years | 97 (64.2%) | 54 (35.8%) |
| 65 to 74 Years | 64 (98.5%) | 1 (1.5%) |
| 75 Years and older | 66 (100.0%) | 0 (0.0%) |
| Total | 732 (66.1%) | 376 (33.9%) |
Health Insurance Coverage by Citizenship Status in King Cove
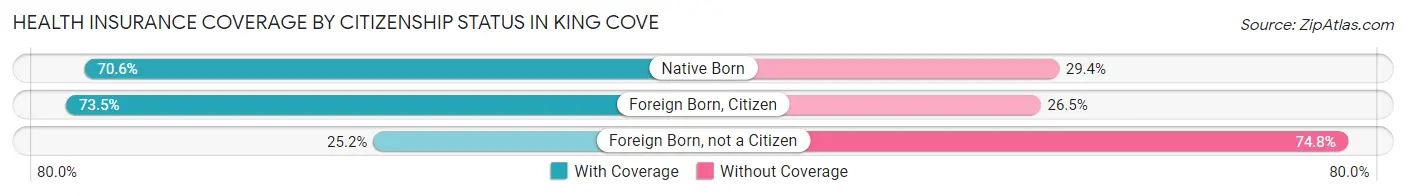
| Citizenship Status | With Coverage | Without Coverage |
| Native Born | 36 (70.6%) | 15 (29.4%) |
| Foreign Born, Citizen | 119 (73.5%) | 43 (26.5%) |
| Foreign Born, not a Citizen | 34 (25.2%) | 101 (74.8%) |
Health Insurance Coverage by Household Income in King Cove
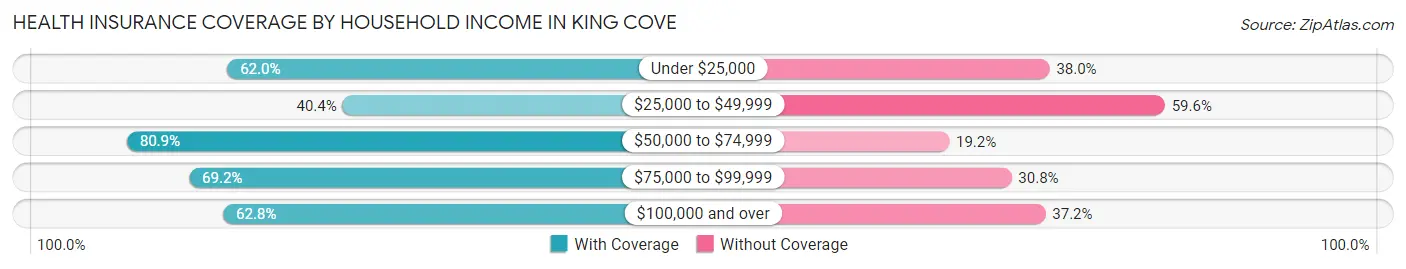
| Household Income | With Coverage | Without Coverage |
| Under $25,000 | 49 (62.0%) | 30 (38.0%) |
| $25,000 to $49,999 | 57 (40.4%) | 84 (59.6%) |
| $50,000 to $74,999 | 114 (80.8%) | 27 (19.2%) |
| $75,000 to $99,999 | 148 (69.2%) | 66 (30.8%) |
| $100,000 and over | 184 (62.8%) | 109 (37.2%) |
Public vs Private Health Insurance Coverage by Age in King Cove
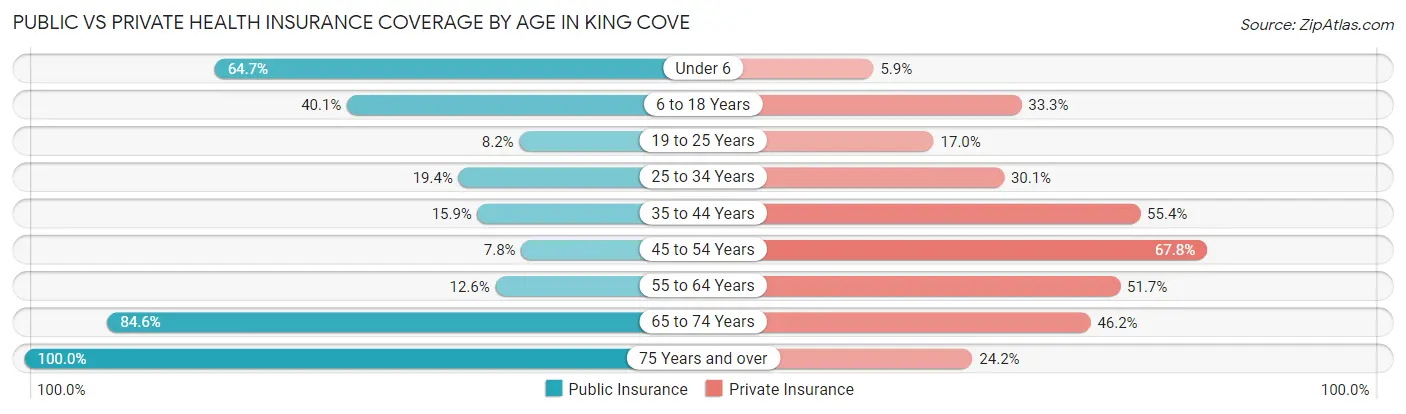
| Age Bracket | Public Insurance | Private Insurance |
| Under 6 | 33 (64.7%) | 3 (5.9%) |
| 6 to 18 Years | 65 (40.1%) | 54 (33.3%) |
| 19 to 25 Years | 11 (8.2%) | 23 (17.0%) |
| 25 to 34 Years | 20 (19.4%) | 31 (30.1%) |
| 35 to 44 Years | 31 (15.9%) | 108 (55.4%) |
| 45 to 54 Years | 14 (7.8%) | 122 (67.8%) |
| 55 to 64 Years | 19 (12.6%) | 78 (51.7%) |
| 65 to 74 Years | 55 (84.6%) | 30 (46.2%) |
| 75 Years and over | 66 (100.0%) | 16 (24.2%) |
| Total | 314 (28.3%) | 465 (42.0%) |
Disability Status by Sex by Age in King Cove
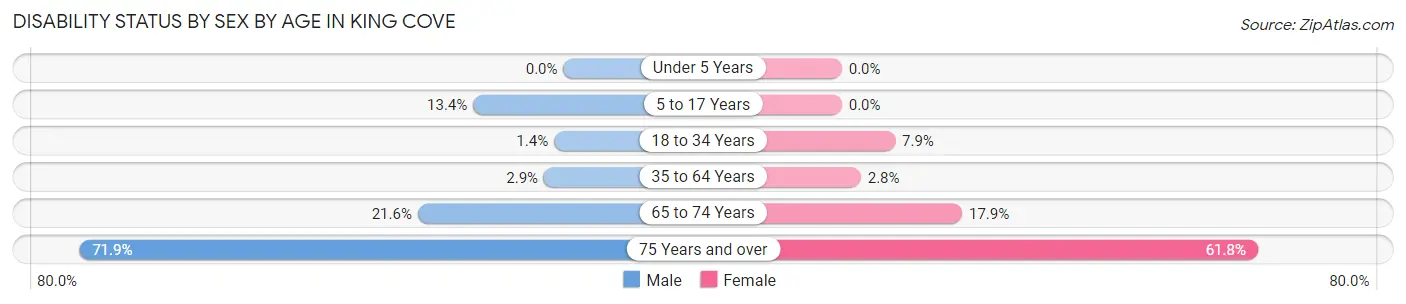
| Age Bracket | Male | Female |
| Under 5 Years | 0 (0.0%) | 0 (0.0%) |
| 5 to 17 Years | 13 (13.4%) | 0 (0.0%) |
| 18 to 34 Years | 2 (1.4%) | 8 (7.9%) |
| 35 to 64 Years | 9 (2.9%) | 6 (2.8%) |
| 65 to 74 Years | 8 (21.6%) | 5 (17.9%) |
| 75 Years and over | 23 (71.9%) | 21 (61.8%) |
Disability Class by Sex by Age in King Cove
Disability Class: Hearing Difficulty
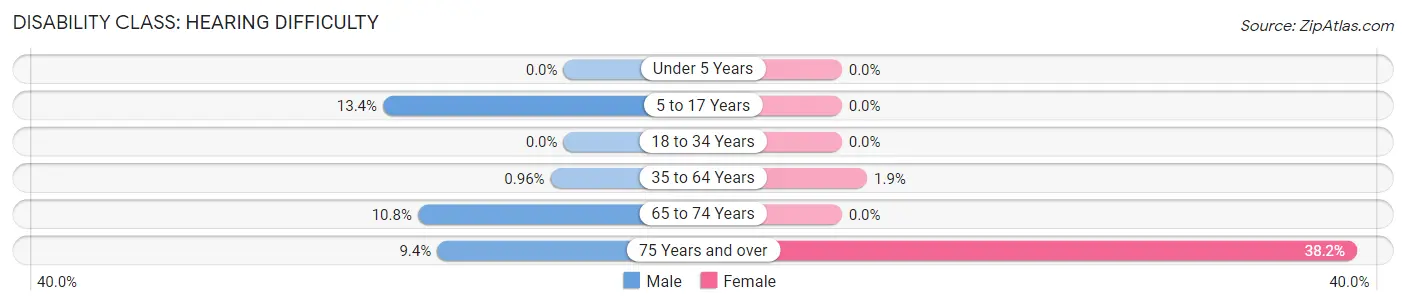
| Age Bracket | Male | Female |
| Under 5 Years | 0 (0.0%) | 0 (0.0%) |
| 5 to 17 Years | 13 (13.4%) | 0 (0.0%) |
| 18 to 34 Years | 0 (0.0%) | 0 (0.0%) |
| 35 to 64 Years | 3 (1.0%) | 4 (1.9%) |
| 65 to 74 Years | 4 (10.8%) | 0 (0.0%) |
| 75 Years and over | 3 (9.4%) | 13 (38.2%) |
Disability Class: Vision Difficulty
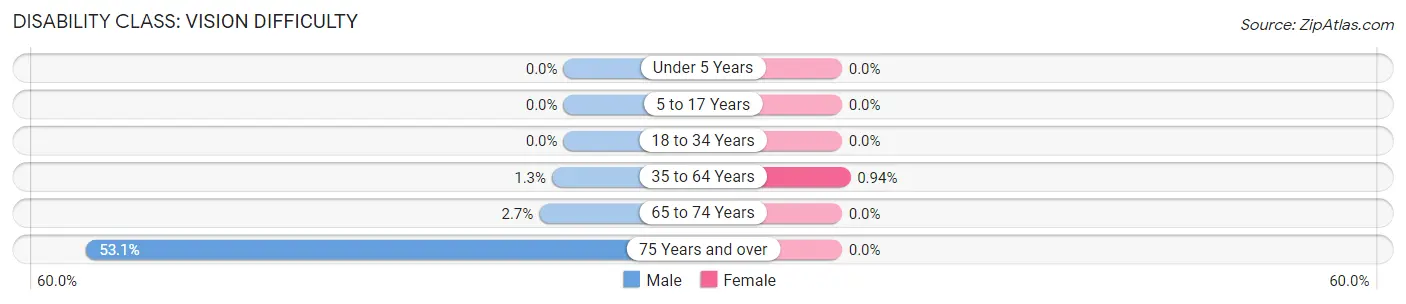
| Age Bracket | Male | Female |
| Under 5 Years | 0 (0.0%) | 0 (0.0%) |
| 5 to 17 Years | 0 (0.0%) | 0 (0.0%) |
| 18 to 34 Years | 0 (0.0%) | 0 (0.0%) |
| 35 to 64 Years | 4 (1.3%) | 2 (0.9%) |
| 65 to 74 Years | 1 (2.7%) | 0 (0.0%) |
| 75 Years and over | 17 (53.1%) | 0 (0.0%) |
Disability Class: Cognitive Difficulty
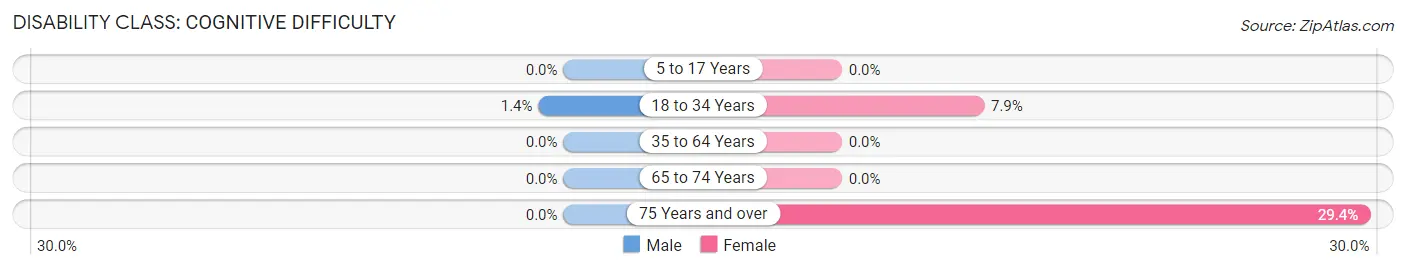
| Age Bracket | Male | Female |
| 5 to 17 Years | 0 (0.0%) | 0 (0.0%) |
| 18 to 34 Years | 2 (1.4%) | 8 (7.9%) |
| 35 to 64 Years | 0 (0.0%) | 0 (0.0%) |
| 65 to 74 Years | 0 (0.0%) | 0 (0.0%) |
| 75 Years and over | 0 (0.0%) | 10 (29.4%) |
Disability Class: Ambulatory Difficulty
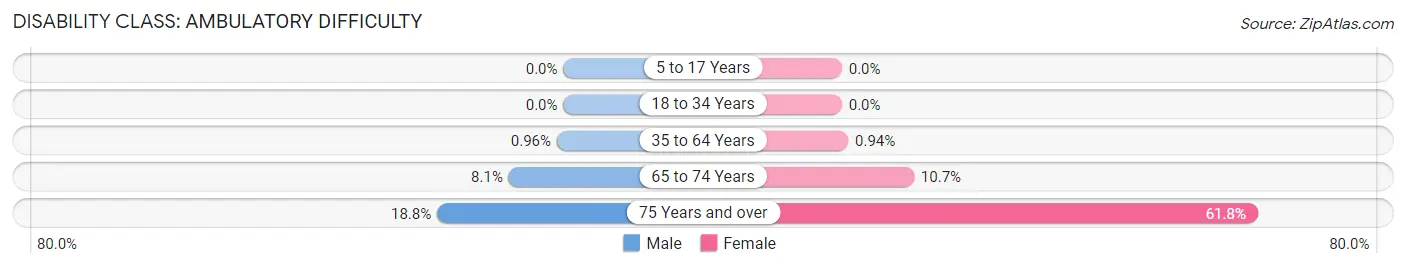
| Age Bracket | Male | Female |
| 5 to 17 Years | 0 (0.0%) | 0 (0.0%) |
| 18 to 34 Years | 0 (0.0%) | 0 (0.0%) |
| 35 to 64 Years | 3 (1.0%) | 2 (0.9%) |
| 65 to 74 Years | 3 (8.1%) | 3 (10.7%) |
| 75 Years and over | 6 (18.8%) | 21 (61.8%) |
Disability Class: Self-Care Difficulty
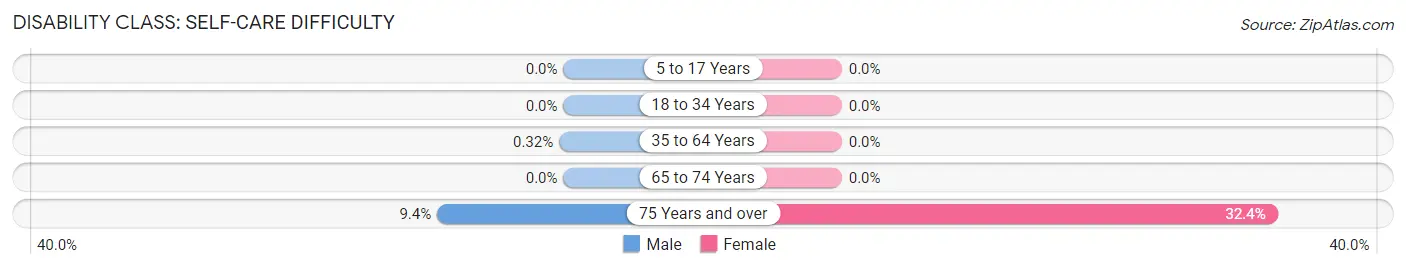
| Age Bracket | Male | Female |
| 5 to 17 Years | 0 (0.0%) | 0 (0.0%) |
| 18 to 34 Years | 0 (0.0%) | 0 (0.0%) |
| 35 to 64 Years | 1 (0.3%) | 0 (0.0%) |
| 65 to 74 Years | 0 (0.0%) | 0 (0.0%) |
| 75 Years and over | 3 (9.4%) | 11 (32.4%) |
Technology Access in King Cove
Computing Device Access in King Cove
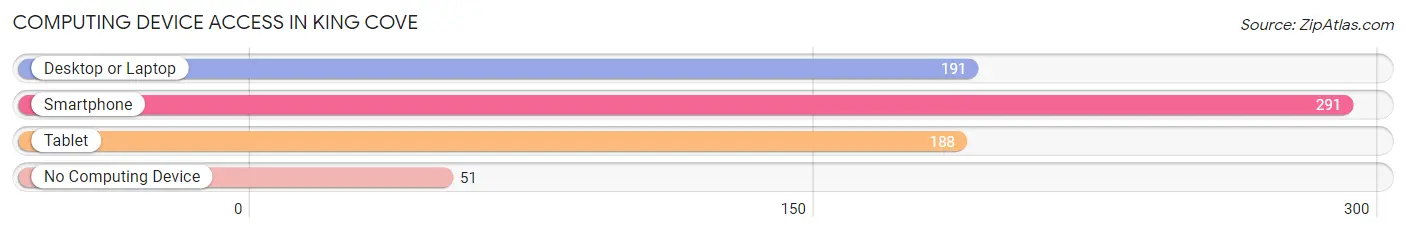
| Device Type | # Households | % Households |
| Desktop or Laptop | 191 | 53.3% |
| Smartphone | 291 | 81.3% |
| Tablet | 188 | 52.5% |
| No Computing Device | 51 | 14.2% |
| Total | 358 | 100.0% |
Internet Access in King Cove
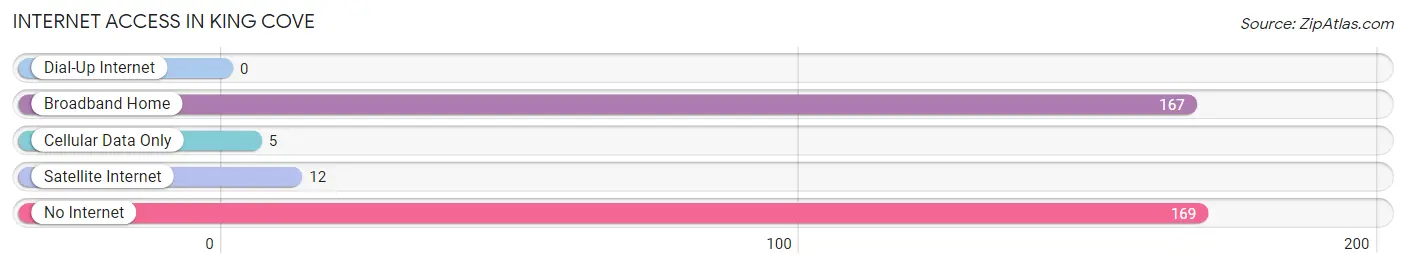
| Internet Type | # Households | % Households |
| Dial-Up Internet | 0 | 0.0% |
| Broadband Home | 167 | 46.7% |
| Cellular Data Only | 5 | 1.4% |
| Satellite Internet | 12 | 3.4% |
| No Internet | 169 | 47.2% |
| Total | 358 | 100.0% |
King Cove Summary
History
King Cove is a small city located on the Alaska Peninsula in the Aleutians East Borough of Alaska. It is located on the eastern side of the Alaska Peninsula, about 600 miles southwest of Anchorage. The city was originally inhabited by the Unangan people, also known as the Aleut, who have lived in the area for thousands of years. The first recorded contact with Europeans was in 1786, when the Russian explorer Gerasim Izmailov visited the area.
In the late 1800s, the area was settled by fur traders and fishermen from the United States and Russia. The city was officially incorporated in 1941, and the population has grown steadily since then. The city is now home to about 900 people, most of whom are of Aleut descent.
Geography
King Cove is located on the eastern side of the Alaska Peninsula, about 600 miles southwest of Anchorage. The city is situated on the shores of Cold Bay, a large bay that is part of the Bering Sea. The city is surrounded by mountains and is located in a temperate rainforest climate, with mild temperatures and high precipitation.
The city is accessible by air and sea, and is served by the King Cove Airport and the King Cove Seaplane Base. The city is also connected to Cold Bay by a road, which is the only land connection to the rest of Alaska.
Economy
The economy of King Cove is largely based on fishing and subsistence activities. The city is home to several commercial fishing operations, and the local economy is also supported by tourism, government services, and retail businesses.
The city is also home to a cannery, which processes and cans seafood for export. The cannery is the largest employer in the city, and provides jobs for many of the local residents.
Demographics
As of the 2010 census, the population of King Cove was 876. The population is predominantly of Aleut descent, and the city is home to a large number of Native American residents. The median age of the population is 37.7 years, and the median household income is $50,000.
The city is served by the King Cove School District, which includes a K-12 school and a vocational school. The city is also home to a health clinic, which provides medical services to the local population.
Conclusion
King Cove is a small city located on the Alaska Peninsula in the Aleutians East Borough of Alaska. It is home to about 900 people, most of whom are of Aleut descent. The city is largely supported by fishing and subsistence activities, and is also home to a cannery and several other businesses. The city is served by the King Cove School District, and is home to a health clinic. The population is predominantly of Aleut descent, and the median age of the population is 37.7 years.
Common Questions
What is Per Capita Income in King Cove?
Per Capita income in King Cove is $40,796.
What is the Median Family Income in King Cove?
Median Family Income in King Cove is $73,250.
What is the Median Household income in King Cove?
Median Household Income in King Cove is $79,844.
What is Income or Wage Gap in King Cove?
Income or Wage Gap in King Cove is 38.9%.
Women in King Cove earn 61.1 cents for every dollar earned by a man.
What is Inequality or Gini Index in King Cove?
Inequality or Gini Index in King Cove is 0.33.
What is the Total Population of King Cove?
Total Population of King Cove is 1,108.
What is the Total Male Population of King Cove?
Total Male Population of King Cove is 651.
What is the Total Female Population of King Cove?
Total Female Population of King Cove is 457.
What is the Ratio of Males per 100 Females in King Cove?
There are 142.45 Males per 100 Females in King Cove.
What is the Ratio of Females per 100 Males in King Cove?
There are 70.20 Females per 100 Males in King Cove.
What is the Median Population Age in King Cove?
Median Population Age in King Cove is 38.2 Years.
What is the Average Family Size in King Cove
Average Family Size in King Cove is 3.3 People.
What is the Average Household Size in King Cove
Average Household Size in King Cove is 2.4 People.
How Large is the Labor Force in King Cove?
There are 711 People in the Labor Forcein in King Cove.
What is the Percentage of People in the Labor Force in King Cove?
76.3% of People are in the Labor Force in King Cove.
What is the Unemployment Rate in King Cove?
Unemployment Rate in King Cove is 6.9%.