Garrett, WA Map & Demographics
Garrett Map
Garrett Overview
$40,427
PER CAPITA INCOME
$109,303
AVG FAMILY INCOME
$108,094
AVG HOUSEHOLD INCOME
31.1%
WAGE / INCOME GAP [ % ]
68.9¢/ $1
WAGE / INCOME GAP [ $ ]
0.34
INEQUALITY / GINI INDEX
1,873
TOTAL POPULATION
904
MALE POPULATION
969
FEMALE POPULATION
93.29
MALES / 100 FEMALES
107.19
FEMALES / 100 MALES
57.1
MEDIAN AGE
2.8
AVG FAMILY SIZE
2.6
AVG HOUSEHOLD SIZE
887
LABOR FORCE [ PEOPLE ]
53.9%
PERCENT IN LABOR FORCE
7.3%
UNEMPLOYMENT RATE
Income in Garrett
Income Overview in Garrett
Per Capita Income in Garrett is $40,427, while median incomes of families and households are $109,303 and $108,094 respectively.
| Characteristic | Number | Measure |
| Per Capita Income | 1,873 | $40,427 |
| Median Family Income | 608 | $109,303 |
| Mean Family Income | 608 | $109,611 |
| Median Household Income | 729 | $108,094 |
| Mean Household Income | 729 | $103,436 |
| Income Deficit | 608 | $0 |
| Wage / Income Gap (%) | 1,873 | 31.14% |
| Wage / Income Gap ($) | 1,873 | 68.86¢ per $1 |
| Gini / Inequality Index | 1,873 | 0.34 |
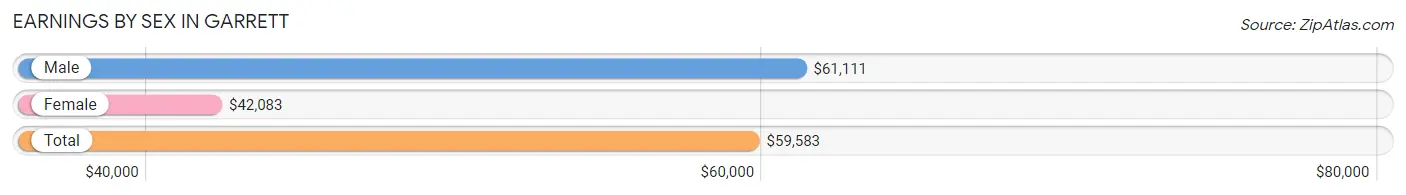
Earnings by Sex in Garrett
Average Earnings in Garrett are $59,583, $61,111 for men and $42,083 for women, a difference of 31.1%.
| Sex | Number | Average Earnings |
| Male | 488 (51.4%) | $61,111 |
| Female | 461 (48.6%) | $42,083 |
| Total | 949 (100.0%) | $59,583 |
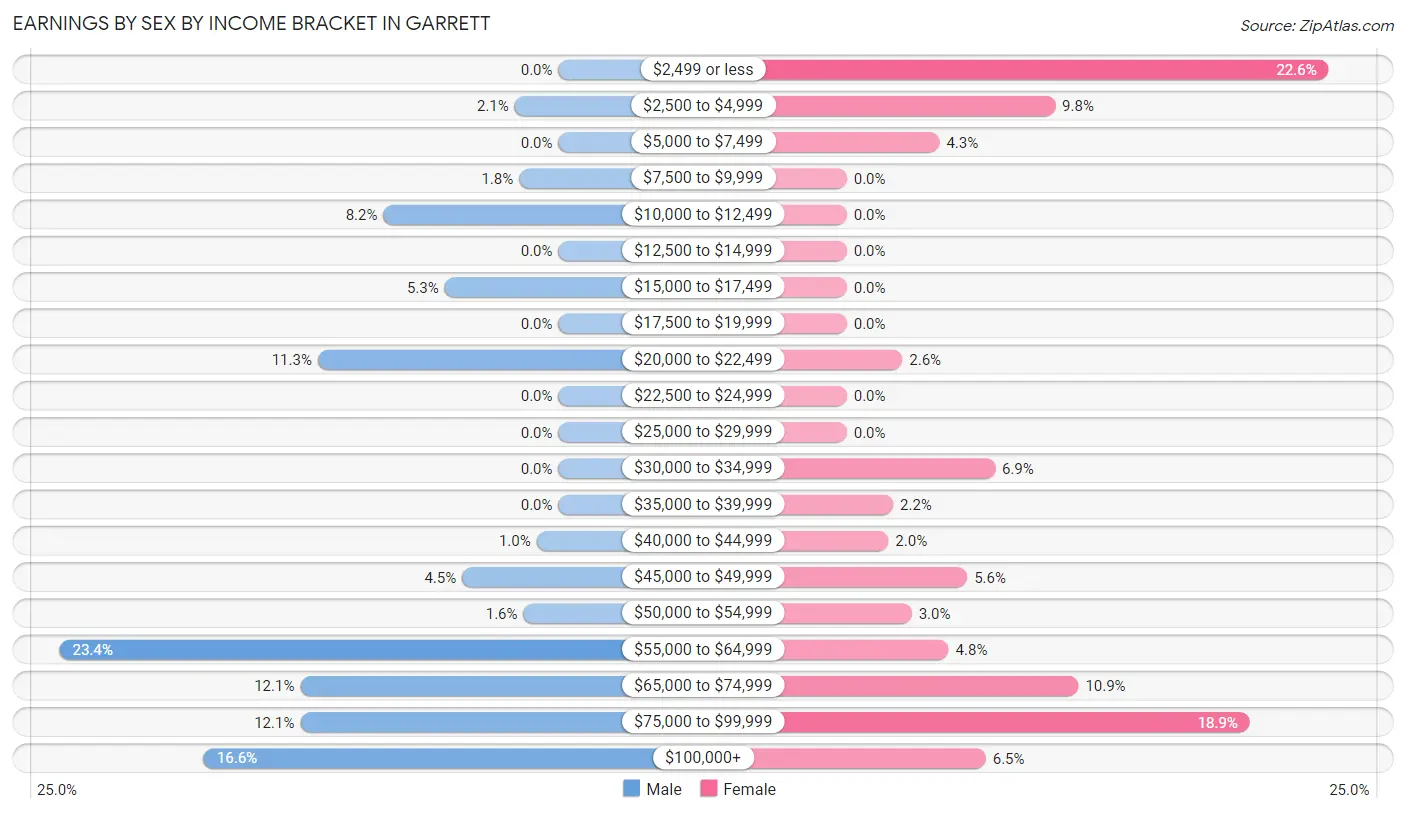
Earnings by Sex by Income Bracket in Garrett
The most common earnings brackets in Garrett are $55,000 to $64,999 for men (114 | 23.4%) and $2,499 or less for women (104 | 22.6%).
| Income | Male | Female |
| $2,499 or less | 0 (0.0%) | 104 (22.6%) |
| $2,500 to $4,999 | 10 (2.1%) | 45 (9.8%) |
| $5,000 to $7,499 | 0 (0.0%) | 20 (4.3%) |
| $7,500 to $9,999 | 9 (1.8%) | 0 (0.0%) |
| $10,000 to $12,499 | 40 (8.2%) | 0 (0.0%) |
| $12,500 to $14,999 | 0 (0.0%) | 0 (0.0%) |
| $15,000 to $17,499 | 26 (5.3%) | 0 (0.0%) |
| $17,500 to $19,999 | 0 (0.0%) | 0 (0.0%) |
| $20,000 to $22,499 | 55 (11.3%) | 12 (2.6%) |
| $22,500 to $24,999 | 0 (0.0%) | 0 (0.0%) |
| $25,000 to $29,999 | 0 (0.0%) | 0 (0.0%) |
| $30,000 to $34,999 | 0 (0.0%) | 32 (6.9%) |
| $35,000 to $39,999 | 0 (0.0%) | 10 (2.2%) |
| $40,000 to $44,999 | 5 (1.0%) | 9 (1.9%) |
| $45,000 to $49,999 | 22 (4.5%) | 26 (5.6%) |
| $50,000 to $54,999 | 8 (1.6%) | 14 (3.0%) |
| $55,000 to $64,999 | 114 (23.4%) | 22 (4.8%) |
| $65,000 to $74,999 | 59 (12.1%) | 50 (10.8%) |
| $75,000 to $99,999 | 59 (12.1%) | 87 (18.9%) |
| $100,000+ | 81 (16.6%) | 30 (6.5%) |
| Total | 488 (100.0%) | 461 (100.0%) |
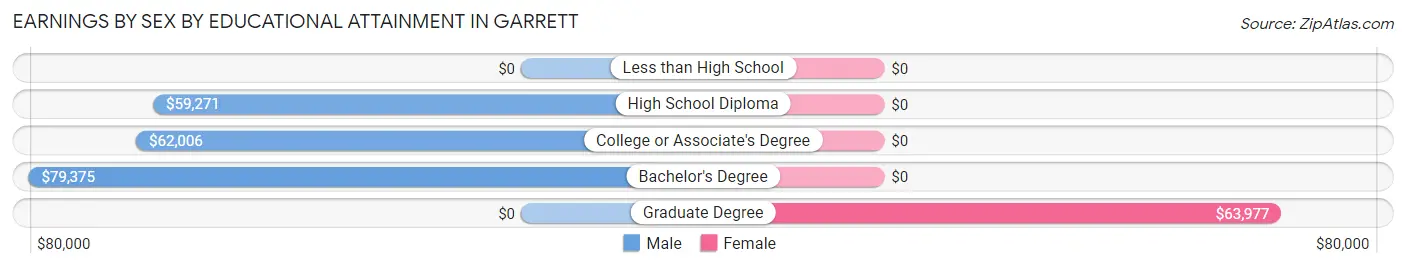
Earnings by Sex by Educational Attainment in Garrett
Average earnings in Garrett are $62,191 for men and $42,083 for women, a difference of 32.3%. Men with an educational attainment of bachelor's degree enjoy the highest average annual earnings of $79,375, while those with high school diploma education earn the least with $59,271. Women with an educational attainment of graduate degree earn the most with the average annual earnings of $63,977, while those with graduate degree education have the smallest earnings of $63,977.
| Educational Attainment | Male Income | Female Income |
| Less than High School | - | - |
| High School Diploma | $59,271 | $0 |
| College or Associate's Degree | $62,006 | $0 |
| Bachelor's Degree | $79,375 | $0 |
| Graduate Degree | - | - |
| Total | $62,191 | $42,083 |
Family Income in Garrett
Family Income Brackets in Garrett
According to the Garrett family income data, there are 244 families falling into the $100,000 to $149,999 income range, which is the most common income bracket and makes up 40.1% of all families.
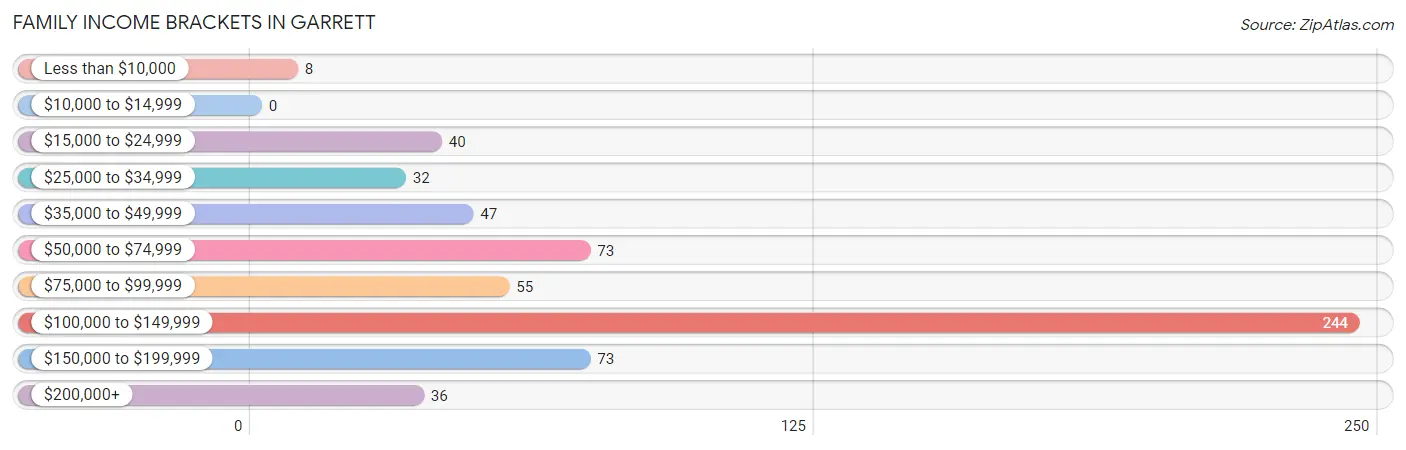
| Income Bracket | # Families | % Families |
| Less than $10,000 | 8 | 1.3% |
| $10,000 to $14,999 | 0 | 0.0% |
| $15,000 to $24,999 | 40 | 6.6% |
| $25,000 to $34,999 | 32 | 5.3% |
| $35,000 to $49,999 | 47 | 7.7% |
| $50,000 to $74,999 | 73 | 12.0% |
| $75,000 to $99,999 | 55 | 9.0% |
| $100,000 to $149,999 | 244 | 40.1% |
| $150,000 to $199,999 | 73 | 12.0% |
| $200,000+ | 36 | 5.9% |
Family Income by Famaliy Size in Garrett
4-person families (189 | 31.1%) account for the highest median family income in Garrett with $124,375 per family, while 2-person families (374 | 61.5%) have the highest median income of $38,194 per family member.
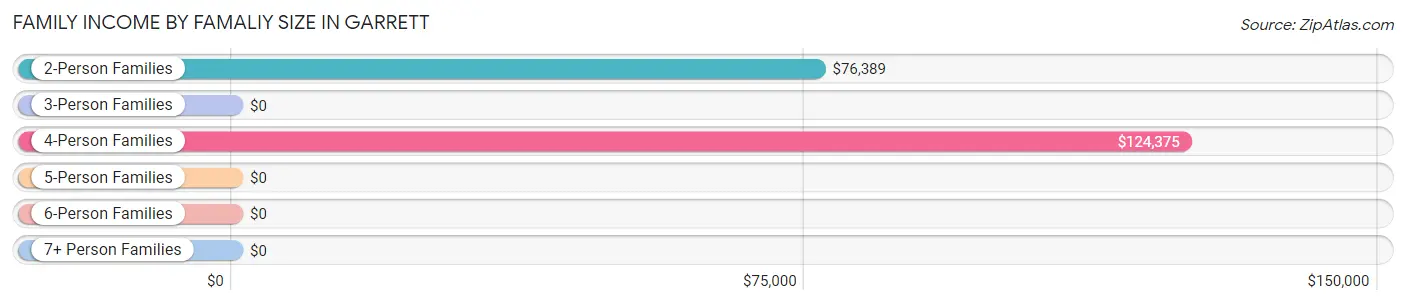
| Income Bracket | # Families | Median Income |
| 2-Person Families | 374 (61.5%) | $76,389 |
| 3-Person Families | 33 (5.4%) | $0 |
| 4-Person Families | 189 (31.1%) | $124,375 |
| 5-Person Families | 12 (2.0%) | $0 |
| 6-Person Families | 0 (0.0%) | $0 |
| 7+ Person Families | 0 (0.0%) | $0 |
| Total | 608 (100.0%) | $109,303 |
Family Income by Number of Earners in Garrett
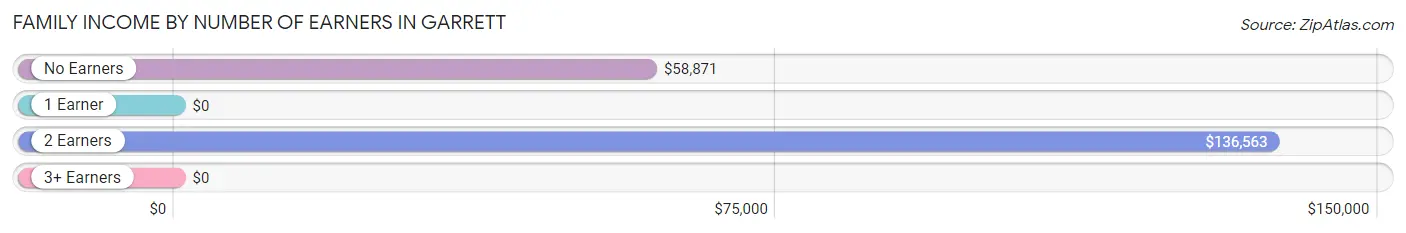
| Number of Earners | # Families | Median Income |
| No Earners | 122 (20.1%) | $58,871 |
| 1 Earner | 173 (28.4%) | $0 |
| 2 Earners | 304 (50.0%) | $136,563 |
| 3+ Earners | 9 (1.5%) | $0 |
| Total | 608 (100.0%) | $109,303 |
Household Income in Garrett
Household Income Brackets in Garrett
With 285 households falling in the category, the $100,000 to $149,999 income range is the most frequent in Garrett, accounting for 39.1% of all households. In contrast, only 7 households (1.0%) fall into the $10,000 to $14,999 income bracket, making it the least populous group.
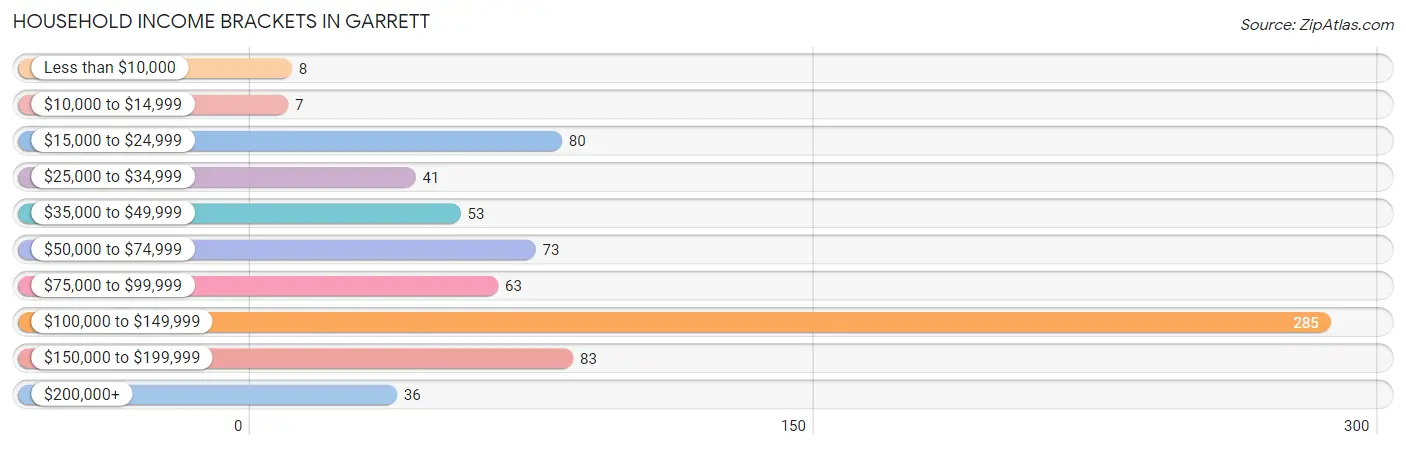
| Income Bracket | # Households | % Households |
| Less than $10,000 | 8 | 1.1% |
| $10,000 to $14,999 | 7 | 1.0% |
| $15,000 to $24,999 | 80 | 11.0% |
| $25,000 to $34,999 | 41 | 5.6% |
| $35,000 to $49,999 | 53 | 7.3% |
| $50,000 to $74,999 | 73 | 10.0% |
| $75,000 to $99,999 | 63 | 8.6% |
| $100,000 to $149,999 | 285 | 39.1% |
| $150,000 to $199,999 | 83 | 11.4% |
| $200,000+ | 36 | 4.9% |
Household Income by Householder Age in Garrett
The median household income in Garrett is $108,094, with the highest median household income of $117,188 found in the 45 to 64 years age bracket for the primary householder. A total of 392 households (53.8%) fall into this category.
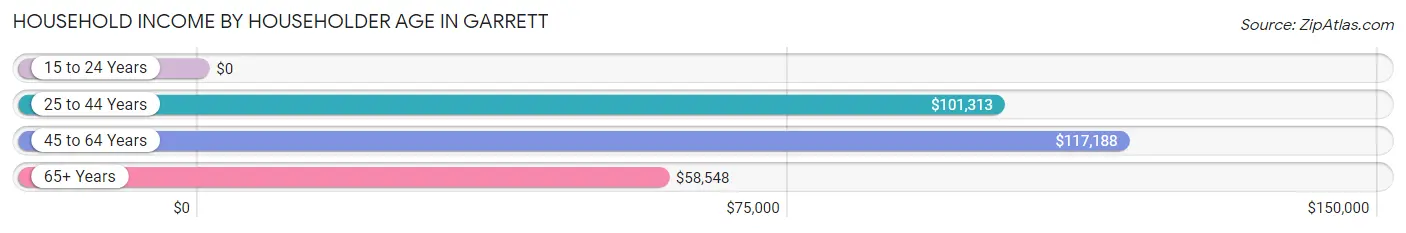
| Income Bracket | # Households | Median Income |
| 15 to 24 Years | 0 (0.0%) | $0 |
| 25 to 44 Years | 113 (15.5%) | $101,313 |
| 45 to 64 Years | 392 (53.8%) | $117,188 |
| 65+ Years | 224 (30.7%) | $58,548 |
| Total | 729 (100.0%) | $108,094 |
Poverty in Garrett
Income Below Poverty by Sex and Age in Garrett
With 1.1% poverty level for males and 3.6% for females among the residents of Garrett, 65 to 74 year old males and under 5 year old females are the most vulnerable to poverty, with 10 males (11.0%) and 9 females (23.7%) in their respective age groups living below the poverty level.
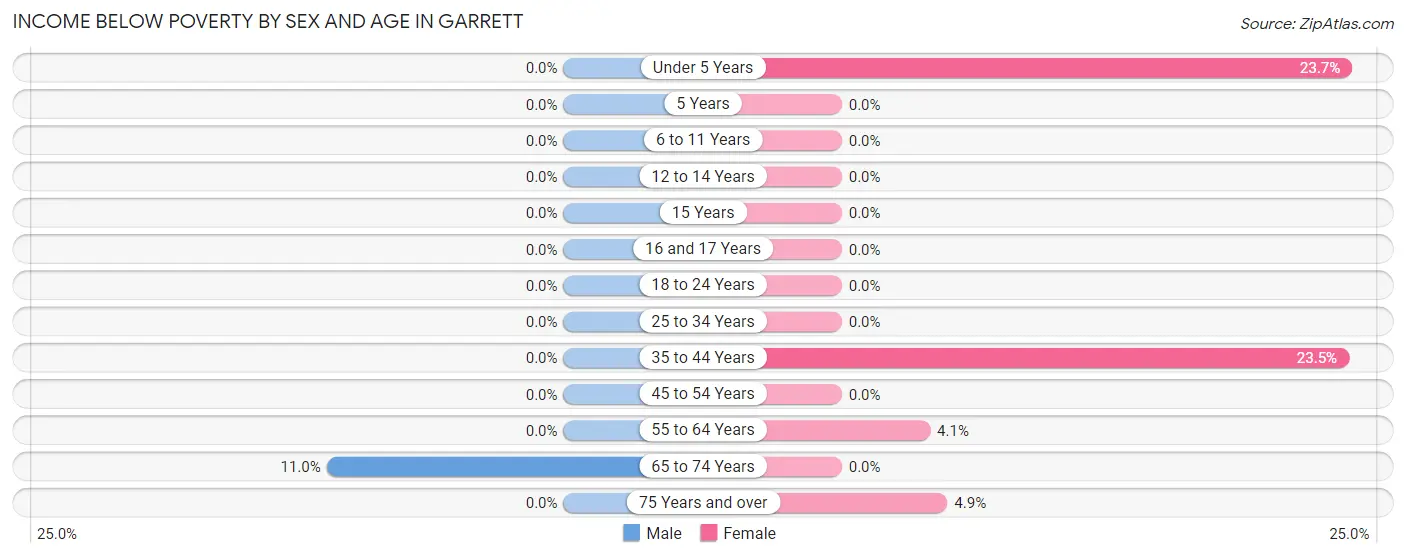
| Age Bracket | Male | Female |
| Under 5 Years | 0 (0.0%) | 9 (23.7%) |
| 5 Years | 0 (0.0%) | 0 (0.0%) |
| 6 to 11 Years | 0 (0.0%) | 0 (0.0%) |
| 12 to 14 Years | 0 (0.0%) | 0 (0.0%) |
| 15 Years | 0 (0.0%) | 0 (0.0%) |
| 16 and 17 Years | 0 (0.0%) | 0 (0.0%) |
| 18 to 24 Years | 0 (0.0%) | 0 (0.0%) |
| 25 to 34 Years | 0 (0.0%) | 0 (0.0%) |
| 35 to 44 Years | 0 (0.0%) | 8 (23.5%) |
| 45 to 54 Years | 0 (0.0%) | 0 (0.0%) |
| 55 to 64 Years | 0 (0.0%) | 11 (4.1%) |
| 65 to 74 Years | 10 (11.0%) | 0 (0.0%) |
| 75 Years and over | 0 (0.0%) | 7 (4.9%) |
| Total | 10 (1.1%) | 35 (3.6%) |
Income Above Poverty by Sex and Age in Garrett
According to the poverty statistics in Garrett, males aged under 5 years and females aged 6 to 11 years are the age groups that are most secure financially, with 100.0% of males and 100.0% of females in these age groups living above the poverty line.
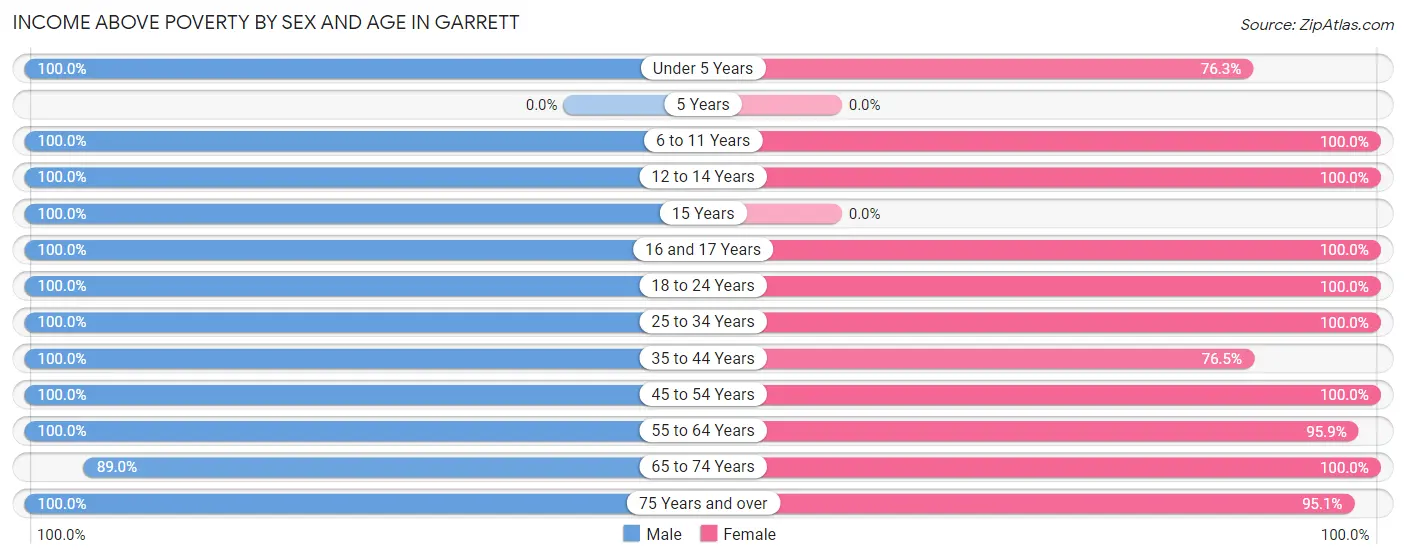
| Age Bracket | Male | Female |
| Under 5 Years | 14 (100.0%) | 29 (76.3%) |
| 5 Years | 0 (0.0%) | 0 (0.0%) |
| 6 to 11 Years | 18 (100.0%) | 13 (100.0%) |
| 12 to 14 Years | 66 (100.0%) | 66 (100.0%) |
| 15 Years | 13 (100.0%) | 0 (0.0%) |
| 16 and 17 Years | 21 (100.0%) | 16 (100.0%) |
| 18 to 24 Years | 126 (100.0%) | 4 (100.0%) |
| 25 to 34 Years | 73 (100.0%) | 148 (100.0%) |
| 35 to 44 Years | 41 (100.0%) | 26 (76.5%) |
| 45 to 54 Years | 113 (100.0%) | 67 (100.0%) |
| 55 to 64 Years | 220 (100.0%) | 257 (95.9%) |
| 65 to 74 Years | 81 (89.0%) | 168 (100.0%) |
| 75 Years and over | 108 (100.0%) | 136 (95.1%) |
| Total | 894 (98.9%) | 930 (96.4%) |
Income Below Poverty Among Married-Couple Families in Garrett
The poverty statistics for married-couple families in Garrett show that 1.8% or 10 of the total 557 families live below the poverty line. Families with no children have the highest poverty rate of 2.4%, comprising of 10 families. On the other hand, families with 1 or 2 children have the lowest poverty rate of 0.0%, which includes 0 families.
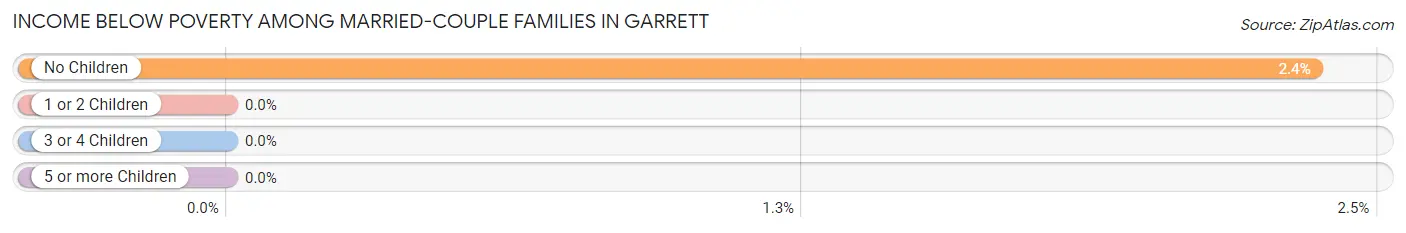
| Children | Above Poverty | Below Poverty |
| No Children | 413 (97.6%) | 10 (2.4%) |
| 1 or 2 Children | 122 (100.0%) | 0 (0.0%) |
| 3 or 4 Children | 12 (100.0%) | 0 (0.0%) |
| 5 or more Children | 0 (0.0%) | 0 (0.0%) |
| Total | 547 (98.2%) | 10 (1.8%) |
Income Below Poverty Among Single-Parent Households in Garrett
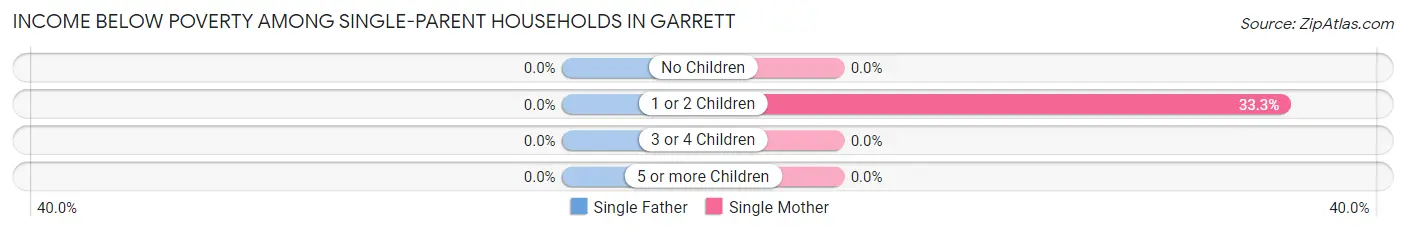
| Children | Single Father | Single Mother |
| No Children | 0 (0.0%) | 0 (0.0%) |
| 1 or 2 Children | 0 (0.0%) | 8 (33.3%) |
| 3 or 4 Children | 0 (0.0%) | 0 (0.0%) |
| 5 or more Children | 0 (0.0%) | 0 (0.0%) |
| Total | 0 (0.0%) | 8 (17.4%) |
Income Below Poverty Among Married-Couple vs Single-Parent Households in Garrett
The poverty data for Garrett shows that 10 of the married-couple family households (1.8%) and 8 of the single-parent households (15.7%) are living below the poverty level. Within the married-couple family households, those with no children have the highest poverty rate, with 10 households (2.4%) falling below the poverty line. Among the single-parent households, those with 1 or 2 children have the highest poverty rate, with 8 household (27.6%) living below poverty.
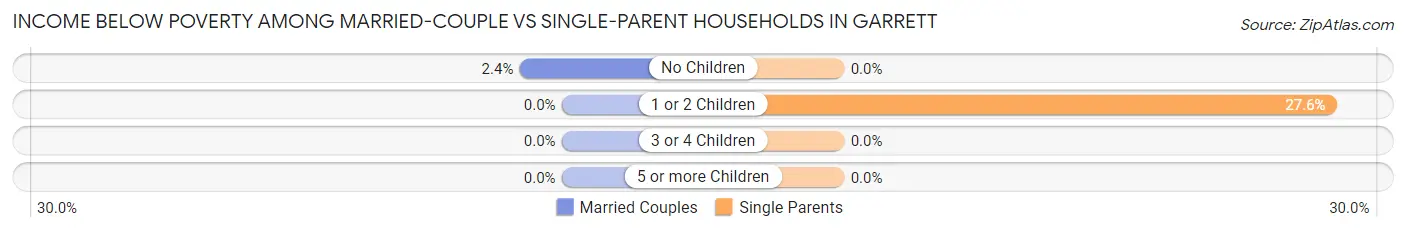
| Children | Married-Couple Families | Single-Parent Households |
| No Children | 10 (2.4%) | 0 (0.0%) |
| 1 or 2 Children | 0 (0.0%) | 8 (27.6%) |
| 3 or 4 Children | 0 (0.0%) | 0 (0.0%) |
| 5 or more Children | 0 (0.0%) | 0 (0.0%) |
| Total | 10 (1.8%) | 8 (15.7%) |
Race in Garrett
The most populous races in Garrett are White / Caucasian (1,728 | 92.3%), Hispanic or Latino (172 | 9.2%), and Two or more Races (119 | 6.4%).
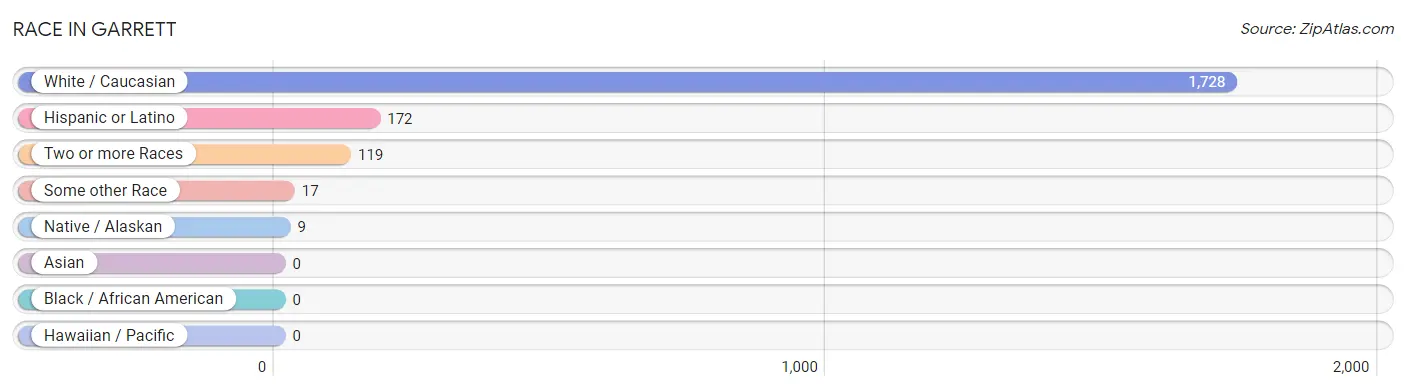
| Race | # Population | % Population |
| Asian | 0 | 0.0% |
| Black / African American | 0 | 0.0% |
| Hawaiian / Pacific | 0 | 0.0% |
| Hispanic or Latino | 172 | 9.2% |
| Native / Alaskan | 9 | 0.5% |
| White / Caucasian | 1,728 | 92.3% |
| Two or more Races | 119 | 6.4% |
| Some other Race | 17 | 0.9% |
| Total | 1,873 | 100.0% |
Ancestry in Garrett
The most populous ancestries reported in Garrett are German (611 | 32.6%), English (284 | 15.2%), Scottish (192 | 10.2%), Irish (186 | 9.9%), and Italian (178 | 9.5%), together accounting for 77.5% of all Garrett residents.
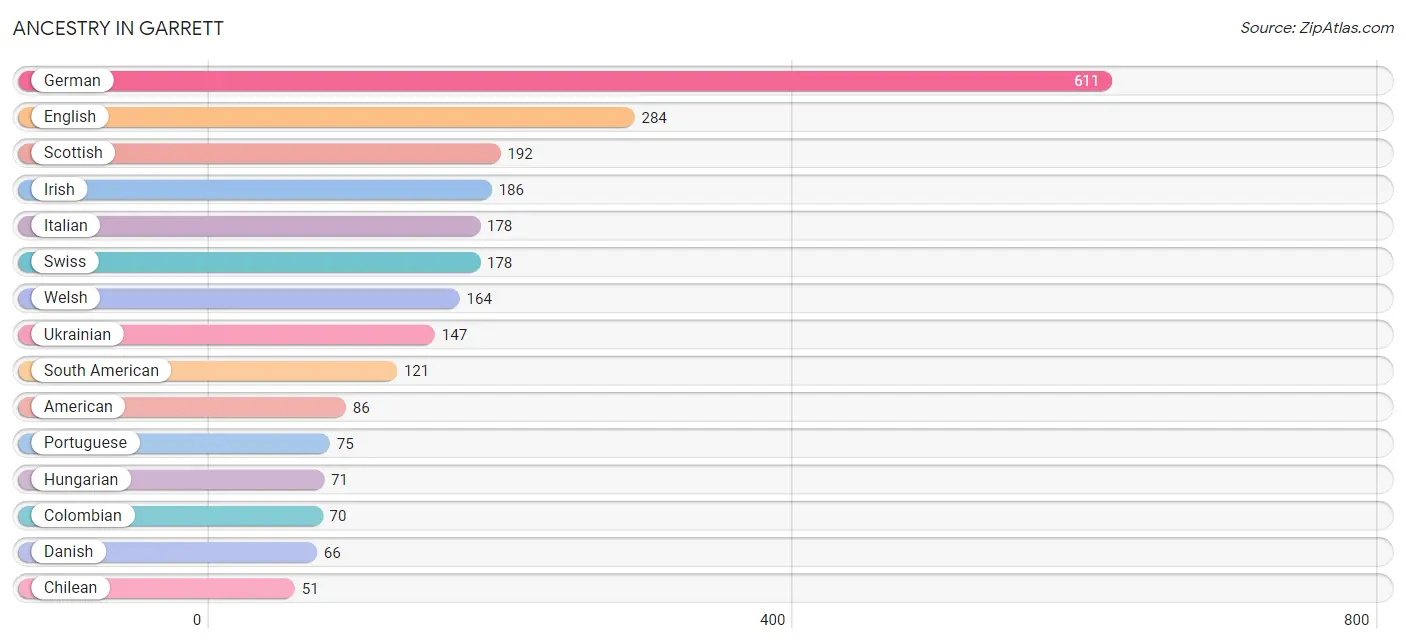
| Ancestry | # Population | % Population |
| Alaska Native | 9 | 0.5% |
| American | 86 | 4.6% |
| Blackfeet | 9 | 0.5% |
| British | 21 | 1.1% |
| Cherokee | 28 | 1.5% |
| Chilean | 51 | 2.7% |
| Chippewa | 20 | 1.1% |
| Colombian | 70 | 3.7% |
| Danish | 66 | 3.5% |
| Dutch | 20 | 1.1% |
| English | 284 | 15.2% |
| European | 8 | 0.4% |
| French | 12 | 0.6% |
| German | 611 | 32.6% |
| Hungarian | 71 | 3.8% |
| Irish | 186 | 9.9% |
| Italian | 178 | 9.5% |
| Mexican | 51 | 2.7% |
| Norwegian | 49 | 2.6% |
| Polish | 45 | 2.4% |
| Portuguese | 75 | 4.0% |
| Scandinavian | 24 | 1.3% |
| Scotch-Irish | 8 | 0.4% |
| Scottish | 192 | 10.2% |
| Sioux | 9 | 0.5% |
| Slavic | 29 | 1.5% |
| South American | 121 | 6.5% |
| Swedish | 51 | 2.7% |
| Swiss | 178 | 9.5% |
| Thai | 9 | 0.5% |
| Tlingit-Haida | 8 | 0.4% |
| Ukrainian | 147 | 7.9% |
| Welsh | 164 | 8.8% | View All 33 Rows |
Immigrants in Garrett
The most numerous immigrant groups reported in Garrett came from Canada (133 | 7.1%), Oceania (53 | 2.8%), Colombia (43 | 2.3%), Latin America (43 | 2.3%), and South America (43 | 2.3%), together accounting for 16.8% of all Garrett residents.
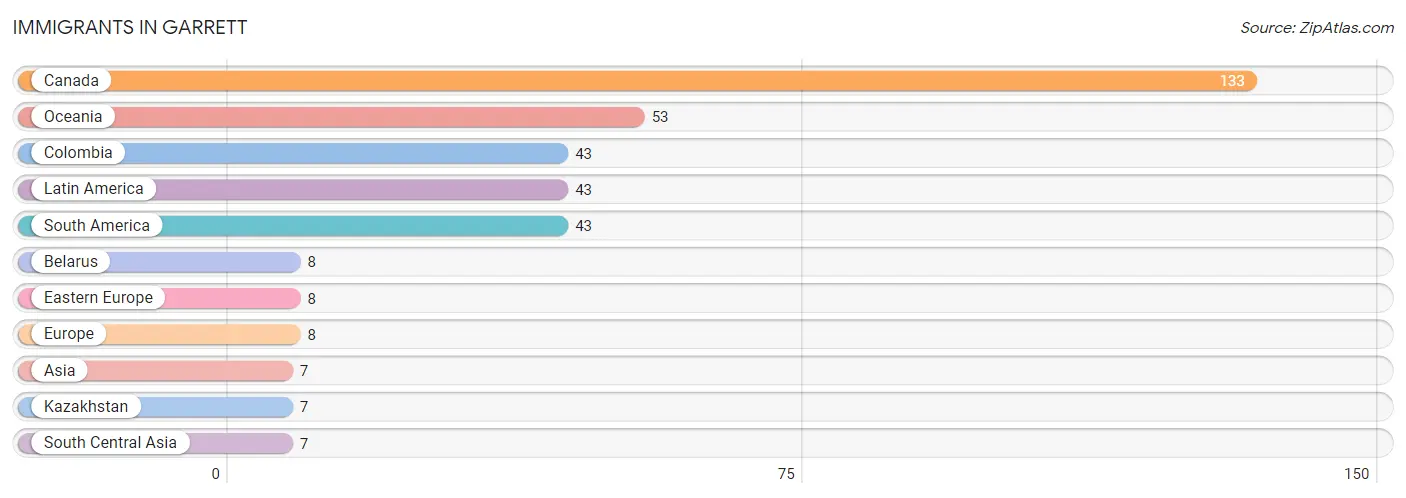
| Immigration Origin | # Population | % Population |
| Asia | 7 | 0.4% |
| Belarus | 8 | 0.4% |
| Canada | 133 | 7.1% |
| Colombia | 43 | 2.3% |
| Eastern Europe | 8 | 0.4% |
| Europe | 8 | 0.4% |
| Kazakhstan | 7 | 0.4% |
| Latin America | 43 | 2.3% |
| Oceania | 53 | 2.8% |
| South America | 43 | 2.3% |
| South Central Asia | 7 | 0.4% | View All 11 Rows |
Sex and Age in Garrett
Sex and Age in Garrett
The most populous age groups in Garrett are 60 to 64 Years (120 | 13.3%) for men and 55 to 59 Years (143 | 14.8%) for women.
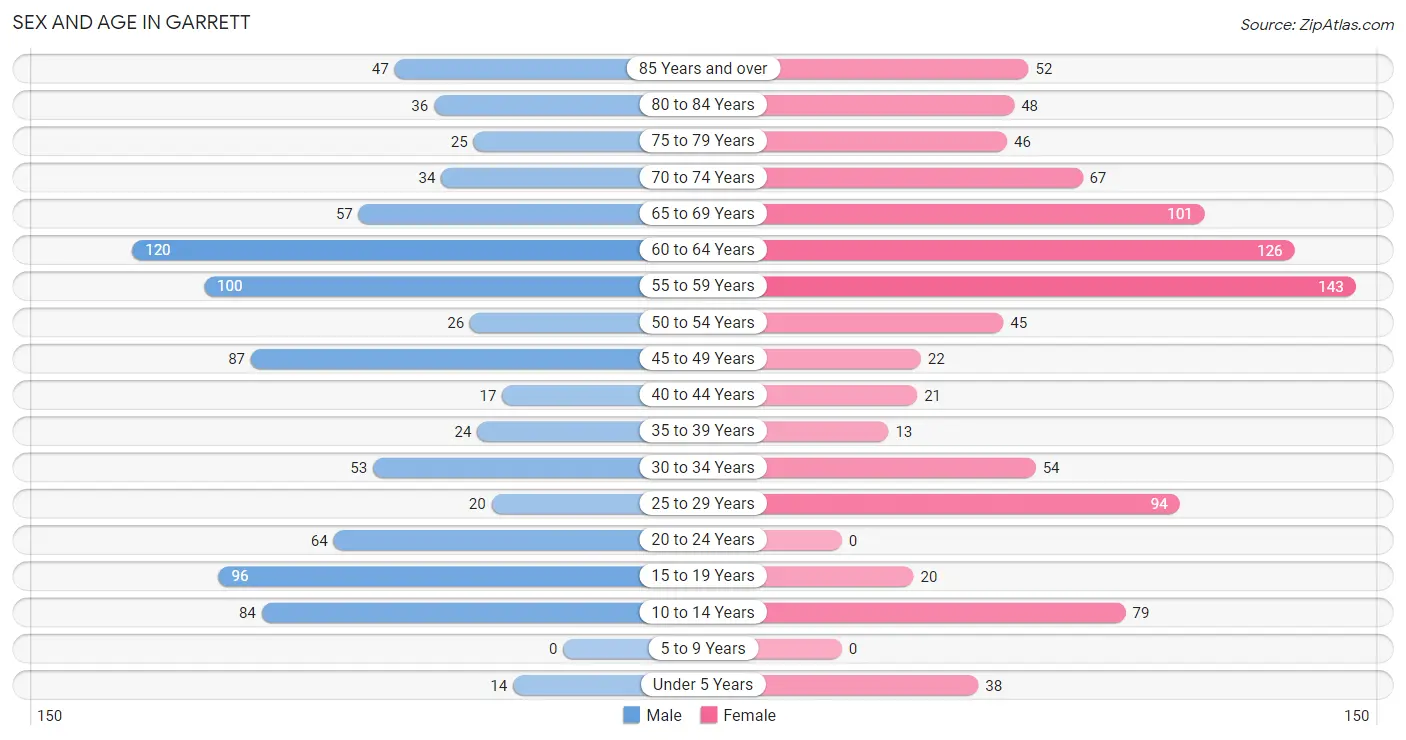
| Age Bracket | Male | Female |
| Under 5 Years | 14 (1.5%) | 38 (3.9%) |
| 5 to 9 Years | 0 (0.0%) | 0 (0.0%) |
| 10 to 14 Years | 84 (9.3%) | 79 (8.2%) |
| 15 to 19 Years | 96 (10.6%) | 20 (2.1%) |
| 20 to 24 Years | 64 (7.1%) | 0 (0.0%) |
| 25 to 29 Years | 20 (2.2%) | 94 (9.7%) |
| 30 to 34 Years | 53 (5.9%) | 54 (5.6%) |
| 35 to 39 Years | 24 (2.6%) | 13 (1.3%) |
| 40 to 44 Years | 17 (1.9%) | 21 (2.2%) |
| 45 to 49 Years | 87 (9.6%) | 22 (2.3%) |
| 50 to 54 Years | 26 (2.9%) | 45 (4.6%) |
| 55 to 59 Years | 100 (11.1%) | 143 (14.8%) |
| 60 to 64 Years | 120 (13.3%) | 126 (13.0%) |
| 65 to 69 Years | 57 (6.3%) | 101 (10.4%) |
| 70 to 74 Years | 34 (3.8%) | 67 (6.9%) |
| 75 to 79 Years | 25 (2.8%) | 46 (4.8%) |
| 80 to 84 Years | 36 (4.0%) | 48 (5.0%) |
| 85 Years and over | 47 (5.2%) | 52 (5.4%) |
| Total | 904 (100.0%) | 969 (100.0%) |
Families and Households in Garrett
Median Family Size in Garrett
The median family size in Garrett is 2.80 persons per family, with single male/father families (5 | 0.8%) accounting for the largest median family size of 3.6 persons per family. On the other hand, single female/mother families (46 | 7.6%) represent the smallest median family size with 2.28 persons per family.
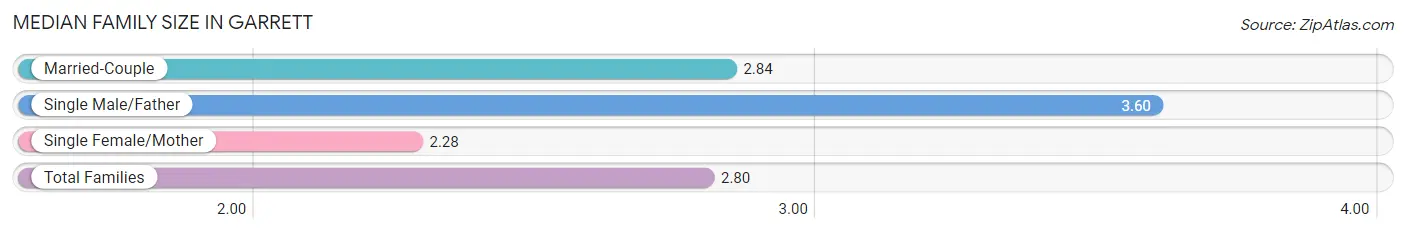
| Family Type | # Families | Family Size |
| Married-Couple | 557 (91.6%) | 2.84 |
| Single Male/Father | 5 (0.8%) | 3.60 |
| Single Female/Mother | 46 (7.6%) | 2.28 |
| Total Families | 608 (100.0%) | 2.80 |
Median Household Size in Garrett
The median household size in Garrett is 2.56 persons per household, with single male/father households (5 | 0.7%) accounting for the largest median household size of 3.6 persons per household. non-family households (121 | 16.6%) represent the smallest median household size with 1.36 persons per household.
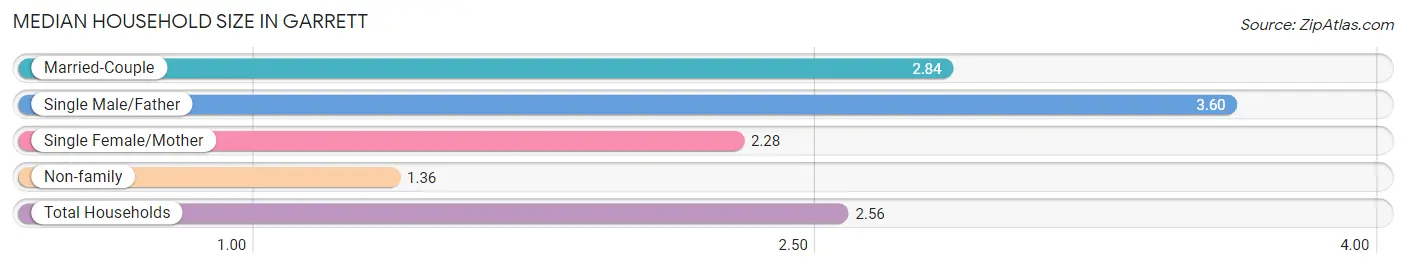
| Household Type | # Households | Household Size |
| Married-Couple | 557 (76.4%) | 2.84 |
| Single Male/Father | 5 (0.7%) | 3.60 |
| Single Female/Mother | 46 (6.3%) | 2.28 |
| Non-family | 121 (16.6%) | 1.36 |
| Total Households | 729 (100.0%) | 2.56 |
Household Size by Marriage Status in Garrett
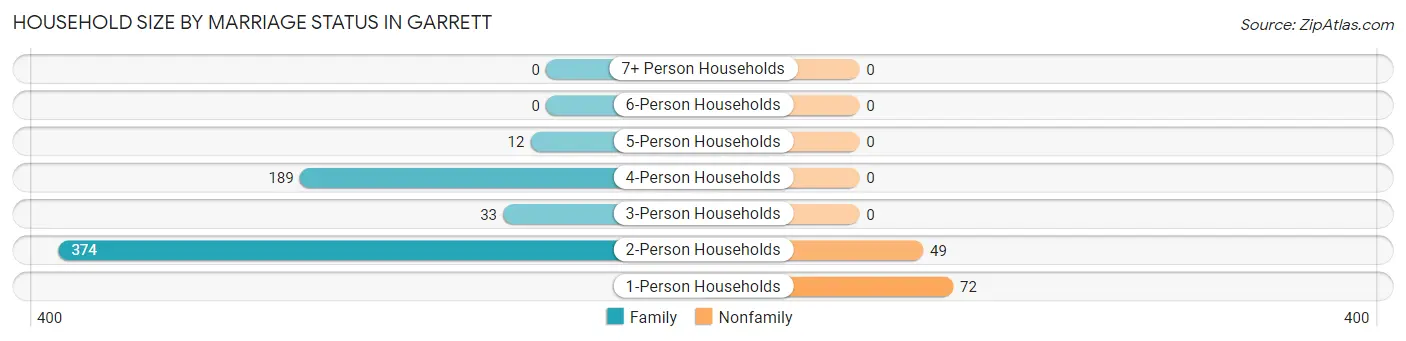
Out of a total of 729 households in Garrett, 608 (83.4%) are family households, while 121 (16.6%) are nonfamily households. The most numerous type of family households are 2-person households, comprising 374, and the most common type of nonfamily households are 1-person households, comprising 72.
| Household Size | Family Households | Nonfamily Households |
| 1-Person Households | - | 72 (9.9%) |
| 2-Person Households | 374 (51.3%) | 49 (6.7%) |
| 3-Person Households | 33 (4.5%) | 0 (0.0%) |
| 4-Person Households | 189 (25.9%) | 0 (0.0%) |
| 5-Person Households | 12 (1.7%) | 0 (0.0%) |
| 6-Person Households | 0 (0.0%) | 0 (0.0%) |
| 7+ Person Households | 0 (0.0%) | 0 (0.0%) |
| Total | 608 (83.4%) | 121 (16.6%) |
Female Fertility in Garrett
Fertility by Age in Garrett
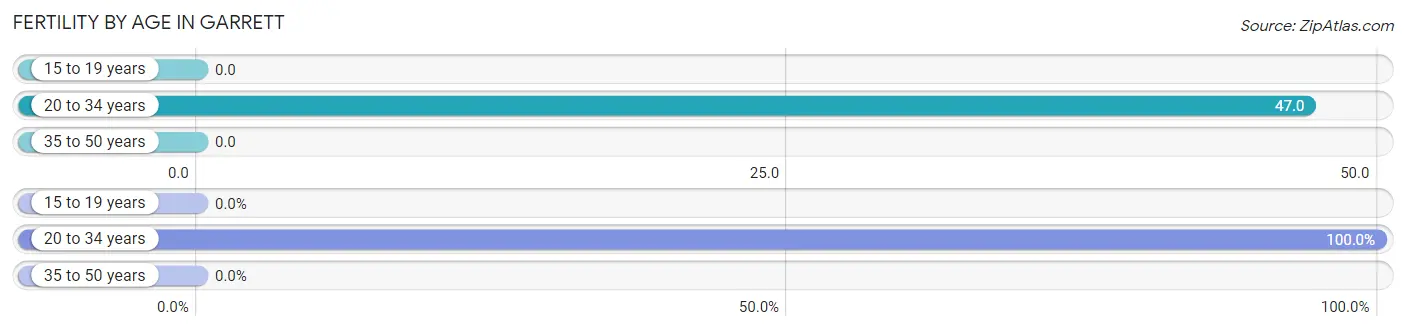
Average fertility rate in Garrett is 30.0 births per 1,000 women. Women in the age bracket of 20 to 34 years have the highest fertility rate with 47.0 births per 1,000 women. Women in the age bracket of 20 to 34 years acount for 100.0% of all women with births.
| Age Bracket | Women with Births | Births / 1,000 Women |
| 15 to 19 years | 0 (0.0%) | 0.0 |
| 20 to 34 years | 7 (100.0%) | 47.0 |
| 35 to 50 years | 0 (0.0%) | 0.0 |
| Total | 7 (100.0%) | 30.0 |
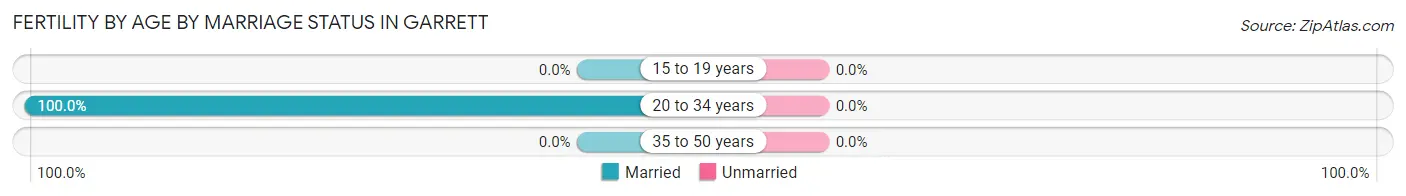
Fertility by Age by Marriage Status in Garrett
| Age Bracket | Married | Unmarried |
| 15 to 19 years | 0 (0.0%) | 0 (0.0%) |
| 20 to 34 years | 7 (100.0%) | 0 (0.0%) |
| 35 to 50 years | 0 (0.0%) | 0 (0.0%) |
| Total | 7 (100.0%) | 0 (0.0%) |
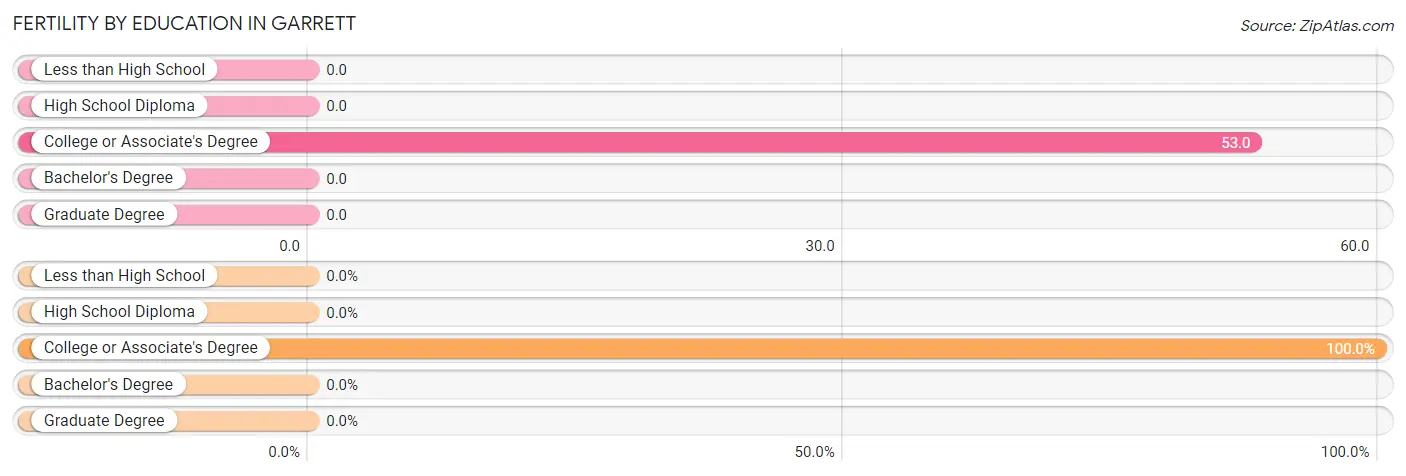
Fertility by Education in Garrett
| Educational Attainment | Women with Births | Births / 1,000 Women |
| Less than High School | 0 (0.0%) | 0.0 |
| High School Diploma | 0 (0.0%) | 0.0 |
| College or Associate's Degree | 7 (100.0%) | 53.0 |
| Bachelor's Degree | 0 (0.0%) | 0.0 |
| Graduate Degree | 0 (0.0%) | 0.0 |
| Total | 7 (100.0%) | 30.0 |
Fertility by Education by Marriage Status in Garrett
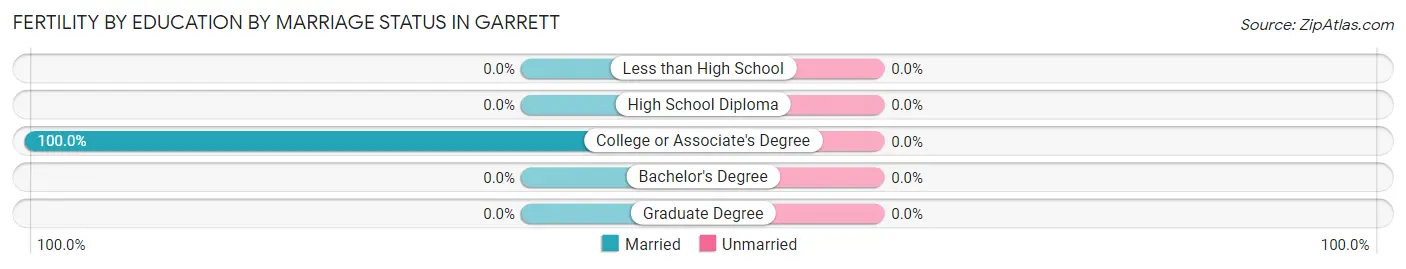
| Educational Attainment | Married | Unmarried |
| Less than High School | 0 (0.0%) | 0 (0.0%) |
| High School Diploma | 0 (0.0%) | 0 (0.0%) |
| College or Associate's Degree | 7 (100.0%) | 0 (0.0%) |
| Bachelor's Degree | 0 (0.0%) | 0 (0.0%) |
| Graduate Degree | 0 (0.0%) | 0 (0.0%) |
| Total | 7 (100.0%) | 0 (0.0%) |
Employment Characteristics in Garrett
Employment by Class of Employer in Garrett
Among the 799 employed individuals in Garrett, private company employees (281 | 35.2%), not-for-profit organizations (197 | 24.7%), and self-employed (incorporated) (89 | 11.1%) make up the most common classes of employment.
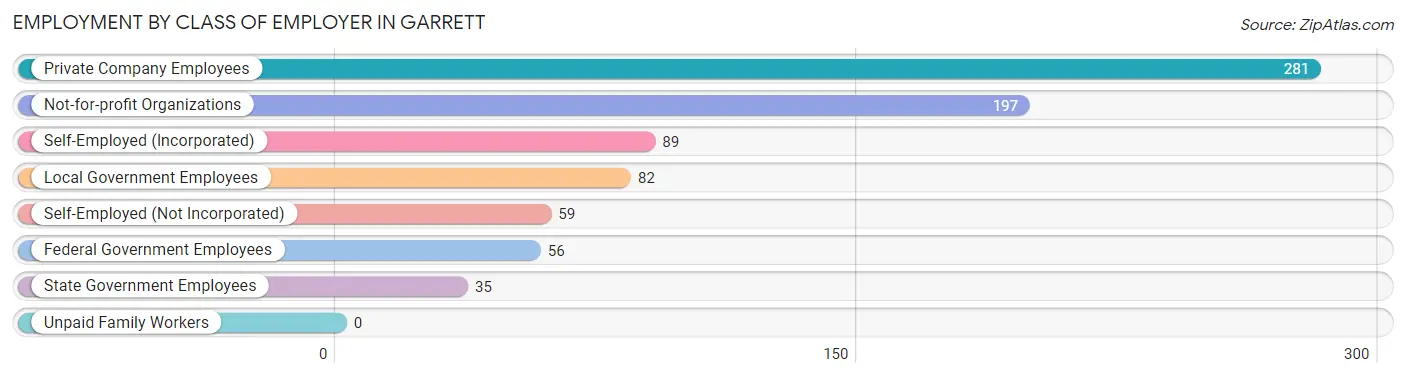
| Employer Class | # Employees | % Employees |
| Private Company Employees | 281 | 35.2% |
| Self-Employed (Incorporated) | 89 | 11.1% |
| Self-Employed (Not Incorporated) | 59 | 7.4% |
| Not-for-profit Organizations | 197 | 24.7% |
| Local Government Employees | 82 | 10.3% |
| State Government Employees | 35 | 4.4% |
| Federal Government Employees | 56 | 7.0% |
| Unpaid Family Workers | 0 | 0.0% |
| Total | 799 | 100.0% |
Employment Status by Age in Garrett
According to the labor force statistics for Garrett, out of the total population over 16 years of age (1,645), 53.9% or 887 individuals are in the labor force, with 7.3% or 65 of them unemployed. The age group with the highest labor force participation rate is 25 to 29 years, with 100.0% or 114 individuals in the labor force. Within the labor force, the 20 to 24 years age range has the highest percentage of unemployed individuals, with 100.0% or 26 of them being unemployed.
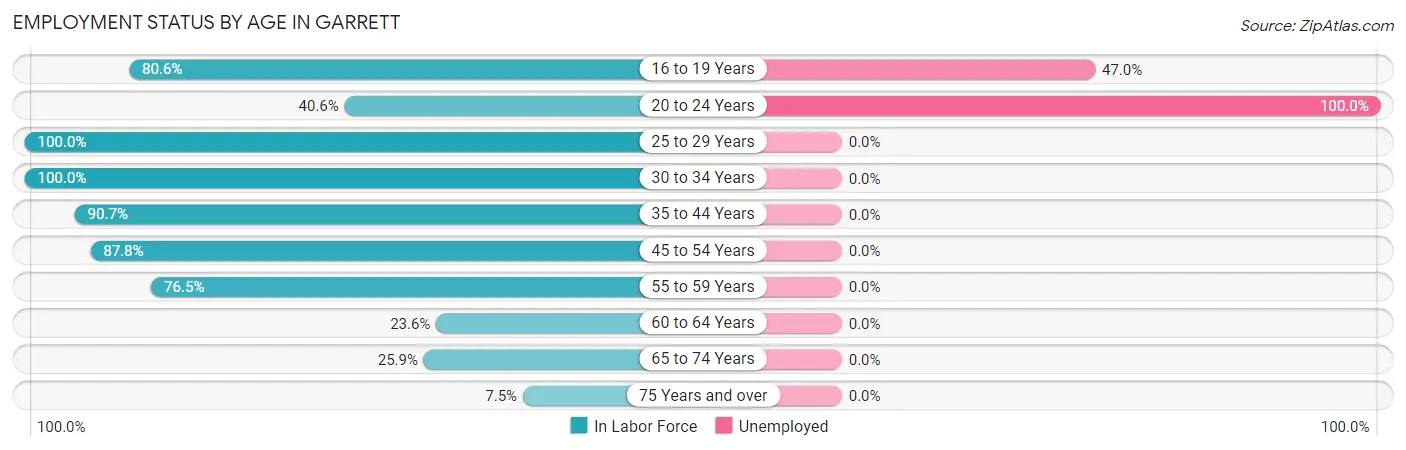
| Age Bracket | In Labor Force | Unemployed |
| 16 to 19 Years | 83 (80.6%) | 39 (47.0%) |
| 20 to 24 Years | 26 (40.6%) | 26 (100.0%) |
| 25 to 29 Years | 114 (100.0%) | 0 (0.0%) |
| 30 to 34 Years | 107 (100.0%) | 0 (0.0%) |
| 35 to 44 Years | 68 (90.7%) | 0 (0.0%) |
| 45 to 54 Years | 158 (87.8%) | 0 (0.0%) |
| 55 to 59 Years | 186 (76.5%) | 0 (0.0%) |
| 60 to 64 Years | 58 (23.6%) | 0 (0.0%) |
| 65 to 74 Years | 67 (25.9%) | 0 (0.0%) |
| 75 Years and over | 19 (7.5%) | 0 (0.0%) |
| Total | 887 (53.9%) | 65 (7.3%) |
Employment Status by Educational Attainment in Garrett
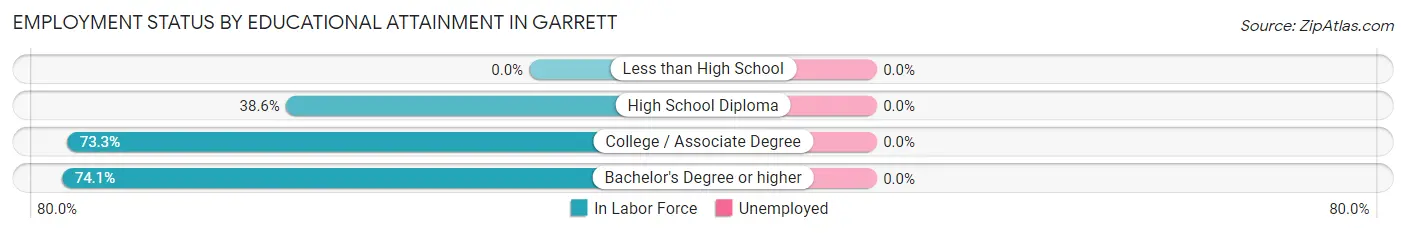
| Educational Attainment | In Labor Force | Unemployed |
| Less than High School | 0 (0.0%) | 0 (0.0%) |
| High School Diploma | 22 (38.6%) | 0 (0.0%) |
| College / Associate Degree | 354 (73.3%) | 0 (0.0%) |
| Bachelor's Degree or higher | 315 (74.1%) | 0 (0.0%) |
| Total | 691 (71.6%) | 0 (0.0%) |
Employment Occupations by Sex in Garrett
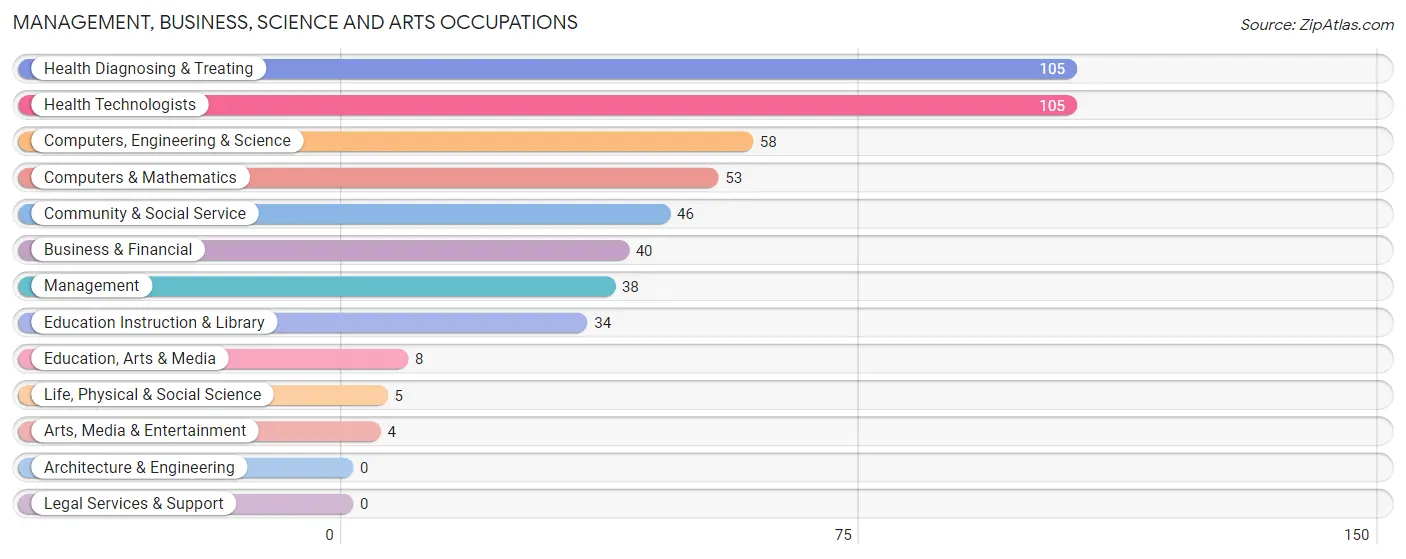
Management, Business, Science and Arts Occupations
The most common Management, Business, Science and Arts occupations in Garrett are Health Diagnosing & Treating (105 | 12.8%), Health Technologists (105 | 12.8%), Computers, Engineering & Science (58 | 7.1%), Computers & Mathematics (53 | 6.5%), and Community & Social Service (46 | 5.6%).
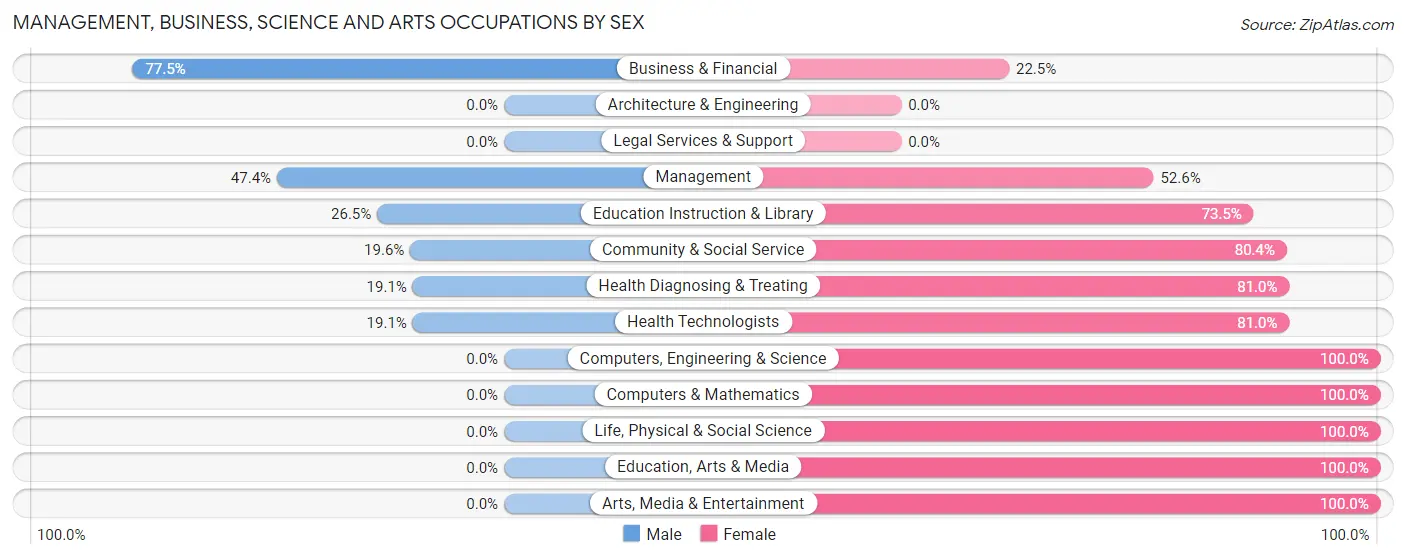
Management, Business, Science and Arts Occupations by Sex
Within the Management, Business, Science and Arts occupations in Garrett, the most male-oriented occupations are Business & Financial (77.5%), Management (47.4%), and Education Instruction & Library (26.5%), while the most female-oriented occupations are Computers, Engineering & Science (100.0%), Computers & Mathematics (100.0%), and Life, Physical & Social Science (100.0%).
| Occupation | Male | Female |
| Management | 18 (47.4%) | 20 (52.6%) |
| Business & Financial | 31 (77.5%) | 9 (22.5%) |
| Computers, Engineering & Science | 0 (0.0%) | 58 (100.0%) |
| Computers & Mathematics | 0 (0.0%) | 53 (100.0%) |
| Architecture & Engineering | 0 (0.0%) | 0 (0.0%) |
| Life, Physical & Social Science | 0 (0.0%) | 5 (100.0%) |
| Community & Social Service | 9 (19.6%) | 37 (80.4%) |
| Education, Arts & Media | 0 (0.0%) | 8 (100.0%) |
| Legal Services & Support | 0 (0.0%) | 0 (0.0%) |
| Education Instruction & Library | 9 (26.5%) | 25 (73.5%) |
| Arts, Media & Entertainment | 0 (0.0%) | 4 (100.0%) |
| Health Diagnosing & Treating | 20 (19.1%) | 85 (80.9%) |
| Health Technologists | 20 (19.1%) | 85 (80.9%) |
| Total (Category) | 78 (27.2%) | 209 (72.8%) |
| Total (Overall) | 423 (51.5%) | 398 (48.5%) |
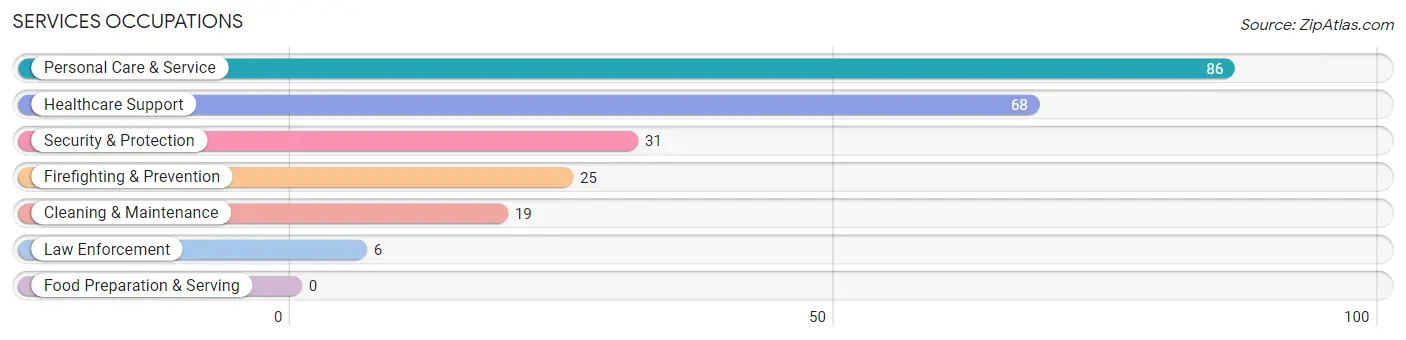
Services Occupations
The most common Services occupations in Garrett are Personal Care & Service (86 | 10.5%), Healthcare Support (68 | 8.3%), Security & Protection (31 | 3.8%), Firefighting & Prevention (25 | 3.0%), and Cleaning & Maintenance (19 | 2.3%).
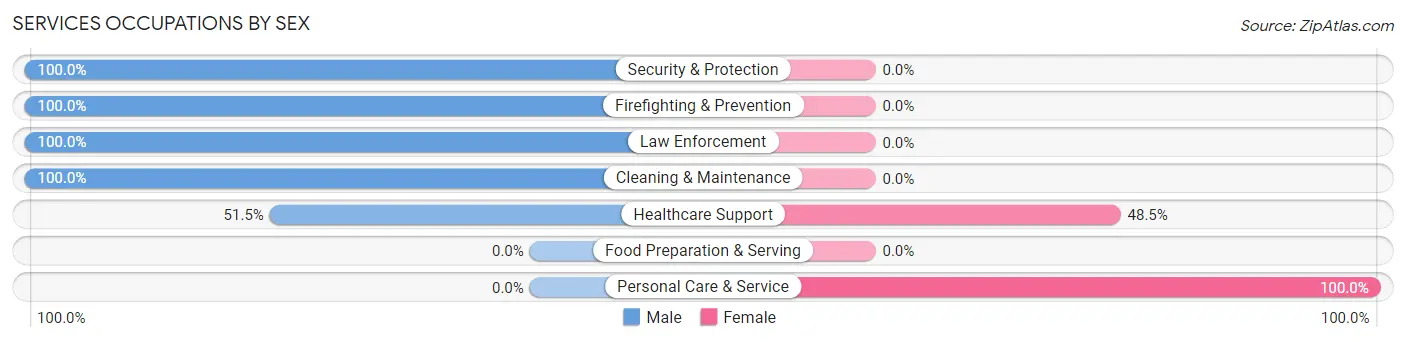
Services Occupations by Sex
Within the Services occupations in Garrett, the most male-oriented occupations are Security & Protection (100.0%), Firefighting & Prevention (100.0%), and Law Enforcement (100.0%), while the most female-oriented occupations are Personal Care & Service (100.0%), and Healthcare Support (48.5%).
| Occupation | Male | Female |
| Healthcare Support | 35 (51.5%) | 33 (48.5%) |
| Security & Protection | 31 (100.0%) | 0 (0.0%) |
| Firefighting & Prevention | 25 (100.0%) | 0 (0.0%) |
| Law Enforcement | 6 (100.0%) | 0 (0.0%) |
| Food Preparation & Serving | 0 (0.0%) | 0 (0.0%) |
| Cleaning & Maintenance | 19 (100.0%) | 0 (0.0%) |
| Personal Care & Service | 0 (0.0%) | 86 (100.0%) |
| Total (Category) | 85 (41.7%) | 119 (58.3%) |
| Total (Overall) | 423 (51.5%) | 398 (48.5%) |
Sales and Office Occupations
The most common Sales and Office occupations in Garrett are Sales & Related (134 | 16.3%), and Office & Administration (91 | 11.1%).
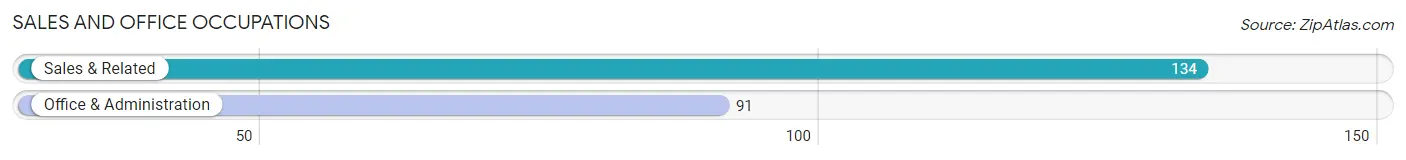
Sales and Office Occupations by Sex

| Occupation | Male | Female |
| Sales & Related | 134 (100.0%) | 0 (0.0%) |
| Office & Administration | 28 (30.8%) | 63 (69.2%) |
| Total (Category) | 162 (72.0%) | 63 (28.0%) |
| Total (Overall) | 423 (51.5%) | 398 (48.5%) |
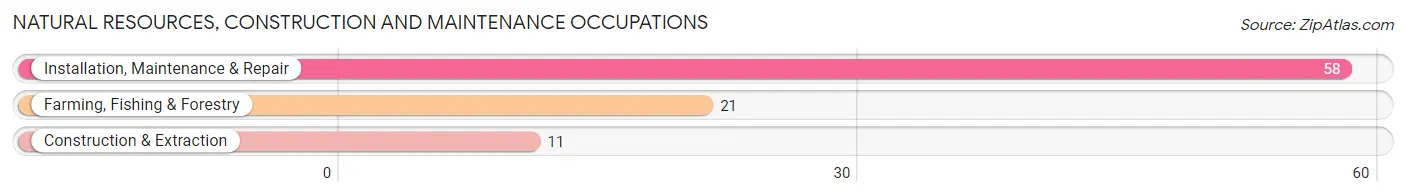
Natural Resources, Construction and Maintenance Occupations
The most common Natural Resources, Construction and Maintenance occupations in Garrett are Installation, Maintenance & Repair (58 | 7.1%), Farming, Fishing & Forestry (21 | 2.6%), and Construction & Extraction (11 | 1.3%).
Natural Resources, Construction and Maintenance Occupations by Sex
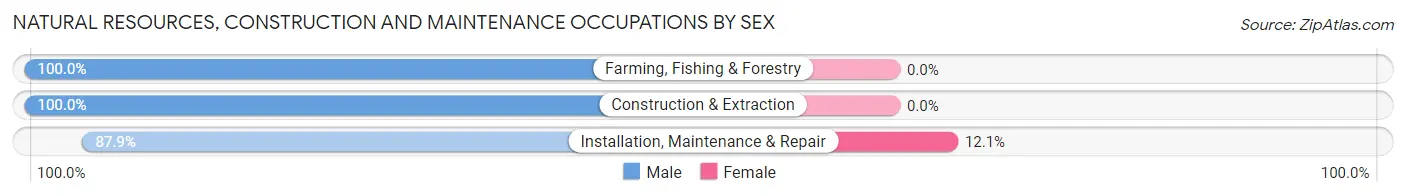
| Occupation | Male | Female |
| Farming, Fishing & Forestry | 21 (100.0%) | 0 (0.0%) |
| Construction & Extraction | 11 (100.0%) | 0 (0.0%) |
| Installation, Maintenance & Repair | 51 (87.9%) | 7 (12.1%) |
| Total (Category) | 83 (92.2%) | 7 (7.8%) |
| Total (Overall) | 423 (51.5%) | 398 (48.5%) |
Production, Transportation and Moving Occupations
The most common Production, Transportation and Moving occupations in Garrett are , and Production (15 | 1.8%).
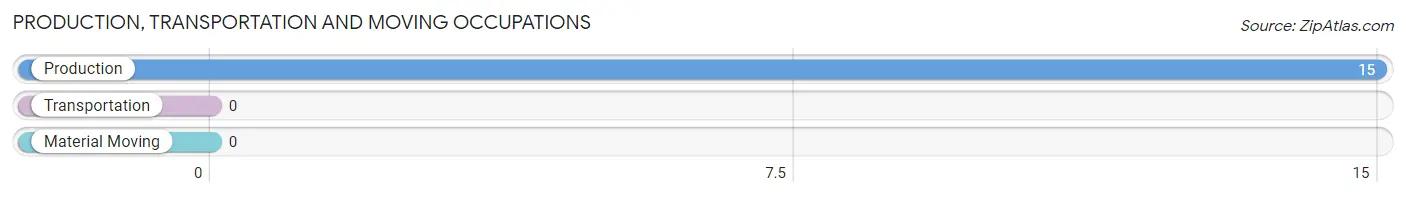
Production, Transportation and Moving Occupations by Sex
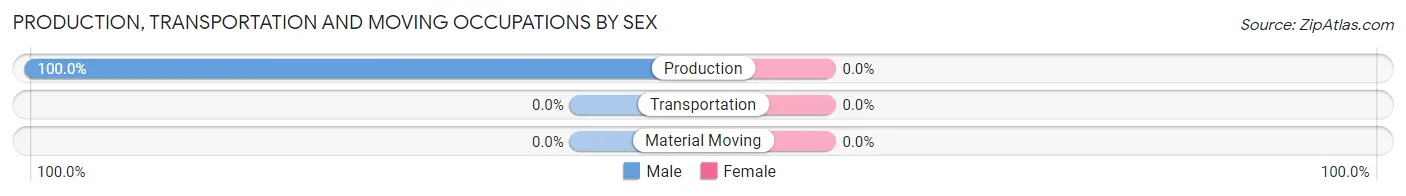
| Occupation | Male | Female |
| Production | 15 (100.0%) | 0 (0.0%) |
| Transportation | 0 (0.0%) | 0 (0.0%) |
| Material Moving | 0 (0.0%) | 0 (0.0%) |
| Total (Category) | 15 (100.0%) | 0 (0.0%) |
| Total (Overall) | 423 (51.5%) | 398 (48.5%) |
Employment Industries by Sex in Garrett
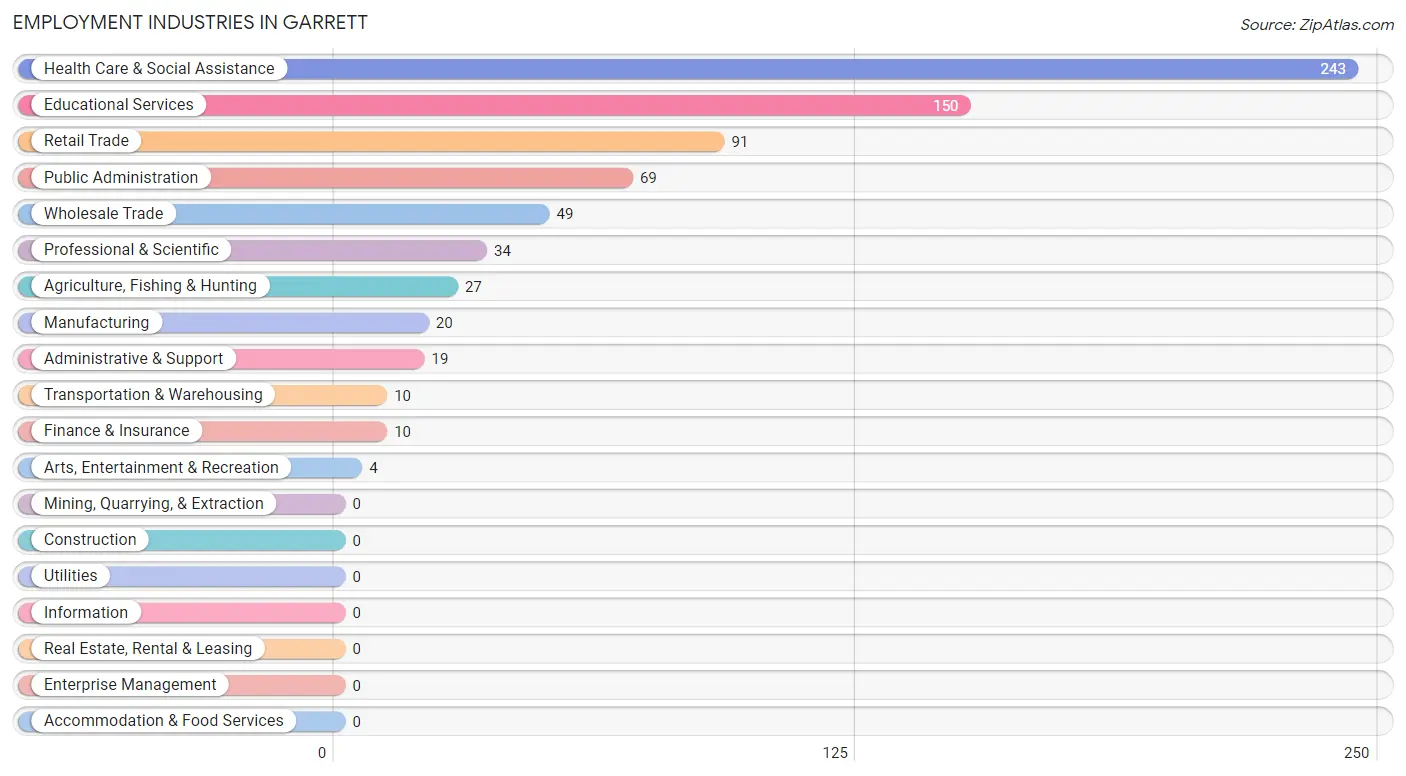
Employment Industries in Garrett
The major employment industries in Garrett include Health Care & Social Assistance (243 | 29.6%), Educational Services (150 | 18.3%), Retail Trade (91 | 11.1%), Public Administration (69 | 8.4%), and Wholesale Trade (49 | 6.0%).
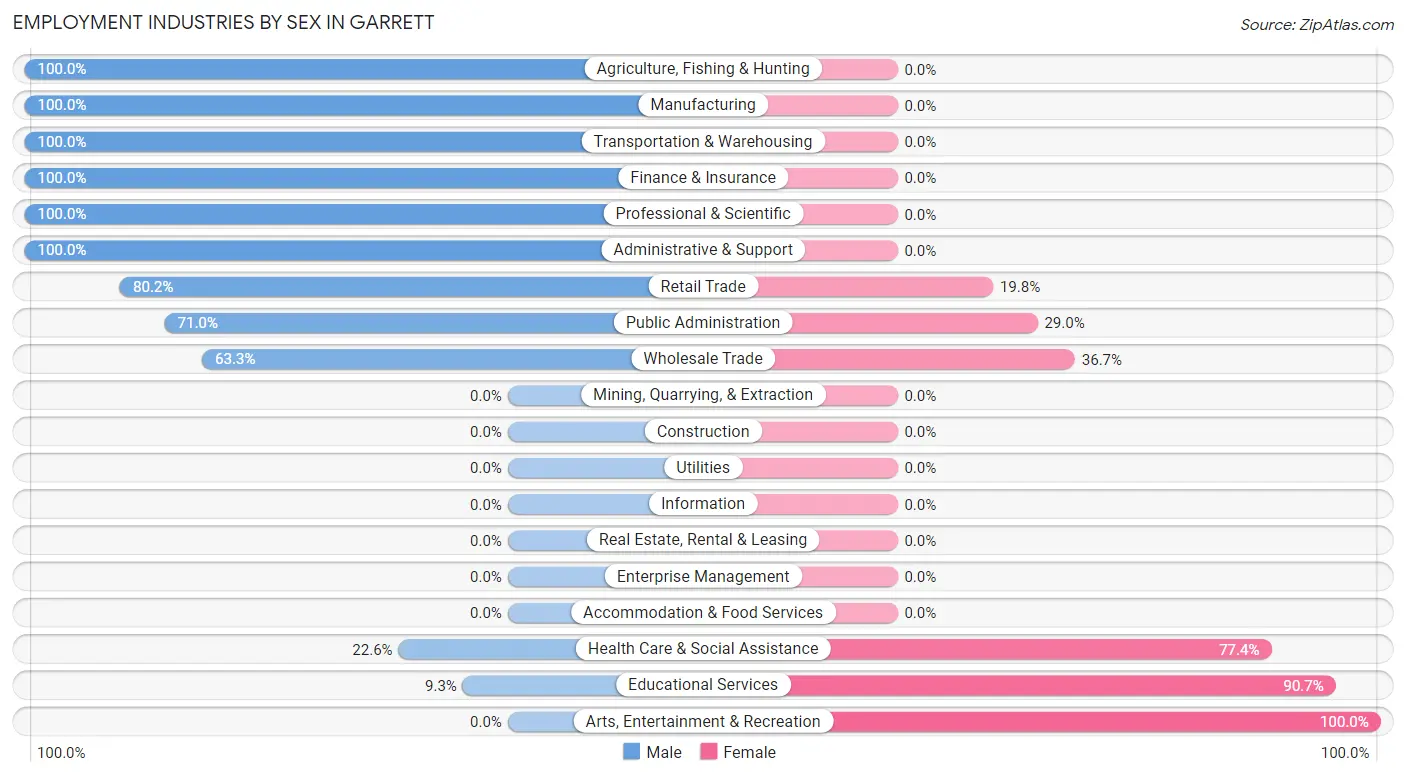
Employment Industries by Sex in Garrett
The Garrett industries that see more men than women are Agriculture, Fishing & Hunting (100.0%), Manufacturing (100.0%), and Transportation & Warehousing (100.0%), whereas the industries that tend to have a higher number of women are Arts, Entertainment & Recreation (100.0%), Educational Services (90.7%), and Health Care & Social Assistance (77.4%).
| Industry | Male | Female |
| Agriculture, Fishing & Hunting | 27 (100.0%) | 0 (0.0%) |
| Mining, Quarrying, & Extraction | 0 (0.0%) | 0 (0.0%) |
| Construction | 0 (0.0%) | 0 (0.0%) |
| Manufacturing | 20 (100.0%) | 0 (0.0%) |
| Wholesale Trade | 31 (63.3%) | 18 (36.7%) |
| Retail Trade | 73 (80.2%) | 18 (19.8%) |
| Transportation & Warehousing | 10 (100.0%) | 0 (0.0%) |
| Utilities | 0 (0.0%) | 0 (0.0%) |
| Information | 0 (0.0%) | 0 (0.0%) |
| Finance & Insurance | 10 (100.0%) | 0 (0.0%) |
| Real Estate, Rental & Leasing | 0 (0.0%) | 0 (0.0%) |
| Professional & Scientific | 34 (100.0%) | 0 (0.0%) |
| Enterprise Management | 0 (0.0%) | 0 (0.0%) |
| Administrative & Support | 19 (100.0%) | 0 (0.0%) |
| Educational Services | 14 (9.3%) | 136 (90.7%) |
| Health Care & Social Assistance | 55 (22.6%) | 188 (77.4%) |
| Arts, Entertainment & Recreation | 0 (0.0%) | 4 (100.0%) |
| Accommodation & Food Services | 0 (0.0%) | 0 (0.0%) |
| Public Administration | 49 (71.0%) | 20 (29.0%) |
| Total | 423 (51.5%) | 398 (48.5%) |
Education in Garrett
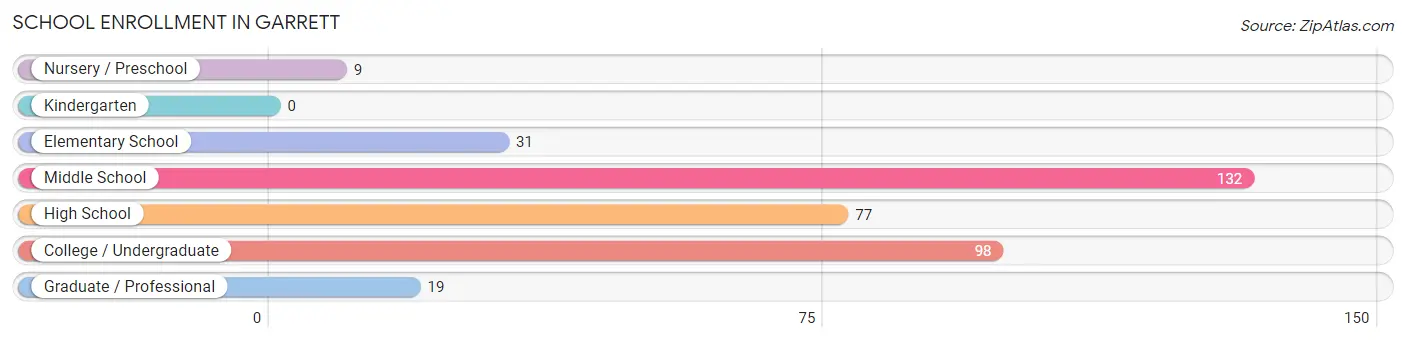
School Enrollment in Garrett
The most common levels of schooling among the 366 students in Garrett are middle school (132 | 36.1%), college / undergraduate (98 | 26.8%), and high school (77 | 21.0%).
| School Level | # Students | % Students |
| Nursery / Preschool | 9 | 2.5% |
| Kindergarten | 0 | 0.0% |
| Elementary School | 31 | 8.5% |
| Middle School | 132 | 36.1% |
| High School | 77 | 21.0% |
| College / Undergraduate | 98 | 26.8% |
| Graduate / Professional | 19 | 5.2% |
| Total | 366 | 100.0% |
School Enrollment by Age by Funding Source in Garrett
Out of a total of 366 students who are enrolled in schools in Garrett, 89 (24.3%) attend a private institution, while the remaining 277 (75.7%) are enrolled in public schools. The age group of 3 to 4 year olds has the highest likelihood of being enrolled in private schools, with 9 (100.0% in the age bracket) enrolled. Conversely, the age group of 20 to 24 year olds has the lowest likelihood of being enrolled in a private school, with 38 (100.0% in the age bracket) attending a public institution.
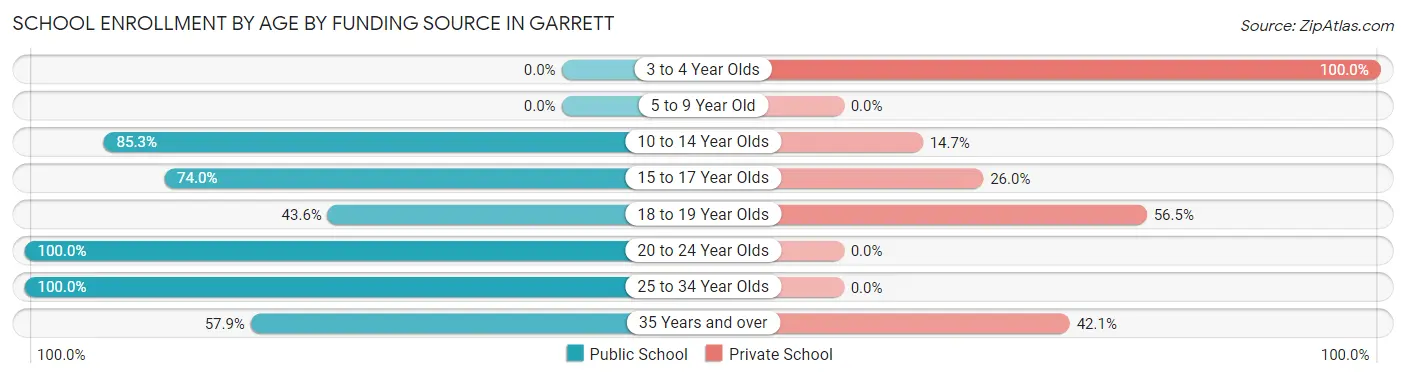
| Age Bracket | Public School | Private School |
| 3 to 4 Year Olds | 0 (0.0%) | 9 (100.0%) |
| 5 to 9 Year Old | 0 (0.0%) | 0 (0.0%) |
| 10 to 14 Year Olds | 139 (85.3%) | 24 (14.7%) |
| 15 to 17 Year Olds | 37 (74.0%) | 13 (26.0%) |
| 18 to 19 Year Olds | 27 (43.5%) | 35 (56.5%) |
| 20 to 24 Year Olds | 38 (100.0%) | 0 (0.0%) |
| 25 to 34 Year Olds | 25 (100.0%) | 0 (0.0%) |
| 35 Years and over | 11 (57.9%) | 8 (42.1%) |
| Total | 277 (75.7%) | 89 (24.3%) |
Educational Attainment by Field of Study in Garrett
Science & technology (144 | 26.0%), bio, nature & agricultural (103 | 18.6%), business (56 | 10.1%), liberal arts & history (50 | 9.0%), and social sciences (36 | 6.5%) are the most common fields of study among 553 individuals in Garrett who have obtained a bachelor's degree or higher.
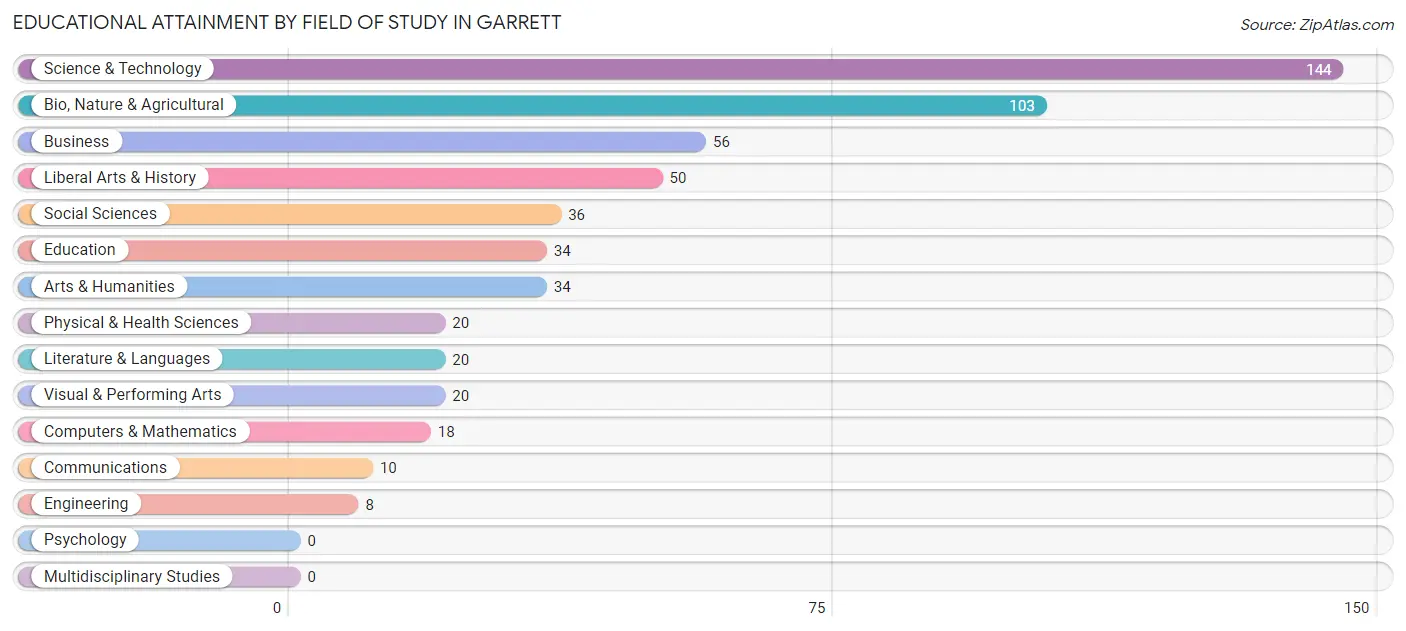
| Field of Study | # Graduates | % Graduates |
| Computers & Mathematics | 18 | 3.3% |
| Bio, Nature & Agricultural | 103 | 18.6% |
| Physical & Health Sciences | 20 | 3.6% |
| Psychology | 0 | 0.0% |
| Social Sciences | 36 | 6.5% |
| Engineering | 8 | 1.5% |
| Multidisciplinary Studies | 0 | 0.0% |
| Science & Technology | 144 | 26.0% |
| Business | 56 | 10.1% |
| Education | 34 | 6.1% |
| Literature & Languages | 20 | 3.6% |
| Liberal Arts & History | 50 | 9.0% |
| Visual & Performing Arts | 20 | 3.6% |
| Communications | 10 | 1.8% |
| Arts & Humanities | 34 | 6.1% |
| Total | 553 | 100.0% |
Transportation & Commute in Garrett
Vehicle Availability by Sex in Garrett
The most prevalent vehicle ownership categories in Garrett are males with 3 vehicles (142, accounting for 33.6%) and females with 3 vehicles (122, making up 37.8%).
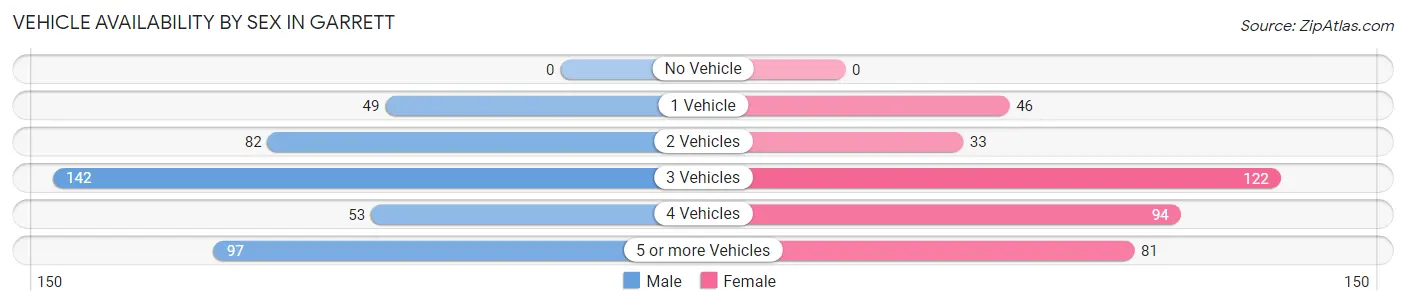
| Vehicles Available | Male | Female |
| No Vehicle | 0 (0.0%) | 0 (0.0%) |
| 1 Vehicle | 49 (11.6%) | 46 (12.2%) |
| 2 Vehicles | 82 (19.4%) | 33 (8.8%) |
| 3 Vehicles | 142 (33.6%) | 122 (32.5%) |
| 4 Vehicles | 53 (12.5%) | 94 (25.0%) |
| 5 or more Vehicles | 97 (22.9%) | 81 (21.5%) |
| Total | 423 (100.0%) | 376 (100.0%) |
Commute Time in Garrett
The most frequently occuring commute durations in Garrett are 5 to 9 minutes (265 commuters, 35.2%), 10 to 14 minutes (167 commuters, 22.2%), and 15 to 19 minutes (162 commuters, 21.5%).
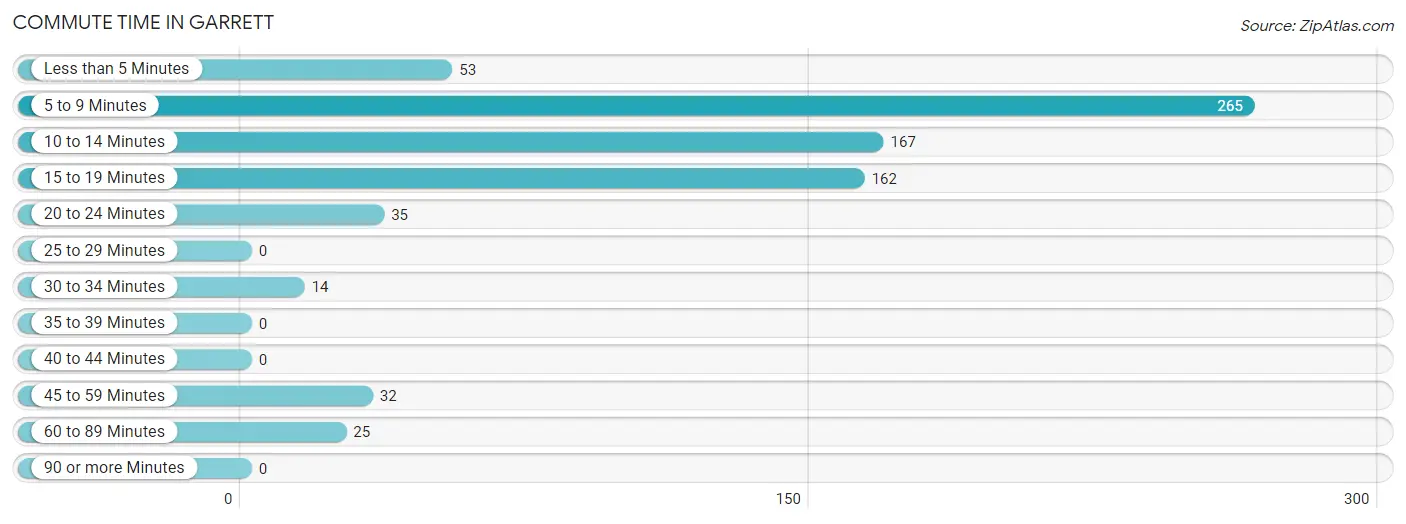
| Commute Time | # Commuters | % Commuters |
| Less than 5 Minutes | 53 | 7.0% |
| 5 to 9 Minutes | 265 | 35.2% |
| 10 to 14 Minutes | 167 | 22.2% |
| 15 to 19 Minutes | 162 | 21.5% |
| 20 to 24 Minutes | 35 | 4.6% |
| 25 to 29 Minutes | 0 | 0.0% |
| 30 to 34 Minutes | 14 | 1.9% |
| 35 to 39 Minutes | 0 | 0.0% |
| 40 to 44 Minutes | 0 | 0.0% |
| 45 to 59 Minutes | 32 | 4.3% |
| 60 to 89 Minutes | 25 | 3.3% |
| 90 or more Minutes | 0 | 0.0% |
Commute Time by Sex in Garrett
The most common commute times in Garrett are 5 to 9 minutes (174 commuters, 44.1%) for males and 15 to 19 minutes (133 commuters, 37.1%) for females.
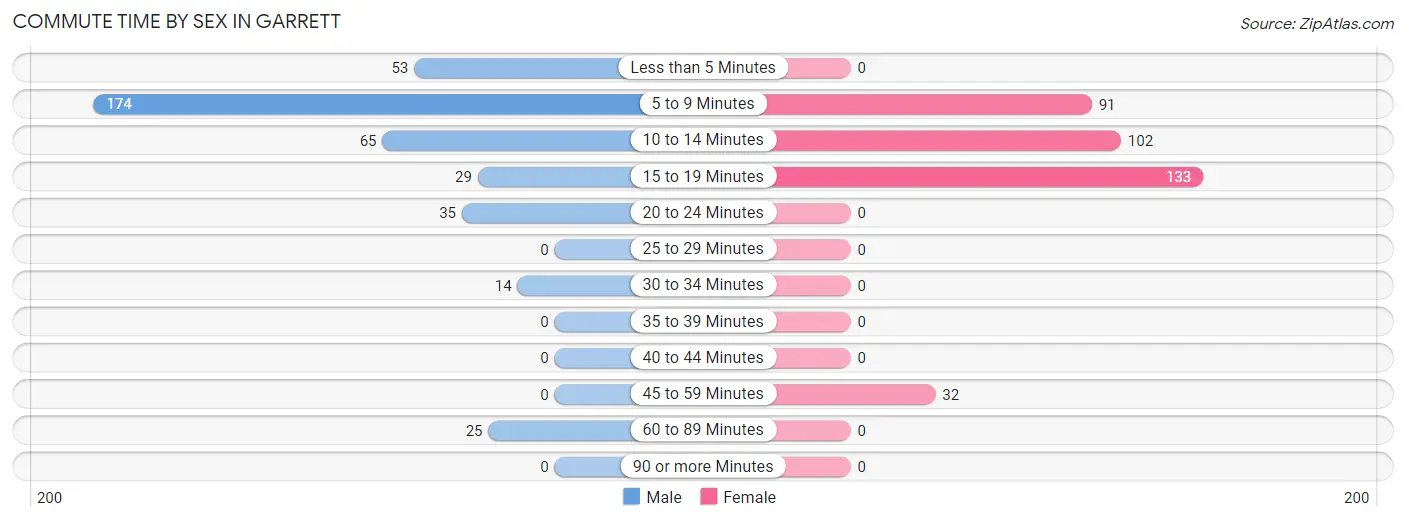
| Commute Time | Male | Female |
| Less than 5 Minutes | 53 (13.4%) | 0 (0.0%) |
| 5 to 9 Minutes | 174 (44.1%) | 91 (25.4%) |
| 10 to 14 Minutes | 65 (16.5%) | 102 (28.5%) |
| 15 to 19 Minutes | 29 (7.3%) | 133 (37.1%) |
| 20 to 24 Minutes | 35 (8.9%) | 0 (0.0%) |
| 25 to 29 Minutes | 0 (0.0%) | 0 (0.0%) |
| 30 to 34 Minutes | 14 (3.5%) | 0 (0.0%) |
| 35 to 39 Minutes | 0 (0.0%) | 0 (0.0%) |
| 40 to 44 Minutes | 0 (0.0%) | 0 (0.0%) |
| 45 to 59 Minutes | 0 (0.0%) | 32 (8.9%) |
| 60 to 89 Minutes | 25 (6.3%) | 0 (0.0%) |
| 90 or more Minutes | 0 (0.0%) | 0 (0.0%) |
Time of Departure to Work by Sex in Garrett
The most frequent times of departure to work in Garrett are 7:30 AM to 7:59 AM (105, 26.6%) for males and 7:00 AM to 7:29 AM (86, 24.0%) for females.
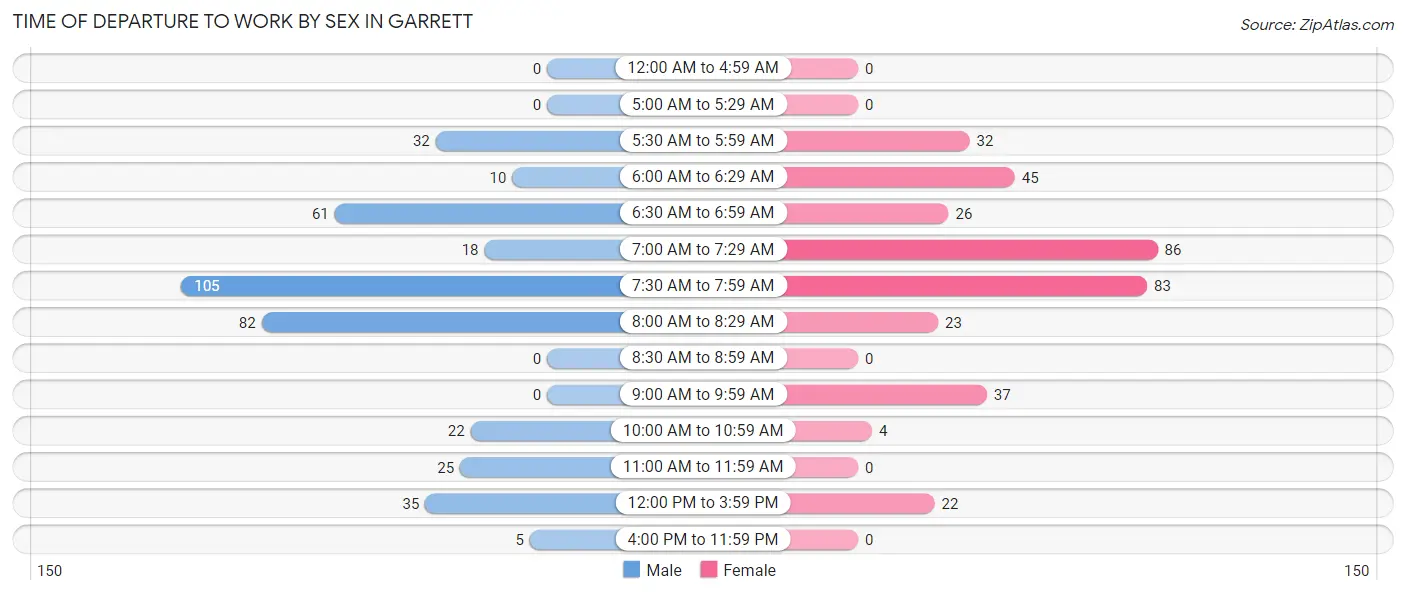
| Time of Departure | Male | Female |
| 12:00 AM to 4:59 AM | 0 (0.0%) | 0 (0.0%) |
| 5:00 AM to 5:29 AM | 0 (0.0%) | 0 (0.0%) |
| 5:30 AM to 5:59 AM | 32 (8.1%) | 32 (8.9%) |
| 6:00 AM to 6:29 AM | 10 (2.5%) | 45 (12.6%) |
| 6:30 AM to 6:59 AM | 61 (15.4%) | 26 (7.3%) |
| 7:00 AM to 7:29 AM | 18 (4.6%) | 86 (24.0%) |
| 7:30 AM to 7:59 AM | 105 (26.6%) | 83 (23.2%) |
| 8:00 AM to 8:29 AM | 82 (20.8%) | 23 (6.4%) |
| 8:30 AM to 8:59 AM | 0 (0.0%) | 0 (0.0%) |
| 9:00 AM to 9:59 AM | 0 (0.0%) | 37 (10.3%) |
| 10:00 AM to 10:59 AM | 22 (5.6%) | 4 (1.1%) |
| 11:00 AM to 11:59 AM | 25 (6.3%) | 0 (0.0%) |
| 12:00 PM to 3:59 PM | 35 (8.9%) | 22 (6.1%) |
| 4:00 PM to 11:59 PM | 5 (1.3%) | 0 (0.0%) |
| Total | 395 (100.0%) | 358 (100.0%) |
Housing Occupancy in Garrett
Occupancy by Ownership in Garrett
Of the total 729 dwellings in Garrett, owner-occupied units account for 670 (91.9%), while renter-occupied units make up 59 (8.1%).
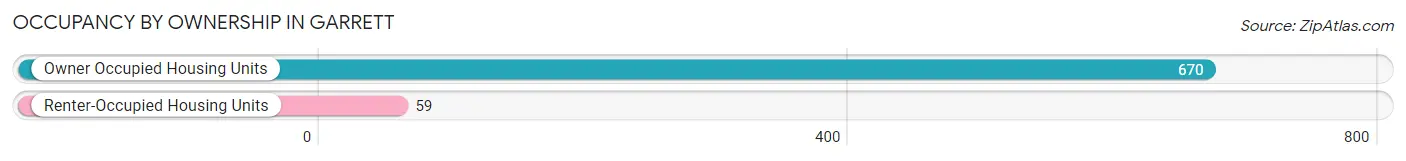
| Occupancy | # Housing Units | % Housing Units |
| Owner Occupied Housing Units | 670 | 91.9% |
| Renter-Occupied Housing Units | 59 | 8.1% |
| Total Occupied Housing Units | 729 | 100.0% |
Occupancy by Household Size in Garrett
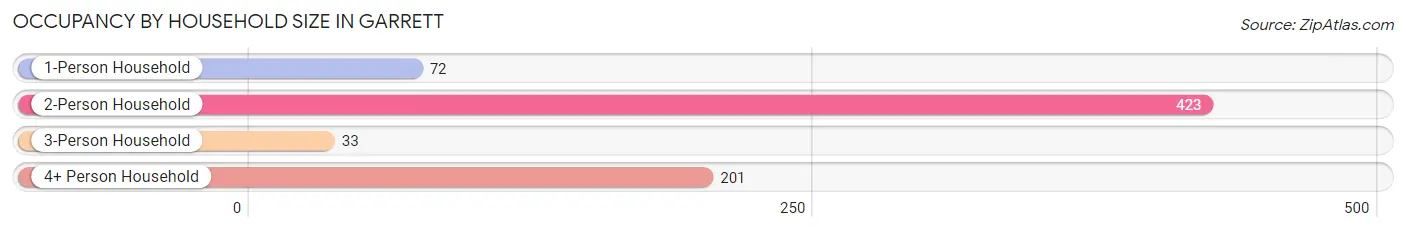
| Household Size | # Housing Units | % Housing Units |
| 1-Person Household | 72 | 9.9% |
| 2-Person Household | 423 | 58.0% |
| 3-Person Household | 33 | 4.5% |
| 4+ Person Household | 201 | 27.6% |
| Total Housing Units | 729 | 100.0% |
Occupancy by Ownership by Household Size in Garrett
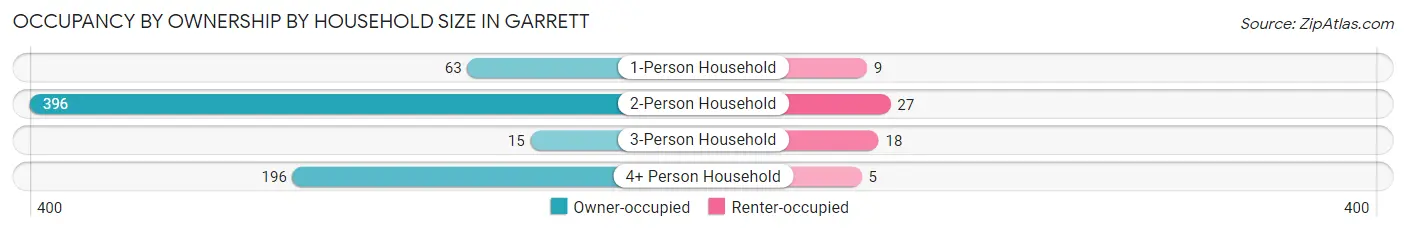
| Household Size | Owner-occupied | Renter-occupied |
| 1-Person Household | 63 (87.5%) | 9 (12.5%) |
| 2-Person Household | 396 (93.6%) | 27 (6.4%) |
| 3-Person Household | 15 (45.5%) | 18 (54.5%) |
| 4+ Person Household | 196 (97.5%) | 5 (2.5%) |
| Total Housing Units | 670 (91.9%) | 59 (8.1%) |
Occupancy by Educational Attainment in Garrett
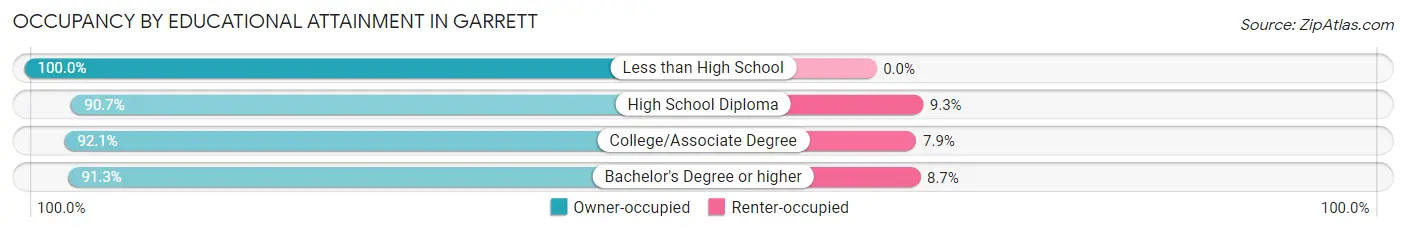
| Household Size | Owner-occupied | Renter-occupied |
| Less than High School | 22 (100.0%) | 0 (0.0%) |
| High School Diploma | 49 (90.7%) | 5 (9.3%) |
| College/Associate Degree | 326 (92.1%) | 28 (7.9%) |
| Bachelor's Degree or higher | 273 (91.3%) | 26 (8.7%) |
Occupancy by Age of Householder in Garrett
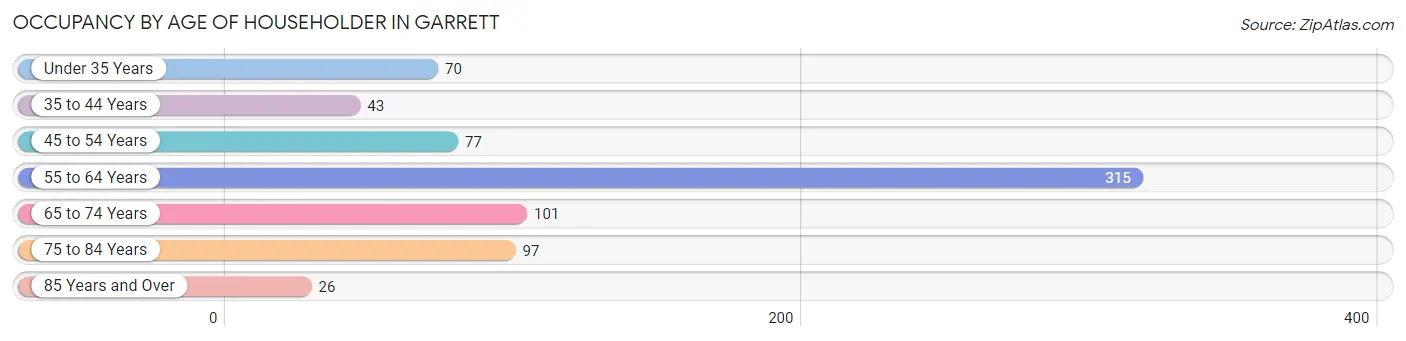
| Age Bracket | # Households | % Households |
| Under 35 Years | 70 | 9.6% |
| 35 to 44 Years | 43 | 5.9% |
| 45 to 54 Years | 77 | 10.6% |
| 55 to 64 Years | 315 | 43.2% |
| 65 to 74 Years | 101 | 13.9% |
| 75 to 84 Years | 97 | 13.3% |
| 85 Years and Over | 26 | 3.6% |
| Total | 729 | 100.0% |
Housing Finances in Garrett
Median Income by Occupancy in Garrett
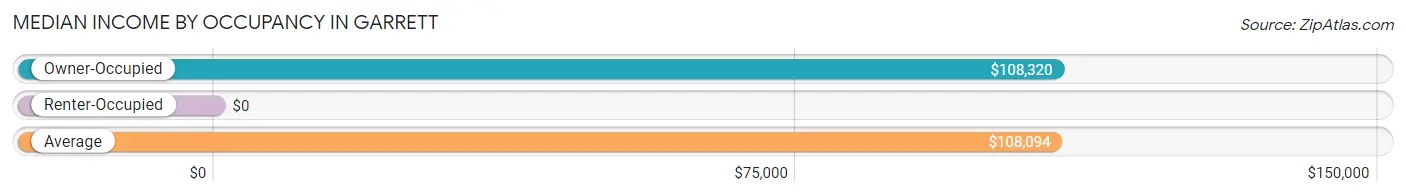
| Occupancy Type | # Households | Median Income |
| Owner-Occupied | 670 (91.9%) | $108,320 |
| Renter-Occupied | 59 (8.1%) | $0 |
| Average | 729 (100.0%) | $108,094 |
Occupancy by Householder Income Bracket in Garrett
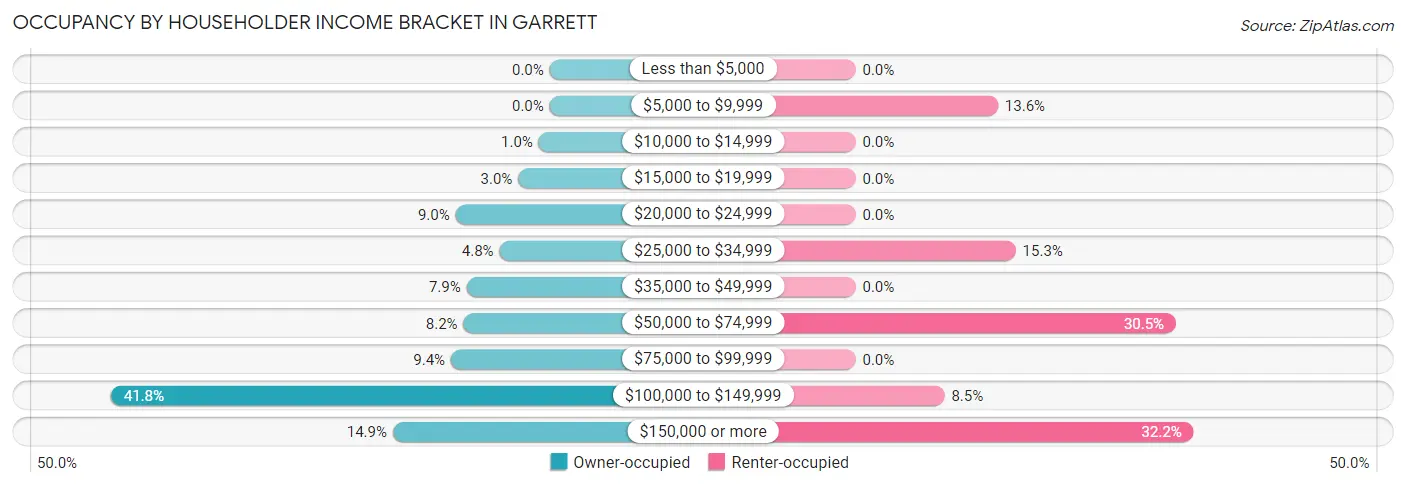
| Income Bracket | Owner-occupied | Renter-occupied |
| Less than $5,000 | 0 (0.0%) | 0 (0.0%) |
| $5,000 to $9,999 | 0 (0.0%) | 8 (13.6%) |
| $10,000 to $14,999 | 7 (1.0%) | 0 (0.0%) |
| $15,000 to $19,999 | 20 (3.0%) | 0 (0.0%) |
| $20,000 to $24,999 | 60 (9.0%) | 0 (0.0%) |
| $25,000 to $34,999 | 32 (4.8%) | 9 (15.2%) |
| $35,000 to $49,999 | 53 (7.9%) | 0 (0.0%) |
| $50,000 to $74,999 | 55 (8.2%) | 18 (30.5%) |
| $75,000 to $99,999 | 63 (9.4%) | 0 (0.0%) |
| $100,000 to $149,999 | 280 (41.8%) | 5 (8.5%) |
| $150,000 or more | 100 (14.9%) | 19 (32.2%) |
| Total | 670 (100.0%) | 59 (100.0%) |
Monthly Housing Cost Tiers in Garrett
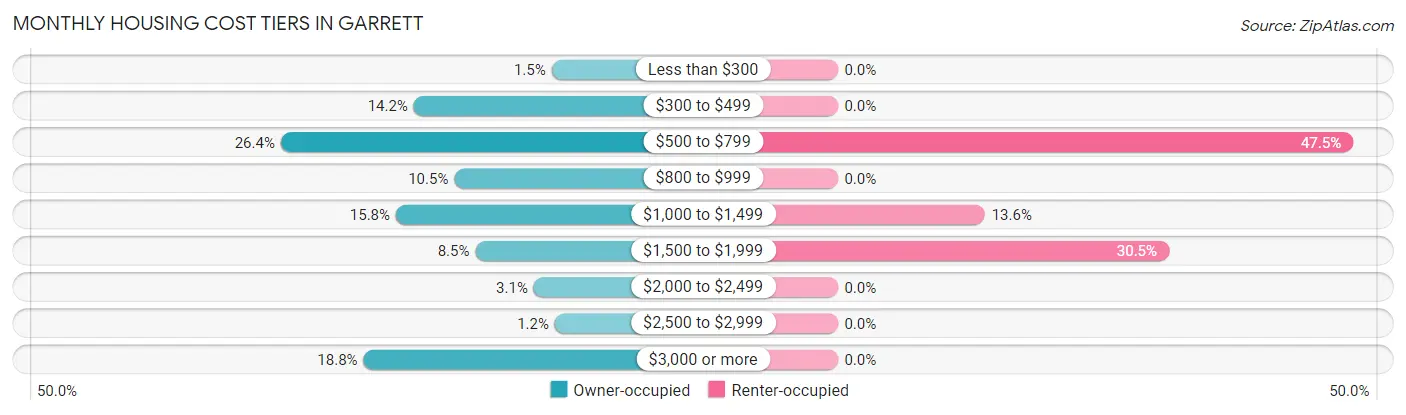
| Monthly Cost | Owner-occupied | Renter-occupied |
| Less than $300 | 10 (1.5%) | 0 (0.0%) |
| $300 to $499 | 95 (14.2%) | 0 (0.0%) |
| $500 to $799 | 177 (26.4%) | 28 (47.5%) |
| $800 to $999 | 70 (10.4%) | 0 (0.0%) |
| $1,000 to $1,499 | 106 (15.8%) | 8 (13.6%) |
| $1,500 to $1,999 | 57 (8.5%) | 18 (30.5%) |
| $2,000 to $2,499 | 21 (3.1%) | 0 (0.0%) |
| $2,500 to $2,999 | 8 (1.2%) | 0 (0.0%) |
| $3,000 or more | 126 (18.8%) | 0 (0.0%) |
| Total | 670 (100.0%) | 59 (100.0%) |
Physical Housing Characteristics in Garrett
Housing Structures in Garrett
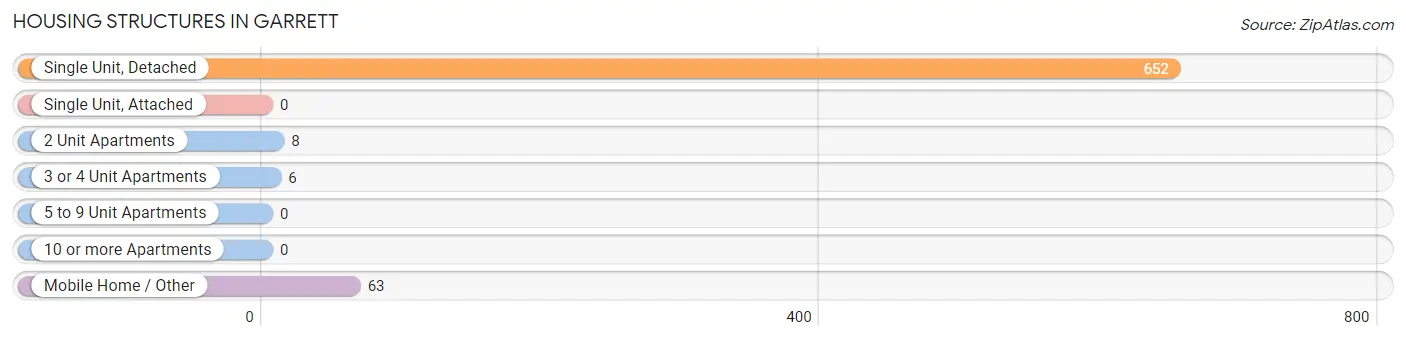
| Structure Type | # Housing Units | % Housing Units |
| Single Unit, Detached | 652 | 89.4% |
| Single Unit, Attached | 0 | 0.0% |
| 2 Unit Apartments | 8 | 1.1% |
| 3 or 4 Unit Apartments | 6 | 0.8% |
| 5 to 9 Unit Apartments | 0 | 0.0% |
| 10 or more Apartments | 0 | 0.0% |
| Mobile Home / Other | 63 | 8.6% |
| Total | 729 | 100.0% |
Housing Structures by Occupancy in Garrett
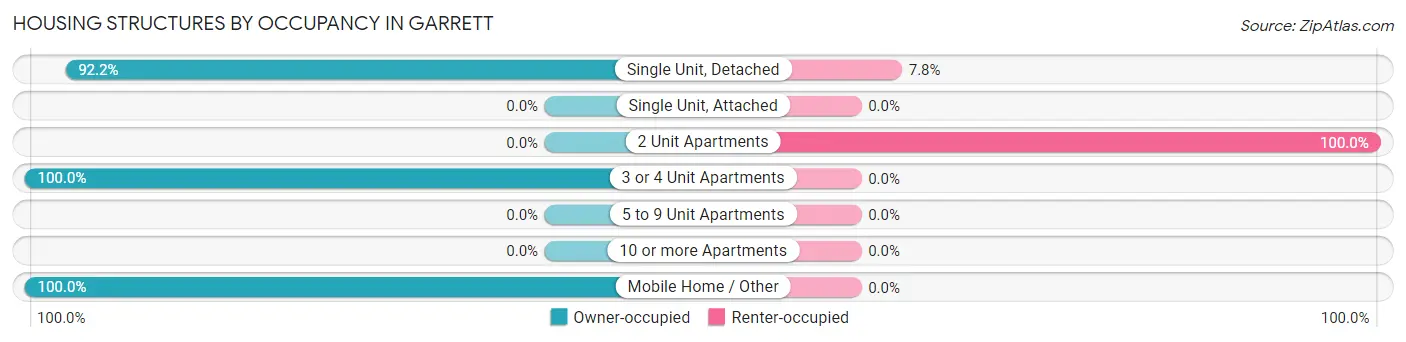
| Structure Type | Owner-occupied | Renter-occupied |
| Single Unit, Detached | 601 (92.2%) | 51 (7.8%) |
| Single Unit, Attached | 0 (0.0%) | 0 (0.0%) |
| 2 Unit Apartments | 0 (0.0%) | 8 (100.0%) |
| 3 or 4 Unit Apartments | 6 (100.0%) | 0 (0.0%) |
| 5 to 9 Unit Apartments | 0 (0.0%) | 0 (0.0%) |
| 10 or more Apartments | 0 (0.0%) | 0 (0.0%) |
| Mobile Home / Other | 63 (100.0%) | 0 (0.0%) |
| Total | 670 (91.9%) | 59 (8.1%) |
Housing Structures by Number of Rooms in Garrett
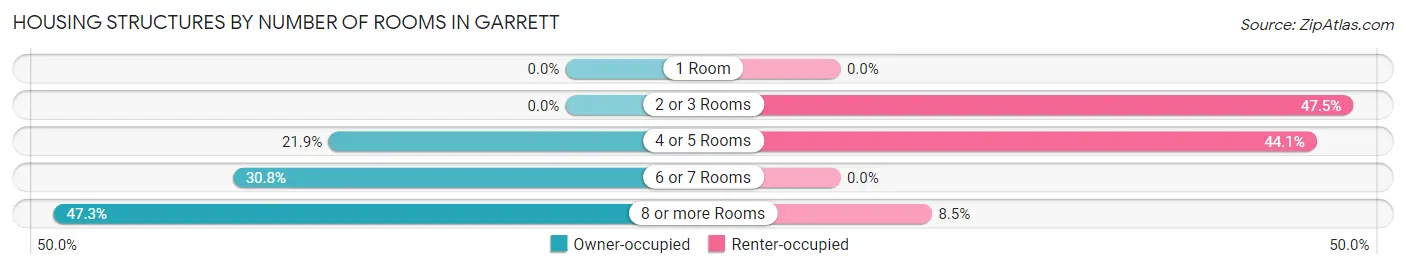
| Number of Rooms | Owner-occupied | Renter-occupied |
| 1 Room | 0 (0.0%) | 0 (0.0%) |
| 2 or 3 Rooms | 0 (0.0%) | 28 (47.5%) |
| 4 or 5 Rooms | 147 (21.9%) | 26 (44.1%) |
| 6 or 7 Rooms | 206 (30.7%) | 0 (0.0%) |
| 8 or more Rooms | 317 (47.3%) | 5 (8.5%) |
| Total | 670 (100.0%) | 59 (100.0%) |
Housing Structure by Heating Type in Garrett
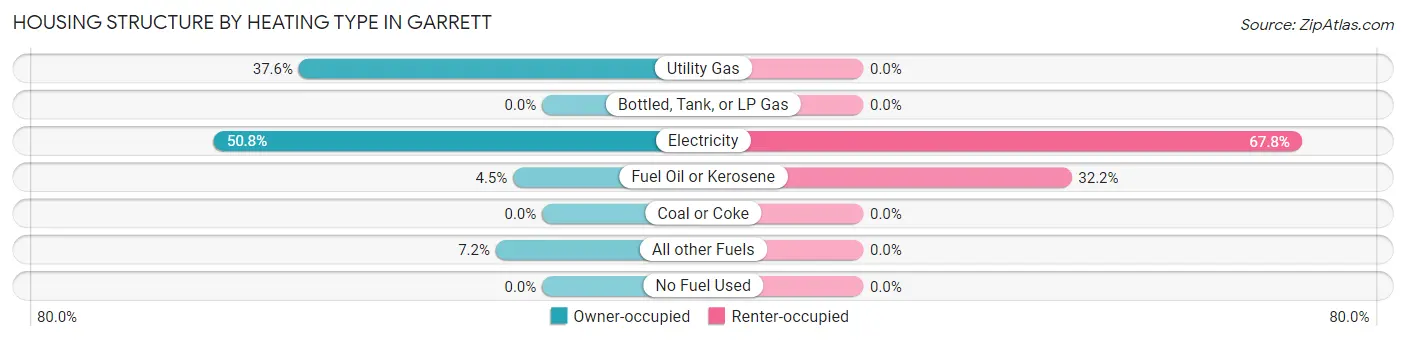
| Heating Type | Owner-occupied | Renter-occupied |
| Utility Gas | 252 (37.6%) | 0 (0.0%) |
| Bottled, Tank, or LP Gas | 0 (0.0%) | 0 (0.0%) |
| Electricity | 340 (50.7%) | 40 (67.8%) |
| Fuel Oil or Kerosene | 30 (4.5%) | 19 (32.2%) |
| Coal or Coke | 0 (0.0%) | 0 (0.0%) |
| All other Fuels | 48 (7.2%) | 0 (0.0%) |
| No Fuel Used | 0 (0.0%) | 0 (0.0%) |
| Total | 670 (100.0%) | 59 (100.0%) |
Household Vehicle Usage in Garrett
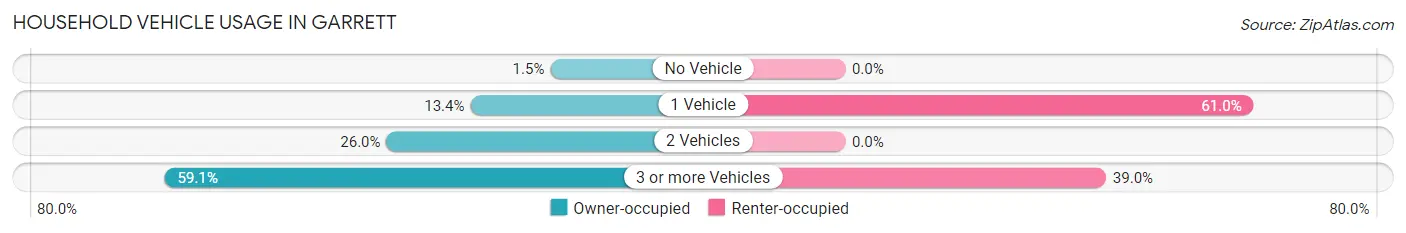
| Vehicles per Household | Owner-occupied | Renter-occupied |
| No Vehicle | 10 (1.5%) | 0 (0.0%) |
| 1 Vehicle | 90 (13.4%) | 36 (61.0%) |
| 2 Vehicles | 174 (26.0%) | 0 (0.0%) |
| 3 or more Vehicles | 396 (59.1%) | 23 (39.0%) |
| Total | 670 (100.0%) | 59 (100.0%) |
Real Estate & Mortgages in Garrett
Real Estate and Mortgage Overview in Garrett
| Characteristic | Without Mortgage | With Mortgage |
| Housing Units | 327 | 343 |
| Median Property Value | $349,200 | $419,200 |
| Median Household Income | $91,023 | $56 |
| Monthly Housing Costs | $596 | $126 |
| Real Estate Taxes | $3,667 | $0 |
Property Value by Mortgage Status in Garrett
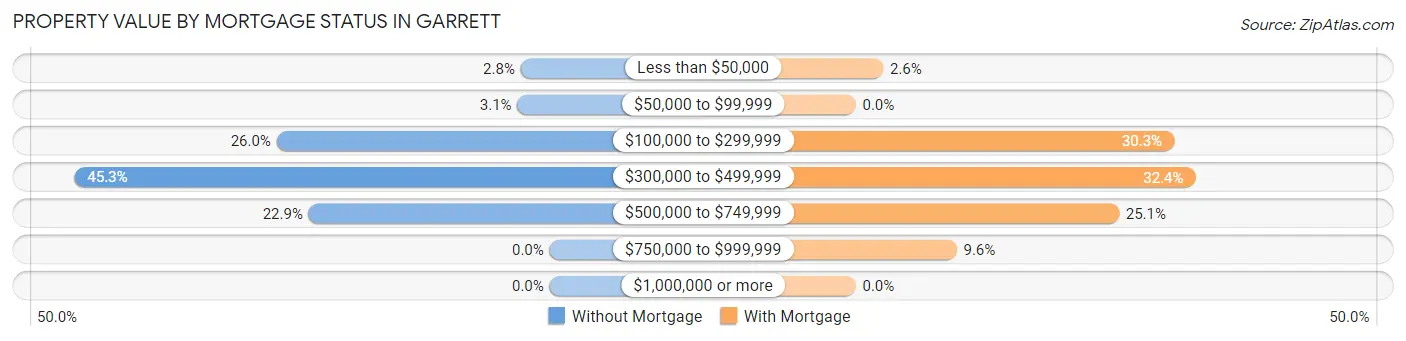
| Property Value | Without Mortgage | With Mortgage |
| Less than $50,000 | 9 (2.8%) | 9 (2.6%) |
| $50,000 to $99,999 | 10 (3.1%) | 0 (0.0%) |
| $100,000 to $299,999 | 85 (26.0%) | 104 (30.3%) |
| $300,000 to $499,999 | 148 (45.3%) | 111 (32.4%) |
| $500,000 to $749,999 | 75 (22.9%) | 86 (25.1%) |
| $750,000 to $999,999 | 0 (0.0%) | 33 (9.6%) |
| $1,000,000 or more | 0 (0.0%) | 0 (0.0%) |
| Total | 327 (100.0%) | 343 (100.0%) |
Household Income by Mortgage Status in Garrett
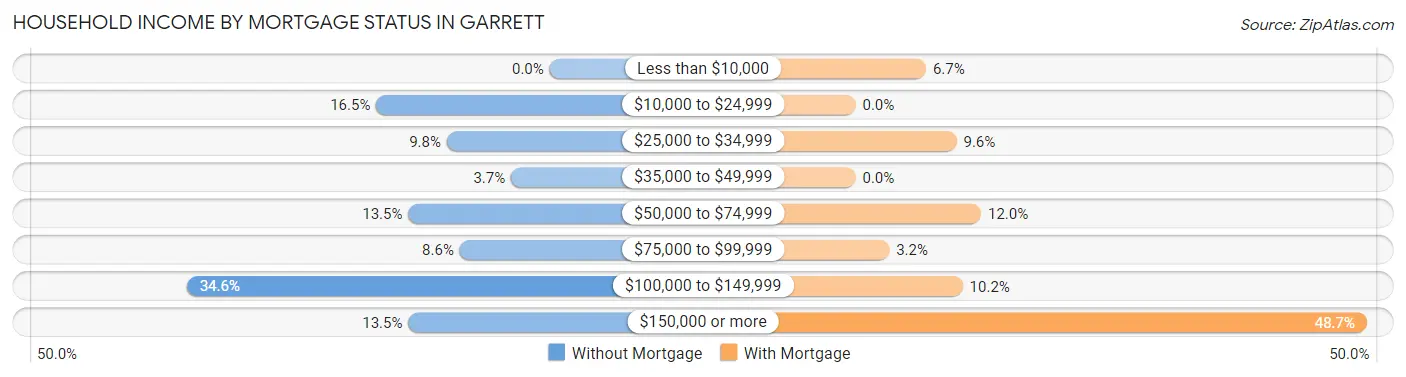
| Household Income | Without Mortgage | With Mortgage |
| Less than $10,000 | 0 (0.0%) | 23 (6.7%) |
| $10,000 to $24,999 | 54 (16.5%) | 0 (0.0%) |
| $25,000 to $34,999 | 32 (9.8%) | 33 (9.6%) |
| $35,000 to $49,999 | 12 (3.7%) | 0 (0.0%) |
| $50,000 to $74,999 | 44 (13.5%) | 41 (11.9%) |
| $75,000 to $99,999 | 28 (8.6%) | 11 (3.2%) |
| $100,000 to $149,999 | 113 (34.6%) | 35 (10.2%) |
| $150,000 or more | 44 (13.5%) | 167 (48.7%) |
| Total | 327 (100.0%) | 343 (100.0%) |
Property Value to Household Income Ratio in Garrett
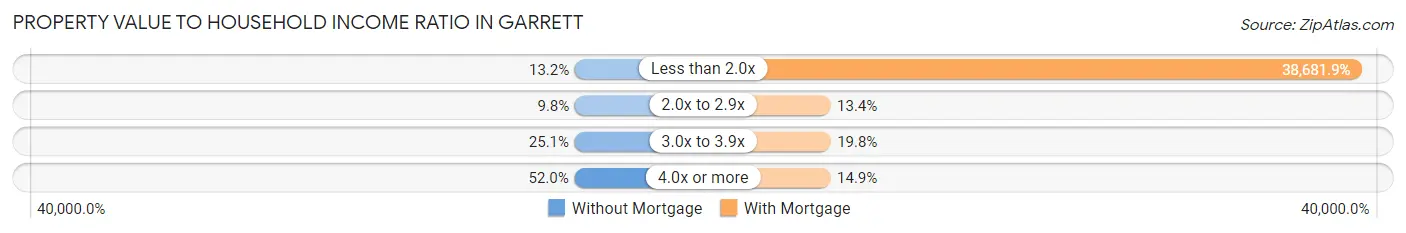
| Value-to-Income Ratio | Without Mortgage | With Mortgage |
| Less than 2.0x | 43 (13.2%) | 132,679 (38,681.9%) |
| 2.0x to 2.9x | 32 (9.8%) | 46 (13.4%) |
| 3.0x to 3.9x | 82 (25.1%) | 68 (19.8%) |
| 4.0x or more | 170 (52.0%) | 51 (14.9%) |
| Total | 327 (100.0%) | 343 (100.0%) |
Real Estate Taxes by Mortgage Status in Garrett
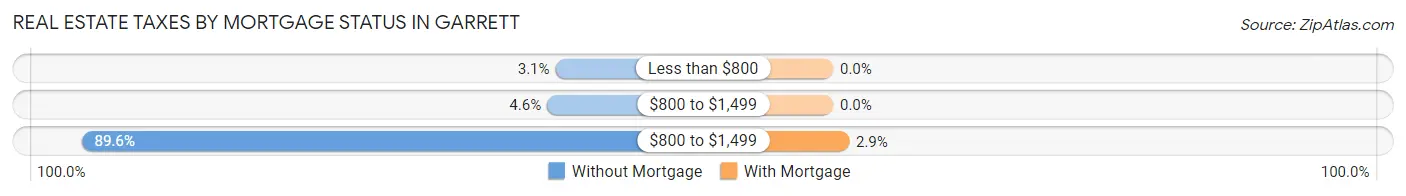
| Property Taxes | Without Mortgage | With Mortgage |
| Less than $800 | 10 (3.1%) | 0 (0.0%) |
| $800 to $1,499 | 15 (4.6%) | 0 (0.0%) |
| $800 to $1,499 | 293 (89.6%) | 10 (2.9%) |
| Total | 327 (100.0%) | 343 (100.0%) |
Health & Disability in Garrett
Health Insurance Coverage by Age in Garrett
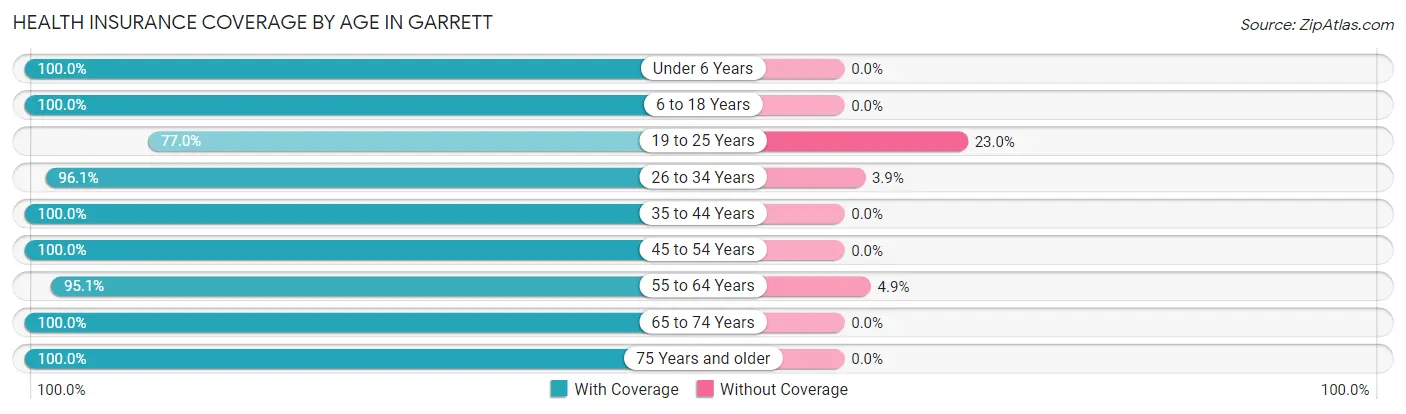
| Age Bracket | With Coverage | Without Coverage |
| Under 6 Years | 52 (100.0%) | 0 (0.0%) |
| 6 to 18 Years | 244 (100.0%) | 0 (0.0%) |
| 19 to 25 Years | 87 (77.0%) | 26 (23.0%) |
| 26 to 34 Years | 199 (96.1%) | 8 (3.9%) |
| 35 to 44 Years | 75 (100.0%) | 0 (0.0%) |
| 45 to 54 Years | 180 (100.0%) | 0 (0.0%) |
| 55 to 64 Years | 464 (95.1%) | 24 (4.9%) |
| 65 to 74 Years | 259 (100.0%) | 0 (0.0%) |
| 75 Years and older | 251 (100.0%) | 0 (0.0%) |
| Total | 1,811 (96.9%) | 58 (3.1%) |
Health Insurance Coverage by Citizenship Status in Garrett
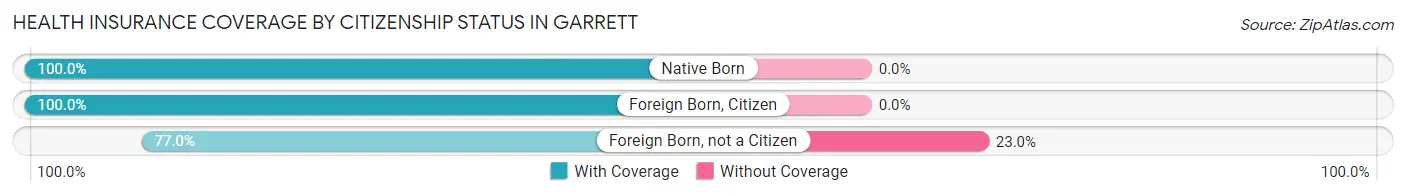
| Citizenship Status | With Coverage | Without Coverage |
| Native Born | 52 (100.0%) | 0 (0.0%) |
| Foreign Born, Citizen | 244 (100.0%) | 0 (0.0%) |
| Foreign Born, not a Citizen | 87 (77.0%) | 26 (23.0%) |
Health Insurance Coverage by Household Income in Garrett
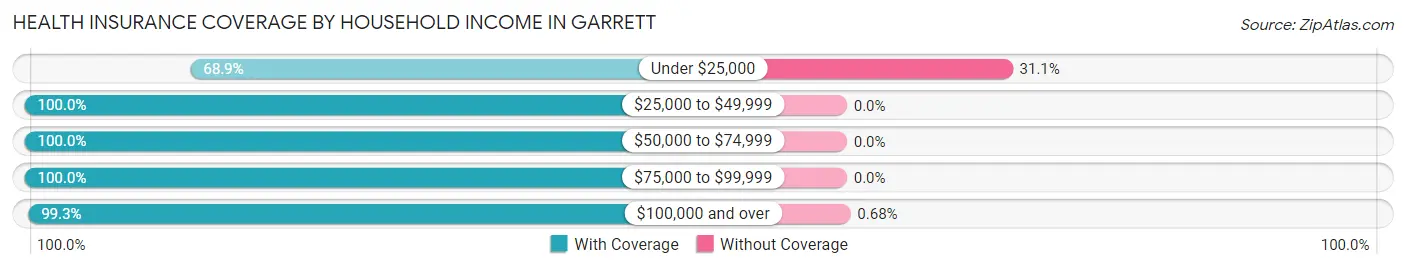
| Household Income | With Coverage | Without Coverage |
| Under $25,000 | 111 (68.9%) | 50 (31.1%) |
| $25,000 to $49,999 | 177 (100.0%) | 0 (0.0%) |
| $50,000 to $74,999 | 180 (100.0%) | 0 (0.0%) |
| $75,000 to $99,999 | 181 (100.0%) | 0 (0.0%) |
| $100,000 and over | 1,162 (99.3%) | 8 (0.7%) |
Public vs Private Health Insurance Coverage by Age in Garrett
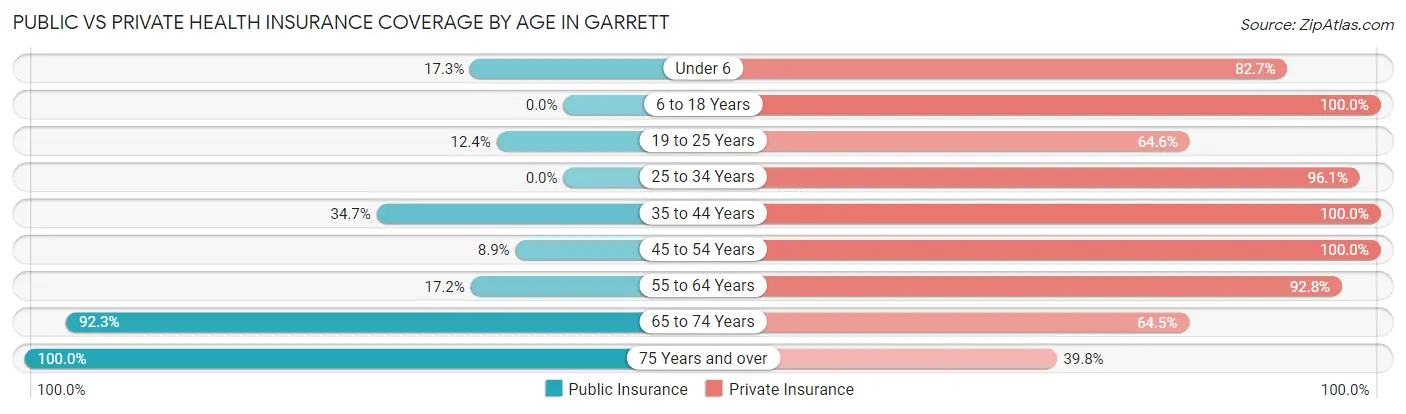
| Age Bracket | Public Insurance | Private Insurance |
| Under 6 | 9 (17.3%) | 43 (82.7%) |
| 6 to 18 Years | 0 (0.0%) | 244 (100.0%) |
| 19 to 25 Years | 14 (12.4%) | 73 (64.6%) |
| 25 to 34 Years | 0 (0.0%) | 199 (96.1%) |
| 35 to 44 Years | 26 (34.7%) | 75 (100.0%) |
| 45 to 54 Years | 16 (8.9%) | 180 (100.0%) |
| 55 to 64 Years | 84 (17.2%) | 453 (92.8%) |
| 65 to 74 Years | 239 (92.3%) | 167 (64.5%) |
| 75 Years and over | 251 (100.0%) | 100 (39.8%) |
| Total | 639 (34.2%) | 1,534 (82.1%) |
Disability Status by Sex by Age in Garrett
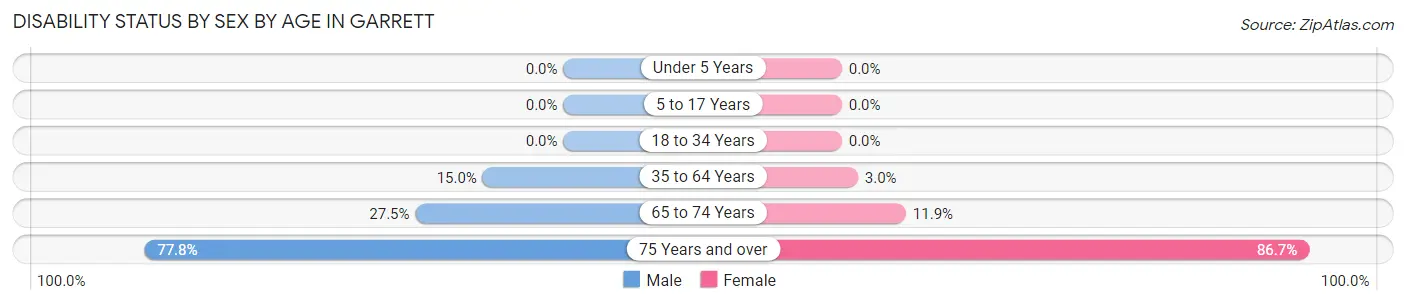
| Age Bracket | Male | Female |
| Under 5 Years | 0 (0.0%) | 0 (0.0%) |
| 5 to 17 Years | 0 (0.0%) | 0 (0.0%) |
| 18 to 34 Years | 0 (0.0%) | 0 (0.0%) |
| 35 to 64 Years | 56 (15.0%) | 11 (3.0%) |
| 65 to 74 Years | 25 (27.5%) | 20 (11.9%) |
| 75 Years and over | 84 (77.8%) | 124 (86.7%) |
Disability Class by Sex by Age in Garrett
Disability Class: Hearing Difficulty
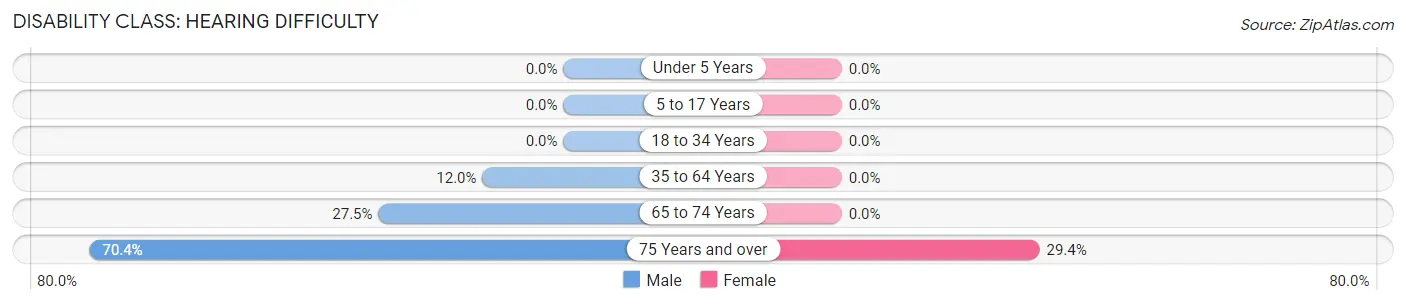
| Age Bracket | Male | Female |
| Under 5 Years | 0 (0.0%) | 0 (0.0%) |
| 5 to 17 Years | 0 (0.0%) | 0 (0.0%) |
| 18 to 34 Years | 0 (0.0%) | 0 (0.0%) |
| 35 to 64 Years | 45 (12.0%) | 0 (0.0%) |
| 65 to 74 Years | 25 (27.5%) | 0 (0.0%) |
| 75 Years and over | 76 (70.4%) | 42 (29.4%) |
Disability Class: Vision Difficulty
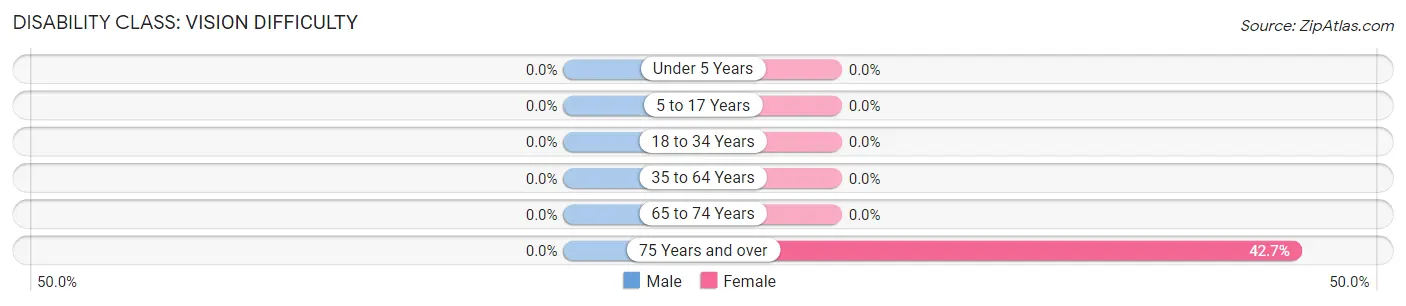
| Age Bracket | Male | Female |
| Under 5 Years | 0 (0.0%) | 0 (0.0%) |
| 5 to 17 Years | 0 (0.0%) | 0 (0.0%) |
| 18 to 34 Years | 0 (0.0%) | 0 (0.0%) |
| 35 to 64 Years | 0 (0.0%) | 0 (0.0%) |
| 65 to 74 Years | 0 (0.0%) | 0 (0.0%) |
| 75 Years and over | 0 (0.0%) | 61 (42.7%) |
Disability Class: Cognitive Difficulty
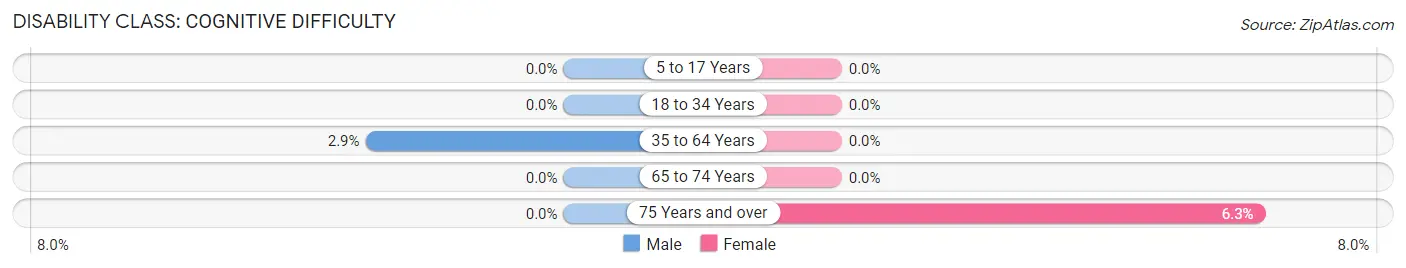
| Age Bracket | Male | Female |
| 5 to 17 Years | 0 (0.0%) | 0 (0.0%) |
| 18 to 34 Years | 0 (0.0%) | 0 (0.0%) |
| 35 to 64 Years | 11 (2.9%) | 0 (0.0%) |
| 65 to 74 Years | 0 (0.0%) | 0 (0.0%) |
| 75 Years and over | 0 (0.0%) | 9 (6.3%) |
Disability Class: Ambulatory Difficulty
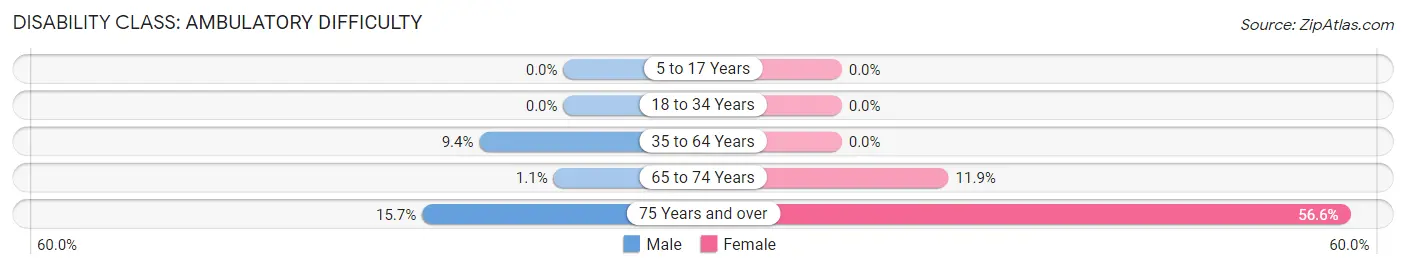
| Age Bracket | Male | Female |
| 5 to 17 Years | 0 (0.0%) | 0 (0.0%) |
| 18 to 34 Years | 0 (0.0%) | 0 (0.0%) |
| 35 to 64 Years | 35 (9.4%) | 0 (0.0%) |
| 65 to 74 Years | 1 (1.1%) | 20 (11.9%) |
| 75 Years and over | 17 (15.7%) | 81 (56.6%) |
Disability Class: Self-Care Difficulty
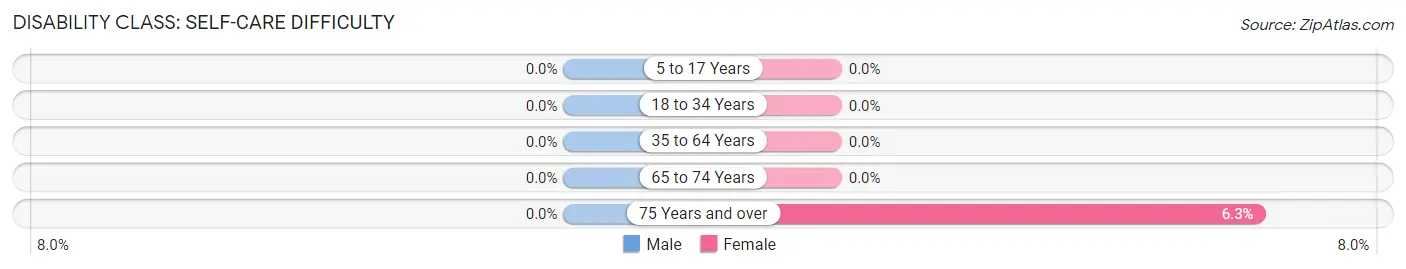
| Age Bracket | Male | Female |
| 5 to 17 Years | 0 (0.0%) | 0 (0.0%) |
| 18 to 34 Years | 0 (0.0%) | 0 (0.0%) |
| 35 to 64 Years | 0 (0.0%) | 0 (0.0%) |
| 65 to 74 Years | 0 (0.0%) | 0 (0.0%) |
| 75 Years and over | 0 (0.0%) | 9 (6.3%) |
Technology Access in Garrett
Computing Device Access in Garrett
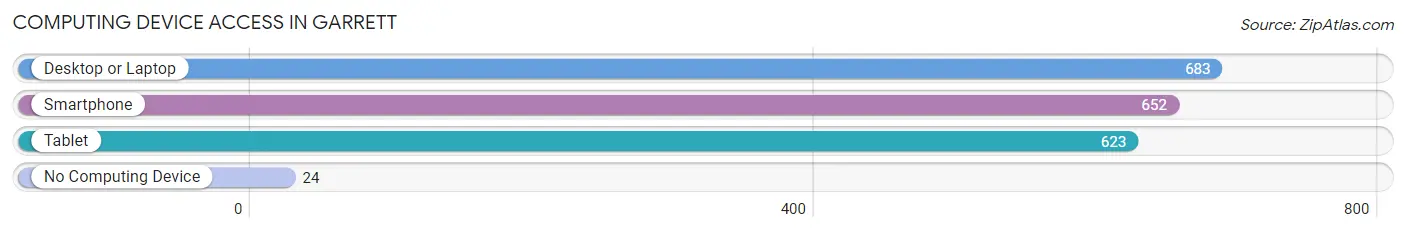
| Device Type | # Households | % Households |
| Desktop or Laptop | 683 | 93.7% |
| Smartphone | 652 | 89.4% |
| Tablet | 623 | 85.5% |
| No Computing Device | 24 | 3.3% |
| Total | 729 | 100.0% |
Internet Access in Garrett
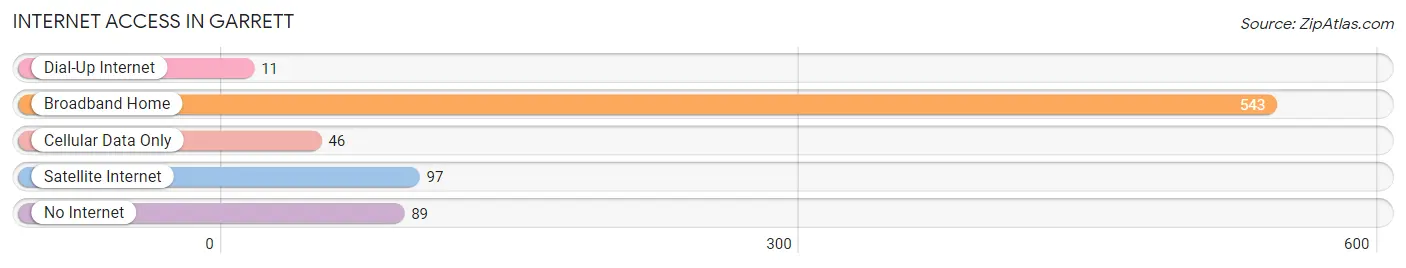
| Internet Type | # Households | % Households |
| Dial-Up Internet | 11 | 1.5% |
| Broadband Home | 543 | 74.5% |
| Cellular Data Only | 46 | 6.3% |
| Satellite Internet | 97 | 13.3% |
| No Internet | 89 | 12.2% |
| Total | 729 | 100.0% |
Garrett Summary
Garrett is a small town located in the state of Washington, United States. It is situated in the Cascade Mountains, about 30 miles east of Seattle. The town has a population of approximately 1,500 people and is known for its rural charm and scenic beauty.
Geography
Garrett is located in the Cascade Mountains, about 30 miles east of Seattle. The town is situated at an elevation of 1,000 feet and is surrounded by lush forests and rolling hills. The town is located in King County and is part of the Seattle-Tacoma-Bellevue metropolitan area. The nearest major city is Redmond, which is about 20 miles away.
The climate in Garrett is mild and temperate. Summers are warm and dry, while winters are cold and wet. The average annual temperature is around 50 degrees Fahrenheit. The average annual precipitation is around 40 inches.
Economy
Garrett’s economy is largely based on tourism and agriculture. The town is home to several small businesses, including restaurants, shops, and galleries. The town is also home to a number of wineries and vineyards, which attract visitors from all over the world.
Agriculture is an important part of the local economy. The town is home to several farms, which produce a variety of fruits and vegetables. The town is also home to several nurseries, which specialize in growing flowers and plants.
Demographics
Garrett has a population of approximately 1,500 people. The town is predominantly white, with a small percentage of African Americans, Asians, and Hispanics. The median household income is around $50,000. The town has a low unemployment rate and a high rate of homeownership.
Education
Garrett is served by the Northshore School District. The town is home to several elementary schools, a middle school, and a high school. The town also has a public library and a community college.
Conclusion
Garrett is a small town located in the Cascade Mountains of Washington. The town has a population of approximately 1,500 people and is known for its rural charm and scenic beauty. The town’s economy is largely based on tourism and agriculture. The town is served by the Northshore School District and has a low unemployment rate and a high rate of homeownership.
Common Questions
What is Per Capita Income in Garrett?
Per Capita income in Garrett is $40,427.
What is the Median Family Income in Garrett?
Median Family Income in Garrett is $109,303.
What is the Median Household income in Garrett?
Median Household Income in Garrett is $108,094.
What is Income or Wage Gap in Garrett?
Income or Wage Gap in Garrett is 31.1%.
Women in Garrett earn 68.9 cents for every dollar earned by a man.
What is Inequality or Gini Index in Garrett?
Inequality or Gini Index in Garrett is 0.34.
What is the Total Population of Garrett?
Total Population of Garrett is 1,873.
What is the Total Male Population of Garrett?
Total Male Population of Garrett is 904.
What is the Total Female Population of Garrett?
Total Female Population of Garrett is 969.
What is the Ratio of Males per 100 Females in Garrett?
There are 93.29 Males per 100 Females in Garrett.
What is the Ratio of Females per 100 Males in Garrett?
There are 107.19 Females per 100 Males in Garrett.
What is the Median Population Age in Garrett?
Median Population Age in Garrett is 57.1 Years.
What is the Average Family Size in Garrett
Average Family Size in Garrett is 2.8 People.
What is the Average Household Size in Garrett
Average Household Size in Garrett is 2.6 People.
How Large is the Labor Force in Garrett?
There are 887 People in the Labor Forcein in Garrett.
What is the Percentage of People in the Labor Force in Garrett?
53.9% of People are in the Labor Force in Garrett.
What is the Unemployment Rate in Garrett?
Unemployment Rate in Garrett is 7.3%.