Lake Placid, NY Map & Demographics
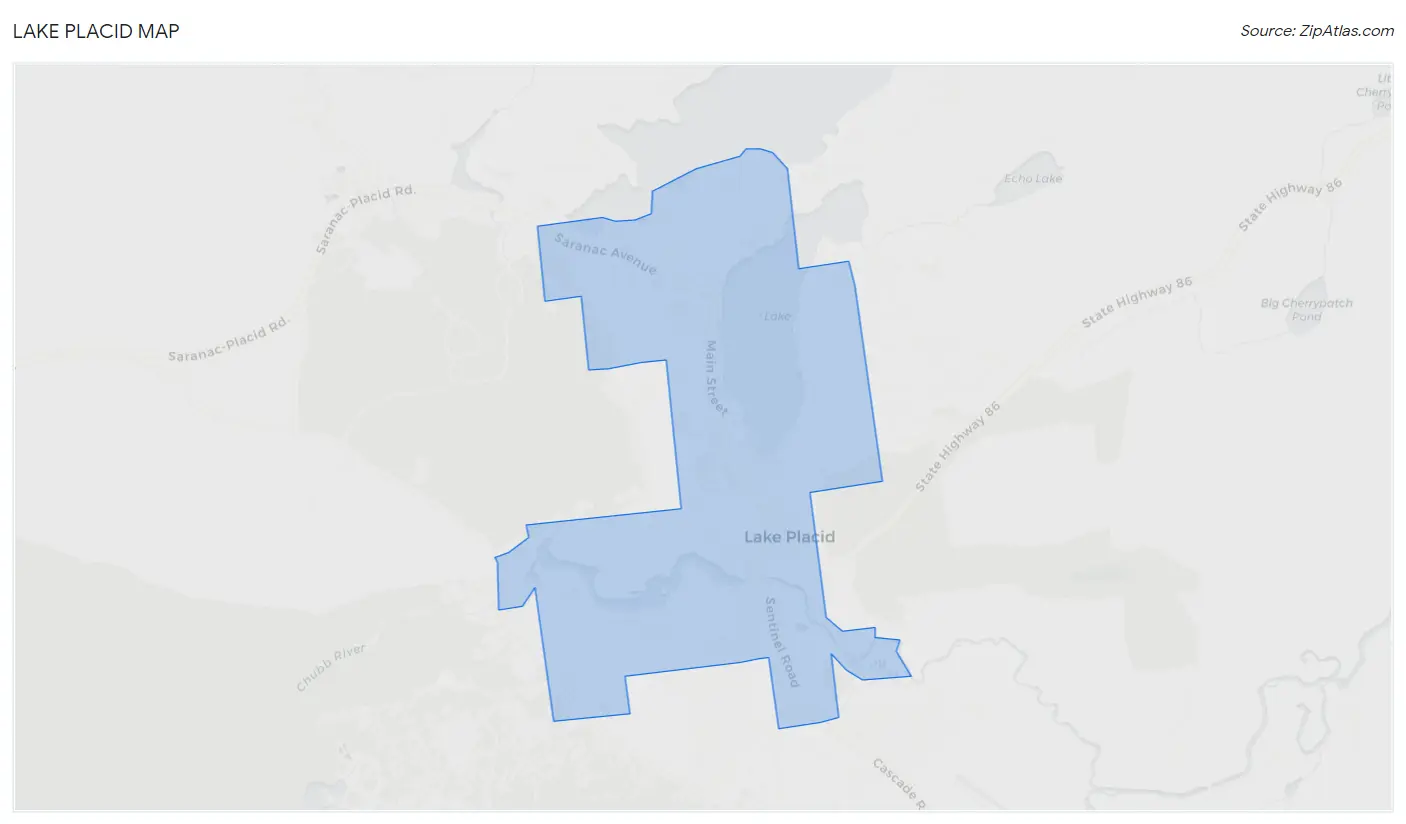
Lake Placid Map
Lake Placid Overview
$42,199
PER CAPITA INCOME
$113,414
AVG FAMILY INCOME
$53,475
AVG HOUSEHOLD INCOME
49.0%
WAGE / INCOME GAP [ % ]
51.0¢/ $1
WAGE / INCOME GAP [ $ ]
0.46
INEQUALITY / GINI INDEX
2,280
TOTAL POPULATION
982
MALE POPULATION
1,298
FEMALE POPULATION
75.65
MALES / 100 FEMALES
132.18
FEMALES / 100 MALES
51.2
MEDIAN AGE
2.5
AVG FAMILY SIZE
1.7
AVG HOUSEHOLD SIZE
1,311
LABOR FORCE [ PEOPLE ]
66.8%
PERCENT IN LABOR FORCE
Lake Placid Zip Codes
Lake Placid Area Codes
Income in Lake Placid
Income Overview in Lake Placid
Per Capita Income in Lake Placid is $42,199, while median incomes of families and households are $113,414 and $53,475 respectively.
| Characteristic | Number | Measure |
| Per Capita Income | 2,280 | $42,199 |
| Median Family Income | 483 | $113,414 |
| Mean Family Income | 483 | $116,132 |
| Median Household Income | 1,307 | $53,475 |
| Mean Household Income | 1,307 | $73,326 |
| Income Deficit | 483 | $0 |
| Wage / Income Gap (%) | 2,280 | 49.03% |
| Wage / Income Gap ($) | 2,280 | 50.97¢ per $1 |
| Gini / Inequality Index | 2,280 | 0.46 |
Earnings by Sex in Lake Placid
Average Earnings in Lake Placid are $37,324, $53,000 for men and $27,014 for women, a difference of 49.0%.
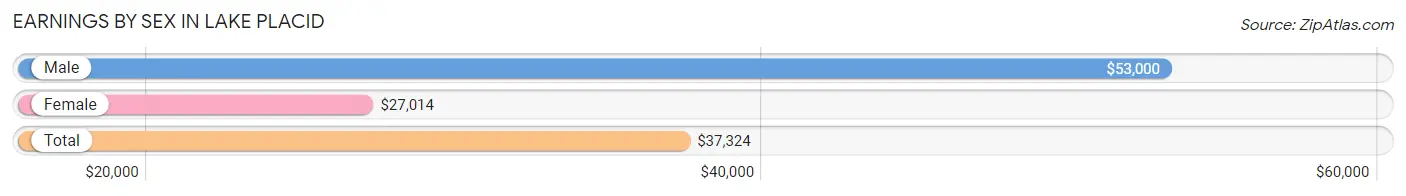
| Sex | Number | Average Earnings |
| Male | 666 (48.2%) | $53,000 |
| Female | 715 (51.8%) | $27,014 |
| Total | 1,381 (100.0%) | $37,324 |
Earnings by Sex by Income Bracket in Lake Placid
The most common earnings brackets in Lake Placid are $65,000 to $74,999 for men (170 | 25.5%) and $2,499 or less for women (122 | 17.1%).
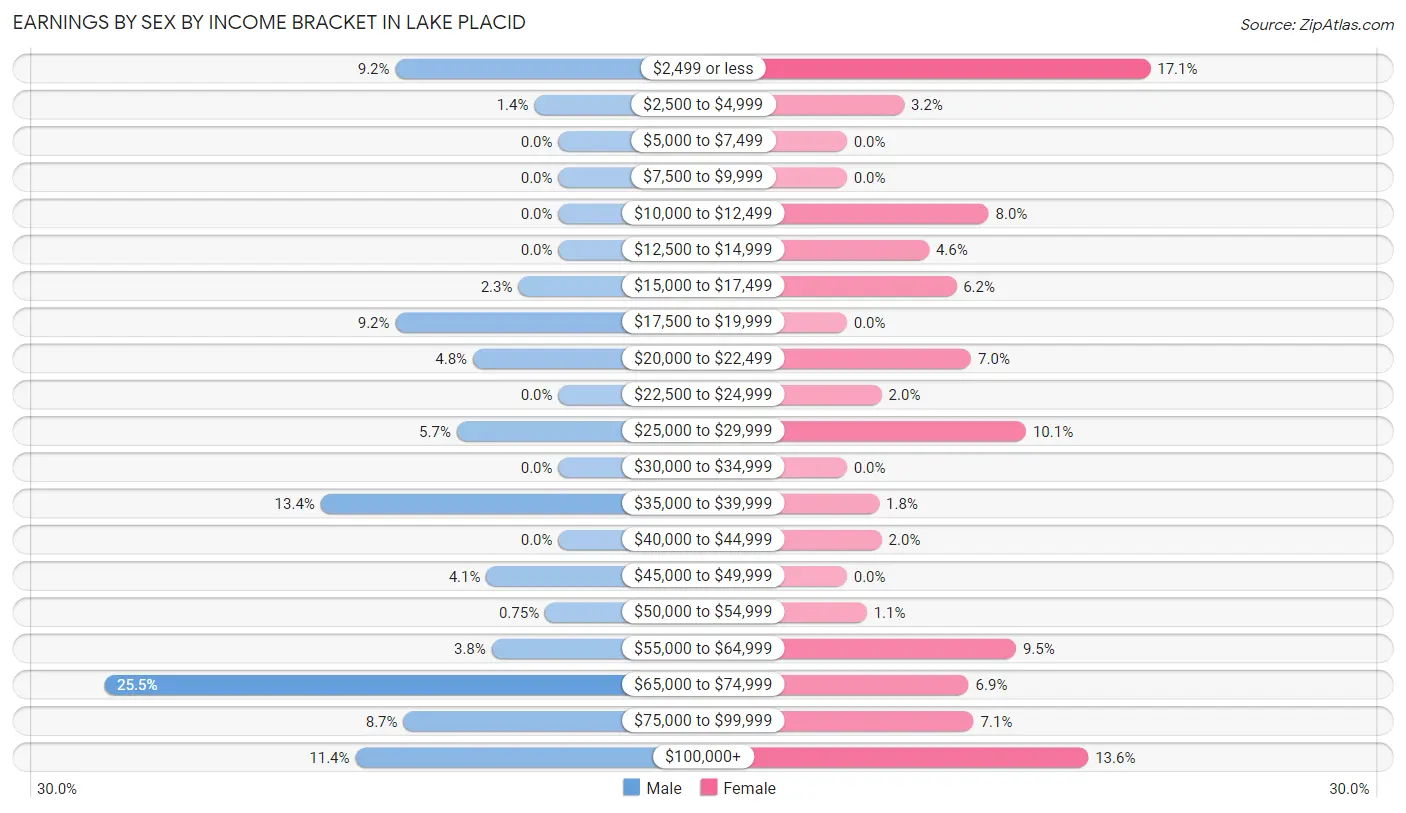
| Income | Male | Female |
| $2,499 or less | 61 (9.2%) | 122 (17.1%) |
| $2,500 to $4,999 | 9 (1.3%) | 23 (3.2%) |
| $5,000 to $7,499 | 0 (0.0%) | 0 (0.0%) |
| $7,500 to $9,999 | 0 (0.0%) | 0 (0.0%) |
| $10,000 to $12,499 | 0 (0.0%) | 57 (8.0%) |
| $12,500 to $14,999 | 0 (0.0%) | 33 (4.6%) |
| $15,000 to $17,499 | 15 (2.2%) | 44 (6.1%) |
| $17,500 to $19,999 | 61 (9.2%) | 0 (0.0%) |
| $20,000 to $22,499 | 32 (4.8%) | 50 (7.0%) |
| $22,500 to $24,999 | 0 (0.0%) | 14 (2.0%) |
| $25,000 to $29,999 | 38 (5.7%) | 72 (10.1%) |
| $30,000 to $34,999 | 0 (0.0%) | 0 (0.0%) |
| $35,000 to $39,999 | 89 (13.4%) | 13 (1.8%) |
| $40,000 to $44,999 | 0 (0.0%) | 14 (2.0%) |
| $45,000 to $49,999 | 27 (4.1%) | 0 (0.0%) |
| $50,000 to $54,999 | 5 (0.7%) | 8 (1.1%) |
| $55,000 to $64,999 | 25 (3.7%) | 68 (9.5%) |
| $65,000 to $74,999 | 170 (25.5%) | 49 (6.9%) |
| $75,000 to $99,999 | 58 (8.7%) | 51 (7.1%) |
| $100,000+ | 76 (11.4%) | 97 (13.6%) |
| Total | 666 (100.0%) | 715 (100.0%) |
Earnings by Sex by Educational Attainment in Lake Placid
Average earnings in Lake Placid are $65,125 for men and $38,846 for women, a difference of 40.4%. Men with an educational attainment of college or associate's degree enjoy the highest average annual earnings of $73,228, while those with high school diploma education earn the least with $65,417. Women with an educational attainment of bachelor's degree earn the most with the average annual earnings of $75,708, while those with college or associate's degree education have the smallest earnings of $21,923.
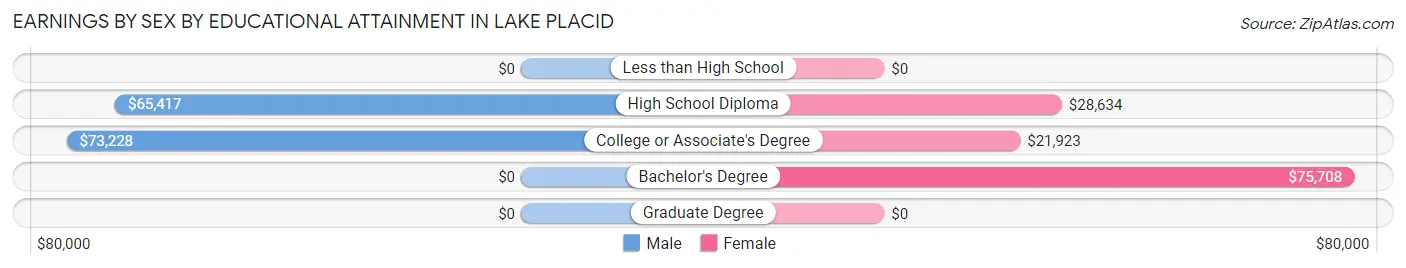
| Educational Attainment | Male Income | Female Income |
| Less than High School | - | - |
| High School Diploma | $65,417 | $28,634 |
| College or Associate's Degree | $73,228 | $21,923 |
| Bachelor's Degree | - | - |
| Graduate Degree | - | - |
| Total | $65,125 | $38,846 |
Family Income in Lake Placid
Family Income Brackets in Lake Placid
According to the Lake Placid family income data, there are 157 families falling into the $100,000 to $149,999 income range, which is the most common income bracket and makes up 32.5% of all families.
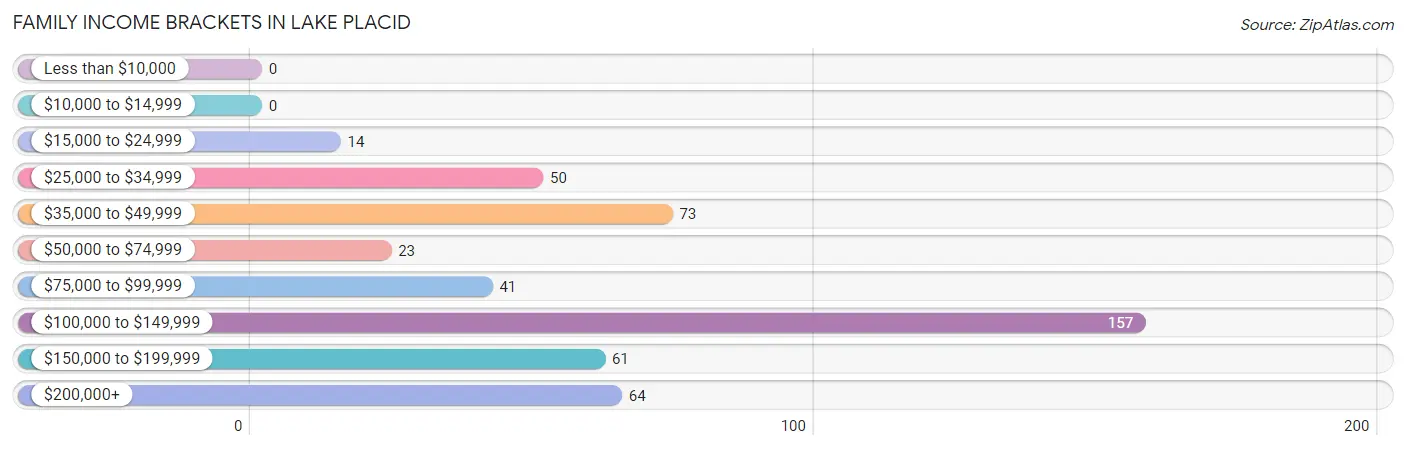
| Income Bracket | # Families | % Families |
| Less than $10,000 | 0 | 0.0% |
| $10,000 to $14,999 | 0 | 0.0% |
| $15,000 to $24,999 | 14 | 2.9% |
| $25,000 to $34,999 | 50 | 10.4% |
| $35,000 to $49,999 | 73 | 15.1% |
| $50,000 to $74,999 | 23 | 4.8% |
| $75,000 to $99,999 | 41 | 8.5% |
| $100,000 to $149,999 | 157 | 32.5% |
| $150,000 to $199,999 | 61 | 12.6% |
| $200,000+ | 64 | 13.3% |
Family Income by Famaliy Size in Lake Placid
2-person families (308 | 63.8%) account for the highest median family income in Lake Placid with $114,142 per family, while 2-person families (308 | 63.8%) have the highest median income of $57,071 per family member.
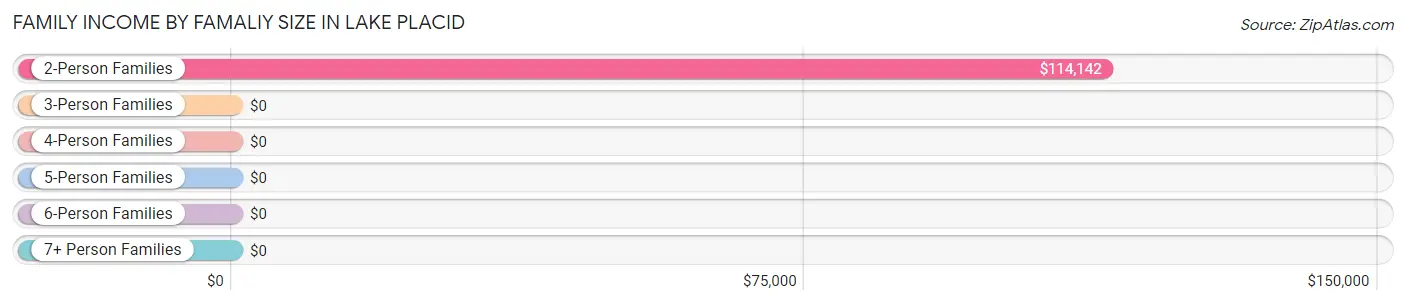
| Income Bracket | # Families | Median Income |
| 2-Person Families | 308 (63.8%) | $114,142 |
| 3-Person Families | 122 (25.3%) | $0 |
| 4-Person Families | 20 (4.1%) | $0 |
| 5-Person Families | 9 (1.9%) | $0 |
| 6-Person Families | 24 (5.0%) | $0 |
| 7+ Person Families | 0 (0.0%) | $0 |
| Total | 483 (100.0%) | $113,414 |
Family Income by Number of Earners in Lake Placid
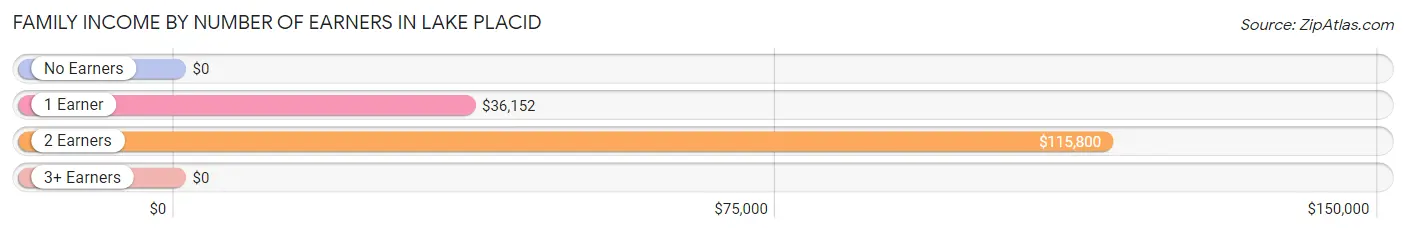
| Number of Earners | # Families | Median Income |
| No Earners | 56 (11.6%) | $0 |
| 1 Earner | 187 (38.7%) | $36,152 |
| 2 Earners | 240 (49.7%) | $115,800 |
| 3+ Earners | 0 (0.0%) | $0 |
| Total | 483 (100.0%) | $113,414 |
Household Income in Lake Placid
Household Income Brackets in Lake Placid
With 265 households falling in the category, the $100,000 to $149,999 income range is the most frequent in Lake Placid, accounting for 20.3% of all households. In contrast, only 61 households (4.7%) fall into the $150,000 to $199,999 income bracket, making it the least populous group.
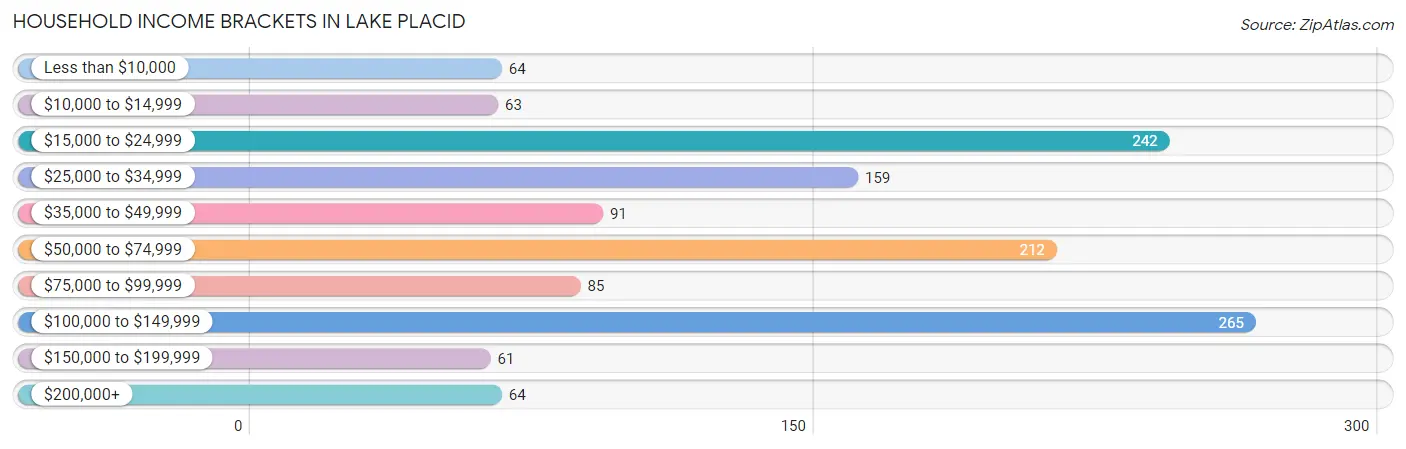
| Income Bracket | # Households | % Households |
| Less than $10,000 | 64 | 4.9% |
| $10,000 to $14,999 | 63 | 4.8% |
| $15,000 to $24,999 | 242 | 18.5% |
| $25,000 to $34,999 | 159 | 12.2% |
| $35,000 to $49,999 | 91 | 7.0% |
| $50,000 to $74,999 | 212 | 16.2% |
| $75,000 to $99,999 | 85 | 6.5% |
| $100,000 to $149,999 | 265 | 20.3% |
| $150,000 to $199,999 | 61 | 4.7% |
| $200,000+ | 64 | 4.9% |
Household Income by Householder Age in Lake Placid
The median household income in Lake Placid is $53,475, with the highest median household income of $80,893 found in the 45 to 64 years age bracket for the primary householder. A total of 666 households (51.0%) fall into this category. Meanwhile, the 15 to 24 years age bracket for the primary householder has the lowest median household income of $4,881, with 54 households (4.1%) in this group.
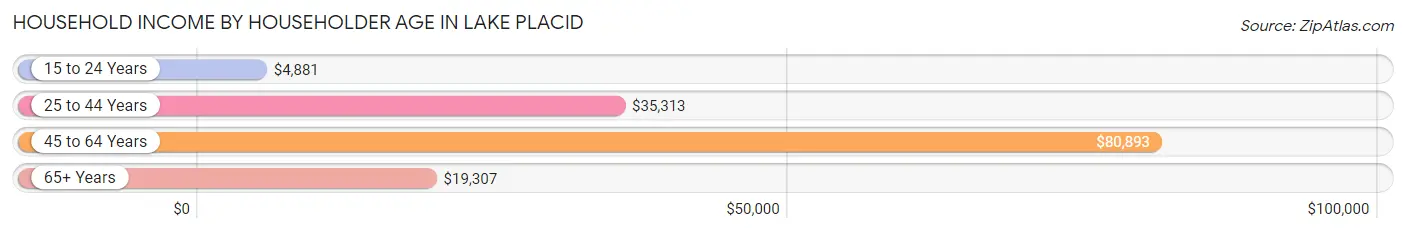
| Income Bracket | # Households | Median Income |
| 15 to 24 Years | 54 (4.1%) | $4,881 |
| 25 to 44 Years | 260 (19.9%) | $35,313 |
| 45 to 64 Years | 666 (51.0%) | $80,893 |
| 65+ Years | 327 (25.0%) | $19,307 |
| Total | 1,307 (100.0%) | $53,475 |
Poverty in Lake Placid
Income Below Poverty by Sex and Age in Lake Placid
With 8.3% poverty level for males and 14.8% for females among the residents of Lake Placid, 18 to 24 year old males and 18 to 24 year old females are the most vulnerable to poverty, with 61 males (100.0%) and 105 females (93.8%) in their respective age groups living below the poverty level.
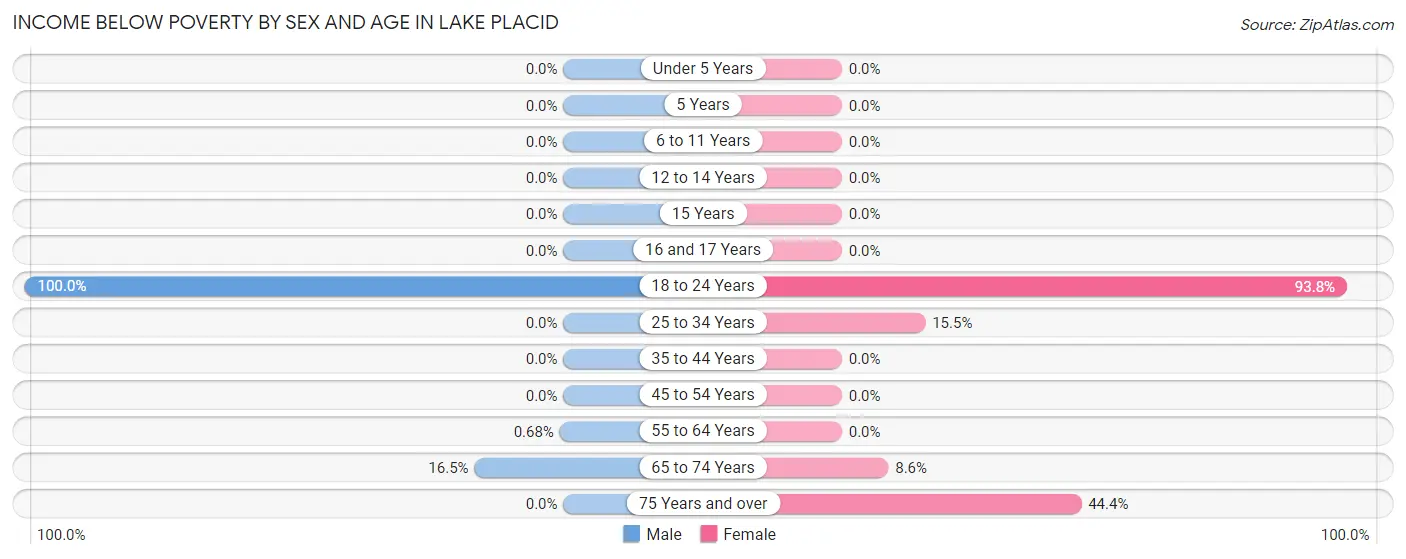
| Age Bracket | Male | Female |
| Under 5 Years | 0 (0.0%) | 0 (0.0%) |
| 5 Years | 0 (0.0%) | 0 (0.0%) |
| 6 to 11 Years | 0 (0.0%) | 0 (0.0%) |
| 12 to 14 Years | 0 (0.0%) | 0 (0.0%) |
| 15 Years | 0 (0.0%) | 0 (0.0%) |
| 16 and 17 Years | 0 (0.0%) | 0 (0.0%) |
| 18 to 24 Years | 61 (100.0%) | 105 (93.8%) |
| 25 to 34 Years | 0 (0.0%) | 35 (15.5%) |
| 35 to 44 Years | 0 (0.0%) | 0 (0.0%) |
| 45 to 54 Years | 0 (0.0%) | 0 (0.0%) |
| 55 to 64 Years | 2 (0.7%) | 0 (0.0%) |
| 65 to 74 Years | 18 (16.5%) | 17 (8.6%) |
| 75 Years and over | 0 (0.0%) | 32 (44.4%) |
| Total | 81 (8.3%) | 189 (14.8%) |
Income Above Poverty by Sex and Age in Lake Placid
According to the poverty statistics in Lake Placid, males aged 6 to 11 years and females aged under 5 years are the age groups that are most secure financially, with 100.0% of males and 100.0% of females in these age groups living above the poverty line.
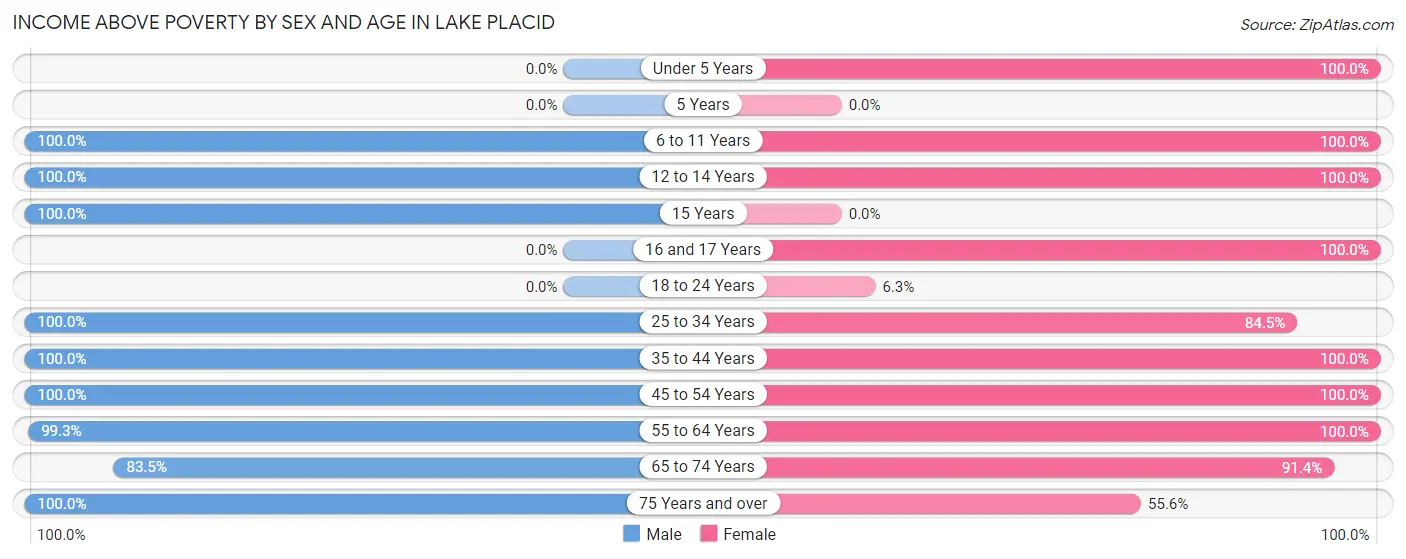
| Age Bracket | Male | Female |
| Under 5 Years | 0 (0.0%) | 70 (100.0%) |
| 5 Years | 0 (0.0%) | 0 (0.0%) |
| 6 to 11 Years | 52 (100.0%) | 86 (100.0%) |
| 12 to 14 Years | 55 (100.0%) | 20 (100.0%) |
| 15 Years | 35 (100.0%) | 0 (0.0%) |
| 16 and 17 Years | 0 (0.0%) | 4 (100.0%) |
| 18 to 24 Years | 0 (0.0%) | 7 (6.2%) |
| 25 to 34 Years | 111 (100.0%) | 191 (84.5%) |
| 35 to 44 Years | 35 (100.0%) | 137 (100.0%) |
| 45 to 54 Years | 178 (100.0%) | 136 (100.0%) |
| 55 to 64 Years | 294 (99.3%) | 217 (100.0%) |
| 65 to 74 Years | 91 (83.5%) | 180 (91.4%) |
| 75 Years and over | 50 (100.0%) | 40 (55.6%) |
| Total | 901 (91.7%) | 1,088 (85.2%) |
Income Below Poverty Among Married-Couple Families in Lake Placid
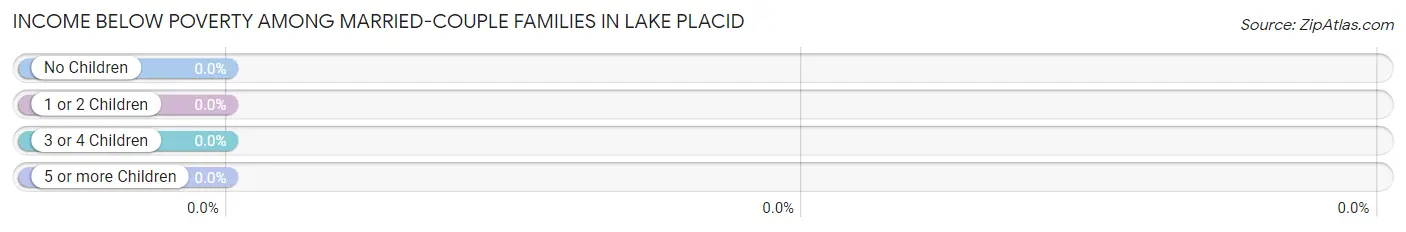
| Children | Above Poverty | Below Poverty |
| No Children | 226 (100.0%) | 0 (0.0%) |
| 1 or 2 Children | 114 (100.0%) | 0 (0.0%) |
| 3 or 4 Children | 33 (100.0%) | 0 (0.0%) |
| 5 or more Children | 0 (0.0%) | 0 (0.0%) |
| Total | 373 (100.0%) | 0 (0.0%) |
Income Below Poverty Among Single-Parent Households in Lake Placid
| Children | Single Father | Single Mother |
| No Children | 0 (0.0%) | 0 (0.0%) |
| 1 or 2 Children | 0 (0.0%) | 0 (0.0%) |
| 3 or 4 Children | 0 (0.0%) | 0 (0.0%) |
| 5 or more Children | 0 (0.0%) | 0 (0.0%) |
| Total | 0 (0.0%) | 0 (0.0%) |
Income Below Poverty Among Married-Couple vs Single-Parent Households in Lake Placid
| Children | Married-Couple Families | Single-Parent Households |
| No Children | 0 (0.0%) | 0 (0.0%) |
| 1 or 2 Children | 0 (0.0%) | 0 (0.0%) |
| 3 or 4 Children | 0 (0.0%) | 0 (0.0%) |
| 5 or more Children | 0 (0.0%) | 0 (0.0%) |
| Total | 0 (0.0%) | 0 (0.0%) |
Race in Lake Placid
The most populous races in Lake Placid are White / Caucasian (2,139 | 93.8%), Two or more Races (85 | 3.7%), and Hispanic or Latino (69 | 3.0%).
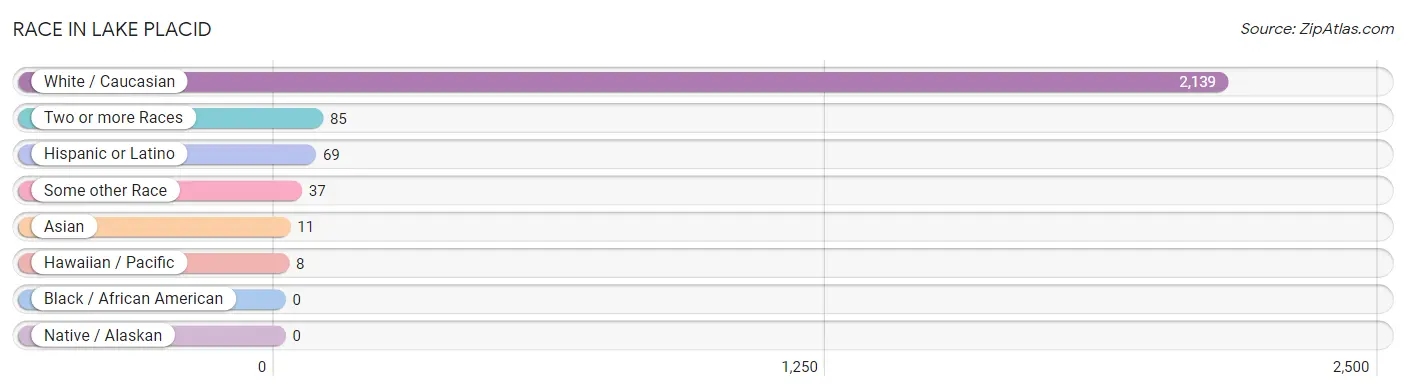
| Race | # Population | % Population |
| Asian | 11 | 0.5% |
| Black / African American | 0 | 0.0% |
| Hawaiian / Pacific | 8 | 0.4% |
| Hispanic or Latino | 69 | 3.0% |
| Native / Alaskan | 0 | 0.0% |
| White / Caucasian | 2,139 | 93.8% |
| Two or more Races | 85 | 3.7% |
| Some other Race | 37 | 1.6% |
| Total | 2,280 | 100.0% |
Ancestry in Lake Placid
The most populous ancestries reported in Lake Placid are Irish (391 | 17.2%), German (362 | 15.9%), English (285 | 12.5%), Yugoslavian (214 | 9.4%), and French (196 | 8.6%), together accounting for 63.5% of all Lake Placid residents.
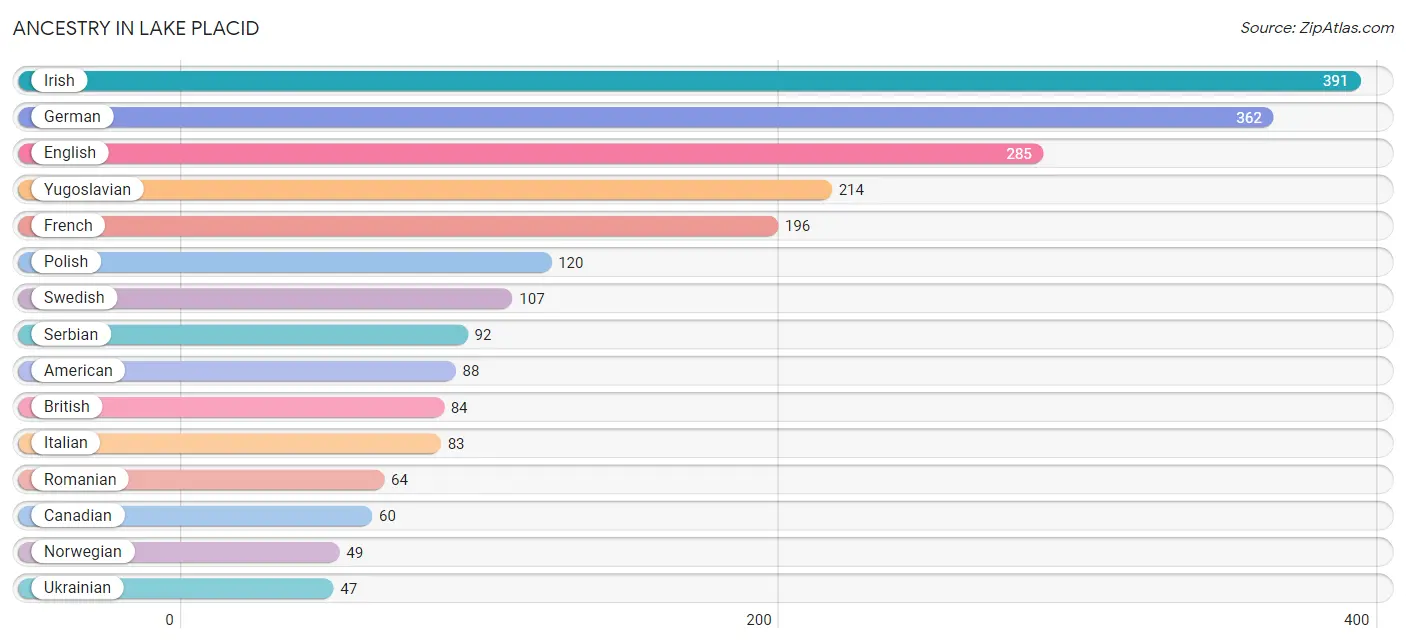
| Ancestry | # Population | % Population |
| American | 88 | 3.9% |
| Austrian | 45 | 2.0% |
| British | 84 | 3.7% |
| Canadian | 60 | 2.6% |
| Central American | 37 | 1.6% |
| Cuban | 7 | 0.3% |
| Czechoslovakian | 8 | 0.4% |
| Dominican | 18 | 0.8% |
| English | 285 | 12.5% |
| European | 13 | 0.6% |
| French | 196 | 8.6% |
| French Canadian | 40 | 1.8% |
| German | 362 | 15.9% |
| Guamanian / Chamorro | 8 | 0.4% |
| Hungarian | 18 | 0.8% |
| Indian (Asian) | 4 | 0.2% |
| Irish | 391 | 17.2% |
| Italian | 83 | 3.6% |
| Korean | 14 | 0.6% |
| Latvian | 10 | 0.4% |
| Norwegian | 49 | 2.1% |
| Polish | 120 | 5.3% |
| Romanian | 64 | 2.8% |
| Salvadoran | 37 | 1.6% |
| Scandinavian | 8 | 0.4% |
| Scottish | 8 | 0.4% |
| Serbian | 92 | 4.0% |
| Slovene | 8 | 0.4% |
| Swedish | 107 | 4.7% |
| Swiss | 6 | 0.3% |
| Ukrainian | 47 | 2.1% |
| Welsh | 13 | 0.6% |
| Yugoslavian | 214 | 9.4% | View All 33 Rows |
Immigrants in Lake Placid
The most numerous immigrant groups reported in Lake Placid came from Eastern Europe (318 | 14.0%), Europe (318 | 14.0%), Bosnia and Herzegovina (117 | 5.1%), Moldova (64 | 2.8%), and Asia (56 | 2.5%), together accounting for 38.3% of all Lake Placid residents.
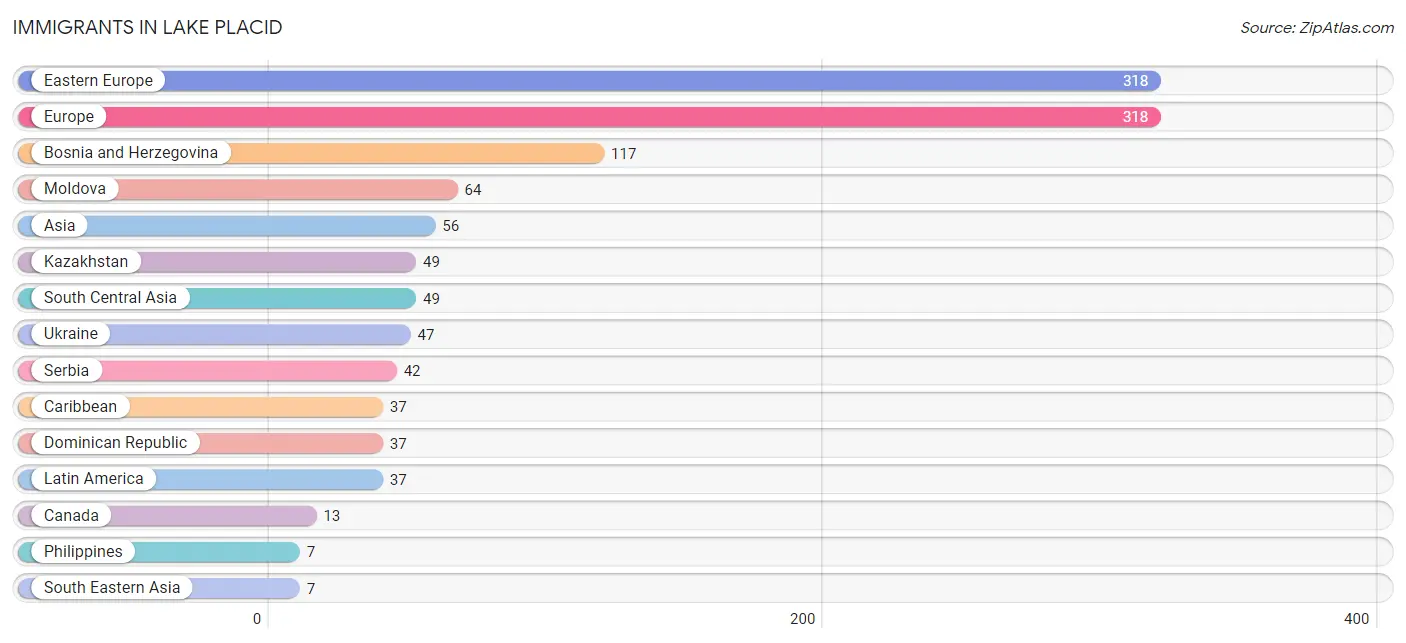
| Immigration Origin | # Population | % Population |
| Asia | 56 | 2.5% |
| Bosnia and Herzegovina | 117 | 5.1% |
| Canada | 13 | 0.6% |
| Caribbean | 37 | 1.6% |
| Dominican Republic | 37 | 1.6% |
| Eastern Europe | 318 | 14.0% |
| Europe | 318 | 14.0% |
| Kazakhstan | 49 | 2.1% |
| Latin America | 37 | 1.6% |
| Moldova | 64 | 2.8% |
| Philippines | 7 | 0.3% |
| Serbia | 42 | 1.8% |
| South Central Asia | 49 | 2.1% |
| South Eastern Asia | 7 | 0.3% |
| Ukraine | 47 | 2.1% | View All 15 Rows |
Sex and Age in Lake Placid
Sex and Age in Lake Placid
The most populous age groups in Lake Placid are 55 to 59 Years (162 | 16.5%) for men and 40 to 44 Years (137 | 10.5%) for women.
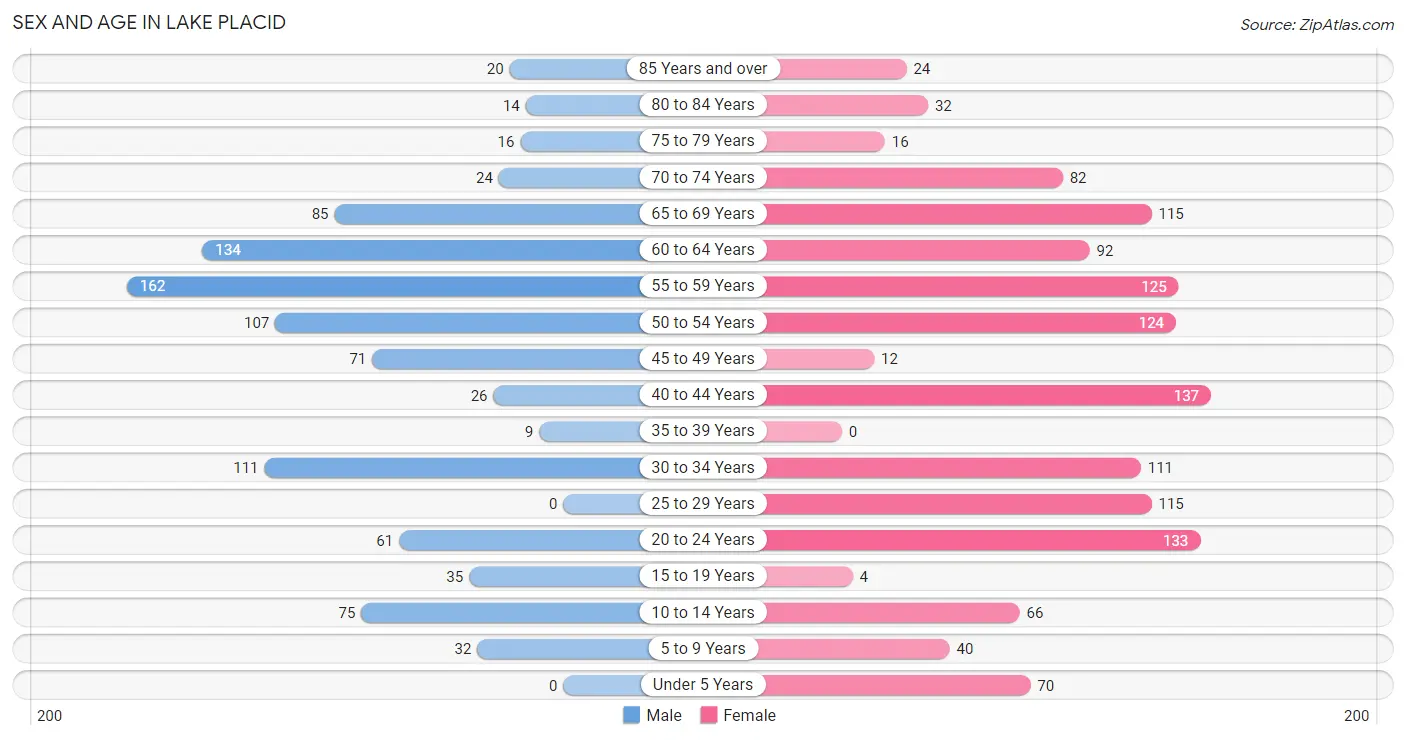
| Age Bracket | Male | Female |
| Under 5 Years | 0 (0.0%) | 70 (5.4%) |
| 5 to 9 Years | 32 (3.3%) | 40 (3.1%) |
| 10 to 14 Years | 75 (7.6%) | 66 (5.1%) |
| 15 to 19 Years | 35 (3.6%) | 4 (0.3%) |
| 20 to 24 Years | 61 (6.2%) | 133 (10.2%) |
| 25 to 29 Years | 0 (0.0%) | 115 (8.9%) |
| 30 to 34 Years | 111 (11.3%) | 111 (8.6%) |
| 35 to 39 Years | 9 (0.9%) | 0 (0.0%) |
| 40 to 44 Years | 26 (2.6%) | 137 (10.5%) |
| 45 to 49 Years | 71 (7.2%) | 12 (0.9%) |
| 50 to 54 Years | 107 (10.9%) | 124 (9.6%) |
| 55 to 59 Years | 162 (16.5%) | 125 (9.6%) |
| 60 to 64 Years | 134 (13.7%) | 92 (7.1%) |
| 65 to 69 Years | 85 (8.7%) | 115 (8.9%) |
| 70 to 74 Years | 24 (2.4%) | 82 (6.3%) |
| 75 to 79 Years | 16 (1.6%) | 16 (1.2%) |
| 80 to 84 Years | 14 (1.4%) | 32 (2.5%) |
| 85 Years and over | 20 (2.0%) | 24 (1.8%) |
| Total | 982 (100.0%) | 1,298 (100.0%) |
Families and Households in Lake Placid
Median Family Size in Lake Placid
The median family size in Lake Placid is 2.46 persons per family, with married-couple families (373 | 77.2%) accounting for the largest median family size of 2.62 persons per family. On the other hand, single male/father families (9 | 1.9%) represent the smallest median family size with 1.78 persons per family.
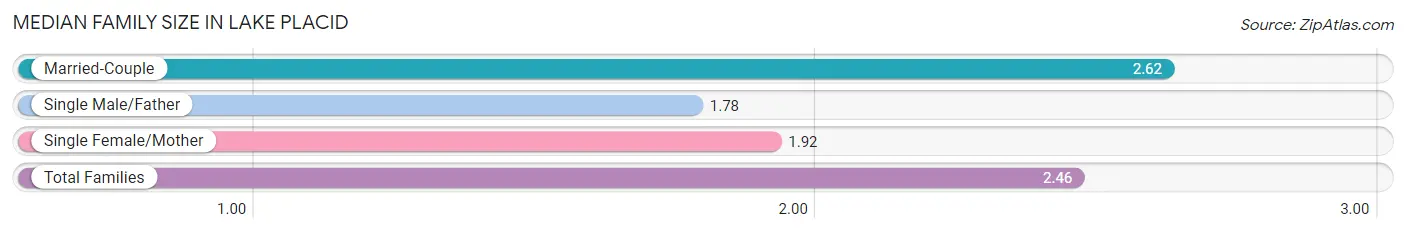
| Family Type | # Families | Family Size |
| Married-Couple | 373 (77.2%) | 2.62 |
| Single Male/Father | 9 (1.9%) | 1.78 |
| Single Female/Mother | 101 (20.9%) | 1.92 |
| Total Families | 483 (100.0%) | 2.46 |
Median Household Size in Lake Placid
The median household size in Lake Placid is 1.72 persons per household, with married-couple households (373 | 28.5%) accounting for the largest median household size of 2.62 persons per household. non-family households (824 | 63.0%) represent the smallest median household size with 1.26 persons per household.
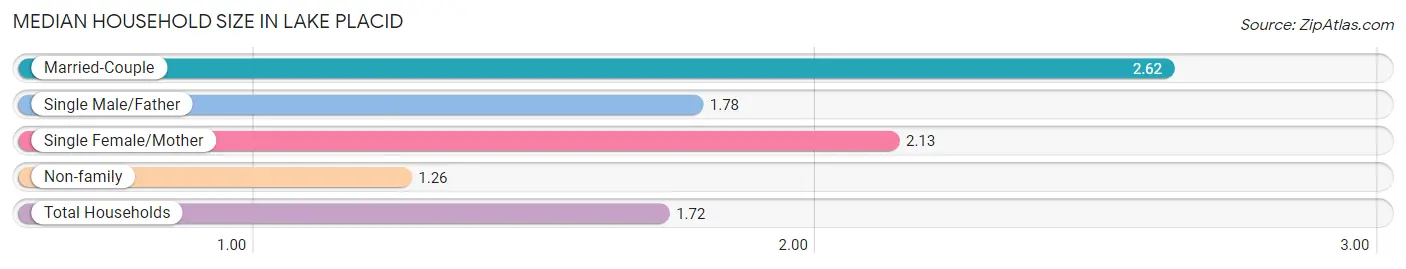
| Household Type | # Households | Household Size |
| Married-Couple | 373 (28.5%) | 2.62 |
| Single Male/Father | 9 (0.7%) | 1.78 |
| Single Female/Mother | 101 (7.7%) | 2.13 |
| Non-family | 824 (63.0%) | 1.26 |
| Total Households | 1,307 (100.0%) | 1.72 |
Household Size by Marriage Status in Lake Placid
Out of a total of 1,307 households in Lake Placid, 483 (36.9%) are family households, while 824 (63.0%) are nonfamily households. The most numerous type of family households are 2-person households, comprising 300, and the most common type of nonfamily households are 1-person households, comprising 710.
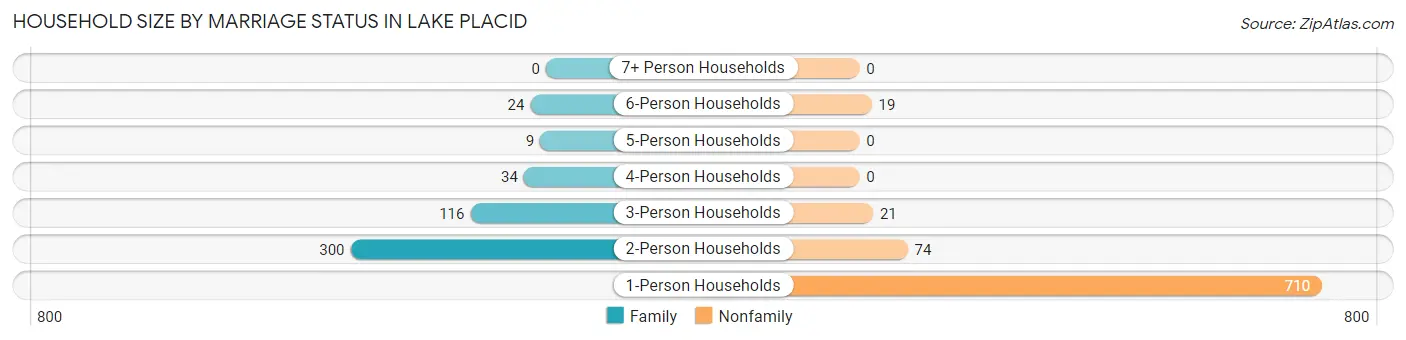
| Household Size | Family Households | Nonfamily Households |
| 1-Person Households | - | 710 (54.3%) |
| 2-Person Households | 300 (23.0%) | 74 (5.7%) |
| 3-Person Households | 116 (8.9%) | 21 (1.6%) |
| 4-Person Households | 34 (2.6%) | 0 (0.0%) |
| 5-Person Households | 9 (0.7%) | 0 (0.0%) |
| 6-Person Households | 24 (1.8%) | 19 (1.5%) |
| 7+ Person Households | 0 (0.0%) | 0 (0.0%) |
| Total | 483 (36.9%) | 824 (63.0%) |
Female Fertility in Lake Placid
Fertility by Age in Lake Placid
Average fertility rate in Lake Placid is 10.0 births per 1,000 women. Women in the age bracket of 20 to 34 years have the highest fertility rate with 14.0 births per 1,000 women. Women in the age bracket of 20 to 34 years acount for 100.0% of all women with births.
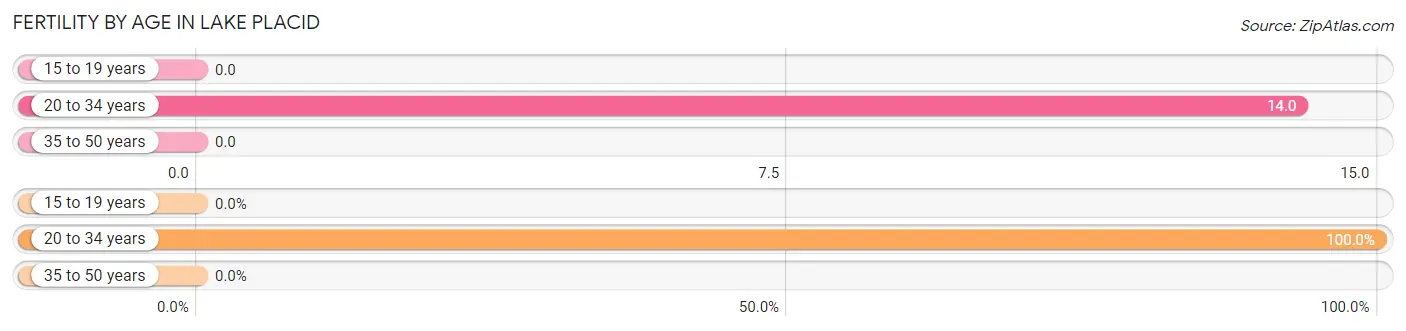
| Age Bracket | Women with Births | Births / 1,000 Women |
| 15 to 19 years | 0 (0.0%) | 0.0 |
| 20 to 34 years | 5 (100.0%) | 14.0 |
| 35 to 50 years | 0 (0.0%) | 0.0 |
| Total | 5 (100.0%) | 10.0 |
Fertility by Age by Marriage Status in Lake Placid
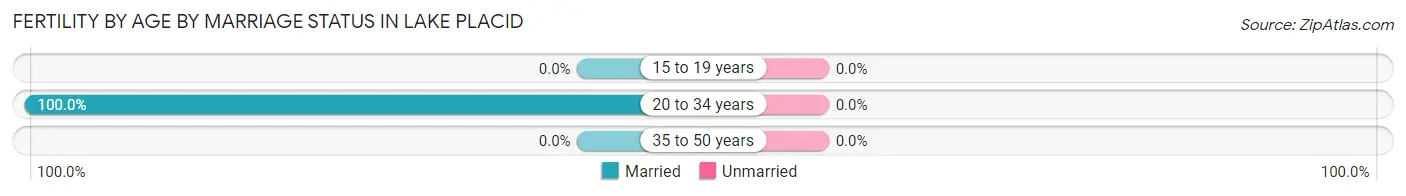
| Age Bracket | Married | Unmarried |
| 15 to 19 years | 0 (0.0%) | 0 (0.0%) |
| 20 to 34 years | 5 (100.0%) | 0 (0.0%) |
| 35 to 50 years | 0 (0.0%) | 0 (0.0%) |
| Total | 5 (100.0%) | 0 (0.0%) |
Fertility by Education in Lake Placid
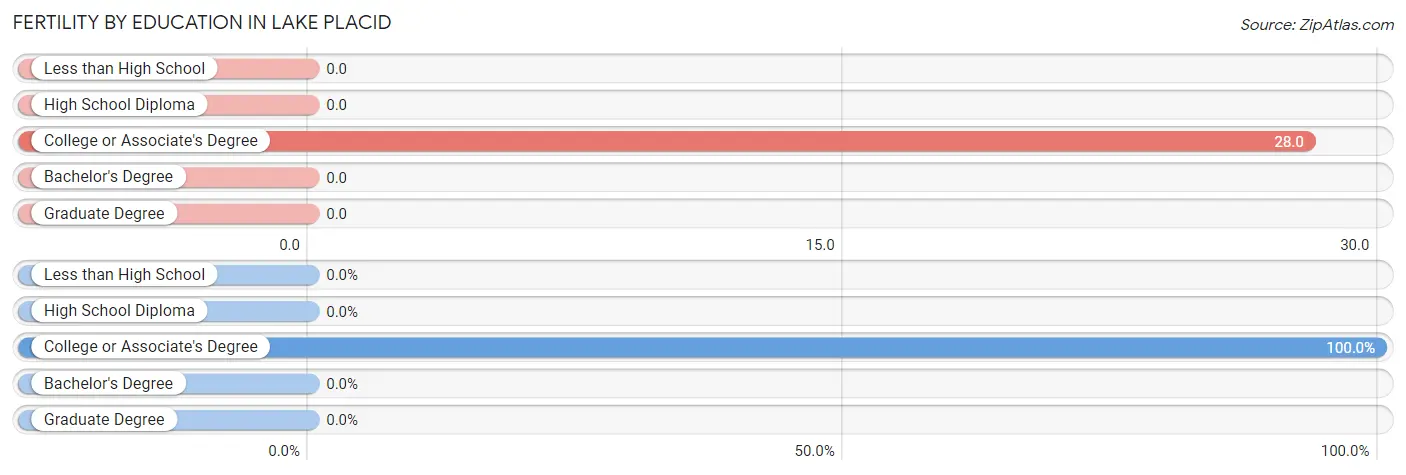
| Educational Attainment | Women with Births | Births / 1,000 Women |
| Less than High School | 0 (0.0%) | 0.0 |
| High School Diploma | 0 (0.0%) | 0.0 |
| College or Associate's Degree | 5 (100.0%) | 28.0 |
| Bachelor's Degree | 0 (0.0%) | 0.0 |
| Graduate Degree | 0 (0.0%) | 0.0 |
| Total | 5 (100.0%) | 10.0 |
Fertility by Education by Marriage Status in Lake Placid
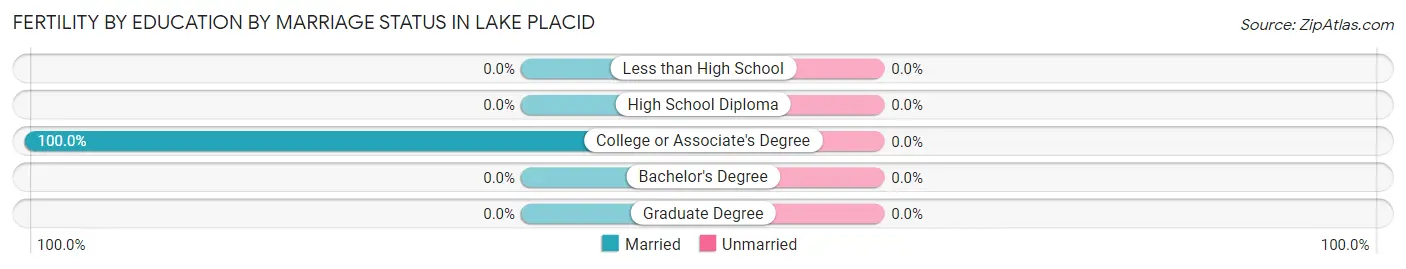
| Educational Attainment | Married | Unmarried |
| Less than High School | 0 (0.0%) | 0 (0.0%) |
| High School Diploma | 0 (0.0%) | 0 (0.0%) |
| College or Associate's Degree | 5 (100.0%) | 0 (0.0%) |
| Bachelor's Degree | 0 (0.0%) | 0 (0.0%) |
| Graduate Degree | 0 (0.0%) | 0 (0.0%) |
| Total | 5 (100.0%) | 0 (0.0%) |
Employment Characteristics in Lake Placid
Employment by Class of Employer in Lake Placid
Among the 1,262 employed individuals in Lake Placid, private company employees (797 | 63.1%), not-for-profit organizations (157 | 12.4%), and self-employed (not incorporated) (120 | 9.5%) make up the most common classes of employment.
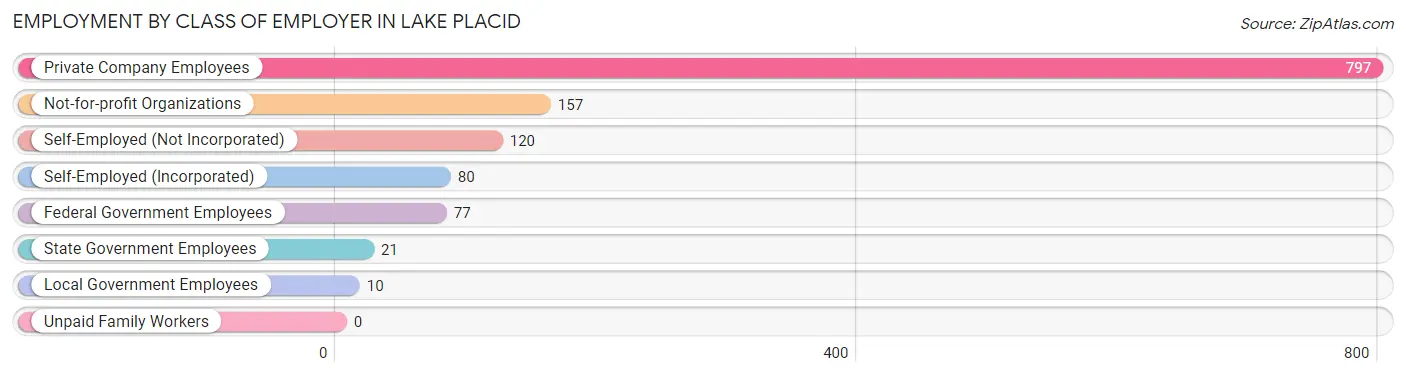
| Employer Class | # Employees | % Employees |
| Private Company Employees | 797 | 63.1% |
| Self-Employed (Incorporated) | 80 | 6.3% |
| Self-Employed (Not Incorporated) | 120 | 9.5% |
| Not-for-profit Organizations | 157 | 12.4% |
| Local Government Employees | 10 | 0.8% |
| State Government Employees | 21 | 1.7% |
| Federal Government Employees | 77 | 6.1% |
| Unpaid Family Workers | 0 | 0.0% |
| Total | 1,262 | 100.0% |
Employment Status by Age in Lake Placid
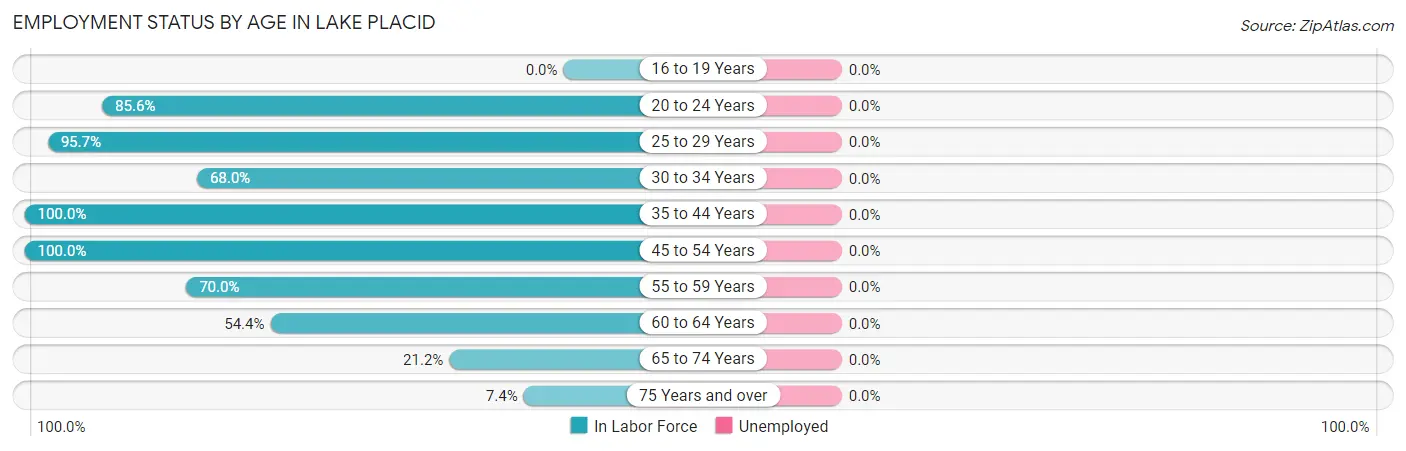
| Age Bracket | In Labor Force | Unemployed |
| 16 to 19 Years | 0 (0.0%) | 0 (0.0%) |
| 20 to 24 Years | 166 (85.6%) | 0 (0.0%) |
| 25 to 29 Years | 110 (95.7%) | 0 (0.0%) |
| 30 to 34 Years | 151 (68.0%) | 0 (0.0%) |
| 35 to 44 Years | 172 (100.0%) | 0 (0.0%) |
| 45 to 54 Years | 314 (100.0%) | 0 (0.0%) |
| 55 to 59 Years | 201 (70.0%) | 0 (0.0%) |
| 60 to 64 Years | 123 (54.4%) | 0 (0.0%) |
| 65 to 74 Years | 65 (21.2%) | 0 (0.0%) |
| 75 Years and over | 9 (7.4%) | 0 (0.0%) |
| Total | 1,311 (66.8%) | 0 (0.0%) |
Employment Status by Educational Attainment in Lake Placid
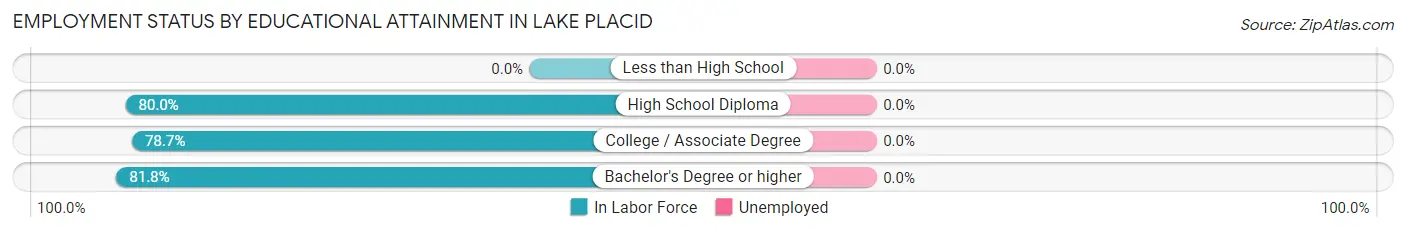
| Educational Attainment | In Labor Force | Unemployed |
| Less than High School | 0 (0.0%) | 0 (0.0%) |
| High School Diploma | 361 (80.0%) | 0 (0.0%) |
| College / Associate Degree | 251 (78.7%) | 0 (0.0%) |
| Bachelor's Degree or higher | 459 (81.8%) | 0 (0.0%) |
| Total | 1,071 (80.2%) | 0 (0.0%) |
Employment Occupations by Sex in Lake Placid
Management, Business, Science and Arts Occupations
The most common Management, Business, Science and Arts occupations in Lake Placid are Management (215 | 16.4%), Business & Financial (106 | 8.1%), Computers, Engineering & Science (73 | 5.6%), Life, Physical & Social Science (73 | 5.6%), and Community & Social Service (65 | 5.0%).
Management, Business, Science and Arts Occupations by Sex
Within the Management, Business, Science and Arts occupations in Lake Placid, the most male-oriented occupations are Computers, Engineering & Science (100.0%), Life, Physical & Social Science (100.0%), and Education, Arts & Media (100.0%), while the most female-oriented occupations are Business & Financial (79.2%), Education Instruction & Library (77.5%), and Health Diagnosing & Treating (64.5%).
| Occupation | Male | Female |
| Management | 125 (58.1%) | 90 (41.9%) |
| Business & Financial | 22 (20.7%) | 84 (79.2%) |
| Computers, Engineering & Science | 73 (100.0%) | 0 (0.0%) |
| Computers & Mathematics | 0 (0.0%) | 0 (0.0%) |
| Architecture & Engineering | 0 (0.0%) | 0 (0.0%) |
| Life, Physical & Social Science | 73 (100.0%) | 0 (0.0%) |
| Community & Social Service | 34 (52.3%) | 31 (47.7%) |
| Education, Arts & Media | 15 (100.0%) | 0 (0.0%) |
| Legal Services & Support | 0 (0.0%) | 0 (0.0%) |
| Education Instruction & Library | 9 (22.5%) | 31 (77.5%) |
| Arts, Media & Entertainment | 10 (100.0%) | 0 (0.0%) |
| Health Diagnosing & Treating | 22 (35.5%) | 40 (64.5%) |
| Health Technologists | 22 (35.5%) | 40 (64.5%) |
| Total (Category) | 276 (53.0%) | 245 (47.0%) |
| Total (Overall) | 620 (47.3%) | 691 (52.7%) |
Services Occupations
The most common Services occupations in Lake Placid are Food Preparation & Serving (227 | 17.3%), Cleaning & Maintenance (86 | 6.6%), and Personal Care & Service (29 | 2.2%).
Services Occupations by Sex
Within the Services occupations in Lake Placid, the most male-oriented occupations are Personal Care & Service (51.7%), Cleaning & Maintenance (34.9%), and Food Preparation & Serving (32.6%), while the most female-oriented occupations are Food Preparation & Serving (67.4%), Cleaning & Maintenance (65.1%), and Personal Care & Service (48.3%).
| Occupation | Male | Female |
| Healthcare Support | 0 (0.0%) | 0 (0.0%) |
| Security & Protection | 0 (0.0%) | 0 (0.0%) |
| Firefighting & Prevention | 0 (0.0%) | 0 (0.0%) |
| Law Enforcement | 0 (0.0%) | 0 (0.0%) |
| Food Preparation & Serving | 74 (32.6%) | 153 (67.4%) |
| Cleaning & Maintenance | 30 (34.9%) | 56 (65.1%) |
| Personal Care & Service | 15 (51.7%) | 14 (48.3%) |
| Total (Category) | 119 (34.8%) | 223 (65.2%) |
| Total (Overall) | 620 (47.3%) | 691 (52.7%) |
Sales and Office Occupations
The most common Sales and Office occupations in Lake Placid are Office & Administration (215 | 16.4%), and Sales & Related (137 | 10.4%).
Sales and Office Occupations by Sex
| Occupation | Male | Female |
| Sales & Related | 44 (32.1%) | 93 (67.9%) |
| Office & Administration | 85 (39.5%) | 130 (60.5%) |
| Total (Category) | 129 (36.6%) | 223 (63.3%) |
| Total (Overall) | 620 (47.3%) | 691 (52.7%) |
Natural Resources, Construction and Maintenance Occupations
The most common Natural Resources, Construction and Maintenance occupations in Lake Placid are Construction & Extraction (41 | 3.1%), and Installation, Maintenance & Repair (14 | 1.1%).
Natural Resources, Construction and Maintenance Occupations by Sex
| Occupation | Male | Female |
| Farming, Fishing & Forestry | 0 (0.0%) | 0 (0.0%) |
| Construction & Extraction | 41 (100.0%) | 0 (0.0%) |
| Installation, Maintenance & Repair | 14 (100.0%) | 0 (0.0%) |
| Total (Category) | 55 (100.0%) | 0 (0.0%) |
| Total (Overall) | 620 (47.3%) | 691 (52.7%) |
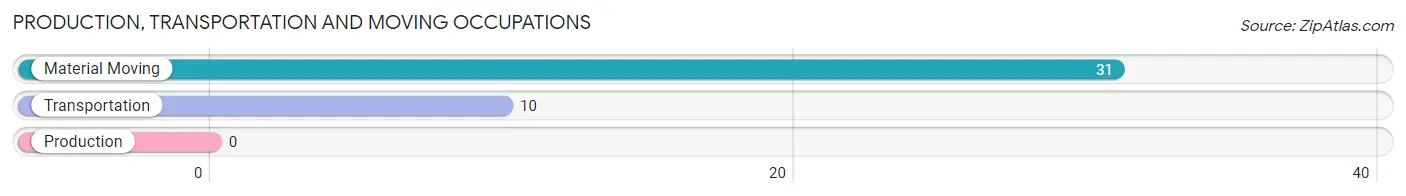
Production, Transportation and Moving Occupations
The most common Production, Transportation and Moving occupations in Lake Placid are Material Moving (31 | 2.4%), and Transportation (10 | 0.8%).
Production, Transportation and Moving Occupations by Sex
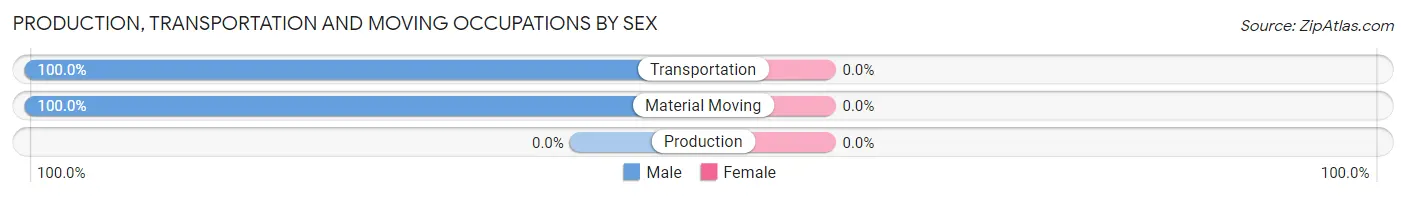
| Occupation | Male | Female |
| Production | 0 (0.0%) | 0 (0.0%) |
| Transportation | 10 (100.0%) | 0 (0.0%) |
| Material Moving | 31 (100.0%) | 0 (0.0%) |
| Total (Category) | 41 (100.0%) | 0 (0.0%) |
| Total (Overall) | 620 (47.3%) | 691 (52.7%) |
Employment Industries by Sex in Lake Placid
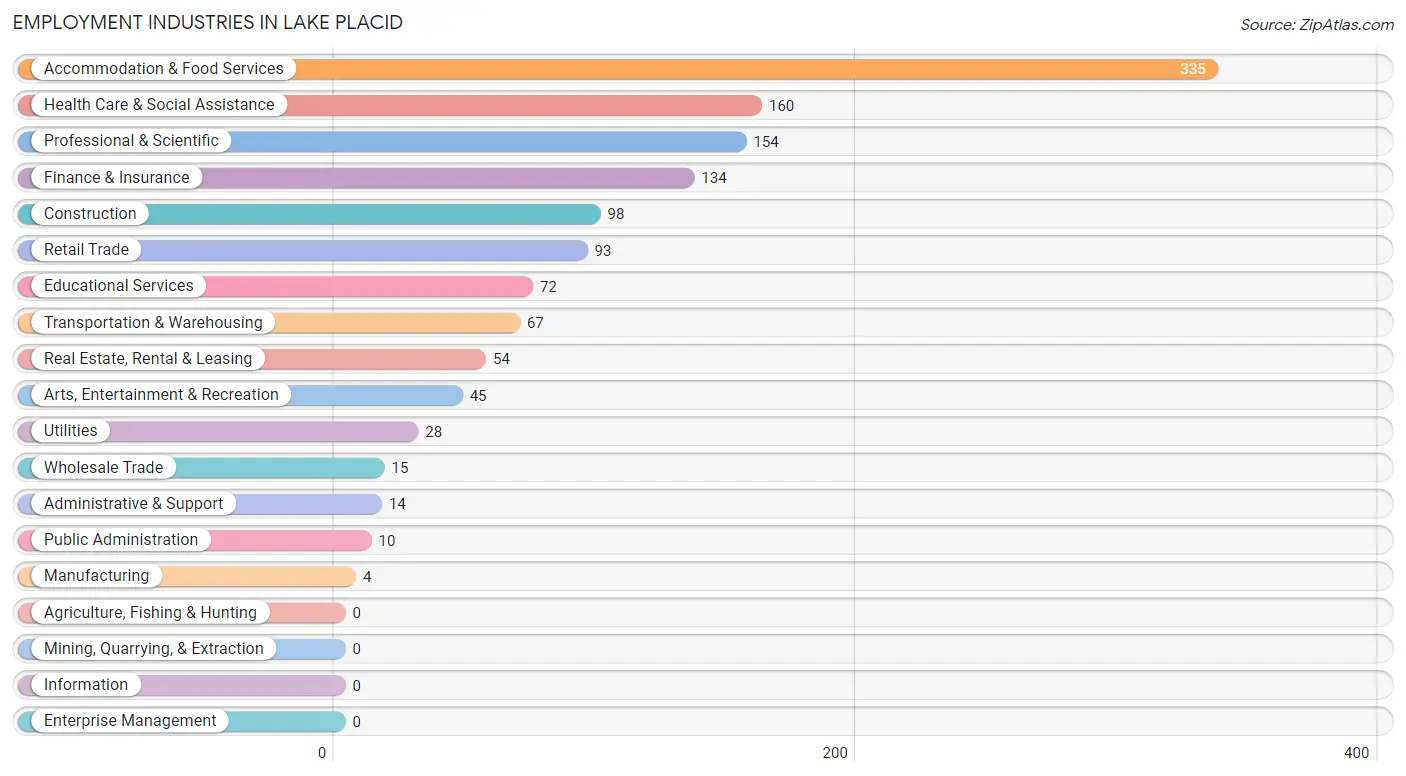
Employment Industries in Lake Placid
The major employment industries in Lake Placid include Accommodation & Food Services (335 | 25.6%), Health Care & Social Assistance (160 | 12.2%), Professional & Scientific (154 | 11.7%), Finance & Insurance (134 | 10.2%), and Construction (98 | 7.5%).
Employment Industries by Sex in Lake Placid
The Lake Placid industries that see more men than women are Wholesale Trade (100.0%), Transportation & Warehousing (100.0%), and Utilities (100.0%), whereas the industries that tend to have a higher number of women are Manufacturing (100.0%), Administrative & Support (100.0%), and Finance & Insurance (83.6%).
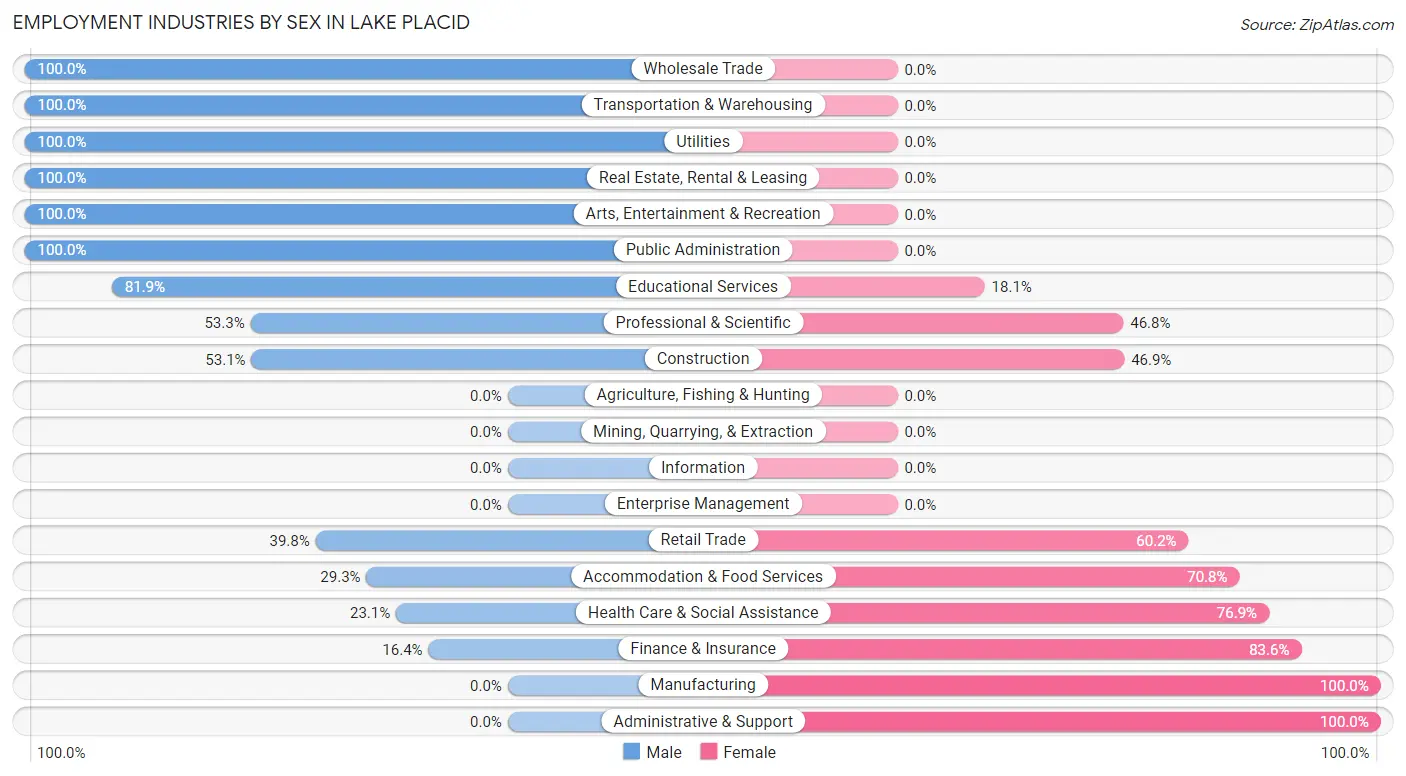
| Industry | Male | Female |
| Agriculture, Fishing & Hunting | 0 (0.0%) | 0 (0.0%) |
| Mining, Quarrying, & Extraction | 0 (0.0%) | 0 (0.0%) |
| Construction | 52 (53.1%) | 46 (46.9%) |
| Manufacturing | 0 (0.0%) | 4 (100.0%) |
| Wholesale Trade | 15 (100.0%) | 0 (0.0%) |
| Retail Trade | 37 (39.8%) | 56 (60.2%) |
| Transportation & Warehousing | 67 (100.0%) | 0 (0.0%) |
| Utilities | 28 (100.0%) | 0 (0.0%) |
| Information | 0 (0.0%) | 0 (0.0%) |
| Finance & Insurance | 22 (16.4%) | 112 (83.6%) |
| Real Estate, Rental & Leasing | 54 (100.0%) | 0 (0.0%) |
| Professional & Scientific | 82 (53.2%) | 72 (46.8%) |
| Enterprise Management | 0 (0.0%) | 0 (0.0%) |
| Administrative & Support | 0 (0.0%) | 14 (100.0%) |
| Educational Services | 59 (81.9%) | 13 (18.1%) |
| Health Care & Social Assistance | 37 (23.1%) | 123 (76.9%) |
| Arts, Entertainment & Recreation | 45 (100.0%) | 0 (0.0%) |
| Accommodation & Food Services | 98 (29.2%) | 237 (70.8%) |
| Public Administration | 10 (100.0%) | 0 (0.0%) |
| Total | 620 (47.3%) | 691 (52.7%) |
Education in Lake Placid
School Enrollment in Lake Placid
The most common levels of schooling among the 355 students in Lake Placid are middle school (134 | 37.8%), college / undergraduate (93 | 26.2%), and elementary school (68 | 19.2%).
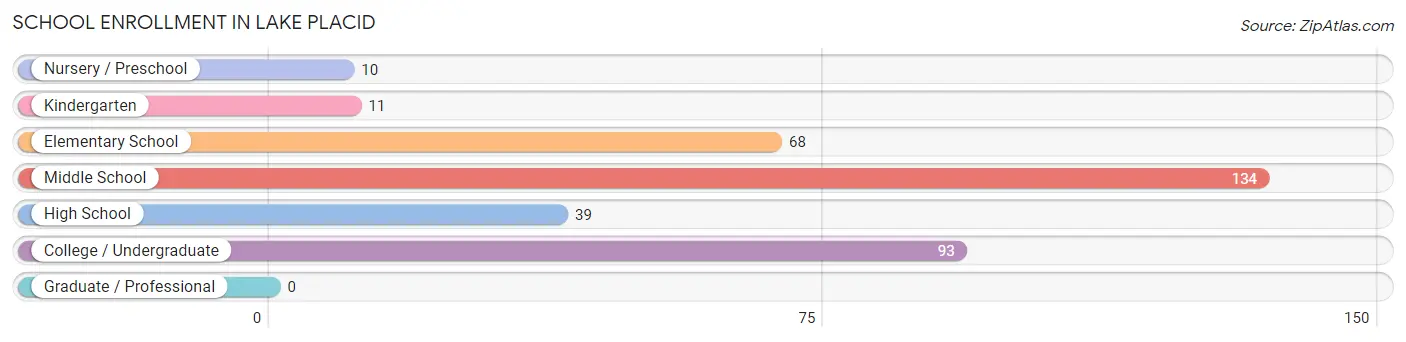
| School Level | # Students | % Students |
| Nursery / Preschool | 10 | 2.8% |
| Kindergarten | 11 | 3.1% |
| Elementary School | 68 | 19.2% |
| Middle School | 134 | 37.8% |
| High School | 39 | 11.0% |
| College / Undergraduate | 93 | 26.2% |
| Graduate / Professional | 0 | 0.0% |
| Total | 355 | 100.0% |
School Enrollment by Age by Funding Source in Lake Placid
Out of a total of 355 students who are enrolled in schools in Lake Placid, 44 (12.4%) attend a private institution, while the remaining 311 (87.6%) are enrolled in public schools. The age group of 3 to 4 year olds has the highest likelihood of being enrolled in private schools, with 10 (100.0% in the age bracket) enrolled. Conversely, the age group of 5 to 9 year old has the lowest likelihood of being enrolled in a private school, with 72 (100.0% in the age bracket) attending a public institution.
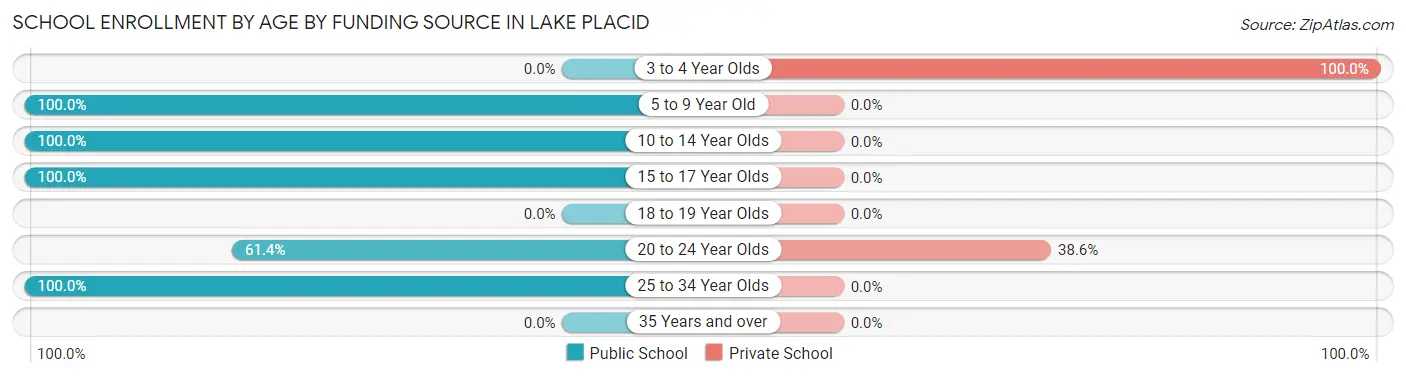
| Age Bracket | Public School | Private School |
| 3 to 4 Year Olds | 0 (0.0%) | 10 (100.0%) |
| 5 to 9 Year Old | 72 (100.0%) | 0 (0.0%) |
| 10 to 14 Year Olds | 141 (100.0%) | 0 (0.0%) |
| 15 to 17 Year Olds | 39 (100.0%) | 0 (0.0%) |
| 18 to 19 Year Olds | 0 (0.0%) | 0 (0.0%) |
| 20 to 24 Year Olds | 54 (61.4%) | 34 (38.6%) |
| 25 to 34 Year Olds | 5 (100.0%) | 0 (0.0%) |
| 35 Years and over | 0 (0.0%) | 0 (0.0%) |
| Total | 311 (87.6%) | 44 (12.4%) |
Educational Attainment by Field of Study in Lake Placid
Science & technology (250 | 30.1%), psychology (137 | 16.5%), business (108 | 13.0%), liberal arts & history (75 | 9.0%), and social sciences (64 | 7.7%) are the most common fields of study among 831 individuals in Lake Placid who have obtained a bachelor's degree or higher.
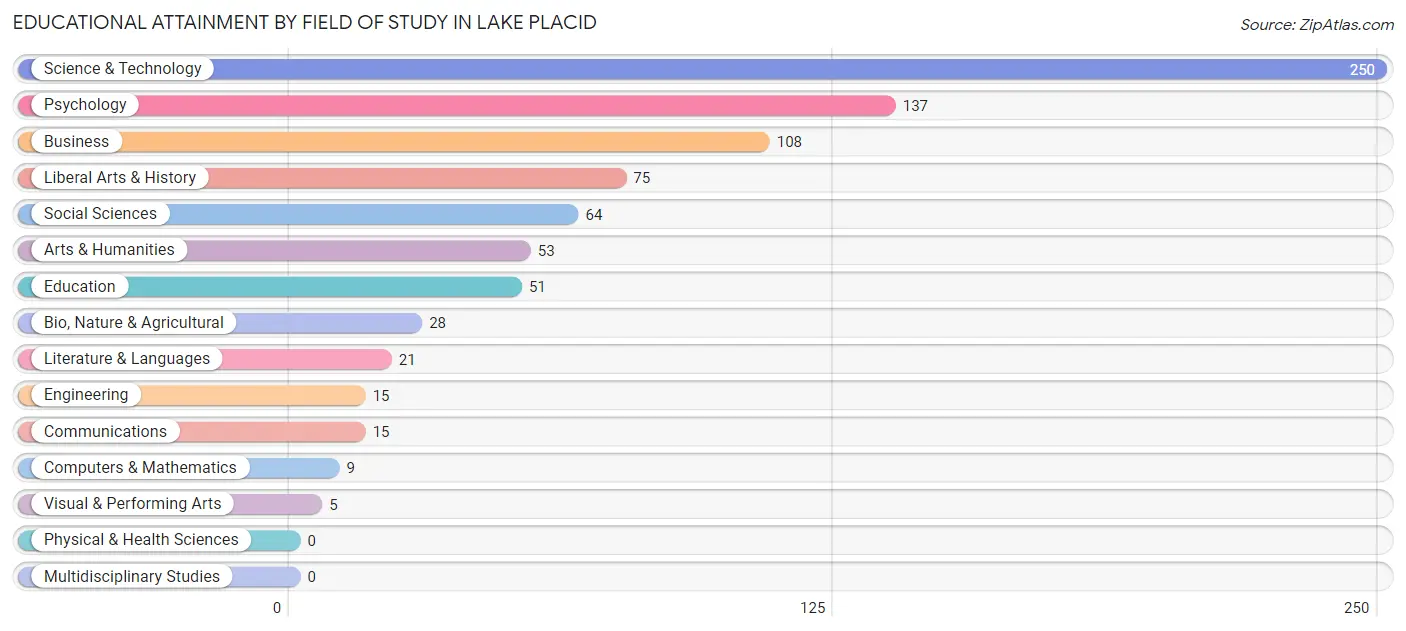
| Field of Study | # Graduates | % Graduates |
| Computers & Mathematics | 9 | 1.1% |
| Bio, Nature & Agricultural | 28 | 3.4% |
| Physical & Health Sciences | 0 | 0.0% |
| Psychology | 137 | 16.5% |
| Social Sciences | 64 | 7.7% |
| Engineering | 15 | 1.8% |
| Multidisciplinary Studies | 0 | 0.0% |
| Science & Technology | 250 | 30.1% |
| Business | 108 | 13.0% |
| Education | 51 | 6.1% |
| Literature & Languages | 21 | 2.5% |
| Liberal Arts & History | 75 | 9.0% |
| Visual & Performing Arts | 5 | 0.6% |
| Communications | 15 | 1.8% |
| Arts & Humanities | 53 | 6.4% |
| Total | 831 | 100.0% |
Transportation & Commute in Lake Placid
Vehicle Availability by Sex in Lake Placid
The most prevalent vehicle ownership categories in Lake Placid are males with 2 vehicles (247, accounting for 40.3%) and females with 2 vehicles (169, making up 38.5%).
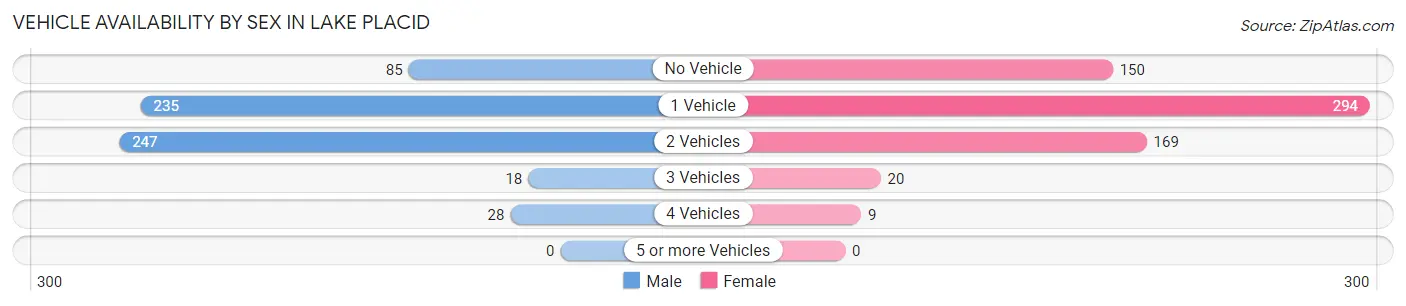
| Vehicles Available | Male | Female |
| No Vehicle | 85 (13.9%) | 150 (23.4%) |
| 1 Vehicle | 235 (38.3%) | 294 (45.8%) |
| 2 Vehicles | 247 (40.3%) | 169 (26.3%) |
| 3 Vehicles | 18 (2.9%) | 20 (3.1%) |
| 4 Vehicles | 28 (4.6%) | 9 (1.4%) |
| 5 or more Vehicles | 0 (0.0%) | 0 (0.0%) |
| Total | 613 (100.0%) | 642 (100.0%) |
Commute Time in Lake Placid
The most frequently occuring commute durations in Lake Placid are 5 to 9 minutes (340 commuters, 32.1%), less than 5 minutes (210 commuters, 19.8%), and 15 to 19 minutes (120 commuters, 11.3%).
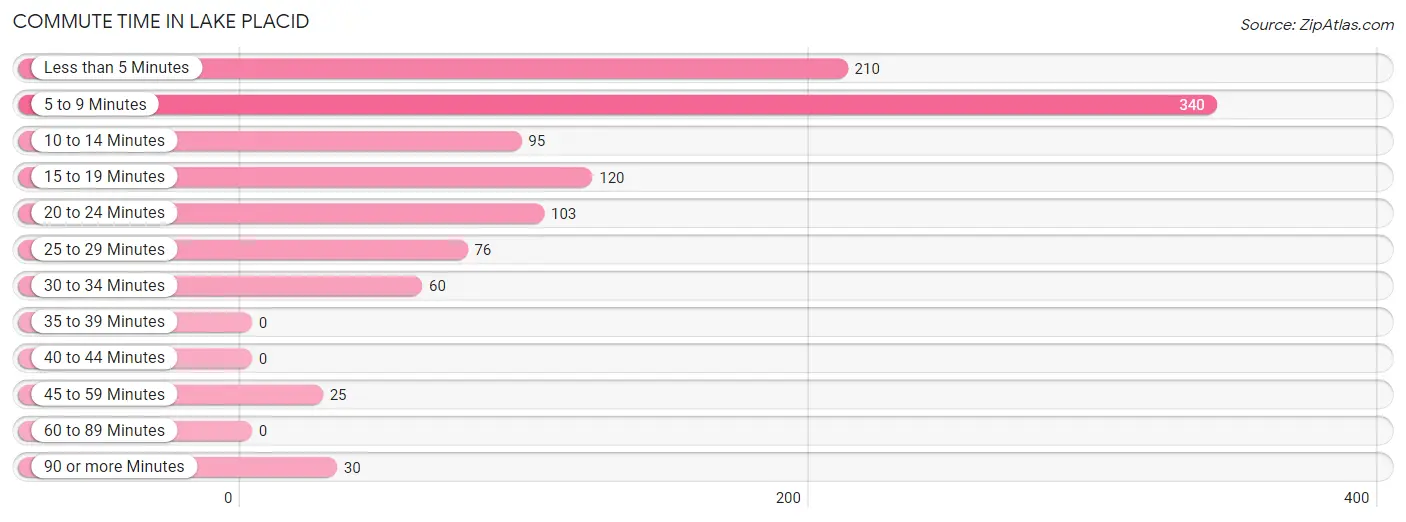
| Commute Time | # Commuters | % Commuters |
| Less than 5 Minutes | 210 | 19.8% |
| 5 to 9 Minutes | 340 | 32.1% |
| 10 to 14 Minutes | 95 | 9.0% |
| 15 to 19 Minutes | 120 | 11.3% |
| 20 to 24 Minutes | 103 | 9.7% |
| 25 to 29 Minutes | 76 | 7.2% |
| 30 to 34 Minutes | 60 | 5.7% |
| 35 to 39 Minutes | 0 | 0.0% |
| 40 to 44 Minutes | 0 | 0.0% |
| 45 to 59 Minutes | 25 | 2.4% |
| 60 to 89 Minutes | 0 | 0.0% |
| 90 or more Minutes | 30 | 2.8% |
Commute Time by Sex in Lake Placid
The most common commute times in Lake Placid are 5 to 9 minutes (143 commuters, 28.7%) for males and 5 to 9 minutes (197 commuters, 35.2%) for females.
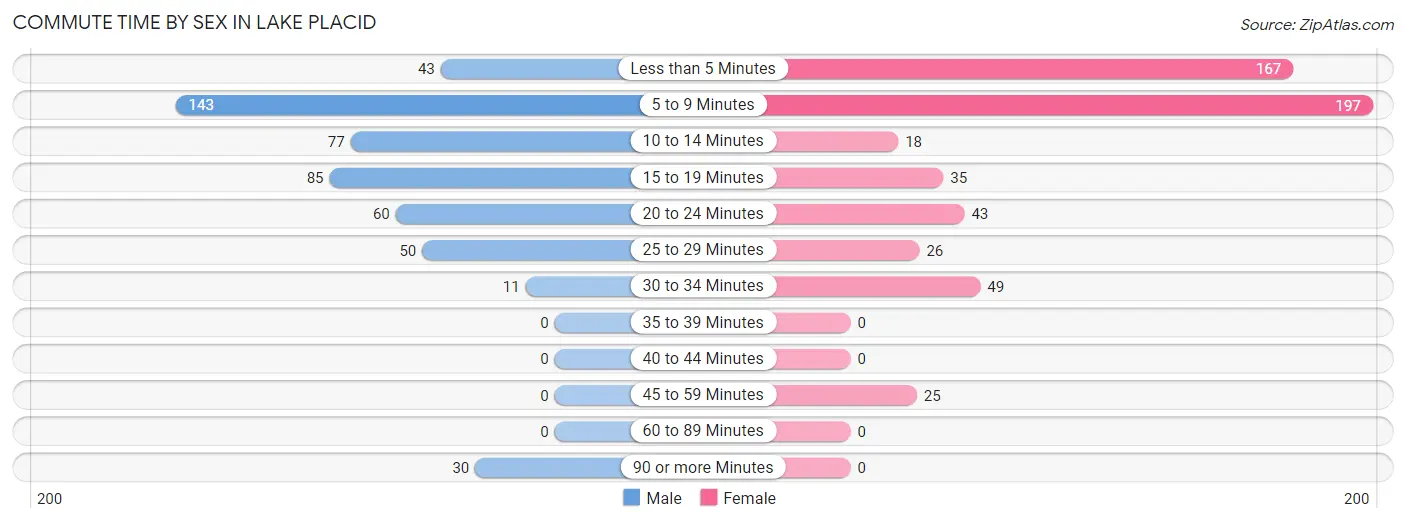
| Commute Time | Male | Female |
| Less than 5 Minutes | 43 (8.6%) | 167 (29.8%) |
| 5 to 9 Minutes | 143 (28.7%) | 197 (35.2%) |
| 10 to 14 Minutes | 77 (15.4%) | 18 (3.2%) |
| 15 to 19 Minutes | 85 (17.0%) | 35 (6.2%) |
| 20 to 24 Minutes | 60 (12.0%) | 43 (7.7%) |
| 25 to 29 Minutes | 50 (10.0%) | 26 (4.6%) |
| 30 to 34 Minutes | 11 (2.2%) | 49 (8.7%) |
| 35 to 39 Minutes | 0 (0.0%) | 0 (0.0%) |
| 40 to 44 Minutes | 0 (0.0%) | 0 (0.0%) |
| 45 to 59 Minutes | 0 (0.0%) | 25 (4.5%) |
| 60 to 89 Minutes | 0 (0.0%) | 0 (0.0%) |
| 90 or more Minutes | 30 (6.0%) | 0 (0.0%) |
Time of Departure to Work by Sex in Lake Placid
The most frequent times of departure to work in Lake Placid are 10:00 AM to 10:59 AM (179, 35.9%) for males and 7:30 AM to 7:59 AM (129, 23.0%) for females.
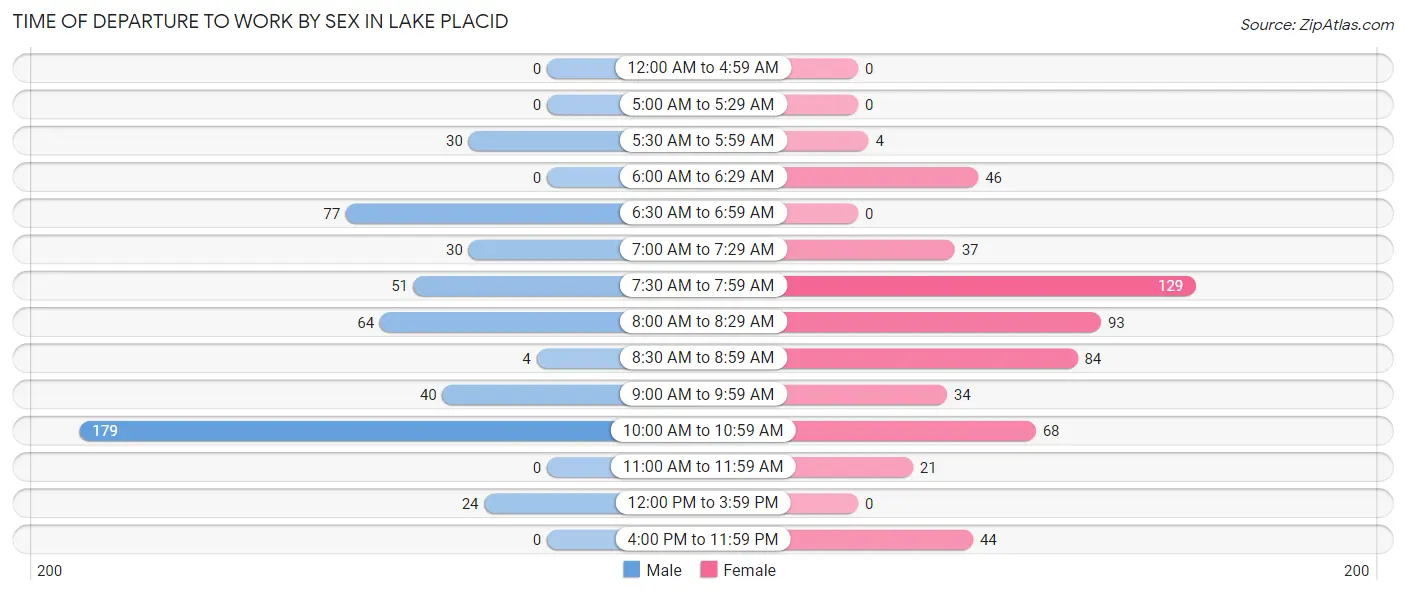
| Time of Departure | Male | Female |
| 12:00 AM to 4:59 AM | 0 (0.0%) | 0 (0.0%) |
| 5:00 AM to 5:29 AM | 0 (0.0%) | 0 (0.0%) |
| 5:30 AM to 5:59 AM | 30 (6.0%) | 4 (0.7%) |
| 6:00 AM to 6:29 AM | 0 (0.0%) | 46 (8.2%) |
| 6:30 AM to 6:59 AM | 77 (15.4%) | 0 (0.0%) |
| 7:00 AM to 7:29 AM | 30 (6.0%) | 37 (6.6%) |
| 7:30 AM to 7:59 AM | 51 (10.2%) | 129 (23.0%) |
| 8:00 AM to 8:29 AM | 64 (12.8%) | 93 (16.6%) |
| 8:30 AM to 8:59 AM | 4 (0.8%) | 84 (15.0%) |
| 9:00 AM to 9:59 AM | 40 (8.0%) | 34 (6.1%) |
| 10:00 AM to 10:59 AM | 179 (35.9%) | 68 (12.1%) |
| 11:00 AM to 11:59 AM | 0 (0.0%) | 21 (3.7%) |
| 12:00 PM to 3:59 PM | 24 (4.8%) | 0 (0.0%) |
| 4:00 PM to 11:59 PM | 0 (0.0%) | 44 (7.9%) |
| Total | 499 (100.0%) | 560 (100.0%) |
Housing Occupancy in Lake Placid
Occupancy by Ownership in Lake Placid
Of the total 1,307 dwellings in Lake Placid, owner-occupied units account for 724 (55.4%), while renter-occupied units make up 583 (44.6%).
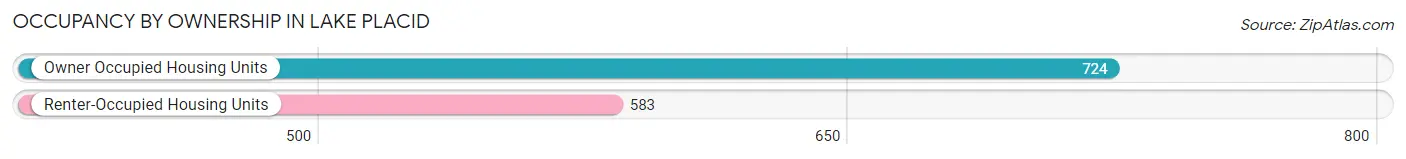
| Occupancy | # Housing Units | % Housing Units |
| Owner Occupied Housing Units | 724 | 55.4% |
| Renter-Occupied Housing Units | 583 | 44.6% |
| Total Occupied Housing Units | 1,307 | 100.0% |
Occupancy by Household Size in Lake Placid
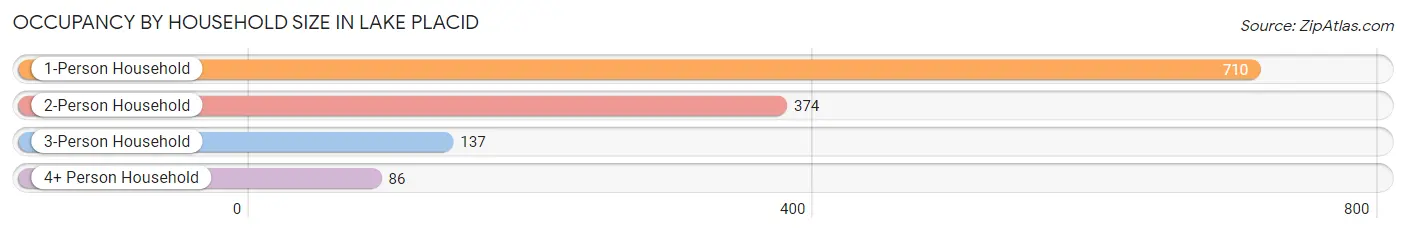
| Household Size | # Housing Units | % Housing Units |
| 1-Person Household | 710 | 54.3% |
| 2-Person Household | 374 | 28.6% |
| 3-Person Household | 137 | 10.5% |
| 4+ Person Household | 86 | 6.6% |
| Total Housing Units | 1,307 | 100.0% |
Occupancy by Ownership by Household Size in Lake Placid
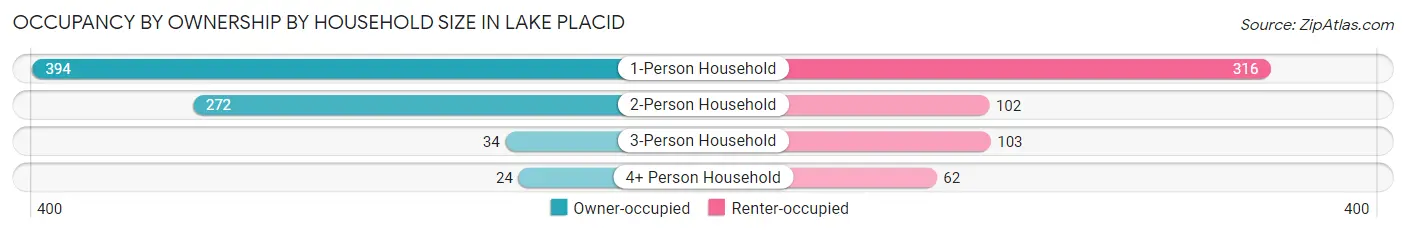
| Household Size | Owner-occupied | Renter-occupied |
| 1-Person Household | 394 (55.5%) | 316 (44.5%) |
| 2-Person Household | 272 (72.7%) | 102 (27.3%) |
| 3-Person Household | 34 (24.8%) | 103 (75.2%) |
| 4+ Person Household | 24 (27.9%) | 62 (72.1%) |
| Total Housing Units | 724 (55.4%) | 583 (44.6%) |
Occupancy by Educational Attainment in Lake Placid
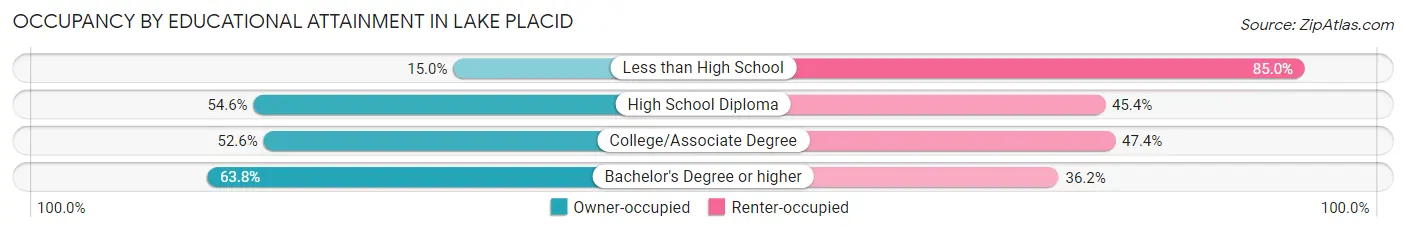
| Household Size | Owner-occupied | Renter-occupied |
| Less than High School | 12 (15.0%) | 68 (85.0%) |
| High School Diploma | 183 (54.6%) | 152 (45.4%) |
| College/Associate Degree | 190 (52.6%) | 171 (47.4%) |
| Bachelor's Degree or higher | 339 (63.8%) | 192 (36.2%) |
Occupancy by Age of Householder in Lake Placid
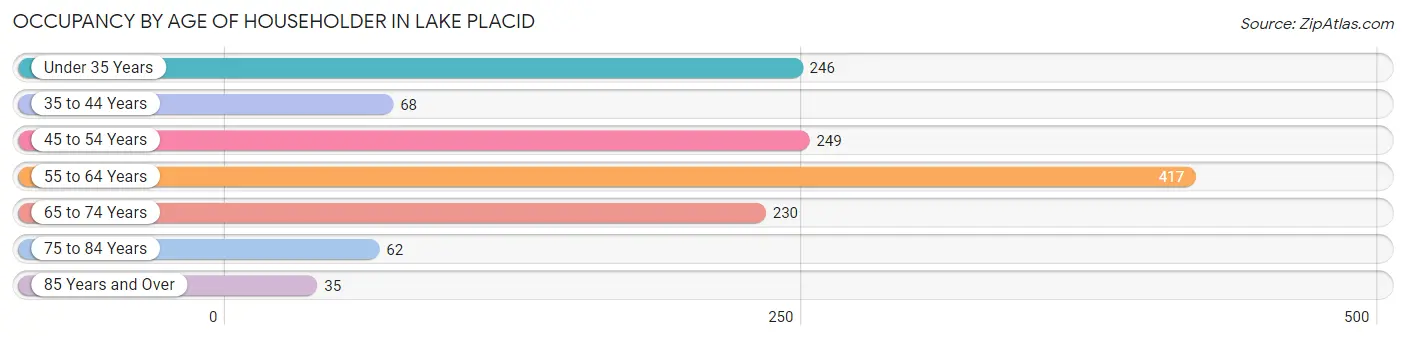
| Age Bracket | # Households | % Households |
| Under 35 Years | 246 | 18.8% |
| 35 to 44 Years | 68 | 5.2% |
| 45 to 54 Years | 249 | 19.1% |
| 55 to 64 Years | 417 | 31.9% |
| 65 to 74 Years | 230 | 17.6% |
| 75 to 84 Years | 62 | 4.7% |
| 85 Years and Over | 35 | 2.7% |
| Total | 1,307 | 100.0% |
Housing Finances in Lake Placid
Median Income by Occupancy in Lake Placid
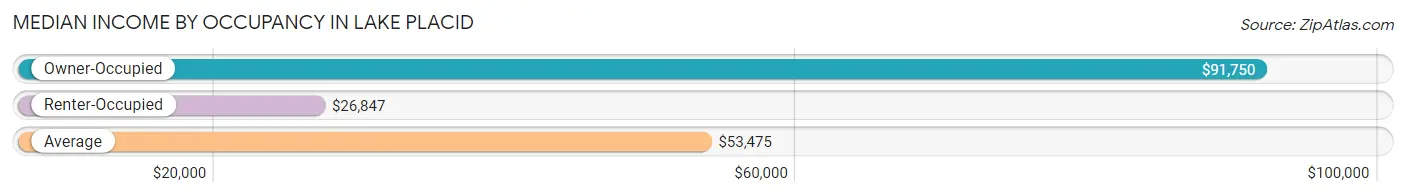
| Occupancy Type | # Households | Median Income |
| Owner-Occupied | 724 (55.4%) | $91,750 |
| Renter-Occupied | 583 (44.6%) | $26,847 |
| Average | 1,307 (100.0%) | $53,475 |
Occupancy by Householder Income Bracket in Lake Placid
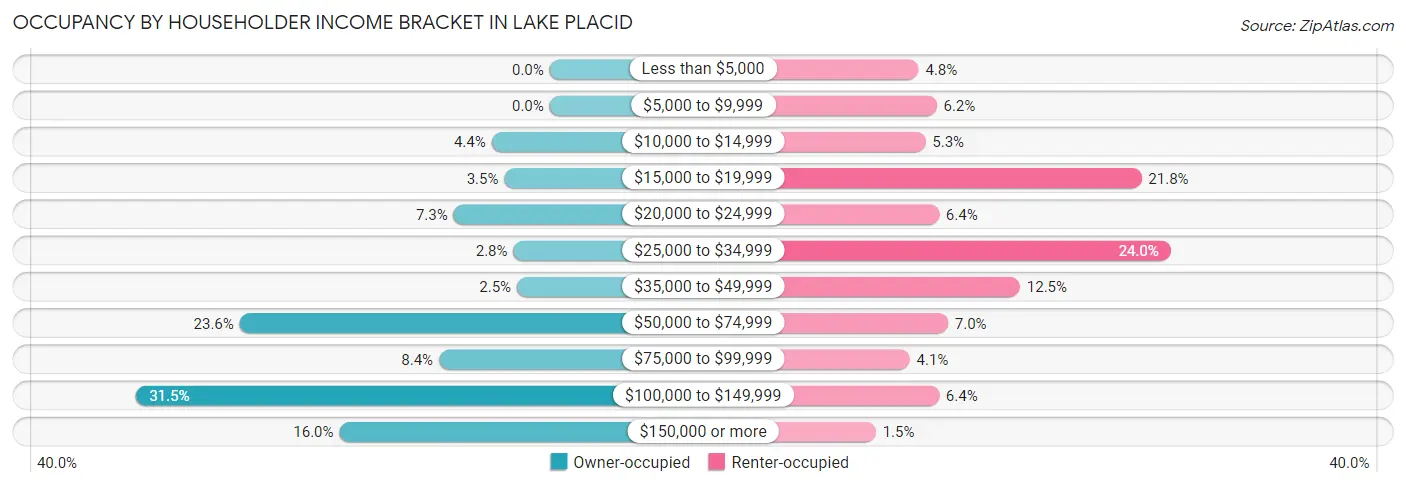
| Income Bracket | Owner-occupied | Renter-occupied |
| Less than $5,000 | 0 (0.0%) | 28 (4.8%) |
| $5,000 to $9,999 | 0 (0.0%) | 36 (6.2%) |
| $10,000 to $14,999 | 32 (4.4%) | 31 (5.3%) |
| $15,000 to $19,999 | 25 (3.5%) | 127 (21.8%) |
| $20,000 to $24,999 | 53 (7.3%) | 37 (6.4%) |
| $25,000 to $34,999 | 20 (2.8%) | 140 (24.0%) |
| $35,000 to $49,999 | 18 (2.5%) | 73 (12.5%) |
| $50,000 to $74,999 | 171 (23.6%) | 41 (7.0%) |
| $75,000 to $99,999 | 61 (8.4%) | 24 (4.1%) |
| $100,000 to $149,999 | 228 (31.5%) | 37 (6.4%) |
| $150,000 or more | 116 (16.0%) | 9 (1.5%) |
| Total | 724 (100.0%) | 583 (100.0%) |
Monthly Housing Cost Tiers in Lake Placid
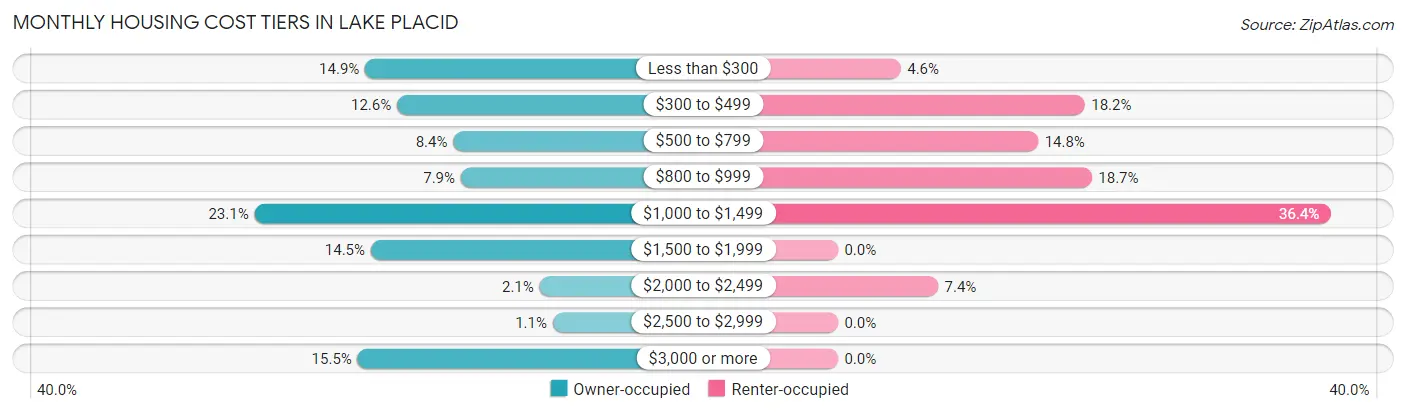
| Monthly Cost | Owner-occupied | Renter-occupied |
| Less than $300 | 108 (14.9%) | 27 (4.6%) |
| $300 to $499 | 91 (12.6%) | 106 (18.2%) |
| $500 to $799 | 61 (8.4%) | 86 (14.7%) |
| $800 to $999 | 57 (7.9%) | 109 (18.7%) |
| $1,000 to $1,499 | 167 (23.1%) | 212 (36.4%) |
| $1,500 to $1,999 | 105 (14.5%) | 0 (0.0%) |
| $2,000 to $2,499 | 15 (2.1%) | 43 (7.4%) |
| $2,500 to $2,999 | 8 (1.1%) | 0 (0.0%) |
| $3,000 or more | 112 (15.5%) | 0 (0.0%) |
| Total | 724 (100.0%) | 583 (100.0%) |
Physical Housing Characteristics in Lake Placid
Housing Structures in Lake Placid
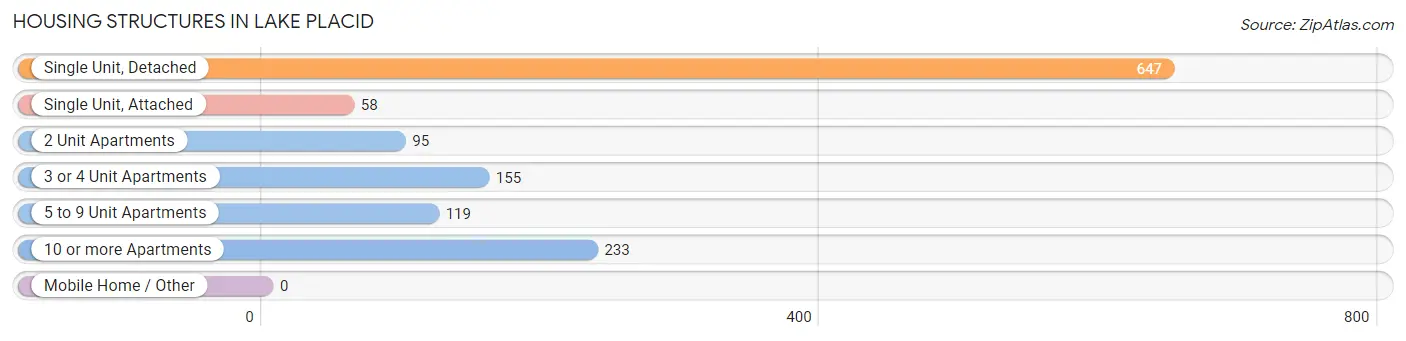
| Structure Type | # Housing Units | % Housing Units |
| Single Unit, Detached | 647 | 49.5% |
| Single Unit, Attached | 58 | 4.4% |
| 2 Unit Apartments | 95 | 7.3% |
| 3 or 4 Unit Apartments | 155 | 11.9% |
| 5 to 9 Unit Apartments | 119 | 9.1% |
| 10 or more Apartments | 233 | 17.8% |
| Mobile Home / Other | 0 | 0.0% |
| Total | 1,307 | 100.0% |
Housing Structures by Occupancy in Lake Placid
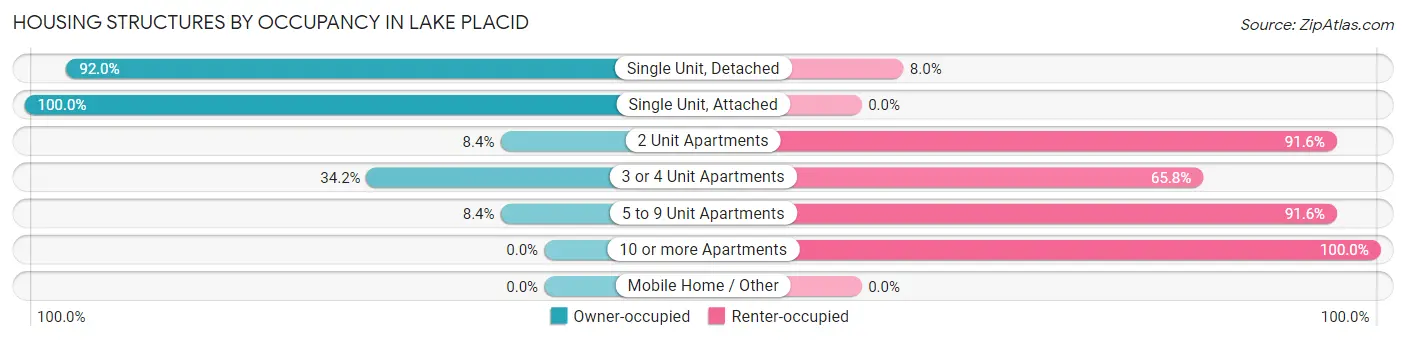
| Structure Type | Owner-occupied | Renter-occupied |
| Single Unit, Detached | 595 (92.0%) | 52 (8.0%) |
| Single Unit, Attached | 58 (100.0%) | 0 (0.0%) |
| 2 Unit Apartments | 8 (8.4%) | 87 (91.6%) |
| 3 or 4 Unit Apartments | 53 (34.2%) | 102 (65.8%) |
| 5 to 9 Unit Apartments | 10 (8.4%) | 109 (91.6%) |
| 10 or more Apartments | 0 (0.0%) | 233 (100.0%) |
| Mobile Home / Other | 0 (0.0%) | 0 (0.0%) |
| Total | 724 (55.4%) | 583 (44.6%) |
Housing Structures by Number of Rooms in Lake Placid
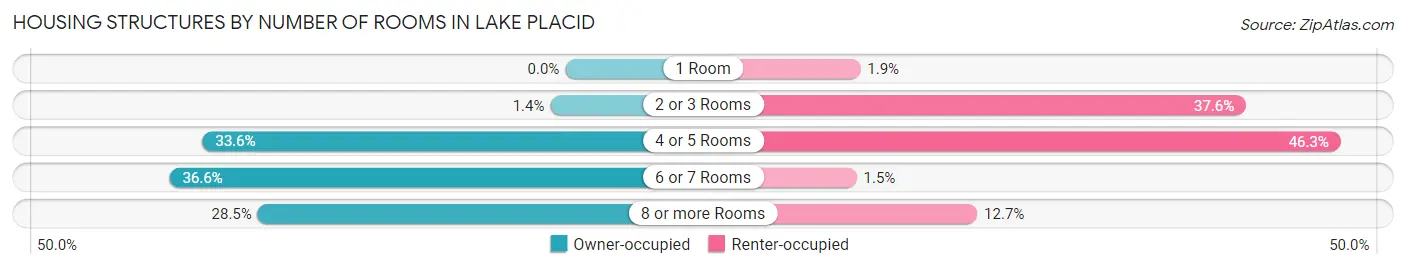
| Number of Rooms | Owner-occupied | Renter-occupied |
| 1 Room | 0 (0.0%) | 11 (1.9%) |
| 2 or 3 Rooms | 10 (1.4%) | 219 (37.6%) |
| 4 or 5 Rooms | 243 (33.6%) | 270 (46.3%) |
| 6 or 7 Rooms | 265 (36.6%) | 9 (1.5%) |
| 8 or more Rooms | 206 (28.4%) | 74 (12.7%) |
| Total | 724 (100.0%) | 583 (100.0%) |
Housing Structure by Heating Type in Lake Placid
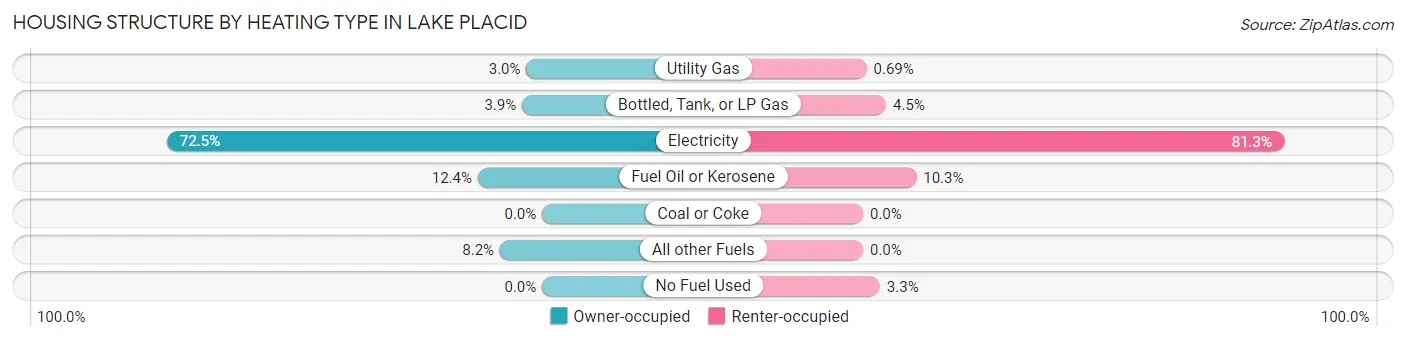
| Heating Type | Owner-occupied | Renter-occupied |
| Utility Gas | 22 (3.0%) | 4 (0.7%) |
| Bottled, Tank, or LP Gas | 28 (3.9%) | 26 (4.5%) |
| Electricity | 525 (72.5%) | 474 (81.3%) |
| Fuel Oil or Kerosene | 90 (12.4%) | 60 (10.3%) |
| Coal or Coke | 0 (0.0%) | 0 (0.0%) |
| All other Fuels | 59 (8.2%) | 0 (0.0%) |
| No Fuel Used | 0 (0.0%) | 19 (3.3%) |
| Total | 724 (100.0%) | 583 (100.0%) |
Household Vehicle Usage in Lake Placid
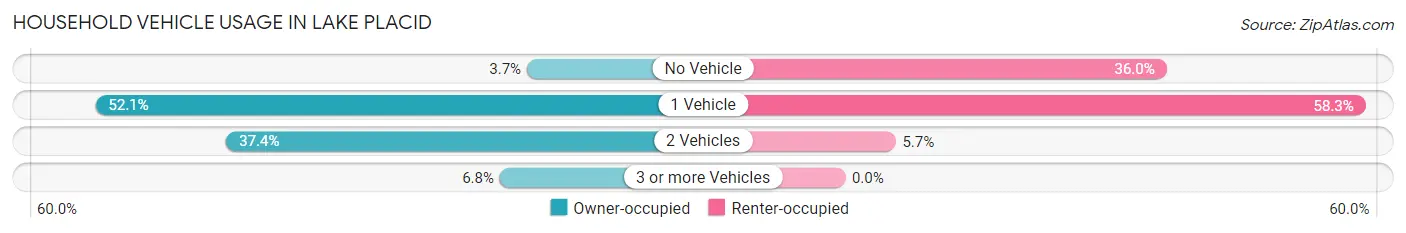
| Vehicles per Household | Owner-occupied | Renter-occupied |
| No Vehicle | 27 (3.7%) | 210 (36.0%) |
| 1 Vehicle | 377 (52.1%) | 340 (58.3%) |
| 2 Vehicles | 271 (37.4%) | 33 (5.7%) |
| 3 or more Vehicles | 49 (6.8%) | 0 (0.0%) |
| Total | 724 (100.0%) | 583 (100.0%) |
Real Estate & Mortgages in Lake Placid
Real Estate and Mortgage Overview in Lake Placid
| Characteristic | Without Mortgage | With Mortgage |
| Housing Units | 426 | 298 |
| Median Property Value | $300,000 | $438,500 |
| Median Household Income | $69,235 | $54 |
| Monthly Housing Costs | $529 | $112 |
| Real Estate Taxes | $2,571 | $0 |
Property Value by Mortgage Status in Lake Placid
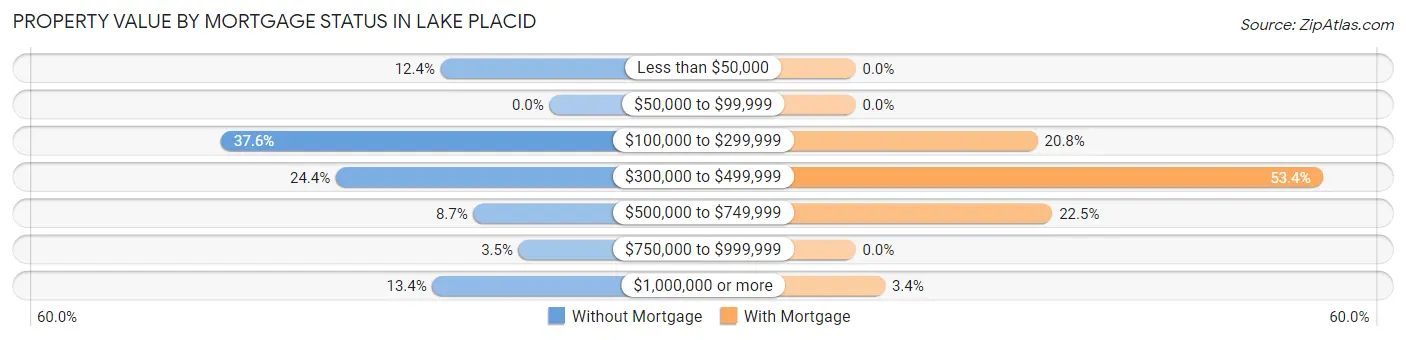
| Property Value | Without Mortgage | With Mortgage |
| Less than $50,000 | 53 (12.4%) | 0 (0.0%) |
| $50,000 to $99,999 | 0 (0.0%) | 0 (0.0%) |
| $100,000 to $299,999 | 160 (37.6%) | 62 (20.8%) |
| $300,000 to $499,999 | 104 (24.4%) | 159 (53.4%) |
| $500,000 to $749,999 | 37 (8.7%) | 67 (22.5%) |
| $750,000 to $999,999 | 15 (3.5%) | 0 (0.0%) |
| $1,000,000 or more | 57 (13.4%) | 10 (3.4%) |
| Total | 426 (100.0%) | 298 (100.0%) |
Household Income by Mortgage Status in Lake Placid
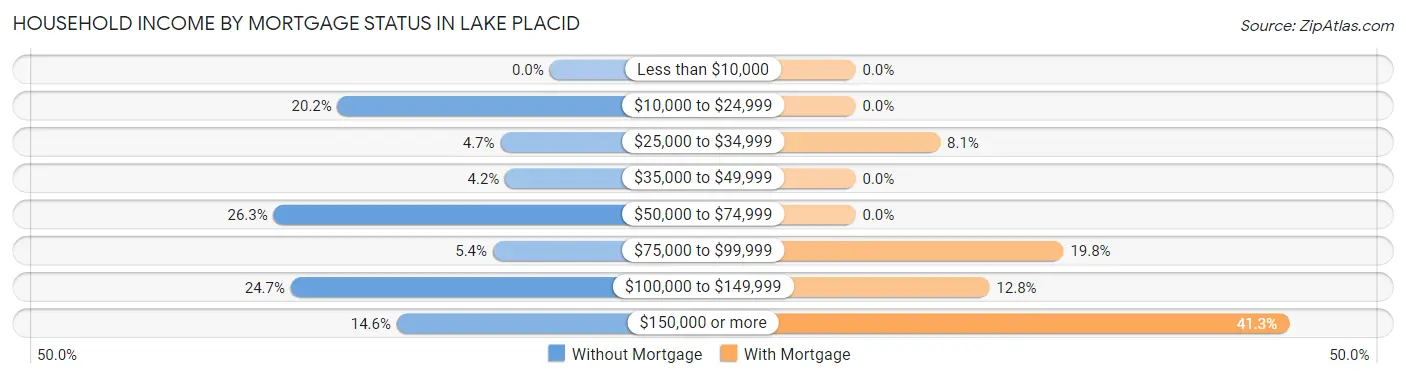
| Household Income | Without Mortgage | With Mortgage |
| Less than $10,000 | 0 (0.0%) | 0 (0.0%) |
| $10,000 to $24,999 | 86 (20.2%) | 0 (0.0%) |
| $25,000 to $34,999 | 20 (4.7%) | 24 (8.1%) |
| $35,000 to $49,999 | 18 (4.2%) | 0 (0.0%) |
| $50,000 to $74,999 | 112 (26.3%) | 0 (0.0%) |
| $75,000 to $99,999 | 23 (5.4%) | 59 (19.8%) |
| $100,000 to $149,999 | 105 (24.6%) | 38 (12.8%) |
| $150,000 or more | 62 (14.5%) | 123 (41.3%) |
| Total | 426 (100.0%) | 298 (100.0%) |
Property Value to Household Income Ratio in Lake Placid
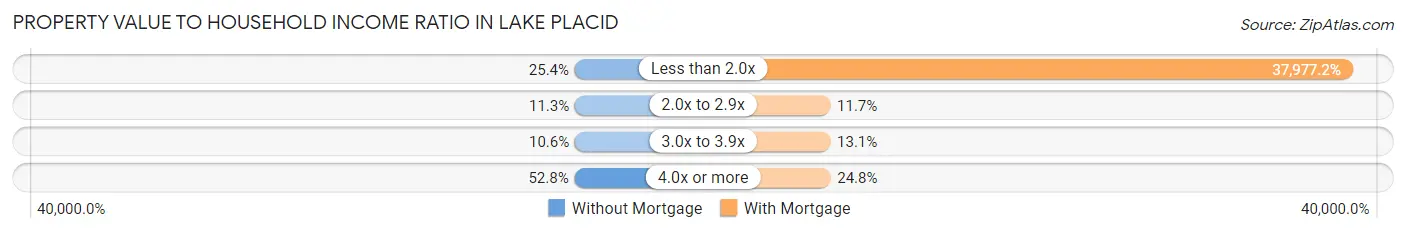
| Value-to-Income Ratio | Without Mortgage | With Mortgage |
| Less than 2.0x | 108 (25.4%) | 113,172 (37,977.2%) |
| 2.0x to 2.9x | 48 (11.3%) | 35 (11.7%) |
| 3.0x to 3.9x | 45 (10.6%) | 39 (13.1%) |
| 4.0x or more | 225 (52.8%) | 74 (24.8%) |
| Total | 426 (100.0%) | 298 (100.0%) |
Real Estate Taxes by Mortgage Status in Lake Placid
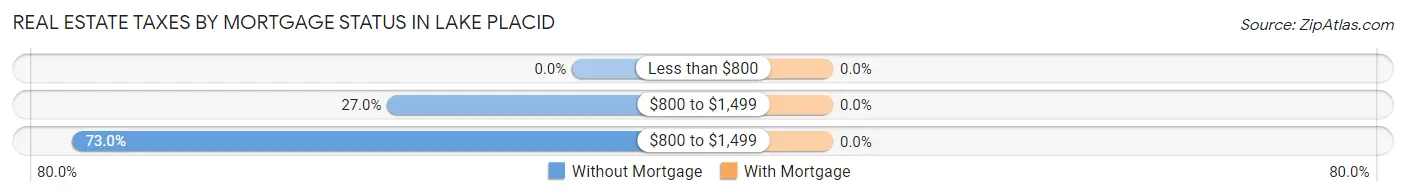
| Property Taxes | Without Mortgage | With Mortgage |
| Less than $800 | 0 (0.0%) | 0 (0.0%) |
| $800 to $1,499 | 115 (27.0%) | 0 (0.0%) |
| $800 to $1,499 | 311 (73.0%) | 0 (0.0%) |
| Total | 426 (100.0%) | 298 (100.0%) |
Health & Disability in Lake Placid
Health Insurance Coverage by Age in Lake Placid
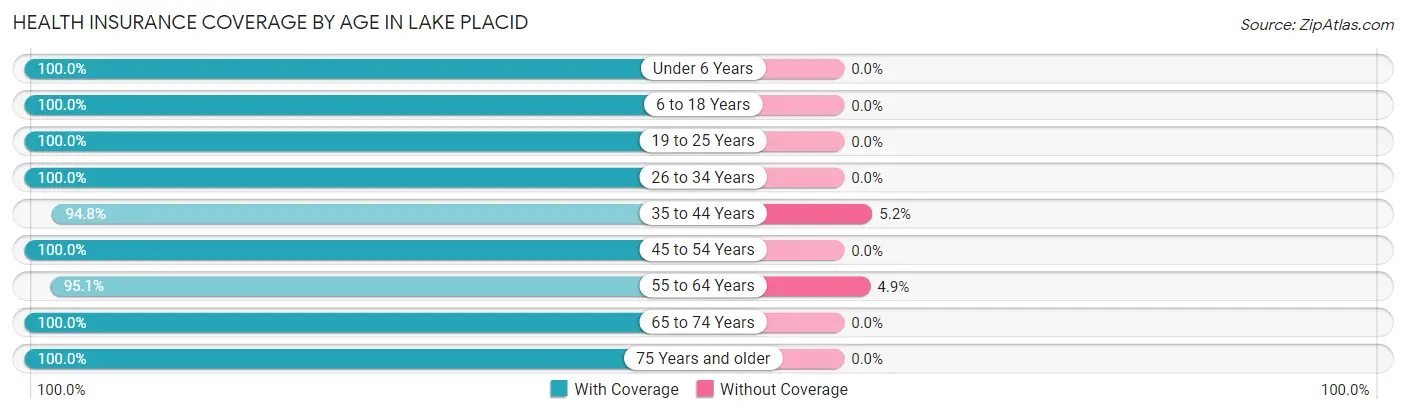
| Age Bracket | With Coverage | Without Coverage |
| Under 6 Years | 70 (100.0%) | 0 (0.0%) |
| 6 to 18 Years | 252 (100.0%) | 0 (0.0%) |
| 19 to 25 Years | 194 (100.0%) | 0 (0.0%) |
| 26 to 34 Years | 337 (100.0%) | 0 (0.0%) |
| 35 to 44 Years | 163 (94.8%) | 9 (5.2%) |
| 45 to 54 Years | 314 (100.0%) | 0 (0.0%) |
| 55 to 64 Years | 488 (95.1%) | 25 (4.9%) |
| 65 to 74 Years | 306 (100.0%) | 0 (0.0%) |
| 75 Years and older | 122 (100.0%) | 0 (0.0%) |
| Total | 2,246 (98.5%) | 34 (1.5%) |
Health Insurance Coverage by Citizenship Status in Lake Placid
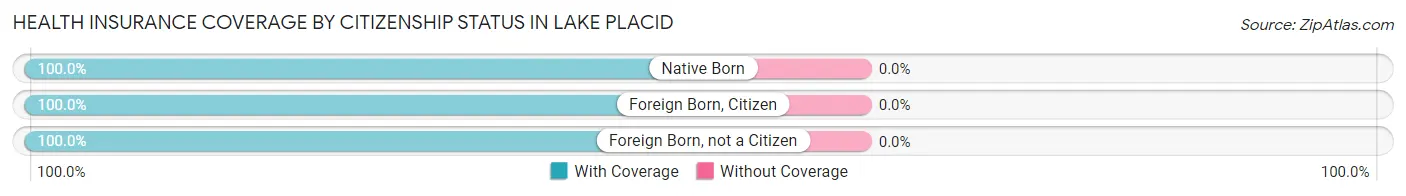
| Citizenship Status | With Coverage | Without Coverage |
| Native Born | 70 (100.0%) | 0 (0.0%) |
| Foreign Born, Citizen | 252 (100.0%) | 0 (0.0%) |
| Foreign Born, not a Citizen | 194 (100.0%) | 0 (0.0%) |
Health Insurance Coverage by Household Income in Lake Placid
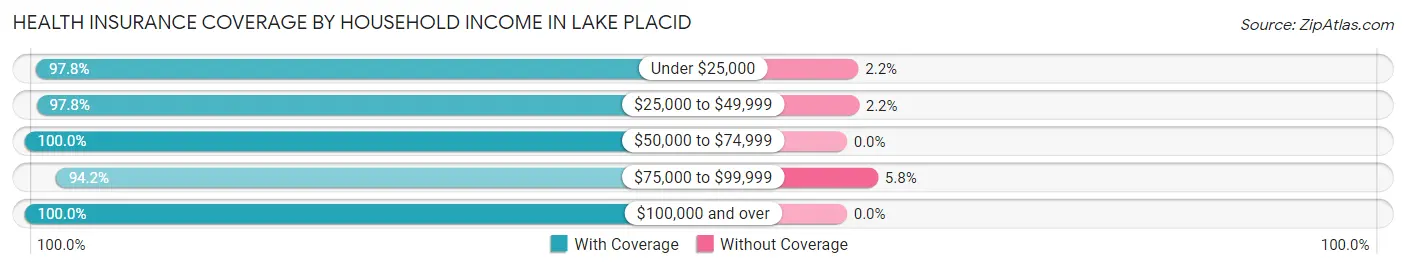
| Household Income | With Coverage | Without Coverage |
| Under $25,000 | 499 (97.8%) | 11 (2.2%) |
| $25,000 to $49,999 | 392 (97.8%) | 9 (2.2%) |
| $50,000 to $74,999 | 294 (100.0%) | 0 (0.0%) |
| $75,000 to $99,999 | 226 (94.2%) | 14 (5.8%) |
| $100,000 and over | 805 (100.0%) | 0 (0.0%) |
Public vs Private Health Insurance Coverage by Age in Lake Placid
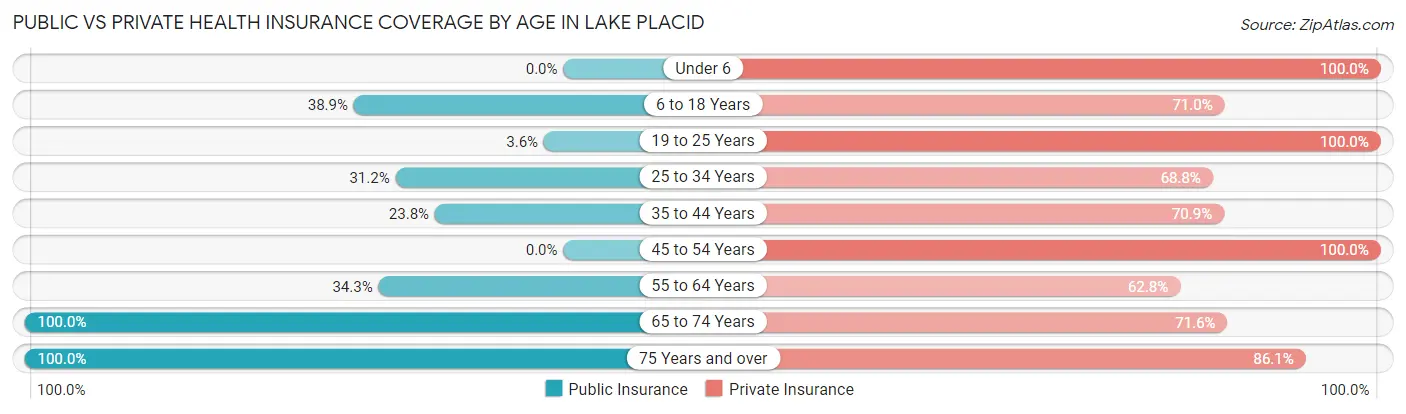
| Age Bracket | Public Insurance | Private Insurance |
| Under 6 | 0 (0.0%) | 70 (100.0%) |
| 6 to 18 Years | 98 (38.9%) | 179 (71.0%) |
| 19 to 25 Years | 7 (3.6%) | 194 (100.0%) |
| 25 to 34 Years | 105 (31.2%) | 232 (68.8%) |
| 35 to 44 Years | 41 (23.8%) | 122 (70.9%) |
| 45 to 54 Years | 0 (0.0%) | 314 (100.0%) |
| 55 to 64 Years | 176 (34.3%) | 322 (62.8%) |
| 65 to 74 Years | 306 (100.0%) | 219 (71.6%) |
| 75 Years and over | 122 (100.0%) | 105 (86.1%) |
| Total | 855 (37.5%) | 1,757 (77.1%) |
Disability Status by Sex by Age in Lake Placid
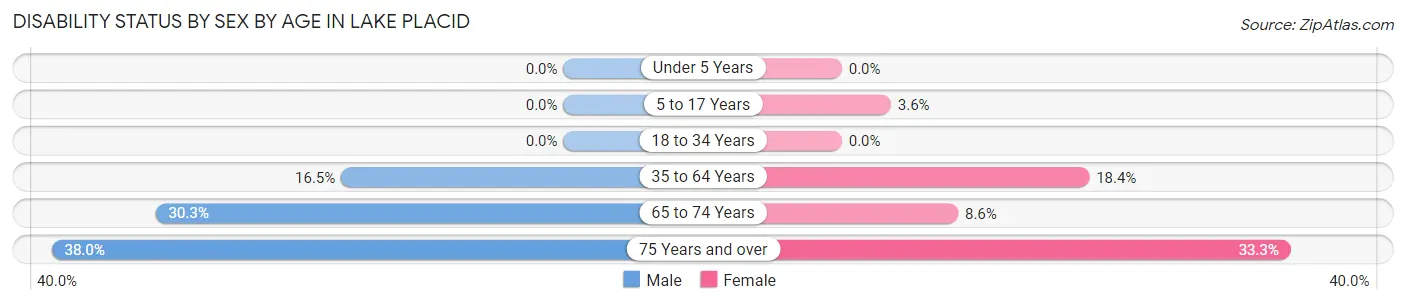
| Age Bracket | Male | Female |
| Under 5 Years | 0 (0.0%) | 0 (0.0%) |
| 5 to 17 Years | 0 (0.0%) | 4 (3.6%) |
| 18 to 34 Years | 0 (0.0%) | 0 (0.0%) |
| 35 to 64 Years | 84 (16.5%) | 90 (18.4%) |
| 65 to 74 Years | 33 (30.3%) | 17 (8.6%) |
| 75 Years and over | 19 (38.0%) | 24 (33.3%) |
Disability Class by Sex by Age in Lake Placid
Disability Class: Hearing Difficulty
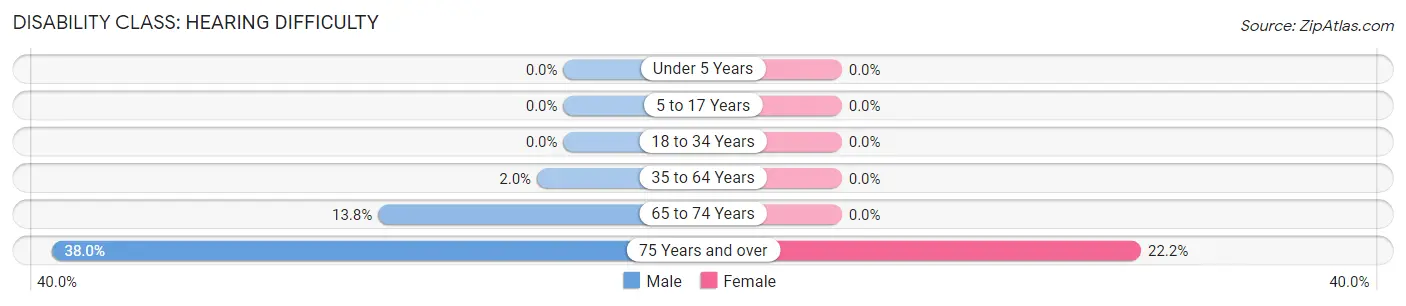
| Age Bracket | Male | Female |
| Under 5 Years | 0 (0.0%) | 0 (0.0%) |
| 5 to 17 Years | 0 (0.0%) | 0 (0.0%) |
| 18 to 34 Years | 0 (0.0%) | 0 (0.0%) |
| 35 to 64 Years | 10 (2.0%) | 0 (0.0%) |
| 65 to 74 Years | 15 (13.8%) | 0 (0.0%) |
| 75 Years and over | 19 (38.0%) | 16 (22.2%) |
Disability Class: Vision Difficulty
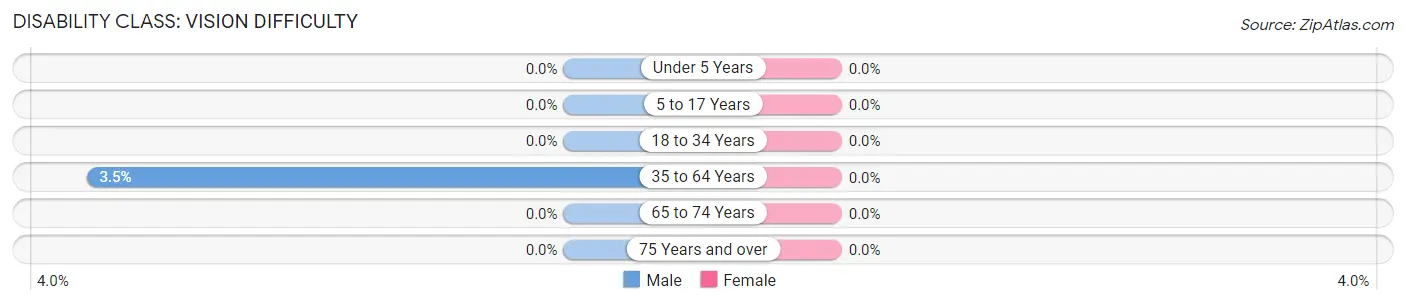
| Age Bracket | Male | Female |
| Under 5 Years | 0 (0.0%) | 0 (0.0%) |
| 5 to 17 Years | 0 (0.0%) | 0 (0.0%) |
| 18 to 34 Years | 0 (0.0%) | 0 (0.0%) |
| 35 to 64 Years | 18 (3.5%) | 0 (0.0%) |
| 65 to 74 Years | 0 (0.0%) | 0 (0.0%) |
| 75 Years and over | 0 (0.0%) | 0 (0.0%) |
Disability Class: Cognitive Difficulty
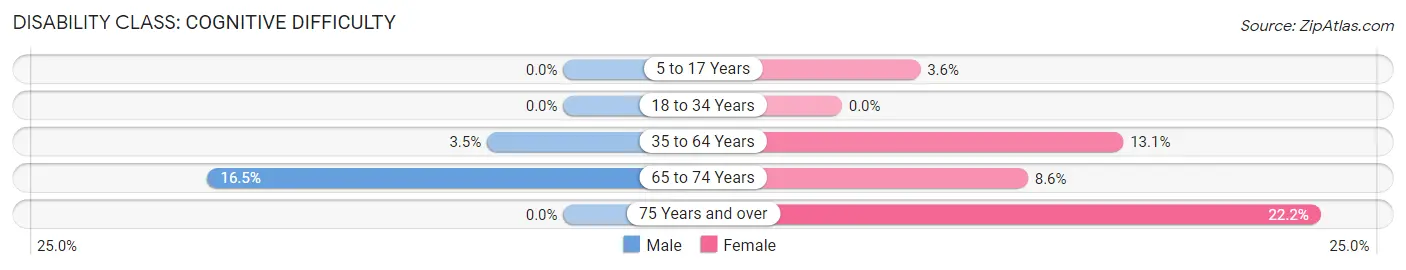
| Age Bracket | Male | Female |
| 5 to 17 Years | 0 (0.0%) | 4 (3.6%) |
| 18 to 34 Years | 0 (0.0%) | 0 (0.0%) |
| 35 to 64 Years | 18 (3.5%) | 64 (13.1%) |
| 65 to 74 Years | 18 (16.5%) | 17 (8.6%) |
| 75 Years and over | 0 (0.0%) | 16 (22.2%) |
Disability Class: Ambulatory Difficulty
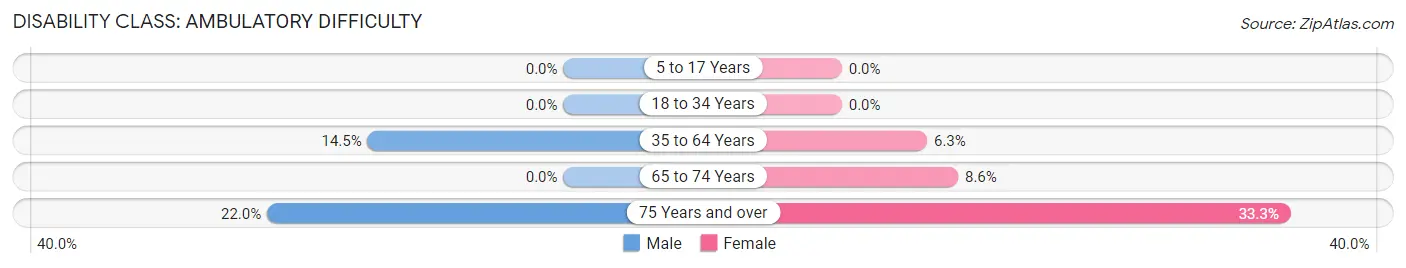
| Age Bracket | Male | Female |
| 5 to 17 Years | 0 (0.0%) | 0 (0.0%) |
| 18 to 34 Years | 0 (0.0%) | 0 (0.0%) |
| 35 to 64 Years | 74 (14.5%) | 31 (6.3%) |
| 65 to 74 Years | 0 (0.0%) | 17 (8.6%) |
| 75 Years and over | 11 (22.0%) | 24 (33.3%) |
Disability Class: Self-Care Difficulty
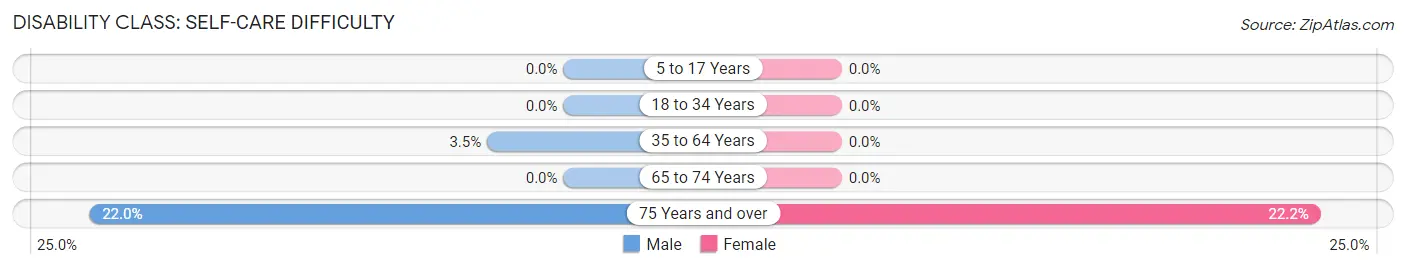
| Age Bracket | Male | Female |
| 5 to 17 Years | 0 (0.0%) | 0 (0.0%) |
| 18 to 34 Years | 0 (0.0%) | 0 (0.0%) |
| 35 to 64 Years | 18 (3.5%) | 0 (0.0%) |
| 65 to 74 Years | 0 (0.0%) | 0 (0.0%) |
| 75 Years and over | 11 (22.0%) | 16 (22.2%) |
Technology Access in Lake Placid
Computing Device Access in Lake Placid
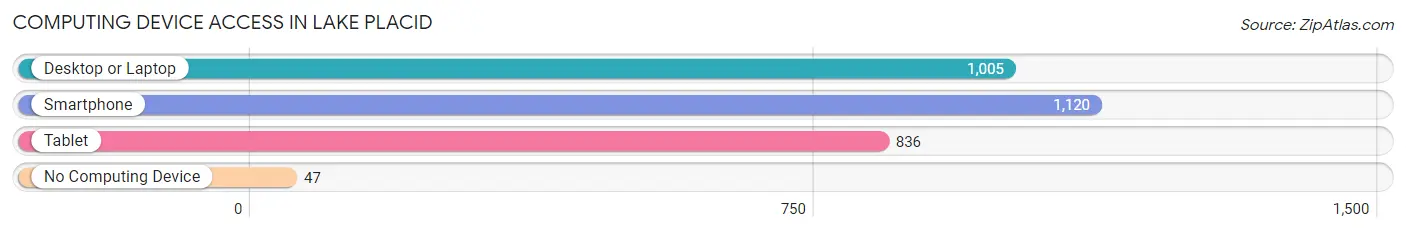
| Device Type | # Households | % Households |
| Desktop or Laptop | 1,005 | 76.9% |
| Smartphone | 1,120 | 85.7% |
| Tablet | 836 | 64.0% |
| No Computing Device | 47 | 3.6% |
| Total | 1,307 | 100.0% |
Internet Access in Lake Placid
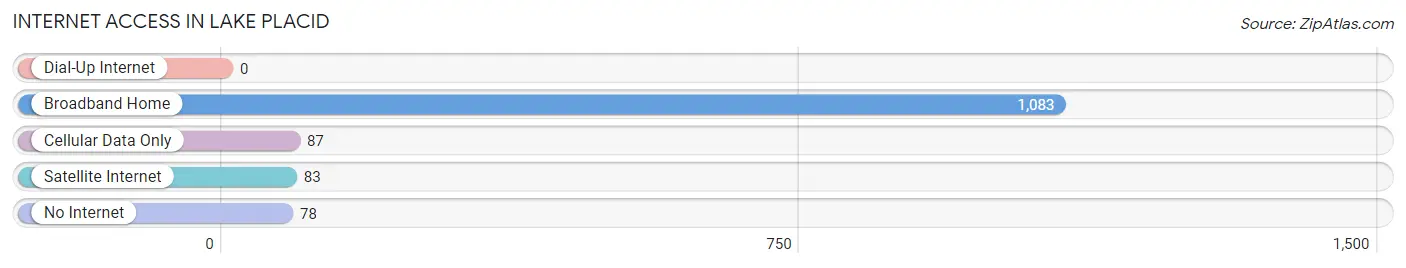
| Internet Type | # Households | % Households |
| Dial-Up Internet | 0 | 0.0% |
| Broadband Home | 1,083 | 82.9% |
| Cellular Data Only | 87 | 6.7% |
| Satellite Internet | 83 | 6.4% |
| No Internet | 78 | 6.0% |
| Total | 1,307 | 100.0% |
Lake Placid Summary
Lake Placid is a village located in the Adirondack Mountains of upstate New York. It is the county seat of Essex County and is situated in the High Peaks region of the Adirondacks. The village is best known for hosting the 1932 and 1980 Winter Olympics. It is also home to the Lake Placid Olympic Center, which is a multi-sport complex that includes two ice rinks, a ski jump, and a bobsled track.
History
The area that is now Lake Placid was first settled in the early 19th century by settlers from New England. The village was officially incorporated in 1900 and was named after the nearby lake. The village was a popular tourist destination in the early 20th century, and it was the site of the 1932 and 1980 Winter Olympics. The village has also been the site of several world-class sporting events, including the World Cup in bobsledding, luge, and ski jumping.
Geography
Lake Placid is located in the Adirondack Mountains of upstate New York. It is situated in the High Peaks region of the Adirondacks, which is known for its rugged terrain and picturesque views. The village is located on the shores of Mirror Lake and is surrounded by the Adirondack Park. The village is located approximately 75 miles north of Albany and is accessible by car via the Adirondack Northway (I-87).
Economy
The economy of Lake Placid is largely driven by tourism. The village is home to several ski resorts, including Whiteface Mountain, which is the site of the 1980 Winter Olympics. The village is also home to the Lake Placid Olympic Center, which is a multi-sport complex that includes two ice rinks, a ski jump, and a bobsled track. The village is also home to several restaurants, shops, and hotels.
Demographics
As of the 2010 census, the population of Lake Placid was 2,521. The racial makeup of the village was 97.2% White, 0.7% African American, 0.3% Native American, 0.4% Asian, 0.1% Pacific Islander, 0.3% from other races, and 1.0% from two or more races. The median household income in the village was $45,941, and the median family income was $54,818. The per capita income in the village was $25,945.
Common Questions
What is Per Capita Income in Lake Placid?
Per Capita income in Lake Placid is $42,199.
What is the Median Family Income in Lake Placid?
Median Family Income in Lake Placid is $113,414.
What is the Median Household income in Lake Placid?
Median Household Income in Lake Placid is $53,475.
What is Income or Wage Gap in Lake Placid?
Income or Wage Gap in Lake Placid is 49.0%.
Women in Lake Placid earn 51.0 cents for every dollar earned by a man.
What is Inequality or Gini Index in Lake Placid?
Inequality or Gini Index in Lake Placid is 0.46.
What is the Total Population of Lake Placid?
Total Population of Lake Placid is 2,280.
What is the Total Male Population of Lake Placid?
Total Male Population of Lake Placid is 982.
What is the Total Female Population of Lake Placid?
Total Female Population of Lake Placid is 1,298.
What is the Ratio of Males per 100 Females in Lake Placid?
There are 75.65 Males per 100 Females in Lake Placid.
What is the Ratio of Females per 100 Males in Lake Placid?
There are 132.18 Females per 100 Males in Lake Placid.
What is the Median Population Age in Lake Placid?
Median Population Age in Lake Placid is 51.2 Years.
What is the Average Family Size in Lake Placid
Average Family Size in Lake Placid is 2.5 People.
What is the Average Household Size in Lake Placid
Average Household Size in Lake Placid is 1.7 People.
How Large is the Labor Force in Lake Placid?
There are 1,311 People in the Labor Forcein in Lake Placid.
What is the Percentage of People in the Labor Force in Lake Placid?
66.8% of People are in the Labor Force in Lake Placid.