Lacrosse, WA Map & Demographics
Lacrosse Map
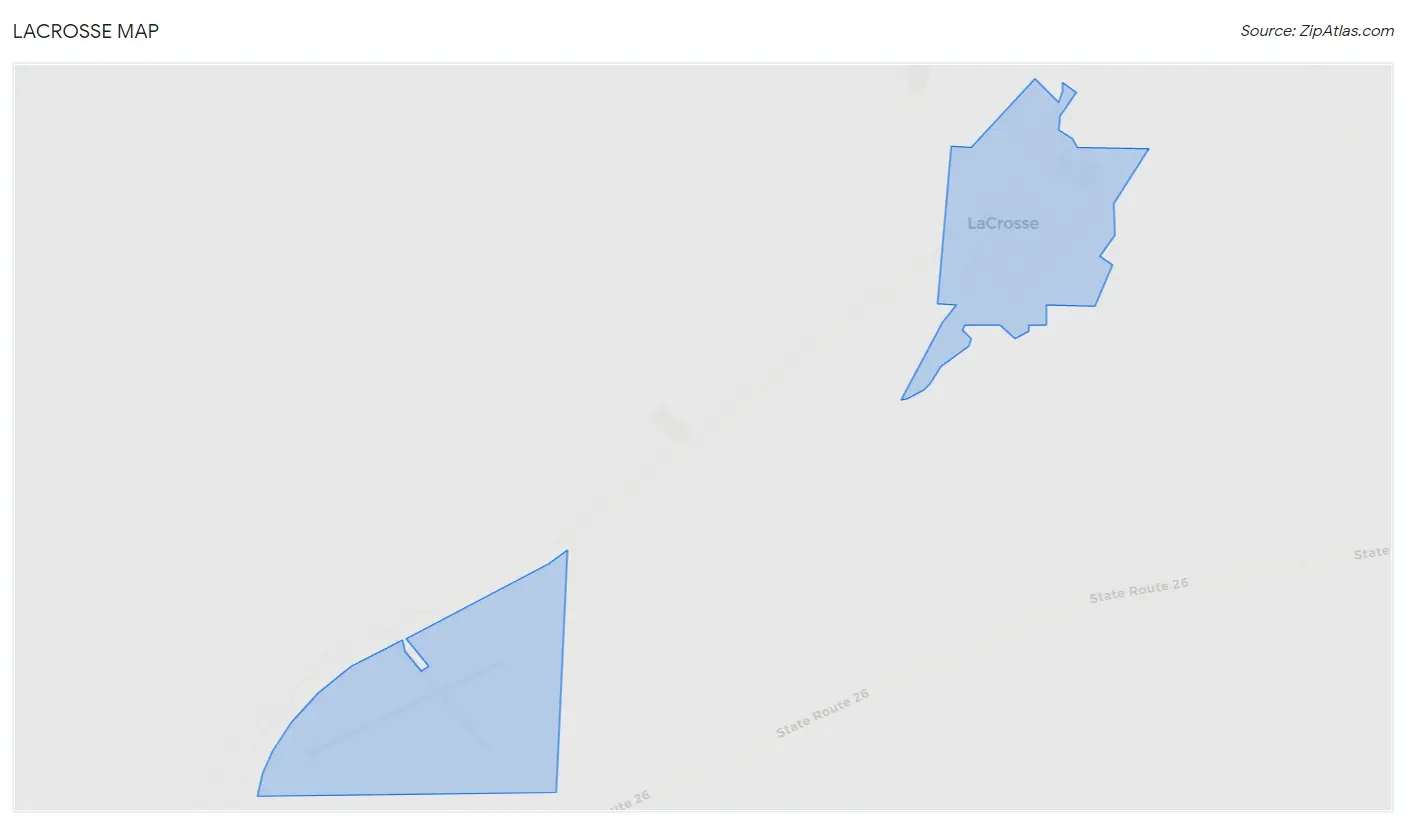
Lacrosse Overview
$21,124
PER CAPITA INCOME
$31,653
AVG FAMILY INCOME
$31,369
AVG HOUSEHOLD INCOME
0.41
INEQUALITY / GINI INDEX
417
TOTAL POPULATION
222
MALE POPULATION
195
FEMALE POPULATION
113.85
MALES / 100 FEMALES
87.84
FEMALES / 100 MALES
55.7
MEDIAN AGE
2.1
AVG FAMILY SIZE
1.9
AVG HOUSEHOLD SIZE
176
LABOR FORCE [ PEOPLE ]
51.6%
PERCENT IN LABOR FORCE
Lacrosse Zip Codes
Lacrosse Area Codes
Income in Lacrosse
Income Overview in Lacrosse
Per Capita Income in Lacrosse is $21,124, while median incomes of families and households are $31,653 and $31,369 respectively.
| Characteristic | Number | Measure |
| Per Capita Income | 417 | $21,124 |
| Median Family Income | 144 | $31,653 |
| Mean Family Income | 144 | $44,897 |
| Median Household Income | 225 | $31,369 |
| Mean Household Income | 225 | $42,944 |
| Income Deficit | 144 | $0 |
| Wage / Income Gap (%) | 417 | 0.00% |
| Wage / Income Gap ($) | 417 | 100.00¢ per $1 |
| Gini / Inequality Index | 417 | 0.41 |
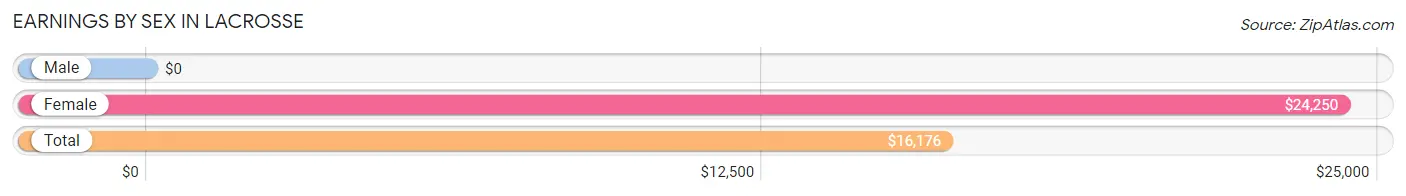
Earnings by Sex in Lacrosse
| Sex | Number | Average Earnings |
| Male | 127 (66.1%) | $0 |
| Female | 65 (33.9%) | $24,250 |
| Total | 192 (100.0%) | $16,176 |
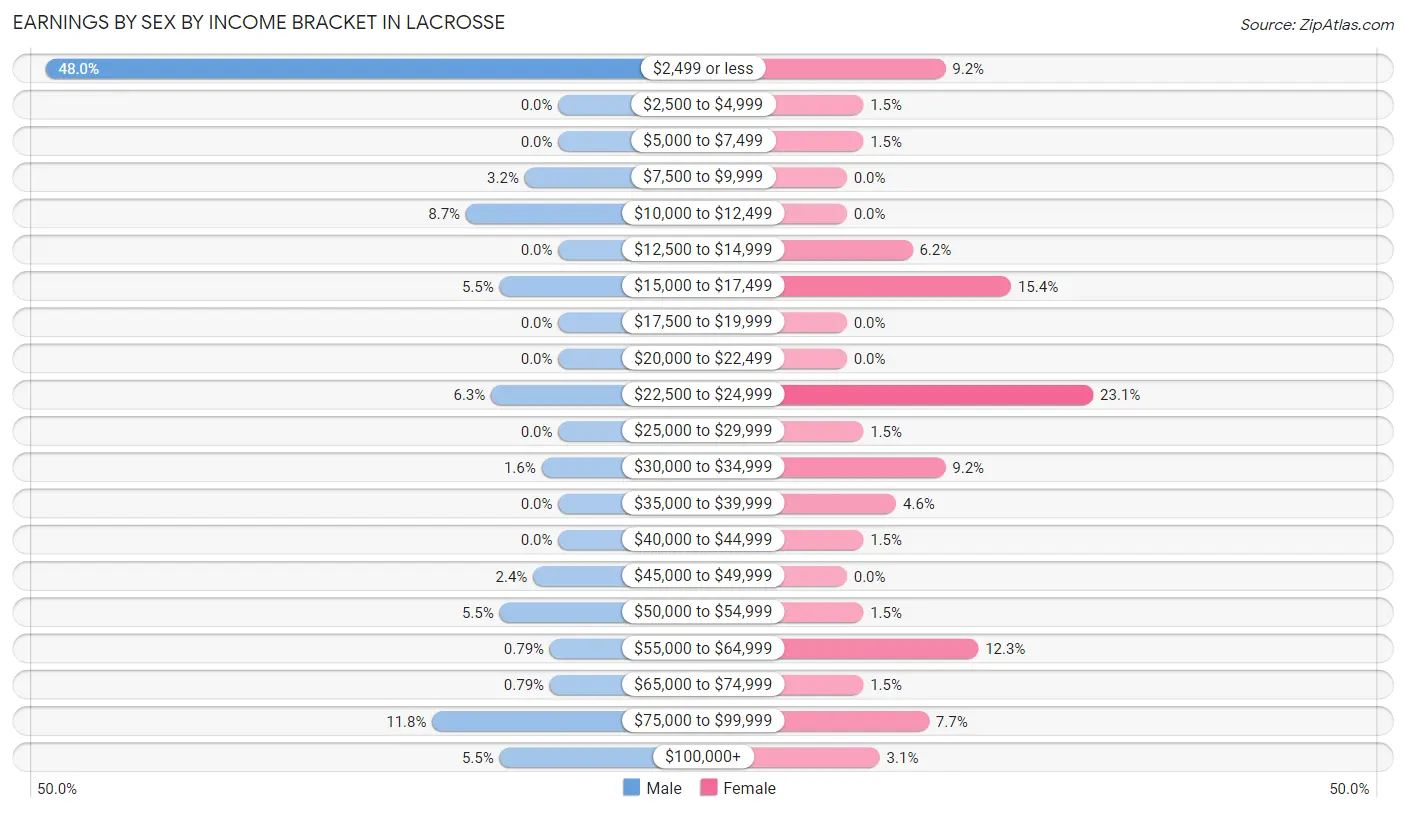
Earnings by Sex by Income Bracket in Lacrosse
The most common earnings brackets in Lacrosse are $2,499 or less for men (61 | 48.0%) and $22,500 to $24,999 for women (15 | 23.1%).
| Income | Male | Female |
| $2,499 or less | 61 (48.0%) | 6 (9.2%) |
| $2,500 to $4,999 | 0 (0.0%) | 1 (1.5%) |
| $5,000 to $7,499 | 0 (0.0%) | 1 (1.5%) |
| $7,500 to $9,999 | 4 (3.2%) | 0 (0.0%) |
| $10,000 to $12,499 | 11 (8.7%) | 0 (0.0%) |
| $12,500 to $14,999 | 0 (0.0%) | 4 (6.1%) |
| $15,000 to $17,499 | 7 (5.5%) | 10 (15.4%) |
| $17,500 to $19,999 | 0 (0.0%) | 0 (0.0%) |
| $20,000 to $22,499 | 0 (0.0%) | 0 (0.0%) |
| $22,500 to $24,999 | 8 (6.3%) | 15 (23.1%) |
| $25,000 to $29,999 | 0 (0.0%) | 1 (1.5%) |
| $30,000 to $34,999 | 2 (1.6%) | 6 (9.2%) |
| $35,000 to $39,999 | 0 (0.0%) | 3 (4.6%) |
| $40,000 to $44,999 | 0 (0.0%) | 1 (1.5%) |
| $45,000 to $49,999 | 3 (2.4%) | 0 (0.0%) |
| $50,000 to $54,999 | 7 (5.5%) | 1 (1.5%) |
| $55,000 to $64,999 | 1 (0.8%) | 8 (12.3%) |
| $65,000 to $74,999 | 1 (0.8%) | 1 (1.5%) |
| $75,000 to $99,999 | 15 (11.8%) | 5 (7.7%) |
| $100,000+ | 7 (5.5%) | 2 (3.1%) |
| Total | 127 (100.0%) | 65 (100.0%) |
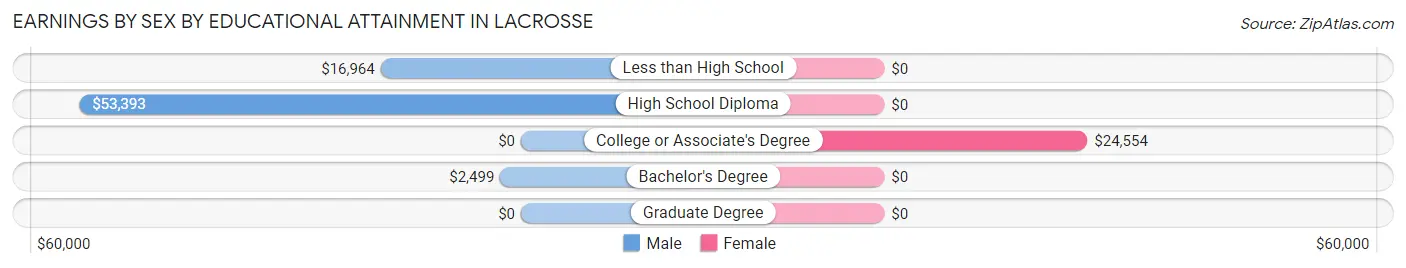
Earnings by Sex by Educational Attainment in Lacrosse
| Educational Attainment | Male Income | Female Income |
| Less than High School | $16,964 | $0 |
| High School Diploma | $53,393 | $0 |
| College or Associate's Degree | - | - |
| Bachelor's Degree | $2,499 | $0 |
| Graduate Degree | - | - |
| Total | - | - |
Family Income in Lacrosse
Family Income Brackets in Lacrosse
According to the Lacrosse family income data, there are 68 families falling into the $25,000 to $34,999 income range, which is the most common income bracket and makes up 47.2% of all families. Conversely, the $200,000+ income bracket is the least frequent group with only 2 families (1.4%) belonging to this category.
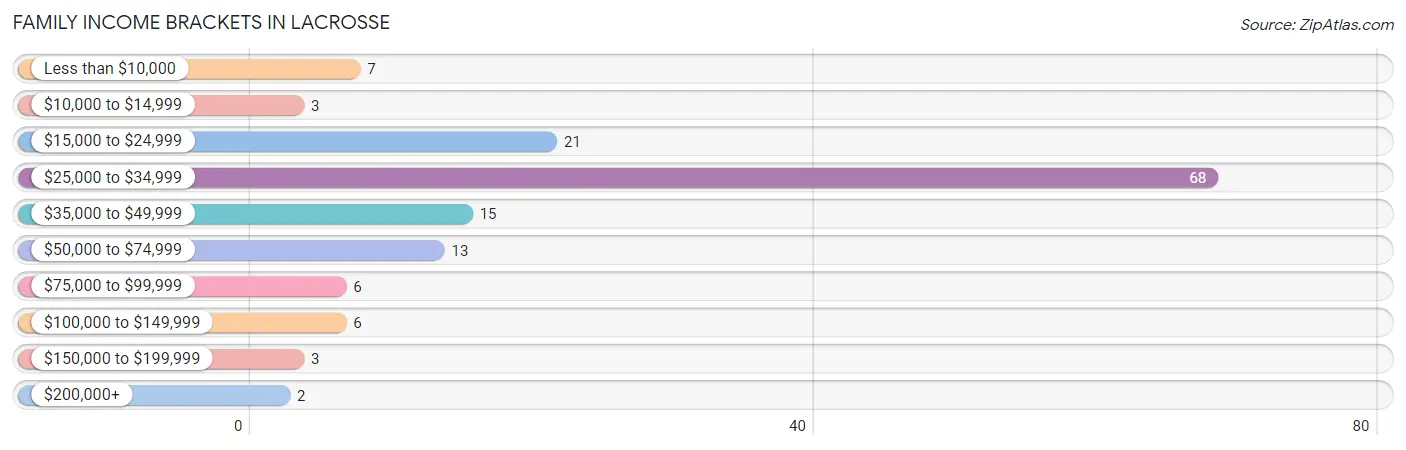
| Income Bracket | # Families | % Families |
| Less than $10,000 | 7 | 4.9% |
| $10,000 to $14,999 | 3 | 2.1% |
| $15,000 to $24,999 | 21 | 14.6% |
| $25,000 to $34,999 | 68 | 47.2% |
| $35,000 to $49,999 | 15 | 10.4% |
| $50,000 to $74,999 | 13 | 9.0% |
| $75,000 to $99,999 | 6 | 4.2% |
| $100,000 to $149,999 | 6 | 4.2% |
| $150,000 to $199,999 | 3 | 2.1% |
| $200,000+ | 2 | 1.4% |
Family Income by Famaliy Size in Lacrosse
2-person families (58 | 40.3%) account for the highest median family income in Lacrosse with $33,929 per family, while 2-person families (58 | 40.3%) have the highest median income of $16,964 per family member.
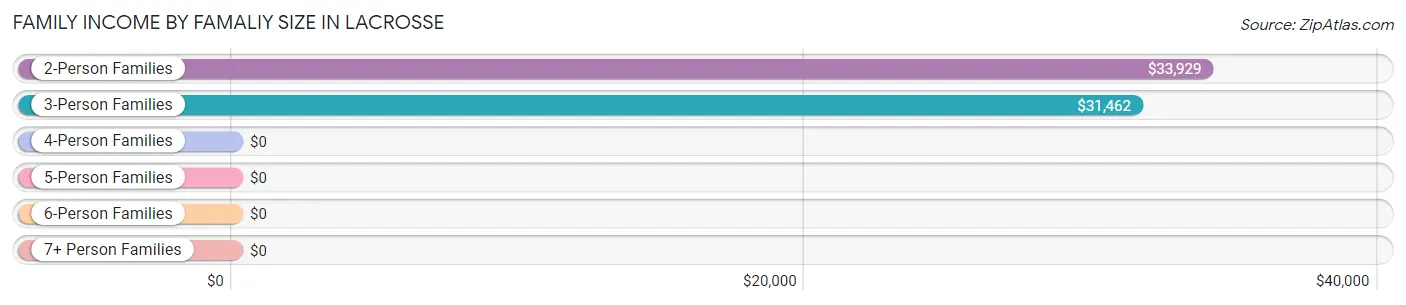
| Income Bracket | # Families | Median Income |
| 2-Person Families | 58 (40.3%) | $33,929 |
| 3-Person Families | 75 (52.1%) | $31,462 |
| 4-Person Families | 10 (6.9%) | $0 |
| 5-Person Families | 1 (0.7%) | $0 |
| 6-Person Families | 0 (0.0%) | $0 |
| 7+ Person Families | 0 (0.0%) | $0 |
| Total | 144 (100.0%) | $31,653 |
Family Income by Number of Earners in Lacrosse
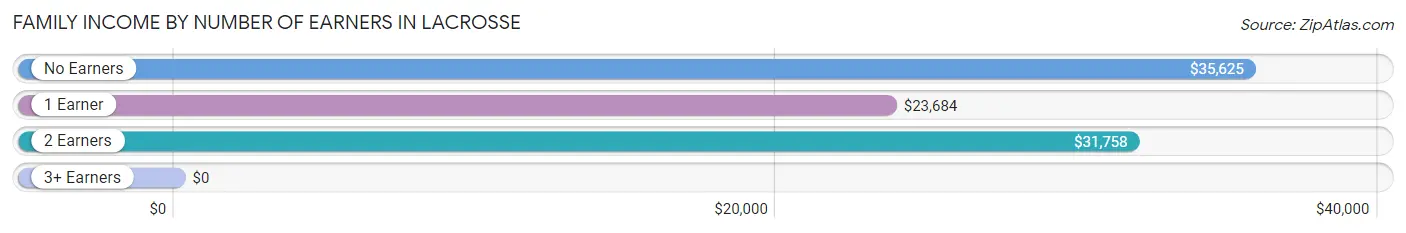
| Number of Earners | # Families | Median Income |
| No Earners | 28 (19.4%) | $35,625 |
| 1 Earner | 32 (22.2%) | $23,684 |
| 2 Earners | 83 (57.6%) | $31,758 |
| 3+ Earners | 1 (0.7%) | $0 |
| Total | 144 (100.0%) | $31,653 |
Household Income in Lacrosse
Household Income Brackets in Lacrosse
With 74 households falling in the category, the $25,000 to $34,999 income range is the most frequent in Lacrosse, accounting for 32.9% of all households. In contrast, only 2 households (0.9%) fall into the $200,000+ income bracket, making it the least populous group.
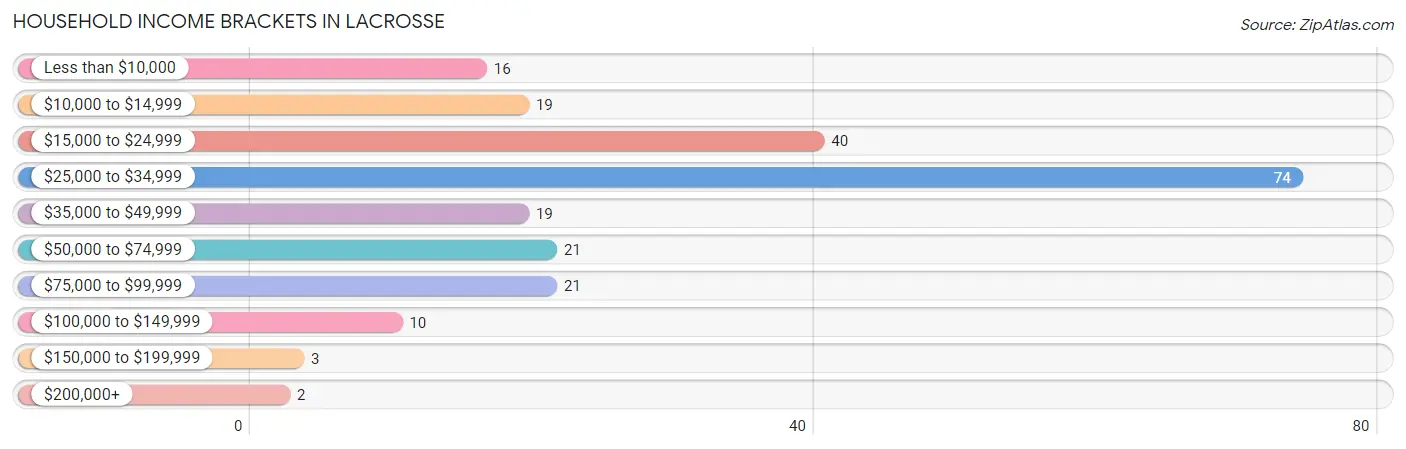
| Income Bracket | # Households | % Households |
| Less than $10,000 | 16 | 7.1% |
| $10,000 to $14,999 | 19 | 8.4% |
| $15,000 to $24,999 | 40 | 17.8% |
| $25,000 to $34,999 | 74 | 32.9% |
| $35,000 to $49,999 | 19 | 8.4% |
| $50,000 to $74,999 | 21 | 9.3% |
| $75,000 to $99,999 | 21 | 9.3% |
| $100,000 to $149,999 | 10 | 4.4% |
| $150,000 to $199,999 | 3 | 1.3% |
| $200,000+ | 2 | 0.9% |
Household Income by Householder Age in Lacrosse
The median household income in Lacrosse is $31,369, with the highest median household income of $63,750 found in the 25 to 44 years age bracket for the primary householder. A total of 18 households (8.0%) fall into this category.
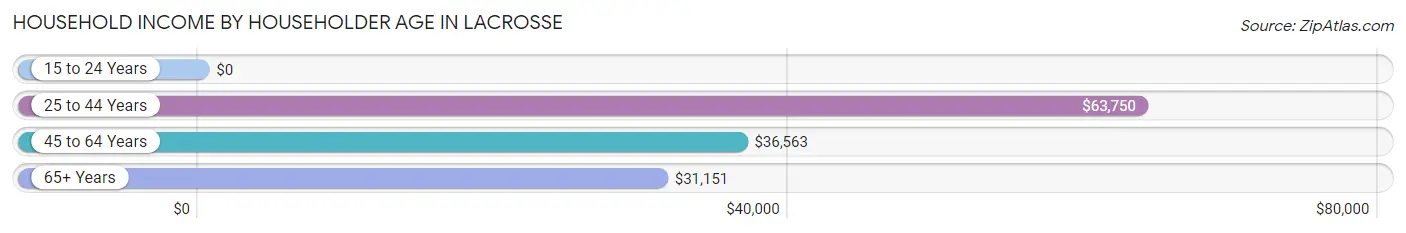
| Income Bracket | # Households | Median Income |
| 15 to 24 Years | 0 (0.0%) | $0 |
| 25 to 44 Years | 18 (8.0%) | $63,750 |
| 45 to 64 Years | 103 (45.8%) | $36,563 |
| 65+ Years | 104 (46.2%) | $31,151 |
| Total | 225 (100.0%) | $31,369 |
Poverty in Lacrosse
Income Below Poverty by Sex and Age in Lacrosse
With 18.9% poverty level for males and 23.1% for females among the residents of Lacrosse, 5 year old males and 35 to 44 year old females are the most vulnerable to poverty, with 1 males (100.0%) and 2 females (40.0%) in their respective age groups living below the poverty level.
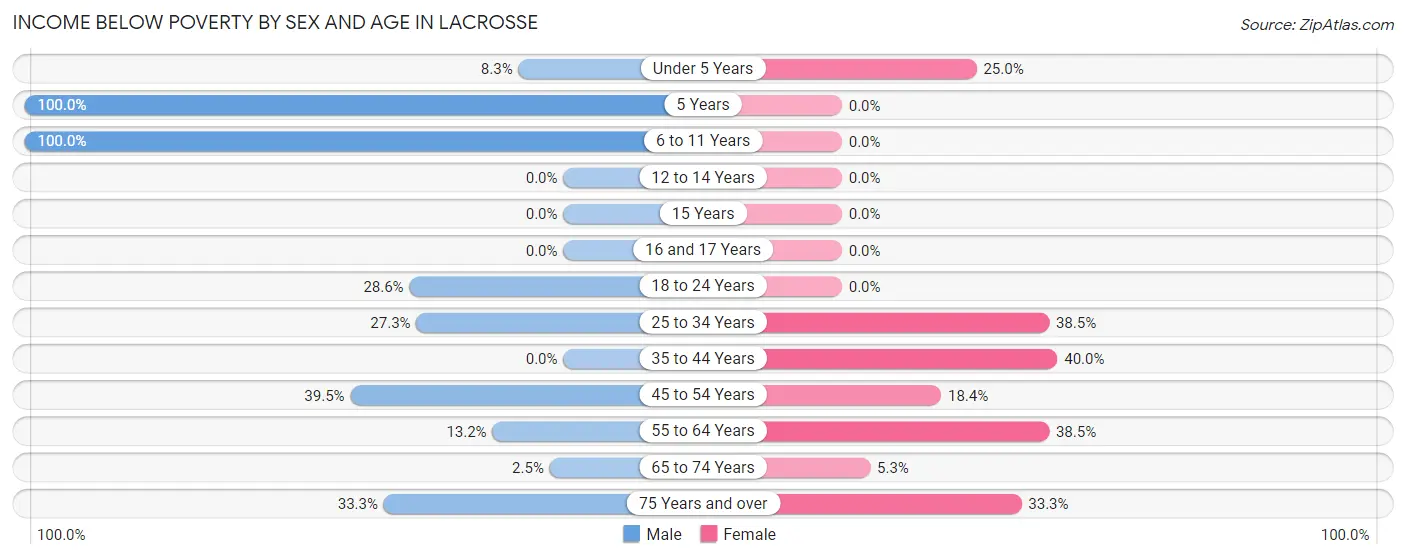
| Age Bracket | Male | Female |
| Under 5 Years | 1 (8.3%) | 4 (25.0%) |
| 5 Years | 1 (100.0%) | 0 (0.0%) |
| 6 to 11 Years | 8 (100.0%) | 0 (0.0%) |
| 12 to 14 Years | 0 (0.0%) | 0 (0.0%) |
| 15 Years | 0 (0.0%) | 0 (0.0%) |
| 16 and 17 Years | 0 (0.0%) | 0 (0.0%) |
| 18 to 24 Years | 2 (28.6%) | 0 (0.0%) |
| 25 to 34 Years | 3 (27.3%) | 5 (38.5%) |
| 35 to 44 Years | 0 (0.0%) | 2 (40.0%) |
| 45 to 54 Years | 17 (39.5%) | 7 (18.4%) |
| 55 to 64 Years | 5 (13.2%) | 20 (38.5%) |
| 65 to 74 Years | 2 (2.5%) | 1 (5.3%) |
| 75 Years and over | 3 (33.3%) | 6 (33.3%) |
| Total | 42 (18.9%) | 45 (23.1%) |
Income Above Poverty by Sex and Age in Lacrosse
According to the poverty statistics in Lacrosse, males aged 12 to 14 years and females aged 6 to 11 years are the age groups that are most secure financially, with 100.0% of males and 100.0% of females in these age groups living above the poverty line.
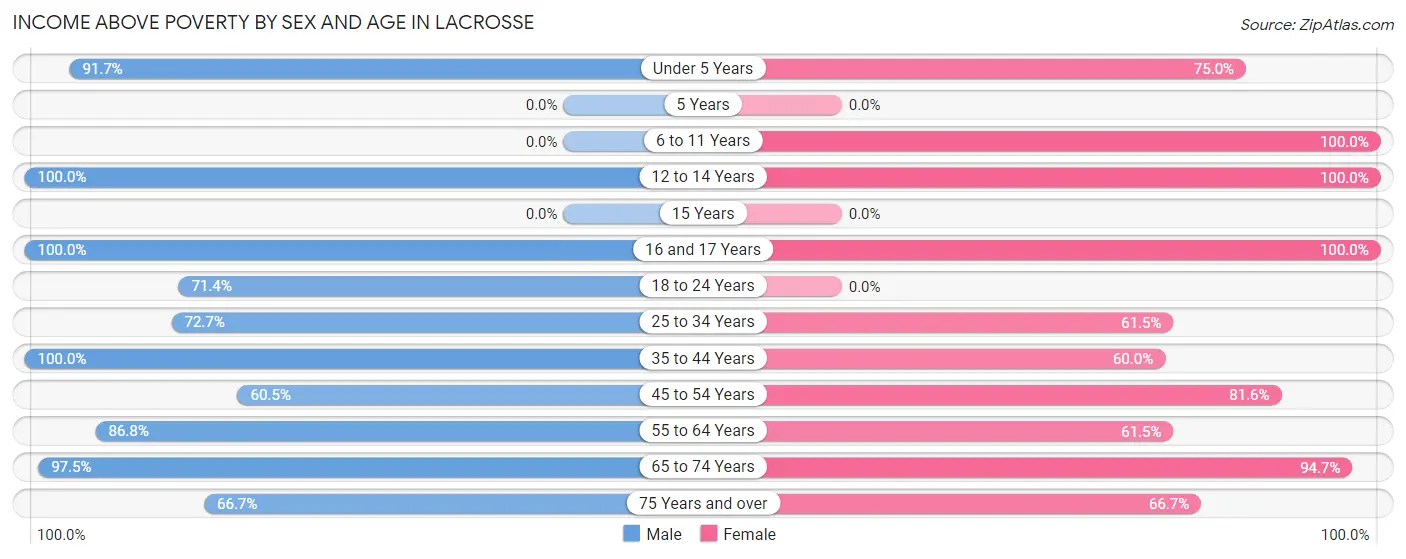
| Age Bracket | Male | Female |
| Under 5 Years | 11 (91.7%) | 12 (75.0%) |
| 5 Years | 0 (0.0%) | 0 (0.0%) |
| 6 to 11 Years | 0 (0.0%) | 31 (100.0%) |
| 12 to 14 Years | 6 (100.0%) | 2 (100.0%) |
| 15 Years | 0 (0.0%) | 0 (0.0%) |
| 16 and 17 Years | 2 (100.0%) | 1 (100.0%) |
| 18 to 24 Years | 5 (71.4%) | 0 (0.0%) |
| 25 to 34 Years | 8 (72.7%) | 8 (61.5%) |
| 35 to 44 Years | 6 (100.0%) | 3 (60.0%) |
| 45 to 54 Years | 26 (60.5%) | 31 (81.6%) |
| 55 to 64 Years | 33 (86.8%) | 32 (61.5%) |
| 65 to 74 Years | 77 (97.5%) | 18 (94.7%) |
| 75 Years and over | 6 (66.7%) | 12 (66.7%) |
| Total | 180 (81.1%) | 150 (76.9%) |
Income Below Poverty Among Married-Couple Families in Lacrosse
The poverty statistics for married-couple families in Lacrosse show that 3.6% or 4 of the total 111 families live below the poverty line. Families with 1 or 2 children have the highest poverty rate of 5.3%, comprising of 4 families. On the other hand, families with no children have the lowest poverty rate of 0.0%, which includes 0 families.
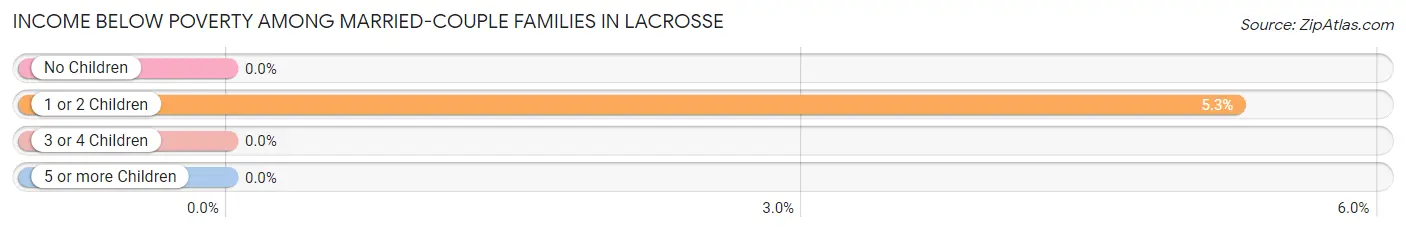
| Children | Above Poverty | Below Poverty |
| No Children | 34 (100.0%) | 0 (0.0%) |
| 1 or 2 Children | 72 (94.7%) | 4 (5.3%) |
| 3 or 4 Children | 1 (100.0%) | 0 (0.0%) |
| 5 or more Children | 0 (0.0%) | 0 (0.0%) |
| Total | 107 (96.4%) | 4 (3.6%) |
Income Below Poverty Among Single-Parent Households in Lacrosse
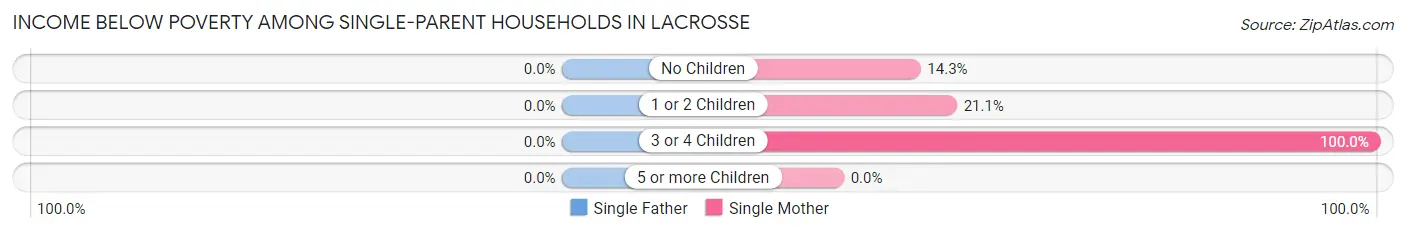
| Children | Single Father | Single Mother |
| No Children | 0 (0.0%) | 1 (14.3%) |
| 1 or 2 Children | 0 (0.0%) | 4 (21.0%) |
| 3 or 4 Children | 0 (0.0%) | 2 (100.0%) |
| 5 or more Children | 0 (0.0%) | 0 (0.0%) |
| Total | 0 (0.0%) | 7 (25.0%) |
Income Below Poverty Among Married-Couple vs Single-Parent Households in Lacrosse
The poverty data for Lacrosse shows that 4 of the married-couple family households (3.6%) and 7 of the single-parent households (21.2%) are living below the poverty level. Within the married-couple family households, those with 1 or 2 children have the highest poverty rate, with 4 households (5.3%) falling below the poverty line. Among the single-parent households, those with 3 or 4 children have the highest poverty rate, with 2 household (100.0%) living below poverty.
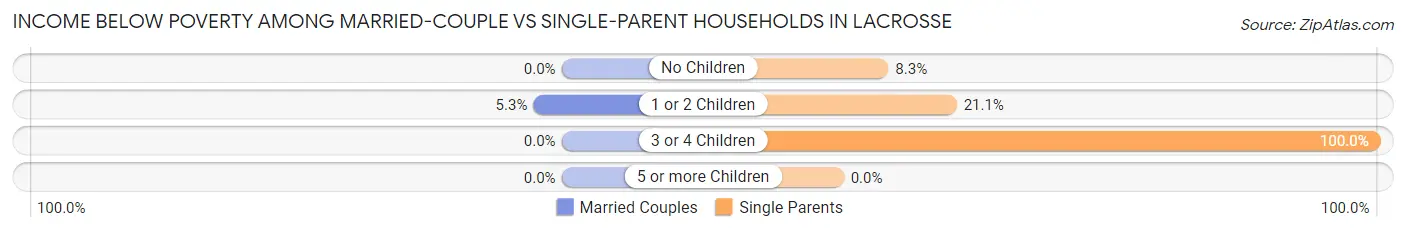
| Children | Married-Couple Families | Single-Parent Households |
| No Children | 0 (0.0%) | 1 (8.3%) |
| 1 or 2 Children | 4 (5.3%) | 4 (21.0%) |
| 3 or 4 Children | 0 (0.0%) | 2 (100.0%) |
| 5 or more Children | 0 (0.0%) | 0 (0.0%) |
| Total | 4 (3.6%) | 7 (21.2%) |
Race in Lacrosse
The most populous races in Lacrosse are White / Caucasian (279 | 66.9%), Some other Race (96 | 23.0%), and Hispanic or Latino (46 | 11.0%).
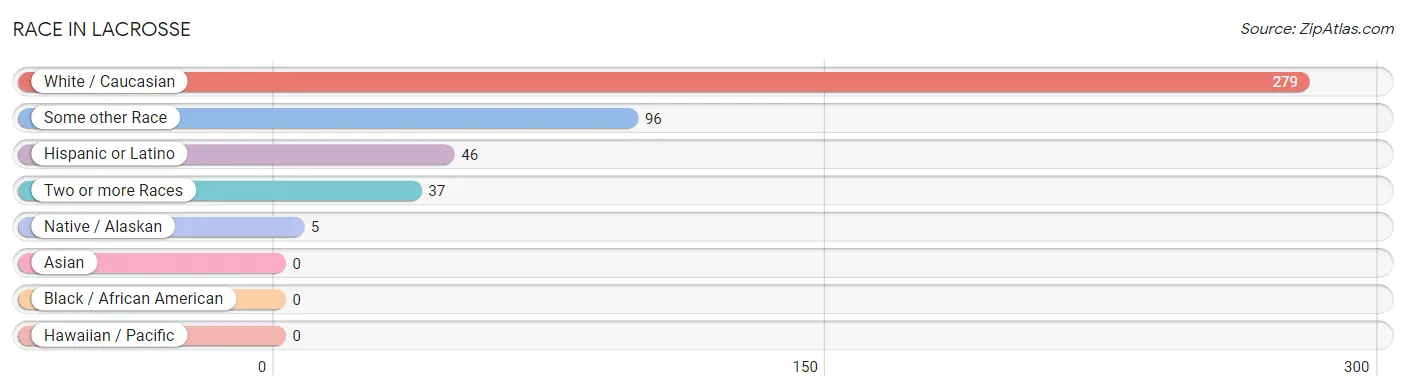
| Race | # Population | % Population |
| Asian | 0 | 0.0% |
| Black / African American | 0 | 0.0% |
| Hawaiian / Pacific | 0 | 0.0% |
| Hispanic or Latino | 46 | 11.0% |
| Native / Alaskan | 5 | 1.2% |
| White / Caucasian | 279 | 66.9% |
| Two or more Races | 37 | 8.9% |
| Some other Race | 96 | 23.0% |
| Total | 417 | 100.0% |
Ancestry in Lacrosse
The most populous ancestries reported in Lacrosse are American (135 | 32.4%), German (87 | 20.9%), Irish (35 | 8.4%), European (34 | 8.2%), and English (27 | 6.5%), together accounting for 76.2% of all Lacrosse residents.
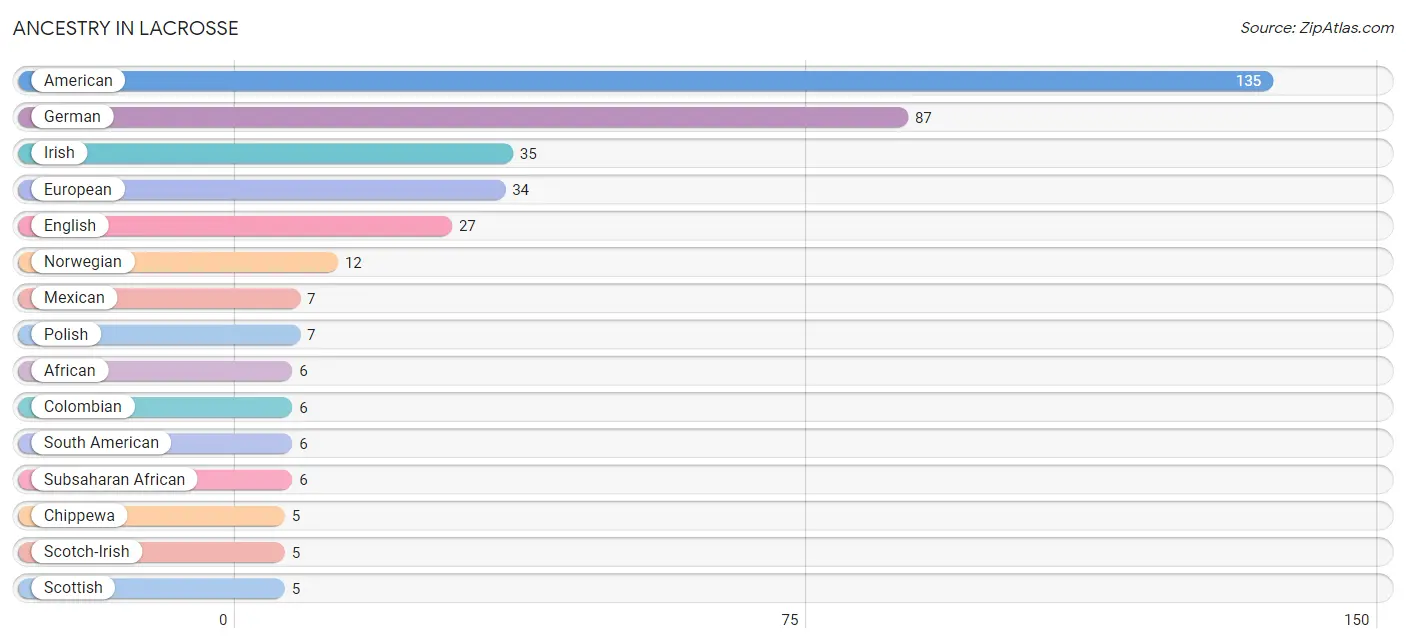
| Ancestry | # Population | % Population |
| African | 6 | 1.4% |
| American | 135 | 32.4% |
| Austrian | 1 | 0.2% |
| Chippewa | 5 | 1.2% |
| Colombian | 6 | 1.4% |
| Colville | 3 | 0.7% |
| Dutch | 3 | 0.7% |
| Eastern European | 2 | 0.5% |
| English | 27 | 6.5% |
| European | 34 | 8.2% |
| French Canadian | 4 | 1.0% |
| German | 87 | 20.9% |
| Indian (Asian) | 1 | 0.2% |
| Irish | 35 | 8.4% |
| Italian | 1 | 0.2% |
| Lithuanian | 1 | 0.2% |
| Mexican | 7 | 1.7% |
| Native Hawaiian | 1 | 0.2% |
| Northern European | 1 | 0.2% |
| Norwegian | 12 | 2.9% |
| Polish | 7 | 1.7% |
| Scotch-Irish | 5 | 1.2% |
| Scottish | 5 | 1.2% |
| South American | 6 | 1.4% |
| Sri Lankan | 1 | 0.2% |
| Subsaharan African | 6 | 1.4% |
| Welsh | 2 | 0.5% | View All 27 Rows |
Immigrants in Lacrosse
The most numerous immigrant groups reported in Lacrosse came from Canada (14 | 3.4%), Asia (8 | 1.9%), Kazakhstan (8 | 1.9%), South Central Asia (8 | 1.9%), and Colombia (6 | 1.4%), together accounting for 10.6% of all Lacrosse residents.
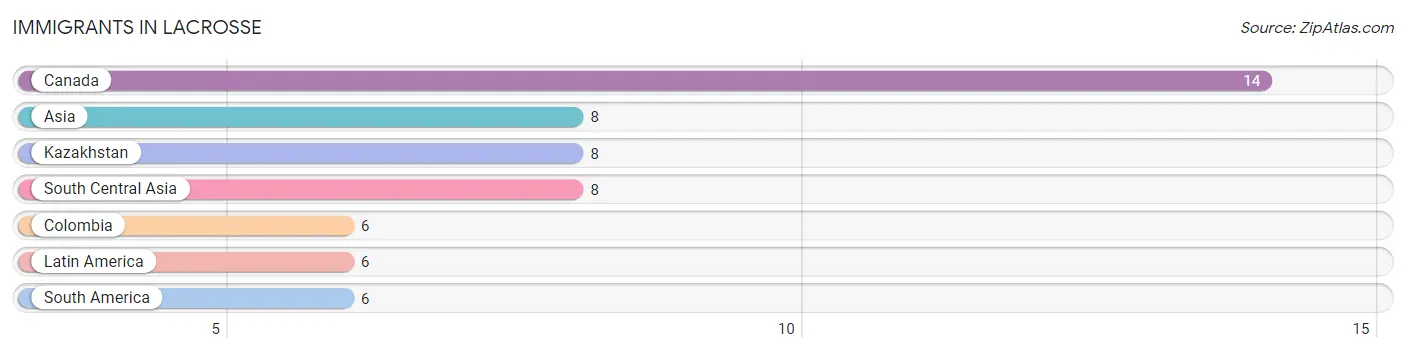
| Immigration Origin | # Population | % Population |
| Asia | 8 | 1.9% |
| Canada | 14 | 3.4% |
| Colombia | 6 | 1.4% |
| Kazakhstan | 8 | 1.9% |
| Latin America | 6 | 1.4% |
| South America | 6 | 1.4% |
| South Central Asia | 8 | 1.9% | View All 7 Rows |
Sex and Age in Lacrosse
Sex and Age in Lacrosse
The most populous age groups in Lacrosse are 65 to 69 Years (74 | 33.3%) for men and 10 to 14 Years (33 | 16.9%) for women.
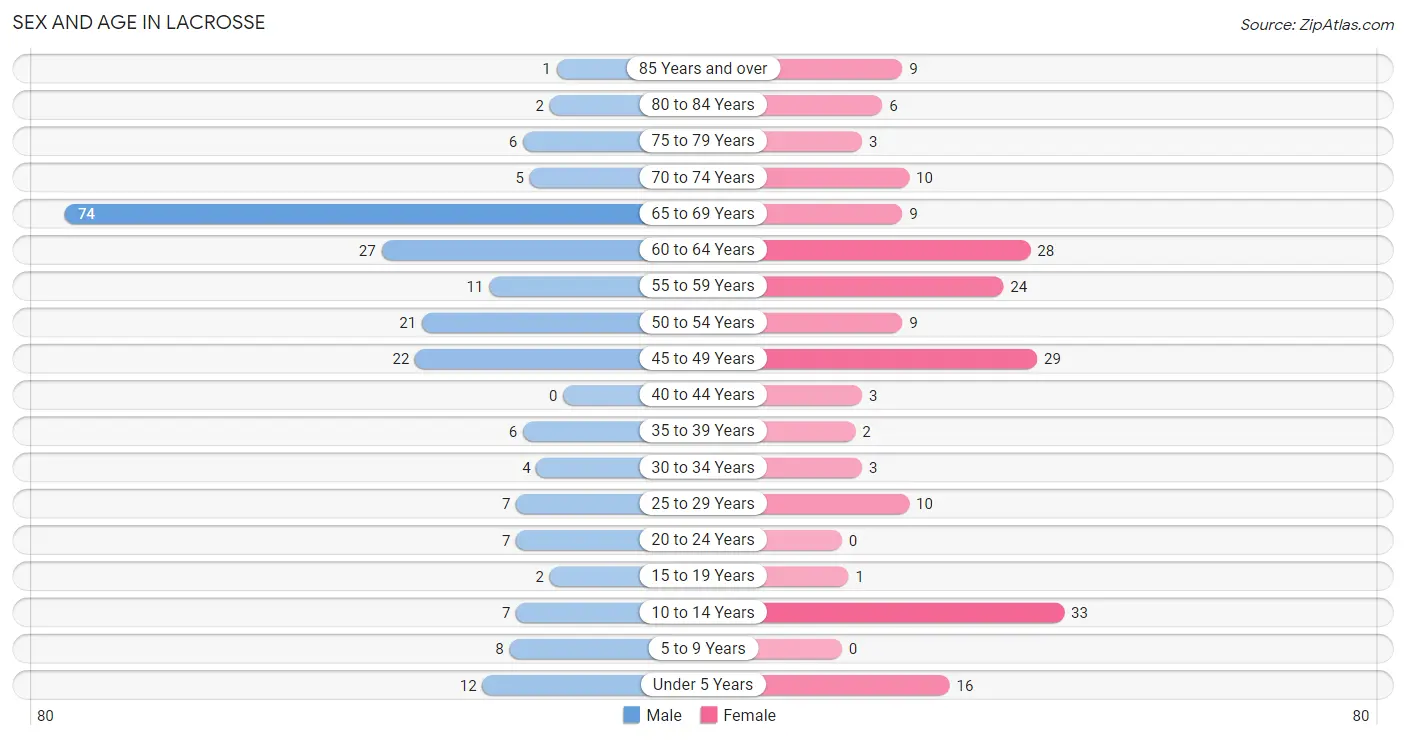
| Age Bracket | Male | Female |
| Under 5 Years | 12 (5.4%) | 16 (8.2%) |
| 5 to 9 Years | 8 (3.6%) | 0 (0.0%) |
| 10 to 14 Years | 7 (3.2%) | 33 (16.9%) |
| 15 to 19 Years | 2 (0.9%) | 1 (0.5%) |
| 20 to 24 Years | 7 (3.2%) | 0 (0.0%) |
| 25 to 29 Years | 7 (3.2%) | 10 (5.1%) |
| 30 to 34 Years | 4 (1.8%) | 3 (1.5%) |
| 35 to 39 Years | 6 (2.7%) | 2 (1.0%) |
| 40 to 44 Years | 0 (0.0%) | 3 (1.5%) |
| 45 to 49 Years | 22 (9.9%) | 29 (14.9%) |
| 50 to 54 Years | 21 (9.5%) | 9 (4.6%) |
| 55 to 59 Years | 11 (5.0%) | 24 (12.3%) |
| 60 to 64 Years | 27 (12.2%) | 28 (14.4%) |
| 65 to 69 Years | 74 (33.3%) | 9 (4.6%) |
| 70 to 74 Years | 5 (2.2%) | 10 (5.1%) |
| 75 to 79 Years | 6 (2.7%) | 3 (1.5%) |
| 80 to 84 Years | 2 (0.9%) | 6 (3.1%) |
| 85 Years and over | 1 (0.4%) | 9 (4.6%) |
| Total | 222 (100.0%) | 195 (100.0%) |
Families and Households in Lacrosse
Median Family Size in Lacrosse
The median family size in Lacrosse is 2.10 persons per family, with single female/mother families (28 | 19.4%) accounting for the largest median family size of 2.21 persons per family. On the other hand, married-couple families (111 | 77.1%) represent the smallest median family size with 2.06 persons per family.
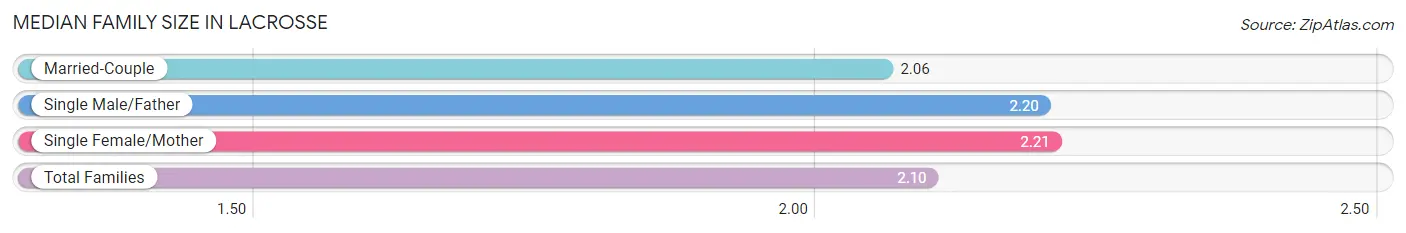
| Family Type | # Families | Family Size |
| Married-Couple | 111 (77.1%) | 2.06 |
| Single Male/Father | 5 (3.5%) | 2.20 |
| Single Female/Mother | 28 (19.4%) | 2.21 |
| Total Families | 144 (100.0%) | 2.10 |
Median Household Size in Lacrosse
The median household size in Lacrosse is 1.85 persons per household, with single female/mother households (28 | 12.4%) accounting for the largest median household size of 2.61 persons per household. non-family households (81 | 36.0%) represent the smallest median household size with 1.28 persons per household.
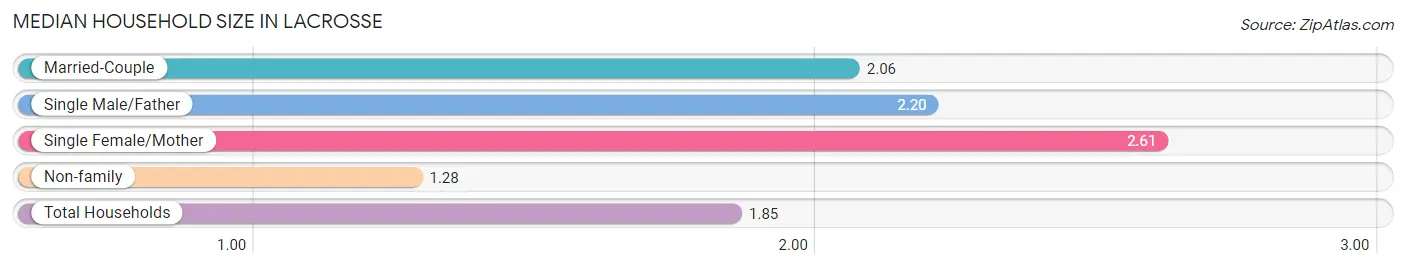
| Household Type | # Households | Household Size |
| Married-Couple | 111 (49.3%) | 2.06 |
| Single Male/Father | 5 (2.2%) | 2.20 |
| Single Female/Mother | 28 (12.4%) | 2.61 |
| Non-family | 81 (36.0%) | 1.28 |
| Total Households | 225 (100.0%) | 1.85 |
Household Size by Marriage Status in Lacrosse
Out of a total of 225 households in Lacrosse, 144 (64.0%) are family households, while 81 (36.0%) are nonfamily households. The most numerous type of family households are 3-person households, comprising 89, and the most common type of nonfamily households are 1-person households, comprising 65.
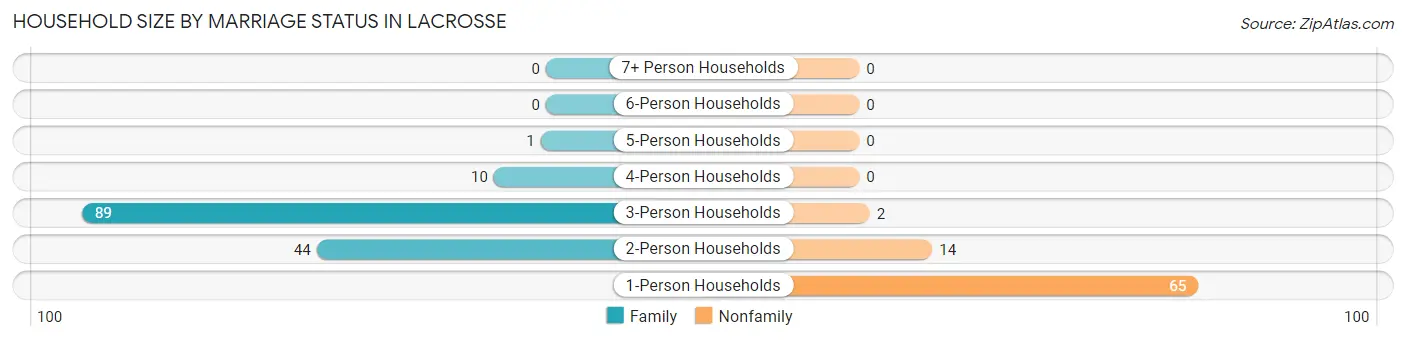
| Household Size | Family Households | Nonfamily Households |
| 1-Person Households | - | 65 (28.9%) |
| 2-Person Households | 44 (19.6%) | 14 (6.2%) |
| 3-Person Households | 89 (39.6%) | 2 (0.9%) |
| 4-Person Households | 10 (4.4%) | 0 (0.0%) |
| 5-Person Households | 1 (0.4%) | 0 (0.0%) |
| 6-Person Households | 0 (0.0%) | 0 (0.0%) |
| 7+ Person Households | 0 (0.0%) | 0 (0.0%) |
| Total | 144 (64.0%) | 81 (36.0%) |
Female Fertility in Lacrosse
Fertility by Age in Lacrosse
| Age Bracket | Women with Births | Births / 1,000 Women |
| 15 to 19 years | 0 (0.0%) | 0.0 |
| 20 to 34 years | 0 (0.0%) | 0.0 |
| 35 to 50 years | 0 (0.0%) | 0.0 |
| Total | 0 (0.0%) | 0.0 |
Fertility by Age by Marriage Status in Lacrosse
| Age Bracket | Married | Unmarried |
| 15 to 19 years | 0 (0.0%) | 0 (0.0%) |
| 20 to 34 years | 0 (0.0%) | 0 (0.0%) |
| 35 to 50 years | 0 (0.0%) | 0 (0.0%) |
| Total | 0 (0.0%) | 0 (0.0%) |
Fertility by Education in Lacrosse
| Educational Attainment | Women with Births | Births / 1,000 Women |
| Less than High School | 0 (0.0%) | 0.0 |
| High School Diploma | 0 (0.0%) | 0.0 |
| College or Associate's Degree | 0 (0.0%) | 0.0 |
| Bachelor's Degree | 0 (0.0%) | 0.0 |
| Graduate Degree | 0 (0.0%) | 0.0 |
| Total | 0 (0.0%) | 0.0 |
Fertility by Education by Marriage Status in Lacrosse
| Educational Attainment | Married | Unmarried |
| Less than High School | 0 (0.0%) | 0 (0.0%) |
| High School Diploma | 0 (0.0%) | 0 (0.0%) |
| College or Associate's Degree | 0 (0.0%) | 0 (0.0%) |
| Bachelor's Degree | 0 (0.0%) | 0 (0.0%) |
| Graduate Degree | 0 (0.0%) | 0 (0.0%) |
| Total | 0 (0.0%) | 0 (0.0%) |
Employment Characteristics in Lacrosse
Employment by Class of Employer in Lacrosse
Among the 176 employed individuals in Lacrosse, self-employed (not incorporated) (89 | 50.6%), private company employees (60 | 34.1%), and local government employees (22 | 12.5%) make up the most common classes of employment.
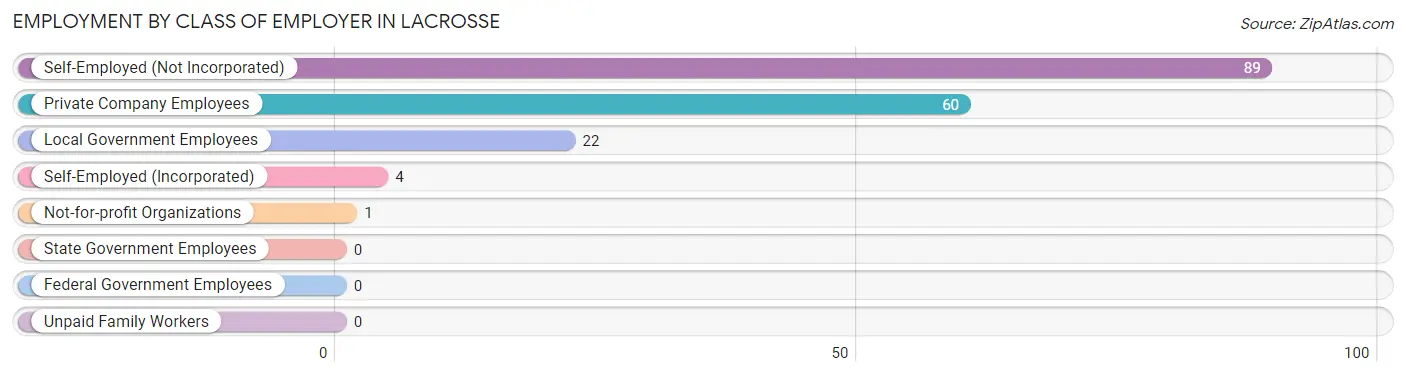
| Employer Class | # Employees | % Employees |
| Private Company Employees | 60 | 34.1% |
| Self-Employed (Incorporated) | 4 | 2.3% |
| Self-Employed (Not Incorporated) | 89 | 50.6% |
| Not-for-profit Organizations | 1 | 0.6% |
| Local Government Employees | 22 | 12.5% |
| State Government Employees | 0 | 0.0% |
| Federal Government Employees | 0 | 0.0% |
| Unpaid Family Workers | 0 | 0.0% |
| Total | 176 | 100.0% |
Employment Status by Age in Lacrosse
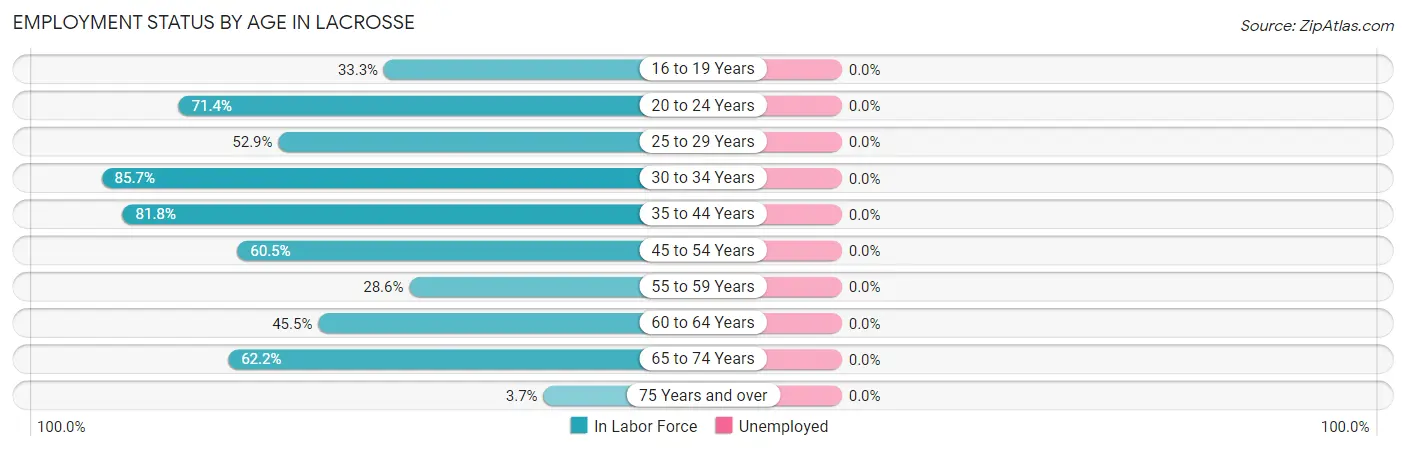
| Age Bracket | In Labor Force | Unemployed |
| 16 to 19 Years | 1 (33.3%) | 0 (0.0%) |
| 20 to 24 Years | 5 (71.4%) | 0 (0.0%) |
| 25 to 29 Years | 9 (52.9%) | 0 (0.0%) |
| 30 to 34 Years | 6 (85.7%) | 0 (0.0%) |
| 35 to 44 Years | 9 (81.8%) | 0 (0.0%) |
| 45 to 54 Years | 49 (60.5%) | 0 (0.0%) |
| 55 to 59 Years | 10 (28.6%) | 0 (0.0%) |
| 60 to 64 Years | 25 (45.5%) | 0 (0.0%) |
| 65 to 74 Years | 61 (62.2%) | 0 (0.0%) |
| 75 Years and over | 1 (3.7%) | 0 (0.0%) |
| Total | 176 (51.6%) | 0 (0.0%) |
Employment Status by Educational Attainment in Lacrosse
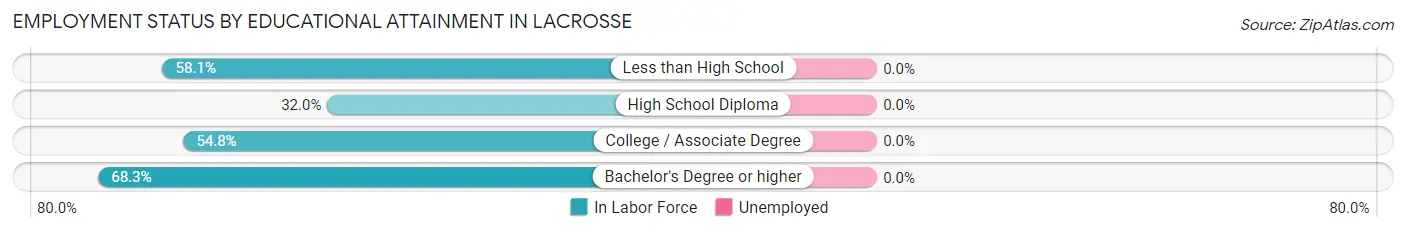
| Educational Attainment | In Labor Force | Unemployed |
| Less than High School | 18 (58.1%) | 0 (0.0%) |
| High School Diploma | 16 (32.0%) | 0 (0.0%) |
| College / Associate Degree | 46 (54.8%) | 0 (0.0%) |
| Bachelor's Degree or higher | 28 (68.3%) | 0 (0.0%) |
| Total | 108 (52.4%) | 0 (0.0%) |
Employment Occupations by Sex in Lacrosse
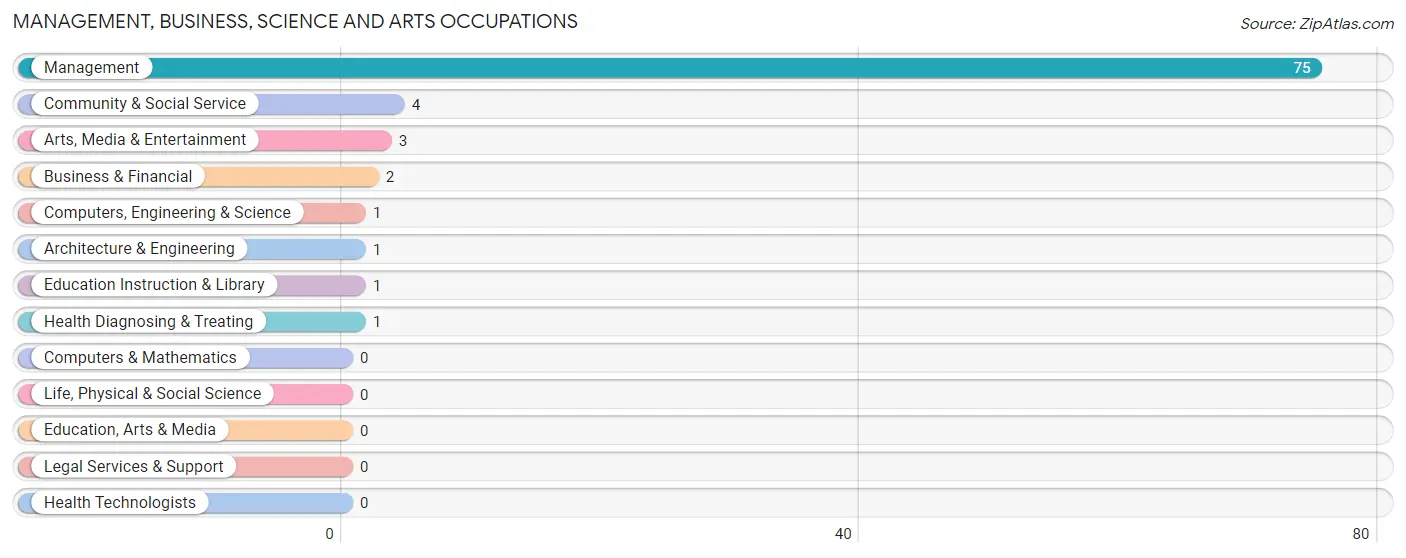
Management, Business, Science and Arts Occupations
The most common Management, Business, Science and Arts occupations in Lacrosse are Management (75 | 42.6%), Community & Social Service (4 | 2.3%), Arts, Media & Entertainment (3 | 1.7%), Business & Financial (2 | 1.1%), and Computers, Engineering & Science (1 | 0.6%).
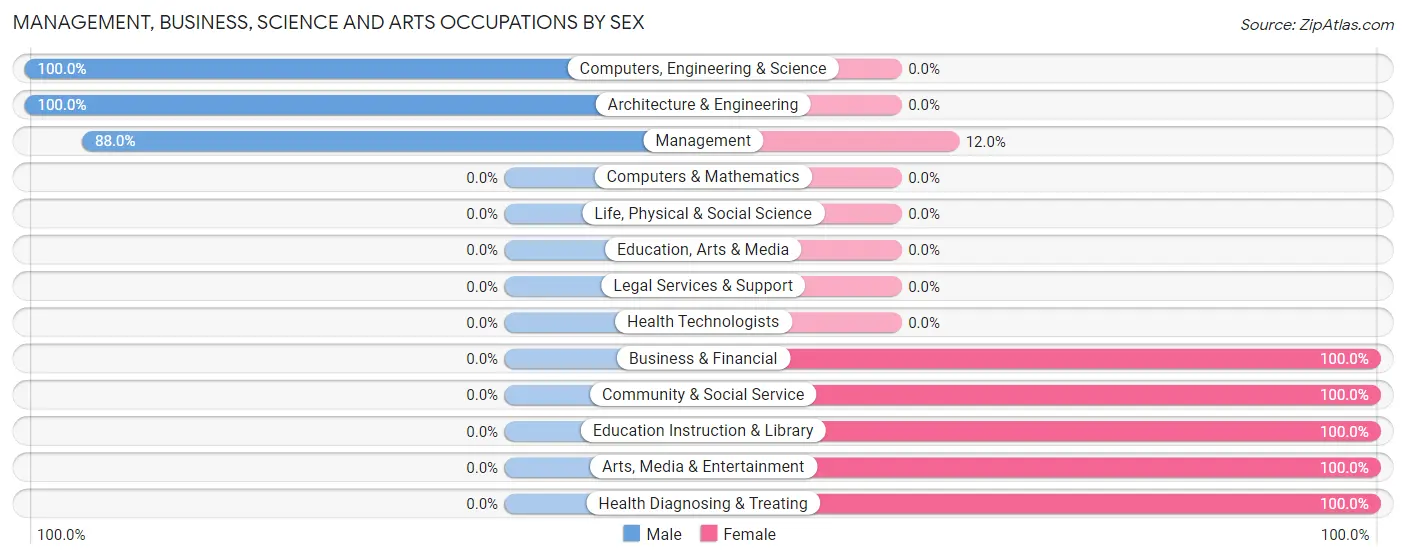
Management, Business, Science and Arts Occupations by Sex
Within the Management, Business, Science and Arts occupations in Lacrosse, the most male-oriented occupations are Computers, Engineering & Science (100.0%), Architecture & Engineering (100.0%), and Management (88.0%), while the most female-oriented occupations are Business & Financial (100.0%), Community & Social Service (100.0%), and Education Instruction & Library (100.0%).
| Occupation | Male | Female |
| Management | 66 (88.0%) | 9 (12.0%) |
| Business & Financial | 0 (0.0%) | 2 (100.0%) |
| Computers, Engineering & Science | 1 (100.0%) | 0 (0.0%) |
| Computers & Mathematics | 0 (0.0%) | 0 (0.0%) |
| Architecture & Engineering | 1 (100.0%) | 0 (0.0%) |
| Life, Physical & Social Science | 0 (0.0%) | 0 (0.0%) |
| Community & Social Service | 0 (0.0%) | 4 (100.0%) |
| Education, Arts & Media | 0 (0.0%) | 0 (0.0%) |
| Legal Services & Support | 0 (0.0%) | 0 (0.0%) |
| Education Instruction & Library | 0 (0.0%) | 1 (100.0%) |
| Arts, Media & Entertainment | 0 (0.0%) | 3 (100.0%) |
| Health Diagnosing & Treating | 0 (0.0%) | 1 (100.0%) |
| Health Technologists | 0 (0.0%) | 0 (0.0%) |
| Total (Category) | 67 (80.7%) | 16 (19.3%) |
| Total (Overall) | 120 (68.2%) | 56 (31.8%) |
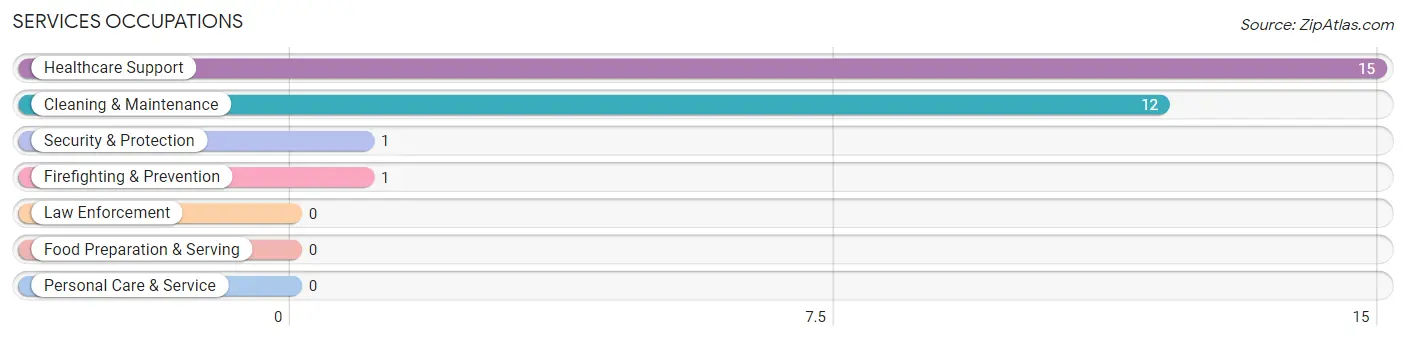
Services Occupations
The most common Services occupations in Lacrosse are Healthcare Support (15 | 8.5%), Cleaning & Maintenance (12 | 6.8%), Security & Protection (1 | 0.6%), and Firefighting & Prevention (1 | 0.6%).
Services Occupations by Sex
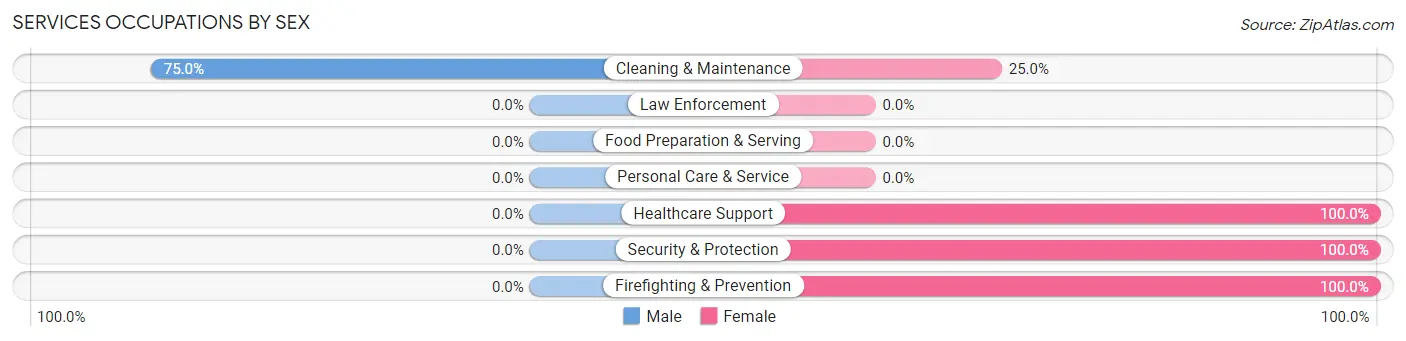
| Occupation | Male | Female |
| Healthcare Support | 0 (0.0%) | 15 (100.0%) |
| Security & Protection | 0 (0.0%) | 1 (100.0%) |
| Firefighting & Prevention | 0 (0.0%) | 1 (100.0%) |
| Law Enforcement | 0 (0.0%) | 0 (0.0%) |
| Food Preparation & Serving | 0 (0.0%) | 0 (0.0%) |
| Cleaning & Maintenance | 9 (75.0%) | 3 (25.0%) |
| Personal Care & Service | 0 (0.0%) | 0 (0.0%) |
| Total (Category) | 9 (32.1%) | 19 (67.9%) |
| Total (Overall) | 120 (68.2%) | 56 (31.8%) |
Sales and Office Occupations
The most common Sales and Office occupations in Lacrosse are , and Office & Administration (10 | 5.7%).

Sales and Office Occupations by Sex
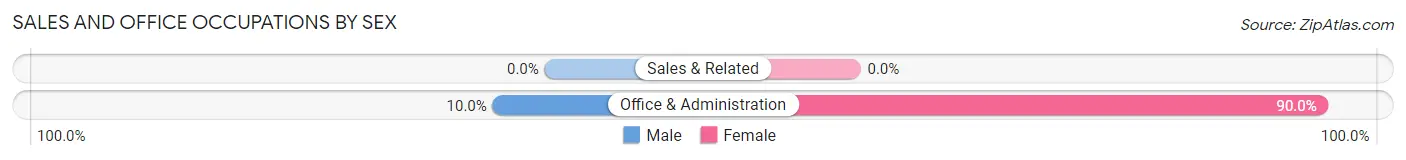
| Occupation | Male | Female |
| Sales & Related | 0 (0.0%) | 0 (0.0%) |
| Office & Administration | 1 (10.0%) | 9 (90.0%) |
| Total (Category) | 1 (10.0%) | 9 (90.0%) |
| Total (Overall) | 120 (68.2%) | 56 (31.8%) |
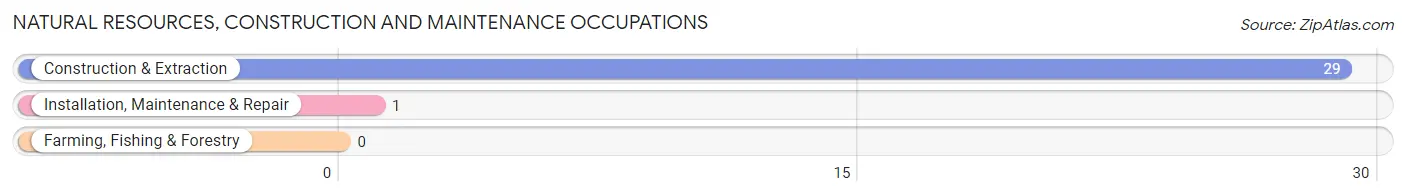
Natural Resources, Construction and Maintenance Occupations
The most common Natural Resources, Construction and Maintenance occupations in Lacrosse are Construction & Extraction (29 | 16.5%), and Installation, Maintenance & Repair (1 | 0.6%).
Natural Resources, Construction and Maintenance Occupations by Sex
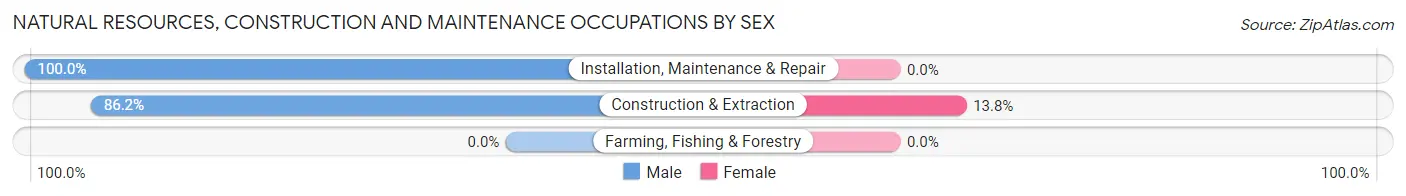
| Occupation | Male | Female |
| Farming, Fishing & Forestry | 0 (0.0%) | 0 (0.0%) |
| Construction & Extraction | 25 (86.2%) | 4 (13.8%) |
| Installation, Maintenance & Repair | 1 (100.0%) | 0 (0.0%) |
| Total (Category) | 26 (86.7%) | 4 (13.3%) |
| Total (Overall) | 120 (68.2%) | 56 (31.8%) |
Production, Transportation and Moving Occupations
The most common Production, Transportation and Moving occupations in Lacrosse are Transportation (10 | 5.7%), Material Moving (10 | 5.7%), and Production (5 | 2.8%).
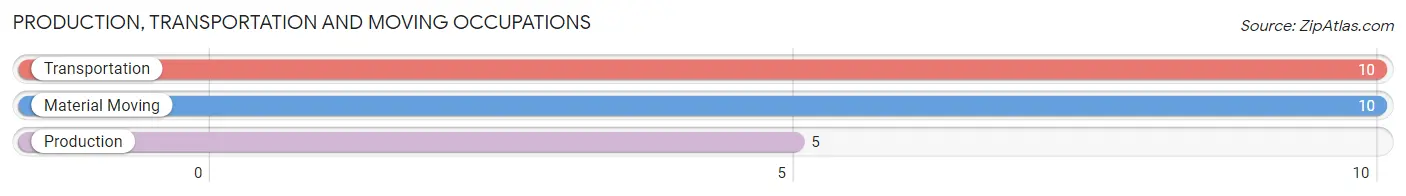
Production, Transportation and Moving Occupations by Sex
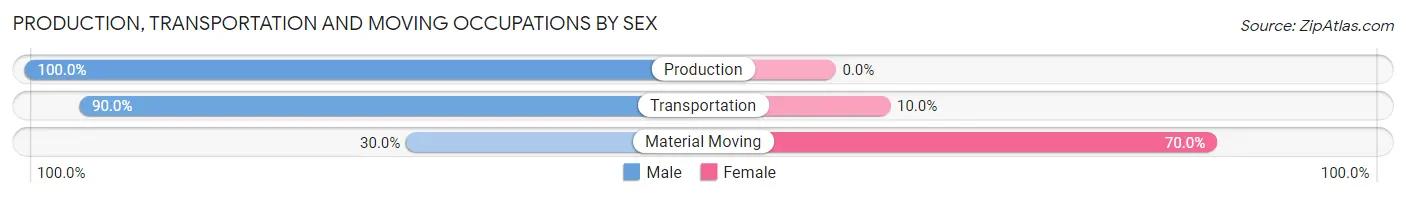
| Occupation | Male | Female |
| Production | 5 (100.0%) | 0 (0.0%) |
| Transportation | 9 (90.0%) | 1 (10.0%) |
| Material Moving | 3 (30.0%) | 7 (70.0%) |
| Total (Category) | 17 (68.0%) | 8 (32.0%) |
| Total (Overall) | 120 (68.2%) | 56 (31.8%) |
Employment Industries by Sex in Lacrosse
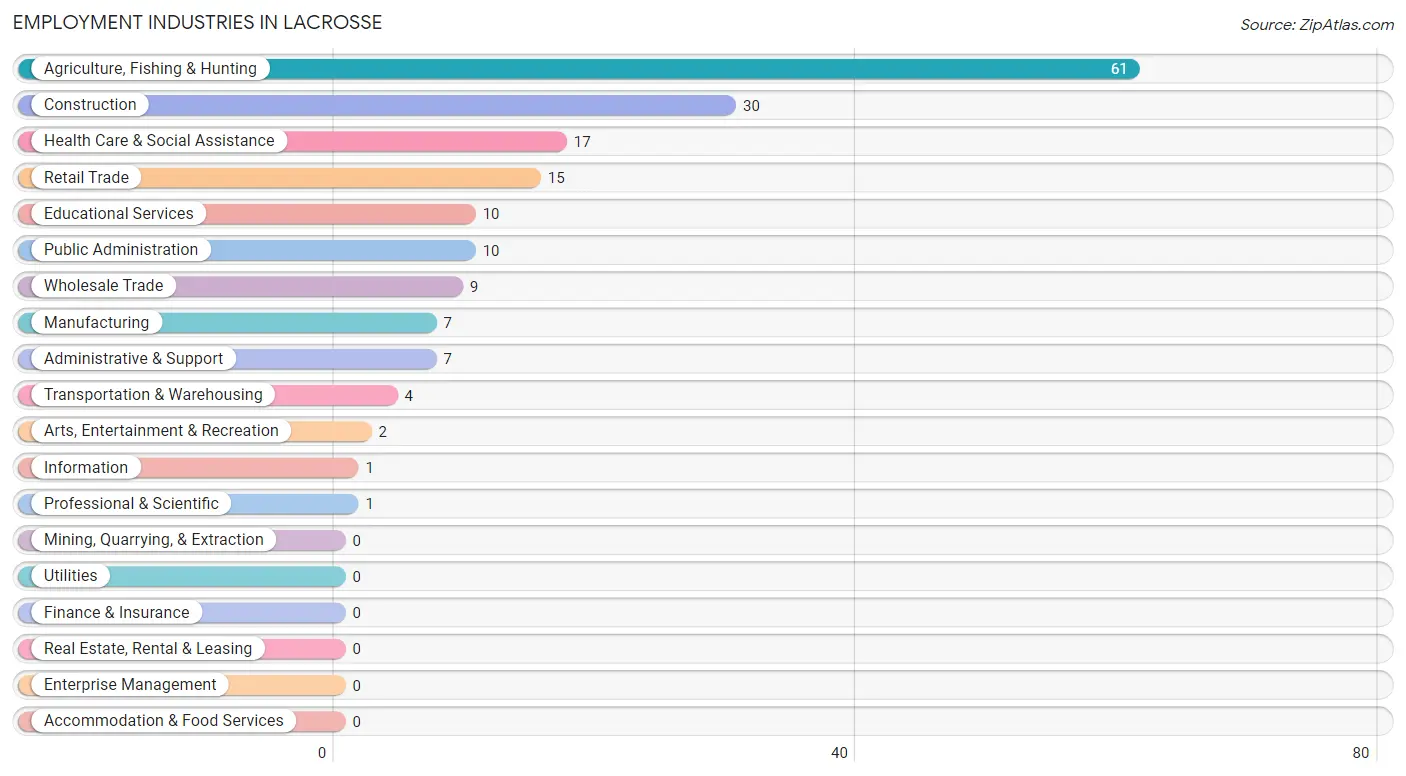
Employment Industries in Lacrosse
The major employment industries in Lacrosse include Agriculture, Fishing & Hunting (61 | 34.7%), Construction (30 | 17.1%), Health Care & Social Assistance (17 | 9.7%), Retail Trade (15 | 8.5%), and Educational Services (10 | 5.7%).
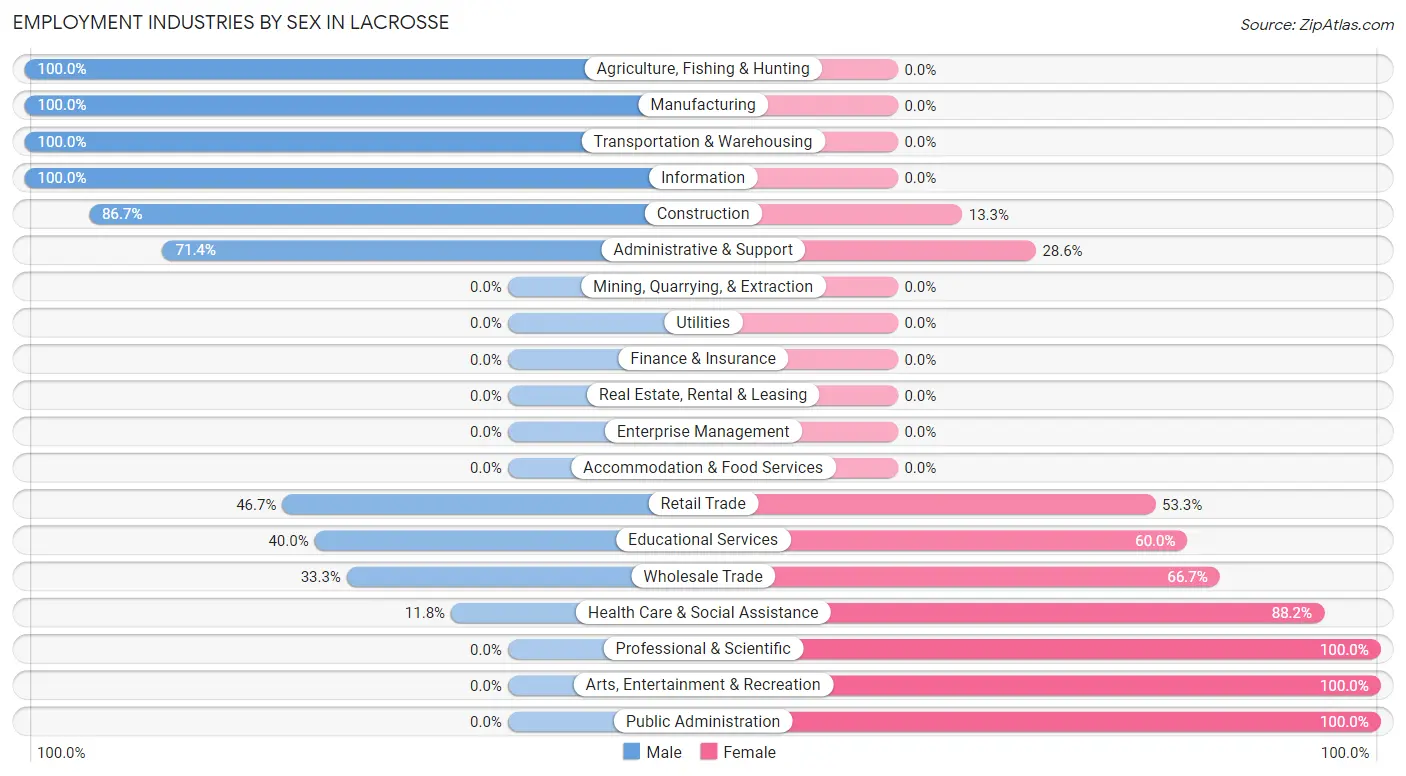
Employment Industries by Sex in Lacrosse
The Lacrosse industries that see more men than women are Agriculture, Fishing & Hunting (100.0%), Manufacturing (100.0%), and Transportation & Warehousing (100.0%), whereas the industries that tend to have a higher number of women are Professional & Scientific (100.0%), Arts, Entertainment & Recreation (100.0%), and Public Administration (100.0%).
| Industry | Male | Female |
| Agriculture, Fishing & Hunting | 61 (100.0%) | 0 (0.0%) |
| Mining, Quarrying, & Extraction | 0 (0.0%) | 0 (0.0%) |
| Construction | 26 (86.7%) | 4 (13.3%) |
| Manufacturing | 7 (100.0%) | 0 (0.0%) |
| Wholesale Trade | 3 (33.3%) | 6 (66.7%) |
| Retail Trade | 7 (46.7%) | 8 (53.3%) |
| Transportation & Warehousing | 4 (100.0%) | 0 (0.0%) |
| Utilities | 0 (0.0%) | 0 (0.0%) |
| Information | 1 (100.0%) | 0 (0.0%) |
| Finance & Insurance | 0 (0.0%) | 0 (0.0%) |
| Real Estate, Rental & Leasing | 0 (0.0%) | 0 (0.0%) |
| Professional & Scientific | 0 (0.0%) | 1 (100.0%) |
| Enterprise Management | 0 (0.0%) | 0 (0.0%) |
| Administrative & Support | 5 (71.4%) | 2 (28.6%) |
| Educational Services | 4 (40.0%) | 6 (60.0%) |
| Health Care & Social Assistance | 2 (11.8%) | 15 (88.2%) |
| Arts, Entertainment & Recreation | 0 (0.0%) | 2 (100.0%) |
| Accommodation & Food Services | 0 (0.0%) | 0 (0.0%) |
| Public Administration | 0 (0.0%) | 10 (100.0%) |
| Total | 120 (68.2%) | 56 (31.8%) |
Education in Lacrosse
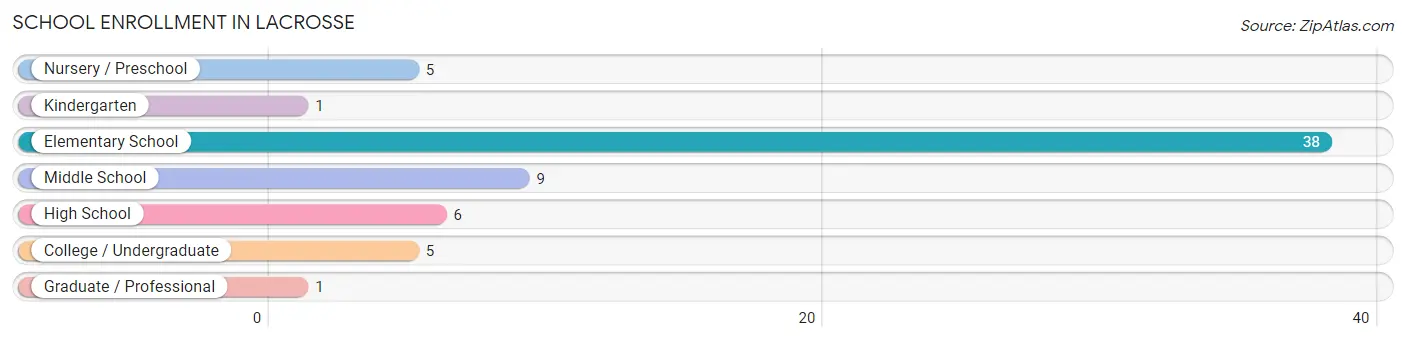
School Enrollment in Lacrosse
The most common levels of schooling among the 65 students in Lacrosse are elementary school (38 | 58.5%), middle school (9 | 13.9%), and high school (6 | 9.2%).
| School Level | # Students | % Students |
| Nursery / Preschool | 5 | 7.7% |
| Kindergarten | 1 | 1.5% |
| Elementary School | 38 | 58.5% |
| Middle School | 9 | 13.9% |
| High School | 6 | 9.2% |
| College / Undergraduate | 5 | 7.7% |
| Graduate / Professional | 1 | 1.5% |
| Total | 65 | 100.0% |
School Enrollment by Age by Funding Source in Lacrosse
Out of a total of 65 students who are enrolled in schools in Lacrosse, 3 (4.6%) attend a private institution, while the remaining 62 (95.4%) are enrolled in public schools. The age group of 35 years and over has the highest likelihood of being enrolled in private schools, with 1 (25.0% in the age bracket) enrolled. Conversely, the age group of 5 to 9 year old has the lowest likelihood of being enrolled in a private school, with 8 (100.0% in the age bracket) attending a public institution.
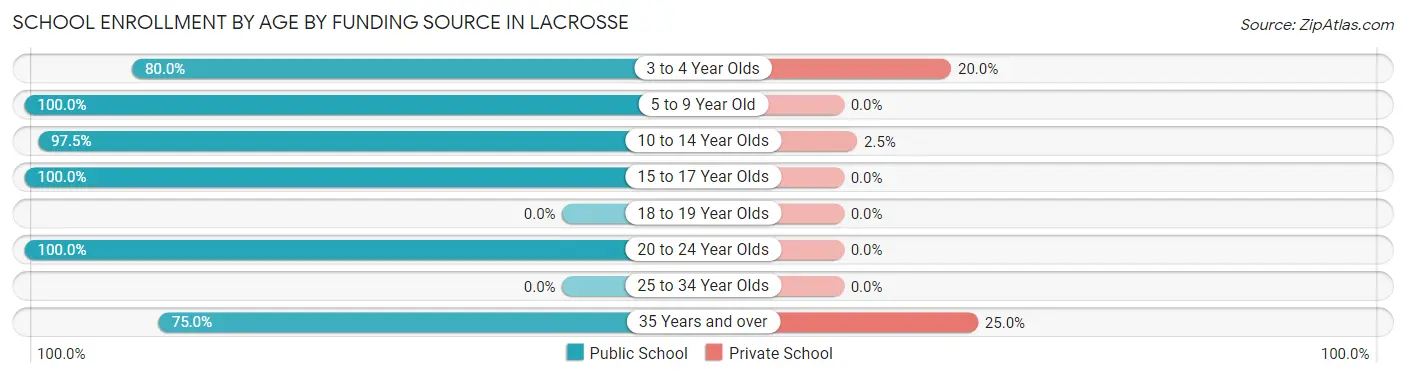
| Age Bracket | Public School | Private School |
| 3 to 4 Year Olds | 4 (80.0%) | 1 (20.0%) |
| 5 to 9 Year Old | 8 (100.0%) | 0 (0.0%) |
| 10 to 14 Year Olds | 39 (97.5%) | 1 (2.5%) |
| 15 to 17 Year Olds | 3 (100.0%) | 0 (0.0%) |
| 18 to 19 Year Olds | 0 (0.0%) | 0 (0.0%) |
| 20 to 24 Year Olds | 5 (100.0%) | 0 (0.0%) |
| 25 to 34 Year Olds | 0 (0.0%) | 0 (0.0%) |
| 35 Years and over | 3 (75.0%) | 1 (25.0%) |
| Total | 62 (95.4%) | 3 (4.6%) |
Educational Attainment by Field of Study in Lacrosse
Education (65 | 61.3%), bio, nature & agricultural (16 | 15.1%), business (13 | 12.3%), arts & humanities (7 | 6.6%), and visual & performing arts (4 | 3.8%) are the most common fields of study among 106 individuals in Lacrosse who have obtained a bachelor's degree or higher.
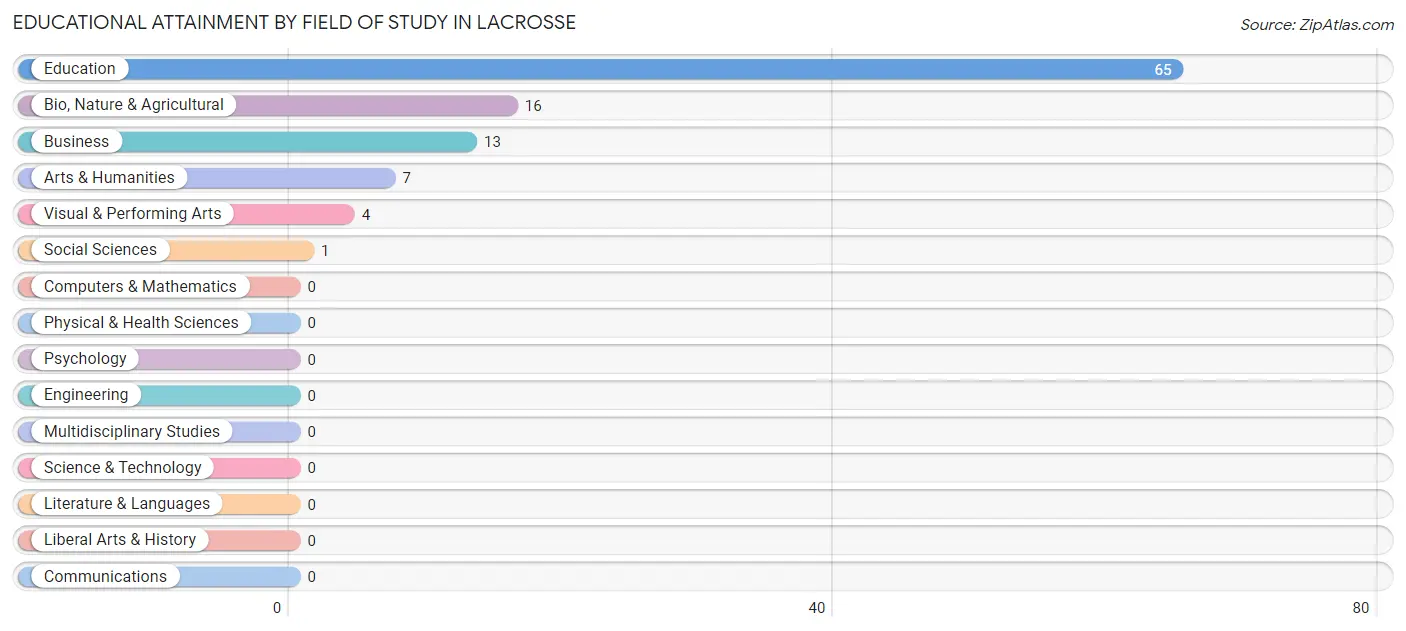
| Field of Study | # Graduates | % Graduates |
| Computers & Mathematics | 0 | 0.0% |
| Bio, Nature & Agricultural | 16 | 15.1% |
| Physical & Health Sciences | 0 | 0.0% |
| Psychology | 0 | 0.0% |
| Social Sciences | 1 | 0.9% |
| Engineering | 0 | 0.0% |
| Multidisciplinary Studies | 0 | 0.0% |
| Science & Technology | 0 | 0.0% |
| Business | 13 | 12.3% |
| Education | 65 | 61.3% |
| Literature & Languages | 0 | 0.0% |
| Liberal Arts & History | 0 | 0.0% |
| Visual & Performing Arts | 4 | 3.8% |
| Communications | 0 | 0.0% |
| Arts & Humanities | 7 | 6.6% |
| Total | 106 | 100.0% |
Transportation & Commute in Lacrosse
Vehicle Availability by Sex in Lacrosse
The most prevalent vehicle ownership categories in Lacrosse are males with 3 vehicles (91, accounting for 75.8%) and females with 3 vehicles (15, making up 162.5%).
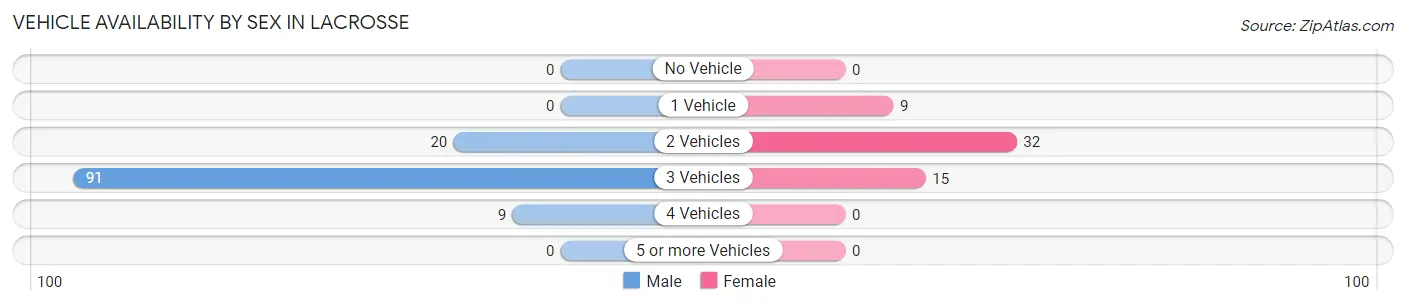
| Vehicles Available | Male | Female |
| No Vehicle | 0 (0.0%) | 0 (0.0%) |
| 1 Vehicle | 0 (0.0%) | 9 (16.1%) |
| 2 Vehicles | 20 (16.7%) | 32 (57.1%) |
| 3 Vehicles | 91 (75.8%) | 15 (26.8%) |
| 4 Vehicles | 9 (7.5%) | 0 (0.0%) |
| 5 or more Vehicles | 0 (0.0%) | 0 (0.0%) |
| Total | 120 (100.0%) | 56 (100.0%) |
Commute Time in Lacrosse
The most frequently occuring commute durations in Lacrosse are 15 to 19 minutes (59 commuters, 34.3%), 20 to 24 minutes (24 commuters, 14.0%), and 30 to 34 minutes (20 commuters, 11.6%).
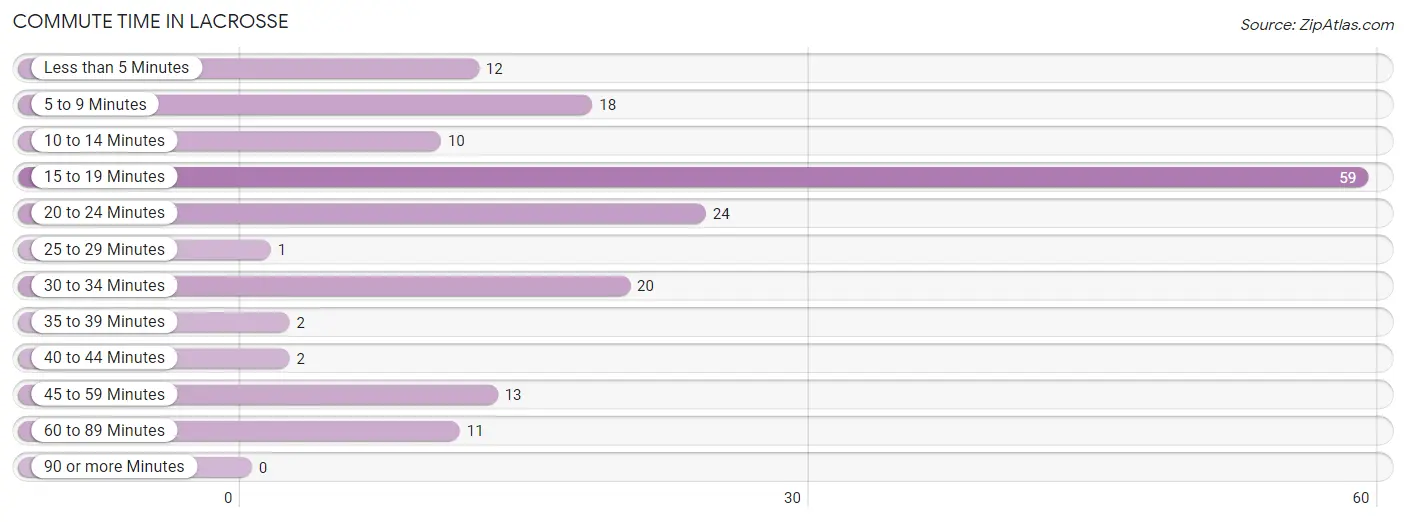
| Commute Time | # Commuters | % Commuters |
| Less than 5 Minutes | 12 | 7.0% |
| 5 to 9 Minutes | 18 | 10.5% |
| 10 to 14 Minutes | 10 | 5.8% |
| 15 to 19 Minutes | 59 | 34.3% |
| 20 to 24 Minutes | 24 | 14.0% |
| 25 to 29 Minutes | 1 | 0.6% |
| 30 to 34 Minutes | 20 | 11.6% |
| 35 to 39 Minutes | 2 | 1.2% |
| 40 to 44 Minutes | 2 | 1.2% |
| 45 to 59 Minutes | 13 | 7.6% |
| 60 to 89 Minutes | 11 | 6.4% |
| 90 or more Minutes | 0 | 0.0% |
Commute Time by Sex in Lacrosse
The most common commute times in Lacrosse are 15 to 19 minutes (59 commuters, 50.0%) for males and 30 to 34 minutes (20 commuters, 37.0%) for females.
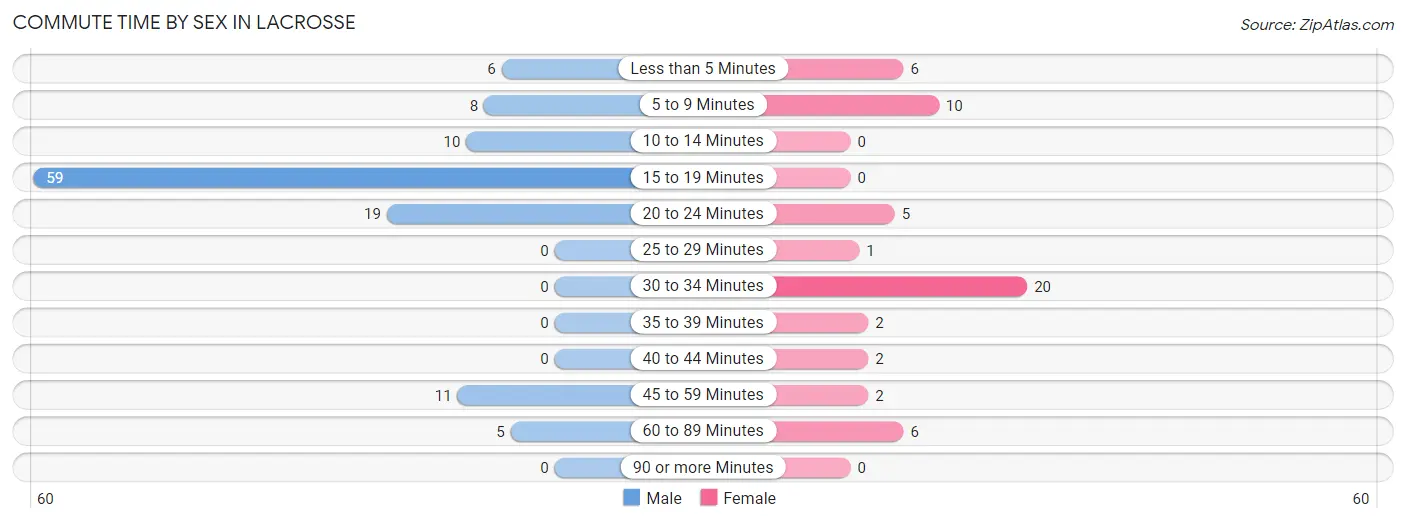
| Commute Time | Male | Female |
| Less than 5 Minutes | 6 (5.1%) | 6 (11.1%) |
| 5 to 9 Minutes | 8 (6.8%) | 10 (18.5%) |
| 10 to 14 Minutes | 10 (8.5%) | 0 (0.0%) |
| 15 to 19 Minutes | 59 (50.0%) | 0 (0.0%) |
| 20 to 24 Minutes | 19 (16.1%) | 5 (9.3%) |
| 25 to 29 Minutes | 0 (0.0%) | 1 (1.8%) |
| 30 to 34 Minutes | 0 (0.0%) | 20 (37.0%) |
| 35 to 39 Minutes | 0 (0.0%) | 2 (3.7%) |
| 40 to 44 Minutes | 0 (0.0%) | 2 (3.7%) |
| 45 to 59 Minutes | 11 (9.3%) | 2 (3.7%) |
| 60 to 89 Minutes | 5 (4.2%) | 6 (11.1%) |
| 90 or more Minutes | 0 (0.0%) | 0 (0.0%) |
Time of Departure to Work by Sex in Lacrosse
The most frequent times of departure to work in Lacrosse are 5:00 AM to 5:29 AM (60, 50.8%) for males and 6:30 AM to 6:59 AM (16, 29.6%) for females.
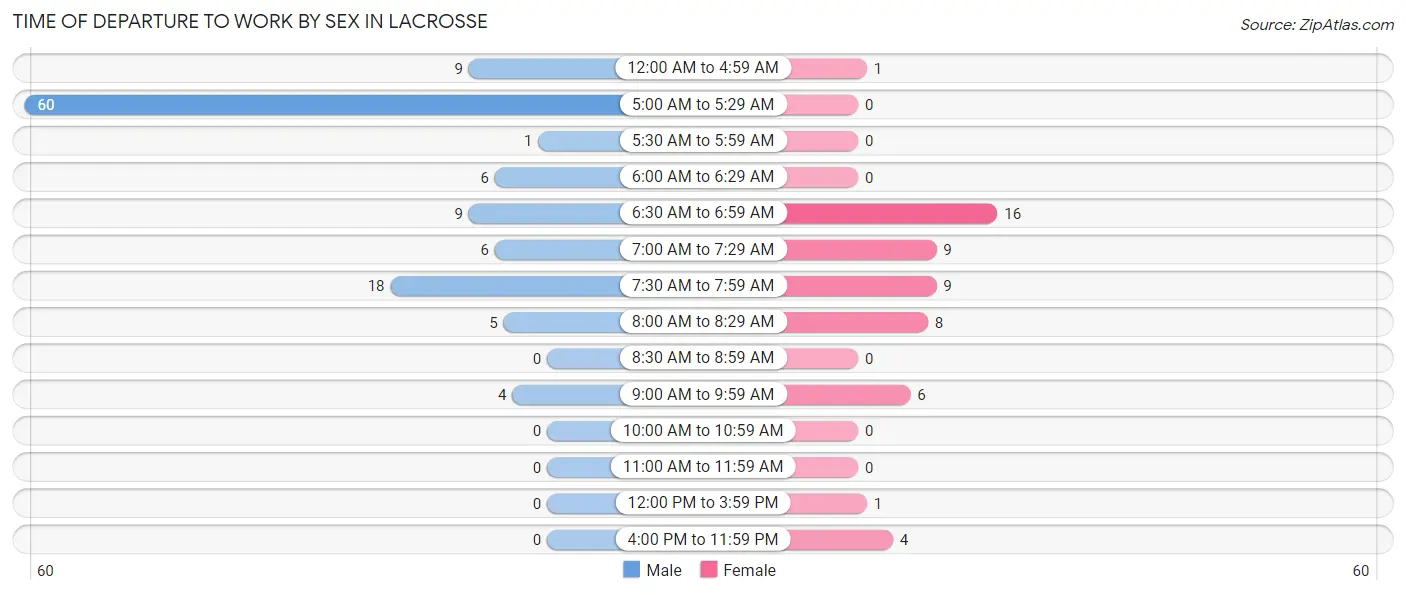
| Time of Departure | Male | Female |
| 12:00 AM to 4:59 AM | 9 (7.6%) | 1 (1.8%) |
| 5:00 AM to 5:29 AM | 60 (50.8%) | 0 (0.0%) |
| 5:30 AM to 5:59 AM | 1 (0.9%) | 0 (0.0%) |
| 6:00 AM to 6:29 AM | 6 (5.1%) | 0 (0.0%) |
| 6:30 AM to 6:59 AM | 9 (7.6%) | 16 (29.6%) |
| 7:00 AM to 7:29 AM | 6 (5.1%) | 9 (16.7%) |
| 7:30 AM to 7:59 AM | 18 (15.2%) | 9 (16.7%) |
| 8:00 AM to 8:29 AM | 5 (4.2%) | 8 (14.8%) |
| 8:30 AM to 8:59 AM | 0 (0.0%) | 0 (0.0%) |
| 9:00 AM to 9:59 AM | 4 (3.4%) | 6 (11.1%) |
| 10:00 AM to 10:59 AM | 0 (0.0%) | 0 (0.0%) |
| 11:00 AM to 11:59 AM | 0 (0.0%) | 0 (0.0%) |
| 12:00 PM to 3:59 PM | 0 (0.0%) | 1 (1.8%) |
| 4:00 PM to 11:59 PM | 0 (0.0%) | 4 (7.4%) |
| Total | 118 (100.0%) | 54 (100.0%) |
Housing Occupancy in Lacrosse
Occupancy by Ownership in Lacrosse
Of the total 225 dwellings in Lacrosse, owner-occupied units account for 187 (83.1%), while renter-occupied units make up 38 (16.9%).
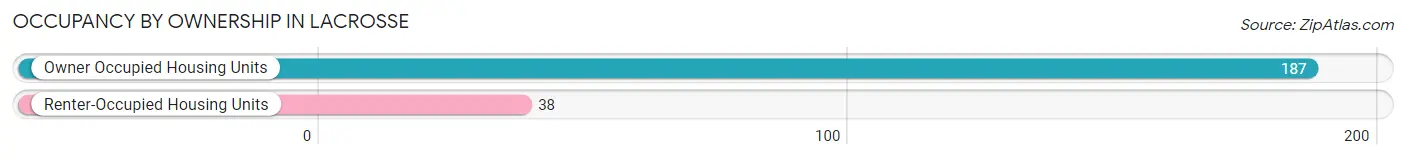
| Occupancy | # Housing Units | % Housing Units |
| Owner Occupied Housing Units | 187 | 83.1% |
| Renter-Occupied Housing Units | 38 | 16.9% |
| Total Occupied Housing Units | 225 | 100.0% |
Occupancy by Household Size in Lacrosse
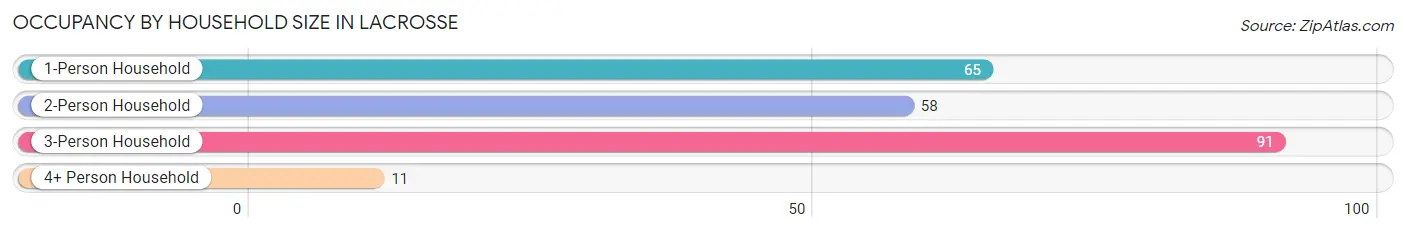
| Household Size | # Housing Units | % Housing Units |
| 1-Person Household | 65 | 28.9% |
| 2-Person Household | 58 | 25.8% |
| 3-Person Household | 91 | 40.4% |
| 4+ Person Household | 11 | 4.9% |
| Total Housing Units | 225 | 100.0% |
Occupancy by Ownership by Household Size in Lacrosse
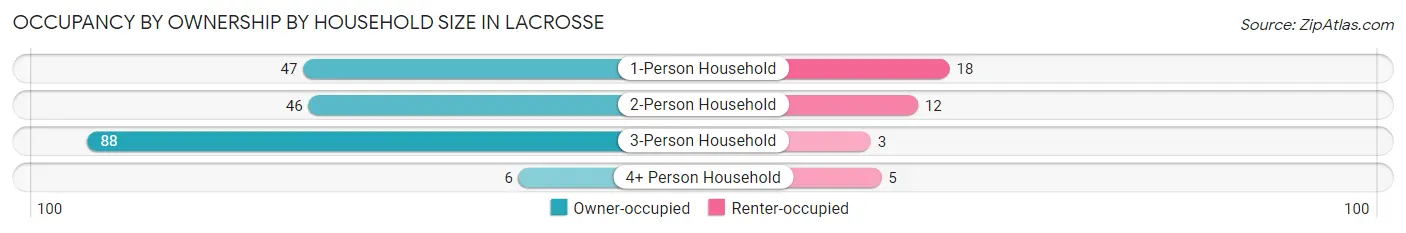
| Household Size | Owner-occupied | Renter-occupied |
| 1-Person Household | 47 (72.3%) | 18 (27.7%) |
| 2-Person Household | 46 (79.3%) | 12 (20.7%) |
| 3-Person Household | 88 (96.7%) | 3 (3.3%) |
| 4+ Person Household | 6 (54.5%) | 5 (45.5%) |
| Total Housing Units | 187 (83.1%) | 38 (16.9%) |
Occupancy by Educational Attainment in Lacrosse
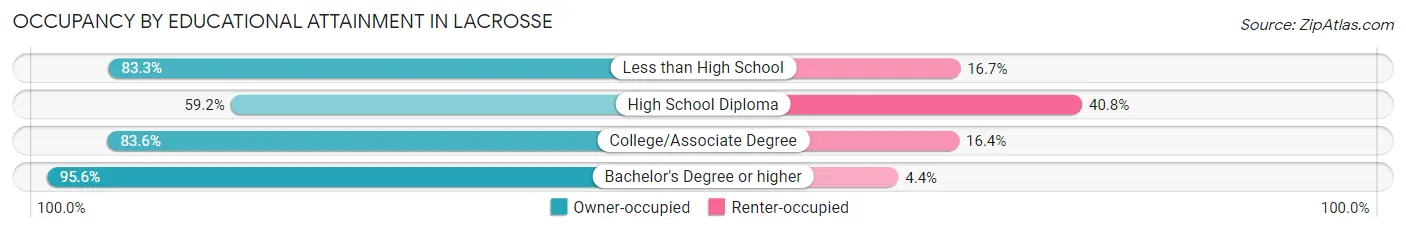
| Household Size | Owner-occupied | Renter-occupied |
| Less than High School | 10 (83.3%) | 2 (16.7%) |
| High School Diploma | 29 (59.2%) | 20 (40.8%) |
| College/Associate Degree | 61 (83.6%) | 12 (16.4%) |
| Bachelor's Degree or higher | 87 (95.6%) | 4 (4.4%) |
Occupancy by Age of Householder in Lacrosse
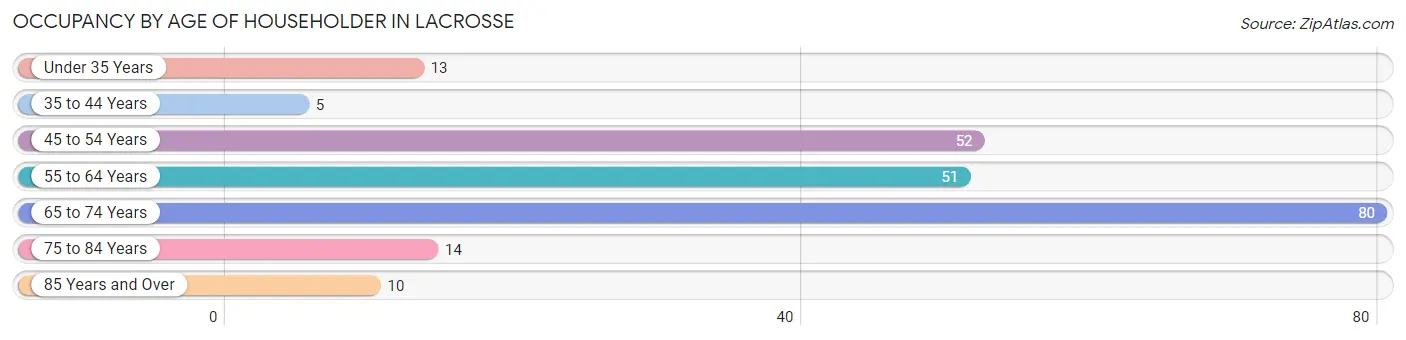
| Age Bracket | # Households | % Households |
| Under 35 Years | 13 | 5.8% |
| 35 to 44 Years | 5 | 2.2% |
| 45 to 54 Years | 52 | 23.1% |
| 55 to 64 Years | 51 | 22.7% |
| 65 to 74 Years | 80 | 35.6% |
| 75 to 84 Years | 14 | 6.2% |
| 85 Years and Over | 10 | 4.4% |
| Total | 225 | 100.0% |
Housing Finances in Lacrosse
Median Income by Occupancy in Lacrosse
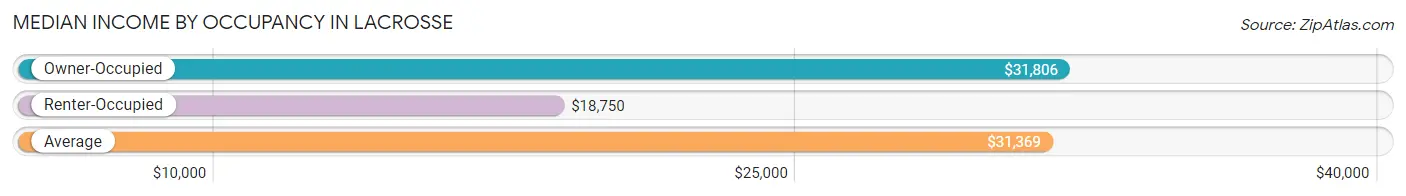
| Occupancy Type | # Households | Median Income |
| Owner-Occupied | 187 (83.1%) | $31,806 |
| Renter-Occupied | 38 (16.9%) | $18,750 |
| Average | 225 (100.0%) | $31,369 |
Occupancy by Householder Income Bracket in Lacrosse
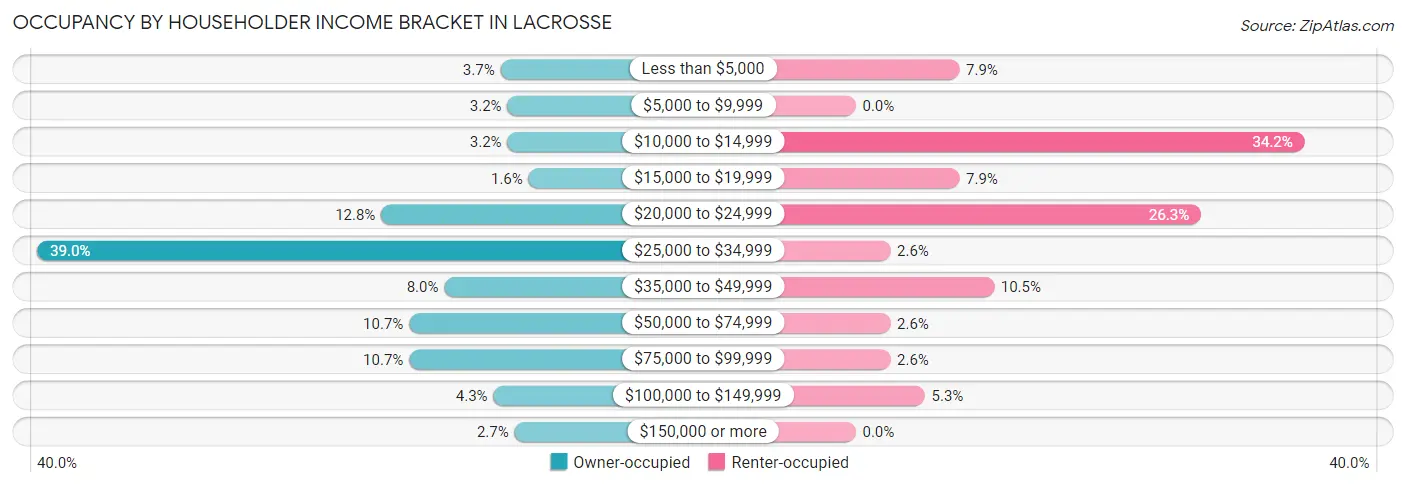
| Income Bracket | Owner-occupied | Renter-occupied |
| Less than $5,000 | 7 (3.7%) | 3 (7.9%) |
| $5,000 to $9,999 | 6 (3.2%) | 0 (0.0%) |
| $10,000 to $14,999 | 6 (3.2%) | 13 (34.2%) |
| $15,000 to $19,999 | 3 (1.6%) | 3 (7.9%) |
| $20,000 to $24,999 | 24 (12.8%) | 10 (26.3%) |
| $25,000 to $34,999 | 73 (39.0%) | 1 (2.6%) |
| $35,000 to $49,999 | 15 (8.0%) | 4 (10.5%) |
| $50,000 to $74,999 | 20 (10.7%) | 1 (2.6%) |
| $75,000 to $99,999 | 20 (10.7%) | 1 (2.6%) |
| $100,000 to $149,999 | 8 (4.3%) | 2 (5.3%) |
| $150,000 or more | 5 (2.7%) | 0 (0.0%) |
| Total | 187 (100.0%) | 38 (100.0%) |
Monthly Housing Cost Tiers in Lacrosse
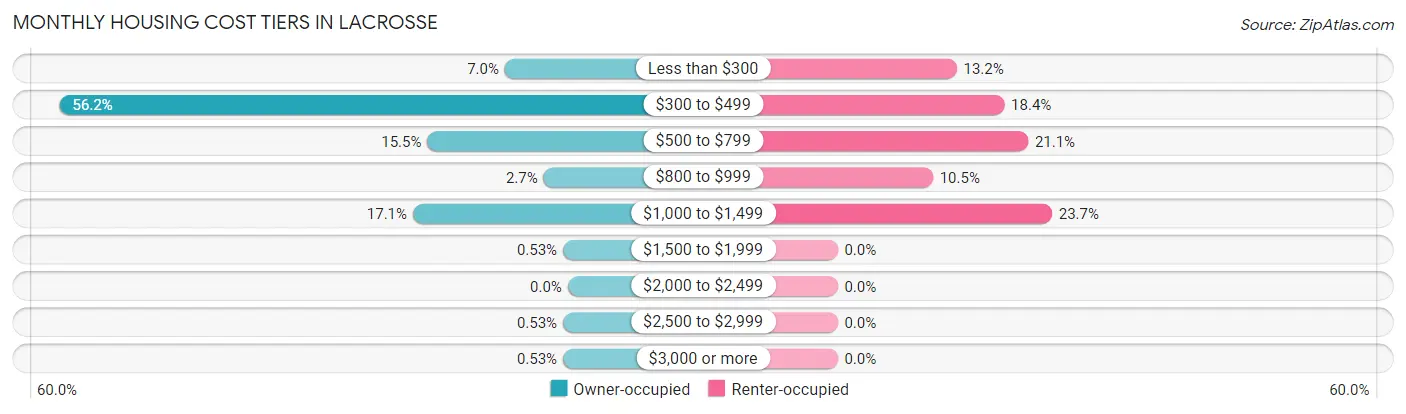
| Monthly Cost | Owner-occupied | Renter-occupied |
| Less than $300 | 13 (7.0%) | 5 (13.2%) |
| $300 to $499 | 105 (56.1%) | 7 (18.4%) |
| $500 to $799 | 29 (15.5%) | 8 (21.0%) |
| $800 to $999 | 5 (2.7%) | 4 (10.5%) |
| $1,000 to $1,499 | 32 (17.1%) | 9 (23.7%) |
| $1,500 to $1,999 | 1 (0.5%) | 0 (0.0%) |
| $2,000 to $2,499 | 0 (0.0%) | 0 (0.0%) |
| $2,500 to $2,999 | 1 (0.5%) | 0 (0.0%) |
| $3,000 or more | 1 (0.5%) | 0 (0.0%) |
| Total | 187 (100.0%) | 38 (100.0%) |
Physical Housing Characteristics in Lacrosse
Housing Structures in Lacrosse
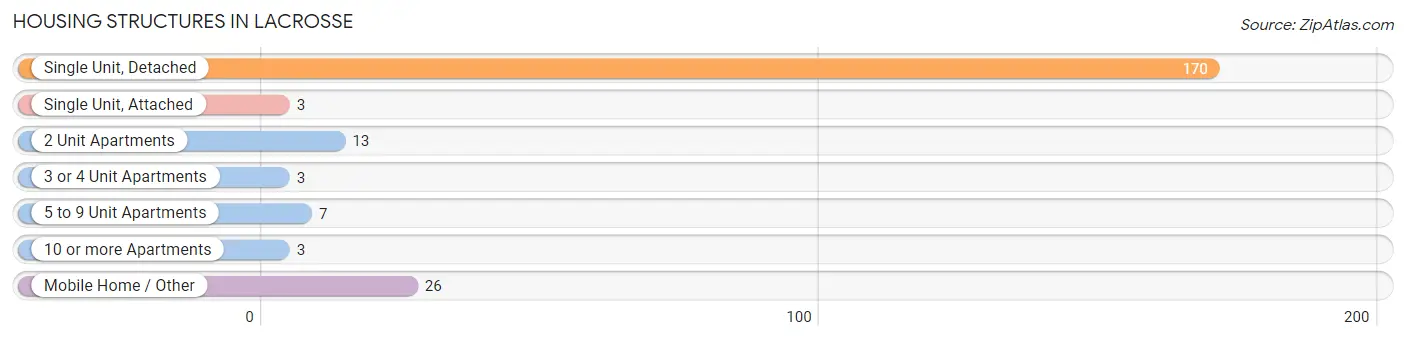
| Structure Type | # Housing Units | % Housing Units |
| Single Unit, Detached | 170 | 75.6% |
| Single Unit, Attached | 3 | 1.3% |
| 2 Unit Apartments | 13 | 5.8% |
| 3 or 4 Unit Apartments | 3 | 1.3% |
| 5 to 9 Unit Apartments | 7 | 3.1% |
| 10 or more Apartments | 3 | 1.3% |
| Mobile Home / Other | 26 | 11.6% |
| Total | 225 | 100.0% |
Housing Structures by Occupancy in Lacrosse
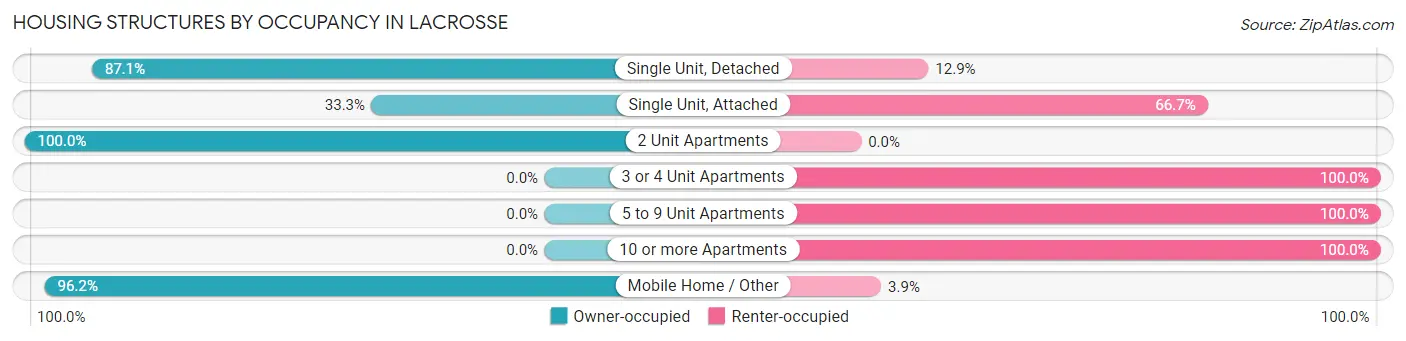
| Structure Type | Owner-occupied | Renter-occupied |
| Single Unit, Detached | 148 (87.1%) | 22 (12.9%) |
| Single Unit, Attached | 1 (33.3%) | 2 (66.7%) |
| 2 Unit Apartments | 13 (100.0%) | 0 (0.0%) |
| 3 or 4 Unit Apartments | 0 (0.0%) | 3 (100.0%) |
| 5 to 9 Unit Apartments | 0 (0.0%) | 7 (100.0%) |
| 10 or more Apartments | 0 (0.0%) | 3 (100.0%) |
| Mobile Home / Other | 25 (96.2%) | 1 (3.8%) |
| Total | 187 (83.1%) | 38 (16.9%) |
Housing Structures by Number of Rooms in Lacrosse
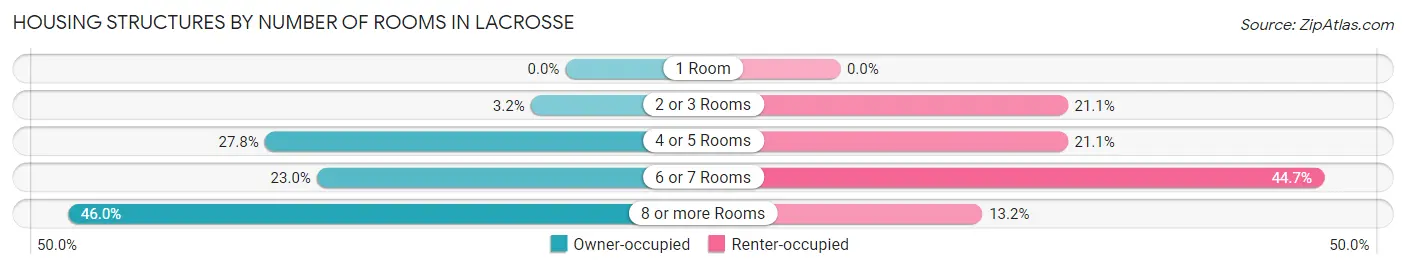
| Number of Rooms | Owner-occupied | Renter-occupied |
| 1 Room | 0 (0.0%) | 0 (0.0%) |
| 2 or 3 Rooms | 6 (3.2%) | 8 (21.0%) |
| 4 or 5 Rooms | 52 (27.8%) | 8 (21.0%) |
| 6 or 7 Rooms | 43 (23.0%) | 17 (44.7%) |
| 8 or more Rooms | 86 (46.0%) | 5 (13.2%) |
| Total | 187 (100.0%) | 38 (100.0%) |
Housing Structure by Heating Type in Lacrosse
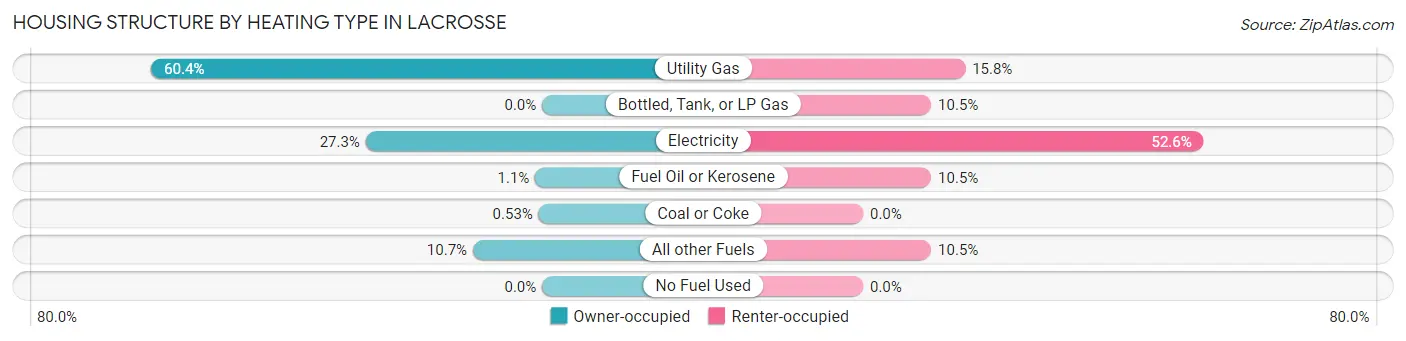
| Heating Type | Owner-occupied | Renter-occupied |
| Utility Gas | 113 (60.4%) | 6 (15.8%) |
| Bottled, Tank, or LP Gas | 0 (0.0%) | 4 (10.5%) |
| Electricity | 51 (27.3%) | 20 (52.6%) |
| Fuel Oil or Kerosene | 2 (1.1%) | 4 (10.5%) |
| Coal or Coke | 1 (0.5%) | 0 (0.0%) |
| All other Fuels | 20 (10.7%) | 4 (10.5%) |
| No Fuel Used | 0 (0.0%) | 0 (0.0%) |
| Total | 187 (100.0%) | 38 (100.0%) |
Household Vehicle Usage in Lacrosse
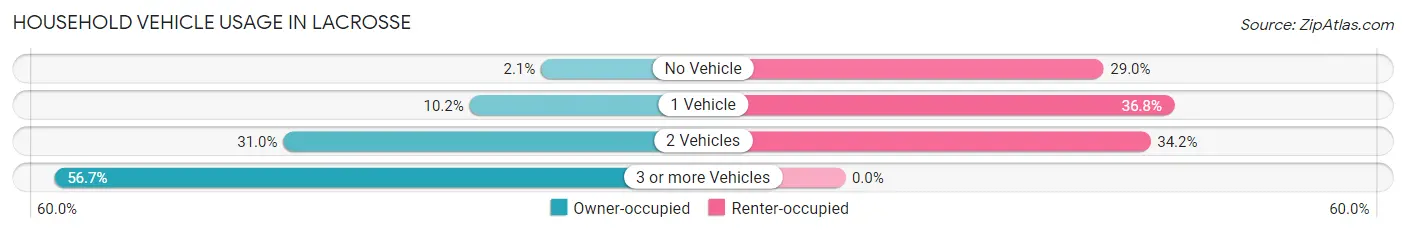
| Vehicles per Household | Owner-occupied | Renter-occupied |
| No Vehicle | 4 (2.1%) | 11 (28.9%) |
| 1 Vehicle | 19 (10.2%) | 14 (36.8%) |
| 2 Vehicles | 58 (31.0%) | 13 (34.2%) |
| 3 or more Vehicles | 106 (56.7%) | 0 (0.0%) |
| Total | 187 (100.0%) | 38 (100.0%) |
Real Estate & Mortgages in Lacrosse
Real Estate and Mortgage Overview in Lacrosse
| Characteristic | Without Mortgage | With Mortgage |
| Housing Units | 140 | 47 |
| Median Property Value | $102,900 | $143,800 |
| Median Household Income | $31,746 | $3 |
| Monthly Housing Costs | $441 | $1 |
| Real Estate Taxes | $1,186 | $19 |
Property Value by Mortgage Status in Lacrosse
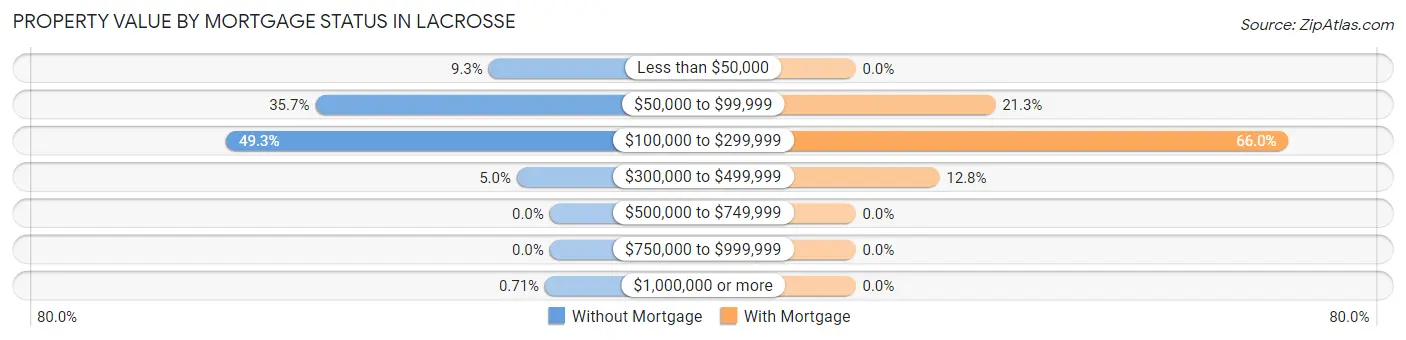
| Property Value | Without Mortgage | With Mortgage |
| Less than $50,000 | 13 (9.3%) | 0 (0.0%) |
| $50,000 to $99,999 | 50 (35.7%) | 10 (21.3%) |
| $100,000 to $299,999 | 69 (49.3%) | 31 (66.0%) |
| $300,000 to $499,999 | 7 (5.0%) | 6 (12.8%) |
| $500,000 to $749,999 | 0 (0.0%) | 0 (0.0%) |
| $750,000 to $999,999 | 0 (0.0%) | 0 (0.0%) |
| $1,000,000 or more | 1 (0.7%) | 0 (0.0%) |
| Total | 140 (100.0%) | 47 (100.0%) |
Household Income by Mortgage Status in Lacrosse
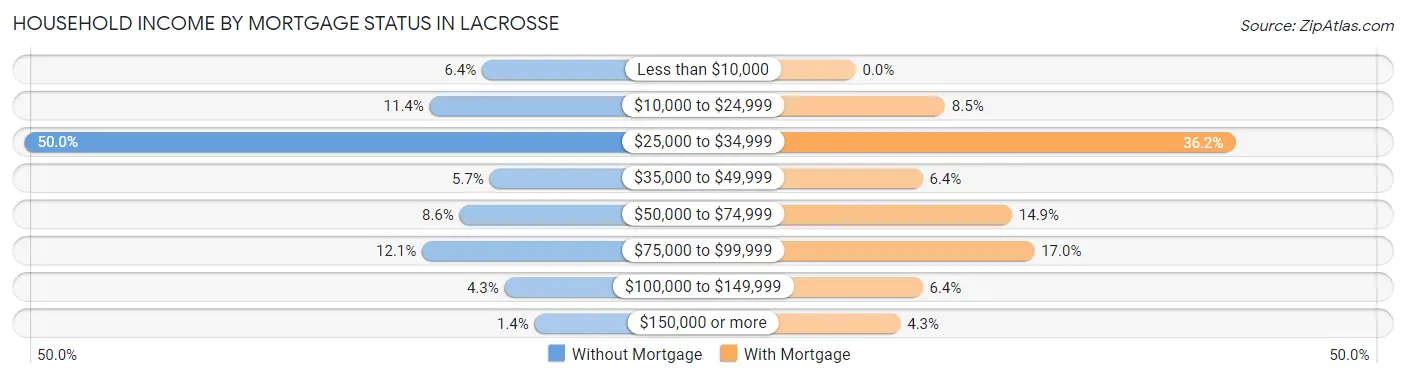
| Household Income | Without Mortgage | With Mortgage |
| Less than $10,000 | 9 (6.4%) | 0 (0.0%) |
| $10,000 to $24,999 | 16 (11.4%) | 4 (8.5%) |
| $25,000 to $34,999 | 70 (50.0%) | 17 (36.2%) |
| $35,000 to $49,999 | 8 (5.7%) | 3 (6.4%) |
| $50,000 to $74,999 | 12 (8.6%) | 7 (14.9%) |
| $75,000 to $99,999 | 17 (12.1%) | 8 (17.0%) |
| $100,000 to $149,999 | 6 (4.3%) | 3 (6.4%) |
| $150,000 or more | 2 (1.4%) | 2 (4.3%) |
| Total | 140 (100.0%) | 47 (100.0%) |
Property Value to Household Income Ratio in Lacrosse
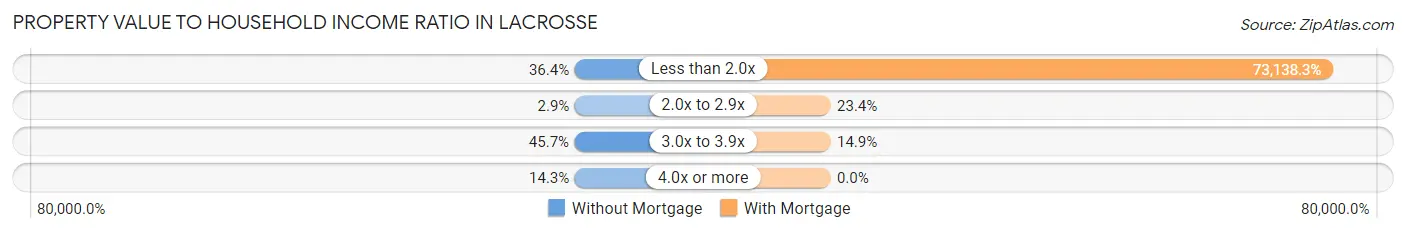
| Value-to-Income Ratio | Without Mortgage | With Mortgage |
| Less than 2.0x | 51 (36.4%) | 34,375 (73,138.3%) |
| 2.0x to 2.9x | 4 (2.9%) | 11 (23.4%) |
| 3.0x to 3.9x | 64 (45.7%) | 7 (14.9%) |
| 4.0x or more | 20 (14.3%) | 0 (0.0%) |
| Total | 140 (100.0%) | 47 (100.0%) |
Real Estate Taxes by Mortgage Status in Lacrosse
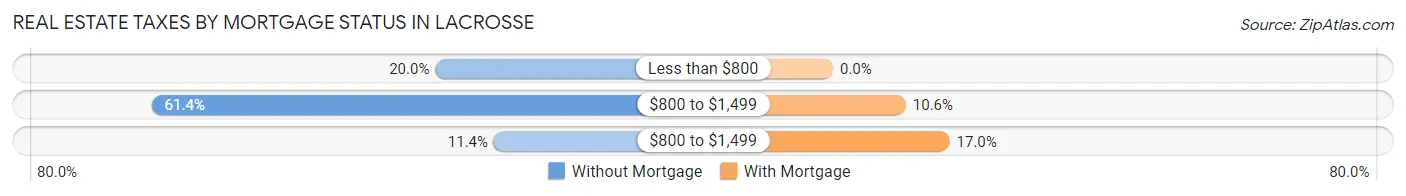
| Property Taxes | Without Mortgage | With Mortgage |
| Less than $800 | 28 (20.0%) | 0 (0.0%) |
| $800 to $1,499 | 86 (61.4%) | 5 (10.6%) |
| $800 to $1,499 | 16 (11.4%) | 8 (17.0%) |
| Total | 140 (100.0%) | 47 (100.0%) |
Health & Disability in Lacrosse
Health Insurance Coverage by Age in Lacrosse
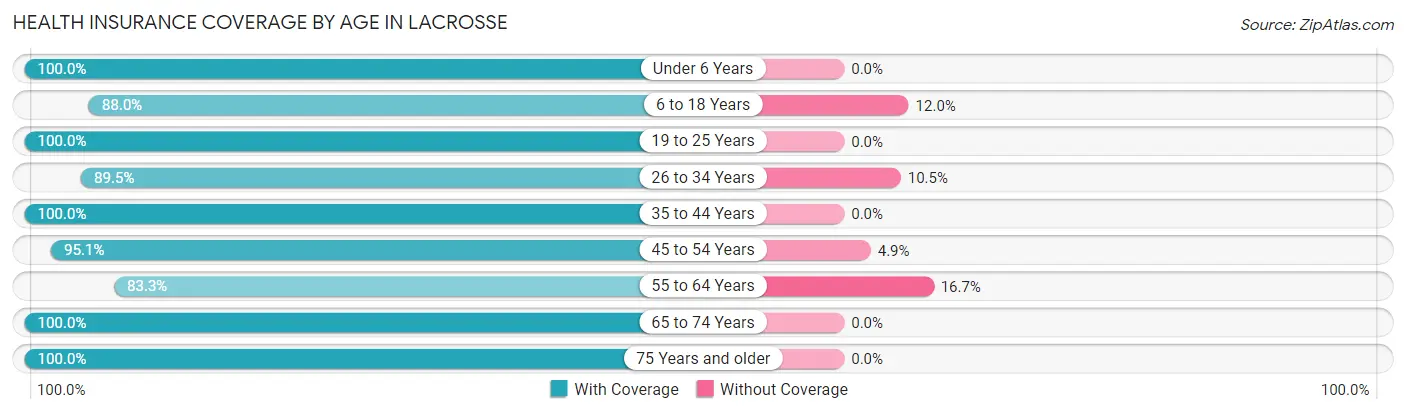
| Age Bracket | With Coverage | Without Coverage |
| Under 6 Years | 29 (100.0%) | 0 (0.0%) |
| 6 to 18 Years | 44 (88.0%) | 6 (12.0%) |
| 19 to 25 Years | 12 (100.0%) | 0 (0.0%) |
| 26 to 34 Years | 17 (89.5%) | 2 (10.5%) |
| 35 to 44 Years | 11 (100.0%) | 0 (0.0%) |
| 45 to 54 Years | 77 (95.1%) | 4 (4.9%) |
| 55 to 64 Years | 75 (83.3%) | 15 (16.7%) |
| 65 to 74 Years | 98 (100.0%) | 0 (0.0%) |
| 75 Years and older | 27 (100.0%) | 0 (0.0%) |
| Total | 390 (93.5%) | 27 (6.5%) |
Health Insurance Coverage by Citizenship Status in Lacrosse
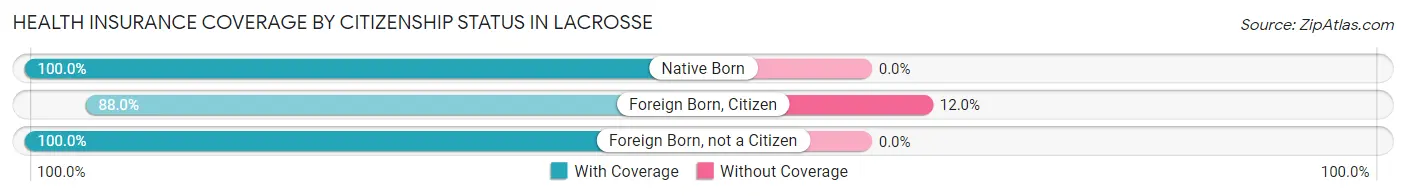
| Citizenship Status | With Coverage | Without Coverage |
| Native Born | 29 (100.0%) | 0 (0.0%) |
| Foreign Born, Citizen | 44 (88.0%) | 6 (12.0%) |
| Foreign Born, not a Citizen | 12 (100.0%) | 0 (0.0%) |
Health Insurance Coverage by Household Income in Lacrosse
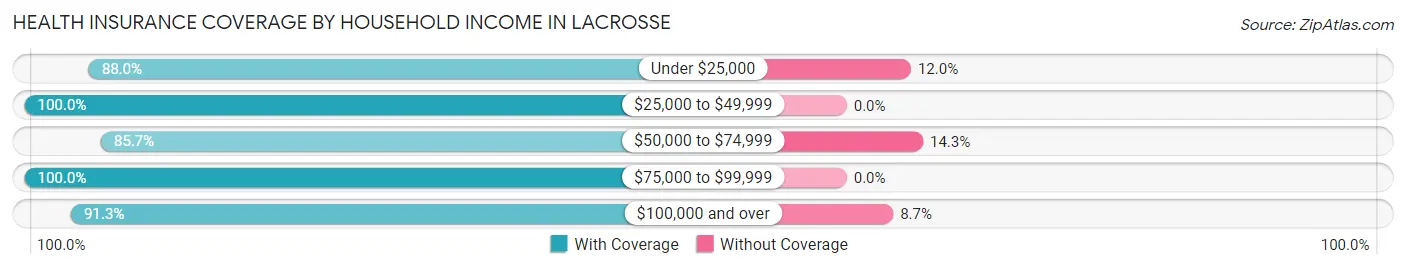
| Household Income | With Coverage | Without Coverage |
| Under $25,000 | 117 (88.0%) | 16 (12.0%) |
| $25,000 to $49,999 | 161 (100.0%) | 0 (0.0%) |
| $50,000 to $74,999 | 42 (85.7%) | 7 (14.3%) |
| $75,000 to $99,999 | 28 (100.0%) | 0 (0.0%) |
| $100,000 and over | 42 (91.3%) | 4 (8.7%) |
Public vs Private Health Insurance Coverage by Age in Lacrosse
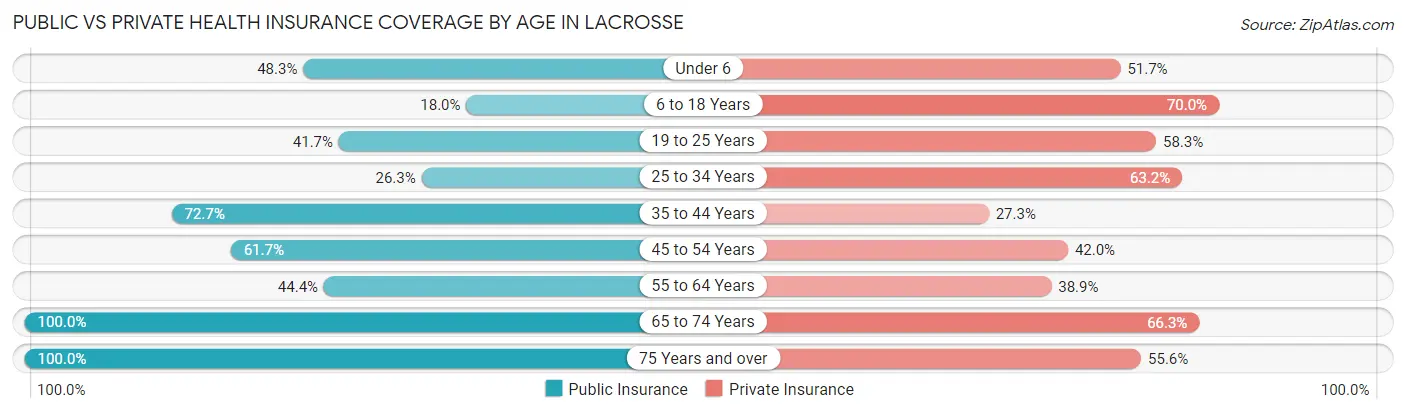
| Age Bracket | Public Insurance | Private Insurance |
| Under 6 | 14 (48.3%) | 15 (51.7%) |
| 6 to 18 Years | 9 (18.0%) | 35 (70.0%) |
| 19 to 25 Years | 5 (41.7%) | 7 (58.3%) |
| 25 to 34 Years | 5 (26.3%) | 12 (63.2%) |
| 35 to 44 Years | 8 (72.7%) | 3 (27.3%) |
| 45 to 54 Years | 50 (61.7%) | 34 (42.0%) |
| 55 to 64 Years | 40 (44.4%) | 35 (38.9%) |
| 65 to 74 Years | 98 (100.0%) | 65 (66.3%) |
| 75 Years and over | 27 (100.0%) | 15 (55.6%) |
| Total | 256 (61.4%) | 221 (53.0%) |
Disability Status by Sex by Age in Lacrosse
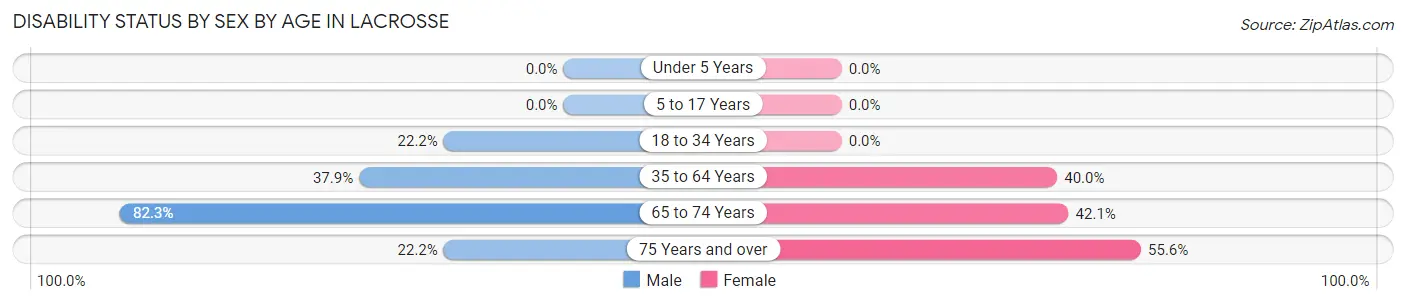
| Age Bracket | Male | Female |
| Under 5 Years | 0 (0.0%) | 0 (0.0%) |
| 5 to 17 Years | 0 (0.0%) | 0 (0.0%) |
| 18 to 34 Years | 4 (22.2%) | 0 (0.0%) |
| 35 to 64 Years | 33 (37.9%) | 38 (40.0%) |
| 65 to 74 Years | 65 (82.3%) | 8 (42.1%) |
| 75 Years and over | 2 (22.2%) | 10 (55.6%) |
Disability Class by Sex by Age in Lacrosse
Disability Class: Hearing Difficulty
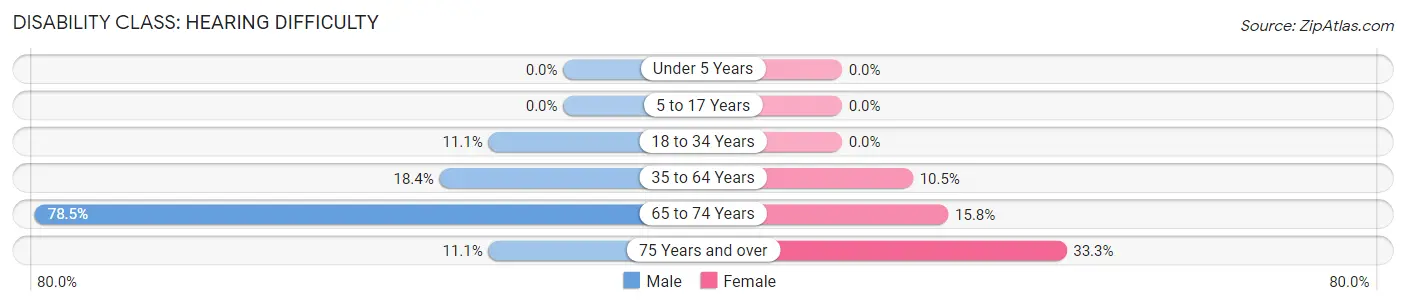
| Age Bracket | Male | Female |
| Under 5 Years | 0 (0.0%) | 0 (0.0%) |
| 5 to 17 Years | 0 (0.0%) | 0 (0.0%) |
| 18 to 34 Years | 2 (11.1%) | 0 (0.0%) |
| 35 to 64 Years | 16 (18.4%) | 10 (10.5%) |
| 65 to 74 Years | 62 (78.5%) | 3 (15.8%) |
| 75 Years and over | 1 (11.1%) | 6 (33.3%) |
Disability Class: Vision Difficulty
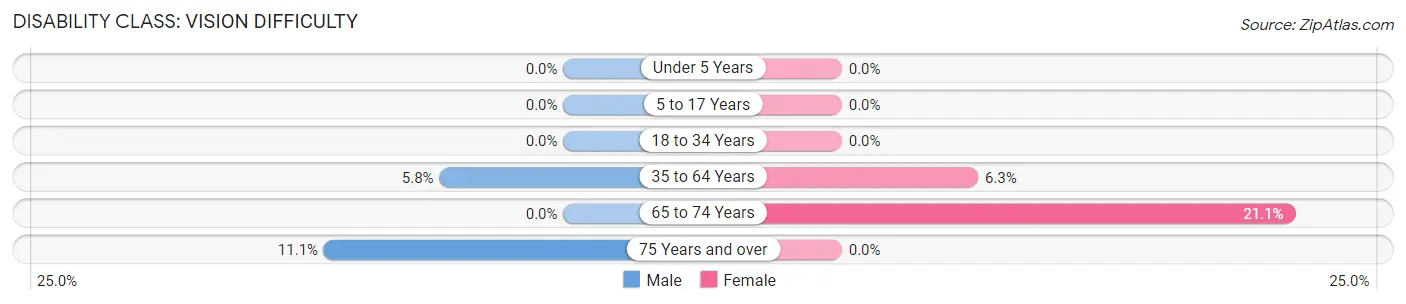
| Age Bracket | Male | Female |
| Under 5 Years | 0 (0.0%) | 0 (0.0%) |
| 5 to 17 Years | 0 (0.0%) | 0 (0.0%) |
| 18 to 34 Years | 0 (0.0%) | 0 (0.0%) |
| 35 to 64 Years | 5 (5.8%) | 6 (6.3%) |
| 65 to 74 Years | 0 (0.0%) | 4 (21.0%) |
| 75 Years and over | 1 (11.1%) | 0 (0.0%) |
Disability Class: Cognitive Difficulty
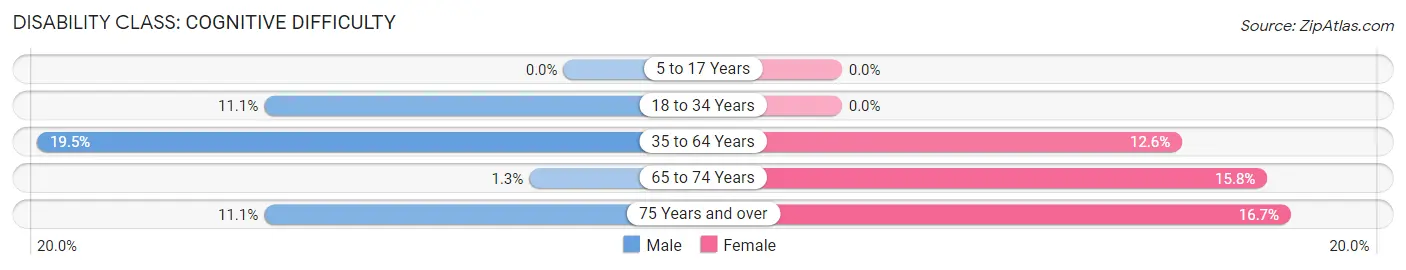
| Age Bracket | Male | Female |
| 5 to 17 Years | 0 (0.0%) | 0 (0.0%) |
| 18 to 34 Years | 2 (11.1%) | 0 (0.0%) |
| 35 to 64 Years | 17 (19.5%) | 12 (12.6%) |
| 65 to 74 Years | 1 (1.3%) | 3 (15.8%) |
| 75 Years and over | 1 (11.1%) | 3 (16.7%) |
Disability Class: Ambulatory Difficulty
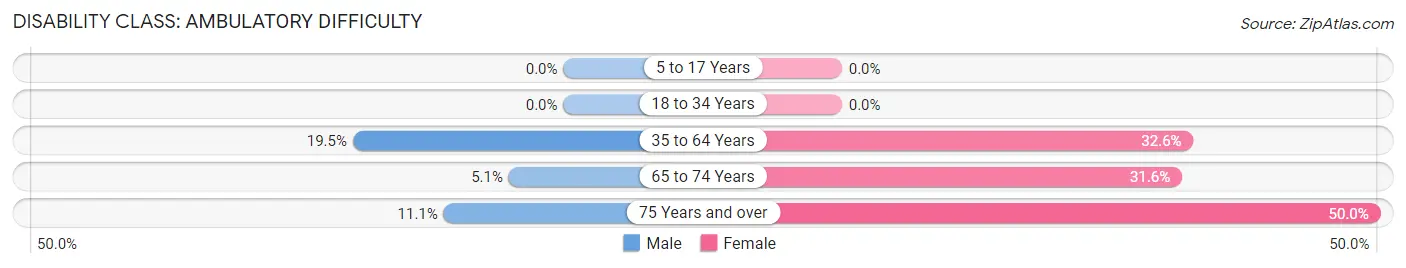
| Age Bracket | Male | Female |
| 5 to 17 Years | 0 (0.0%) | 0 (0.0%) |
| 18 to 34 Years | 0 (0.0%) | 0 (0.0%) |
| 35 to 64 Years | 17 (19.5%) | 31 (32.6%) |
| 65 to 74 Years | 4 (5.1%) | 6 (31.6%) |
| 75 Years and over | 1 (11.1%) | 9 (50.0%) |
Disability Class: Self-Care Difficulty
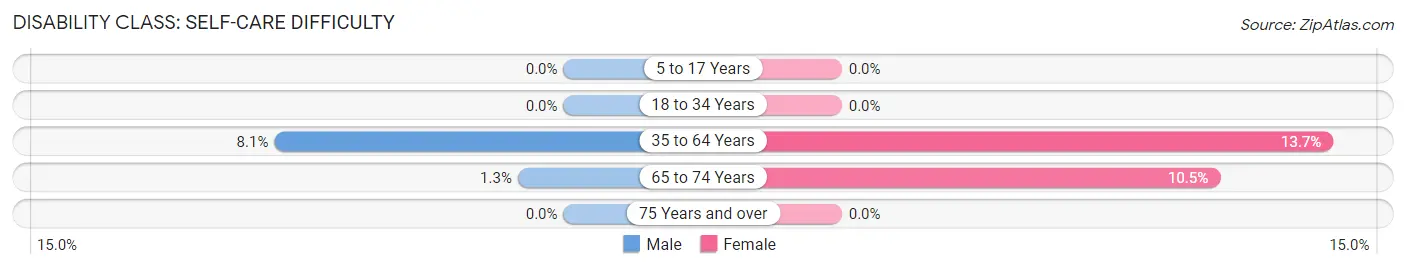
| Age Bracket | Male | Female |
| 5 to 17 Years | 0 (0.0%) | 0 (0.0%) |
| 18 to 34 Years | 0 (0.0%) | 0 (0.0%) |
| 35 to 64 Years | 7 (8.1%) | 13 (13.7%) |
| 65 to 74 Years | 1 (1.3%) | 2 (10.5%) |
| 75 Years and over | 0 (0.0%) | 0 (0.0%) |
Technology Access in Lacrosse
Computing Device Access in Lacrosse
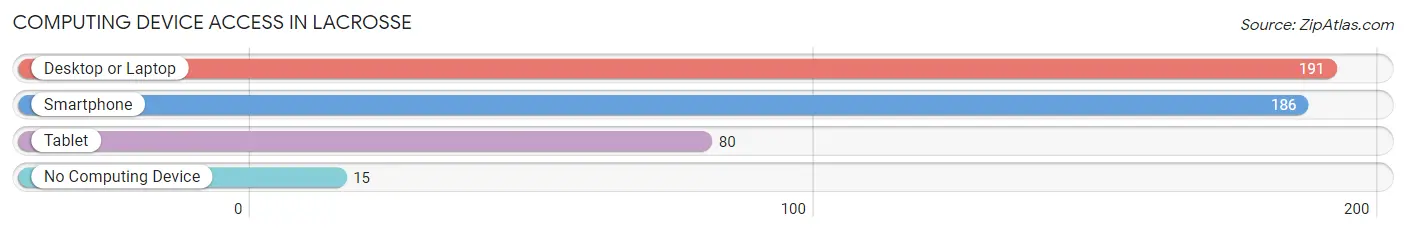
| Device Type | # Households | % Households |
| Desktop or Laptop | 191 | 84.9% |
| Smartphone | 186 | 82.7% |
| Tablet | 80 | 35.6% |
| No Computing Device | 15 | 6.7% |
| Total | 225 | 100.0% |
Internet Access in Lacrosse
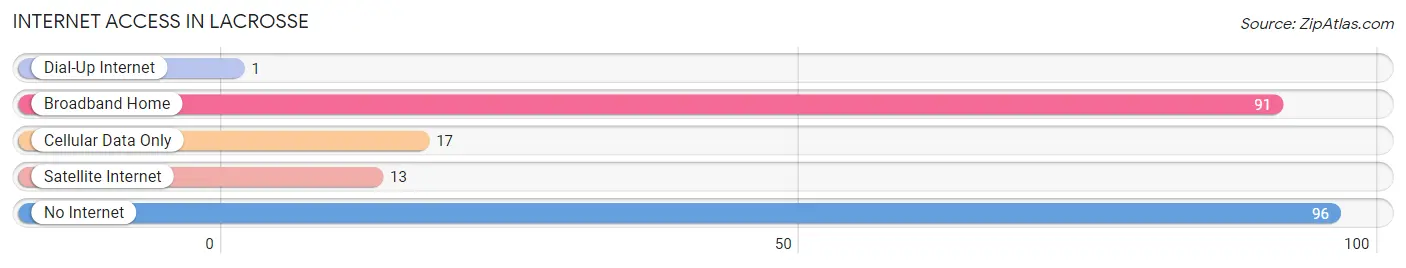
| Internet Type | # Households | % Households |
| Dial-Up Internet | 1 | 0.4% |
| Broadband Home | 91 | 40.4% |
| Cellular Data Only | 17 | 7.6% |
| Satellite Internet | 13 | 5.8% |
| No Internet | 96 | 42.7% |
| Total | 225 | 100.0% |
Lacrosse Summary
Lacrosse, Washington is a small town located in the southeastern corner of the state, near the border of Idaho. It is situated in the Palouse region of the state, which is known for its rolling hills and fertile farmland. The town was founded in 1883 and has a population of just over 500 people.
Geography
Lacrosse is located in the Palouse region of Washington, which is characterized by rolling hills and fertile farmland. The town is situated in the southeastern corner of the state, near the border of Idaho. The town is located on the Palouse River, which is a tributary of the Snake River. The town is surrounded by wheat fields and is located in a valley surrounded by hills. The climate in Lacrosse is semi-arid, with hot summers and cold winters.
Economy
The economy of Lacrosse is largely based on agriculture. The town is surrounded by wheat fields and is home to several grain elevators. The town also has a few small businesses, including a grocery store, a hardware store, and a few restaurants. The town is also home to a small airport, which serves the surrounding area.
Demographics
As of the 2010 census, the population of Lacrosse was 514. The racial makeup of the town was 95.3% White, 0.4% African American, 0.4% Native American, 0.4% Asian, 0.2% Pacific Islander, and 2.3% from two or more races. The median household income in Lacrosse was $37,500, and the median family income was $41,250.
History
Lacrosse was founded in 1883 by a group of settlers from the Midwest. The town was named after the sport of lacrosse, which was popular among the settlers. The town was originally a farming community, and the settlers grew wheat and other crops. The town was also home to a few small businesses, including a grocery store, a hardware store, and a few restaurants.
In the early 1900s, the town began to grow and the population increased. The town was home to several grain elevators, and the town became a hub for the surrounding area. The town was also home to a small airport, which served the surrounding area.
In the late 20th century, the town began to decline. The population decreased and the town became a small, rural community. The town is still home to a few small businesses, including a grocery store, a hardware store, and a few restaurants. The town is also home to a small airport, which serves the surrounding area.
Common Questions
What is Per Capita Income in Lacrosse?
Per Capita income in Lacrosse is $21,124.
What is the Median Family Income in Lacrosse?
Median Family Income in Lacrosse is $31,653.
What is the Median Household income in Lacrosse?
Median Household Income in Lacrosse is $31,369.
What is Inequality or Gini Index in Lacrosse?
Inequality or Gini Index in Lacrosse is 0.41.
What is the Total Population of Lacrosse?
Total Population of Lacrosse is 417.
What is the Total Male Population of Lacrosse?
Total Male Population of Lacrosse is 222.
What is the Total Female Population of Lacrosse?
Total Female Population of Lacrosse is 195.
What is the Ratio of Males per 100 Females in Lacrosse?
There are 113.85 Males per 100 Females in Lacrosse.
What is the Ratio of Females per 100 Males in Lacrosse?
There are 87.84 Females per 100 Males in Lacrosse.
What is the Median Population Age in Lacrosse?
Median Population Age in Lacrosse is 55.7 Years.
What is the Average Family Size in Lacrosse
Average Family Size in Lacrosse is 2.1 People.
What is the Average Household Size in Lacrosse
Average Household Size in Lacrosse is 1.9 People.
How Large is the Labor Force in Lacrosse?
There are 176 People in the Labor Forcein in Lacrosse.
What is the Percentage of People in the Labor Force in Lacrosse?
51.6% of People are in the Labor Force in Lacrosse.