Scott City, KS Map & Demographics
Scott City Map
Scott City Overview
$26,889
PER CAPITA INCOME
$54,522
AVG FAMILY INCOME
$47,217
AVG HOUSEHOLD INCOME
34.6%
WAGE / INCOME GAP [ % ]
65.4¢/ $1
WAGE / INCOME GAP [ $ ]
0.42
INEQUALITY / GINI INDEX
4,121
TOTAL POPULATION
2,081
MALE POPULATION
2,040
FEMALE POPULATION
102.01
MALES / 100 FEMALES
98.03
FEMALES / 100 MALES
36.0
MEDIAN AGE
3.1
AVG FAMILY SIZE
2.4
AVG HOUSEHOLD SIZE
2,146
LABOR FORCE [ PEOPLE ]
67.9%
PERCENT IN LABOR FORCE
3.0%
UNEMPLOYMENT RATE
Scott City Zip Codes
Scott City Area Codes
Income in Scott City
Income Overview in Scott City
Per Capita Income in Scott City is $26,889, while median incomes of families and households are $54,522 and $47,217 respectively.
| Characteristic | Number | Measure |
| Per Capita Income | 4,121 | $26,889 |
| Median Family Income | 1,066 | $54,522 |
| Mean Family Income | 1,066 | $78,927 |
| Median Household Income | 1,647 | $47,217 |
| Mean Household Income | 1,647 | $68,022 |
| Income Deficit | 1,066 | $0 |
| Wage / Income Gap (%) | 4,121 | 34.62% |
| Wage / Income Gap ($) | 4,121 | 65.38¢ per $1 |
| Gini / Inequality Index | 4,121 | 0.42 |
Earnings by Sex in Scott City
Average Earnings in Scott City are $29,758, $38,486 for men and $25,162 for women, a difference of 34.6%.
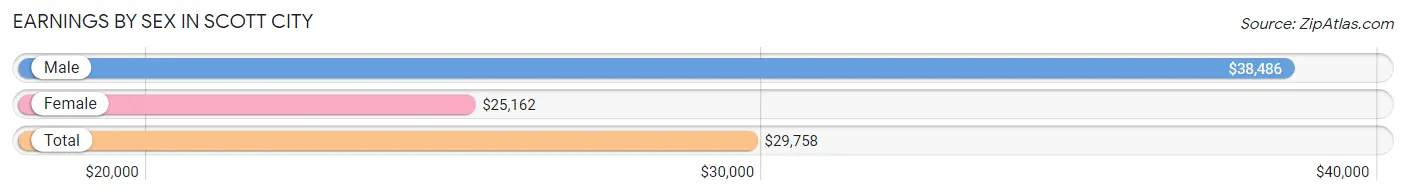
| Sex | Number | Average Earnings |
| Male | 1,354 (58.7%) | $38,486 |
| Female | 951 (41.3%) | $25,162 |
| Total | 2,305 (100.0%) | $29,758 |
Earnings by Sex by Income Bracket in Scott City
The most common earnings brackets in Scott City are $25,000 to $29,999 for men (189 | 14.0%) and $25,000 to $29,999 for women (145 | 15.2%).
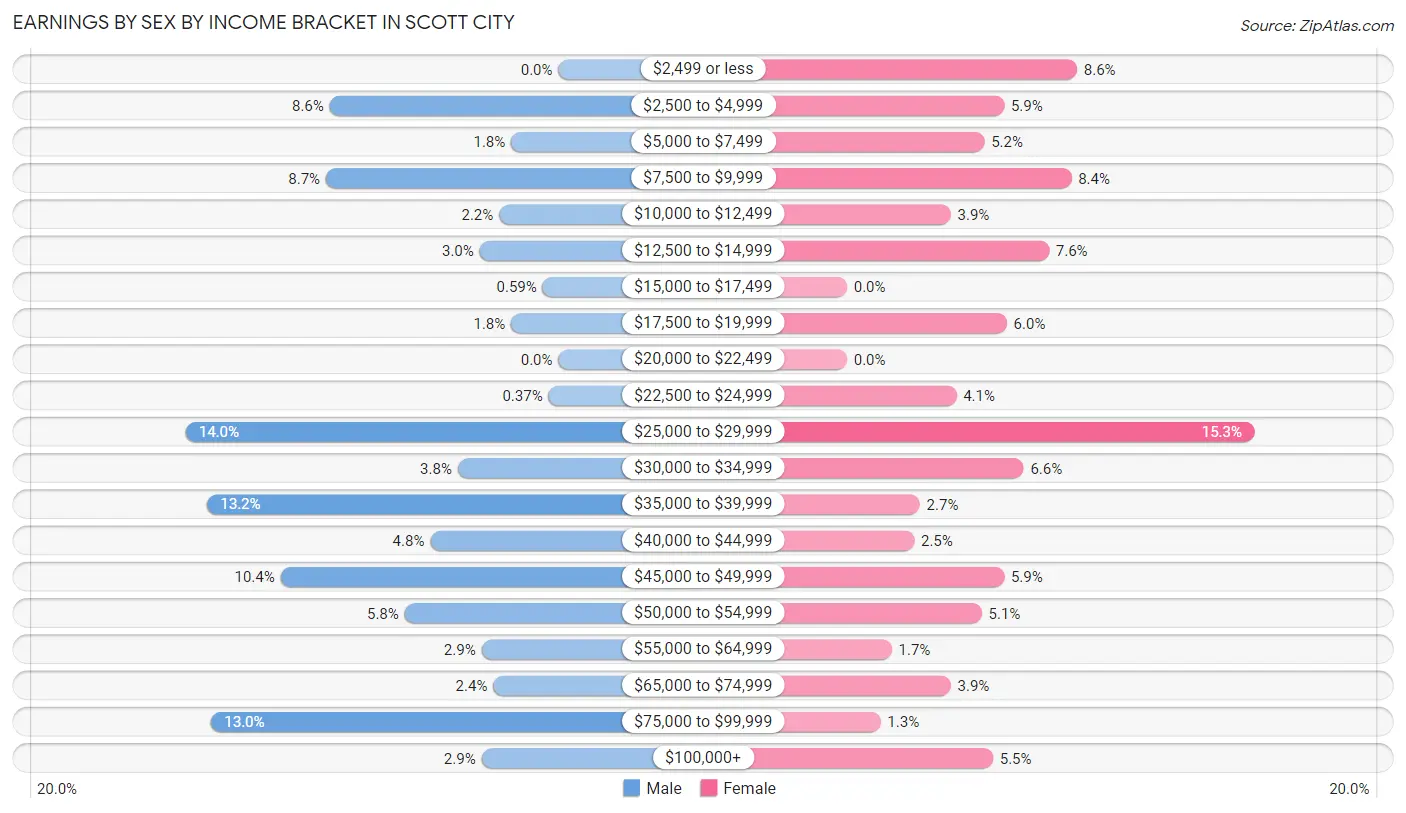
| Income | Male | Female |
| $2,499 or less | 0 (0.0%) | 82 (8.6%) |
| $2,500 to $4,999 | 116 (8.6%) | 56 (5.9%) |
| $5,000 to $7,499 | 24 (1.8%) | 49 (5.1%) |
| $7,500 to $9,999 | 118 (8.7%) | 80 (8.4%) |
| $10,000 to $12,499 | 30 (2.2%) | 37 (3.9%) |
| $12,500 to $14,999 | 40 (2.9%) | 72 (7.6%) |
| $15,000 to $17,499 | 8 (0.6%) | 0 (0.0%) |
| $17,500 to $19,999 | 24 (1.8%) | 57 (6.0%) |
| $20,000 to $22,499 | 0 (0.0%) | 0 (0.0%) |
| $22,500 to $24,999 | 5 (0.4%) | 39 (4.1%) |
| $25,000 to $29,999 | 189 (14.0%) | 145 (15.2%) |
| $30,000 to $34,999 | 51 (3.8%) | 63 (6.6%) |
| $35,000 to $39,999 | 178 (13.2%) | 26 (2.7%) |
| $40,000 to $44,999 | 65 (4.8%) | 24 (2.5%) |
| $45,000 to $49,999 | 141 (10.4%) | 56 (5.9%) |
| $50,000 to $54,999 | 78 (5.8%) | 48 (5.1%) |
| $55,000 to $64,999 | 39 (2.9%) | 16 (1.7%) |
| $65,000 to $74,999 | 33 (2.4%) | 37 (3.9%) |
| $75,000 to $99,999 | 176 (13.0%) | 12 (1.3%) |
| $100,000+ | 39 (2.9%) | 52 (5.5%) |
| Total | 1,354 (100.0%) | 951 (100.0%) |
Earnings by Sex by Educational Attainment in Scott City
Average earnings in Scott City are $43,621 for men and $26,644 for women, a difference of 38.9%. Men with an educational attainment of bachelor's degree enjoy the highest average annual earnings of $83,500, while those with high school diploma education earn the least with $29,361. Women with an educational attainment of graduate degree earn the most with the average annual earnings of $125,601, while those with high school diploma education have the smallest earnings of $26,944.
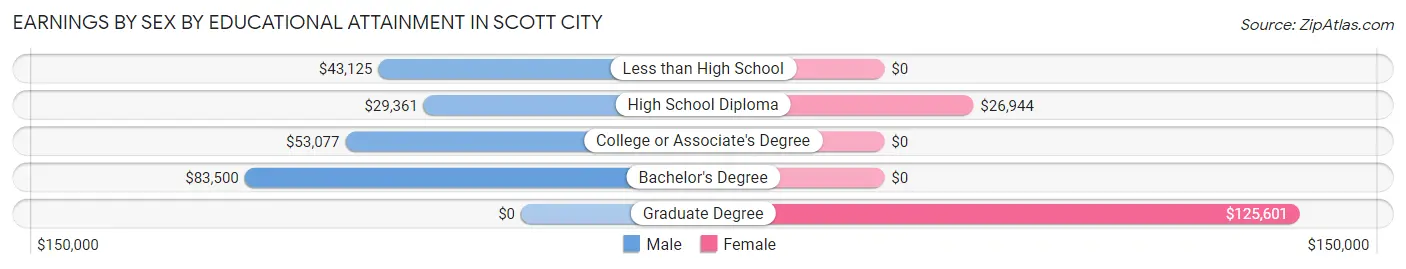
| Educational Attainment | Male Income | Female Income |
| Less than High School | $43,125 | $0 |
| High School Diploma | $29,361 | $26,944 |
| College or Associate's Degree | $53,077 | $0 |
| Bachelor's Degree | $83,500 | $0 |
| Graduate Degree | - | - |
| Total | $43,621 | $26,644 |
Family Income in Scott City
Family Income Brackets in Scott City
According to the Scott City family income data, there are 239 families falling into the $35,000 to $49,999 income range, which is the most common income bracket and makes up 22.4% of all families.
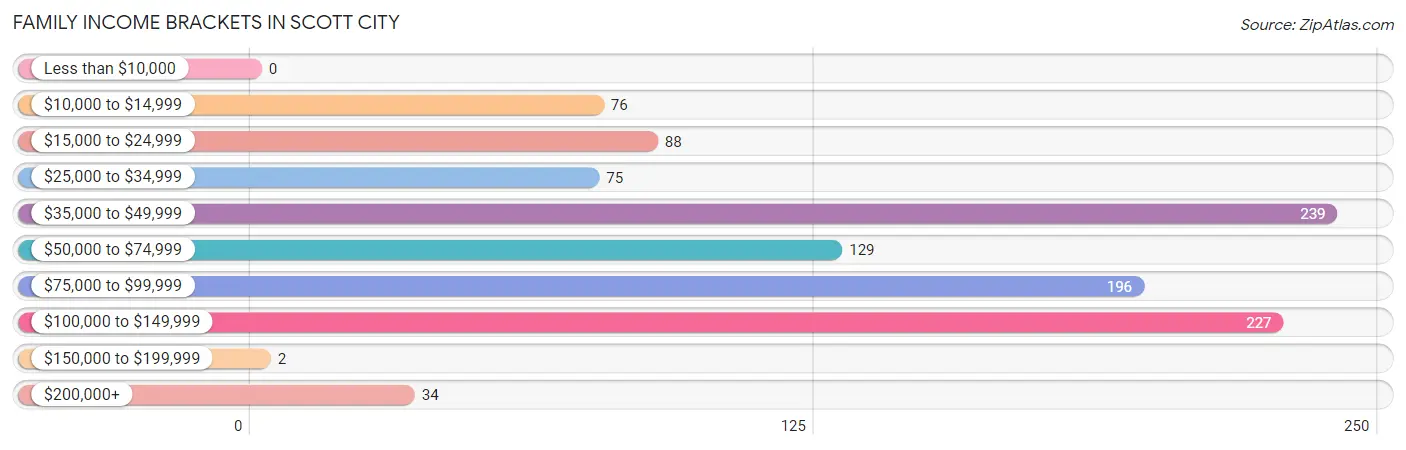
| Income Bracket | # Families | % Families |
| Less than $10,000 | 0 | 0.0% |
| $10,000 to $14,999 | 76 | 7.1% |
| $15,000 to $24,999 | 88 | 8.3% |
| $25,000 to $34,999 | 75 | 7.0% |
| $35,000 to $49,999 | 239 | 22.4% |
| $50,000 to $74,999 | 129 | 12.1% |
| $75,000 to $99,999 | 196 | 18.4% |
| $100,000 to $149,999 | 227 | 21.3% |
| $150,000 to $199,999 | 2 | 0.2% |
| $200,000+ | 34 | 3.2% |
Family Income by Famaliy Size in Scott City
4-person families (113 | 10.6%) account for the highest median family income in Scott City with $115,795 per family, while 3-person families (162 | 15.2%) have the highest median income of $28,978 per family member.
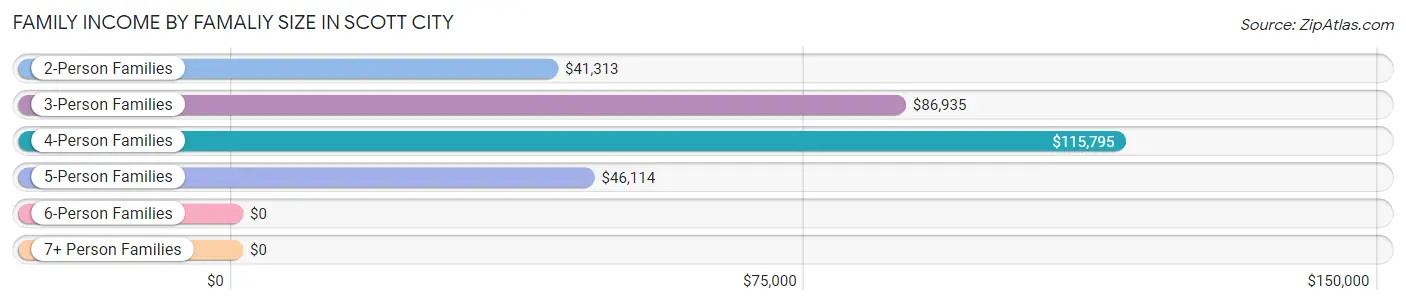
| Income Bracket | # Families | Median Income |
| 2-Person Families | 592 (55.5%) | $41,313 |
| 3-Person Families | 162 (15.2%) | $86,935 |
| 4-Person Families | 113 (10.6%) | $115,795 |
| 5-Person Families | 97 (9.1%) | $46,114 |
| 6-Person Families | 11 (1.0%) | $0 |
| 7+ Person Families | 91 (8.5%) | $0 |
| Total | 1,066 (100.0%) | $54,522 |
Family Income by Number of Earners in Scott City
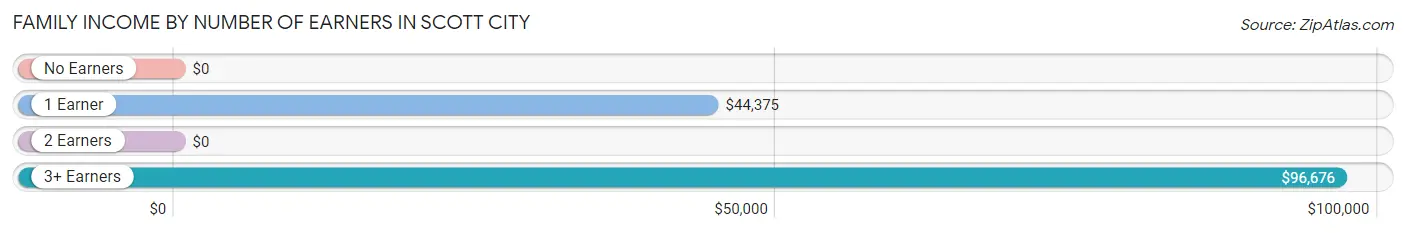
| Number of Earners | # Families | Median Income |
| No Earners | 155 (14.5%) | $0 |
| 1 Earner | 262 (24.6%) | $44,375 |
| 2 Earners | 401 (37.6%) | $0 |
| 3+ Earners | 248 (23.3%) | $96,676 |
| Total | 1,066 (100.0%) | $54,522 |
Household Income in Scott City
Household Income Brackets in Scott City
With 361 households falling in the category, the $25,000 to $34,999 income range is the most frequent in Scott City, accounting for 21.9% of all households. In contrast, only 2 households (0.1%) fall into the $150,000 to $199,999 income bracket, making it the least populous group.
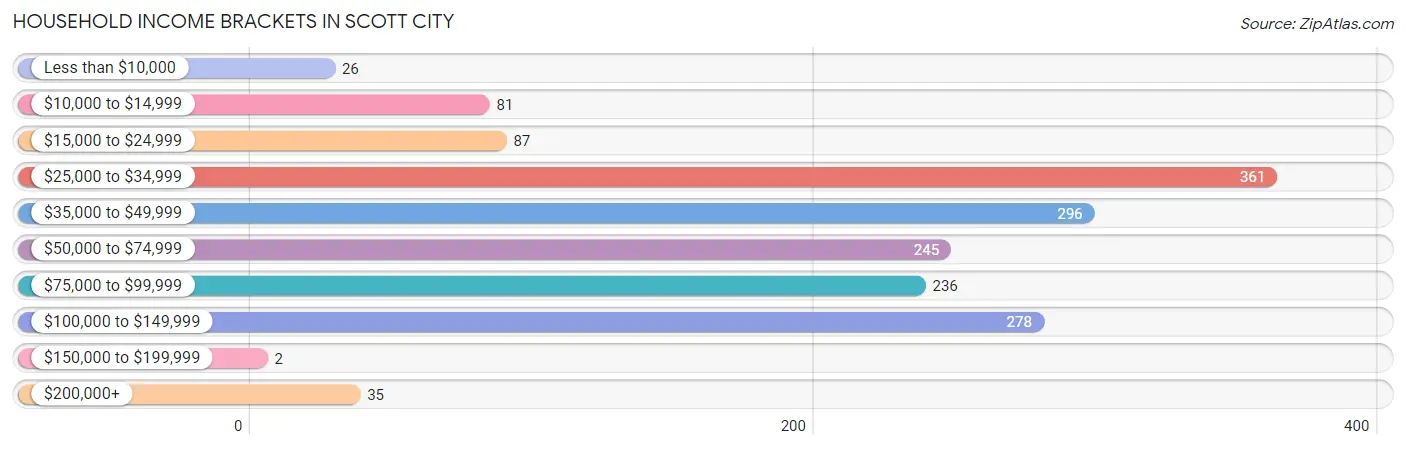
| Income Bracket | # Households | % Households |
| Less than $10,000 | 26 | 1.6% |
| $10,000 to $14,999 | 81 | 4.9% |
| $15,000 to $24,999 | 87 | 5.3% |
| $25,000 to $34,999 | 361 | 21.9% |
| $35,000 to $49,999 | 296 | 18.0% |
| $50,000 to $74,999 | 245 | 14.9% |
| $75,000 to $99,999 | 236 | 14.3% |
| $100,000 to $149,999 | 278 | 16.9% |
| $150,000 to $199,999 | 2 | 0.1% |
| $200,000+ | 35 | 2.1% |
Household Income by Householder Age in Scott City
The median household income in Scott City is $47,217, with the highest median household income of $70,625 found in the 45 to 64 years age bracket for the primary householder. A total of 597 households (36.2%) fall into this category. Meanwhile, the 25 to 44 years age bracket for the primary householder has the lowest median household income of $0, with 590 households (35.8%) in this group.
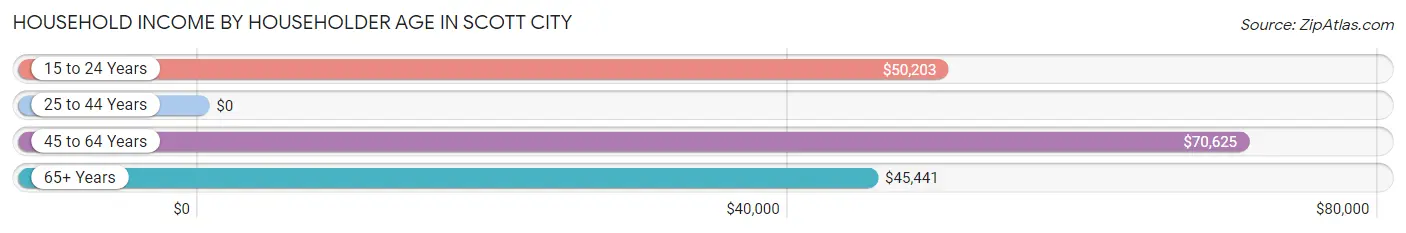
| Income Bracket | # Households | Median Income |
| 15 to 24 Years | 102 (6.2%) | $50,203 |
| 25 to 44 Years | 590 (35.8%) | $0 |
| 45 to 64 Years | 597 (36.2%) | $70,625 |
| 65+ Years | 358 (21.7%) | $45,441 |
| Total | 1,647 (100.0%) | $47,217 |
Poverty in Scott City
Income Below Poverty by Sex and Age in Scott City
With 6.7% poverty level for males and 9.6% for females among the residents of Scott City, 75 year old and over males and 75 year old and over females are the most vulnerable to poverty, with 84 males (54.2%) and 83 females (45.6%) in their respective age groups living below the poverty level.
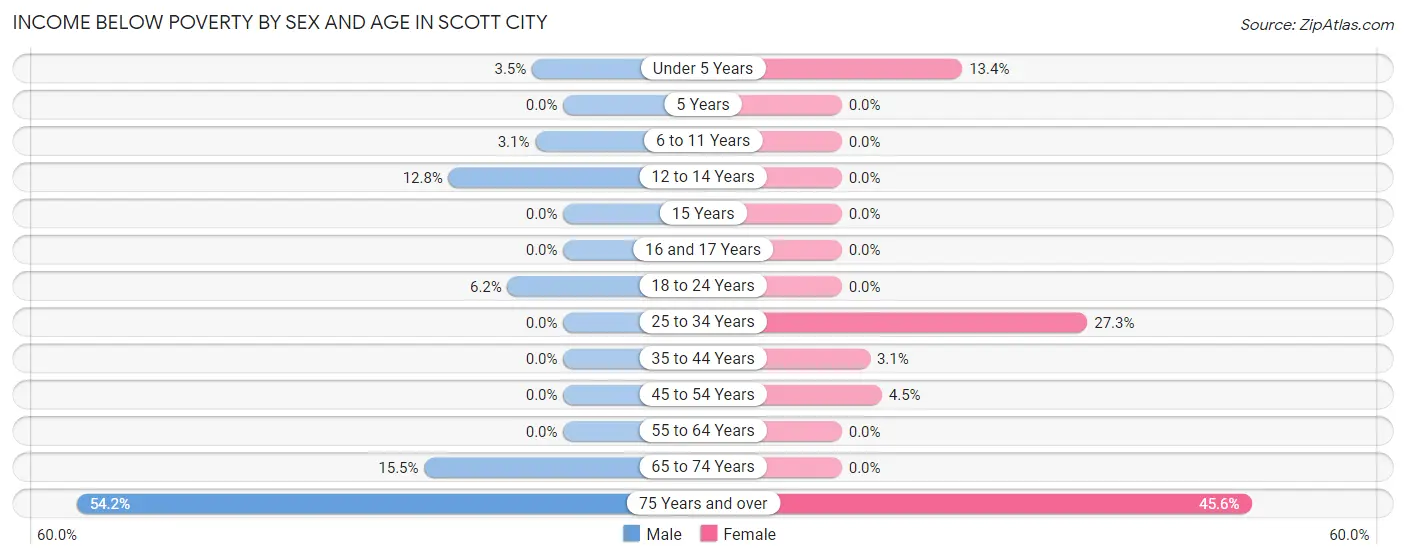
| Age Bracket | Male | Female |
| Under 5 Years | 4 (3.5%) | 11 (13.4%) |
| 5 Years | 0 (0.0%) | 0 (0.0%) |
| 6 to 11 Years | 7 (3.1%) | 0 (0.0%) |
| 12 to 14 Years | 6 (12.8%) | 0 (0.0%) |
| 15 Years | 0 (0.0%) | 0 (0.0%) |
| 16 and 17 Years | 0 (0.0%) | 0 (0.0%) |
| 18 to 24 Years | 9 (6.2%) | 0 (0.0%) |
| 25 to 34 Years | 0 (0.0%) | 76 (27.3%) |
| 35 to 44 Years | 0 (0.0%) | 5 (3.1%) |
| 45 to 54 Years | 0 (0.0%) | 12 (4.5%) |
| 55 to 64 Years | 0 (0.0%) | 0 (0.0%) |
| 65 to 74 Years | 26 (15.5%) | 0 (0.0%) |
| 75 Years and over | 84 (54.2%) | 83 (45.6%) |
| Total | 136 (6.7%) | 187 (9.6%) |
Income Above Poverty by Sex and Age in Scott City
According to the poverty statistics in Scott City, males aged 5 years and females aged 5 years are the age groups that are most secure financially, with 100.0% of males and 100.0% of females in these age groups living above the poverty line.
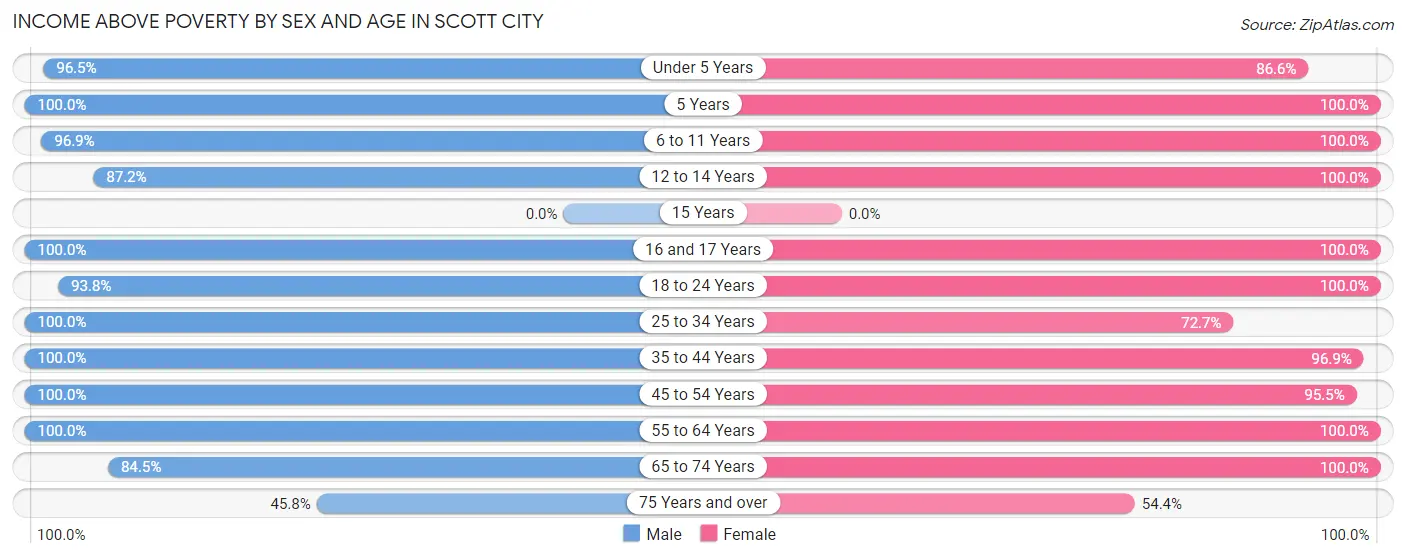
| Age Bracket | Male | Female |
| Under 5 Years | 111 (96.5%) | 71 (86.6%) |
| 5 Years | 18 (100.0%) | 21 (100.0%) |
| 6 to 11 Years | 217 (96.9%) | 249 (100.0%) |
| 12 to 14 Years | 41 (87.2%) | 163 (100.0%) |
| 15 Years | 0 (0.0%) | 0 (0.0%) |
| 16 and 17 Years | 192 (100.0%) | 77 (100.0%) |
| 18 to 24 Years | 136 (93.8%) | 124 (100.0%) |
| 25 to 34 Years | 224 (100.0%) | 202 (72.7%) |
| 35 to 44 Years | 264 (100.0%) | 154 (96.9%) |
| 45 to 54 Years | 254 (100.0%) | 257 (95.5%) |
| 55 to 64 Years | 213 (100.0%) | 154 (100.0%) |
| 65 to 74 Years | 142 (84.5%) | 199 (100.0%) |
| 75 Years and over | 71 (45.8%) | 99 (54.4%) |
| Total | 1,883 (93.3%) | 1,770 (90.4%) |
Income Below Poverty Among Married-Couple Families in Scott City
The poverty statistics for married-couple families in Scott City show that 10.0% or 83 of the total 834 families live below the poverty line. Families with no children have the highest poverty rate of 18.3%, comprising of 83 families. On the other hand, families with 1 or 2 children have the lowest poverty rate of 0.0%, which includes 0 families.
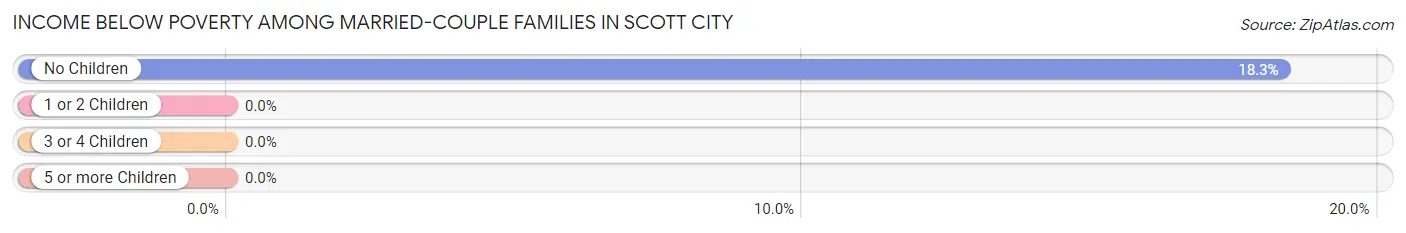
| Children | Above Poverty | Below Poverty |
| No Children | 370 (81.7%) | 83 (18.3%) |
| 1 or 2 Children | 210 (100.0%) | 0 (0.0%) |
| 3 or 4 Children | 171 (100.0%) | 0 (0.0%) |
| 5 or more Children | 0 (0.0%) | 0 (0.0%) |
| Total | 751 (90.0%) | 83 (10.0%) |
Income Below Poverty Among Single-Parent Households in Scott City
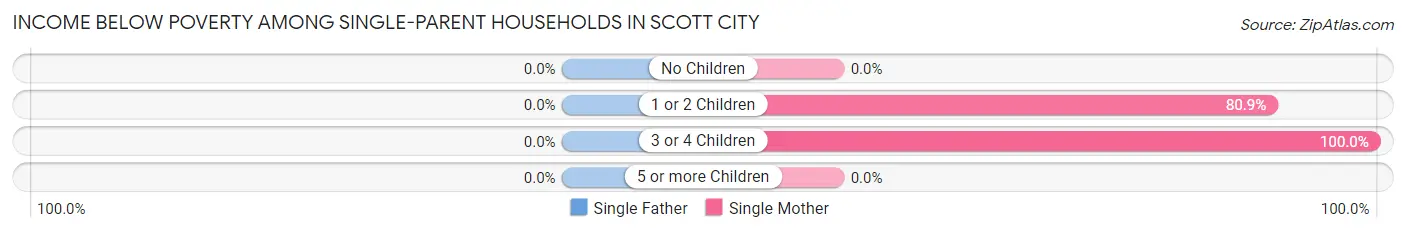
| Children | Single Father | Single Mother |
| No Children | 0 (0.0%) | 0 (0.0%) |
| 1 or 2 Children | 0 (0.0%) | 72 (80.9%) |
| 3 or 4 Children | 0 (0.0%) | 4 (100.0%) |
| 5 or more Children | 0 (0.0%) | 0 (0.0%) |
| Total | 0 (0.0%) | 76 (48.1%) |
Income Below Poverty Among Married-Couple vs Single-Parent Households in Scott City
The poverty data for Scott City shows that 83 of the married-couple family households (10.0%) and 76 of the single-parent households (32.8%) are living below the poverty level. Within the married-couple family households, those with no children have the highest poverty rate, with 83 households (18.3%) falling below the poverty line. Among the single-parent households, those with 3 or 4 children have the highest poverty rate, with 4 household (100.0%) living below poverty.
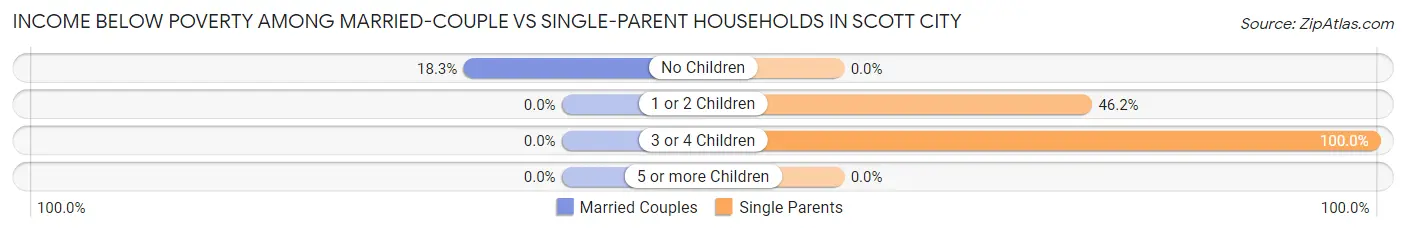
| Children | Married-Couple Families | Single-Parent Households |
| No Children | 83 (18.3%) | 0 (0.0%) |
| 1 or 2 Children | 0 (0.0%) | 72 (46.2%) |
| 3 or 4 Children | 0 (0.0%) | 4 (100.0%) |
| 5 or more Children | 0 (0.0%) | 0 (0.0%) |
| Total | 83 (10.0%) | 76 (32.8%) |
Race in Scott City
The most populous races in Scott City are White / Caucasian (3,387 | 82.2%), Hispanic or Latino (1,017 | 24.7%), and Some other Race (484 | 11.7%).

| Race | # Population | % Population |
| Asian | 27 | 0.7% |
| Black / African American | 0 | 0.0% |
| Hawaiian / Pacific | 3 | 0.1% |
| Hispanic or Latino | 1,017 | 24.7% |
| Native / Alaskan | 0 | 0.0% |
| White / Caucasian | 3,387 | 82.2% |
| Two or more Races | 220 | 5.3% |
| Some other Race | 484 | 11.7% |
| Total | 4,121 | 100.0% |
Ancestry in Scott City
The most populous ancestries reported in Scott City are German (1,031 | 25.0%), Mexican (1,017 | 24.7%), English (599 | 14.5%), Irish (519 | 12.6%), and American (184 | 4.5%), together accounting for 81.3% of all Scott City residents.
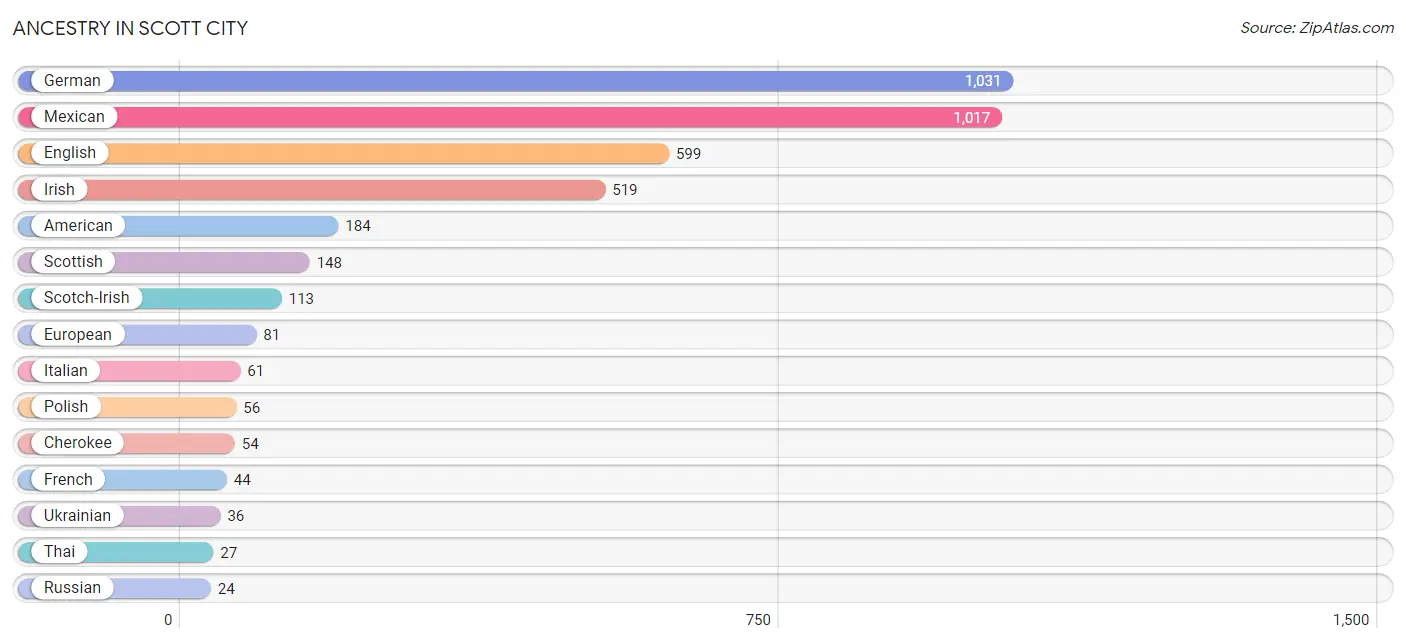
| Ancestry | # Population | % Population |
| American | 184 | 4.5% |
| Cherokee | 54 | 1.3% |
| Dutch | 13 | 0.3% |
| English | 599 | 14.5% |
| European | 81 | 2.0% |
| French | 44 | 1.1% |
| German | 1,031 | 25.0% |
| Irish | 519 | 12.6% |
| Italian | 61 | 1.5% |
| Mexican | 1,017 | 24.7% |
| Native Hawaiian | 3 | 0.1% |
| Polish | 56 | 1.4% |
| Russian | 24 | 0.6% |
| Scandinavian | 4 | 0.1% |
| Scotch-Irish | 113 | 2.7% |
| Scottish | 148 | 3.6% |
| Thai | 27 | 0.7% |
| Ukrainian | 36 | 0.9% |
| Welsh | 7 | 0.2% | View All 19 Rows |
Immigrants in Scott City
The most numerous immigrant groups reported in Scott City came from Central America (293 | 7.1%), Latin America (293 | 7.1%), Mexico (293 | 7.1%), Asia (43 | 1.0%), and South Central Asia (43 | 1.0%), together accounting for 23.4% of all Scott City residents.
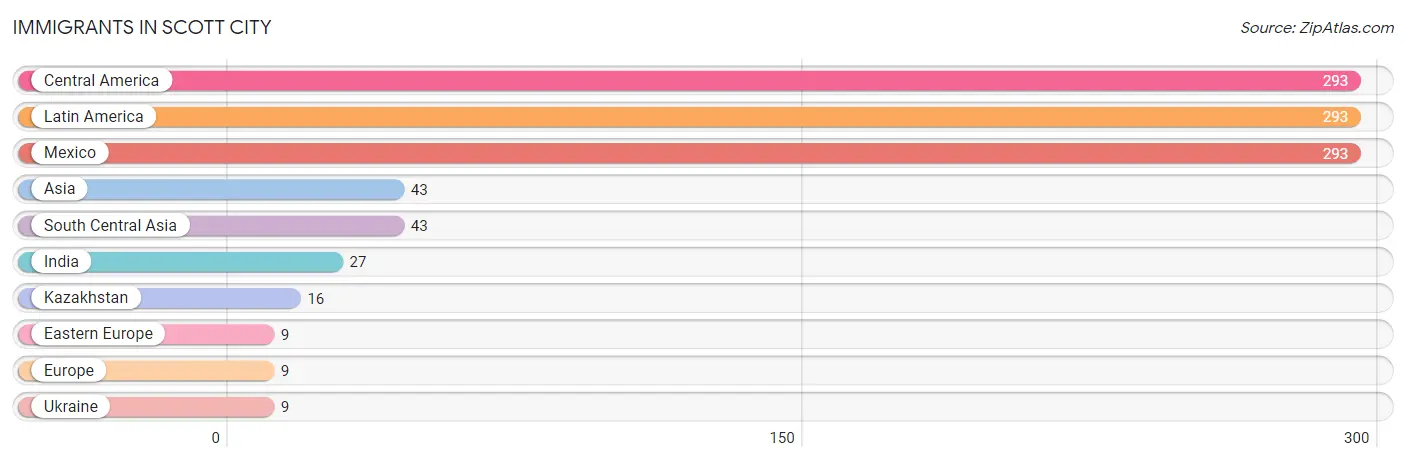
| Immigration Origin | # Population | % Population |
| Asia | 43 | 1.0% |
| Central America | 293 | 7.1% |
| Eastern Europe | 9 | 0.2% |
| Europe | 9 | 0.2% |
| India | 27 | 0.7% |
| Kazakhstan | 16 | 0.4% |
| Latin America | 293 | 7.1% |
| Mexico | 293 | 7.1% |
| South Central Asia | 43 | 1.0% |
| Ukraine | 9 | 0.2% | View All 10 Rows |
Sex and Age in Scott City
Sex and Age in Scott City
The most populous age groups in Scott City are 15 to 19 Years (275 | 13.2%) for men and 10 to 14 Years (300 | 14.7%) for women.
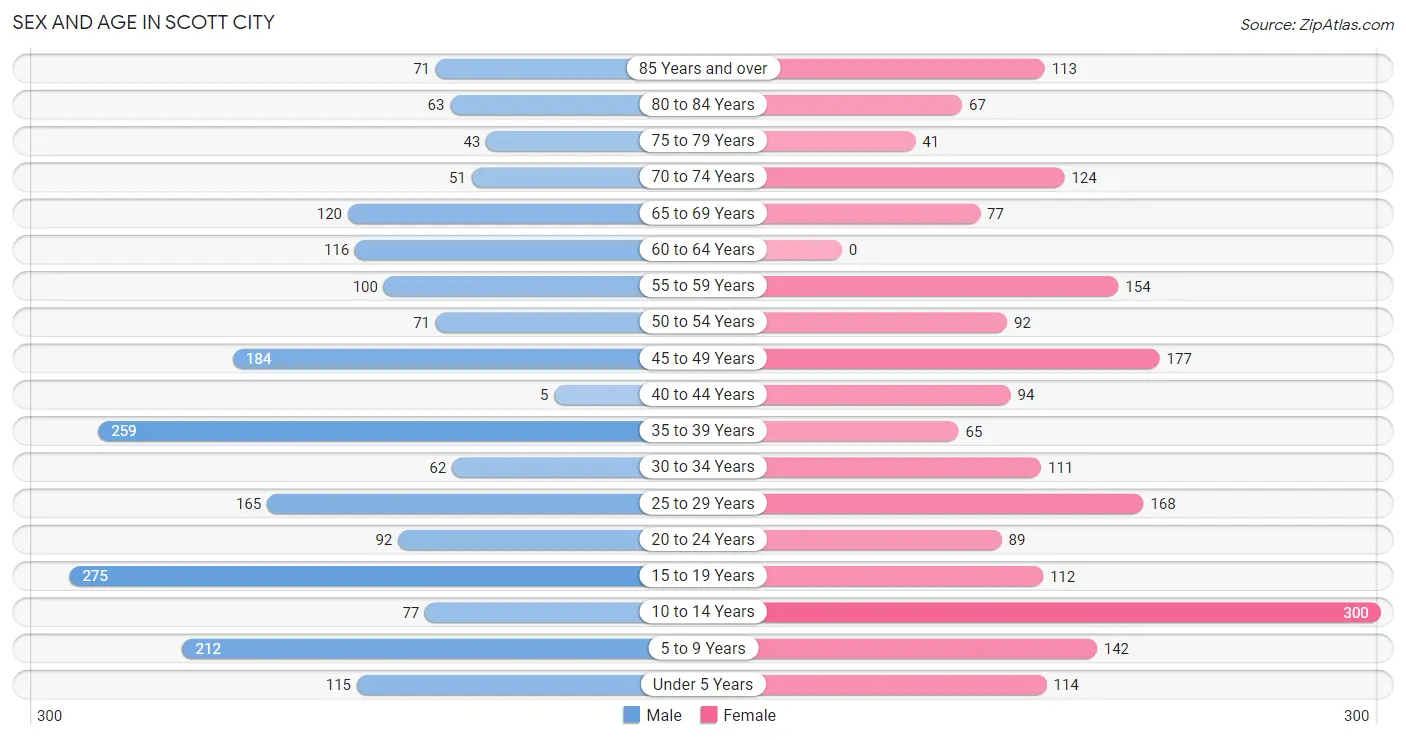
| Age Bracket | Male | Female |
| Under 5 Years | 115 (5.5%) | 114 (5.6%) |
| 5 to 9 Years | 212 (10.2%) | 142 (7.0%) |
| 10 to 14 Years | 77 (3.7%) | 300 (14.7%) |
| 15 to 19 Years | 275 (13.2%) | 112 (5.5%) |
| 20 to 24 Years | 92 (4.4%) | 89 (4.4%) |
| 25 to 29 Years | 165 (7.9%) | 168 (8.2%) |
| 30 to 34 Years | 62 (3.0%) | 111 (5.4%) |
| 35 to 39 Years | 259 (12.4%) | 65 (3.2%) |
| 40 to 44 Years | 5 (0.2%) | 94 (4.6%) |
| 45 to 49 Years | 184 (8.8%) | 177 (8.7%) |
| 50 to 54 Years | 71 (3.4%) | 92 (4.5%) |
| 55 to 59 Years | 100 (4.8%) | 154 (7.5%) |
| 60 to 64 Years | 116 (5.6%) | 0 (0.0%) |
| 65 to 69 Years | 120 (5.8%) | 77 (3.8%) |
| 70 to 74 Years | 51 (2.5%) | 124 (6.1%) |
| 75 to 79 Years | 43 (2.1%) | 41 (2.0%) |
| 80 to 84 Years | 63 (3.0%) | 67 (3.3%) |
| 85 Years and over | 71 (3.4%) | 113 (5.5%) |
| Total | 2,081 (100.0%) | 2,040 (100.0%) |
Families and Households in Scott City
Median Family Size in Scott City
The median family size in Scott City is 3.12 persons per family, with single male/father families (74 | 6.9%) accounting for the largest median family size of 4.7 persons per family. On the other hand, single female/mother families (158 | 14.8%) represent the smallest median family size with 1.38 persons per family.
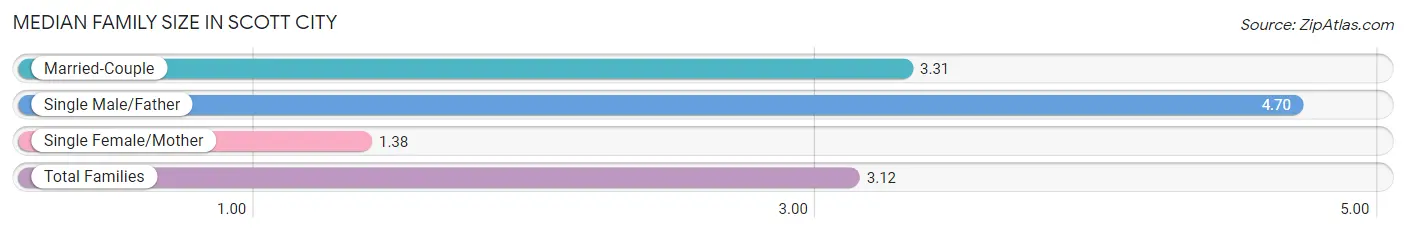
| Family Type | # Families | Family Size |
| Married-Couple | 834 (78.2%) | 3.31 |
| Single Male/Father | 74 (6.9%) | 4.70 |
| Single Female/Mother | 158 (14.8%) | 1.38 |
| Total Families | 1,066 (100.0%) | 3.12 |
Median Household Size in Scott City
The median household size in Scott City is 2.44 persons per household, with single male/father households (74 | 4.5%) accounting for the largest median household size of 5.26 persons per household. non-family households (581 | 35.3%) represent the smallest median household size with 1.03 persons per household.
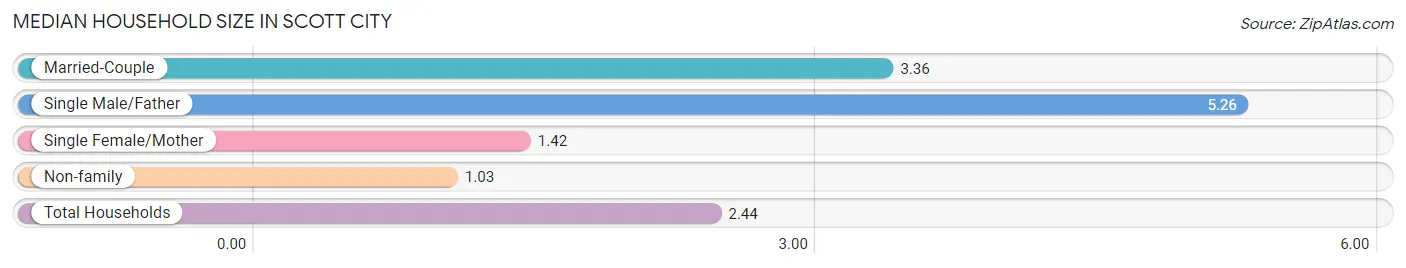
| Household Type | # Households | Household Size |
| Married-Couple | 834 (50.6%) | 3.36 |
| Single Male/Father | 74 (4.5%) | 5.26 |
| Single Female/Mother | 158 (9.6%) | 1.42 |
| Non-family | 581 (35.3%) | 1.03 |
| Total Households | 1,647 (100.0%) | 2.44 |
Household Size by Marriage Status in Scott City
Out of a total of 1,647 households in Scott City, 1,066 (64.7%) are family households, while 581 (35.3%) are nonfamily households. The most numerous type of family households are 2-person households, comprising 549, and the most common type of nonfamily households are 1-person households, comprising 575.
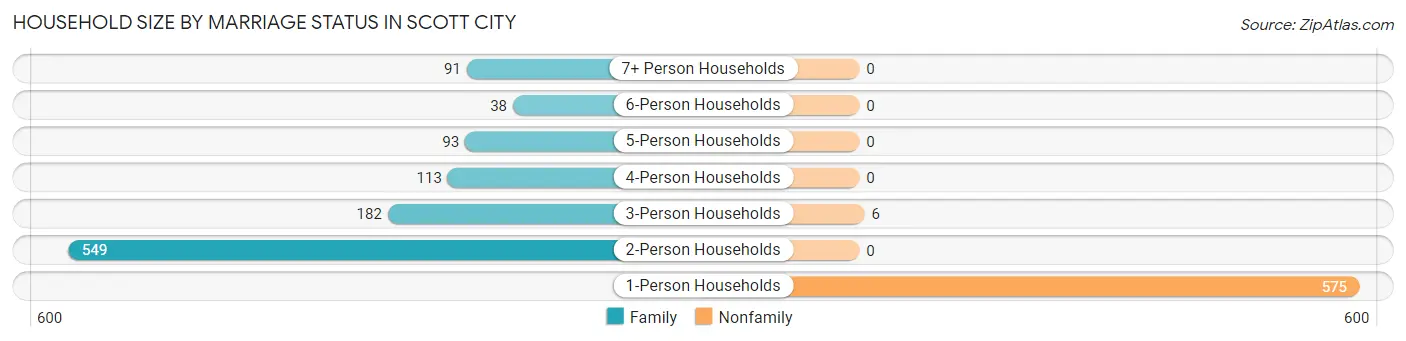
| Household Size | Family Households | Nonfamily Households |
| 1-Person Households | - | 575 (34.9%) |
| 2-Person Households | 549 (33.3%) | 0 (0.0%) |
| 3-Person Households | 182 (11.1%) | 6 (0.4%) |
| 4-Person Households | 113 (6.9%) | 0 (0.0%) |
| 5-Person Households | 93 (5.7%) | 0 (0.0%) |
| 6-Person Households | 38 (2.3%) | 0 (0.0%) |
| 7+ Person Households | 91 (5.5%) | 0 (0.0%) |
| Total | 1,066 (64.7%) | 581 (35.3%) |
Female Fertility in Scott City
Fertility by Age in Scott City
Average fertility rate in Scott City is 124.0 births per 1,000 women. Women in the age bracket of 35 to 50 years have the highest fertility rate with 152.0 births per 1,000 women. Women in the age bracket of 35 to 50 years acount for 53.8% of all women with births.
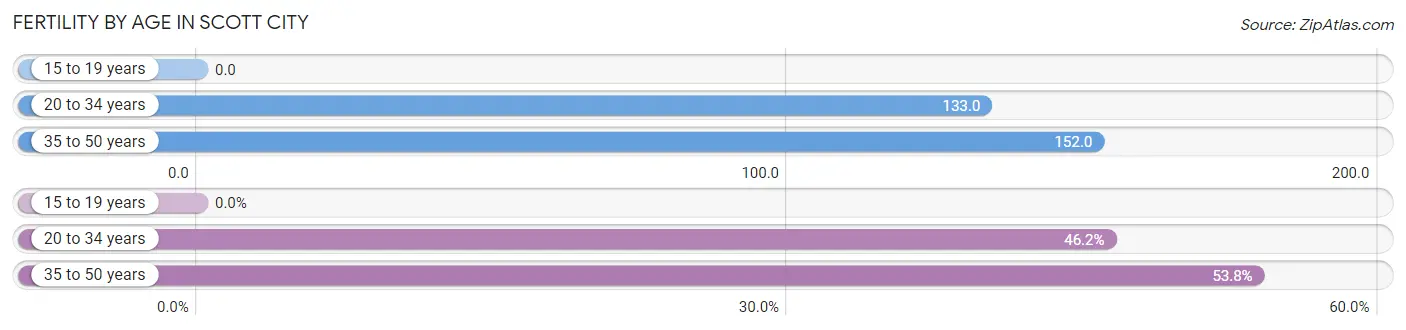
| Age Bracket | Women with Births | Births / 1,000 Women |
| 15 to 19 years | 0 (0.0%) | 0.0 |
| 20 to 34 years | 49 (46.2%) | 133.0 |
| 35 to 50 years | 57 (53.8%) | 152.0 |
| Total | 106 (100.0%) | 124.0 |
Fertility by Age by Marriage Status in Scott City
96.2% of women with births (106) in Scott City are married. The highest percentage of unmarried women with births falls into 20 to 34 years age bracket with 8.2% of them unmarried at the time of birth, while the lowest percentage of unmarried women with births belong to 35 to 50 years age bracket with 0.0% of them unmarried.
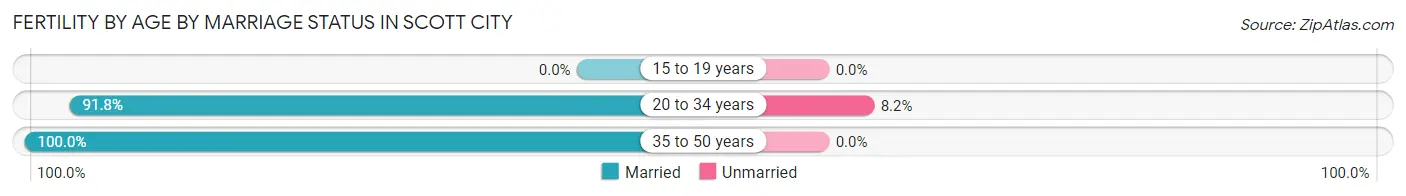
| Age Bracket | Married | Unmarried |
| 15 to 19 years | 0 (0.0%) | 0 (0.0%) |
| 20 to 34 years | 45 (91.8%) | 4 (8.2%) |
| 35 to 50 years | 57 (100.0%) | 0 (0.0%) |
| Total | 102 (96.2%) | 4 (3.8%) |
Fertility by Education in Scott City
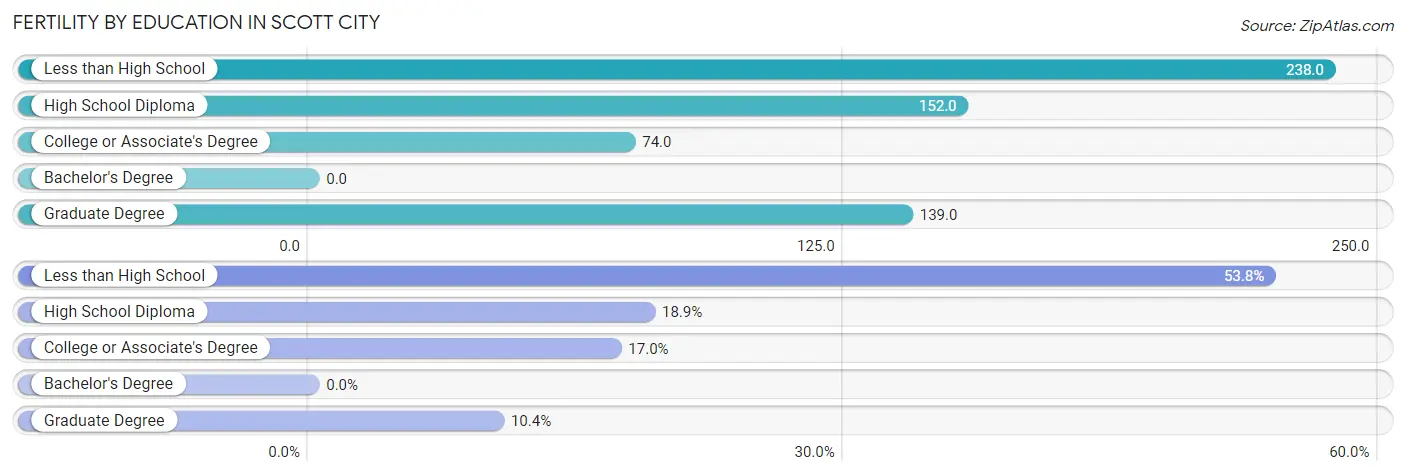
| Educational Attainment | Women with Births | Births / 1,000 Women |
| Less than High School | 57 (53.8%) | 238.0 |
| High School Diploma | 20 (18.9%) | 152.0 |
| College or Associate's Degree | 18 (17.0%) | 74.0 |
| Bachelor's Degree | 0 (0.0%) | 0.0 |
| Graduate Degree | 11 (10.4%) | 139.0 |
| Total | 106 (100.0%) | 124.0 |
Fertility by Education by Marriage Status in Scott City
3.8% of women with births in Scott City are unmarried. Women with the educational attainment of less than high school are most likely to be married with 100.0% of them married at childbirth, while women with the educational attainment of high school diploma are least likely to be married with 20.0% of them unmarried at childbirth.
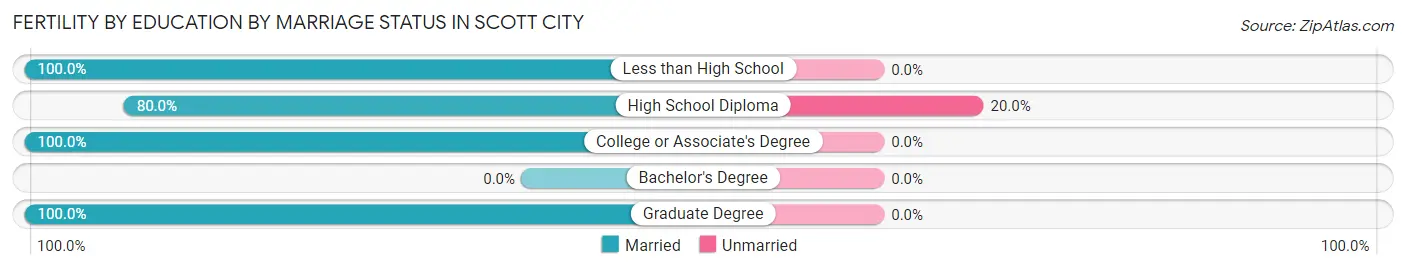
| Educational Attainment | Married | Unmarried |
| Less than High School | 57 (100.0%) | 0 (0.0%) |
| High School Diploma | 16 (80.0%) | 4 (20.0%) |
| College or Associate's Degree | 18 (100.0%) | 0 (0.0%) |
| Bachelor's Degree | 0 (0.0%) | 0 (0.0%) |
| Graduate Degree | 11 (100.0%) | 0 (0.0%) |
| Total | 102 (96.2%) | 4 (3.8%) |
Employment Characteristics in Scott City
Employment by Class of Employer in Scott City
Among the 2,043 employed individuals in Scott City, private company employees (1,438 | 70.4%), local government employees (217 | 10.6%), and self-employed (not incorporated) (196 | 9.6%) make up the most common classes of employment.
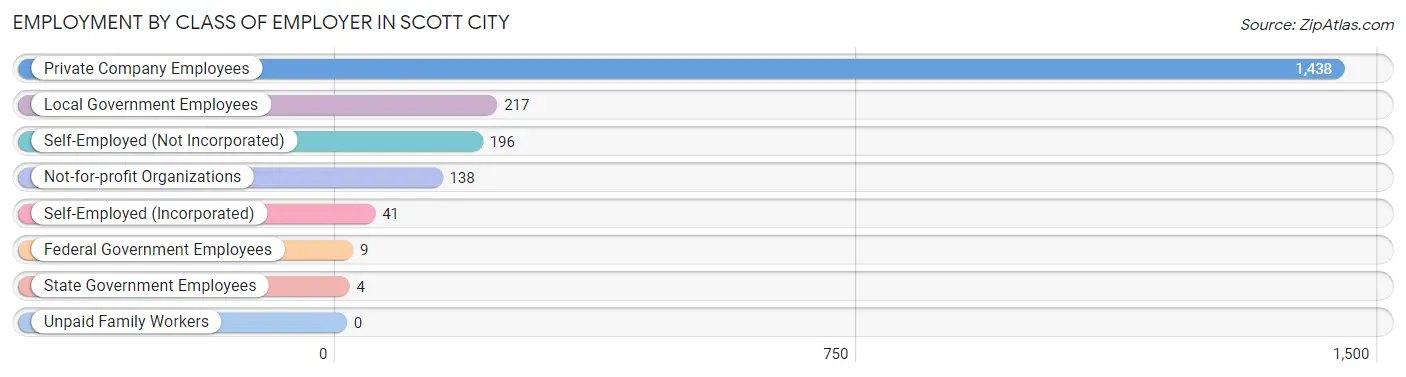
| Employer Class | # Employees | % Employees |
| Private Company Employees | 1,438 | 70.4% |
| Self-Employed (Incorporated) | 41 | 2.0% |
| Self-Employed (Not Incorporated) | 196 | 9.6% |
| Not-for-profit Organizations | 138 | 6.8% |
| Local Government Employees | 217 | 10.6% |
| State Government Employees | 4 | 0.2% |
| Federal Government Employees | 9 | 0.4% |
| Unpaid Family Workers | 0 | 0.0% |
| Total | 2,043 | 100.0% |
Employment Status by Age in Scott City
According to the labor force statistics for Scott City, out of the total population over 16 years of age (3,161), 67.9% or 2,146 individuals are in the labor force, with 3.0% or 64 of them unemployed. The age group with the highest labor force participation rate is 30 to 34 years, with 99.4% or 172 individuals in the labor force. Within the labor force, the 16 to 19 years age range has the highest percentage of unemployed individuals, with 21.0% or 58 of them being unemployed.
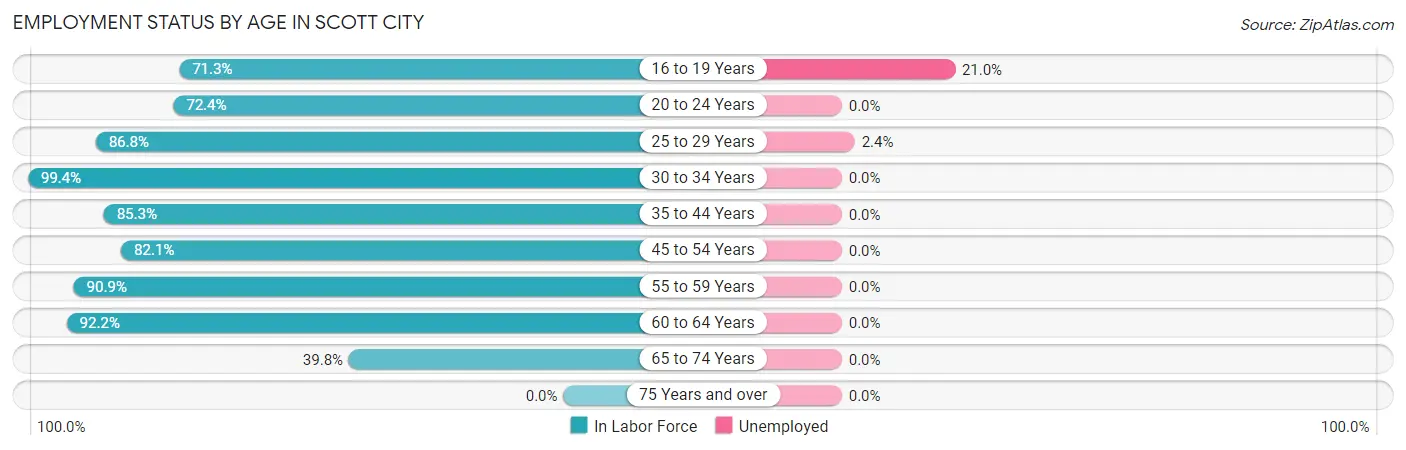
| Age Bracket | In Labor Force | Unemployed |
| 16 to 19 Years | 276 (71.3%) | 58 (21.0%) |
| 20 to 24 Years | 131 (72.4%) | 0 (0.0%) |
| 25 to 29 Years | 289 (86.8%) | 7 (2.4%) |
| 30 to 34 Years | 172 (99.4%) | 0 (0.0%) |
| 35 to 44 Years | 361 (85.3%) | 0 (0.0%) |
| 45 to 54 Years | 430 (82.1%) | 0 (0.0%) |
| 55 to 59 Years | 231 (90.9%) | 0 (0.0%) |
| 60 to 64 Years | 107 (92.2%) | 0 (0.0%) |
| 65 to 74 Years | 148 (39.8%) | 0 (0.0%) |
| 75 Years and over | 0 (0.0%) | 0 (0.0%) |
| Total | 2,146 (67.9%) | 64 (3.0%) |
Employment Status by Educational Attainment in Scott City
According to labor force statistics for Scott City, 87.2% of individuals (1,590) out of the total population between 25 and 64 years of age (1,823) are in the labor force, with 0.4% or 6 of them being unemployed. The group with the highest labor force participation rate are those with the educational attainment of high school diploma, with 99.1% or 580 individuals in the labor force. Within the labor force, individuals with high school diploma education have the highest percentage of unemployment, with 1.2% or 7 of them being unemployed.
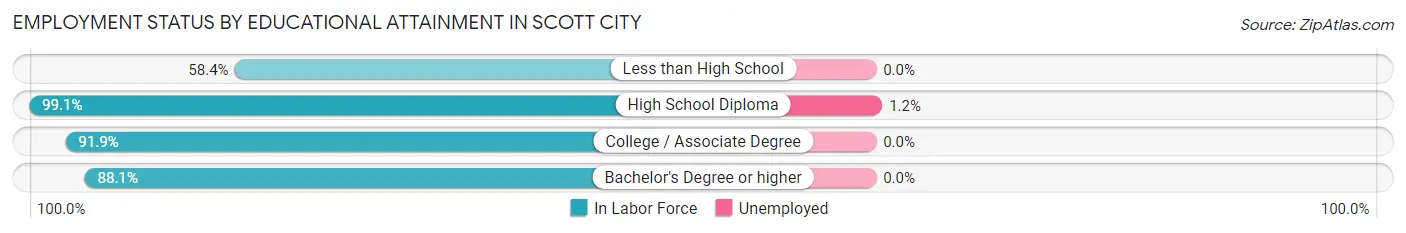
| Educational Attainment | In Labor Force | Unemployed |
| Less than High School | 199 (58.4%) | 0 (0.0%) |
| High School Diploma | 580 (99.1%) | 7 (1.2%) |
| College / Associate Degree | 499 (91.9%) | 0 (0.0%) |
| Bachelor's Degree or higher | 312 (88.1%) | 0 (0.0%) |
| Total | 1,590 (87.2%) | 7 (0.4%) |
Employment Occupations by Sex in Scott City
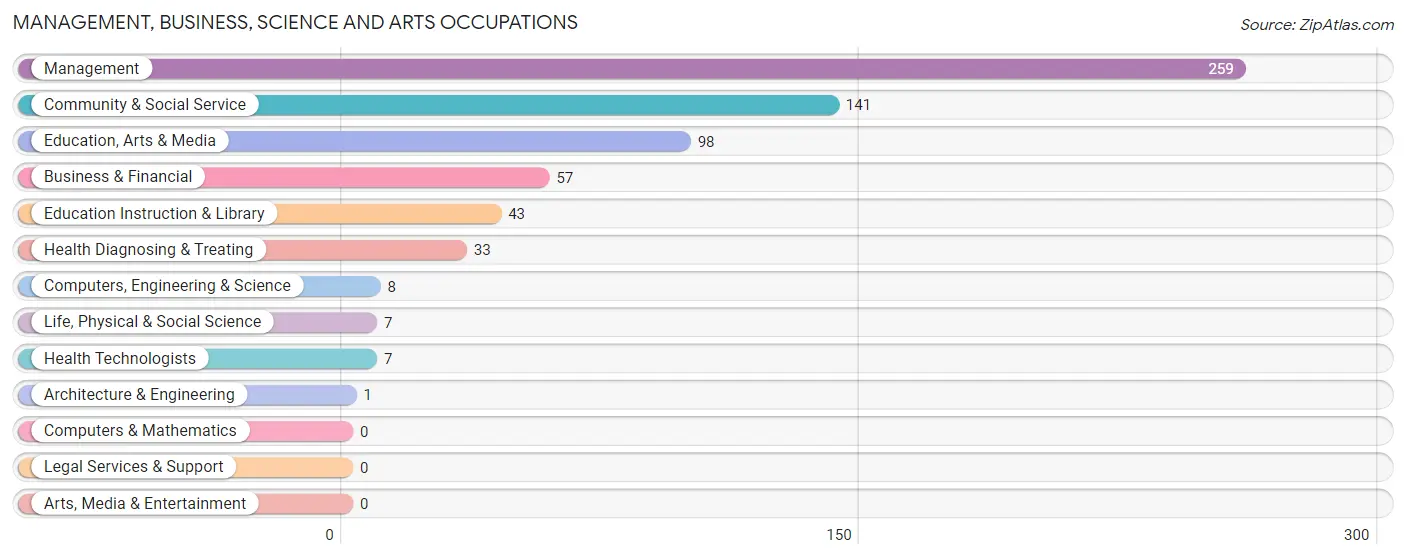
Management, Business, Science and Arts Occupations
The most common Management, Business, Science and Arts occupations in Scott City are Management (259 | 12.4%), Community & Social Service (141 | 6.8%), Education, Arts & Media (98 | 4.7%), Business & Financial (57 | 2.7%), and Education Instruction & Library (43 | 2.1%).
Management, Business, Science and Arts Occupations by Sex
Within the Management, Business, Science and Arts occupations in Scott City, the most male-oriented occupations are Life, Physical & Social Science (100.0%), Computers, Engineering & Science (87.5%), and Education Instruction & Library (79.1%), while the most female-oriented occupations are Architecture & Engineering (100.0%), Health Technologists (100.0%), and Education, Arts & Media (73.5%).
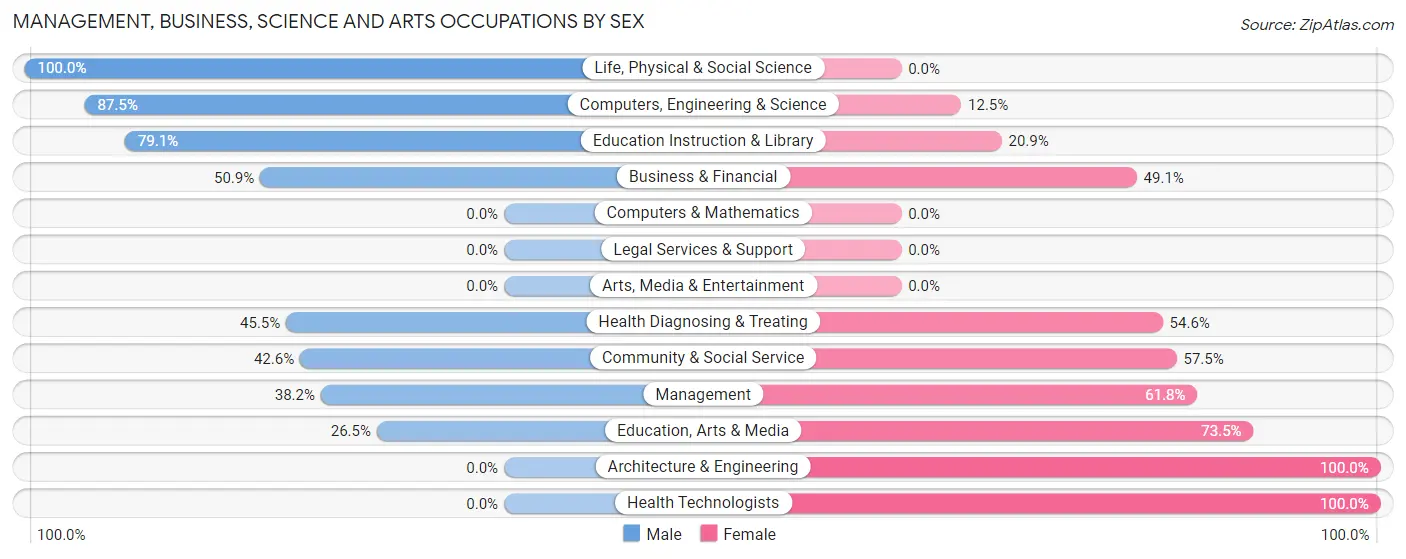
| Occupation | Male | Female |
| Management | 99 (38.2%) | 160 (61.8%) |
| Business & Financial | 29 (50.9%) | 28 (49.1%) |
| Computers, Engineering & Science | 7 (87.5%) | 1 (12.5%) |
| Computers & Mathematics | 0 (0.0%) | 0 (0.0%) |
| Architecture & Engineering | 0 (0.0%) | 1 (100.0%) |
| Life, Physical & Social Science | 7 (100.0%) | 0 (0.0%) |
| Community & Social Service | 60 (42.5%) | 81 (57.5%) |
| Education, Arts & Media | 26 (26.5%) | 72 (73.5%) |
| Legal Services & Support | 0 (0.0%) | 0 (0.0%) |
| Education Instruction & Library | 34 (79.1%) | 9 (20.9%) |
| Arts, Media & Entertainment | 0 (0.0%) | 0 (0.0%) |
| Health Diagnosing & Treating | 15 (45.5%) | 18 (54.5%) |
| Health Technologists | 0 (0.0%) | 7 (100.0%) |
| Total (Category) | 210 (42.2%) | 288 (57.8%) |
| Total (Overall) | 1,245 (59.9%) | 835 (40.1%) |
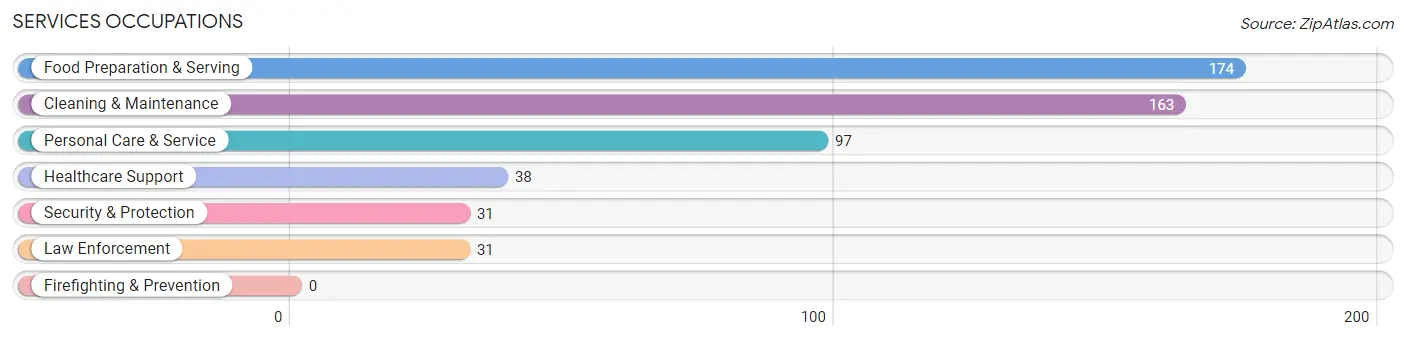
Services Occupations
The most common Services occupations in Scott City are Food Preparation & Serving (174 | 8.4%), Cleaning & Maintenance (163 | 7.8%), Personal Care & Service (97 | 4.7%), Healthcare Support (38 | 1.8%), and Security & Protection (31 | 1.5%).
Services Occupations by Sex
Within the Services occupations in Scott City, the most male-oriented occupations are Healthcare Support (89.5%), Cleaning & Maintenance (66.9%), and Food Preparation & Serving (66.7%), while the most female-oriented occupations are Personal Care & Service (100.0%), Security & Protection (74.2%), and Law Enforcement (74.2%).
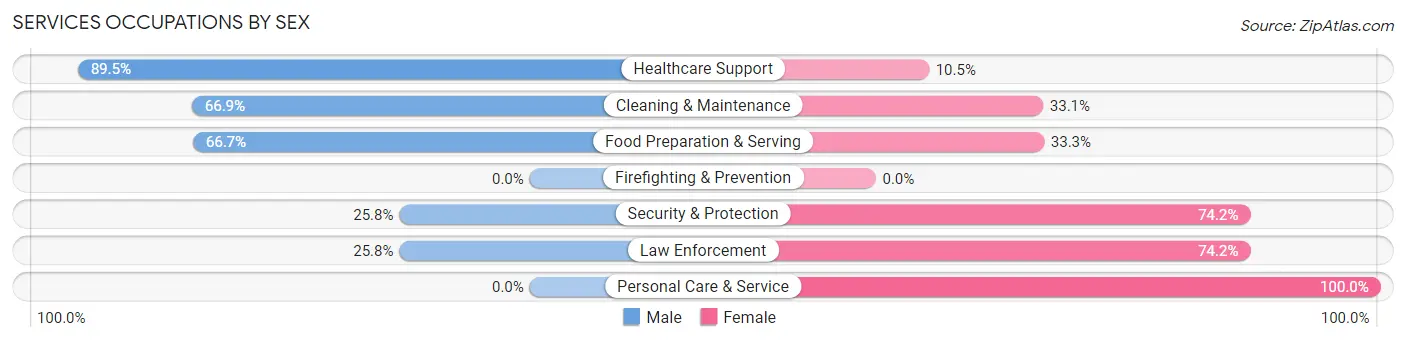
| Occupation | Male | Female |
| Healthcare Support | 34 (89.5%) | 4 (10.5%) |
| Security & Protection | 8 (25.8%) | 23 (74.2%) |
| Firefighting & Prevention | 0 (0.0%) | 0 (0.0%) |
| Law Enforcement | 8 (25.8%) | 23 (74.2%) |
| Food Preparation & Serving | 116 (66.7%) | 58 (33.3%) |
| Cleaning & Maintenance | 109 (66.9%) | 54 (33.1%) |
| Personal Care & Service | 0 (0.0%) | 97 (100.0%) |
| Total (Category) | 267 (53.1%) | 236 (46.9%) |
| Total (Overall) | 1,245 (59.9%) | 835 (40.1%) |
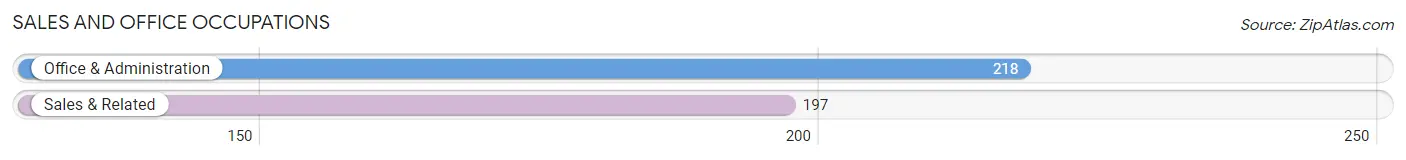
Sales and Office Occupations
The most common Sales and Office occupations in Scott City are Office & Administration (218 | 10.5%), and Sales & Related (197 | 9.5%).
Sales and Office Occupations by Sex

| Occupation | Male | Female |
| Sales & Related | 104 (52.8%) | 93 (47.2%) |
| Office & Administration | 0 (0.0%) | 218 (100.0%) |
| Total (Category) | 104 (25.1%) | 311 (74.9%) |
| Total (Overall) | 1,245 (59.9%) | 835 (40.1%) |
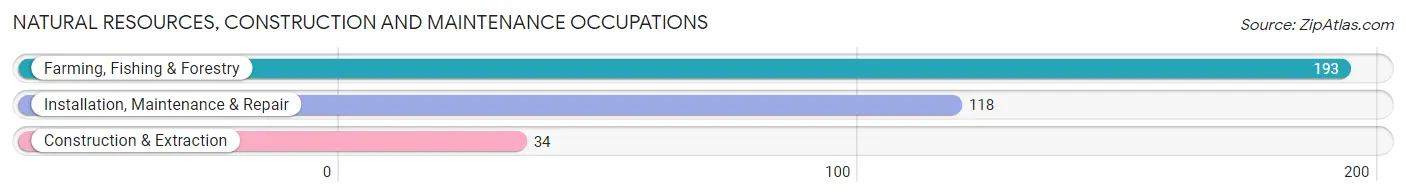
Natural Resources, Construction and Maintenance Occupations
The most common Natural Resources, Construction and Maintenance occupations in Scott City are Farming, Fishing & Forestry (193 | 9.3%), Installation, Maintenance & Repair (118 | 5.7%), and Construction & Extraction (34 | 1.6%).
Natural Resources, Construction and Maintenance Occupations by Sex
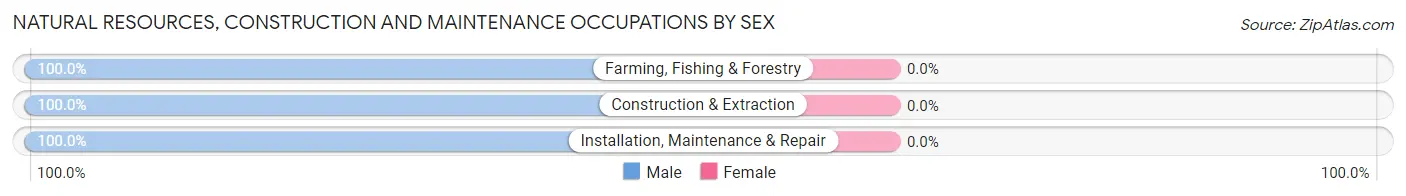
| Occupation | Male | Female |
| Farming, Fishing & Forestry | 193 (100.0%) | 0 (0.0%) |
| Construction & Extraction | 34 (100.0%) | 0 (0.0%) |
| Installation, Maintenance & Repair | 118 (100.0%) | 0 (0.0%) |
| Total (Category) | 345 (100.0%) | 0 (0.0%) |
| Total (Overall) | 1,245 (59.9%) | 835 (40.1%) |
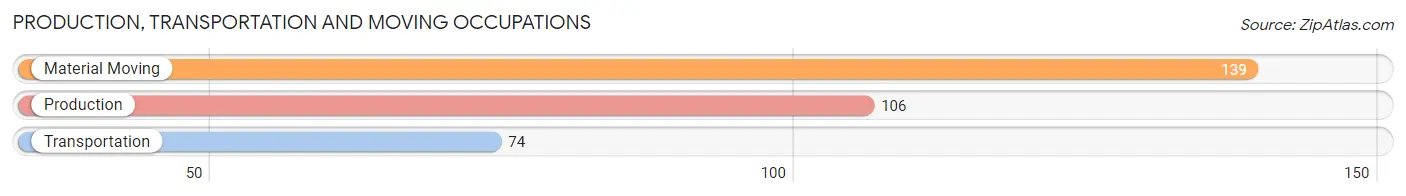
Production, Transportation and Moving Occupations
The most common Production, Transportation and Moving occupations in Scott City are Material Moving (139 | 6.7%), Production (106 | 5.1%), and Transportation (74 | 3.6%).
Production, Transportation and Moving Occupations by Sex
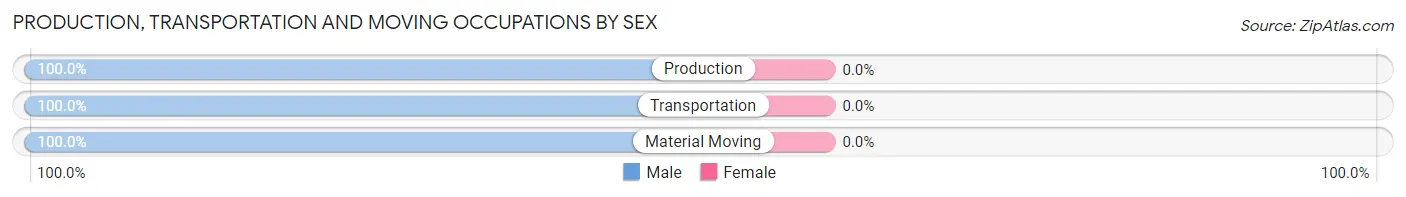
| Occupation | Male | Female |
| Production | 106 (100.0%) | 0 (0.0%) |
| Transportation | 74 (100.0%) | 0 (0.0%) |
| Material Moving | 139 (100.0%) | 0 (0.0%) |
| Total (Category) | 319 (100.0%) | 0 (0.0%) |
| Total (Overall) | 1,245 (59.9%) | 835 (40.1%) |
Employment Industries by Sex in Scott City
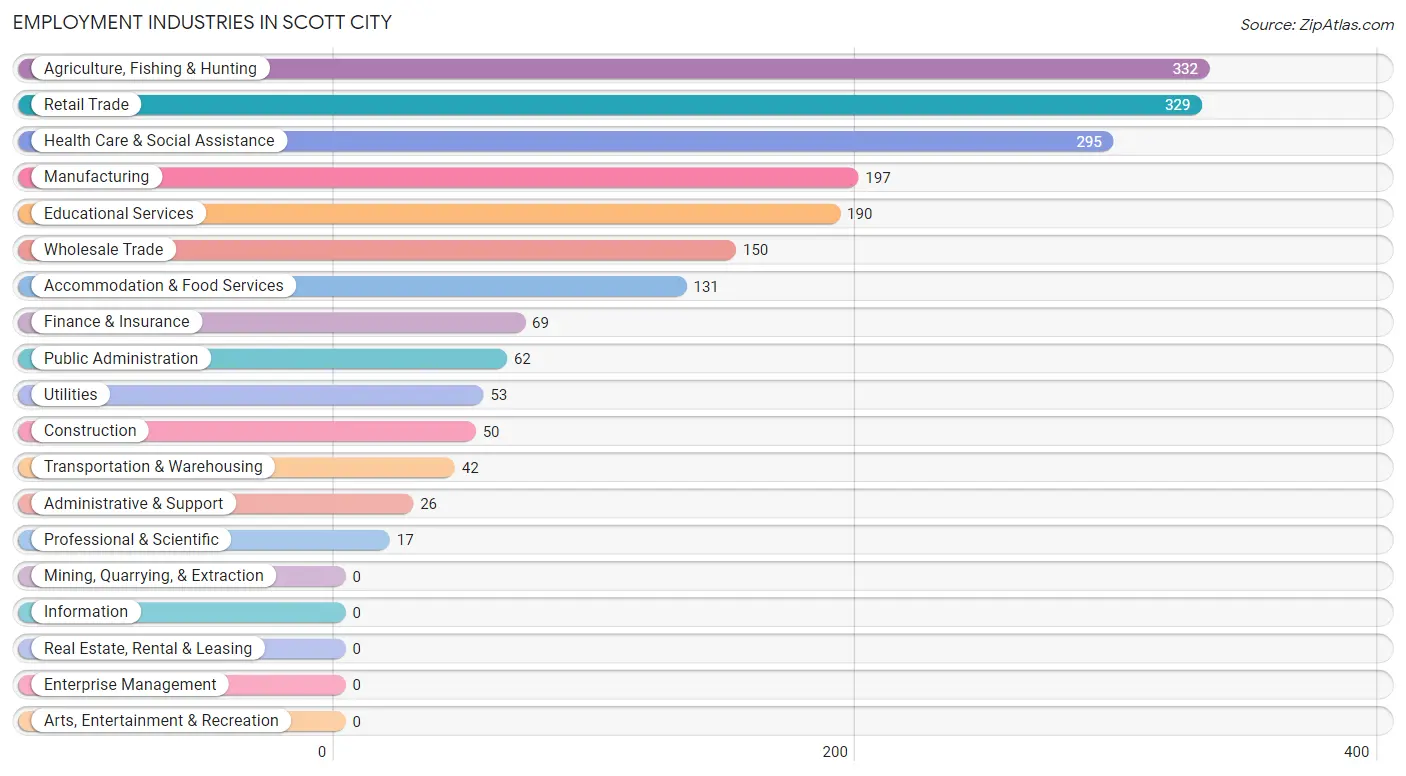
Employment Industries in Scott City
The major employment industries in Scott City include Agriculture, Fishing & Hunting (332 | 16.0%), Retail Trade (329 | 15.8%), Health Care & Social Assistance (295 | 14.2%), Manufacturing (197 | 9.5%), and Educational Services (190 | 9.1%).
Employment Industries by Sex in Scott City
The Scott City industries that see more men than women are Agriculture, Fishing & Hunting (100.0%), Construction (100.0%), and Manufacturing (100.0%), whereas the industries that tend to have a higher number of women are Professional & Scientific (100.0%), Health Care & Social Assistance (94.9%), and Public Administration (87.1%).
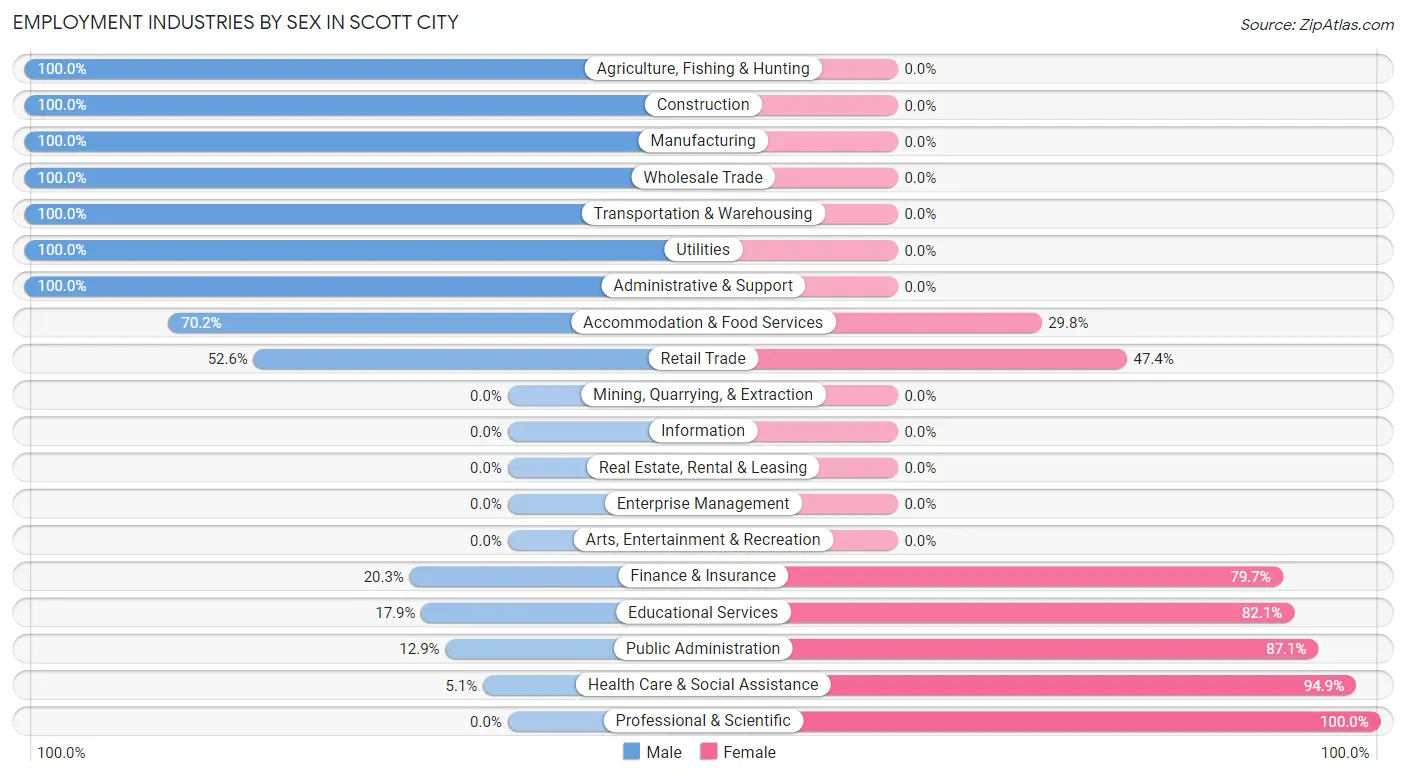
| Industry | Male | Female |
| Agriculture, Fishing & Hunting | 332 (100.0%) | 0 (0.0%) |
| Mining, Quarrying, & Extraction | 0 (0.0%) | 0 (0.0%) |
| Construction | 50 (100.0%) | 0 (0.0%) |
| Manufacturing | 197 (100.0%) | 0 (0.0%) |
| Wholesale Trade | 150 (100.0%) | 0 (0.0%) |
| Retail Trade | 173 (52.6%) | 156 (47.4%) |
| Transportation & Warehousing | 42 (100.0%) | 0 (0.0%) |
| Utilities | 53 (100.0%) | 0 (0.0%) |
| Information | 0 (0.0%) | 0 (0.0%) |
| Finance & Insurance | 14 (20.3%) | 55 (79.7%) |
| Real Estate, Rental & Leasing | 0 (0.0%) | 0 (0.0%) |
| Professional & Scientific | 0 (0.0%) | 17 (100.0%) |
| Enterprise Management | 0 (0.0%) | 0 (0.0%) |
| Administrative & Support | 26 (100.0%) | 0 (0.0%) |
| Educational Services | 34 (17.9%) | 156 (82.1%) |
| Health Care & Social Assistance | 15 (5.1%) | 280 (94.9%) |
| Arts, Entertainment & Recreation | 0 (0.0%) | 0 (0.0%) |
| Accommodation & Food Services | 92 (70.2%) | 39 (29.8%) |
| Public Administration | 8 (12.9%) | 54 (87.1%) |
| Total | 1,245 (59.9%) | 835 (40.1%) |
Education in Scott City
School Enrollment in Scott City
The most common levels of schooling among the 1,185 students in Scott City are high school (438 | 37.0%), elementary school (345 | 29.1%), and middle school (270 | 22.8%).
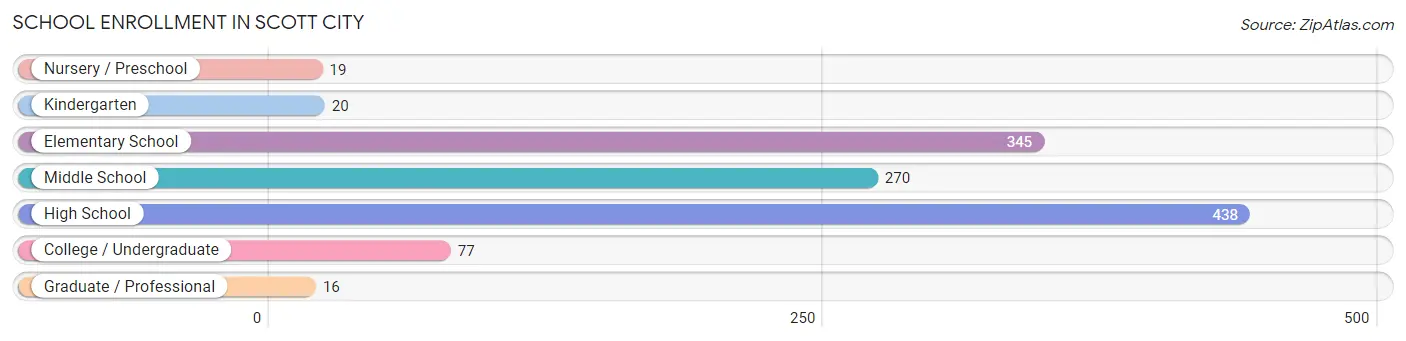
| School Level | # Students | % Students |
| Nursery / Preschool | 19 | 1.6% |
| Kindergarten | 20 | 1.7% |
| Elementary School | 345 | 29.1% |
| Middle School | 270 | 22.8% |
| High School | 438 | 37.0% |
| College / Undergraduate | 77 | 6.5% |
| Graduate / Professional | 16 | 1.3% |
| Total | 1,185 | 100.0% |
School Enrollment by Age by Funding Source in Scott City
Out of a total of 1,185 students who are enrolled in schools in Scott City, 19 (1.6%) attend a private institution, while the remaining 1,166 (98.4%) are enrolled in public schools. The age group of 5 to 9 year old has the highest likelihood of being enrolled in private schools, with 19 (5.4% in the age bracket) enrolled. Conversely, the age group of 10 to 14 year olds has the lowest likelihood of being enrolled in a private school, with 344 (100.0% in the age bracket) attending a public institution.
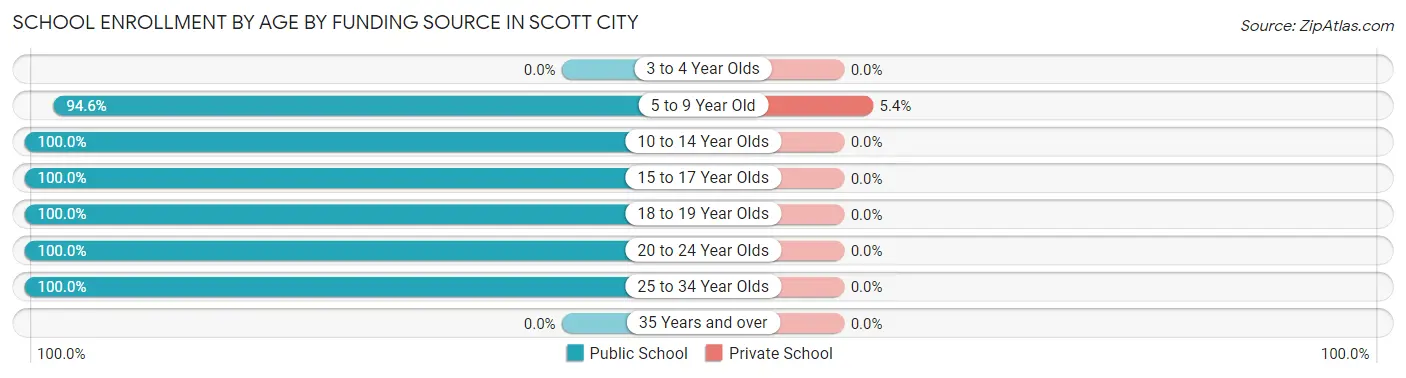
| Age Bracket | Public School | Private School |
| 3 to 4 Year Olds | 0 (0.0%) | 0 (0.0%) |
| 5 to 9 Year Old | 335 (94.6%) | 19 (5.4%) |
| 10 to 14 Year Olds | 344 (100.0%) | 0 (0.0%) |
| 15 to 17 Year Olds | 269 (100.0%) | 0 (0.0%) |
| 18 to 19 Year Olds | 95 (100.0%) | 0 (0.0%) |
| 20 to 24 Year Olds | 5 (100.0%) | 0 (0.0%) |
| 25 to 34 Year Olds | 118 (100.0%) | 0 (0.0%) |
| 35 Years and over | 0 (0.0%) | 0 (0.0%) |
| Total | 1,166 (98.4%) | 19 (1.6%) |
Educational Attainment by Field of Study in Scott City
Education (144 | 21.2%), bio, nature & agricultural (102 | 15.0%), social sciences (93 | 13.7%), business (77 | 11.3%), and arts & humanities (63 | 9.3%) are the most common fields of study among 680 individuals in Scott City who have obtained a bachelor's degree or higher.
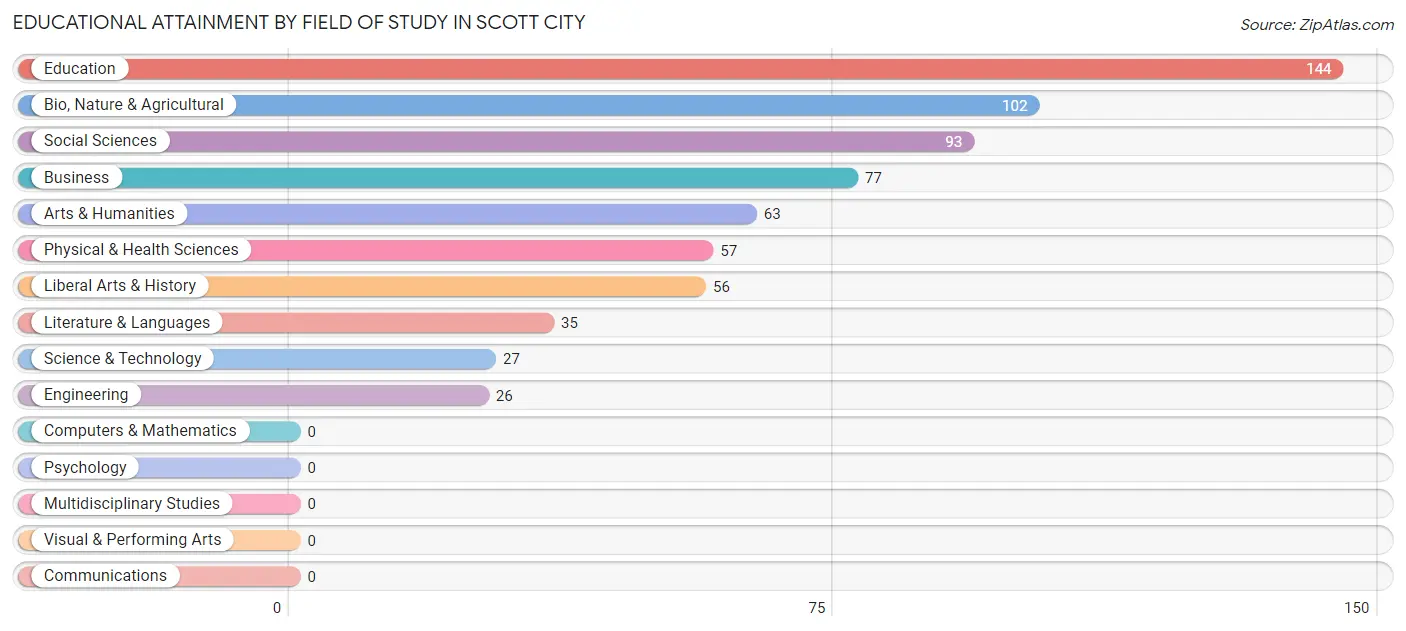
| Field of Study | # Graduates | % Graduates |
| Computers & Mathematics | 0 | 0.0% |
| Bio, Nature & Agricultural | 102 | 15.0% |
| Physical & Health Sciences | 57 | 8.4% |
| Psychology | 0 | 0.0% |
| Social Sciences | 93 | 13.7% |
| Engineering | 26 | 3.8% |
| Multidisciplinary Studies | 0 | 0.0% |
| Science & Technology | 27 | 4.0% |
| Business | 77 | 11.3% |
| Education | 144 | 21.2% |
| Literature & Languages | 35 | 5.1% |
| Liberal Arts & History | 56 | 8.2% |
| Visual & Performing Arts | 0 | 0.0% |
| Communications | 0 | 0.0% |
| Arts & Humanities | 63 | 9.3% |
| Total | 680 | 100.0% |
Transportation & Commute in Scott City
Vehicle Availability by Sex in Scott City
The most prevalent vehicle ownership categories in Scott City are males with 2 vehicles (504, accounting for 40.5%) and females with 2 vehicles (173, making up 63.2%).
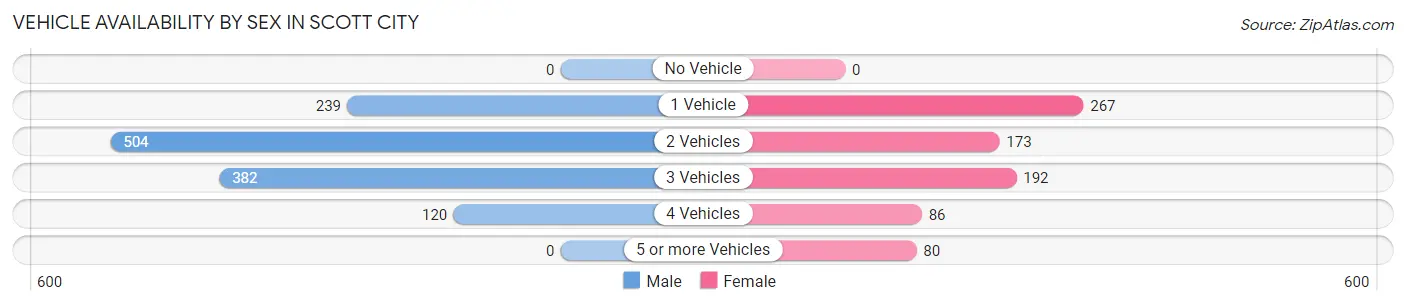
| Vehicles Available | Male | Female |
| No Vehicle | 0 (0.0%) | 0 (0.0%) |
| 1 Vehicle | 239 (19.2%) | 267 (33.5%) |
| 2 Vehicles | 504 (40.5%) | 173 (21.7%) |
| 3 Vehicles | 382 (30.7%) | 192 (24.1%) |
| 4 Vehicles | 120 (9.6%) | 86 (10.8%) |
| 5 or more Vehicles | 0 (0.0%) | 80 (10.0%) |
| Total | 1,245 (100.0%) | 798 (100.0%) |
Commute Time in Scott City
The most frequently occuring commute durations in Scott City are less than 5 minutes (561 commuters, 29.0%), 5 to 9 minutes (555 commuters, 28.7%), and 15 to 19 minutes (279 commuters, 14.4%).
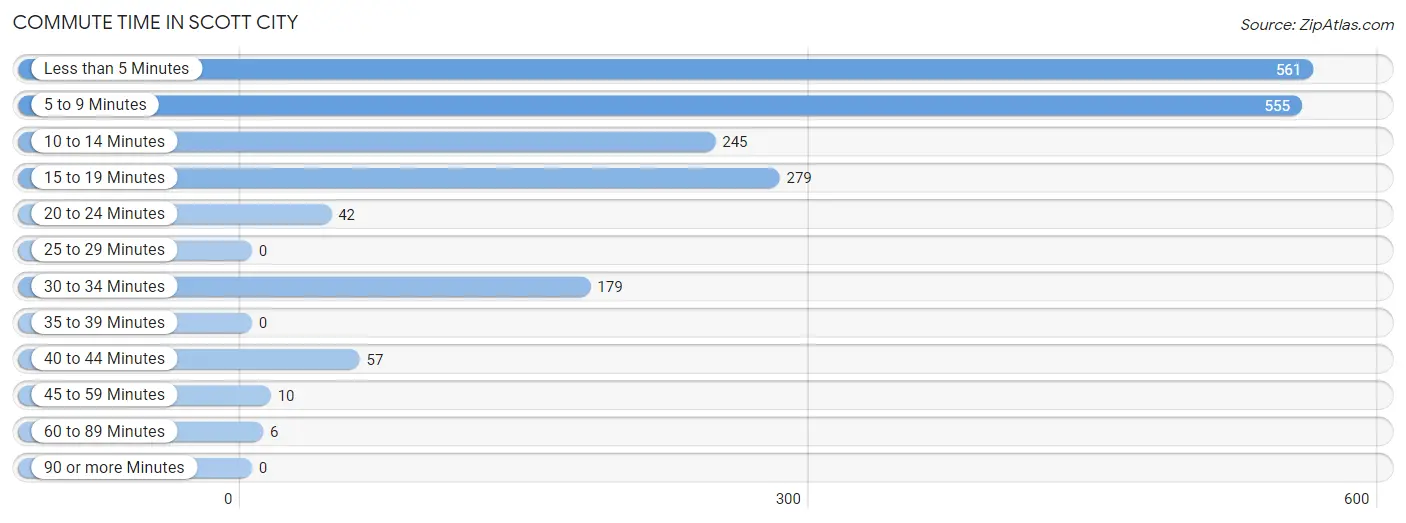
| Commute Time | # Commuters | % Commuters |
| Less than 5 Minutes | 561 | 29.0% |
| 5 to 9 Minutes | 555 | 28.7% |
| 10 to 14 Minutes | 245 | 12.7% |
| 15 to 19 Minutes | 279 | 14.4% |
| 20 to 24 Minutes | 42 | 2.2% |
| 25 to 29 Minutes | 0 | 0.0% |
| 30 to 34 Minutes | 179 | 9.3% |
| 35 to 39 Minutes | 0 | 0.0% |
| 40 to 44 Minutes | 57 | 2.9% |
| 45 to 59 Minutes | 10 | 0.5% |
| 60 to 89 Minutes | 6 | 0.3% |
| 90 or more Minutes | 0 | 0.0% |
Commute Time by Sex in Scott City
The most common commute times in Scott City are 15 to 19 minutes (279 commuters, 22.9%) for males and 5 to 9 minutes (363 commuters, 50.8%) for females.
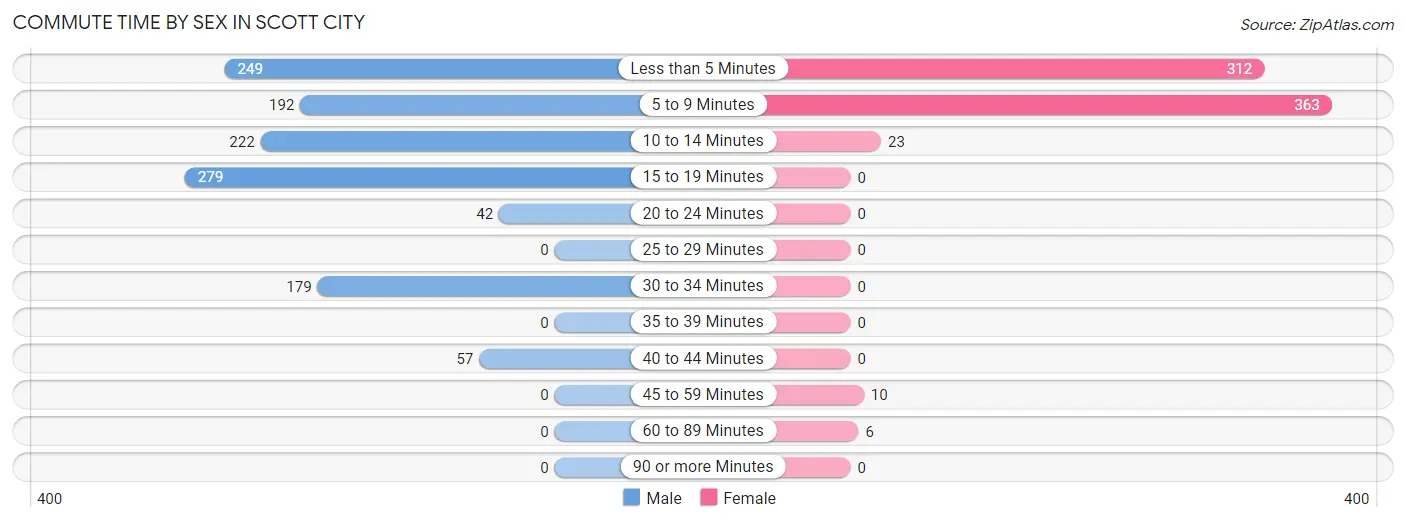
| Commute Time | Male | Female |
| Less than 5 Minutes | 249 (20.4%) | 312 (43.7%) |
| 5 to 9 Minutes | 192 (15.7%) | 363 (50.8%) |
| 10 to 14 Minutes | 222 (18.2%) | 23 (3.2%) |
| 15 to 19 Minutes | 279 (22.9%) | 0 (0.0%) |
| 20 to 24 Minutes | 42 (3.4%) | 0 (0.0%) |
| 25 to 29 Minutes | 0 (0.0%) | 0 (0.0%) |
| 30 to 34 Minutes | 179 (14.7%) | 0 (0.0%) |
| 35 to 39 Minutes | 0 (0.0%) | 0 (0.0%) |
| 40 to 44 Minutes | 57 (4.7%) | 0 (0.0%) |
| 45 to 59 Minutes | 0 (0.0%) | 10 (1.4%) |
| 60 to 89 Minutes | 0 (0.0%) | 6 (0.8%) |
| 90 or more Minutes | 0 (0.0%) | 0 (0.0%) |
Time of Departure to Work by Sex in Scott City
The most frequent times of departure to work in Scott City are 7:00 AM to 7:29 AM (235, 19.3%) for males and 8:30 AM to 8:59 AM (168, 23.5%) for females.
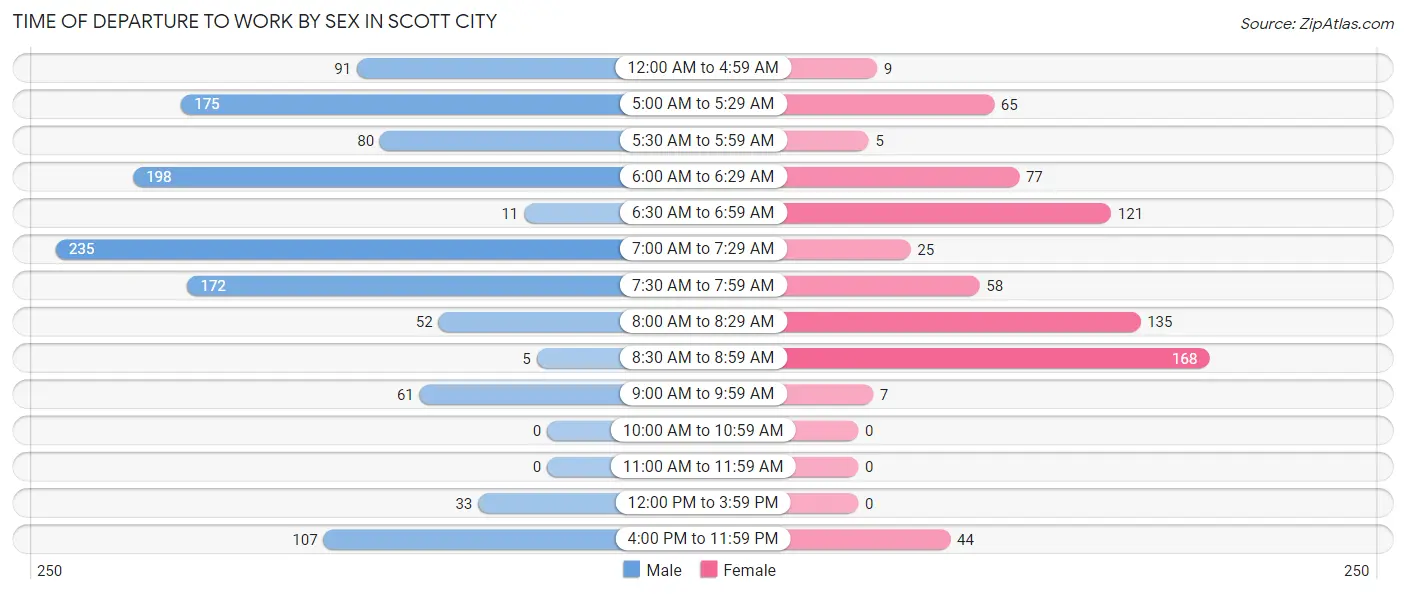
| Time of Departure | Male | Female |
| 12:00 AM to 4:59 AM | 91 (7.5%) | 9 (1.3%) |
| 5:00 AM to 5:29 AM | 175 (14.3%) | 65 (9.1%) |
| 5:30 AM to 5:59 AM | 80 (6.6%) | 5 (0.7%) |
| 6:00 AM to 6:29 AM | 198 (16.2%) | 77 (10.8%) |
| 6:30 AM to 6:59 AM | 11 (0.9%) | 121 (17.0%) |
| 7:00 AM to 7:29 AM | 235 (19.3%) | 25 (3.5%) |
| 7:30 AM to 7:59 AM | 172 (14.1%) | 58 (8.1%) |
| 8:00 AM to 8:29 AM | 52 (4.3%) | 135 (18.9%) |
| 8:30 AM to 8:59 AM | 5 (0.4%) | 168 (23.5%) |
| 9:00 AM to 9:59 AM | 61 (5.0%) | 7 (1.0%) |
| 10:00 AM to 10:59 AM | 0 (0.0%) | 0 (0.0%) |
| 11:00 AM to 11:59 AM | 0 (0.0%) | 0 (0.0%) |
| 12:00 PM to 3:59 PM | 33 (2.7%) | 0 (0.0%) |
| 4:00 PM to 11:59 PM | 107 (8.8%) | 44 (6.2%) |
| Total | 1,220 (100.0%) | 714 (100.0%) |
Housing Occupancy in Scott City
Occupancy by Ownership in Scott City
Of the total 1,647 dwellings in Scott City, owner-occupied units account for 912 (55.4%), while renter-occupied units make up 735 (44.6%).
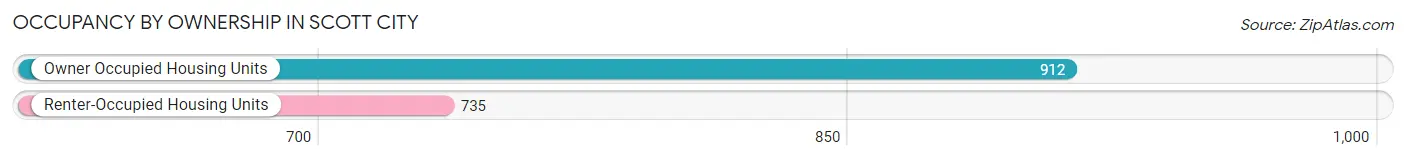
| Occupancy | # Housing Units | % Housing Units |
| Owner Occupied Housing Units | 912 | 55.4% |
| Renter-Occupied Housing Units | 735 | 44.6% |
| Total Occupied Housing Units | 1,647 | 100.0% |
Occupancy by Household Size in Scott City
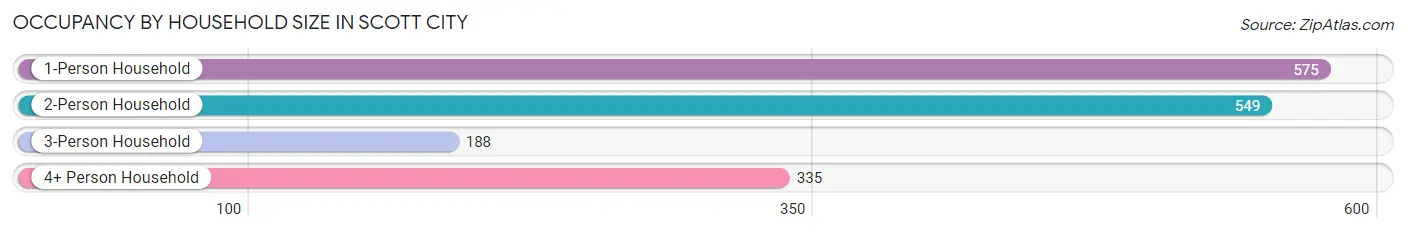
| Household Size | # Housing Units | % Housing Units |
| 1-Person Household | 575 | 34.9% |
| 2-Person Household | 549 | 33.3% |
| 3-Person Household | 188 | 11.4% |
| 4+ Person Household | 335 | 20.3% |
| Total Housing Units | 1,647 | 100.0% |
Occupancy by Ownership by Household Size in Scott City
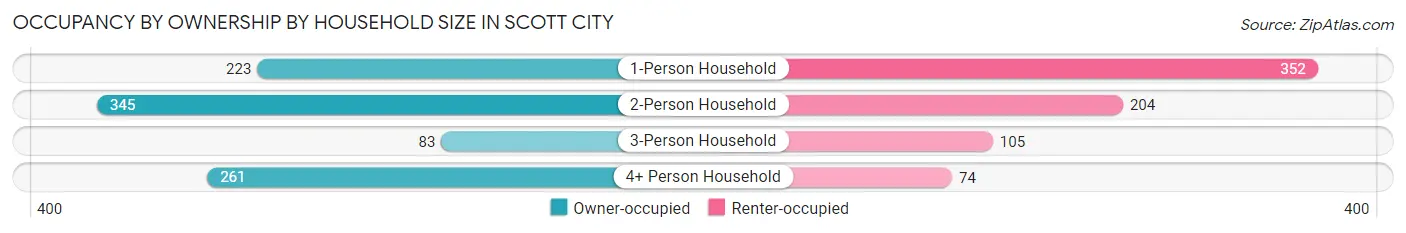
| Household Size | Owner-occupied | Renter-occupied |
| 1-Person Household | 223 (38.8%) | 352 (61.2%) |
| 2-Person Household | 345 (62.8%) | 204 (37.2%) |
| 3-Person Household | 83 (44.2%) | 105 (55.8%) |
| 4+ Person Household | 261 (77.9%) | 74 (22.1%) |
| Total Housing Units | 912 (55.4%) | 735 (44.6%) |
Occupancy by Educational Attainment in Scott City
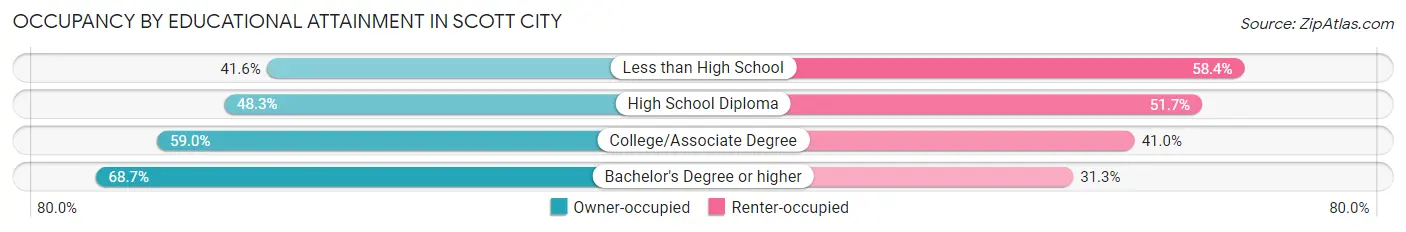
| Household Size | Owner-occupied | Renter-occupied |
| Less than High School | 72 (41.6%) | 101 (58.4%) |
| High School Diploma | 291 (48.3%) | 311 (51.7%) |
| College/Associate Degree | 305 (59.0%) | 212 (41.0%) |
| Bachelor's Degree or higher | 244 (68.7%) | 111 (31.3%) |
Occupancy by Age of Householder in Scott City
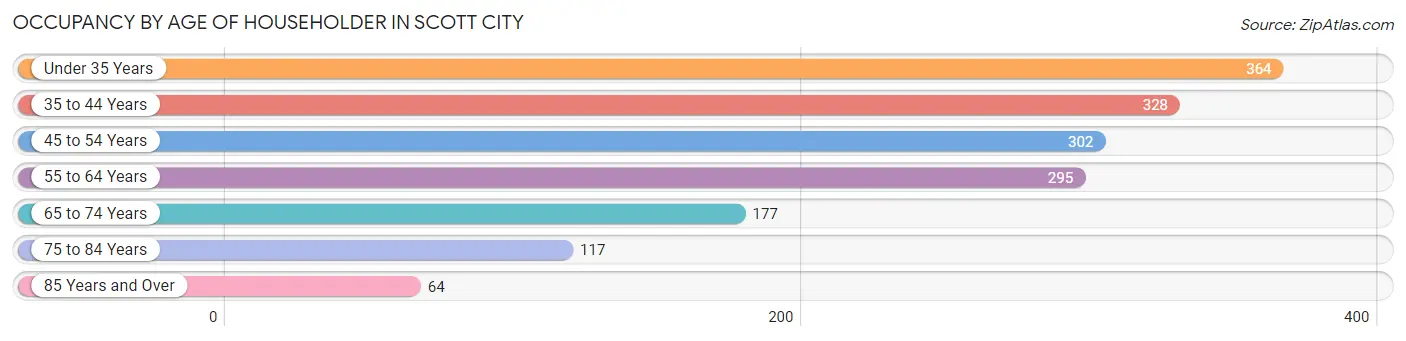
| Age Bracket | # Households | % Households |
| Under 35 Years | 364 | 22.1% |
| 35 to 44 Years | 328 | 19.9% |
| 45 to 54 Years | 302 | 18.3% |
| 55 to 64 Years | 295 | 17.9% |
| 65 to 74 Years | 177 | 10.7% |
| 75 to 84 Years | 117 | 7.1% |
| 85 Years and Over | 64 | 3.9% |
| Total | 1,647 | 100.0% |
Housing Finances in Scott City
Median Income by Occupancy in Scott City
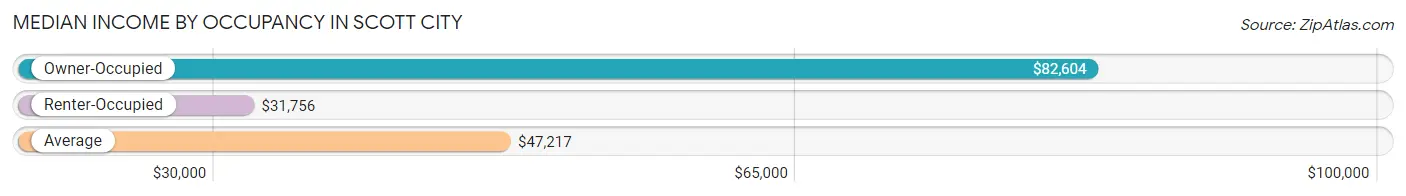
| Occupancy Type | # Households | Median Income |
| Owner-Occupied | 912 (55.4%) | $82,604 |
| Renter-Occupied | 735 (44.6%) | $31,756 |
| Average | 1,647 (100.0%) | $47,217 |
Occupancy by Householder Income Bracket in Scott City
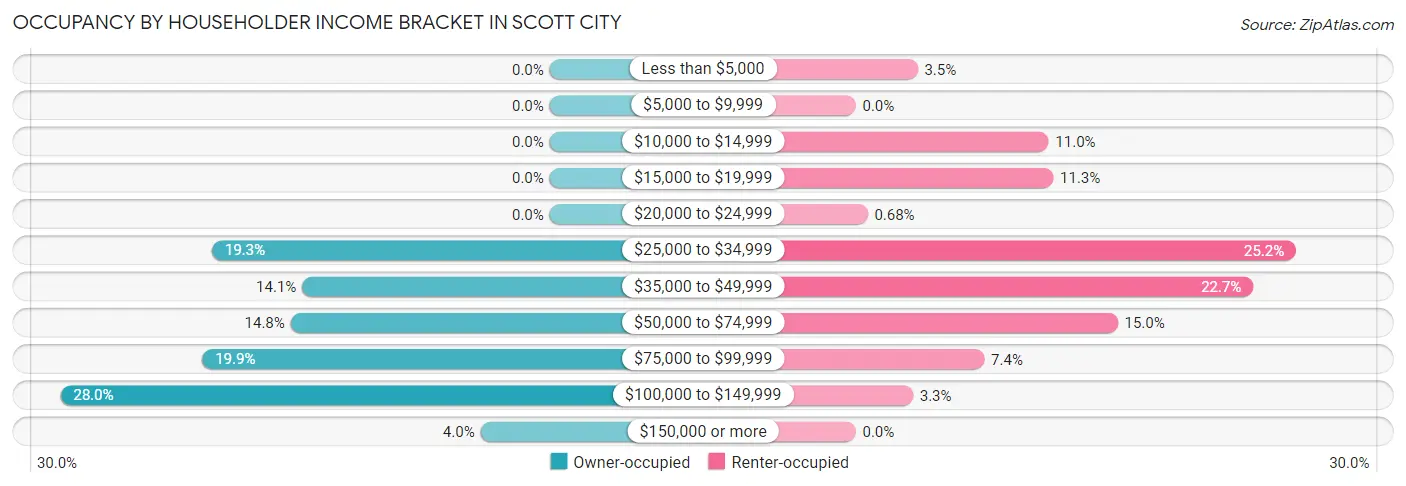
| Income Bracket | Owner-occupied | Renter-occupied |
| Less than $5,000 | 0 (0.0%) | 26 (3.5%) |
| $5,000 to $9,999 | 0 (0.0%) | 0 (0.0%) |
| $10,000 to $14,999 | 0 (0.0%) | 81 (11.0%) |
| $15,000 to $19,999 | 0 (0.0%) | 83 (11.3%) |
| $20,000 to $24,999 | 0 (0.0%) | 5 (0.7%) |
| $25,000 to $34,999 | 176 (19.3%) | 185 (25.2%) |
| $35,000 to $49,999 | 129 (14.1%) | 167 (22.7%) |
| $50,000 to $74,999 | 135 (14.8%) | 110 (15.0%) |
| $75,000 to $99,999 | 181 (19.9%) | 54 (7.3%) |
| $100,000 to $149,999 | 255 (28.0%) | 24 (3.3%) |
| $150,000 or more | 36 (4.0%) | 0 (0.0%) |
| Total | 912 (100.0%) | 735 (100.0%) |
Monthly Housing Cost Tiers in Scott City
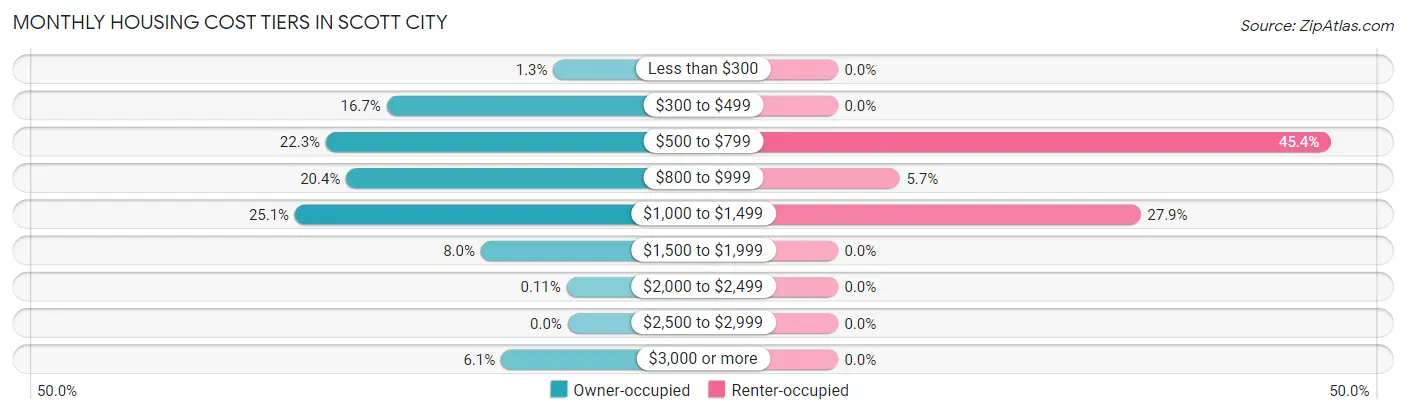
| Monthly Cost | Owner-occupied | Renter-occupied |
| Less than $300 | 12 (1.3%) | 0 (0.0%) |
| $300 to $499 | 152 (16.7%) | 0 (0.0%) |
| $500 to $799 | 203 (22.3%) | 334 (45.4%) |
| $800 to $999 | 186 (20.4%) | 42 (5.7%) |
| $1,000 to $1,499 | 229 (25.1%) | 205 (27.9%) |
| $1,500 to $1,999 | 73 (8.0%) | 0 (0.0%) |
| $2,000 to $2,499 | 1 (0.1%) | 0 (0.0%) |
| $2,500 to $2,999 | 0 (0.0%) | 0 (0.0%) |
| $3,000 or more | 56 (6.1%) | 0 (0.0%) |
| Total | 912 (100.0%) | 735 (100.0%) |
Physical Housing Characteristics in Scott City
Housing Structures in Scott City
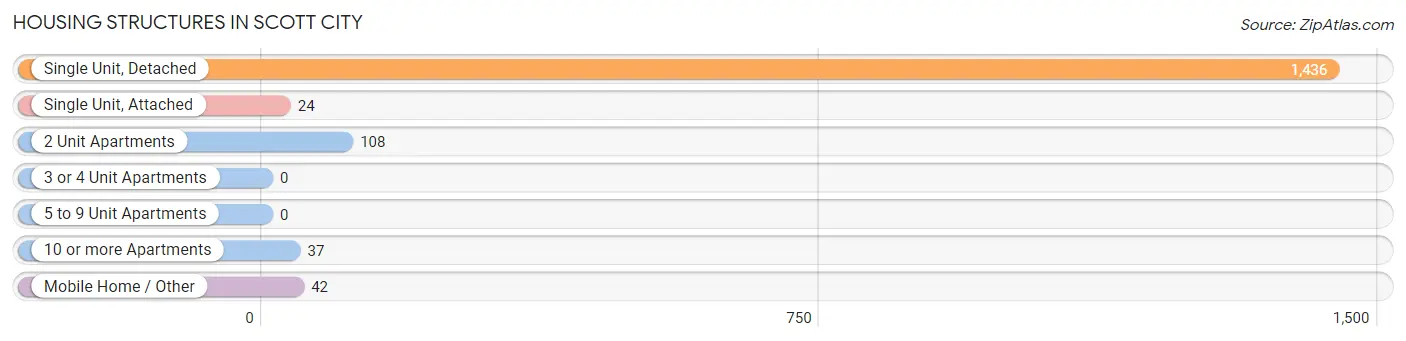
| Structure Type | # Housing Units | % Housing Units |
| Single Unit, Detached | 1,436 | 87.2% |
| Single Unit, Attached | 24 | 1.5% |
| 2 Unit Apartments | 108 | 6.6% |
| 3 or 4 Unit Apartments | 0 | 0.0% |
| 5 to 9 Unit Apartments | 0 | 0.0% |
| 10 or more Apartments | 37 | 2.2% |
| Mobile Home / Other | 42 | 2.5% |
| Total | 1,647 | 100.0% |
Housing Structures by Occupancy in Scott City
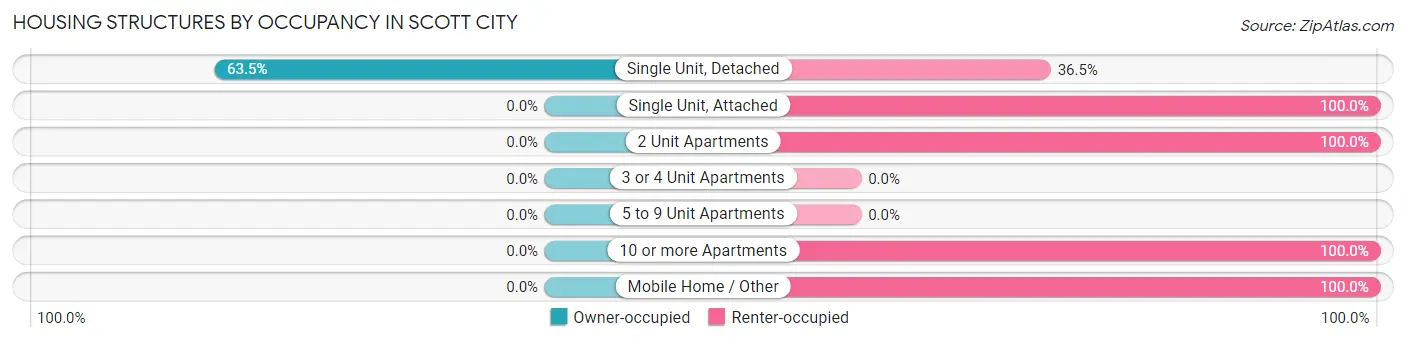
| Structure Type | Owner-occupied | Renter-occupied |
| Single Unit, Detached | 912 (63.5%) | 524 (36.5%) |
| Single Unit, Attached | 0 (0.0%) | 24 (100.0%) |
| 2 Unit Apartments | 0 (0.0%) | 108 (100.0%) |
| 3 or 4 Unit Apartments | 0 (0.0%) | 0 (0.0%) |
| 5 to 9 Unit Apartments | 0 (0.0%) | 0 (0.0%) |
| 10 or more Apartments | 0 (0.0%) | 37 (100.0%) |
| Mobile Home / Other | 0 (0.0%) | 42 (100.0%) |
| Total | 912 (55.4%) | 735 (44.6%) |
Housing Structures by Number of Rooms in Scott City
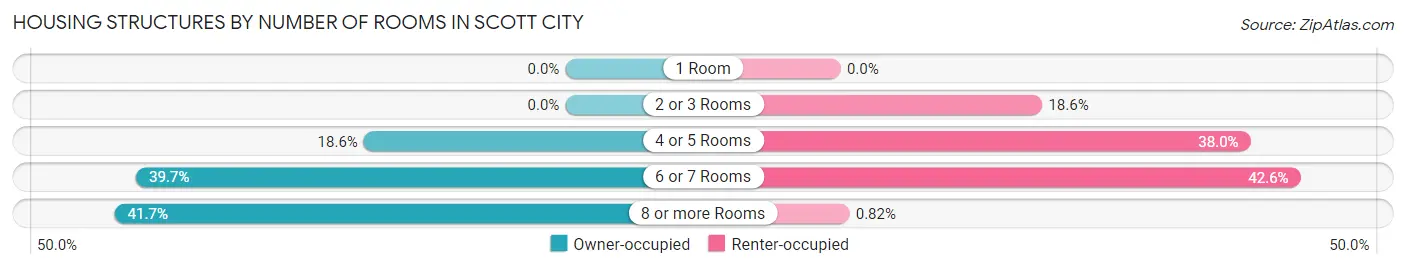
| Number of Rooms | Owner-occupied | Renter-occupied |
| 1 Room | 0 (0.0%) | 0 (0.0%) |
| 2 or 3 Rooms | 0 (0.0%) | 137 (18.6%) |
| 4 or 5 Rooms | 170 (18.6%) | 279 (38.0%) |
| 6 or 7 Rooms | 362 (39.7%) | 313 (42.6%) |
| 8 or more Rooms | 380 (41.7%) | 6 (0.8%) |
| Total | 912 (100.0%) | 735 (100.0%) |
Housing Structure by Heating Type in Scott City
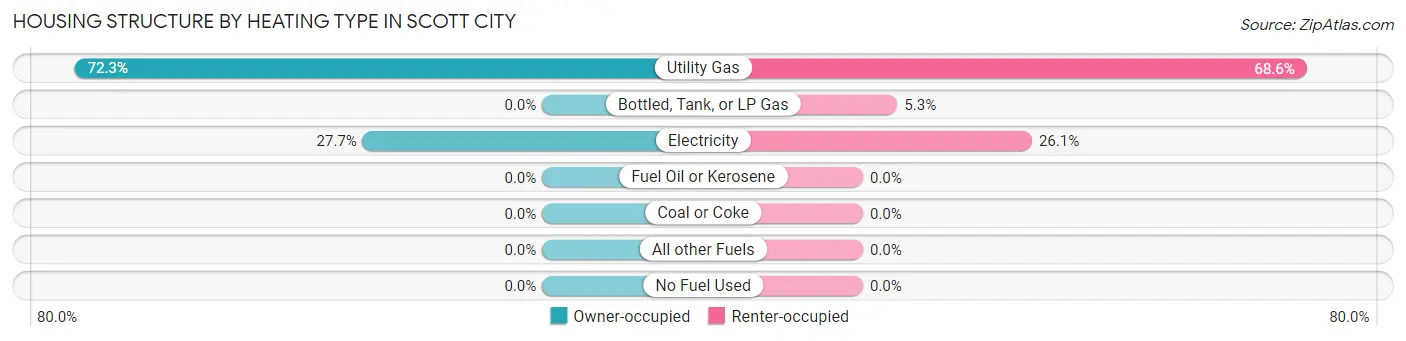
| Heating Type | Owner-occupied | Renter-occupied |
| Utility Gas | 659 (72.3%) | 504 (68.6%) |
| Bottled, Tank, or LP Gas | 0 (0.0%) | 39 (5.3%) |
| Electricity | 253 (27.7%) | 192 (26.1%) |
| Fuel Oil or Kerosene | 0 (0.0%) | 0 (0.0%) |
| Coal or Coke | 0 (0.0%) | 0 (0.0%) |
| All other Fuels | 0 (0.0%) | 0 (0.0%) |
| No Fuel Used | 0 (0.0%) | 0 (0.0%) |
| Total | 912 (100.0%) | 735 (100.0%) |
Household Vehicle Usage in Scott City
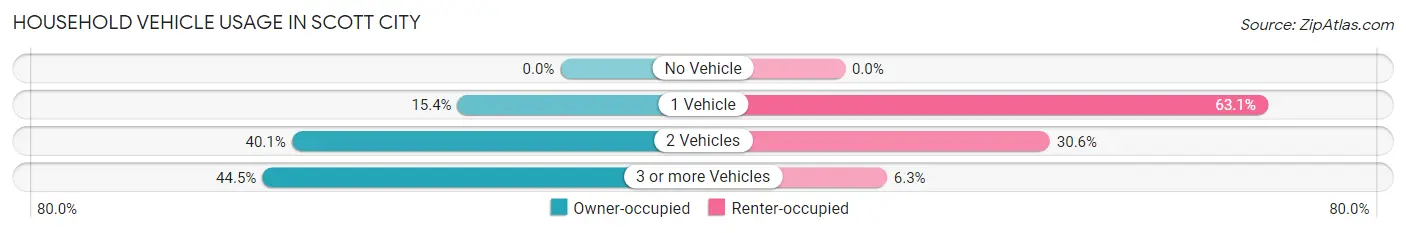
| Vehicles per Household | Owner-occupied | Renter-occupied |
| No Vehicle | 0 (0.0%) | 0 (0.0%) |
| 1 Vehicle | 140 (15.3%) | 464 (63.1%) |
| 2 Vehicles | 366 (40.1%) | 225 (30.6%) |
| 3 or more Vehicles | 406 (44.5%) | 46 (6.3%) |
| Total | 912 (100.0%) | 735 (100.0%) |
Real Estate & Mortgages in Scott City
Real Estate and Mortgage Overview in Scott City
| Characteristic | Without Mortgage | With Mortgage |
| Housing Units | 348 | 564 |
| Median Property Value | $150,300 | $212,400 |
| Median Household Income | $71,429 | $36 |
| Monthly Housing Costs | $526 | $56 |
| Real Estate Taxes | $2,293 | $0 |
Property Value by Mortgage Status in Scott City
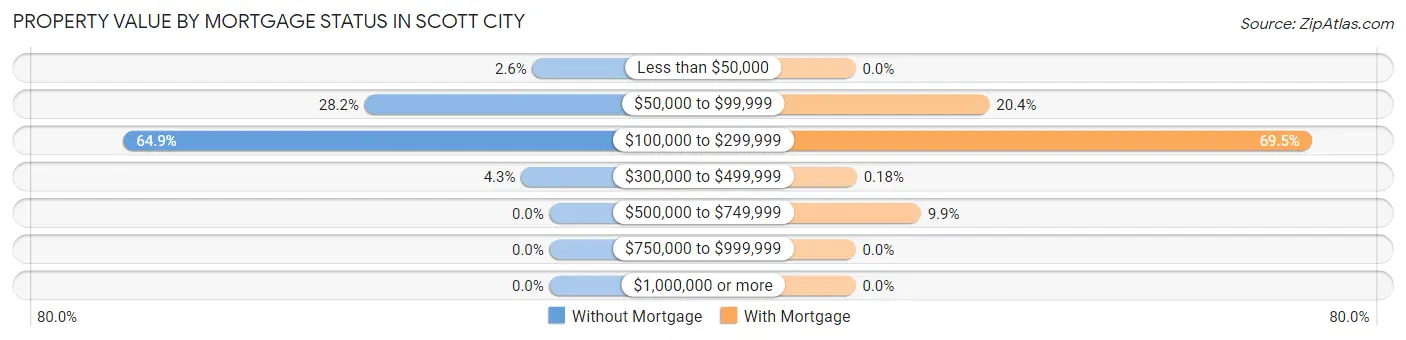
| Property Value | Without Mortgage | With Mortgage |
| Less than $50,000 | 9 (2.6%) | 0 (0.0%) |
| $50,000 to $99,999 | 98 (28.2%) | 115 (20.4%) |
| $100,000 to $299,999 | 226 (64.9%) | 392 (69.5%) |
| $300,000 to $499,999 | 15 (4.3%) | 1 (0.2%) |
| $500,000 to $749,999 | 0 (0.0%) | 56 (9.9%) |
| $750,000 to $999,999 | 0 (0.0%) | 0 (0.0%) |
| $1,000,000 or more | 0 (0.0%) | 0 (0.0%) |
| Total | 348 (100.0%) | 564 (100.0%) |
Household Income by Mortgage Status in Scott City
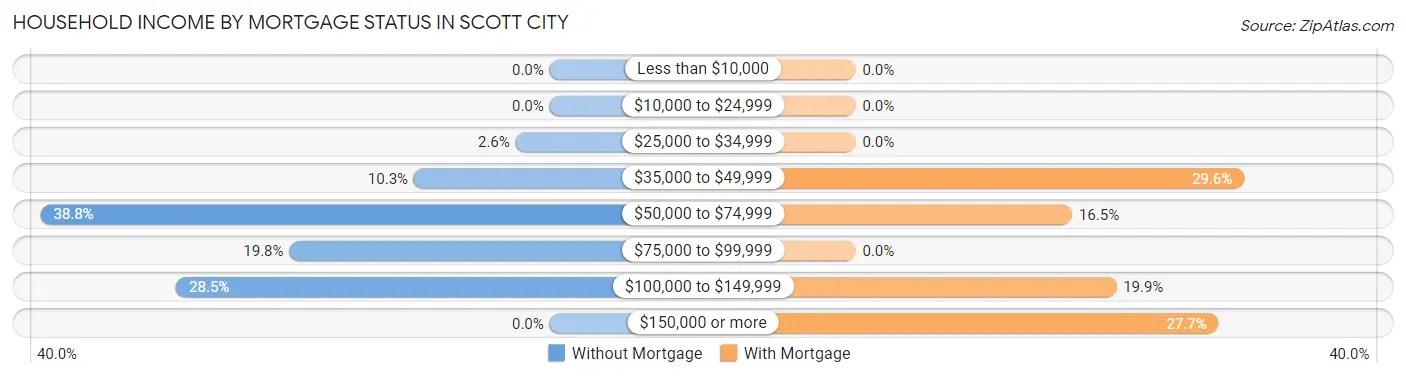
| Household Income | Without Mortgage | With Mortgage |
| Less than $10,000 | 0 (0.0%) | 0 (0.0%) |
| $10,000 to $24,999 | 0 (0.0%) | 0 (0.0%) |
| $25,000 to $34,999 | 9 (2.6%) | 0 (0.0%) |
| $35,000 to $49,999 | 36 (10.3%) | 167 (29.6%) |
| $50,000 to $74,999 | 135 (38.8%) | 93 (16.5%) |
| $75,000 to $99,999 | 69 (19.8%) | 0 (0.0%) |
| $100,000 to $149,999 | 99 (28.4%) | 112 (19.9%) |
| $150,000 or more | 0 (0.0%) | 156 (27.7%) |
| Total | 348 (100.0%) | 564 (100.0%) |
Property Value to Household Income Ratio in Scott City
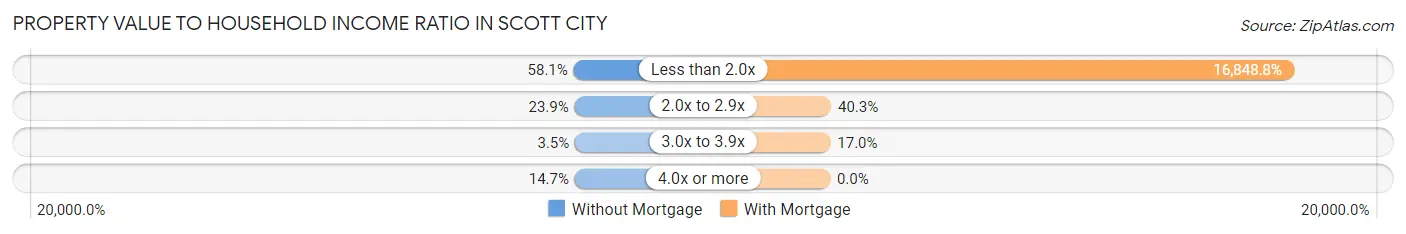
| Value-to-Income Ratio | Without Mortgage | With Mortgage |
| Less than 2.0x | 202 (58.1%) | 95,027 (16,848.8%) |
| 2.0x to 2.9x | 83 (23.8%) | 227 (40.3%) |
| 3.0x to 3.9x | 12 (3.5%) | 96 (17.0%) |
| 4.0x or more | 51 (14.7%) | 0 (0.0%) |
| Total | 348 (100.0%) | 564 (100.0%) |
Real Estate Taxes by Mortgage Status in Scott City
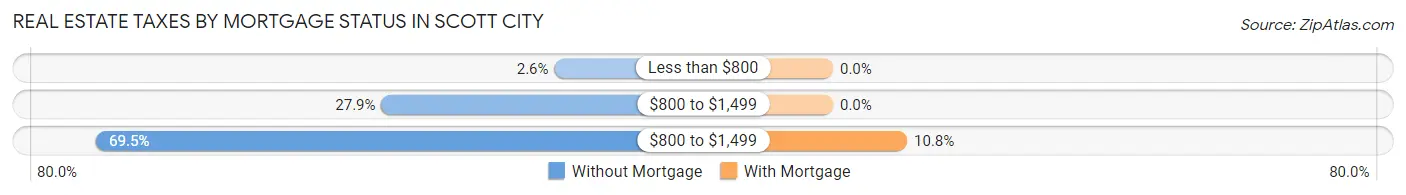
| Property Taxes | Without Mortgage | With Mortgage |
| Less than $800 | 9 (2.6%) | 0 (0.0%) |
| $800 to $1,499 | 97 (27.9%) | 0 (0.0%) |
| $800 to $1,499 | 242 (69.5%) | 61 (10.8%) |
| Total | 348 (100.0%) | 564 (100.0%) |
Health & Disability in Scott City
Health Insurance Coverage by Age in Scott City
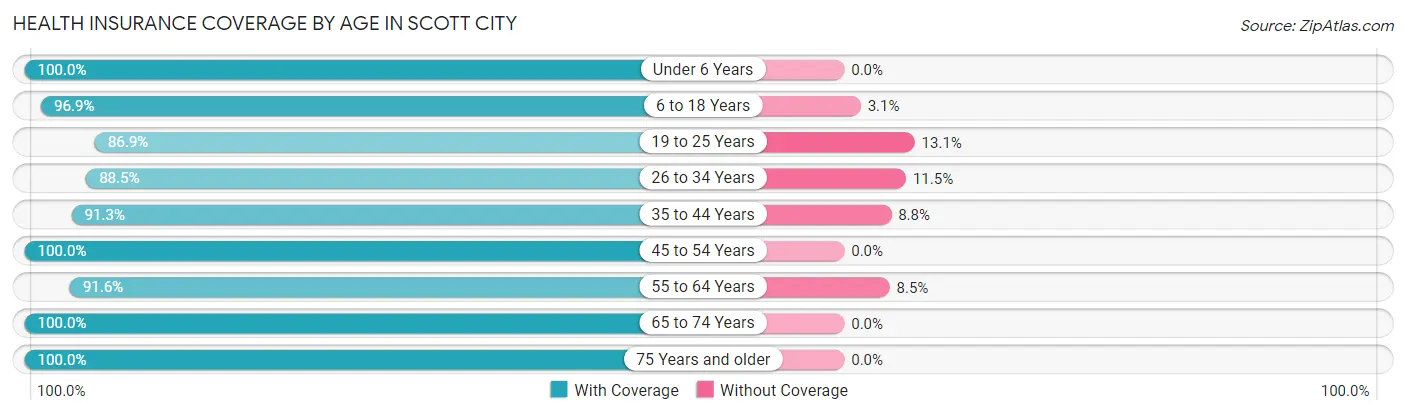
| Age Bracket | With Coverage | Without Coverage |
| Under 6 Years | 268 (100.0%) | 0 (0.0%) |
| 6 to 18 Years | 1,043 (96.9%) | 33 (3.1%) |
| 19 to 25 Years | 245 (86.9%) | 37 (13.1%) |
| 26 to 34 Years | 331 (88.5%) | 43 (11.5%) |
| 35 to 44 Years | 386 (91.2%) | 37 (8.7%) |
| 45 to 54 Years | 523 (100.0%) | 0 (0.0%) |
| 55 to 64 Years | 336 (91.5%) | 31 (8.5%) |
| 65 to 74 Years | 367 (100.0%) | 0 (0.0%) |
| 75 Years and older | 337 (100.0%) | 0 (0.0%) |
| Total | 3,836 (95.5%) | 181 (4.5%) |
Health Insurance Coverage by Citizenship Status in Scott City
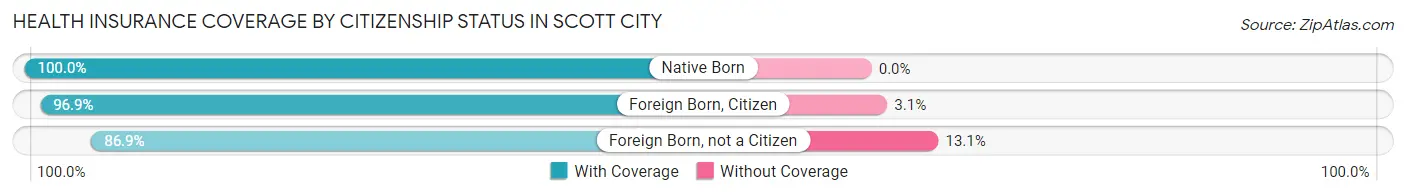
| Citizenship Status | With Coverage | Without Coverage |
| Native Born | 268 (100.0%) | 0 (0.0%) |
| Foreign Born, Citizen | 1,043 (96.9%) | 33 (3.1%) |
| Foreign Born, not a Citizen | 245 (86.9%) | 37 (13.1%) |
Health Insurance Coverage by Household Income in Scott City
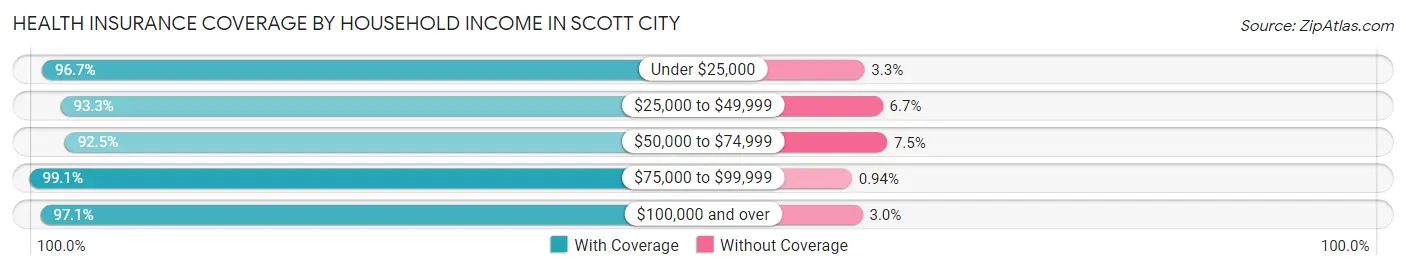
| Household Income | With Coverage | Without Coverage |
| Under $25,000 | 293 (96.7%) | 10 (3.3%) |
| $25,000 to $49,999 | 1,236 (93.3%) | 89 (6.7%) |
| $50,000 to $74,999 | 577 (92.5%) | 47 (7.5%) |
| $75,000 to $99,999 | 842 (99.1%) | 8 (0.9%) |
| $100,000 and over | 888 (97.1%) | 27 (2.9%) |
Public vs Private Health Insurance Coverage by Age in Scott City
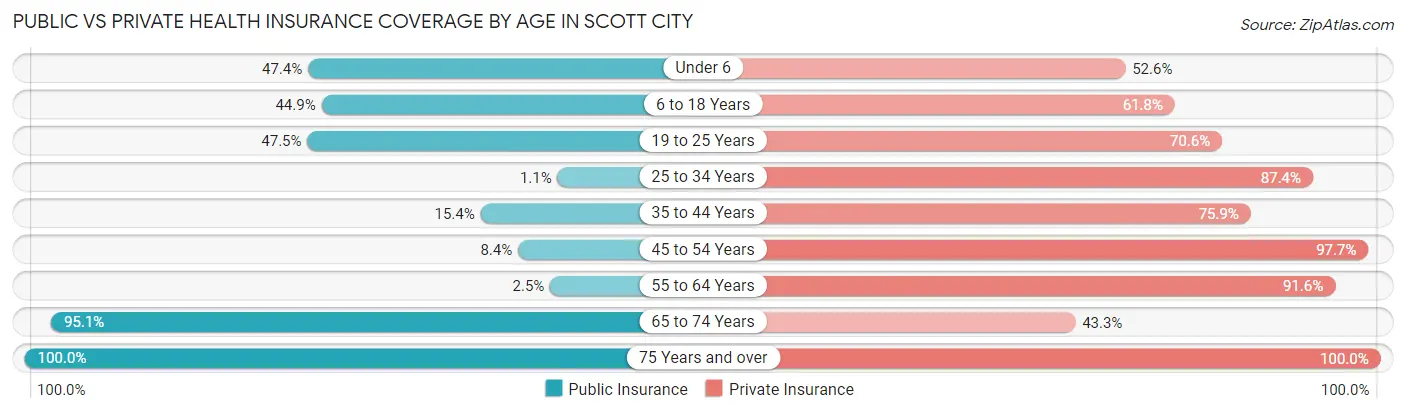
| Age Bracket | Public Insurance | Private Insurance |
| Under 6 | 127 (47.4%) | 141 (52.6%) |
| 6 to 18 Years | 483 (44.9%) | 665 (61.8%) |
| 19 to 25 Years | 134 (47.5%) | 199 (70.6%) |
| 25 to 34 Years | 4 (1.1%) | 327 (87.4%) |
| 35 to 44 Years | 65 (15.4%) | 321 (75.9%) |
| 45 to 54 Years | 44 (8.4%) | 511 (97.7%) |
| 55 to 64 Years | 9 (2.5%) | 336 (91.5%) |
| 65 to 74 Years | 349 (95.1%) | 159 (43.3%) |
| 75 Years and over | 337 (100.0%) | 337 (100.0%) |
| Total | 1,552 (38.6%) | 2,996 (74.6%) |
Disability Status by Sex by Age in Scott City
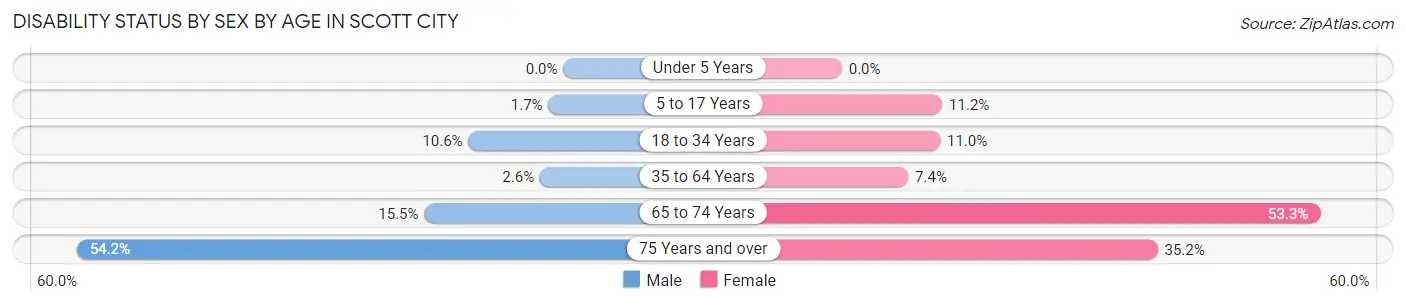
| Age Bracket | Male | Female |
| Under 5 Years | 0 (0.0%) | 0 (0.0%) |
| 5 to 17 Years | 8 (1.7%) | 58 (11.2%) |
| 18 to 34 Years | 39 (10.6%) | 44 (11.0%) |
| 35 to 64 Years | 19 (2.6%) | 43 (7.4%) |
| 65 to 74 Years | 26 (15.5%) | 106 (53.3%) |
| 75 Years and over | 84 (54.2%) | 64 (35.2%) |
Disability Class by Sex by Age in Scott City
Disability Class: Hearing Difficulty
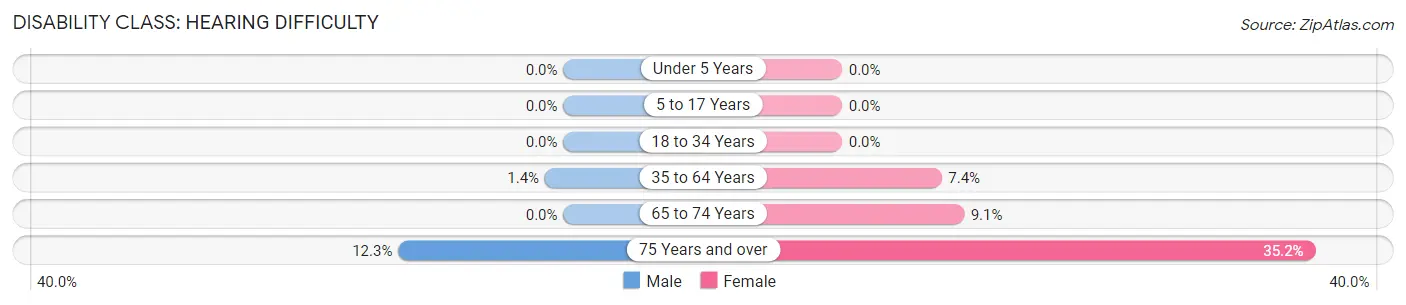
| Age Bracket | Male | Female |
| Under 5 Years | 0 (0.0%) | 0 (0.0%) |
| 5 to 17 Years | 0 (0.0%) | 0 (0.0%) |
| 18 to 34 Years | 0 (0.0%) | 0 (0.0%) |
| 35 to 64 Years | 10 (1.4%) | 43 (7.4%) |
| 65 to 74 Years | 0 (0.0%) | 18 (9.0%) |
| 75 Years and over | 19 (12.3%) | 64 (35.2%) |
Disability Class: Vision Difficulty
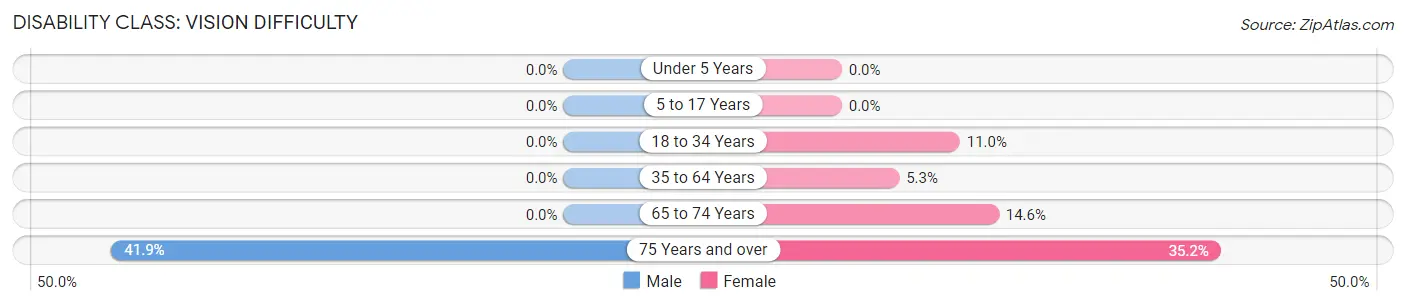
| Age Bracket | Male | Female |
| Under 5 Years | 0 (0.0%) | 0 (0.0%) |
| 5 to 17 Years | 0 (0.0%) | 0 (0.0%) |
| 18 to 34 Years | 0 (0.0%) | 44 (11.0%) |
| 35 to 64 Years | 0 (0.0%) | 31 (5.3%) |
| 65 to 74 Years | 0 (0.0%) | 29 (14.6%) |
| 75 Years and over | 65 (41.9%) | 64 (35.2%) |
Disability Class: Cognitive Difficulty
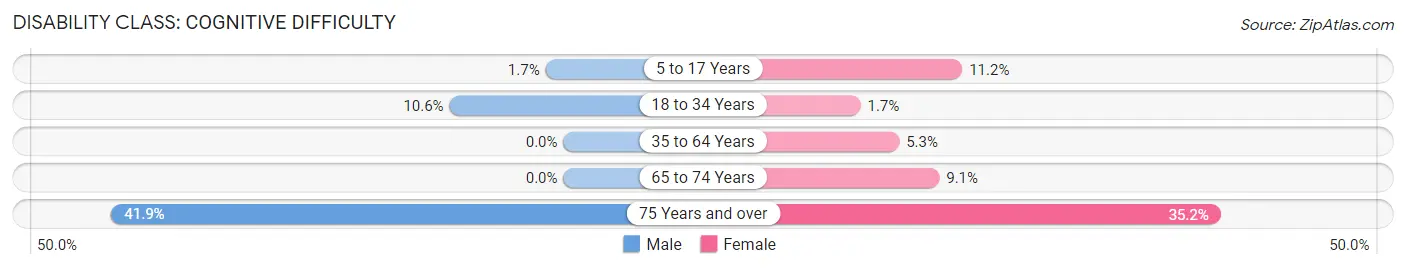
| Age Bracket | Male | Female |
| 5 to 17 Years | 8 (1.7%) | 58 (11.2%) |
| 18 to 34 Years | 39 (10.6%) | 7 (1.7%) |
| 35 to 64 Years | 0 (0.0%) | 31 (5.3%) |
| 65 to 74 Years | 0 (0.0%) | 18 (9.0%) |
| 75 Years and over | 65 (41.9%) | 64 (35.2%) |
Disability Class: Ambulatory Difficulty
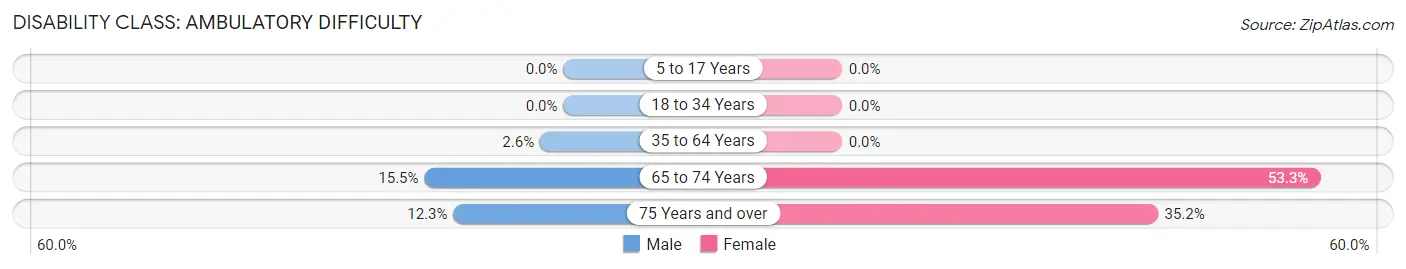
| Age Bracket | Male | Female |
| 5 to 17 Years | 0 (0.0%) | 0 (0.0%) |
| 18 to 34 Years | 0 (0.0%) | 0 (0.0%) |
| 35 to 64 Years | 19 (2.6%) | 0 (0.0%) |
| 65 to 74 Years | 26 (15.5%) | 106 (53.3%) |
| 75 Years and over | 19 (12.3%) | 64 (35.2%) |
Disability Class: Self-Care Difficulty
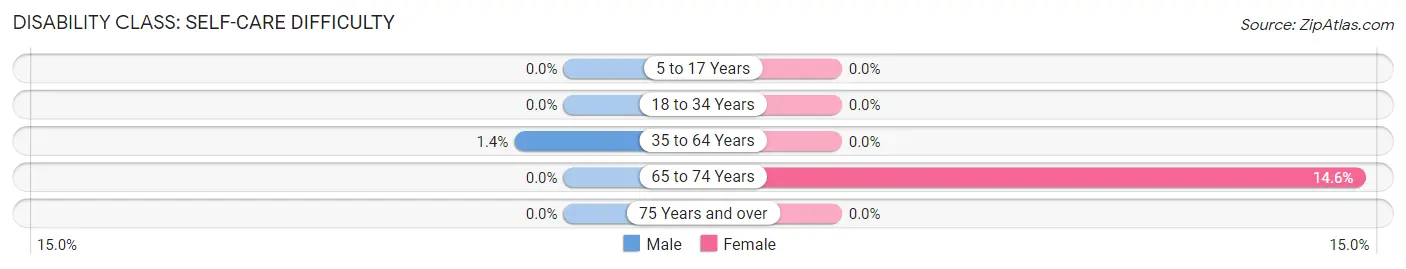
| Age Bracket | Male | Female |
| 5 to 17 Years | 0 (0.0%) | 0 (0.0%) |
| 18 to 34 Years | 0 (0.0%) | 0 (0.0%) |
| 35 to 64 Years | 10 (1.4%) | 0 (0.0%) |
| 65 to 74 Years | 0 (0.0%) | 29 (14.6%) |
| 75 Years and over | 0 (0.0%) | 0 (0.0%) |
Technology Access in Scott City
Computing Device Access in Scott City
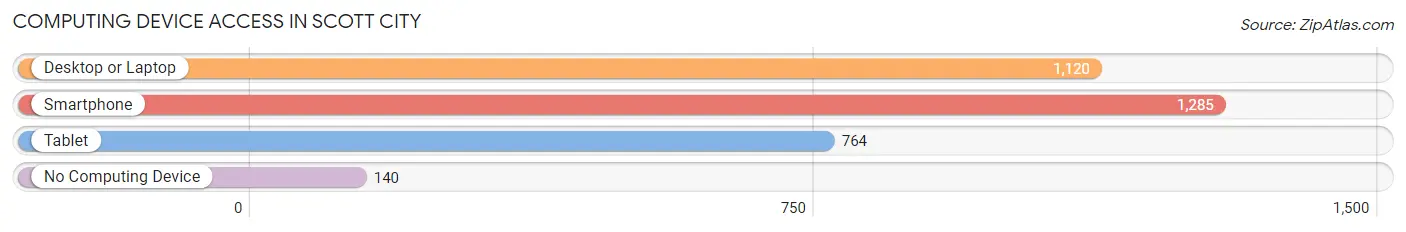
| Device Type | # Households | % Households |
| Desktop or Laptop | 1,120 | 68.0% |
| Smartphone | 1,285 | 78.0% |
| Tablet | 764 | 46.4% |
| No Computing Device | 140 | 8.5% |
| Total | 1,647 | 100.0% |
Internet Access in Scott City
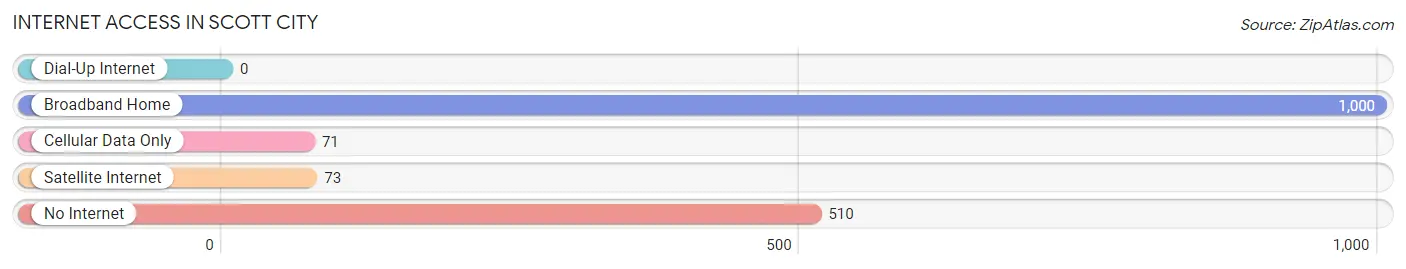
| Internet Type | # Households | % Households |
| Dial-Up Internet | 0 | 0.0% |
| Broadband Home | 1,000 | 60.7% |
| Cellular Data Only | 71 | 4.3% |
| Satellite Internet | 73 | 4.4% |
| No Internet | 510 | 31.0% |
| Total | 1,647 | 100.0% |
Scott City Summary
Scott City, Kansas is a small city located in Scott County in the western part of the state. It is situated on the banks of the Arkansas River and is the county seat of Scott County. The city has a population of 4,711 according to the 2010 census.
History
Scott City was founded in 1885 by William Scott, a former Union soldier who had served in the Civil War. He named the town after himself and it was incorporated in 1887. The city was originally a farming community and the main crops were wheat, corn, and sorghum. In the early 1900s, the city began to grow and develop as a trading center for the surrounding area. The first bank was established in 1906 and the first newspaper, the Scott County News, was published in 1907.
In the 1920s, the city began to experience a period of growth and development. The first hospital was built in 1923 and the first school was built in 1925. The city also saw the construction of a new courthouse in 1926.
In the 1950s, the city experienced a period of decline as the population began to move away to larger cities. However, in the late 1970s, the city began to experience a period of revitalization. The city was able to attract new businesses and industries, which helped to create jobs and bring new people to the area.
Geography
Scott City is located in western Kansas, in Scott County. It is situated on the banks of the Arkansas River and is approximately 30 miles east of Garden City. The city has a total area of 2.2 square miles, all of which is land. The city has a semi-arid climate with hot summers and cold winters.
Economy
The economy of Scott City is largely based on agriculture and manufacturing. The city is home to several large agricultural companies, including Cargill, Inc., which is one of the largest grain processors in the world. The city also has several manufacturing companies, including a plastics plant and a metal fabrication plant.
The city also has a growing tourism industry, with several attractions, including the Scott County Historical Museum, the Scott County Fairgrounds, and the Scott County Speedway.
Demographics
According to the 2010 census, the population of Scott City was 4,711. The racial makeup of the city was 87.3% White, 0.7% African American, 0.3% Native American, 0.2% Asian, 0.1% Pacific Islander, 9.7% from other races, and 1.9% from two or more races. Hispanic or Latino of any race were 16.2% of the population.
The median income for a household in the city was $37,917 and the median income for a family was $45,938. The per capita income for the city was $18,945. About 14.2% of families and 17.3% of the population were below the poverty line, including 22.3% of those under age 18 and 8.2% of those age 65 or over.
Scott City is a small city with a rich history and a bright future. It is a great place to live, work, and raise a family. The city has a strong economy and a diverse population, making it a great place to call home.
Common Questions
What is Per Capita Income in Scott City?
Per Capita income in Scott City is $26,889.
What is the Median Family Income in Scott City?
Median Family Income in Scott City is $54,522.
What is the Median Household income in Scott City?
Median Household Income in Scott City is $47,217.
What is Income or Wage Gap in Scott City?
Income or Wage Gap in Scott City is 34.6%.
Women in Scott City earn 65.4 cents for every dollar earned by a man.
What is Inequality or Gini Index in Scott City?
Inequality or Gini Index in Scott City is 0.42.
What is the Total Population of Scott City?
Total Population of Scott City is 4,121.
What is the Total Male Population of Scott City?
Total Male Population of Scott City is 2,081.
What is the Total Female Population of Scott City?
Total Female Population of Scott City is 2,040.
What is the Ratio of Males per 100 Females in Scott City?
There are 102.01 Males per 100 Females in Scott City.
What is the Ratio of Females per 100 Males in Scott City?
There are 98.03 Females per 100 Males in Scott City.
What is the Median Population Age in Scott City?
Median Population Age in Scott City is 36.0 Years.
What is the Average Family Size in Scott City
Average Family Size in Scott City is 3.1 People.
What is the Average Household Size in Scott City
Average Household Size in Scott City is 2.4 People.
How Large is the Labor Force in Scott City?
There are 2,146 People in the Labor Forcein in Scott City.
What is the Percentage of People in the Labor Force in Scott City?
67.9% of People are in the Labor Force in Scott City.
What is the Unemployment Rate in Scott City?
Unemployment Rate in Scott City is 3.0%.