Cantril, IA Map & Demographics
Cantril Map
Cantril Overview
$25,921
PER CAPITA INCOME
$63,750
AVG FAMILY INCOME
$36,705
AVG HOUSEHOLD INCOME
0.41
INEQUALITY / GINI INDEX
270
TOTAL POPULATION
150
MALE POPULATION
120
FEMALE POPULATION
125.00
MALES / 100 FEMALES
80.00
FEMALES / 100 MALES
43.5
MEDIAN AGE
2.5
AVG FAMILY SIZE
1.9
AVG HOUSEHOLD SIZE
107
LABOR FORCE [ PEOPLE ]
51.2%
PERCENT IN LABOR FORCE
Cantril Zip Codes
Cantril Area Codes
Income in Cantril
Income Overview in Cantril
Per Capita Income in Cantril is $25,921, while median incomes of families and households are $63,750 and $36,705 respectively.
| Characteristic | Number | Measure |
| Per Capita Income | 270 | $25,921 |
| Median Family Income | 81 | $63,750 |
| Mean Family Income | 81 | $70,601 |
| Median Household Income | 139 | $36,705 |
| Mean Household Income | 139 | $52,197 |
| Income Deficit | 81 | $0 |
| Wage / Income Gap (%) | 270 | 0.00% |
| Wage / Income Gap ($) | 270 | 100.00¢ per $1 |
| Gini / Inequality Index | 270 | 0.41 |
Earnings by Sex in Cantril
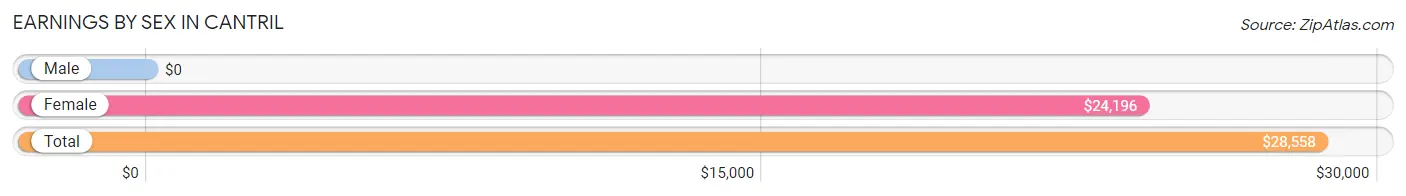
| Sex | Number | Average Earnings |
| Male | 64 (56.6%) | $0 |
| Female | 49 (43.4%) | $24,196 |
| Total | 113 (100.0%) | $28,558 |
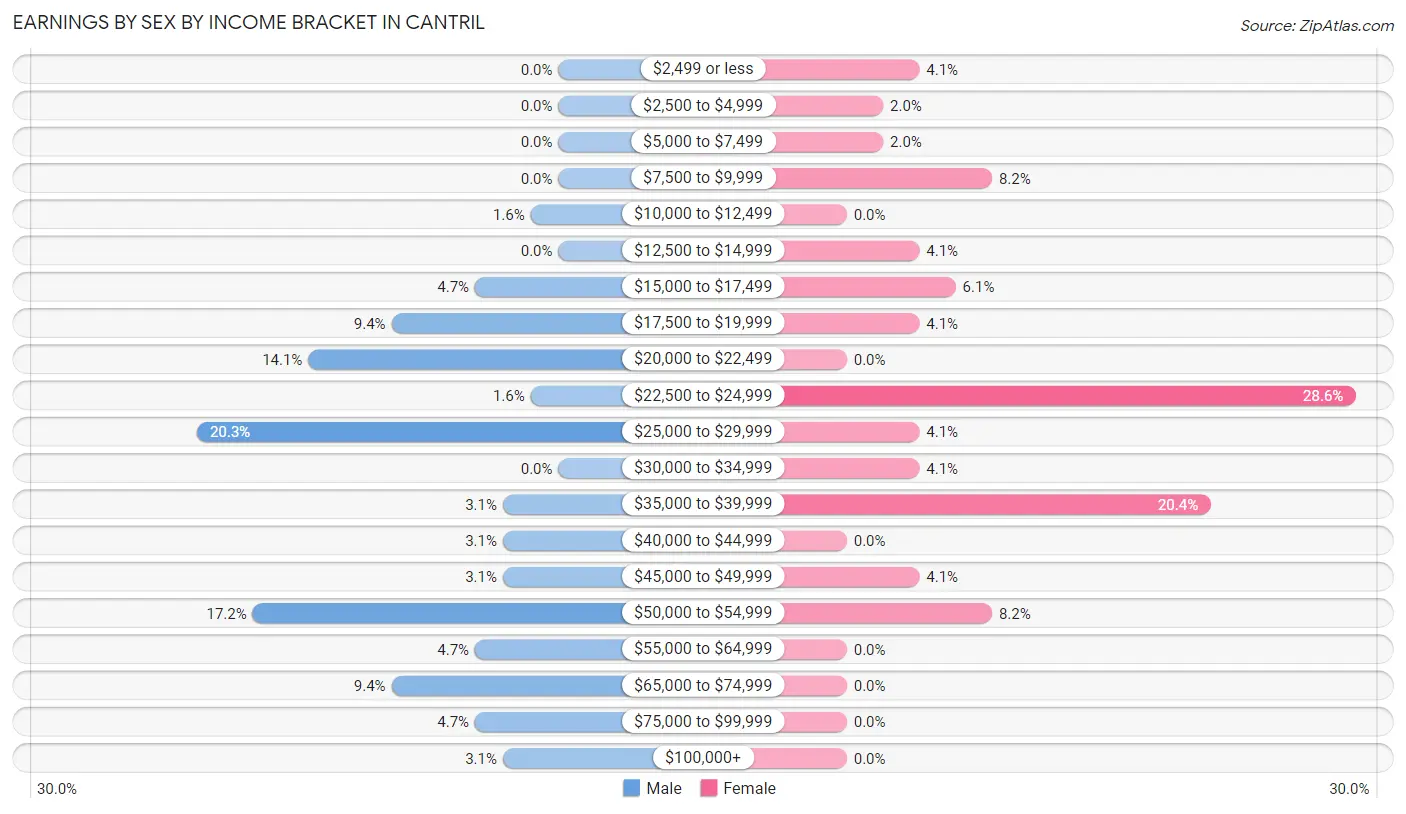
Earnings by Sex by Income Bracket in Cantril
The most common earnings brackets in Cantril are $25,000 to $29,999 for men (13 | 20.3%) and $22,500 to $24,999 for women (14 | 28.6%).
| Income | Male | Female |
| $2,499 or less | 0 (0.0%) | 2 (4.1%) |
| $2,500 to $4,999 | 0 (0.0%) | 1 (2.0%) |
| $5,000 to $7,499 | 0 (0.0%) | 1 (2.0%) |
| $7,500 to $9,999 | 0 (0.0%) | 4 (8.2%) |
| $10,000 to $12,499 | 1 (1.6%) | 0 (0.0%) |
| $12,500 to $14,999 | 0 (0.0%) | 2 (4.1%) |
| $15,000 to $17,499 | 3 (4.7%) | 3 (6.1%) |
| $17,500 to $19,999 | 6 (9.4%) | 2 (4.1%) |
| $20,000 to $22,499 | 9 (14.1%) | 0 (0.0%) |
| $22,500 to $24,999 | 1 (1.6%) | 14 (28.6%) |
| $25,000 to $29,999 | 13 (20.3%) | 2 (4.1%) |
| $30,000 to $34,999 | 0 (0.0%) | 2 (4.1%) |
| $35,000 to $39,999 | 2 (3.1%) | 10 (20.4%) |
| $40,000 to $44,999 | 2 (3.1%) | 0 (0.0%) |
| $45,000 to $49,999 | 2 (3.1%) | 2 (4.1%) |
| $50,000 to $54,999 | 11 (17.2%) | 4 (8.2%) |
| $55,000 to $64,999 | 3 (4.7%) | 0 (0.0%) |
| $65,000 to $74,999 | 6 (9.4%) | 0 (0.0%) |
| $75,000 to $99,999 | 3 (4.7%) | 0 (0.0%) |
| $100,000+ | 2 (3.1%) | 0 (0.0%) |
| Total | 64 (100.0%) | 49 (100.0%) |
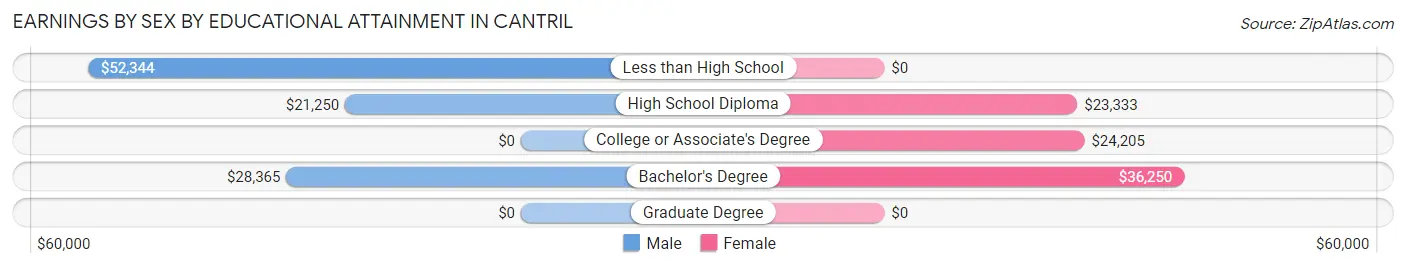
Earnings by Sex by Educational Attainment in Cantril
Average earnings in Cantril are $29,423 for men and $25,000 for women, a difference of 15.0%. Men with an educational attainment of less than high school enjoy the highest average annual earnings of $52,344, while those with high school diploma education earn the least with $21,250. Women with an educational attainment of bachelor's degree earn the most with the average annual earnings of $36,250, while those with high school diploma education have the smallest earnings of $23,333.
| Educational Attainment | Male Income | Female Income |
| Less than High School | $52,344 | $0 |
| High School Diploma | $21,250 | $23,333 |
| College or Associate's Degree | - | - |
| Bachelor's Degree | $28,365 | $36,250 |
| Graduate Degree | - | - |
| Total | $29,423 | $25,000 |
Family Income in Cantril
Family Income Brackets in Cantril
According to the Cantril family income data, there are 21 families falling into the $100,000 to $149,999 income range, which is the most common income bracket and makes up 25.9% of all families.
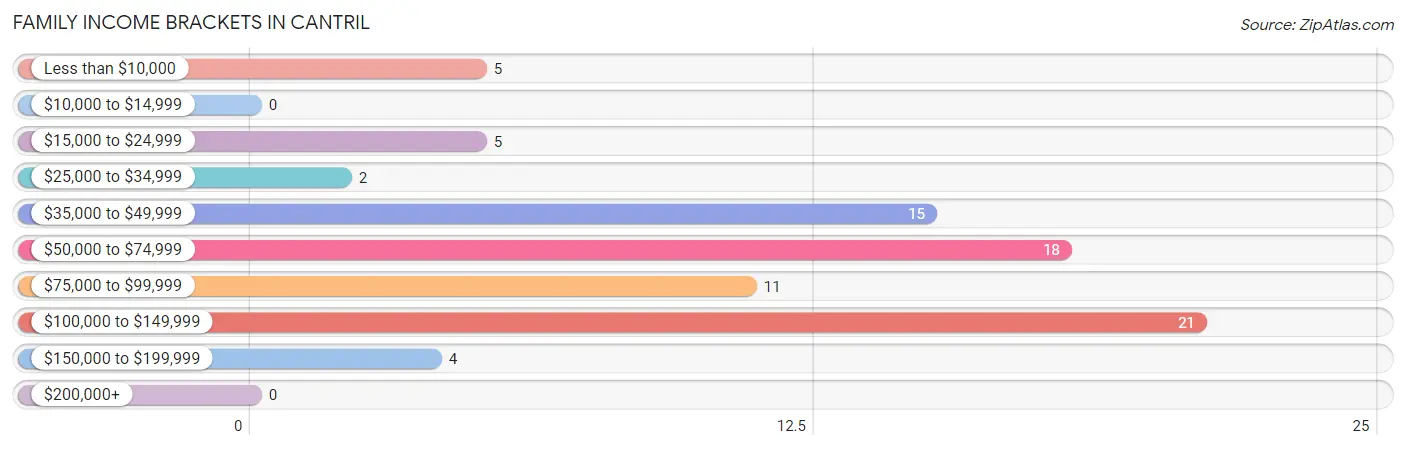
| Income Bracket | # Families | % Families |
| Less than $10,000 | 5 | 6.2% |
| $10,000 to $14,999 | 0 | 0.0% |
| $15,000 to $24,999 | 5 | 6.2% |
| $25,000 to $34,999 | 2 | 2.5% |
| $35,000 to $49,999 | 15 | 18.5% |
| $50,000 to $74,999 | 18 | 22.2% |
| $75,000 to $99,999 | 11 | 13.6% |
| $100,000 to $149,999 | 21 | 25.9% |
| $150,000 to $199,999 | 4 | 4.9% |
| $200,000+ | 0 | 0.0% |
Family Income by Famaliy Size in Cantril
3-person families (12 | 14.8%) account for the highest median family income in Cantril with $79,000 per family, while 2-person families (54 | 66.7%) have the highest median income of $31,250 per family member.
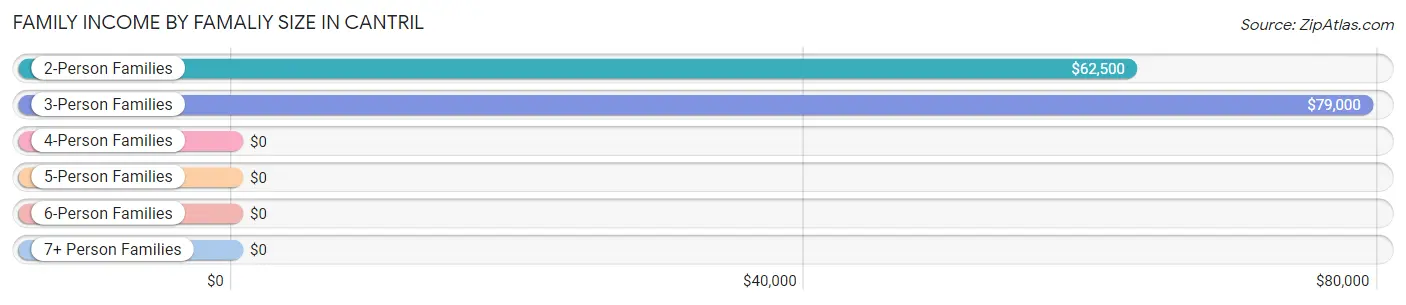
| Income Bracket | # Families | Median Income |
| 2-Person Families | 54 (66.7%) | $62,500 |
| 3-Person Families | 12 (14.8%) | $79,000 |
| 4-Person Families | 13 (16.1%) | $0 |
| 5-Person Families | 2 (2.5%) | $0 |
| 6-Person Families | 0 (0.0%) | $0 |
| 7+ Person Families | 0 (0.0%) | $0 |
| Total | 81 (100.0%) | $63,750 |
Family Income by Number of Earners in Cantril
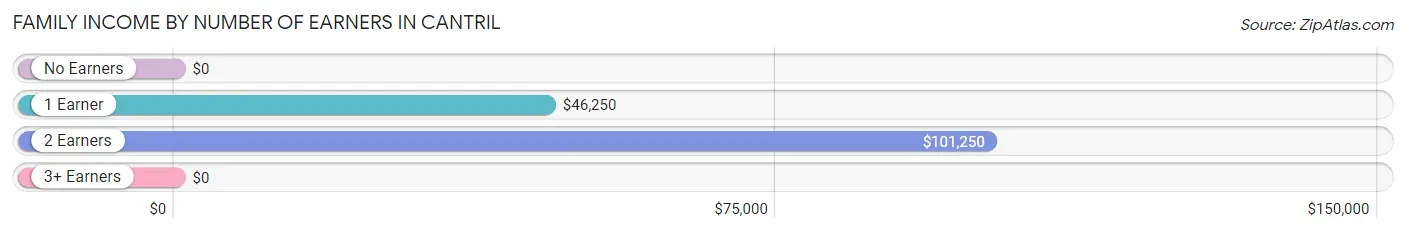
| Number of Earners | # Families | Median Income |
| No Earners | 13 (16.1%) | $0 |
| 1 Earner | 36 (44.4%) | $46,250 |
| 2 Earners | 28 (34.6%) | $101,250 |
| 3+ Earners | 4 (4.9%) | $0 |
| Total | 81 (100.0%) | $63,750 |
Household Income in Cantril
Household Income Brackets in Cantril
With 27 households falling in the category, the $15,000 to $24,999 income range is the most frequent in Cantril, accounting for 19.4% of all households.
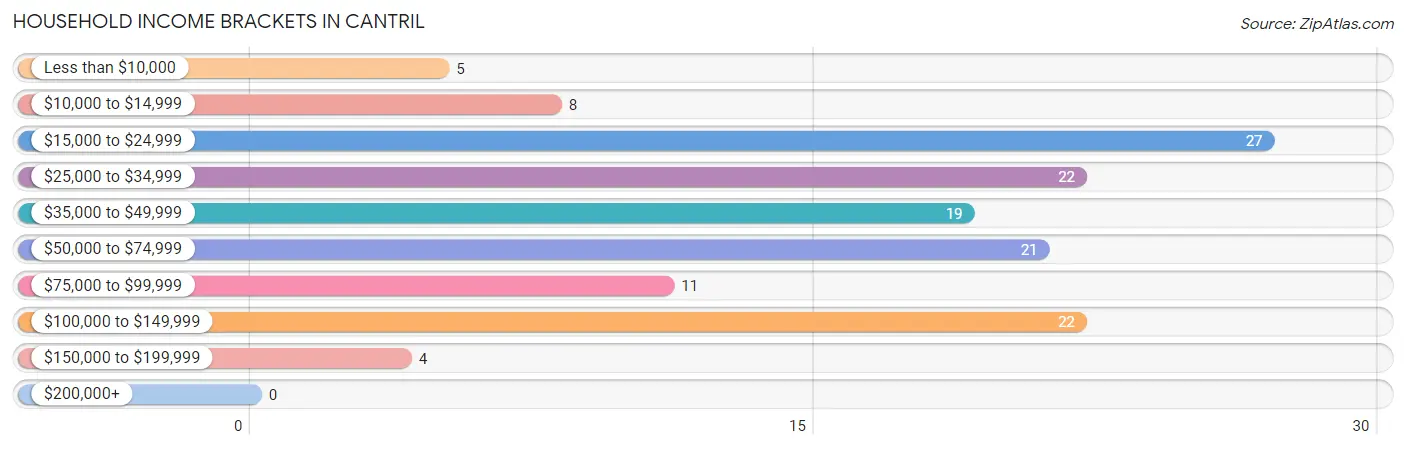
| Income Bracket | # Households | % Households |
| Less than $10,000 | 5 | 3.6% |
| $10,000 to $14,999 | 8 | 5.8% |
| $15,000 to $24,999 | 27 | 19.4% |
| $25,000 to $34,999 | 22 | 15.8% |
| $35,000 to $49,999 | 19 | 13.7% |
| $50,000 to $74,999 | 21 | 15.1% |
| $75,000 to $99,999 | 11 | 7.9% |
| $100,000 to $149,999 | 22 | 15.8% |
| $150,000 to $199,999 | 4 | 2.9% |
| $200,000+ | 0 | 0.0% |
Household Income by Householder Age in Cantril
The median household income in Cantril is $36,705, with the highest median household income of $68,750 found in the 15 to 24 years age bracket for the primary householder. A total of 5 households (3.6%) fall into this category. Meanwhile, the 45 to 64 years age bracket for the primary householder has the lowest median household income of $0, with 23 households (16.6%) in this group.
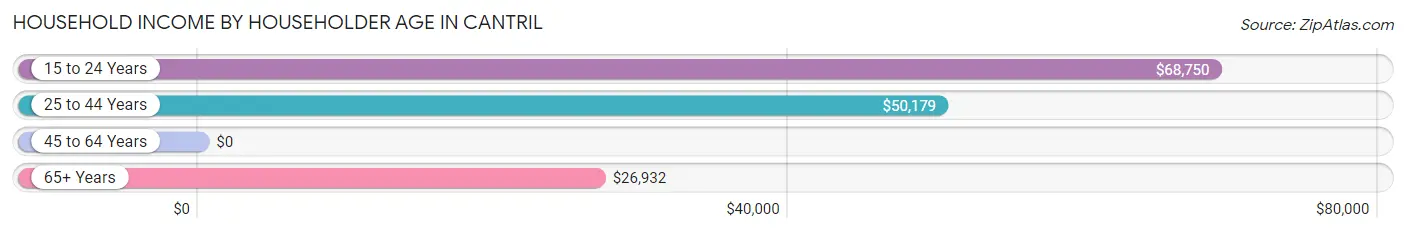
| Income Bracket | # Households | Median Income |
| 15 to 24 Years | 5 (3.6%) | $68,750 |
| 25 to 44 Years | 35 (25.2%) | $50,179 |
| 45 to 64 Years | 23 (16.6%) | $0 |
| 65+ Years | 76 (54.7%) | $26,932 |
| Total | 139 (100.0%) | $36,705 |
Poverty in Cantril
Income Below Poverty by Sex and Age in Cantril
With 3.3% poverty level for males and 17.2% for females among the residents of Cantril, 5 year old males and 45 to 54 year old females are the most vulnerable to poverty, with 2 males (50.0%) and 5 females (45.5%) in their respective age groups living below the poverty level.
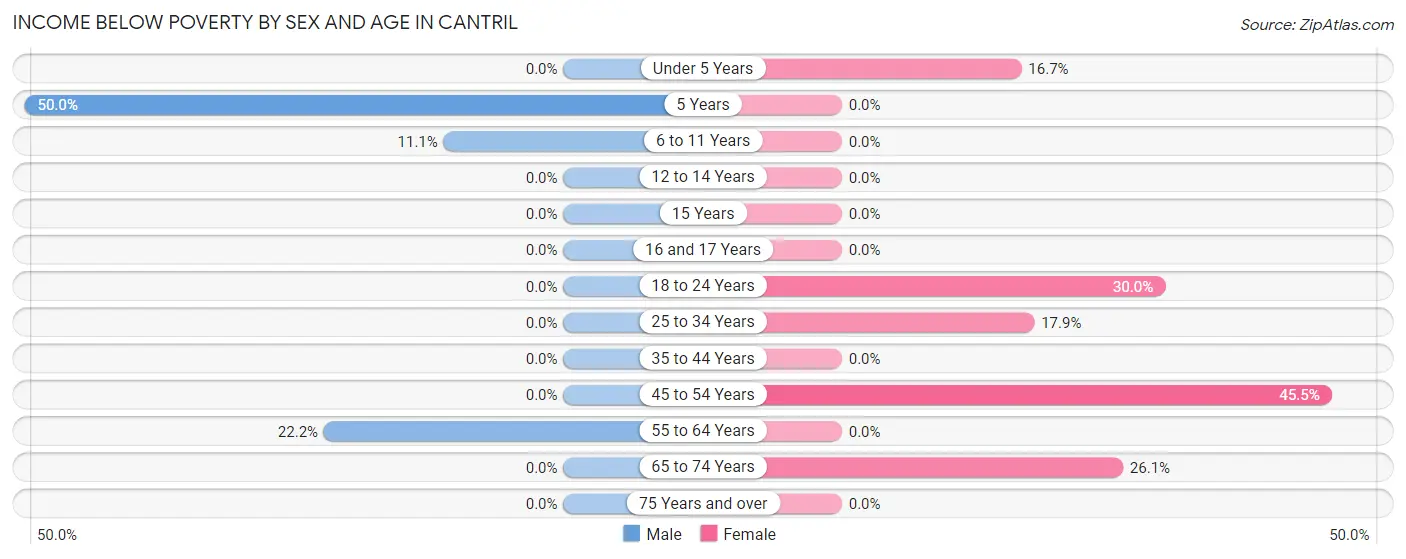
| Age Bracket | Male | Female |
| Under 5 Years | 0 (0.0%) | 1 (16.7%) |
| 5 Years | 2 (50.0%) | 0 (0.0%) |
| 6 to 11 Years | 1 (11.1%) | 0 (0.0%) |
| 12 to 14 Years | 0 (0.0%) | 0 (0.0%) |
| 15 Years | 0 (0.0%) | 0 (0.0%) |
| 16 and 17 Years | 0 (0.0%) | 0 (0.0%) |
| 18 to 24 Years | 0 (0.0%) | 3 (30.0%) |
| 25 to 34 Years | 0 (0.0%) | 5 (17.9%) |
| 35 to 44 Years | 0 (0.0%) | 0 (0.0%) |
| 45 to 54 Years | 0 (0.0%) | 5 (45.5%) |
| 55 to 64 Years | 2 (22.2%) | 0 (0.0%) |
| 65 to 74 Years | 0 (0.0%) | 6 (26.1%) |
| 75 Years and over | 0 (0.0%) | 0 (0.0%) |
| Total | 5 (3.3%) | 20 (17.2%) |
Income Above Poverty by Sex and Age in Cantril
According to the poverty statistics in Cantril, males aged under 5 years and females aged 6 to 11 years are the age groups that are most secure financially, with 100.0% of males and 100.0% of females in these age groups living above the poverty line.
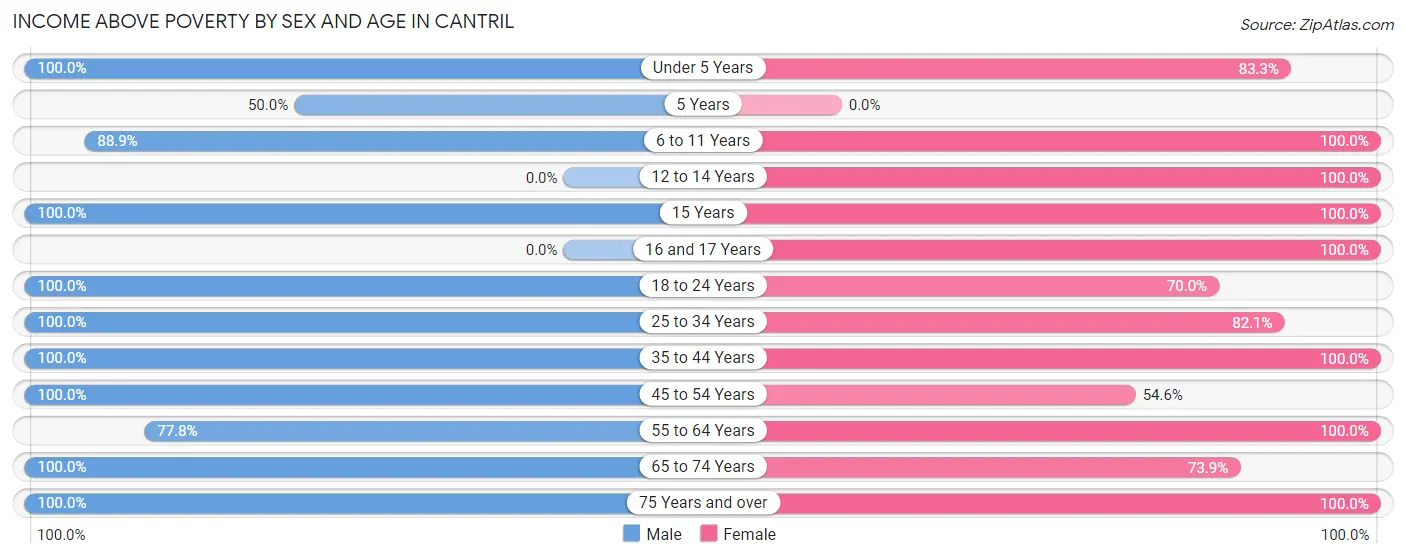
| Age Bracket | Male | Female |
| Under 5 Years | 28 (100.0%) | 5 (83.3%) |
| 5 Years | 2 (50.0%) | 0 (0.0%) |
| 6 to 11 Years | 8 (88.9%) | 3 (100.0%) |
| 12 to 14 Years | 0 (0.0%) | 2 (100.0%) |
| 15 Years | 3 (100.0%) | 2 (100.0%) |
| 16 and 17 Years | 0 (0.0%) | 2 (100.0%) |
| 18 to 24 Years | 6 (100.0%) | 7 (70.0%) |
| 25 to 34 Years | 21 (100.0%) | 23 (82.1%) |
| 35 to 44 Years | 5 (100.0%) | 4 (100.0%) |
| 45 to 54 Years | 5 (100.0%) | 6 (54.5%) |
| 55 to 64 Years | 7 (77.8%) | 16 (100.0%) |
| 65 to 74 Years | 36 (100.0%) | 17 (73.9%) |
| 75 Years and over | 24 (100.0%) | 9 (100.0%) |
| Total | 145 (96.7%) | 96 (82.8%) |
Income Below Poverty Among Married-Couple Families in Cantril
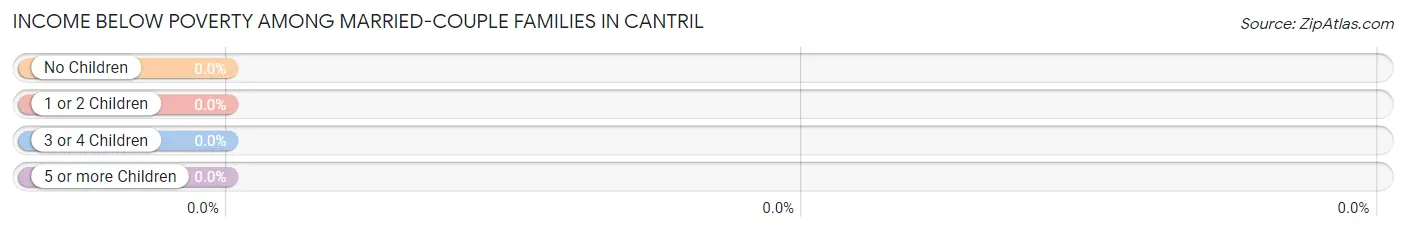
| Children | Above Poverty | Below Poverty |
| No Children | 38 (100.0%) | 0 (0.0%) |
| 1 or 2 Children | 22 (100.0%) | 0 (0.0%) |
| 3 or 4 Children | 2 (100.0%) | 0 (0.0%) |
| 5 or more Children | 0 (0.0%) | 0 (0.0%) |
| Total | 62 (100.0%) | 0 (0.0%) |
Income Below Poverty Among Single-Parent Households in Cantril
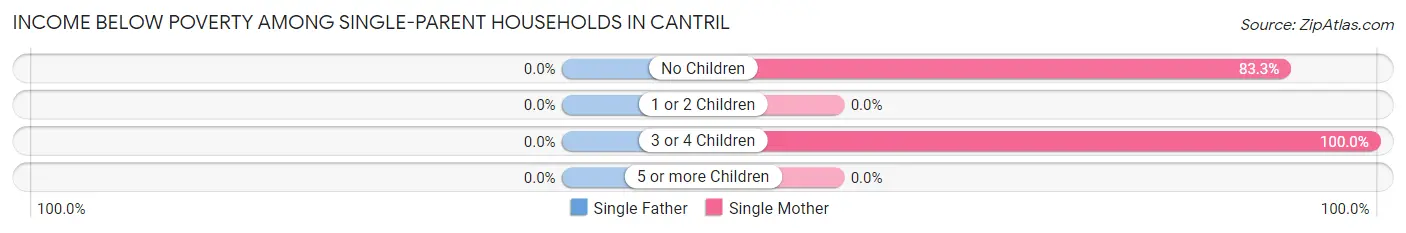
| Children | Single Father | Single Mother |
| No Children | 0 (0.0%) | 5 (83.3%) |
| 1 or 2 Children | 0 (0.0%) | 0 (0.0%) |
| 3 or 4 Children | 0 (0.0%) | 1 (100.0%) |
| 5 or more Children | 0 (0.0%) | 0 (0.0%) |
| Total | 0 (0.0%) | 6 (37.5%) |
Income Below Poverty Among Married-Couple vs Single-Parent Households in Cantril
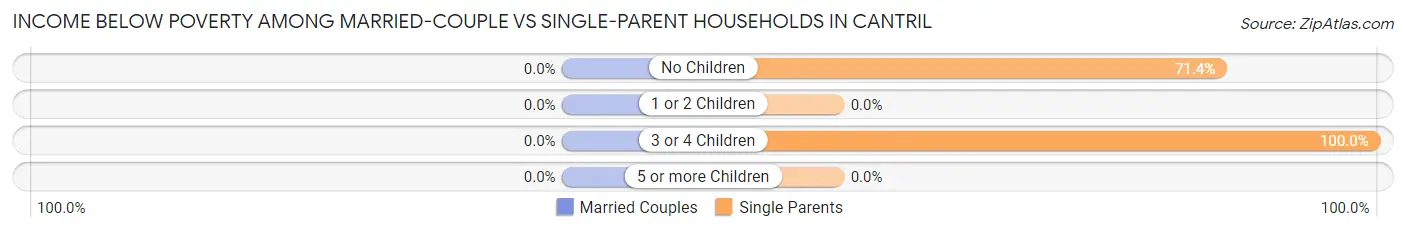
| Children | Married-Couple Families | Single-Parent Households |
| No Children | 0 (0.0%) | 5 (71.4%) |
| 1 or 2 Children | 0 (0.0%) | 0 (0.0%) |
| 3 or 4 Children | 0 (0.0%) | 1 (100.0%) |
| 5 or more Children | 0 (0.0%) | 0 (0.0%) |
| Total | 0 (0.0%) | 6 (31.6%) |
Race in Cantril
The most populous races in Cantril are White / Caucasian (270 | 100.0%), and Hispanic or Latino (18 | 6.7%).
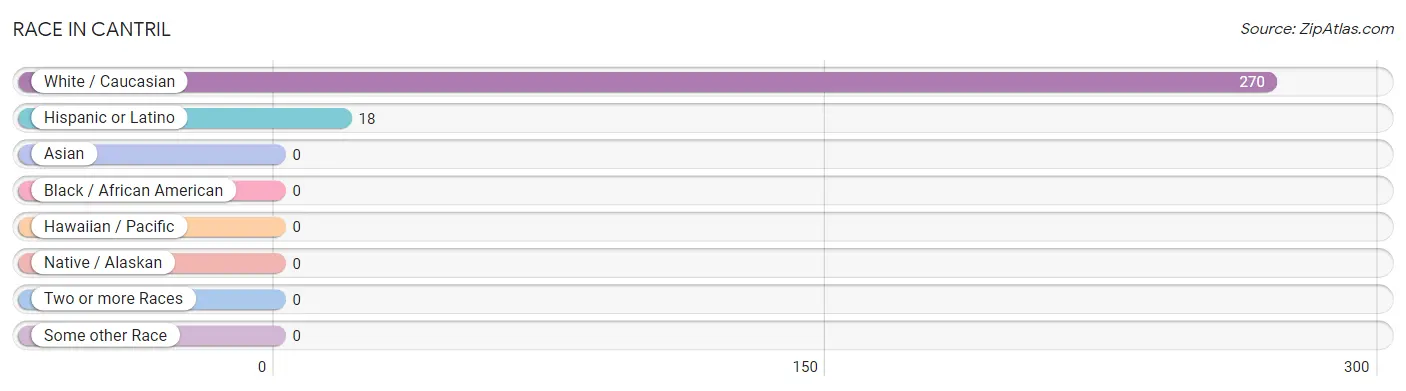
| Race | # Population | % Population |
| Asian | 0 | 0.0% |
| Black / African American | 0 | 0.0% |
| Hawaiian / Pacific | 0 | 0.0% |
| Hispanic or Latino | 18 | 6.7% |
| Native / Alaskan | 0 | 0.0% |
| White / Caucasian | 270 | 100.0% |
| Two or more Races | 0 | 0.0% |
| Some other Race | 0 | 0.0% |
| Total | 270 | 100.0% |
Ancestry in Cantril
The most populous ancestries reported in Cantril are German (49 | 18.1%), French (31 | 11.5%), English (27 | 10.0%), Dutch (17 | 6.3%), and European (14 | 5.2%), together accounting for 51.1% of all Cantril residents.
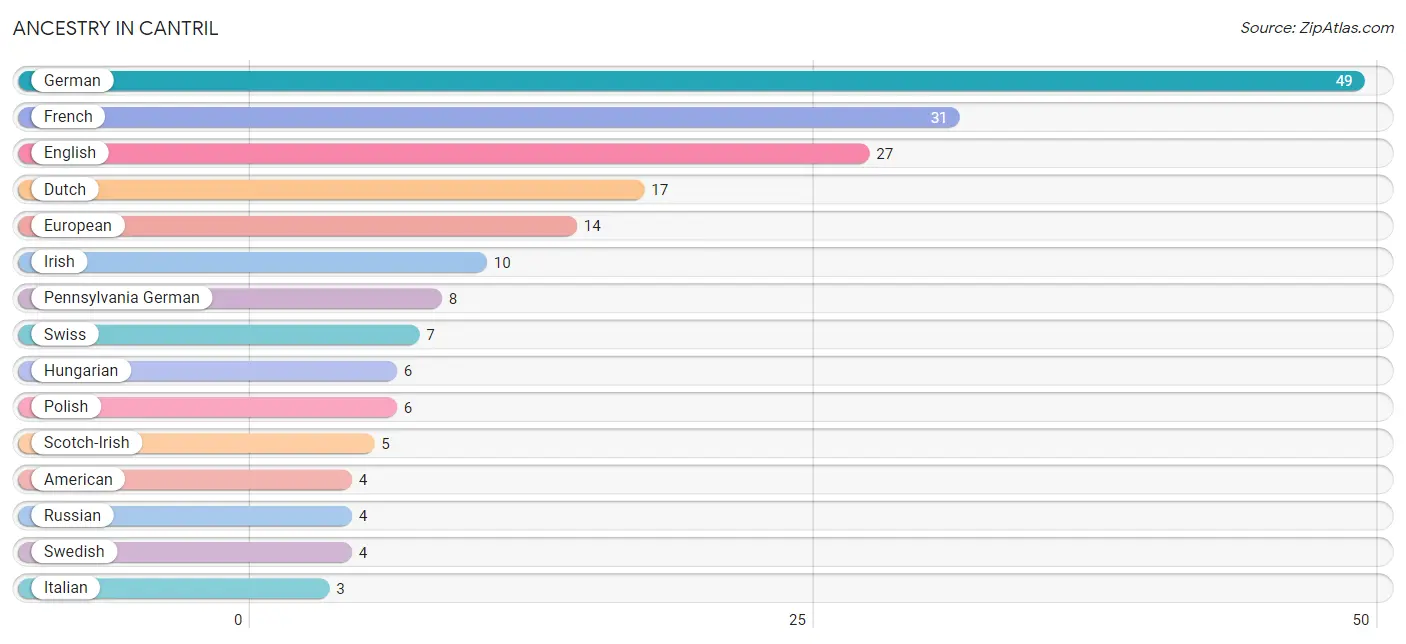
| Ancestry | # Population | % Population |
| American | 4 | 1.5% |
| Dutch | 17 | 6.3% |
| English | 27 | 10.0% |
| European | 14 | 5.2% |
| French | 31 | 11.5% |
| German | 49 | 18.1% |
| Hungarian | 6 | 2.2% |
| Irish | 10 | 3.7% |
| Italian | 3 | 1.1% |
| Lithuanian | 2 | 0.7% |
| Norwegian | 2 | 0.7% |
| Pennsylvania German | 8 | 3.0% |
| Polish | 6 | 2.2% |
| Russian | 4 | 1.5% |
| Scandinavian | 3 | 1.1% |
| Scotch-Irish | 5 | 1.8% |
| Swedish | 4 | 1.5% |
| Swiss | 7 | 2.6% | View All 18 Rows |
Immigrants in Cantril
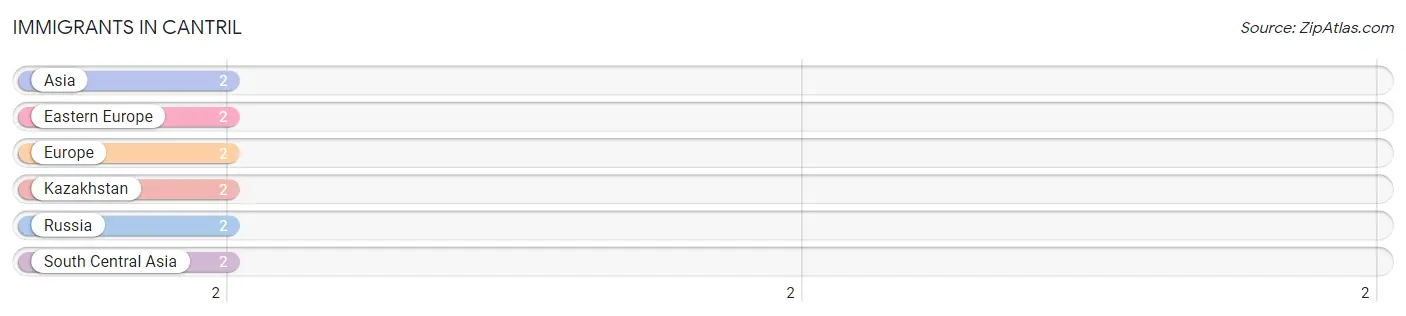
The most numerous immigrant groups reported in Cantril came from Asia (2 | 0.7%), Eastern Europe (2 | 0.7%), Europe (2 | 0.7%), Kazakhstan (2 | 0.7%), and Russia (2 | 0.7%), together accounting for 3.7% of all Cantril residents.
| Immigration Origin | # Population | % Population |
| Asia | 2 | 0.7% |
| Eastern Europe | 2 | 0.7% |
| Europe | 2 | 0.7% |
| Kazakhstan | 2 | 0.7% |
| Russia | 2 | 0.7% |
| South Central Asia | 2 | 0.7% | View All 6 Rows |
Sex and Age in Cantril
Sex and Age in Cantril
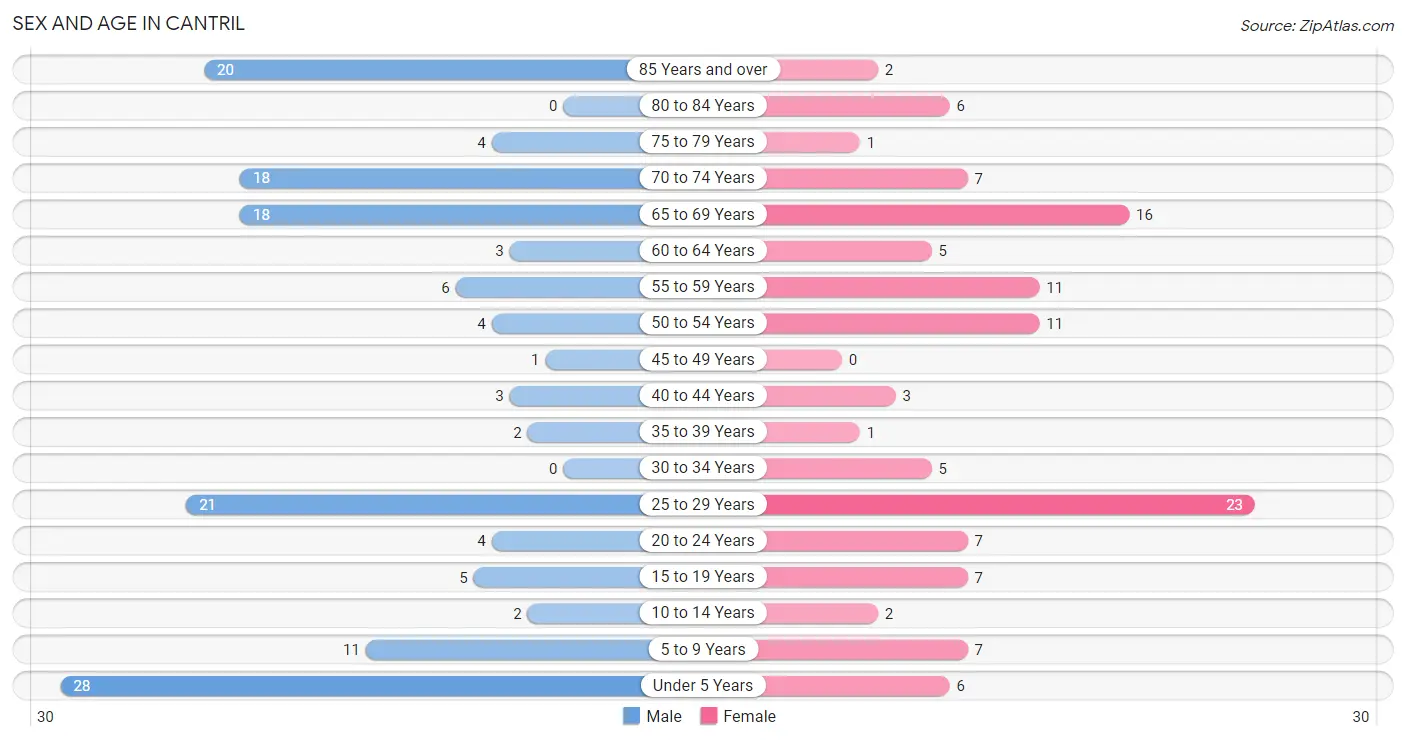
The most populous age groups in Cantril are Under 5 Years (28 | 18.7%) for men and 25 to 29 Years (23 | 19.2%) for women.
| Age Bracket | Male | Female |
| Under 5 Years | 28 (18.7%) | 6 (5.0%) |
| 5 to 9 Years | 11 (7.3%) | 7 (5.8%) |
| 10 to 14 Years | 2 (1.3%) | 2 (1.7%) |
| 15 to 19 Years | 5 (3.3%) | 7 (5.8%) |
| 20 to 24 Years | 4 (2.7%) | 7 (5.8%) |
| 25 to 29 Years | 21 (14.0%) | 23 (19.2%) |
| 30 to 34 Years | 0 (0.0%) | 5 (4.2%) |
| 35 to 39 Years | 2 (1.3%) | 1 (0.8%) |
| 40 to 44 Years | 3 (2.0%) | 3 (2.5%) |
| 45 to 49 Years | 1 (0.7%) | 0 (0.0%) |
| 50 to 54 Years | 4 (2.7%) | 11 (9.2%) |
| 55 to 59 Years | 6 (4.0%) | 11 (9.2%) |
| 60 to 64 Years | 3 (2.0%) | 5 (4.2%) |
| 65 to 69 Years | 18 (12.0%) | 16 (13.3%) |
| 70 to 74 Years | 18 (12.0%) | 7 (5.8%) |
| 75 to 79 Years | 4 (2.7%) | 1 (0.8%) |
| 80 to 84 Years | 0 (0.0%) | 6 (5.0%) |
| 85 Years and over | 20 (13.3%) | 2 (1.7%) |
| Total | 150 (100.0%) | 120 (100.0%) |
Families and Households in Cantril
Median Family Size in Cantril
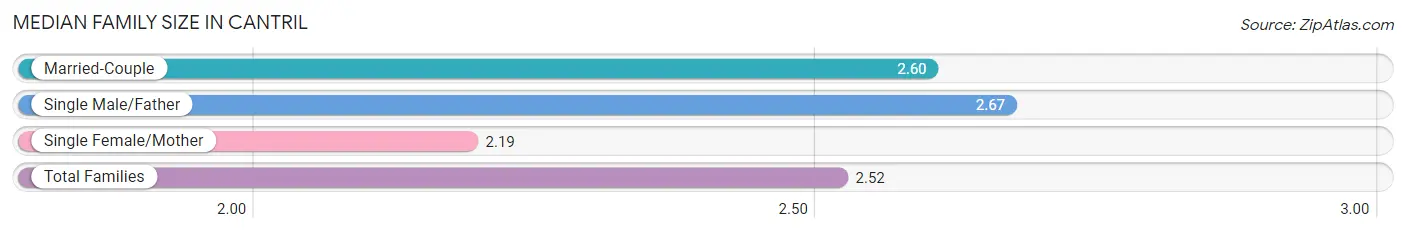
The median family size in Cantril is 2.52 persons per family, with single male/father families (3 | 3.7%) accounting for the largest median family size of 2.67 persons per family. On the other hand, single female/mother families (16 | 19.8%) represent the smallest median family size with 2.19 persons per family.
| Family Type | # Families | Family Size |
| Married-Couple | 62 (76.5%) | 2.60 |
| Single Male/Father | 3 (3.7%) | 2.67 |
| Single Female/Mother | 16 (19.8%) | 2.19 |
| Total Families | 81 (100.0%) | 2.52 |
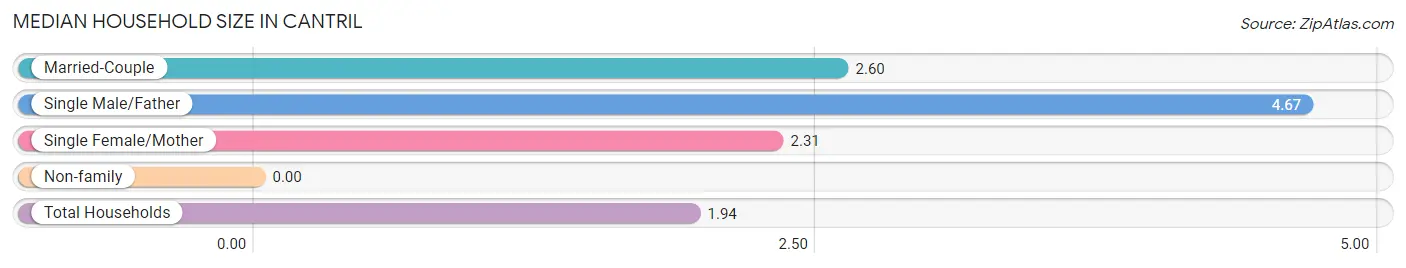
Median Household Size in Cantril
| Household Type | # Households | Household Size |
| Married-Couple | 62 (44.6%) | 2.60 |
| Single Male/Father | 3 (2.2%) | 4.67 |
| Single Female/Mother | 16 (11.5%) | 2.31 |
| Non-family | 58 (41.7%) | - |
| Total Households | 139 (100.0%) | 1.94 |
Household Size by Marriage Status in Cantril
Out of a total of 139 households in Cantril, 81 (58.3%) are family households, while 58 (41.7%) are nonfamily households. The most numerous type of family households are 2-person households, comprising 52, and the most common type of nonfamily households are 1-person households, comprising 58.
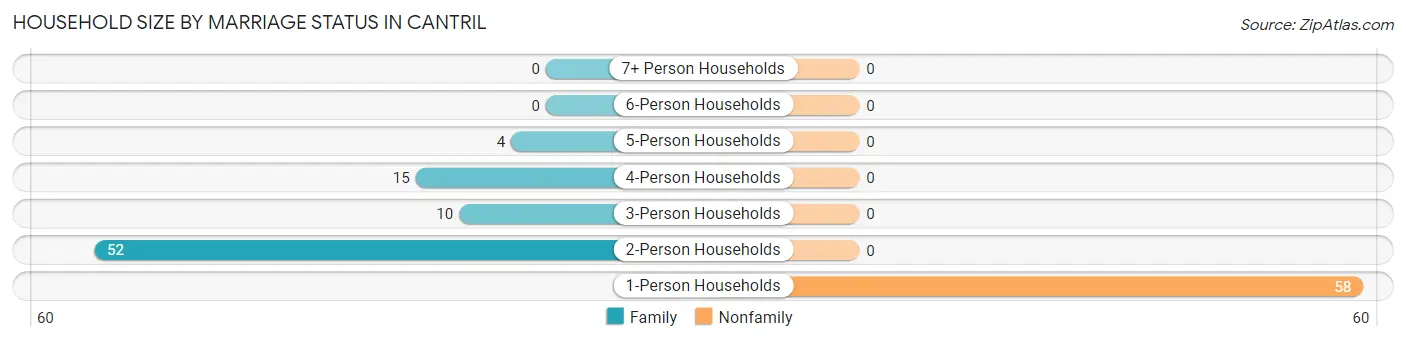
| Household Size | Family Households | Nonfamily Households |
| 1-Person Households | - | 58 (41.7%) |
| 2-Person Households | 52 (37.4%) | 0 (0.0%) |
| 3-Person Households | 10 (7.2%) | 0 (0.0%) |
| 4-Person Households | 15 (10.8%) | 0 (0.0%) |
| 5-Person Households | 4 (2.9%) | 0 (0.0%) |
| 6-Person Households | 0 (0.0%) | 0 (0.0%) |
| 7+ Person Households | 0 (0.0%) | 0 (0.0%) |
| Total | 81 (58.3%) | 58 (41.7%) |
Female Fertility in Cantril
Fertility by Age in Cantril
Average fertility rate in Cantril is 60.0 births per 1,000 women. Women in the age bracket of 35 to 50 years have the highest fertility rate with 125.0 births per 1,000 women. Women in the age bracket of 20 to 34 years acount for 66.7% of all women with births.
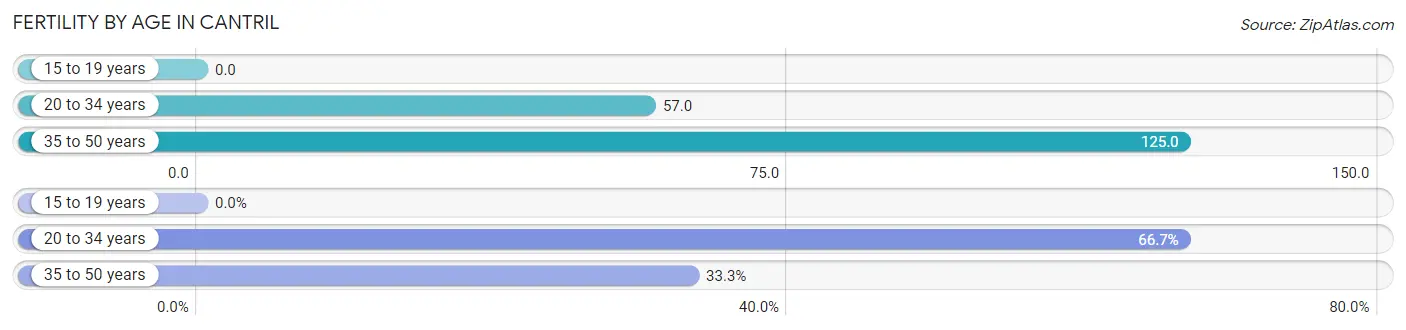
| Age Bracket | Women with Births | Births / 1,000 Women |
| 15 to 19 years | 0 (0.0%) | 0.0 |
| 20 to 34 years | 2 (66.7%) | 57.0 |
| 35 to 50 years | 1 (33.3%) | 125.0 |
| Total | 3 (100.0%) | 60.0 |
Fertility by Age by Marriage Status in Cantril
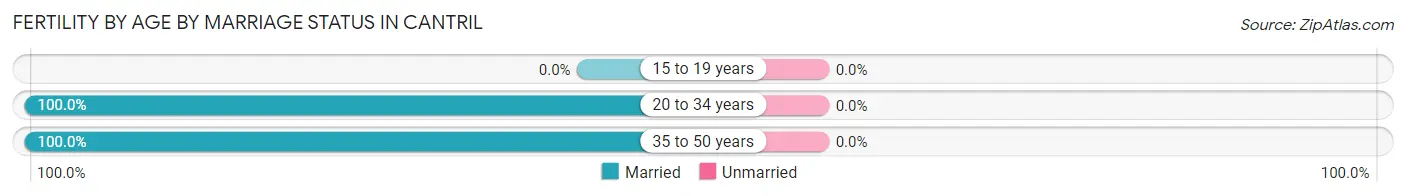
| Age Bracket | Married | Unmarried |
| 15 to 19 years | 0 (0.0%) | 0 (0.0%) |
| 20 to 34 years | 2 (100.0%) | 0 (0.0%) |
| 35 to 50 years | 1 (100.0%) | 0 (0.0%) |
| Total | 3 (100.0%) | 0 (0.0%) |
Fertility by Education in Cantril
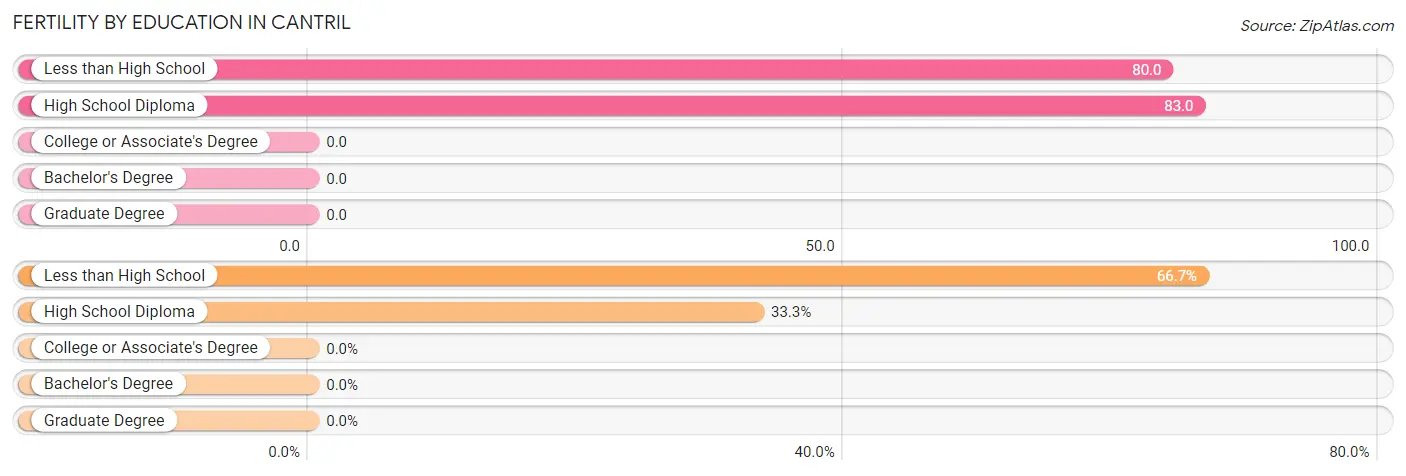
| Educational Attainment | Women with Births | Births / 1,000 Women |
| Less than High School | 2 (66.7%) | 80.0 |
| High School Diploma | 1 (33.3%) | 83.0 |
| College or Associate's Degree | 0 (0.0%) | 0.0 |
| Bachelor's Degree | 0 (0.0%) | 0.0 |
| Graduate Degree | 0 (0.0%) | 0.0 |
| Total | 3 (100.0%) | 60.0 |
Fertility by Education by Marriage Status in Cantril
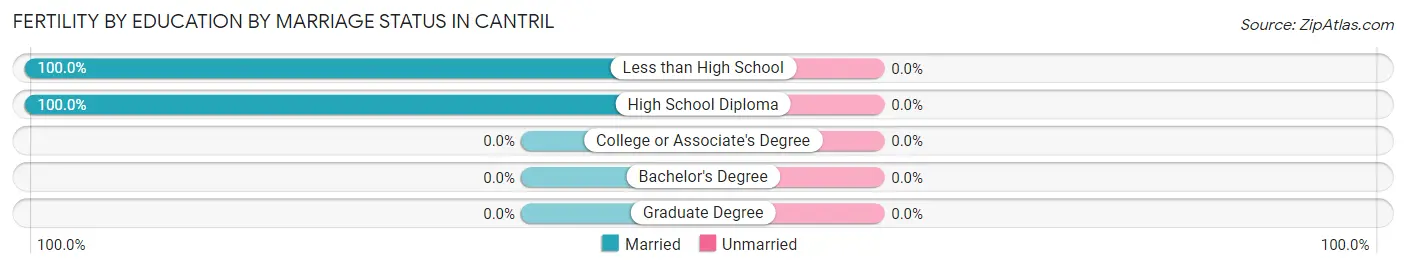
| Educational Attainment | Married | Unmarried |
| Less than High School | 2 (100.0%) | 0 (0.0%) |
| High School Diploma | 1 (100.0%) | 0 (0.0%) |
| College or Associate's Degree | 0 (0.0%) | 0 (0.0%) |
| Bachelor's Degree | 0 (0.0%) | 0 (0.0%) |
| Graduate Degree | 0 (0.0%) | 0 (0.0%) |
| Total | 3 (100.0%) | 0 (0.0%) |
Employment Characteristics in Cantril
Employment by Class of Employer in Cantril
Among the 107 employed individuals in Cantril, private company employees (87 | 81.3%), self-employed (not incorporated) (13 | 12.1%), and local government employees (4 | 3.7%) make up the most common classes of employment.
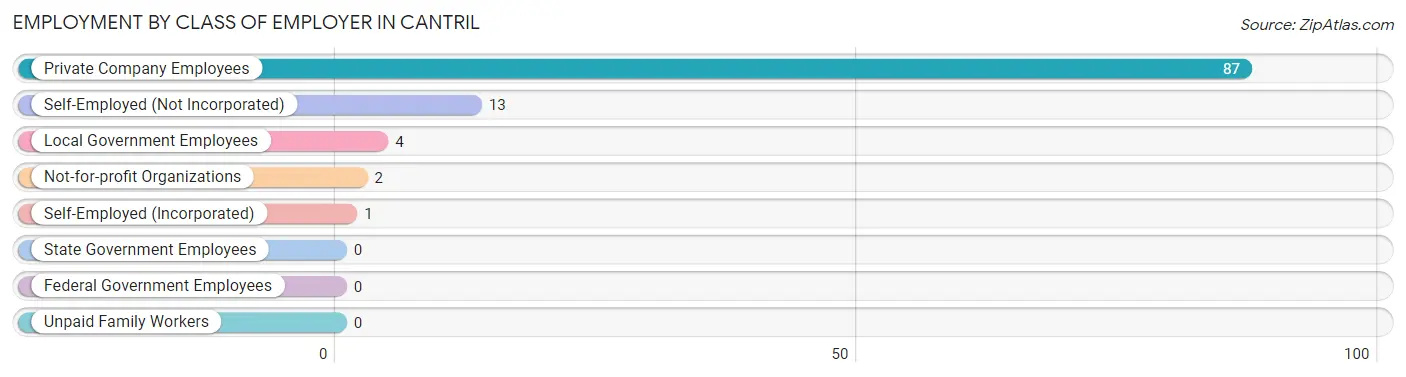
| Employer Class | # Employees | % Employees |
| Private Company Employees | 87 | 81.3% |
| Self-Employed (Incorporated) | 1 | 0.9% |
| Self-Employed (Not Incorporated) | 13 | 12.1% |
| Not-for-profit Organizations | 2 | 1.9% |
| Local Government Employees | 4 | 3.7% |
| State Government Employees | 0 | 0.0% |
| Federal Government Employees | 0 | 0.0% |
| Unpaid Family Workers | 0 | 0.0% |
| Total | 107 | 100.0% |
Employment Status by Age in Cantril
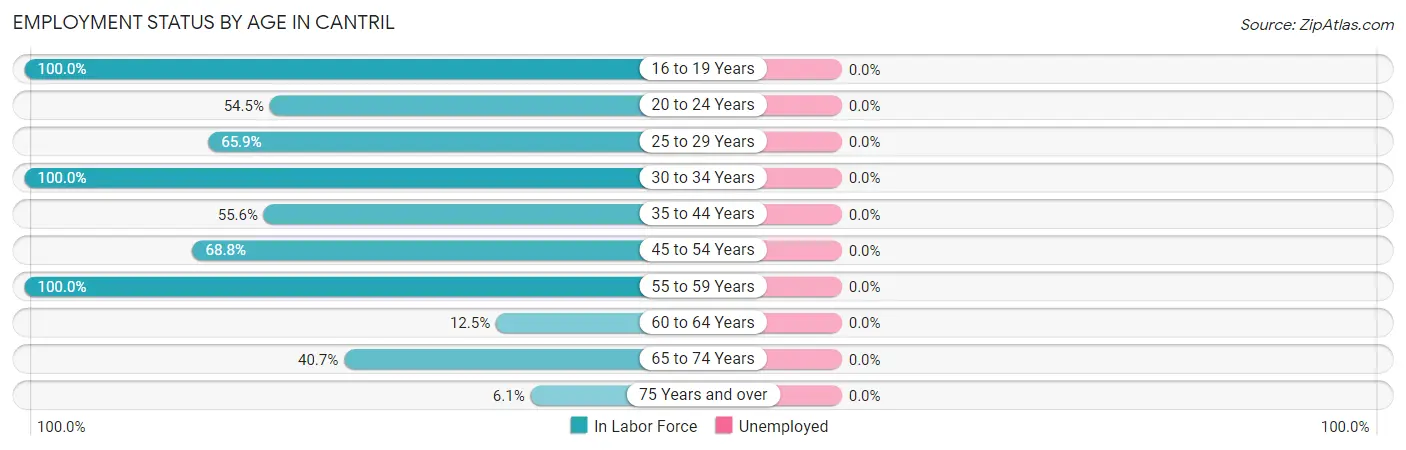
| Age Bracket | In Labor Force | Unemployed |
| 16 to 19 Years | 7 (100.0%) | 0 (0.0%) |
| 20 to 24 Years | 6 (54.5%) | 0 (0.0%) |
| 25 to 29 Years | 29 (65.9%) | 0 (0.0%) |
| 30 to 34 Years | 5 (100.0%) | 0 (0.0%) |
| 35 to 44 Years | 5 (55.6%) | 0 (0.0%) |
| 45 to 54 Years | 11 (68.8%) | 0 (0.0%) |
| 55 to 59 Years | 17 (100.0%) | 0 (0.0%) |
| 60 to 64 Years | 1 (12.5%) | 0 (0.0%) |
| 65 to 74 Years | 24 (40.7%) | 0 (0.0%) |
| 75 Years and over | 2 (6.1%) | 0 (0.0%) |
| Total | 107 (51.2%) | 0 (0.0%) |
Employment Status by Educational Attainment in Cantril
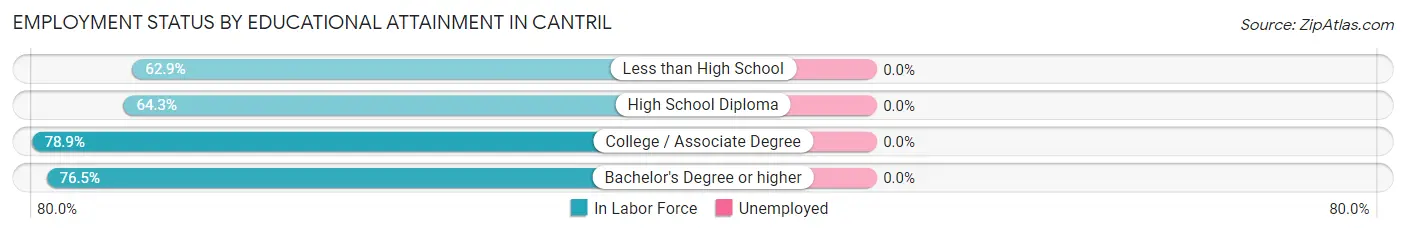
| Educational Attainment | In Labor Force | Unemployed |
| Less than High School | 22 (62.9%) | 0 (0.0%) |
| High School Diploma | 18 (64.3%) | 0 (0.0%) |
| College / Associate Degree | 15 (78.9%) | 0 (0.0%) |
| Bachelor's Degree or higher | 13 (76.5%) | 0 (0.0%) |
| Total | 68 (68.7%) | 0 (0.0%) |
Employment Occupations by Sex in Cantril
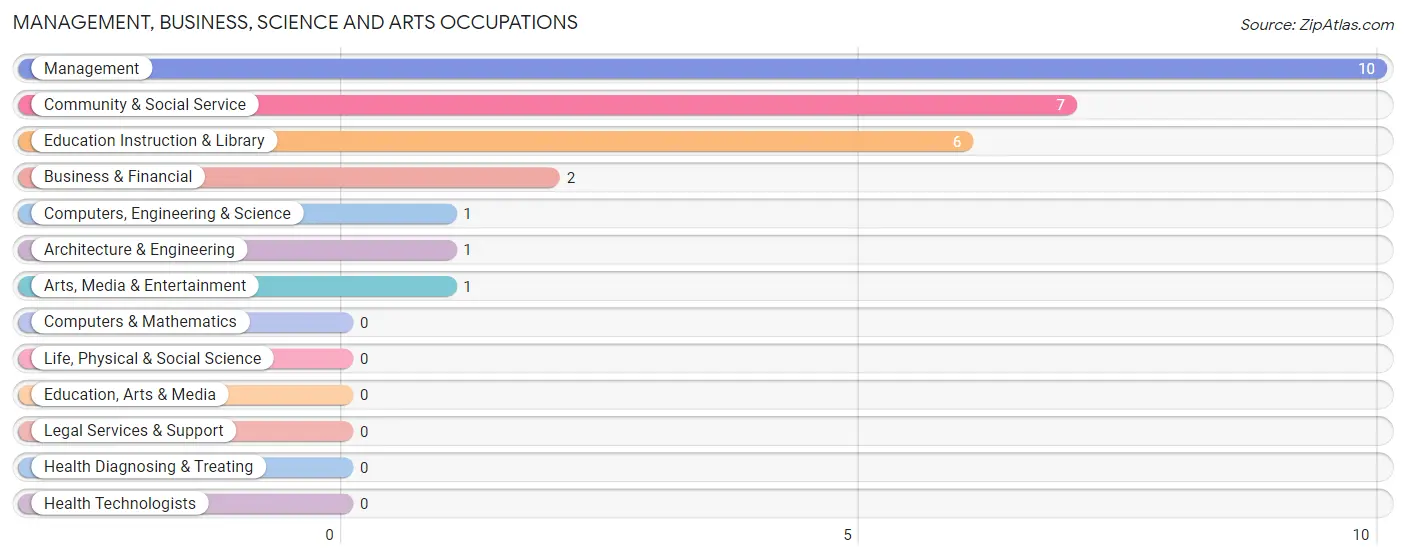
Management, Business, Science and Arts Occupations
The most common Management, Business, Science and Arts occupations in Cantril are Management (10 | 9.3%), Community & Social Service (7 | 6.5%), Education Instruction & Library (6 | 5.6%), Business & Financial (2 | 1.9%), and Computers, Engineering & Science (1 | 0.9%).
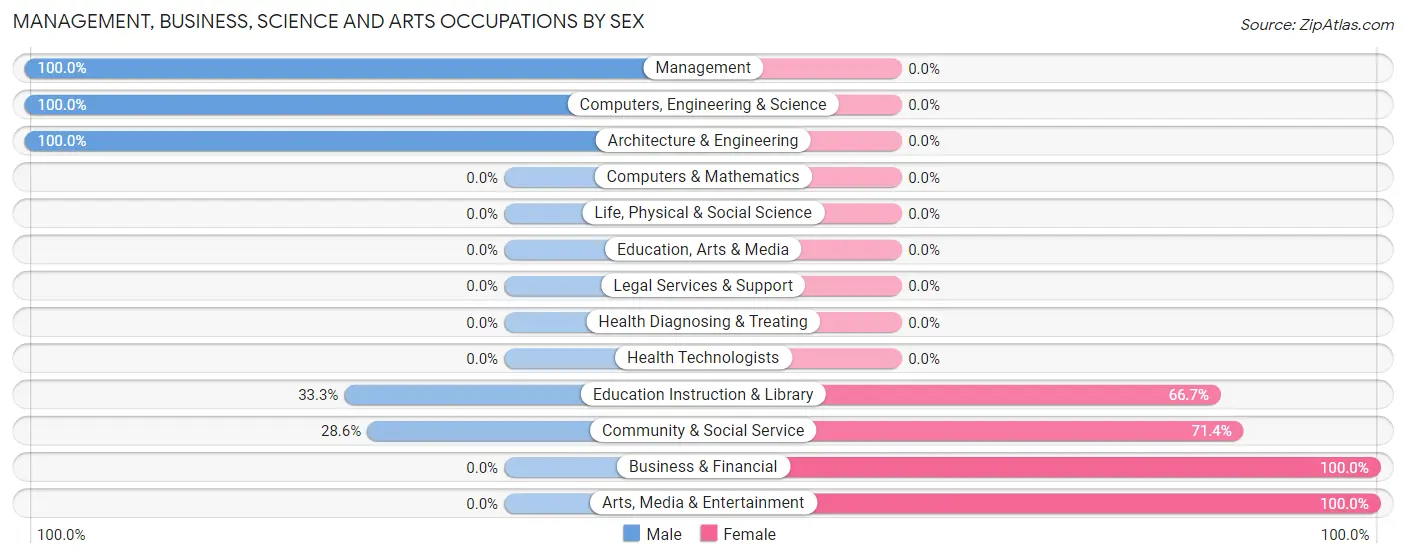
Management, Business, Science and Arts Occupations by Sex
Within the Management, Business, Science and Arts occupations in Cantril, the most male-oriented occupations are Management (100.0%), Computers, Engineering & Science (100.0%), and Architecture & Engineering (100.0%), while the most female-oriented occupations are Business & Financial (100.0%), Arts, Media & Entertainment (100.0%), and Community & Social Service (71.4%).
| Occupation | Male | Female |
| Management | 10 (100.0%) | 0 (0.0%) |
| Business & Financial | 0 (0.0%) | 2 (100.0%) |
| Computers, Engineering & Science | 1 (100.0%) | 0 (0.0%) |
| Computers & Mathematics | 0 (0.0%) | 0 (0.0%) |
| Architecture & Engineering | 1 (100.0%) | 0 (0.0%) |
| Life, Physical & Social Science | 0 (0.0%) | 0 (0.0%) |
| Community & Social Service | 2 (28.6%) | 5 (71.4%) |
| Education, Arts & Media | 0 (0.0%) | 0 (0.0%) |
| Legal Services & Support | 0 (0.0%) | 0 (0.0%) |
| Education Instruction & Library | 2 (33.3%) | 4 (66.7%) |
| Arts, Media & Entertainment | 0 (0.0%) | 1 (100.0%) |
| Health Diagnosing & Treating | 0 (0.0%) | 0 (0.0%) |
| Health Technologists | 0 (0.0%) | 0 (0.0%) |
| Total (Category) | 13 (65.0%) | 7 (35.0%) |
| Total (Overall) | 60 (56.1%) | 47 (43.9%) |
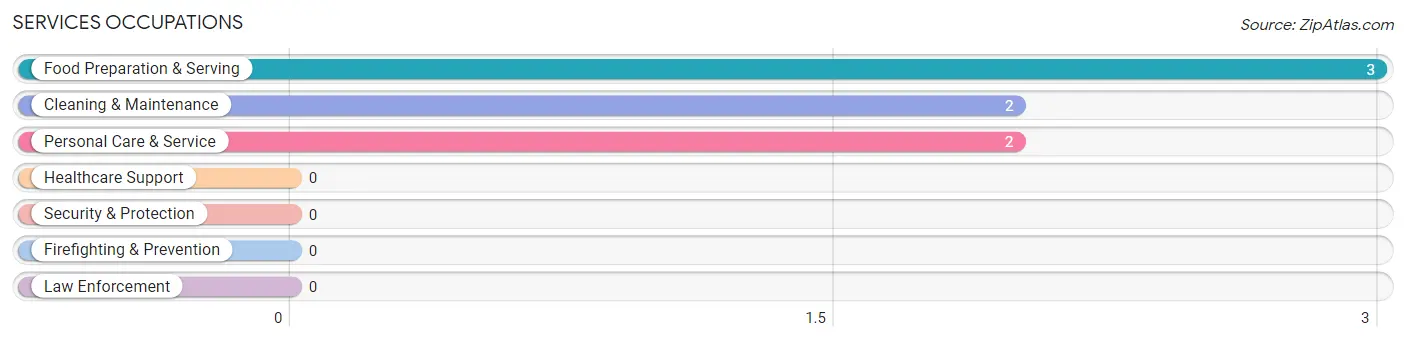
Services Occupations
The most common Services occupations in Cantril are Food Preparation & Serving (3 | 2.8%), Cleaning & Maintenance (2 | 1.9%), and Personal Care & Service (2 | 1.9%).
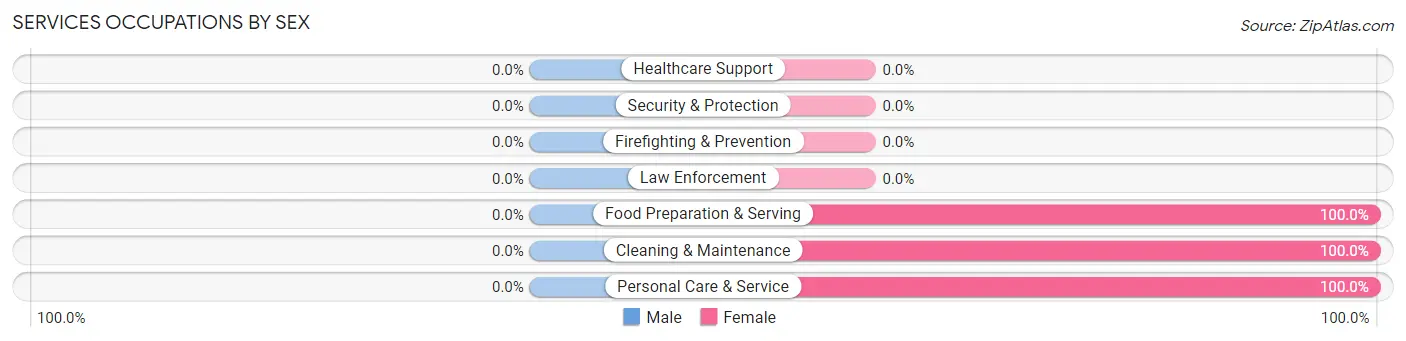
Services Occupations by Sex
| Occupation | Male | Female |
| Healthcare Support | 0 (0.0%) | 0 (0.0%) |
| Security & Protection | 0 (0.0%) | 0 (0.0%) |
| Firefighting & Prevention | 0 (0.0%) | 0 (0.0%) |
| Law Enforcement | 0 (0.0%) | 0 (0.0%) |
| Food Preparation & Serving | 0 (0.0%) | 3 (100.0%) |
| Cleaning & Maintenance | 0 (0.0%) | 2 (100.0%) |
| Personal Care & Service | 0 (0.0%) | 2 (100.0%) |
| Total (Category) | 0 (0.0%) | 7 (100.0%) |
| Total (Overall) | 60 (56.1%) | 47 (43.9%) |
Sales and Office Occupations
The most common Sales and Office occupations in Cantril are Office & Administration (26 | 24.3%), and Sales & Related (12 | 11.2%).
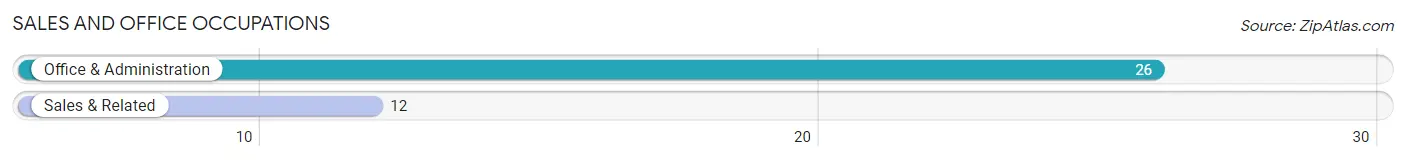
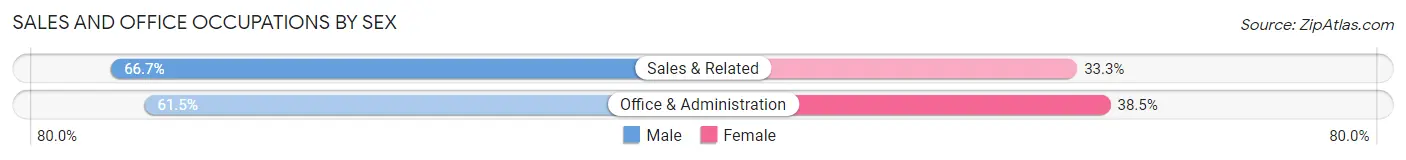
Sales and Office Occupations by Sex
| Occupation | Male | Female |
| Sales & Related | 8 (66.7%) | 4 (33.3%) |
| Office & Administration | 16 (61.5%) | 10 (38.5%) |
| Total (Category) | 24 (63.2%) | 14 (36.8%) |
| Total (Overall) | 60 (56.1%) | 47 (43.9%) |
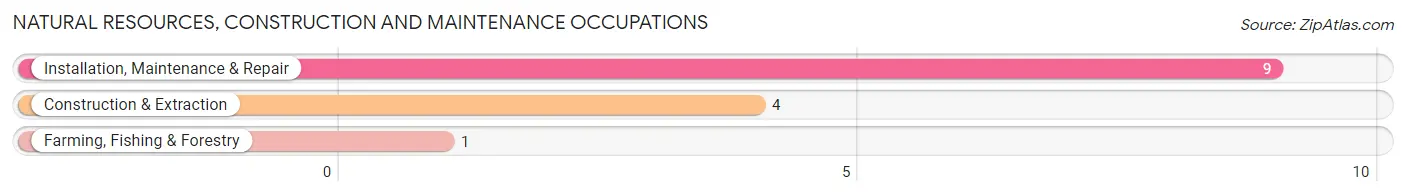
Natural Resources, Construction and Maintenance Occupations
The most common Natural Resources, Construction and Maintenance occupations in Cantril are Installation, Maintenance & Repair (9 | 8.4%), Construction & Extraction (4 | 3.7%), and Farming, Fishing & Forestry (1 | 0.9%).
Natural Resources, Construction and Maintenance Occupations by Sex
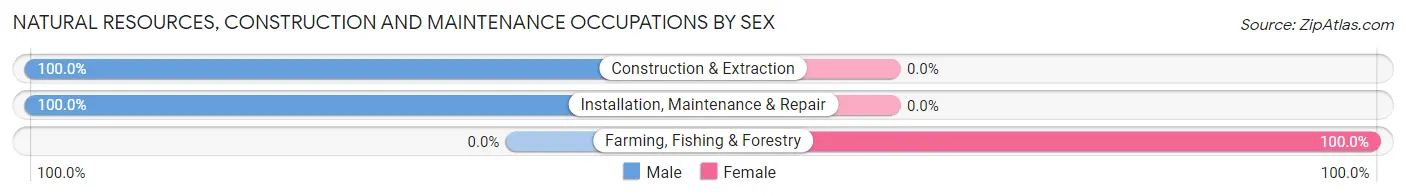
| Occupation | Male | Female |
| Farming, Fishing & Forestry | 0 (0.0%) | 1 (100.0%) |
| Construction & Extraction | 4 (100.0%) | 0 (0.0%) |
| Installation, Maintenance & Repair | 9 (100.0%) | 0 (0.0%) |
| Total (Category) | 13 (92.9%) | 1 (7.1%) |
| Total (Overall) | 60 (56.1%) | 47 (43.9%) |
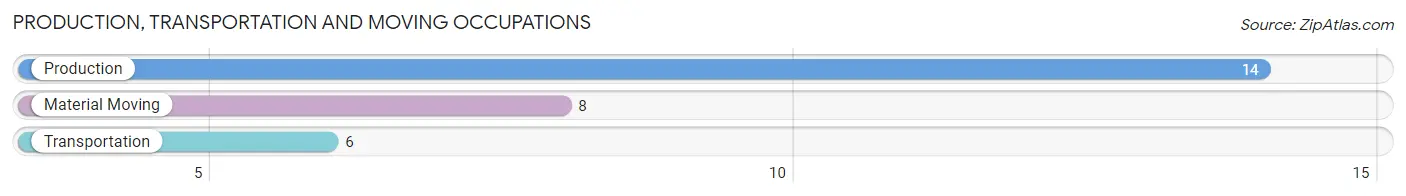
Production, Transportation and Moving Occupations
The most common Production, Transportation and Moving occupations in Cantril are Production (14 | 13.1%), Material Moving (8 | 7.5%), and Transportation (6 | 5.6%).
Production, Transportation and Moving Occupations by Sex
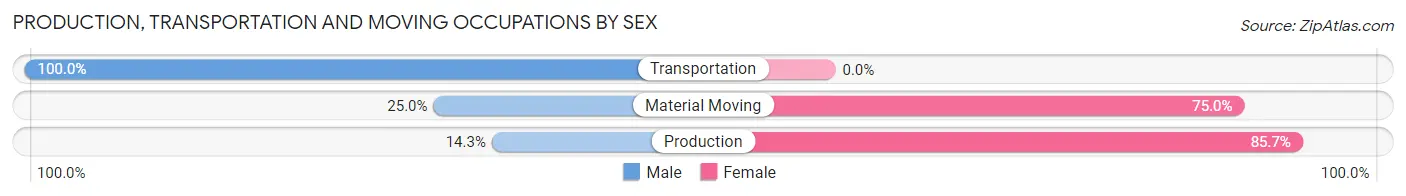
| Occupation | Male | Female |
| Production | 2 (14.3%) | 12 (85.7%) |
| Transportation | 6 (100.0%) | 0 (0.0%) |
| Material Moving | 2 (25.0%) | 6 (75.0%) |
| Total (Category) | 10 (35.7%) | 18 (64.3%) |
| Total (Overall) | 60 (56.1%) | 47 (43.9%) |
Employment Industries by Sex in Cantril
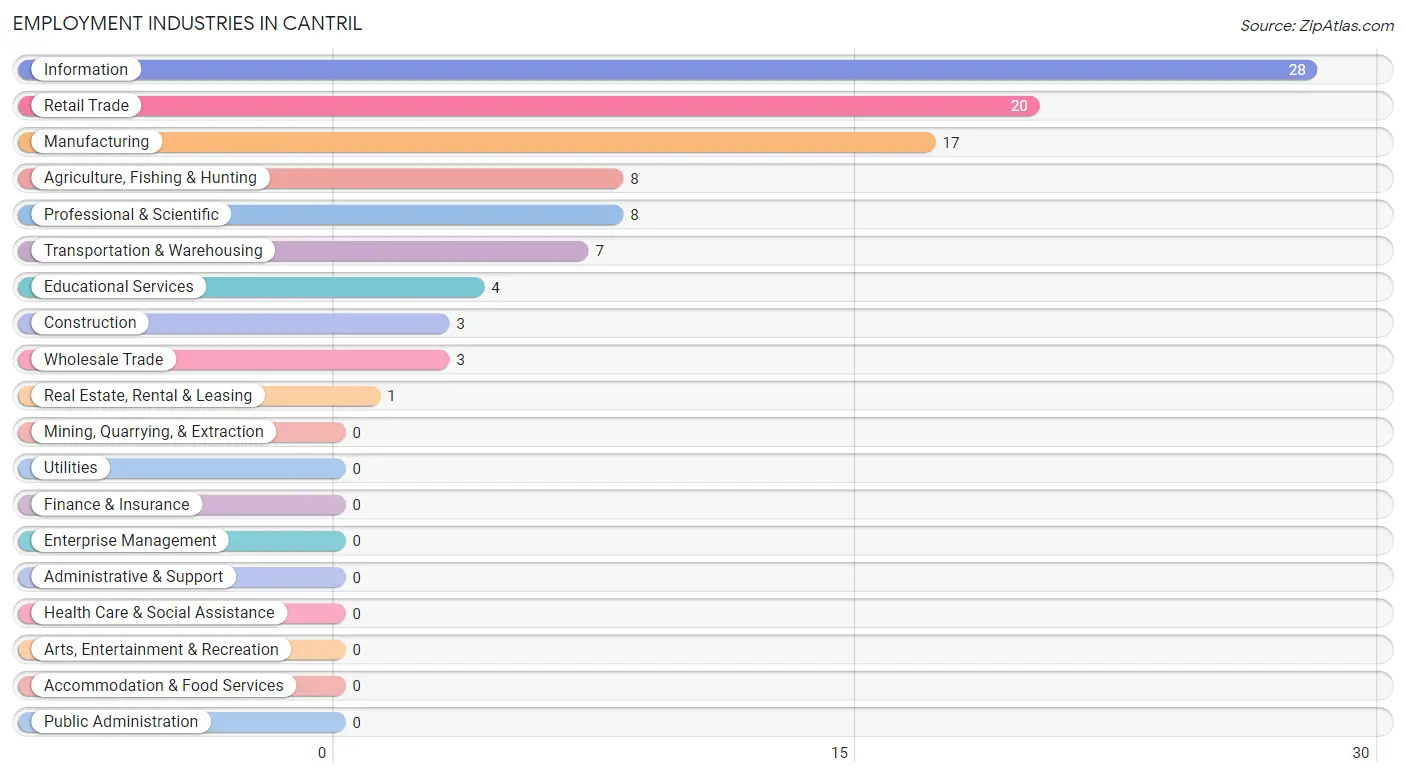
Employment Industries in Cantril
The major employment industries in Cantril include Information (28 | 26.2%), Retail Trade (20 | 18.7%), Manufacturing (17 | 15.9%), Agriculture, Fishing & Hunting (8 | 7.5%), and Professional & Scientific (8 | 7.5%).
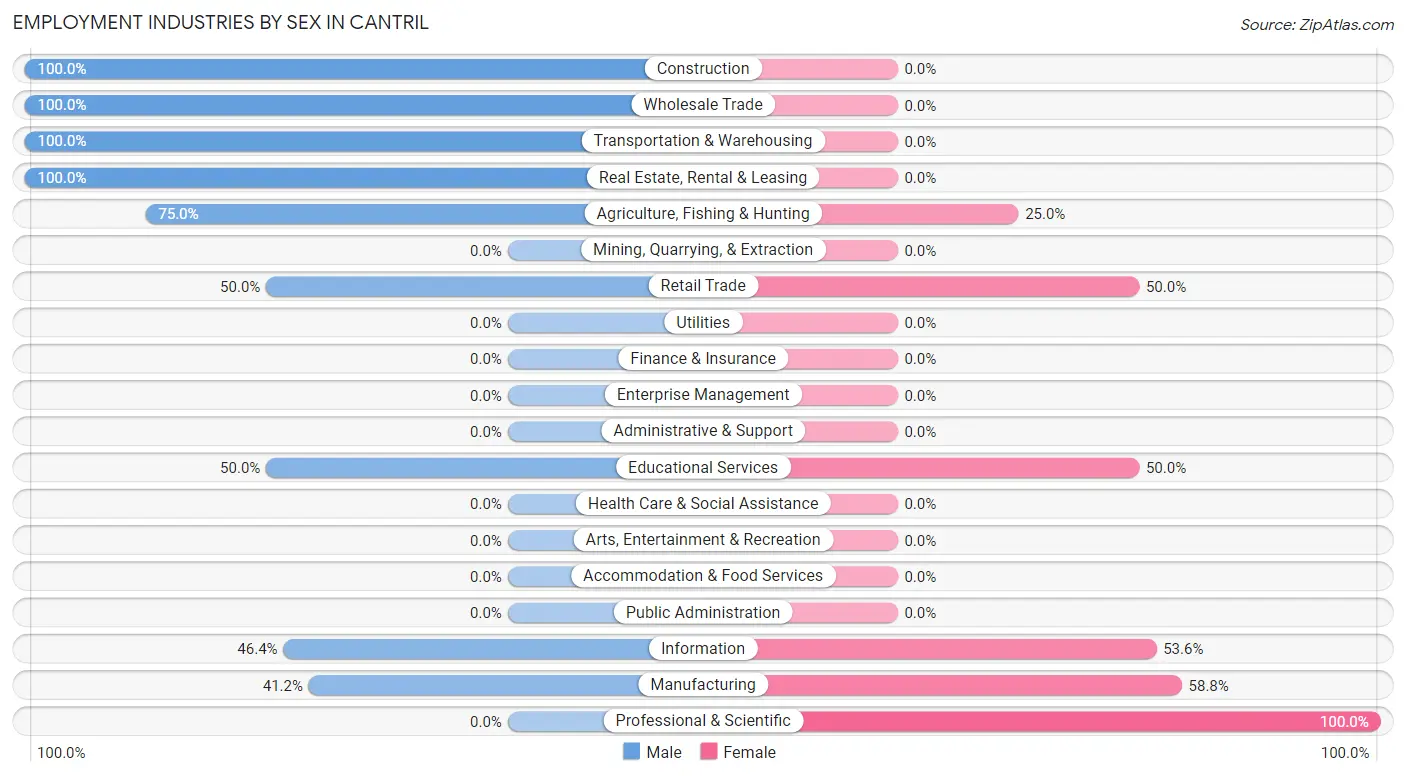
Employment Industries by Sex in Cantril
The Cantril industries that see more men than women are Construction (100.0%), Wholesale Trade (100.0%), and Transportation & Warehousing (100.0%), whereas the industries that tend to have a higher number of women are Professional & Scientific (100.0%), Manufacturing (58.8%), and Information (53.6%).
| Industry | Male | Female |
| Agriculture, Fishing & Hunting | 6 (75.0%) | 2 (25.0%) |
| Mining, Quarrying, & Extraction | 0 (0.0%) | 0 (0.0%) |
| Construction | 3 (100.0%) | 0 (0.0%) |
| Manufacturing | 7 (41.2%) | 10 (58.8%) |
| Wholesale Trade | 3 (100.0%) | 0 (0.0%) |
| Retail Trade | 10 (50.0%) | 10 (50.0%) |
| Transportation & Warehousing | 7 (100.0%) | 0 (0.0%) |
| Utilities | 0 (0.0%) | 0 (0.0%) |
| Information | 13 (46.4%) | 15 (53.6%) |
| Finance & Insurance | 0 (0.0%) | 0 (0.0%) |
| Real Estate, Rental & Leasing | 1 (100.0%) | 0 (0.0%) |
| Professional & Scientific | 0 (0.0%) | 8 (100.0%) |
| Enterprise Management | 0 (0.0%) | 0 (0.0%) |
| Administrative & Support | 0 (0.0%) | 0 (0.0%) |
| Educational Services | 2 (50.0%) | 2 (50.0%) |
| Health Care & Social Assistance | 0 (0.0%) | 0 (0.0%) |
| Arts, Entertainment & Recreation | 0 (0.0%) | 0 (0.0%) |
| Accommodation & Food Services | 0 (0.0%) | 0 (0.0%) |
| Public Administration | 0 (0.0%) | 0 (0.0%) |
| Total | 60 (56.1%) | 47 (43.9%) |
Education in Cantril
School Enrollment in Cantril
The most common levels of schooling among the 21 students in Cantril are elementary school (12 | 57.1%), kindergarten (4 | 19.1%), and middle school (4 | 19.1%).
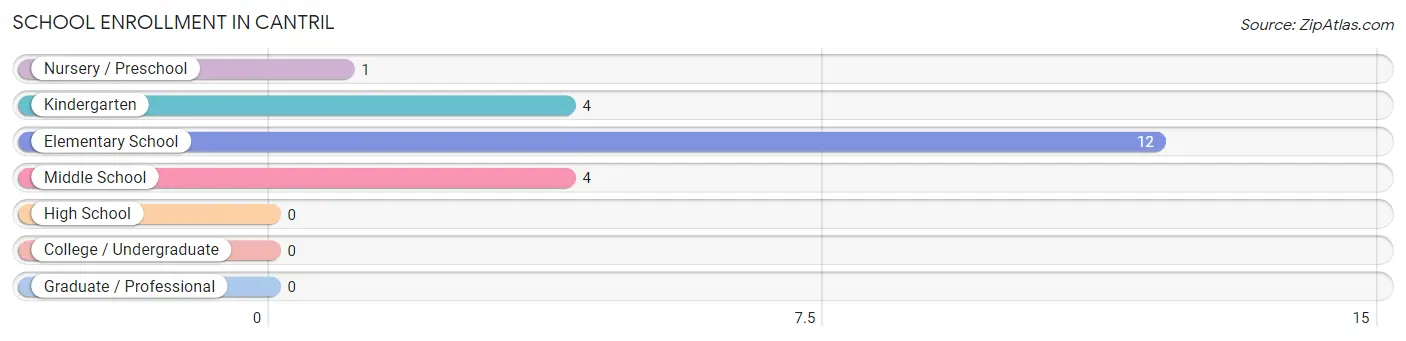
| School Level | # Students | % Students |
| Nursery / Preschool | 1 | 4.8% |
| Kindergarten | 4 | 19.1% |
| Elementary School | 12 | 57.1% |
| Middle School | 4 | 19.1% |
| High School | 0 | 0.0% |
| College / Undergraduate | 0 | 0.0% |
| Graduate / Professional | 0 | 0.0% |
| Total | 21 | 100.0% |
School Enrollment by Age by Funding Source in Cantril
Out of a total of 21 students who are enrolled in schools in Cantril, 2 (9.5%) attend a private institution, while the remaining 19 (90.5%) are enrolled in public schools. The age group of 10 to 14 year olds has the highest likelihood of being enrolled in private schools, with 2 (50.0% in the age bracket) enrolled. Conversely, the age group of 3 to 4 year olds has the lowest likelihood of being enrolled in a private school, with 1 (100.0% in the age bracket) attending a public institution.
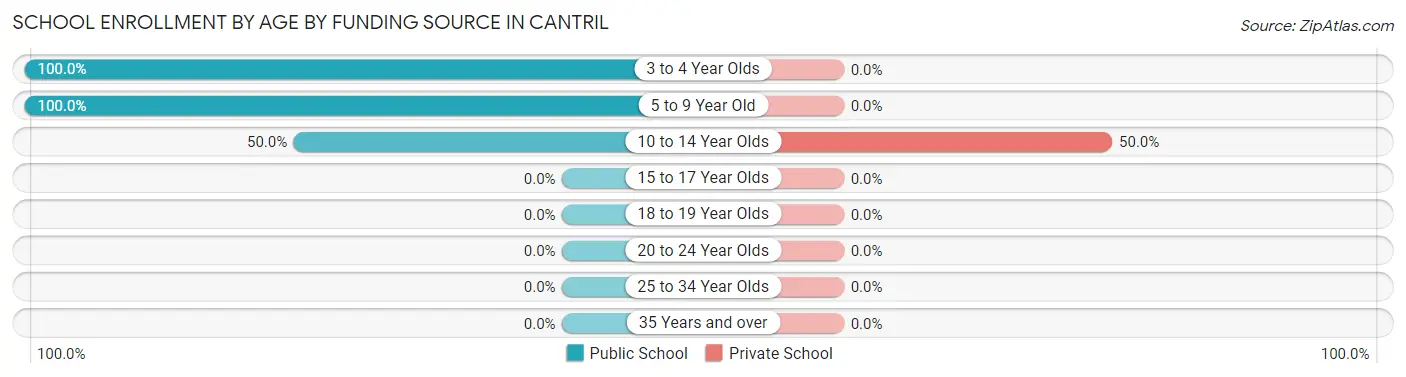
| Age Bracket | Public School | Private School |
| 3 to 4 Year Olds | 1 (100.0%) | 0 (0.0%) |
| 5 to 9 Year Old | 16 (100.0%) | 0 (0.0%) |
| 10 to 14 Year Olds | 2 (50.0%) | 2 (50.0%) |
| 15 to 17 Year Olds | 0 (0.0%) | 0 (0.0%) |
| 18 to 19 Year Olds | 0 (0.0%) | 0 (0.0%) |
| 20 to 24 Year Olds | 0 (0.0%) | 0 (0.0%) |
| 25 to 34 Year Olds | 0 (0.0%) | 0 (0.0%) |
| 35 Years and over | 0 (0.0%) | 0 (0.0%) |
| Total | 19 (90.5%) | 2 (9.5%) |
Educational Attainment by Field of Study in Cantril
Education (19 | 45.2%), bio, nature & agricultural (7 | 16.7%), arts & humanities (7 | 16.7%), business (4 | 9.5%), and psychology (2 | 4.8%) are the most common fields of study among 42 individuals in Cantril who have obtained a bachelor's degree or higher.
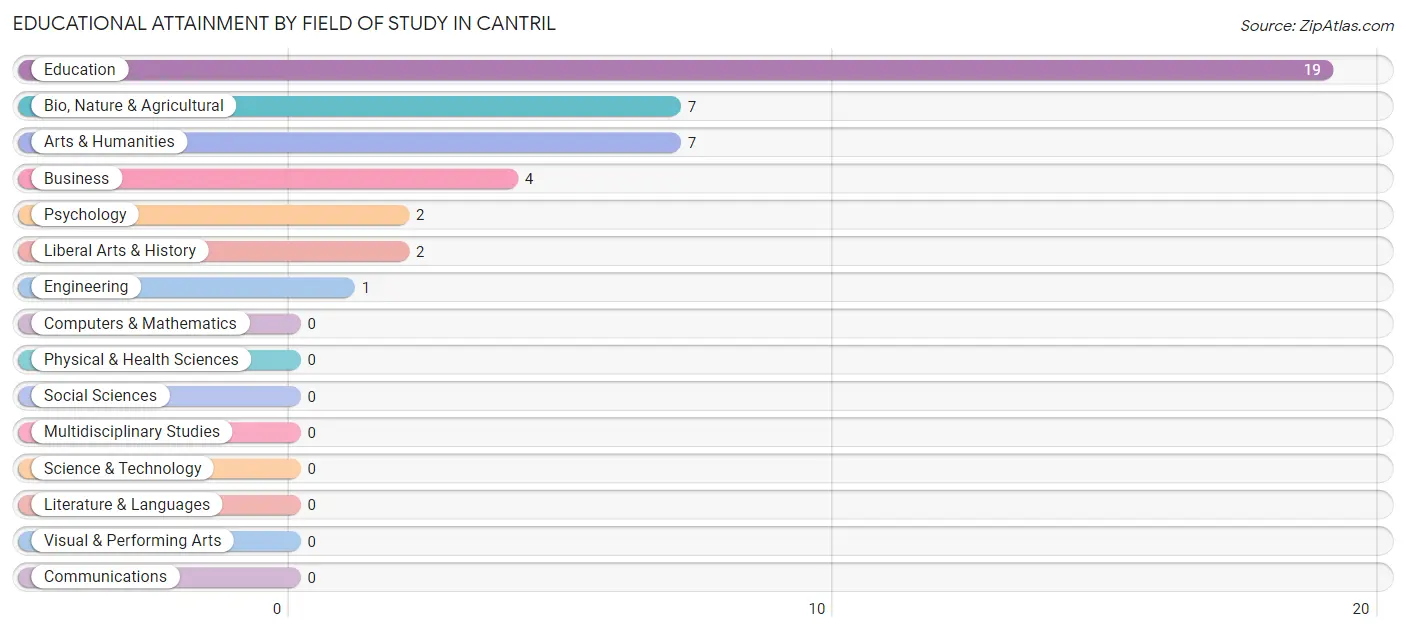
| Field of Study | # Graduates | % Graduates |
| Computers & Mathematics | 0 | 0.0% |
| Bio, Nature & Agricultural | 7 | 16.7% |
| Physical & Health Sciences | 0 | 0.0% |
| Psychology | 2 | 4.8% |
| Social Sciences | 0 | 0.0% |
| Engineering | 1 | 2.4% |
| Multidisciplinary Studies | 0 | 0.0% |
| Science & Technology | 0 | 0.0% |
| Business | 4 | 9.5% |
| Education | 19 | 45.2% |
| Literature & Languages | 0 | 0.0% |
| Liberal Arts & History | 2 | 4.8% |
| Visual & Performing Arts | 0 | 0.0% |
| Communications | 0 | 0.0% |
| Arts & Humanities | 7 | 16.7% |
| Total | 42 | 100.0% |
Transportation & Commute in Cantril
Vehicle Availability by Sex in Cantril
The most prevalent vehicle ownership categories in Cantril are males with 2 vehicles (37, accounting for 61.7%) and females with 2 vehicles (23, making up 78.7%).
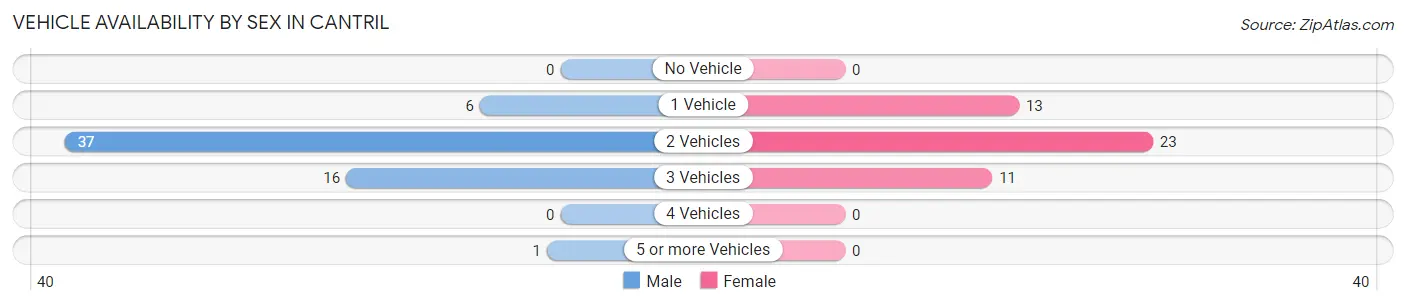
| Vehicles Available | Male | Female |
| No Vehicle | 0 (0.0%) | 0 (0.0%) |
| 1 Vehicle | 6 (10.0%) | 13 (27.7%) |
| 2 Vehicles | 37 (61.7%) | 23 (48.9%) |
| 3 Vehicles | 16 (26.7%) | 11 (23.4%) |
| 4 Vehicles | 0 (0.0%) | 0 (0.0%) |
| 5 or more Vehicles | 1 (1.7%) | 0 (0.0%) |
| Total | 60 (100.0%) | 47 (100.0%) |
Commute Time in Cantril
The most frequently occuring commute durations in Cantril are 20 to 24 minutes (35 commuters, 33.7%), less than 5 minutes (21 commuters, 20.2%), and 5 to 9 minutes (12 commuters, 11.5%).
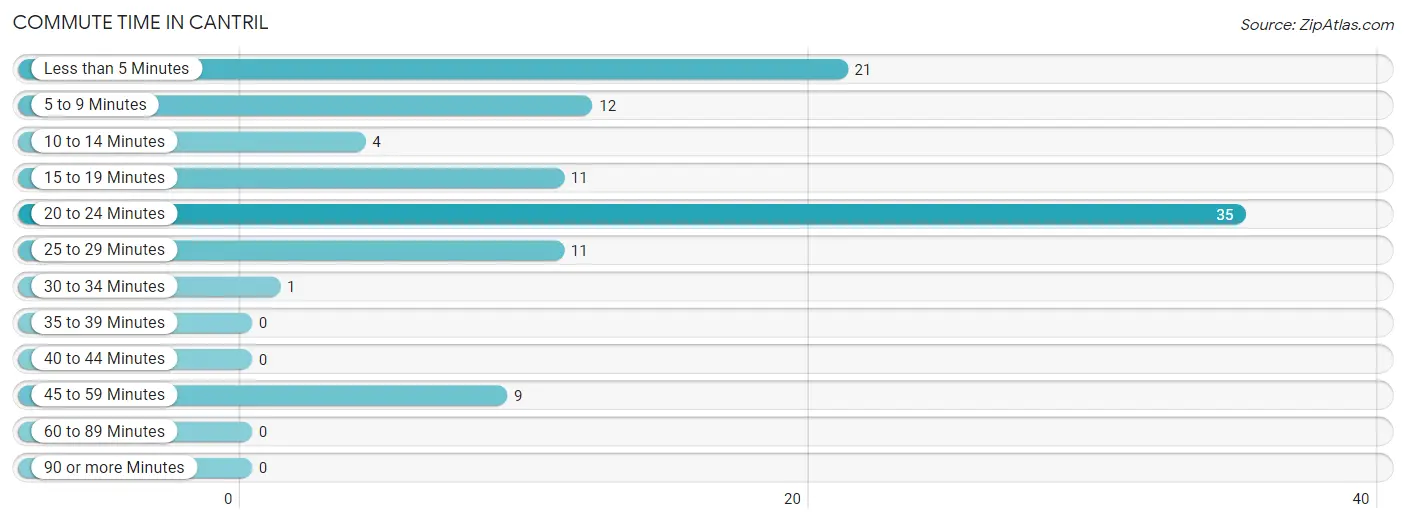
| Commute Time | # Commuters | % Commuters |
| Less than 5 Minutes | 21 | 20.2% |
| 5 to 9 Minutes | 12 | 11.5% |
| 10 to 14 Minutes | 4 | 3.8% |
| 15 to 19 Minutes | 11 | 10.6% |
| 20 to 24 Minutes | 35 | 33.7% |
| 25 to 29 Minutes | 11 | 10.6% |
| 30 to 34 Minutes | 1 | 1.0% |
| 35 to 39 Minutes | 0 | 0.0% |
| 40 to 44 Minutes | 0 | 0.0% |
| 45 to 59 Minutes | 9 | 8.6% |
| 60 to 89 Minutes | 0 | 0.0% |
| 90 or more Minutes | 0 | 0.0% |
Commute Time by Sex in Cantril
The most common commute times in Cantril are 20 to 24 minutes (20 commuters, 33.3%) for males and 20 to 24 minutes (15 commuters, 34.1%) for females.
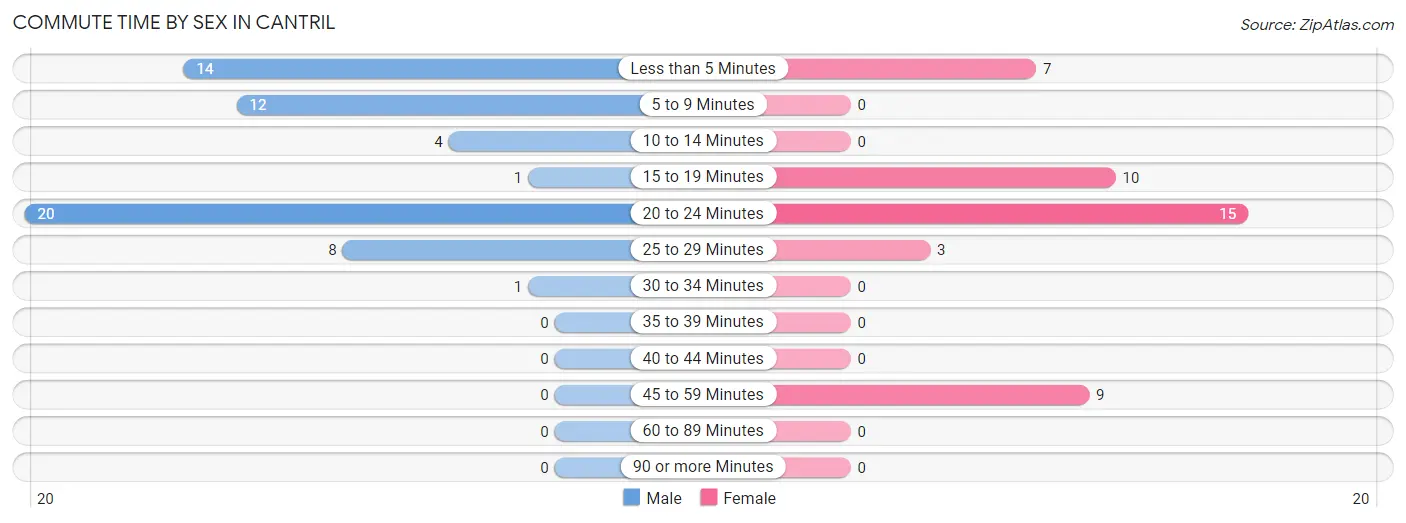
| Commute Time | Male | Female |
| Less than 5 Minutes | 14 (23.3%) | 7 (15.9%) |
| 5 to 9 Minutes | 12 (20.0%) | 0 (0.0%) |
| 10 to 14 Minutes | 4 (6.7%) | 0 (0.0%) |
| 15 to 19 Minutes | 1 (1.7%) | 10 (22.7%) |
| 20 to 24 Minutes | 20 (33.3%) | 15 (34.1%) |
| 25 to 29 Minutes | 8 (13.3%) | 3 (6.8%) |
| 30 to 34 Minutes | 1 (1.7%) | 0 (0.0%) |
| 35 to 39 Minutes | 0 (0.0%) | 0 (0.0%) |
| 40 to 44 Minutes | 0 (0.0%) | 0 (0.0%) |
| 45 to 59 Minutes | 0 (0.0%) | 9 (20.4%) |
| 60 to 89 Minutes | 0 (0.0%) | 0 (0.0%) |
| 90 or more Minutes | 0 (0.0%) | 0 (0.0%) |
Time of Departure to Work by Sex in Cantril
The most frequent times of departure to work in Cantril are 8:00 AM to 8:29 AM (17, 28.3%) for males and 7:30 AM to 7:59 AM (22, 50.0%) for females.
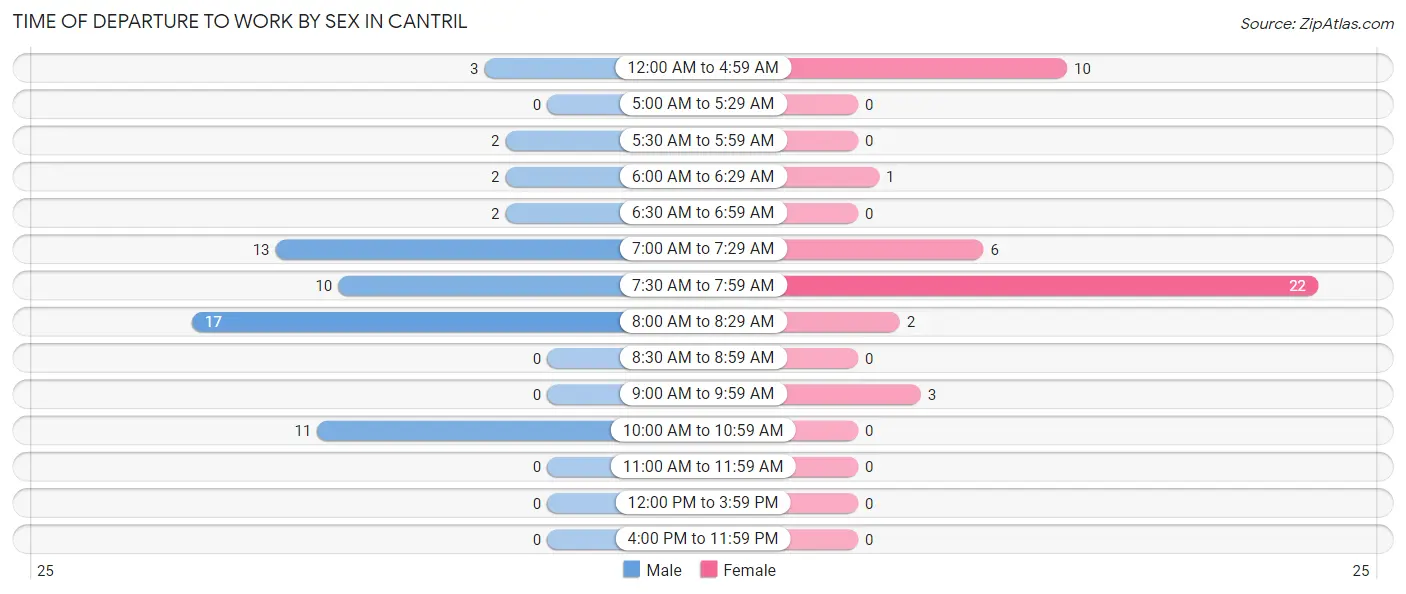
| Time of Departure | Male | Female |
| 12:00 AM to 4:59 AM | 3 (5.0%) | 10 (22.7%) |
| 5:00 AM to 5:29 AM | 0 (0.0%) | 0 (0.0%) |
| 5:30 AM to 5:59 AM | 2 (3.3%) | 0 (0.0%) |
| 6:00 AM to 6:29 AM | 2 (3.3%) | 1 (2.3%) |
| 6:30 AM to 6:59 AM | 2 (3.3%) | 0 (0.0%) |
| 7:00 AM to 7:29 AM | 13 (21.7%) | 6 (13.6%) |
| 7:30 AM to 7:59 AM | 10 (16.7%) | 22 (50.0%) |
| 8:00 AM to 8:29 AM | 17 (28.3%) | 2 (4.5%) |
| 8:30 AM to 8:59 AM | 0 (0.0%) | 0 (0.0%) |
| 9:00 AM to 9:59 AM | 0 (0.0%) | 3 (6.8%) |
| 10:00 AM to 10:59 AM | 11 (18.3%) | 0 (0.0%) |
| 11:00 AM to 11:59 AM | 0 (0.0%) | 0 (0.0%) |
| 12:00 PM to 3:59 PM | 0 (0.0%) | 0 (0.0%) |
| 4:00 PM to 11:59 PM | 0 (0.0%) | 0 (0.0%) |
| Total | 60 (100.0%) | 44 (100.0%) |
Housing Occupancy in Cantril
Occupancy by Ownership in Cantril
Of the total 139 dwellings in Cantril, owner-occupied units account for 113 (81.3%), while renter-occupied units make up 26 (18.7%).
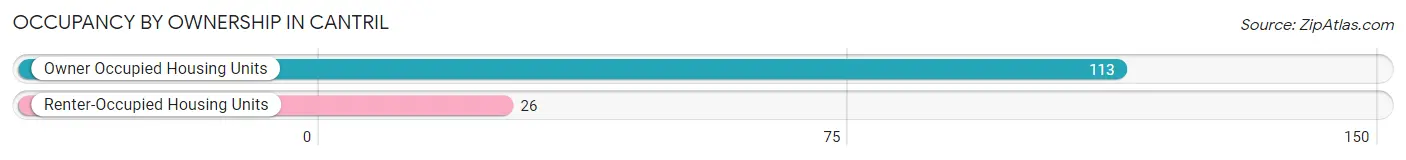
| Occupancy | # Housing Units | % Housing Units |
| Owner Occupied Housing Units | 113 | 81.3% |
| Renter-Occupied Housing Units | 26 | 18.7% |
| Total Occupied Housing Units | 139 | 100.0% |
Occupancy by Household Size in Cantril
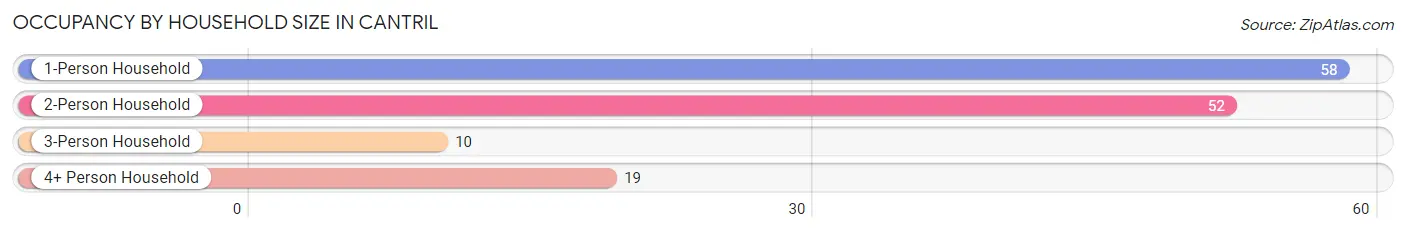
| Household Size | # Housing Units | % Housing Units |
| 1-Person Household | 58 | 41.7% |
| 2-Person Household | 52 | 37.4% |
| 3-Person Household | 10 | 7.2% |
| 4+ Person Household | 19 | 13.7% |
| Total Housing Units | 139 | 100.0% |
Occupancy by Ownership by Household Size in Cantril
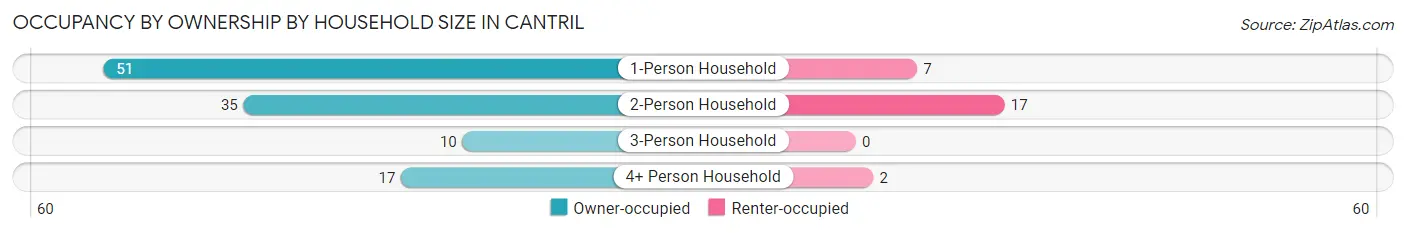
| Household Size | Owner-occupied | Renter-occupied |
| 1-Person Household | 51 (87.9%) | 7 (12.1%) |
| 2-Person Household | 35 (67.3%) | 17 (32.7%) |
| 3-Person Household | 10 (100.0%) | 0 (0.0%) |
| 4+ Person Household | 17 (89.5%) | 2 (10.5%) |
| Total Housing Units | 113 (81.3%) | 26 (18.7%) |
Occupancy by Educational Attainment in Cantril
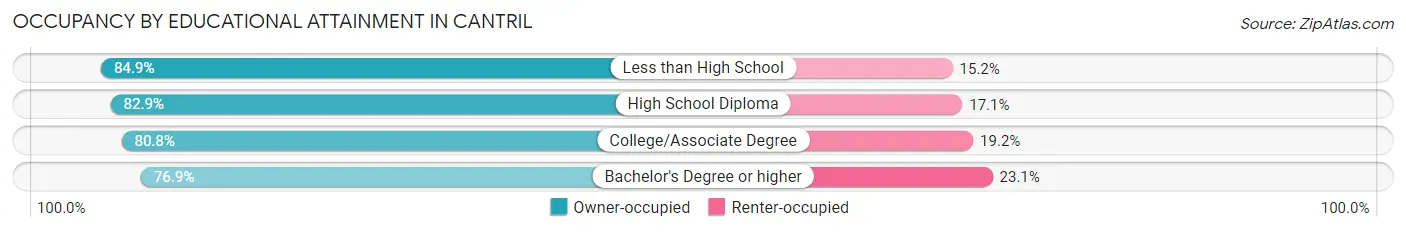
| Household Size | Owner-occupied | Renter-occupied |
| Less than High School | 28 (84.9%) | 5 (15.1%) |
| High School Diploma | 34 (82.9%) | 7 (17.1%) |
| College/Associate Degree | 21 (80.8%) | 5 (19.2%) |
| Bachelor's Degree or higher | 30 (76.9%) | 9 (23.1%) |
Occupancy by Age of Householder in Cantril
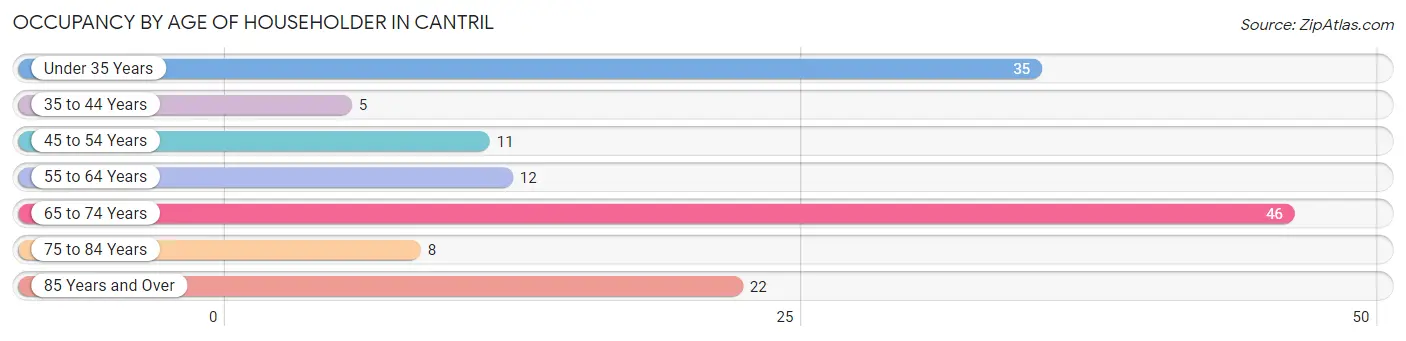
| Age Bracket | # Households | % Households |
| Under 35 Years | 35 | 25.2% |
| 35 to 44 Years | 5 | 3.6% |
| 45 to 54 Years | 11 | 7.9% |
| 55 to 64 Years | 12 | 8.6% |
| 65 to 74 Years | 46 | 33.1% |
| 75 to 84 Years | 8 | 5.8% |
| 85 Years and Over | 22 | 15.8% |
| Total | 139 | 100.0% |
Housing Finances in Cantril
Median Income by Occupancy in Cantril
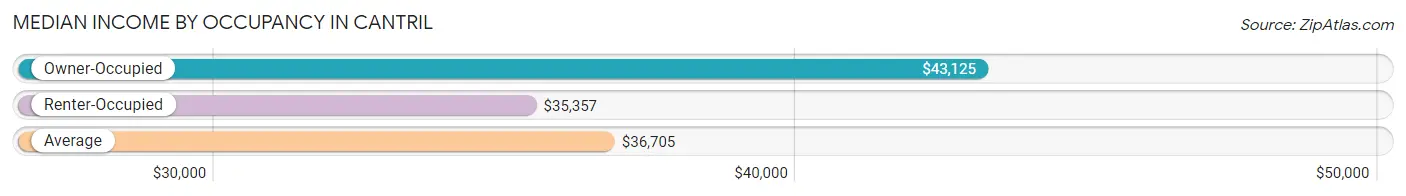
| Occupancy Type | # Households | Median Income |
| Owner-Occupied | 113 (81.3%) | $43,125 |
| Renter-Occupied | 26 (18.7%) | $35,357 |
| Average | 139 (100.0%) | $36,705 |
Occupancy by Householder Income Bracket in Cantril
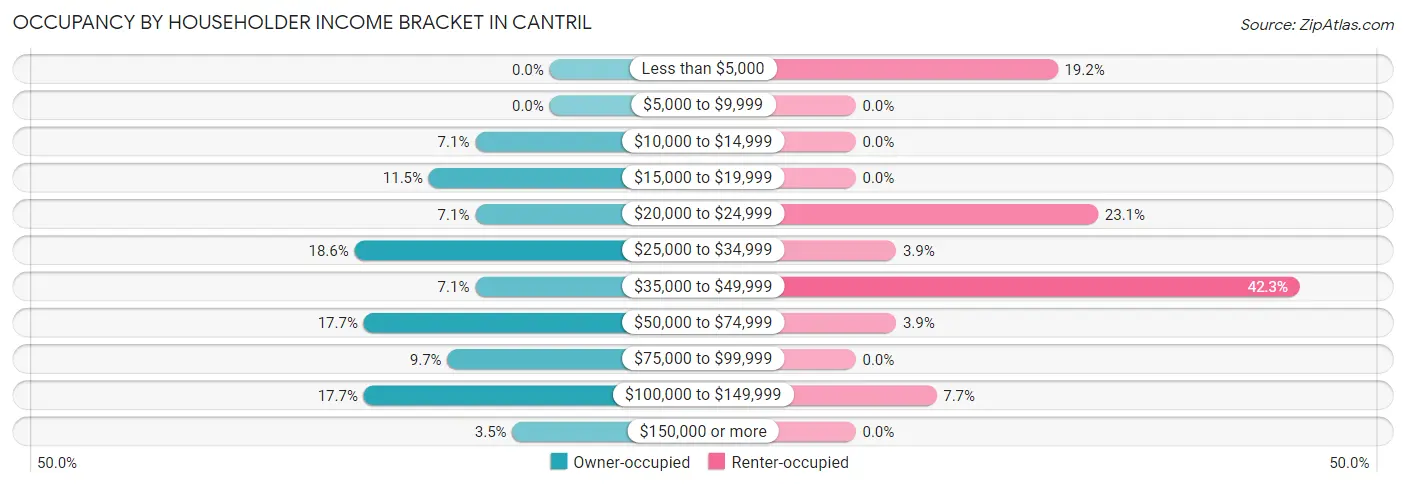
| Income Bracket | Owner-occupied | Renter-occupied |
| Less than $5,000 | 0 (0.0%) | 5 (19.2%) |
| $5,000 to $9,999 | 0 (0.0%) | 0 (0.0%) |
| $10,000 to $14,999 | 8 (7.1%) | 0 (0.0%) |
| $15,000 to $19,999 | 13 (11.5%) | 0 (0.0%) |
| $20,000 to $24,999 | 8 (7.1%) | 6 (23.1%) |
| $25,000 to $34,999 | 21 (18.6%) | 1 (3.8%) |
| $35,000 to $49,999 | 8 (7.1%) | 11 (42.3%) |
| $50,000 to $74,999 | 20 (17.7%) | 1 (3.8%) |
| $75,000 to $99,999 | 11 (9.7%) | 0 (0.0%) |
| $100,000 to $149,999 | 20 (17.7%) | 2 (7.7%) |
| $150,000 or more | 4 (3.5%) | 0 (0.0%) |
| Total | 113 (100.0%) | 26 (100.0%) |
Monthly Housing Cost Tiers in Cantril
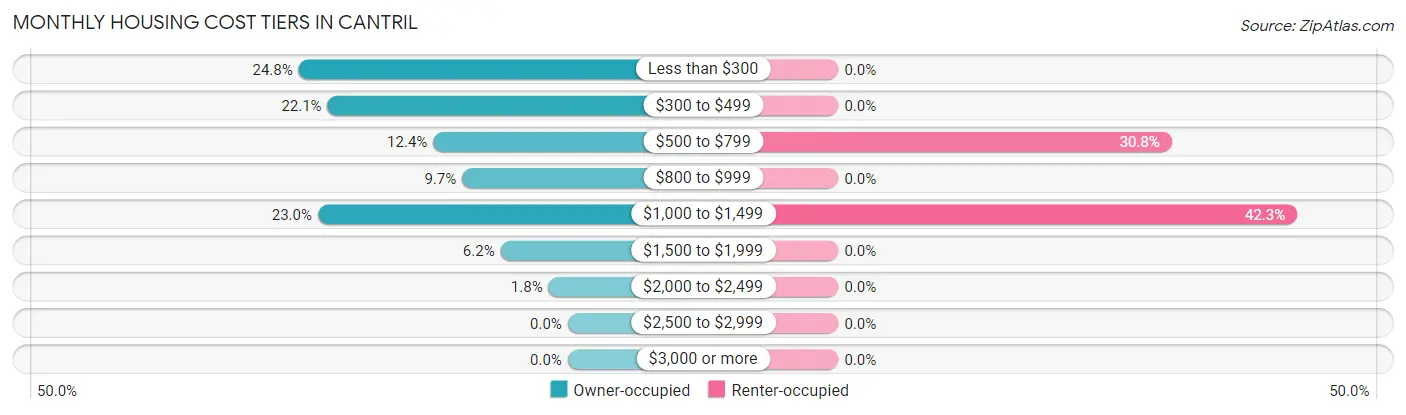
| Monthly Cost | Owner-occupied | Renter-occupied |
| Less than $300 | 28 (24.8%) | 0 (0.0%) |
| $300 to $499 | 25 (22.1%) | 0 (0.0%) |
| $500 to $799 | 14 (12.4%) | 8 (30.8%) |
| $800 to $999 | 11 (9.7%) | 0 (0.0%) |
| $1,000 to $1,499 | 26 (23.0%) | 11 (42.3%) |
| $1,500 to $1,999 | 7 (6.2%) | 0 (0.0%) |
| $2,000 to $2,499 | 2 (1.8%) | 0 (0.0%) |
| $2,500 to $2,999 | 0 (0.0%) | 0 (0.0%) |
| $3,000 or more | 0 (0.0%) | 0 (0.0%) |
| Total | 113 (100.0%) | 26 (100.0%) |
Physical Housing Characteristics in Cantril
Housing Structures in Cantril
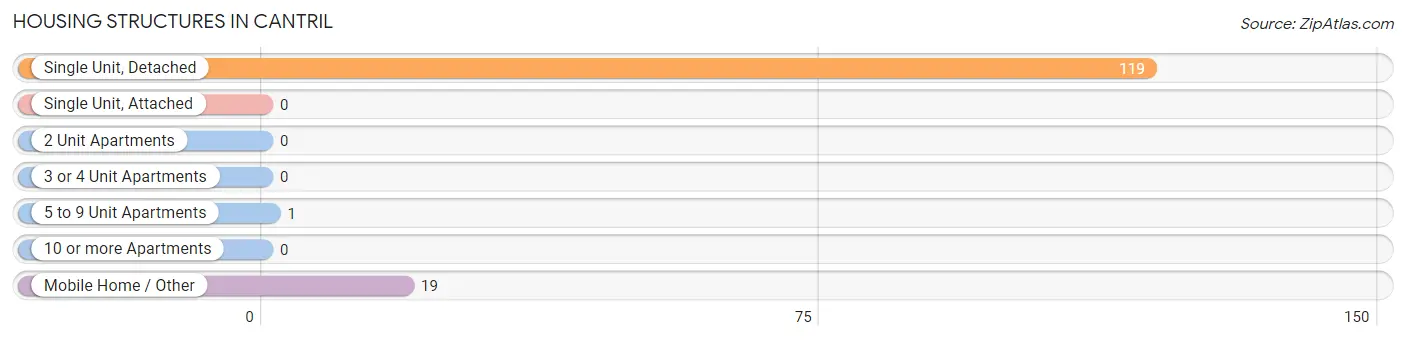
| Structure Type | # Housing Units | % Housing Units |
| Single Unit, Detached | 119 | 85.6% |
| Single Unit, Attached | 0 | 0.0% |
| 2 Unit Apartments | 0 | 0.0% |
| 3 or 4 Unit Apartments | 0 | 0.0% |
| 5 to 9 Unit Apartments | 1 | 0.7% |
| 10 or more Apartments | 0 | 0.0% |
| Mobile Home / Other | 19 | 13.7% |
| Total | 139 | 100.0% |
Housing Structures by Occupancy in Cantril
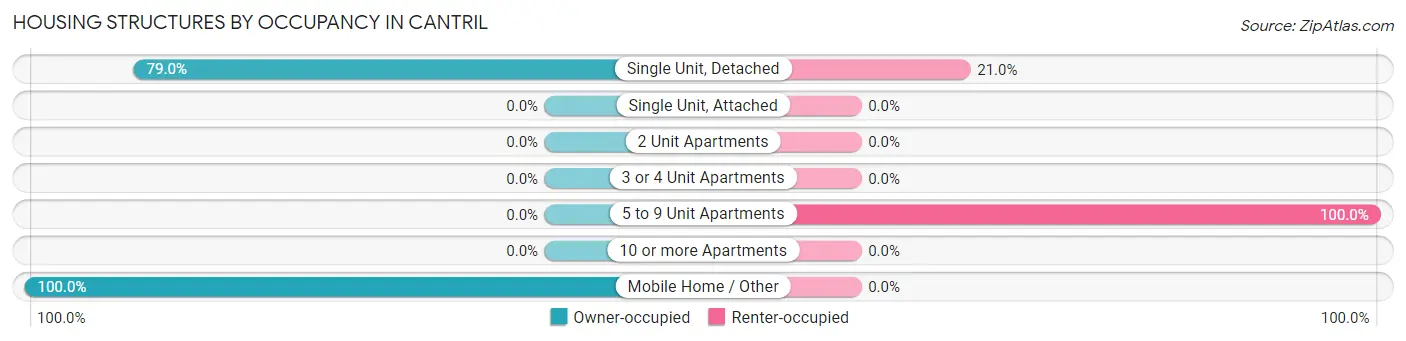
| Structure Type | Owner-occupied | Renter-occupied |
| Single Unit, Detached | 94 (79.0%) | 25 (21.0%) |
| Single Unit, Attached | 0 (0.0%) | 0 (0.0%) |
| 2 Unit Apartments | 0 (0.0%) | 0 (0.0%) |
| 3 or 4 Unit Apartments | 0 (0.0%) | 0 (0.0%) |
| 5 to 9 Unit Apartments | 0 (0.0%) | 1 (100.0%) |
| 10 or more Apartments | 0 (0.0%) | 0 (0.0%) |
| Mobile Home / Other | 19 (100.0%) | 0 (0.0%) |
| Total | 113 (81.3%) | 26 (18.7%) |
Housing Structures by Number of Rooms in Cantril
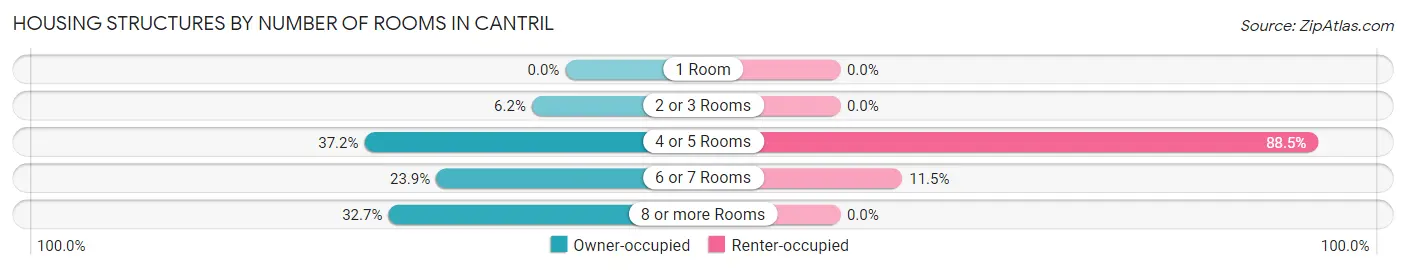
| Number of Rooms | Owner-occupied | Renter-occupied |
| 1 Room | 0 (0.0%) | 0 (0.0%) |
| 2 or 3 Rooms | 7 (6.2%) | 0 (0.0%) |
| 4 or 5 Rooms | 42 (37.2%) | 23 (88.5%) |
| 6 or 7 Rooms | 27 (23.9%) | 3 (11.5%) |
| 8 or more Rooms | 37 (32.7%) | 0 (0.0%) |
| Total | 113 (100.0%) | 26 (100.0%) |
Housing Structure by Heating Type in Cantril
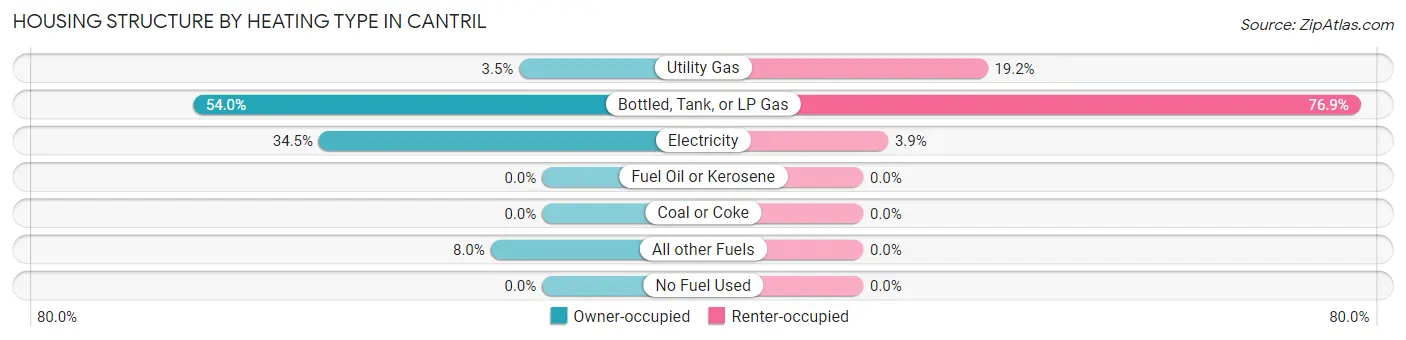
| Heating Type | Owner-occupied | Renter-occupied |
| Utility Gas | 4 (3.5%) | 5 (19.2%) |
| Bottled, Tank, or LP Gas | 61 (54.0%) | 20 (76.9%) |
| Electricity | 39 (34.5%) | 1 (3.8%) |
| Fuel Oil or Kerosene | 0 (0.0%) | 0 (0.0%) |
| Coal or Coke | 0 (0.0%) | 0 (0.0%) |
| All other Fuels | 9 (8.0%) | 0 (0.0%) |
| No Fuel Used | 0 (0.0%) | 0 (0.0%) |
| Total | 113 (100.0%) | 26 (100.0%) |
Household Vehicle Usage in Cantril
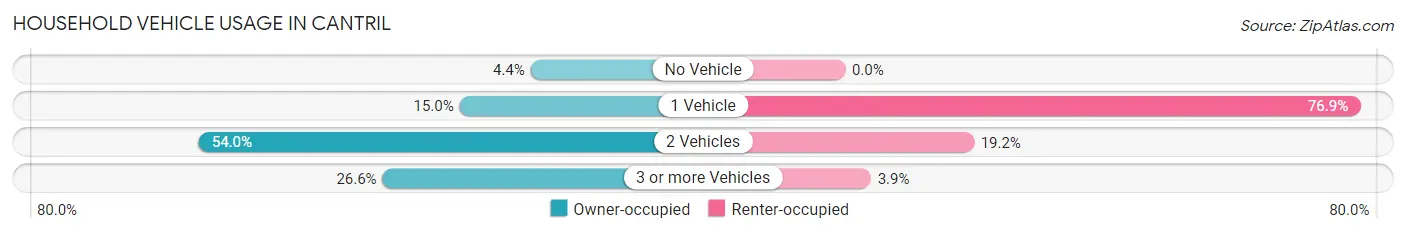
| Vehicles per Household | Owner-occupied | Renter-occupied |
| No Vehicle | 5 (4.4%) | 0 (0.0%) |
| 1 Vehicle | 17 (15.0%) | 20 (76.9%) |
| 2 Vehicles | 61 (54.0%) | 5 (19.2%) |
| 3 or more Vehicles | 30 (26.6%) | 1 (3.8%) |
| Total | 113 (100.0%) | 26 (100.0%) |
Real Estate & Mortgages in Cantril
Real Estate and Mortgage Overview in Cantril
| Characteristic | Without Mortgage | With Mortgage |
| Housing Units | 65 | 48 |
| Median Property Value | $57,300 | $118,800 |
| Median Household Income | $26,012 | $1 |
| Monthly Housing Costs | $402 | $0 |
| Real Estate Taxes | - | - |
Property Value by Mortgage Status in Cantril
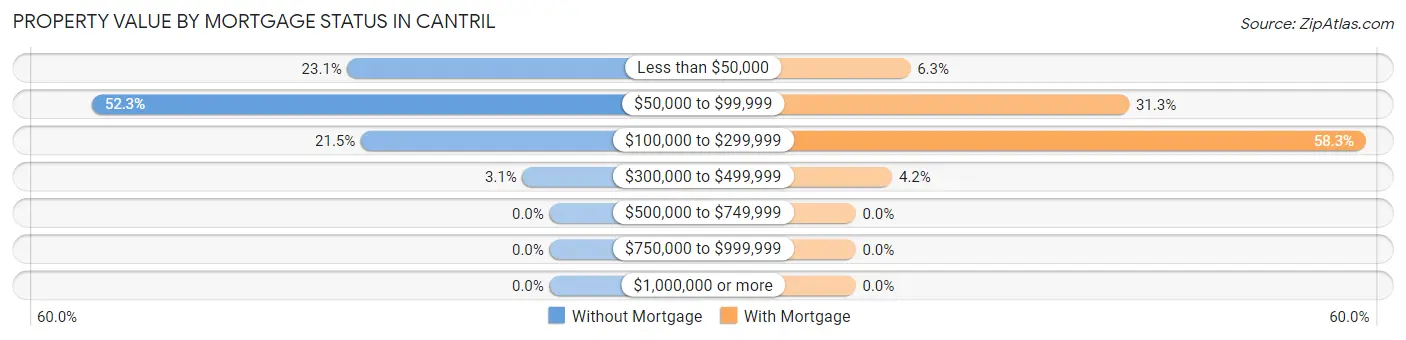
| Property Value | Without Mortgage | With Mortgage |
| Less than $50,000 | 15 (23.1%) | 3 (6.2%) |
| $50,000 to $99,999 | 34 (52.3%) | 15 (31.2%) |
| $100,000 to $299,999 | 14 (21.5%) | 28 (58.3%) |
| $300,000 to $499,999 | 2 (3.1%) | 2 (4.2%) |
| $500,000 to $749,999 | 0 (0.0%) | 0 (0.0%) |
| $750,000 to $999,999 | 0 (0.0%) | 0 (0.0%) |
| $1,000,000 or more | 0 (0.0%) | 0 (0.0%) |
| Total | 65 (100.0%) | 48 (100.0%) |
Household Income by Mortgage Status in Cantril
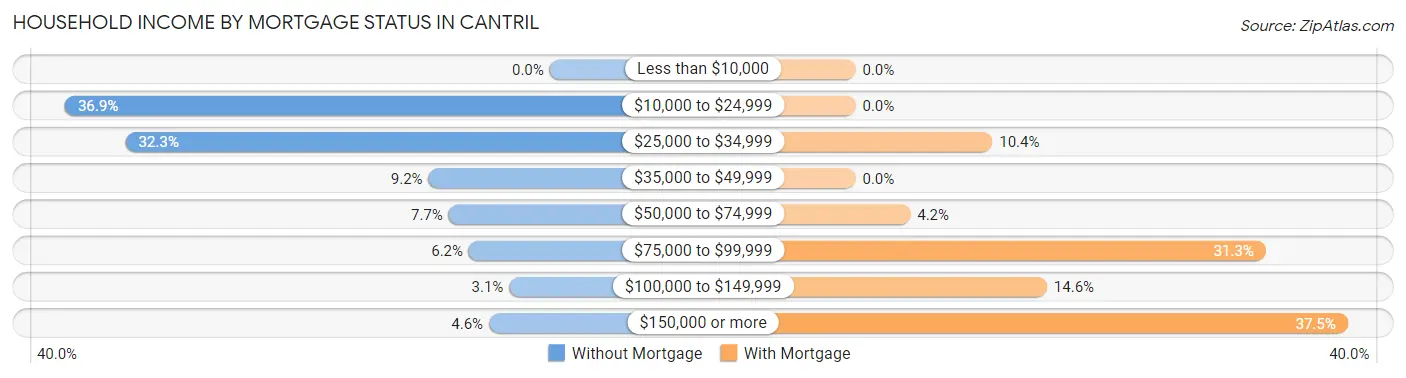
| Household Income | Without Mortgage | With Mortgage |
| Less than $10,000 | 0 (0.0%) | 0 (0.0%) |
| $10,000 to $24,999 | 24 (36.9%) | 0 (0.0%) |
| $25,000 to $34,999 | 21 (32.3%) | 5 (10.4%) |
| $35,000 to $49,999 | 6 (9.2%) | 0 (0.0%) |
| $50,000 to $74,999 | 5 (7.7%) | 2 (4.2%) |
| $75,000 to $99,999 | 4 (6.1%) | 15 (31.2%) |
| $100,000 to $149,999 | 2 (3.1%) | 7 (14.6%) |
| $150,000 or more | 3 (4.6%) | 18 (37.5%) |
| Total | 65 (100.0%) | 48 (100.0%) |
Property Value to Household Income Ratio in Cantril
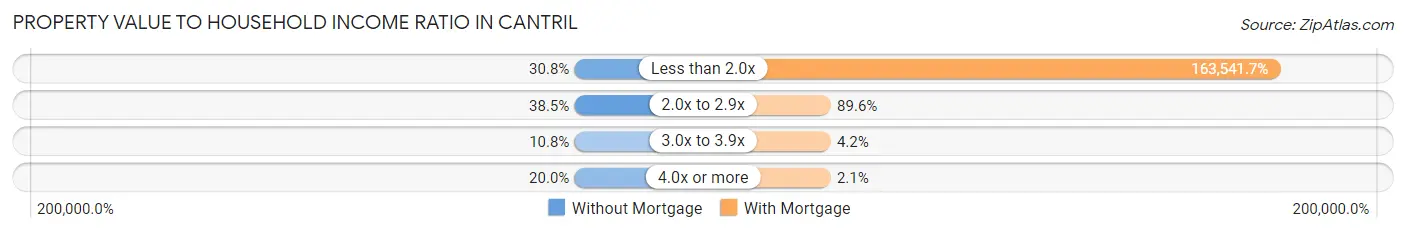
| Value-to-Income Ratio | Without Mortgage | With Mortgage |
| Less than 2.0x | 20 (30.8%) | 78,500 (163,541.7%) |
| 2.0x to 2.9x | 25 (38.5%) | 43 (89.6%) |
| 3.0x to 3.9x | 7 (10.8%) | 2 (4.2%) |
| 4.0x or more | 13 (20.0%) | 1 (2.1%) |
| Total | 65 (100.0%) | 48 (100.0%) |
Real Estate Taxes by Mortgage Status in Cantril
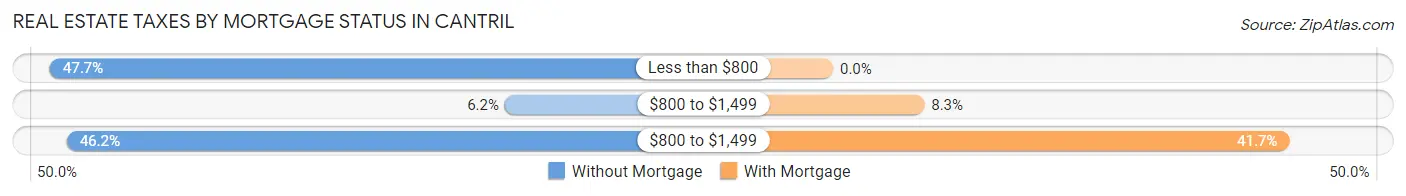
| Property Taxes | Without Mortgage | With Mortgage |
| Less than $800 | 31 (47.7%) | 0 (0.0%) |
| $800 to $1,499 | 4 (6.1%) | 4 (8.3%) |
| $800 to $1,499 | 30 (46.2%) | 20 (41.7%) |
| Total | 65 (100.0%) | 48 (100.0%) |
Health & Disability in Cantril
Health Insurance Coverage by Age in Cantril
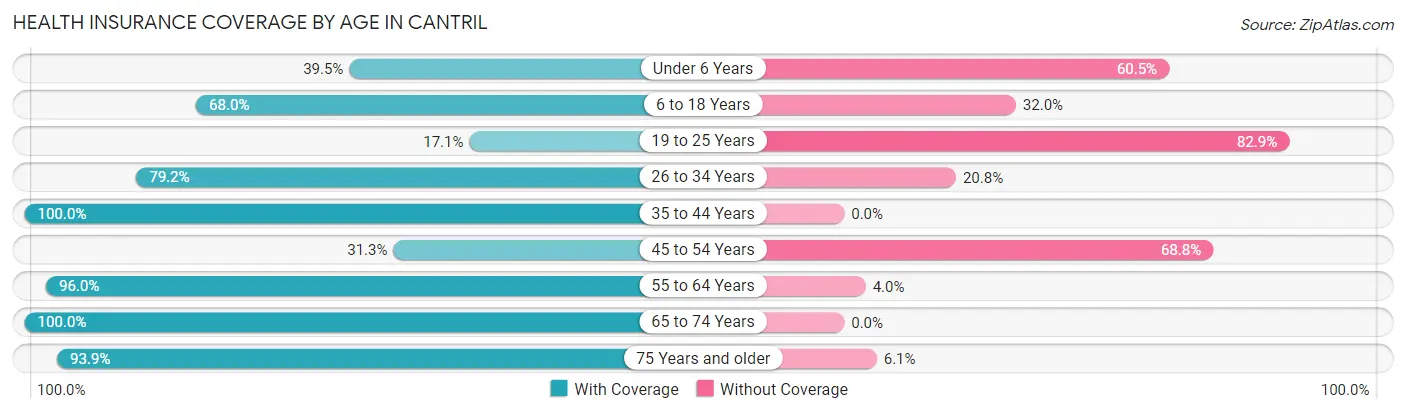
| Age Bracket | With Coverage | Without Coverage |
| Under 6 Years | 15 (39.5%) | 23 (60.5%) |
| 6 to 18 Years | 17 (68.0%) | 8 (32.0%) |
| 19 to 25 Years | 7 (17.1%) | 34 (82.9%) |
| 26 to 34 Years | 19 (79.2%) | 5 (20.8%) |
| 35 to 44 Years | 9 (100.0%) | 0 (0.0%) |
| 45 to 54 Years | 5 (31.2%) | 11 (68.8%) |
| 55 to 64 Years | 24 (96.0%) | 1 (4.0%) |
| 65 to 74 Years | 59 (100.0%) | 0 (0.0%) |
| 75 Years and older | 31 (93.9%) | 2 (6.1%) |
| Total | 186 (68.9%) | 84 (31.1%) |
Health Insurance Coverage by Citizenship Status in Cantril
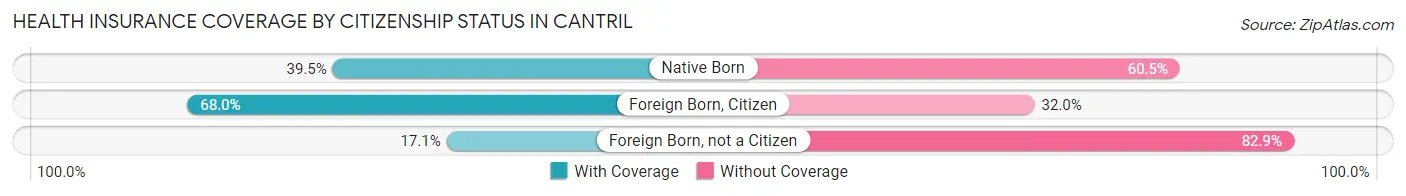
| Citizenship Status | With Coverage | Without Coverage |
| Native Born | 15 (39.5%) | 23 (60.5%) |
| Foreign Born, Citizen | 17 (68.0%) | 8 (32.0%) |
| Foreign Born, not a Citizen | 7 (17.1%) | 34 (82.9%) |
Health Insurance Coverage by Household Income in Cantril
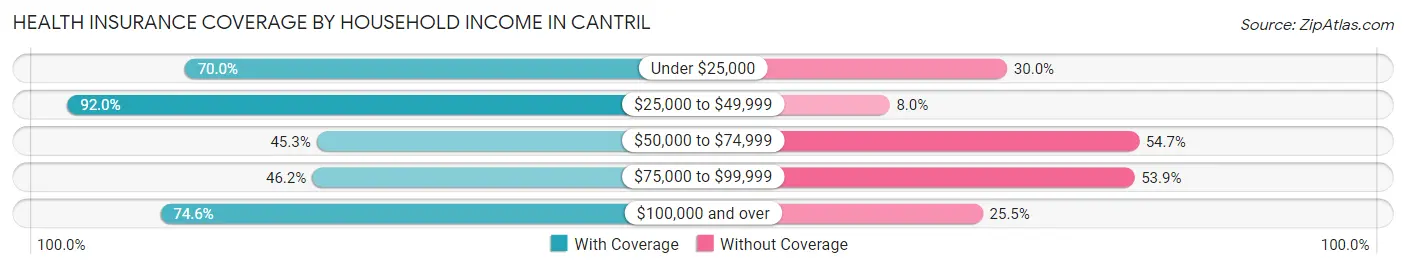
| Household Income | With Coverage | Without Coverage |
| Under $25,000 | 35 (70.0%) | 15 (30.0%) |
| $25,000 to $49,999 | 69 (92.0%) | 6 (8.0%) |
| $50,000 to $74,999 | 29 (45.3%) | 35 (54.7%) |
| $75,000 to $99,999 | 12 (46.2%) | 14 (53.8%) |
| $100,000 and over | 41 (74.6%) | 14 (25.5%) |
Public vs Private Health Insurance Coverage by Age in Cantril
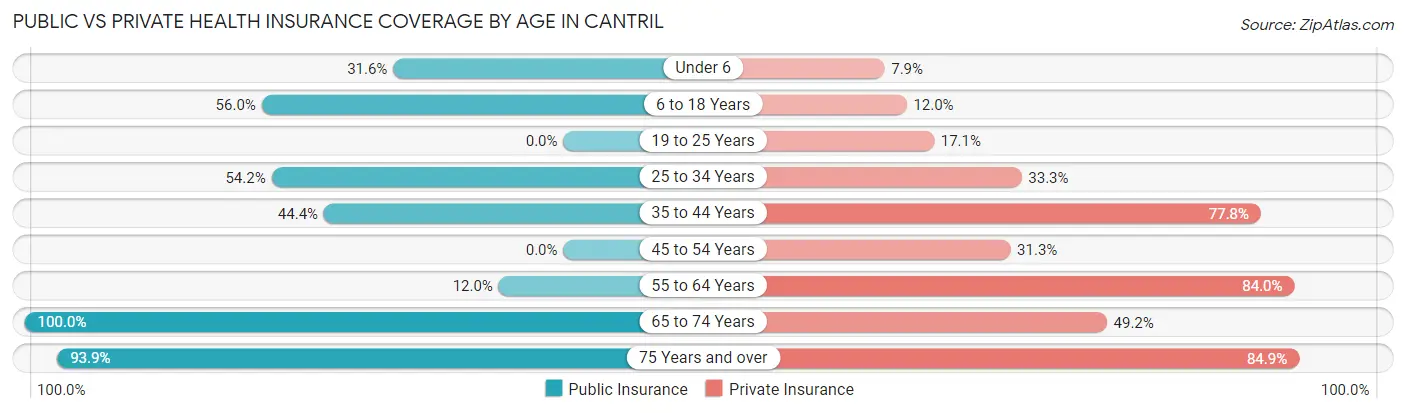
| Age Bracket | Public Insurance | Private Insurance |
| Under 6 | 12 (31.6%) | 3 (7.9%) |
| 6 to 18 Years | 14 (56.0%) | 3 (12.0%) |
| 19 to 25 Years | 0 (0.0%) | 7 (17.1%) |
| 25 to 34 Years | 13 (54.2%) | 8 (33.3%) |
| 35 to 44 Years | 4 (44.4%) | 7 (77.8%) |
| 45 to 54 Years | 0 (0.0%) | 5 (31.2%) |
| 55 to 64 Years | 3 (12.0%) | 21 (84.0%) |
| 65 to 74 Years | 59 (100.0%) | 29 (49.1%) |
| 75 Years and over | 31 (93.9%) | 28 (84.9%) |
| Total | 136 (50.4%) | 111 (41.1%) |
Disability Status by Sex by Age in Cantril
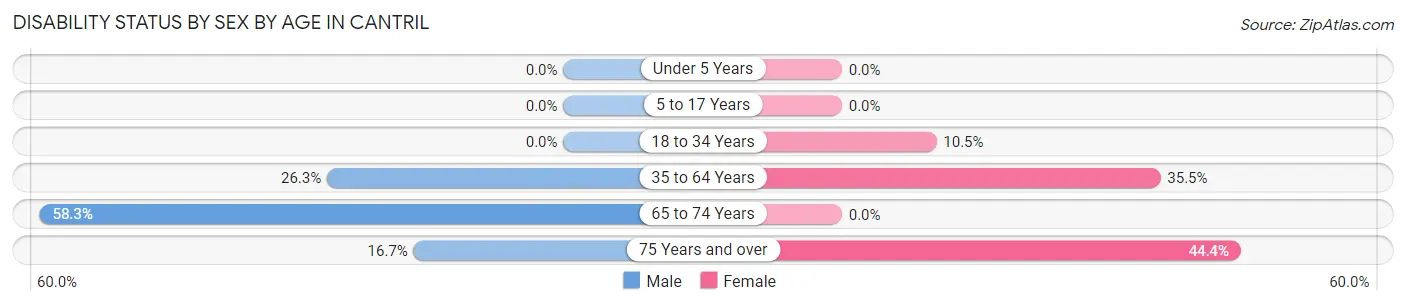
| Age Bracket | Male | Female |
| Under 5 Years | 0 (0.0%) | 0 (0.0%) |
| 5 to 17 Years | 0 (0.0%) | 0 (0.0%) |
| 18 to 34 Years | 0 (0.0%) | 4 (10.5%) |
| 35 to 64 Years | 5 (26.3%) | 11 (35.5%) |
| 65 to 74 Years | 21 (58.3%) | 0 (0.0%) |
| 75 Years and over | 4 (16.7%) | 4 (44.4%) |
Disability Class by Sex by Age in Cantril
Disability Class: Hearing Difficulty
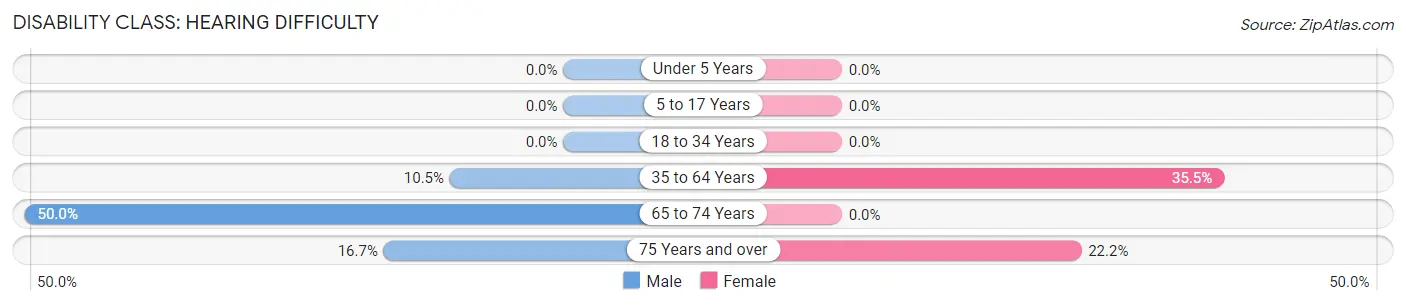
| Age Bracket | Male | Female |
| Under 5 Years | 0 (0.0%) | 0 (0.0%) |
| 5 to 17 Years | 0 (0.0%) | 0 (0.0%) |
| 18 to 34 Years | 0 (0.0%) | 0 (0.0%) |
| 35 to 64 Years | 2 (10.5%) | 11 (35.5%) |
| 65 to 74 Years | 18 (50.0%) | 0 (0.0%) |
| 75 Years and over | 4 (16.7%) | 2 (22.2%) |
Disability Class: Vision Difficulty
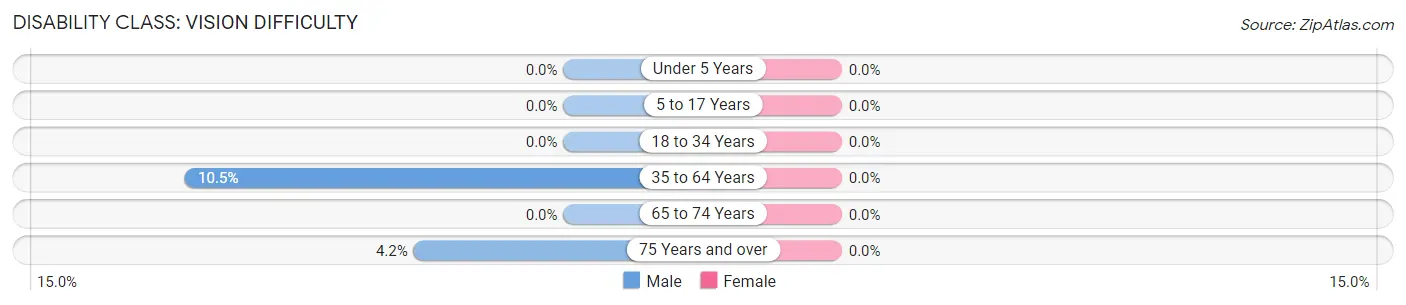
| Age Bracket | Male | Female |
| Under 5 Years | 0 (0.0%) | 0 (0.0%) |
| 5 to 17 Years | 0 (0.0%) | 0 (0.0%) |
| 18 to 34 Years | 0 (0.0%) | 0 (0.0%) |
| 35 to 64 Years | 2 (10.5%) | 0 (0.0%) |
| 65 to 74 Years | 0 (0.0%) | 0 (0.0%) |
| 75 Years and over | 1 (4.2%) | 0 (0.0%) |
Disability Class: Cognitive Difficulty
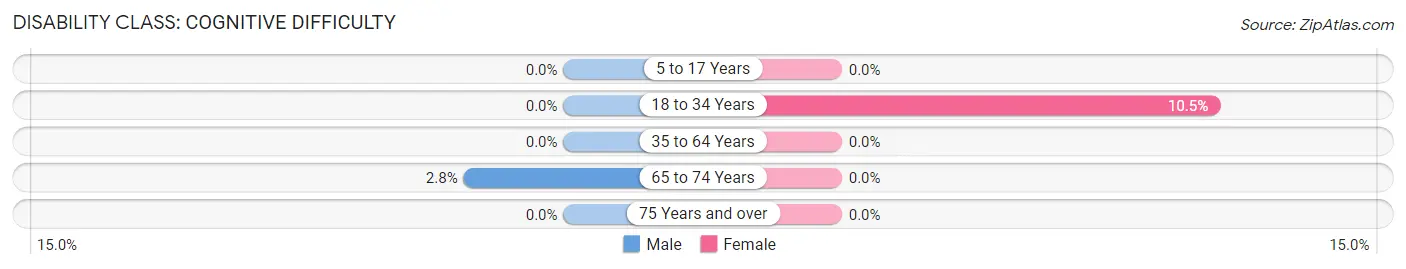
| Age Bracket | Male | Female |
| 5 to 17 Years | 0 (0.0%) | 0 (0.0%) |
| 18 to 34 Years | 0 (0.0%) | 4 (10.5%) |
| 35 to 64 Years | 0 (0.0%) | 0 (0.0%) |
| 65 to 74 Years | 1 (2.8%) | 0 (0.0%) |
| 75 Years and over | 0 (0.0%) | 0 (0.0%) |
Disability Class: Ambulatory Difficulty
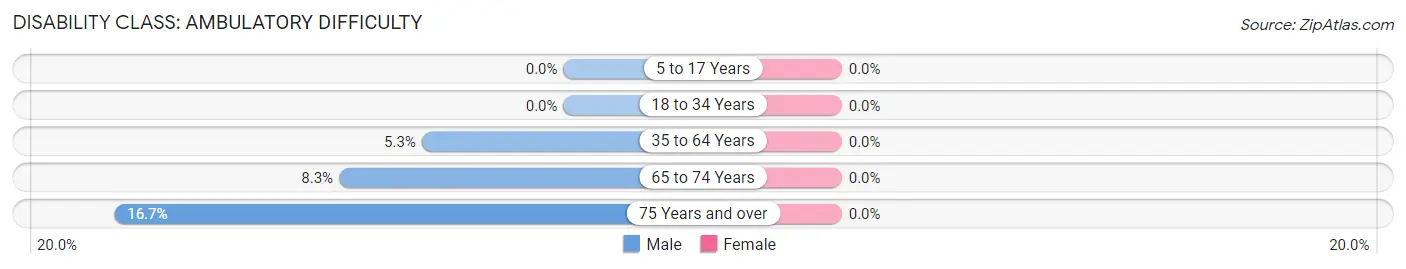
| Age Bracket | Male | Female |
| 5 to 17 Years | 0 (0.0%) | 0 (0.0%) |
| 18 to 34 Years | 0 (0.0%) | 0 (0.0%) |
| 35 to 64 Years | 1 (5.3%) | 0 (0.0%) |
| 65 to 74 Years | 3 (8.3%) | 0 (0.0%) |
| 75 Years and over | 4 (16.7%) | 0 (0.0%) |
Disability Class: Self-Care Difficulty
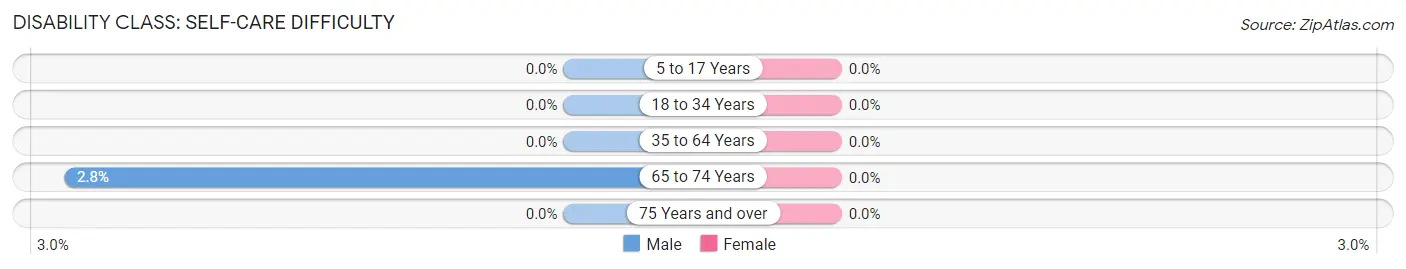
| Age Bracket | Male | Female |
| 5 to 17 Years | 0 (0.0%) | 0 (0.0%) |
| 18 to 34 Years | 0 (0.0%) | 0 (0.0%) |
| 35 to 64 Years | 0 (0.0%) | 0 (0.0%) |
| 65 to 74 Years | 1 (2.8%) | 0 (0.0%) |
| 75 Years and over | 0 (0.0%) | 0 (0.0%) |
Technology Access in Cantril
Computing Device Access in Cantril
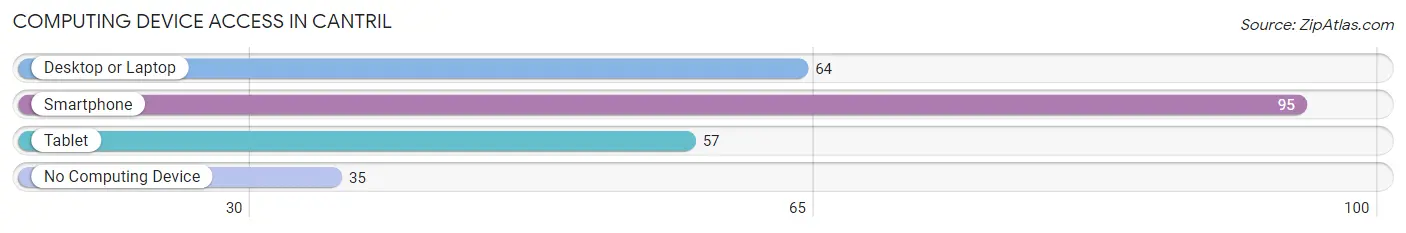
| Device Type | # Households | % Households |
| Desktop or Laptop | 64 | 46.0% |
| Smartphone | 95 | 68.3% |
| Tablet | 57 | 41.0% |
| No Computing Device | 35 | 25.2% |
| Total | 139 | 100.0% |
Internet Access in Cantril
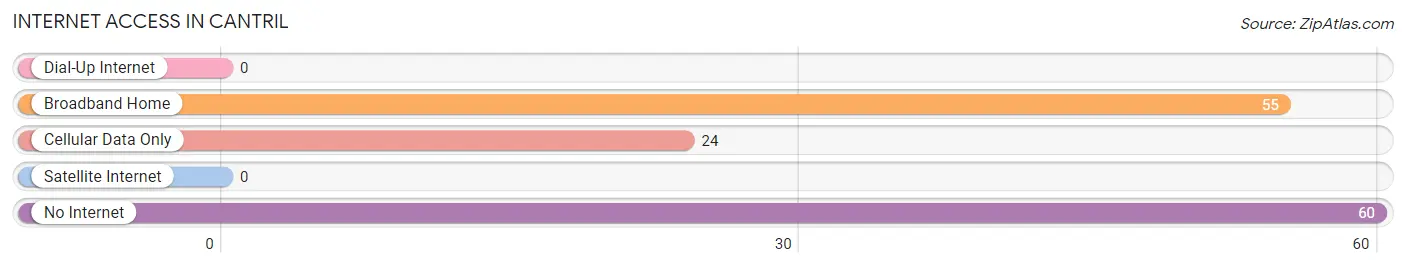
| Internet Type | # Households | % Households |
| Dial-Up Internet | 0 | 0.0% |
| Broadband Home | 55 | 39.6% |
| Cellular Data Only | 24 | 17.3% |
| Satellite Internet | 0 | 0.0% |
| No Internet | 60 | 43.2% |
| Total | 139 | 100.0% |
Cantril Summary
Cantril is a small town located in Van Buren County, Iowa. It is situated in the southeastern corner of the state, about 25 miles south of the state capital of Des Moines. The town has a population of just over 500 people, and is part of the Keosauqua Micropolitan Statistical Area.
History
Cantril was founded in 1854 by a group of settlers from Ohio. The town was named after a local creek, which was named after a local Native American chief. The town was originally a farming community, and the first post office was established in 1856.
In the late 19th century, Cantril began to grow and develop. The town was incorporated in 1891, and the first school was built in 1895. The town also had a bank, a hotel, a blacksmith shop, and a general store.
In the early 20th century, Cantril continued to grow and develop. The town was connected to the railroad in 1910, and the first telephone service was established in 1912. The town also had a movie theater, a library, and a variety of other businesses.
Geography
Cantril is located in the southeastern corner of Iowa, about 25 miles south of Des Moines. The town is situated in the rolling hills of the Des Moines River Valley. The town is surrounded by farmland, and the nearby towns of Keosauqua and Milton are both within a few miles of Cantril.
The climate in Cantril is typical of the Midwest, with hot summers and cold winters. The average temperature in the summer is around 80 degrees Fahrenheit, and the average temperature in the winter is around 20 degrees Fahrenheit.
Economy
Cantril’s economy is largely based on agriculture. The town is surrounded by farmland, and many of the town’s residents are employed in the agricultural industry. The town also has a few small businesses, including a grocery store, a hardware store, and a few restaurants.
Demographics
As of the 2010 census, Cantril had a population of 514 people. The town is predominantly white, with 94.3% of the population being white and 5.7% being of other races. The median household income in Cantril is $41,250, and the median age is 44.7 years.
Cantril is a small town with a rich history and a strong sense of community. The town is surrounded by farmland, and the economy is largely based on agriculture. The town has a population of just over 500 people, and is part of the Keosauqua Micropolitan Statistical Area.
Common Questions
What is Per Capita Income in Cantril?
Per Capita income in Cantril is $25,921.
What is the Median Family Income in Cantril?
Median Family Income in Cantril is $63,750.
What is the Median Household income in Cantril?
Median Household Income in Cantril is $36,705.
What is Inequality or Gini Index in Cantril?
Inequality or Gini Index in Cantril is 0.41.
What is the Total Population of Cantril?
Total Population of Cantril is 270.
What is the Total Male Population of Cantril?
Total Male Population of Cantril is 150.
What is the Total Female Population of Cantril?
Total Female Population of Cantril is 120.
What is the Ratio of Males per 100 Females in Cantril?
There are 125.00 Males per 100 Females in Cantril.
What is the Ratio of Females per 100 Males in Cantril?
There are 80.00 Females per 100 Males in Cantril.
What is the Median Population Age in Cantril?
Median Population Age in Cantril is 43.5 Years.
What is the Average Family Size in Cantril
Average Family Size in Cantril is 2.5 People.
What is the Average Household Size in Cantril
Average Household Size in Cantril is 1.9 People.
How Large is the Labor Force in Cantril?
There are 107 People in the Labor Forcein in Cantril.
What is the Percentage of People in the Labor Force in Cantril?
51.2% of People are in the Labor Force in Cantril.