Cabool, MO Map & Demographics
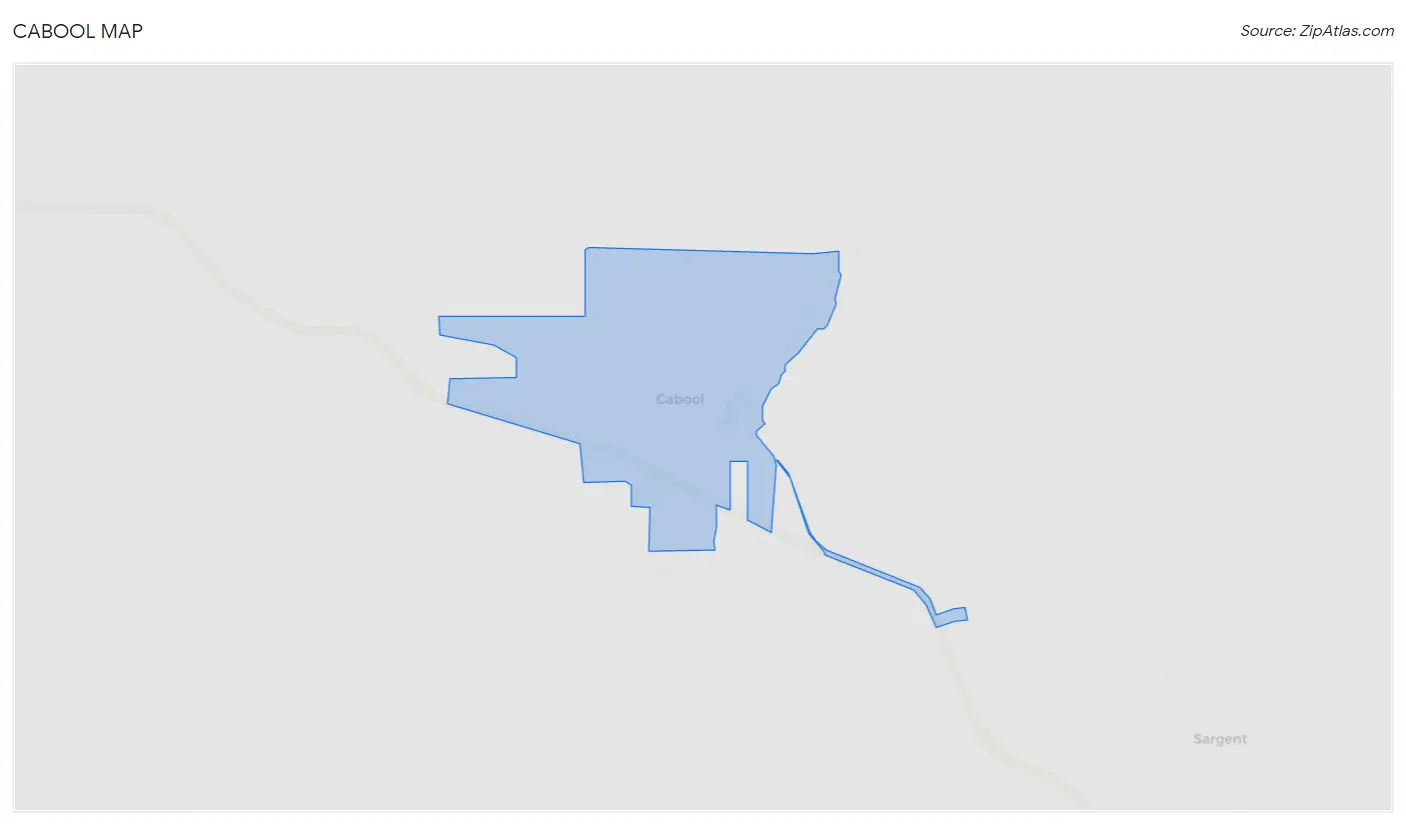
Cabool Map
Cabool Overview
$20,037
PER CAPITA INCOME
$41,302
AVG FAMILY INCOME
$33,429
AVG HOUSEHOLD INCOME
39.2%
WAGE / INCOME GAP [ % ]
60.8¢/ $1
WAGE / INCOME GAP [ $ ]
0.51
INEQUALITY / GINI INDEX
2,543
TOTAL POPULATION
1,185
MALE POPULATION
1,358
FEMALE POPULATION
87.26
MALES / 100 FEMALES
114.60
FEMALES / 100 MALES
38.7
MEDIAN AGE
3.2
AVG FAMILY SIZE
2.5
AVG HOUSEHOLD SIZE
928
LABOR FORCE [ PEOPLE ]
49.2%
PERCENT IN LABOR FORCE
2.4%
UNEMPLOYMENT RATE
Cabool Zip Codes
Cabool Area Codes
Income in Cabool
Income Overview in Cabool
Per Capita Income in Cabool is $20,037, while median incomes of families and households are $41,302 and $33,429 respectively.
| Characteristic | Number | Measure |
| Per Capita Income | 2,543 | $20,037 |
| Median Family Income | 611 | $41,302 |
| Mean Family Income | 611 | $58,165 |
| Median Household Income | 984 | $33,429 |
| Mean Household Income | 984 | $46,672 |
| Income Deficit | 611 | $0 |
| Wage / Income Gap (%) | 2,543 | 39.15% |
| Wage / Income Gap ($) | 2,543 | 60.85¢ per $1 |
| Gini / Inequality Index | 2,543 | 0.51 |
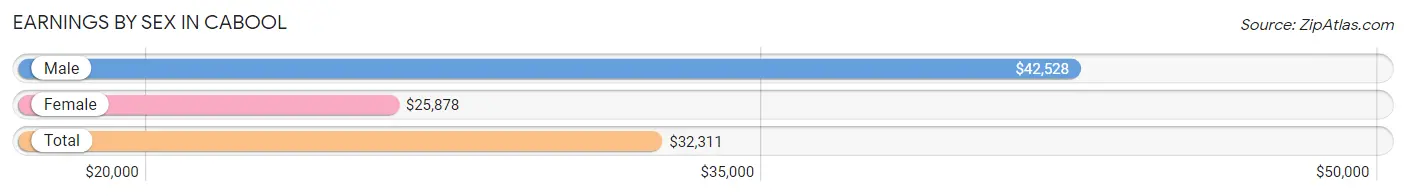
Earnings by Sex in Cabool
Average Earnings in Cabool are $32,311, $42,528 for men and $25,878 for women, a difference of 39.2%.
| Sex | Number | Average Earnings |
| Male | 495 (50.5%) | $42,528 |
| Female | 486 (49.5%) | $25,878 |
| Total | 981 (100.0%) | $32,311 |
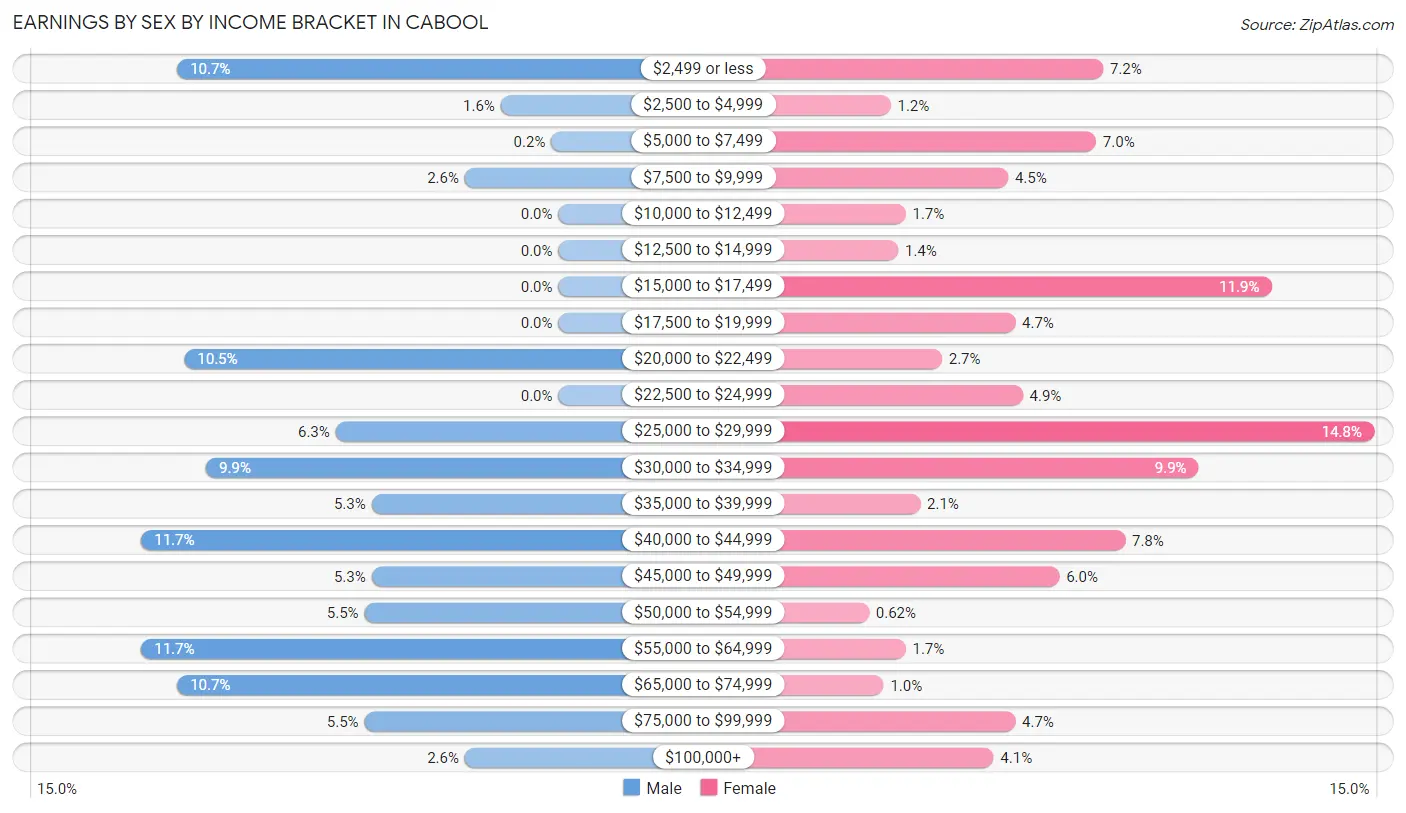
Earnings by Sex by Income Bracket in Cabool
The most common earnings brackets in Cabool are $40,000 to $44,999 for men (58 | 11.7%) and $25,000 to $29,999 for women (72 | 14.8%).
| Income | Male | Female |
| $2,499 or less | 53 (10.7%) | 35 (7.2%) |
| $2,500 to $4,999 | 8 (1.6%) | 6 (1.2%) |
| $5,000 to $7,499 | 1 (0.2%) | 34 (7.0%) |
| $7,500 to $9,999 | 13 (2.6%) | 22 (4.5%) |
| $10,000 to $12,499 | 0 (0.0%) | 8 (1.7%) |
| $12,500 to $14,999 | 0 (0.0%) | 7 (1.4%) |
| $15,000 to $17,499 | 0 (0.0%) | 58 (11.9%) |
| $17,500 to $19,999 | 0 (0.0%) | 23 (4.7%) |
| $20,000 to $22,499 | 52 (10.5%) | 13 (2.7%) |
| $22,500 to $24,999 | 0 (0.0%) | 24 (4.9%) |
| $25,000 to $29,999 | 31 (6.3%) | 72 (14.8%) |
| $30,000 to $34,999 | 49 (9.9%) | 48 (9.9%) |
| $35,000 to $39,999 | 26 (5.2%) | 10 (2.1%) |
| $40,000 to $44,999 | 58 (11.7%) | 38 (7.8%) |
| $45,000 to $49,999 | 26 (5.2%) | 29 (6.0%) |
| $50,000 to $54,999 | 27 (5.4%) | 3 (0.6%) |
| $55,000 to $64,999 | 58 (11.7%) | 8 (1.7%) |
| $65,000 to $74,999 | 53 (10.7%) | 5 (1.0%) |
| $75,000 to $99,999 | 27 (5.4%) | 23 (4.7%) |
| $100,000+ | 13 (2.6%) | 20 (4.1%) |
| Total | 495 (100.0%) | 486 (100.0%) |
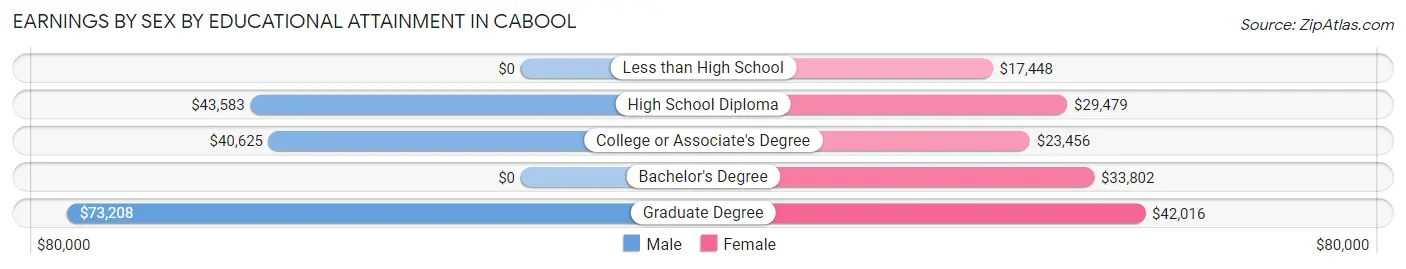
Earnings by Sex by Educational Attainment in Cabool
Average earnings in Cabool are $44,119 for men and $28,821 for women, a difference of 34.7%. Men with an educational attainment of graduate degree enjoy the highest average annual earnings of $73,208, while those with college or associate's degree education earn the least with $40,625. Women with an educational attainment of graduate degree earn the most with the average annual earnings of $42,016, while those with less than high school education have the smallest earnings of $17,448.
| Educational Attainment | Male Income | Female Income |
| Less than High School | - | - |
| High School Diploma | $43,583 | $29,479 |
| College or Associate's Degree | $40,625 | $23,456 |
| Bachelor's Degree | - | - |
| Graduate Degree | $73,208 | $42,016 |
| Total | $44,119 | $28,821 |
Family Income in Cabool
Family Income Brackets in Cabool
According to the Cabool family income data, there are 148 families falling into the $50,000 to $74,999 income range, which is the most common income bracket and makes up 24.2% of all families. Conversely, the $200,000+ income bracket is the least frequent group with only 18 families (2.9%) belonging to this category.
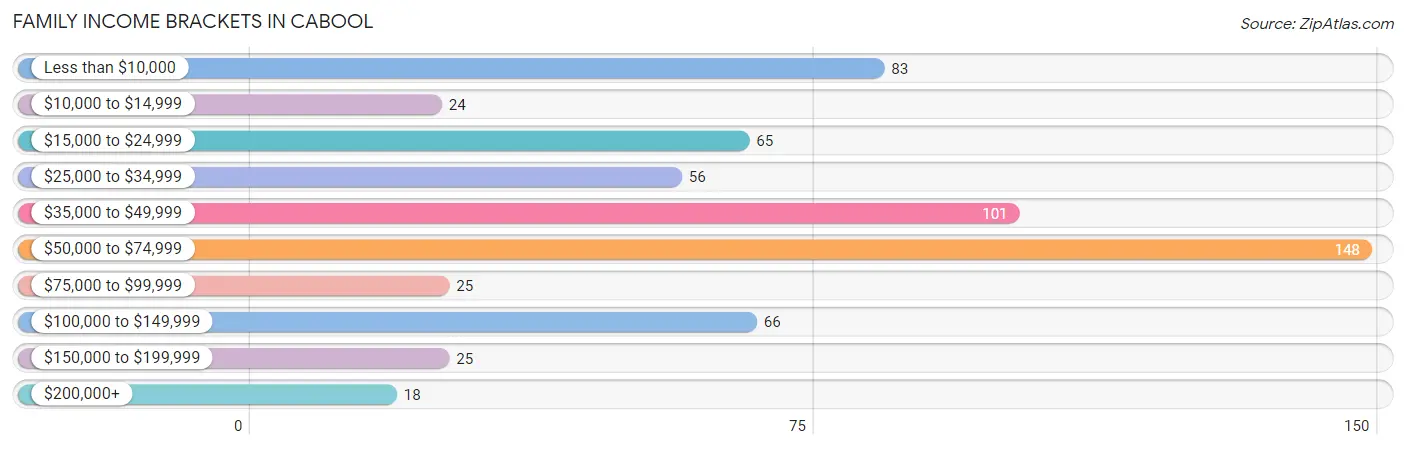
| Income Bracket | # Families | % Families |
| Less than $10,000 | 83 | 13.6% |
| $10,000 to $14,999 | 24 | 3.9% |
| $15,000 to $24,999 | 65 | 10.6% |
| $25,000 to $34,999 | 56 | 9.2% |
| $35,000 to $49,999 | 101 | 16.5% |
| $50,000 to $74,999 | 148 | 24.2% |
| $75,000 to $99,999 | 25 | 4.1% |
| $100,000 to $149,999 | 66 | 10.8% |
| $150,000 to $199,999 | 25 | 4.1% |
| $200,000+ | 18 | 2.9% |
Family Income by Famaliy Size in Cabool
4-person families (91 | 14.9%) account for the highest median family income in Cabool with $115,040 per family, while 4-person families (91 | 14.9%) have the highest median income of $28,760 per family member.
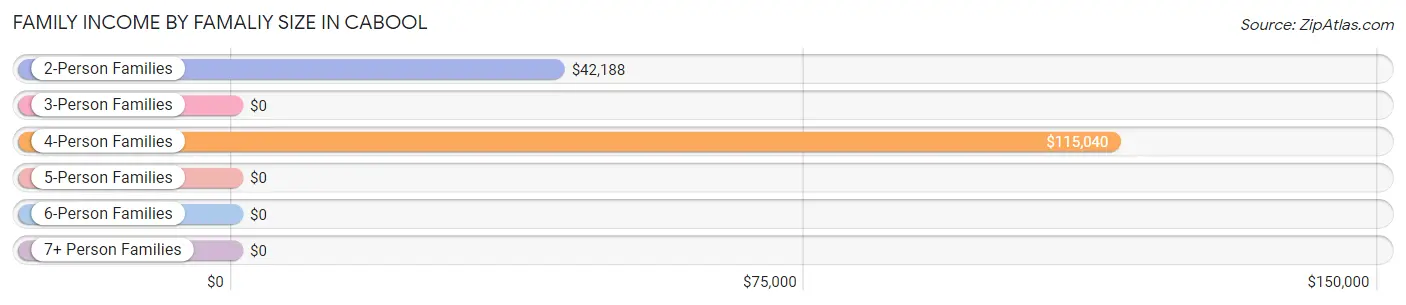
| Income Bracket | # Families | Median Income |
| 2-Person Families | 310 (50.7%) | $42,188 |
| 3-Person Families | 142 (23.2%) | $0 |
| 4-Person Families | 91 (14.9%) | $115,040 |
| 5-Person Families | 26 (4.3%) | $0 |
| 6-Person Families | 42 (6.9%) | $0 |
| 7+ Person Families | 0 (0.0%) | $0 |
| Total | 611 (100.0%) | $41,302 |
Family Income by Number of Earners in Cabool
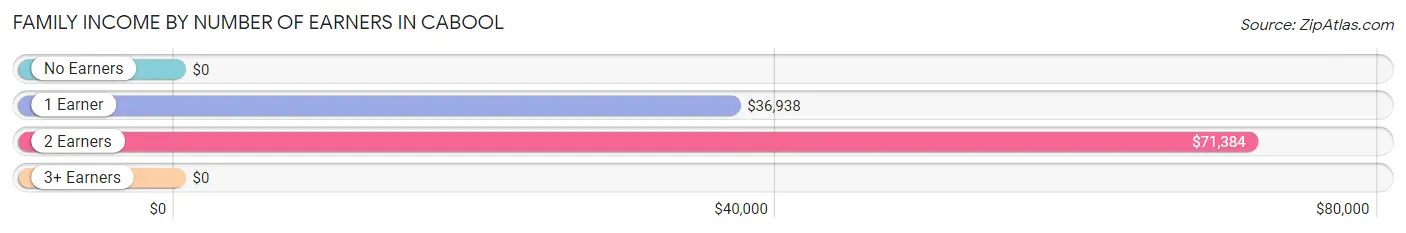
| Number of Earners | # Families | Median Income |
| No Earners | 139 (22.8%) | $0 |
| 1 Earner | 240 (39.3%) | $36,938 |
| 2 Earners | 205 (33.6%) | $71,384 |
| 3+ Earners | 27 (4.4%) | $0 |
| Total | 611 (100.0%) | $41,302 |
Household Income in Cabool
Household Income Brackets in Cabool
With 177 households falling in the category, the $15,000 to $24,999 income range is the most frequent in Cabool, accounting for 18.0% of all households. In contrast, only 18 households (1.8%) fall into the $200,000+ income bracket, making it the least populous group.
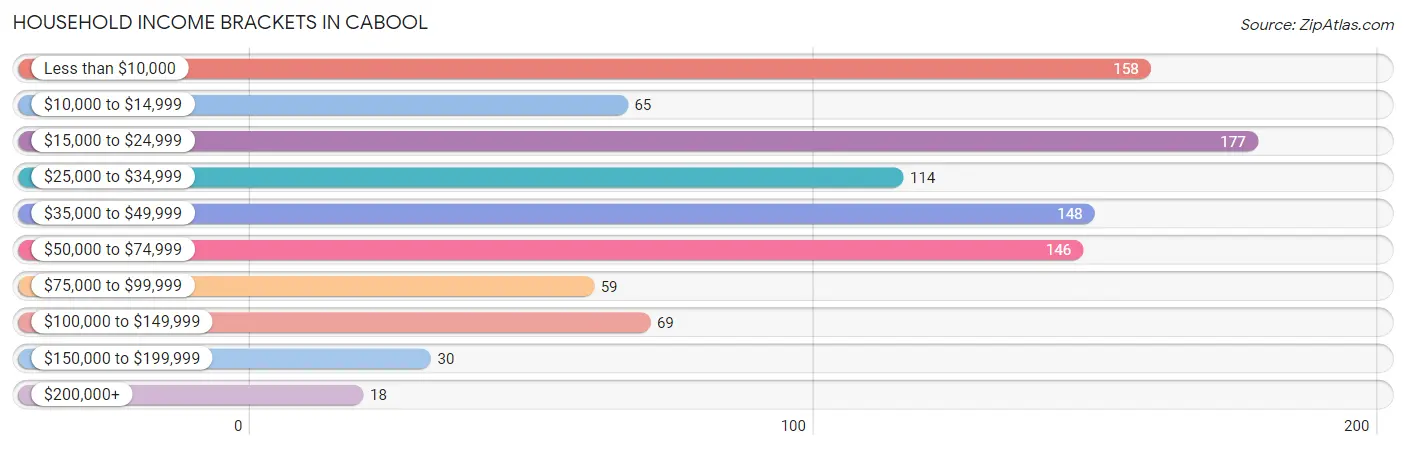
| Income Bracket | # Households | % Households |
| Less than $10,000 | 158 | 16.1% |
| $10,000 to $14,999 | 65 | 6.6% |
| $15,000 to $24,999 | 177 | 18.0% |
| $25,000 to $34,999 | 114 | 11.6% |
| $35,000 to $49,999 | 148 | 15.0% |
| $50,000 to $74,999 | 146 | 14.8% |
| $75,000 to $99,999 | 59 | 6.0% |
| $100,000 to $149,999 | 69 | 7.0% |
| $150,000 to $199,999 | 30 | 3.0% |
| $200,000+ | 18 | 1.8% |
Household Income by Householder Age in Cabool
The median household income in Cabool is $33,429, with the highest median household income of $40,250 found in the 25 to 44 years age bracket for the primary householder. A total of 265 households (26.9%) fall into this category. Meanwhile, the 15 to 24 years age bracket for the primary householder has the lowest median household income of $0, with 90 households (9.1%) in this group.
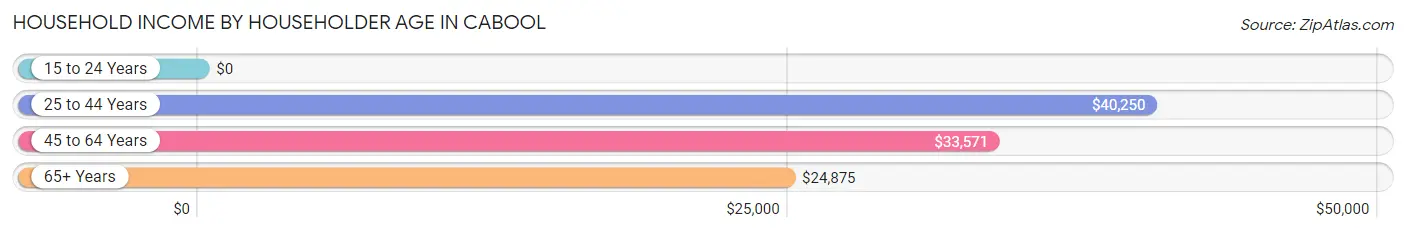
| Income Bracket | # Households | Median Income |
| 15 to 24 Years | 90 (9.1%) | $0 |
| 25 to 44 Years | 265 (26.9%) | $40,250 |
| 45 to 64 Years | 364 (37.0%) | $33,571 |
| 65+ Years | 265 (26.9%) | $24,875 |
| Total | 984 (100.0%) | $33,429 |
Poverty in Cabool
Income Below Poverty by Sex and Age in Cabool
With 24.9% poverty level for males and 35.7% for females among the residents of Cabool, 5 year old males and 5 year old females are the most vulnerable to poverty, with 10 males (100.0%) and 15 females (100.0%) in their respective age groups living below the poverty level.
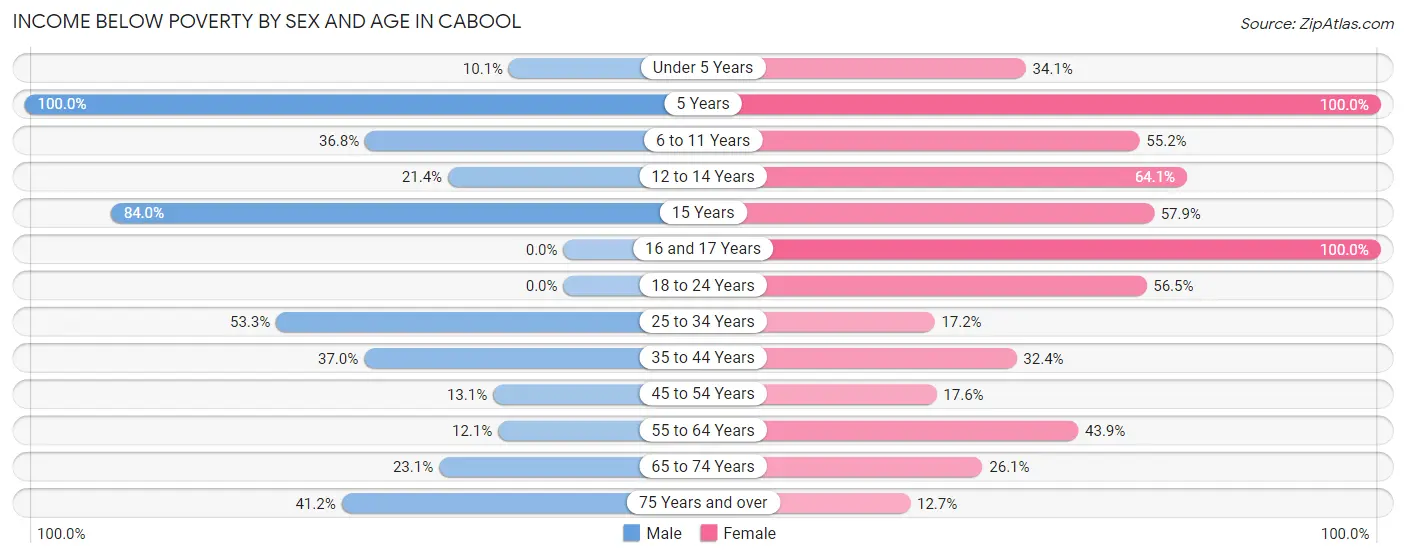
| Age Bracket | Male | Female |
| Under 5 Years | 9 (10.1%) | 43 (34.1%) |
| 5 Years | 10 (100.0%) | 15 (100.0%) |
| 6 to 11 Years | 60 (36.8%) | 58 (55.2%) |
| 12 to 14 Years | 3 (21.4%) | 41 (64.1%) |
| 15 Years | 21 (84.0%) | 22 (57.9%) |
| 16 and 17 Years | 0 (0.0%) | 13 (100.0%) |
| 18 to 24 Years | 0 (0.0%) | 65 (56.5%) |
| 25 to 34 Years | 40 (53.3%) | 27 (17.2%) |
| 35 to 44 Years | 54 (37.0%) | 47 (32.4%) |
| 45 to 54 Years | 29 (13.1%) | 23 (17.6%) |
| 55 to 64 Years | 16 (12.1%) | 75 (43.9%) |
| 65 to 74 Years | 12 (23.1%) | 18 (26.1%) |
| 75 Years and over | 28 (41.2%) | 20 (12.7%) |
| Total | 282 (24.9%) | 467 (35.7%) |
Income Above Poverty by Sex and Age in Cabool
According to the poverty statistics in Cabool, males aged 16 and 17 years and females aged 75 years and over are the age groups that are most secure financially, with 100.0% of males and 87.3% of females in these age groups living above the poverty line.
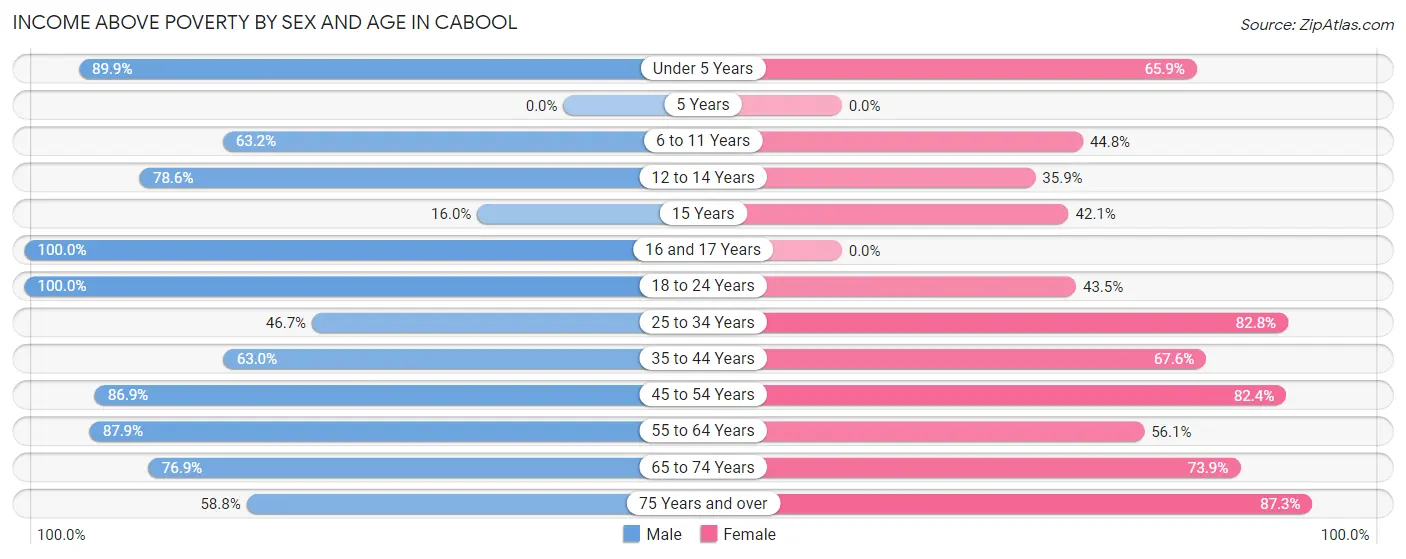
| Age Bracket | Male | Female |
| Under 5 Years | 80 (89.9%) | 83 (65.9%) |
| 5 Years | 0 (0.0%) | 0 (0.0%) |
| 6 to 11 Years | 103 (63.2%) | 47 (44.8%) |
| 12 to 14 Years | 11 (78.6%) | 23 (35.9%) |
| 15 Years | 4 (16.0%) | 16 (42.1%) |
| 16 and 17 Years | 12 (100.0%) | 0 (0.0%) |
| 18 to 24 Years | 124 (100.0%) | 50 (43.5%) |
| 25 to 34 Years | 35 (46.7%) | 130 (82.8%) |
| 35 to 44 Years | 92 (63.0%) | 98 (67.6%) |
| 45 to 54 Years | 193 (86.9%) | 108 (82.4%) |
| 55 to 64 Years | 116 (87.9%) | 96 (56.1%) |
| 65 to 74 Years | 40 (76.9%) | 51 (73.9%) |
| 75 Years and over | 40 (58.8%) | 138 (87.3%) |
| Total | 850 (75.1%) | 840 (64.3%) |
Income Below Poverty Among Married-Couple Families in Cabool
The poverty statistics for married-couple families in Cabool show that 24.1% or 102 of the total 424 families live below the poverty line. Families with 3 or 4 children have the highest poverty rate of 78.4%, comprising of 40 families. On the other hand, families with 1 or 2 children have the lowest poverty rate of 8.7%, which includes 14 families.
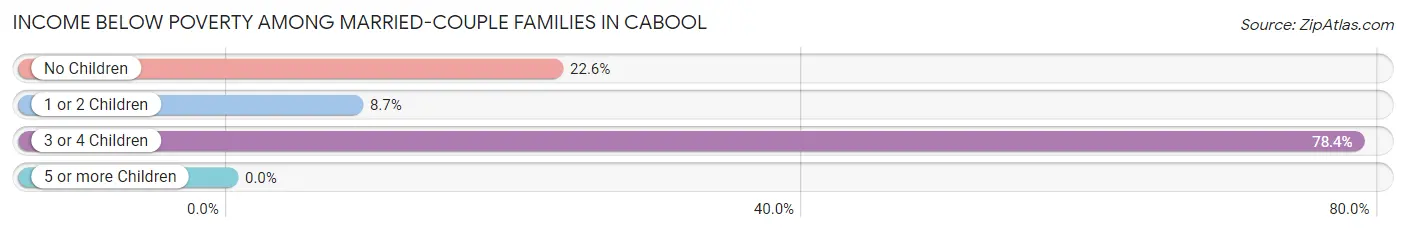
| Children | Above Poverty | Below Poverty |
| No Children | 164 (77.4%) | 48 (22.6%) |
| 1 or 2 Children | 147 (91.3%) | 14 (8.7%) |
| 3 or 4 Children | 11 (21.6%) | 40 (78.4%) |
| 5 or more Children | 0 (0.0%) | 0 (0.0%) |
| Total | 322 (75.9%) | 102 (24.1%) |
Income Below Poverty Among Single-Parent Households in Cabool
According to the poverty data in Cabool, 31.8% or 7 single-father households and 37.6% or 62 single-mother households are living below the poverty line. Among single-father households, those with 1 or 2 children have the highest poverty rate, with 7 households (36.8%) experiencing poverty. Likewise, among single-mother households, those with 3 or 4 children have the highest poverty rate, with 1 households (100.0%) falling below the poverty line.
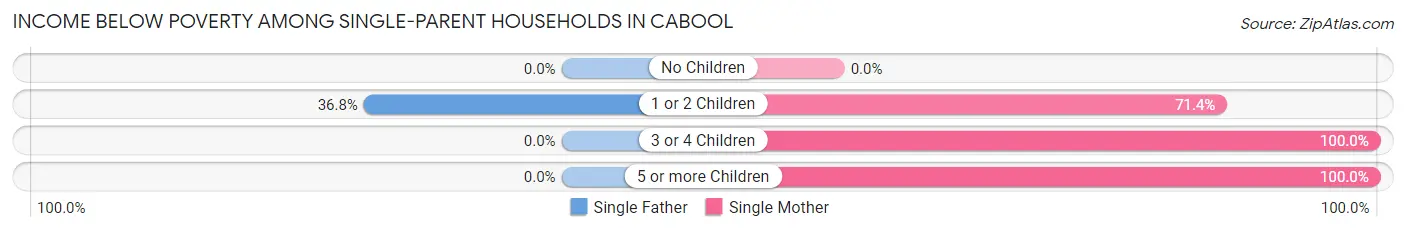
| Children | Single Father | Single Mother |
| No Children | 0 (0.0%) | 0 (0.0%) |
| 1 or 2 Children | 7 (36.8%) | 45 (71.4%) |
| 3 or 4 Children | 0 (0.0%) | 1 (100.0%) |
| 5 or more Children | 0 (0.0%) | 16 (100.0%) |
| Total | 7 (31.8%) | 62 (37.6%) |
Income Below Poverty Among Married-Couple vs Single-Parent Households in Cabool
The poverty data for Cabool shows that 102 of the married-couple family households (24.1%) and 69 of the single-parent households (36.9%) are living below the poverty level. Within the married-couple family households, those with 3 or 4 children have the highest poverty rate, with 40 households (78.4%) falling below the poverty line. Among the single-parent households, those with 3 or 4 children have the highest poverty rate, with 1 household (100.0%) living below poverty.
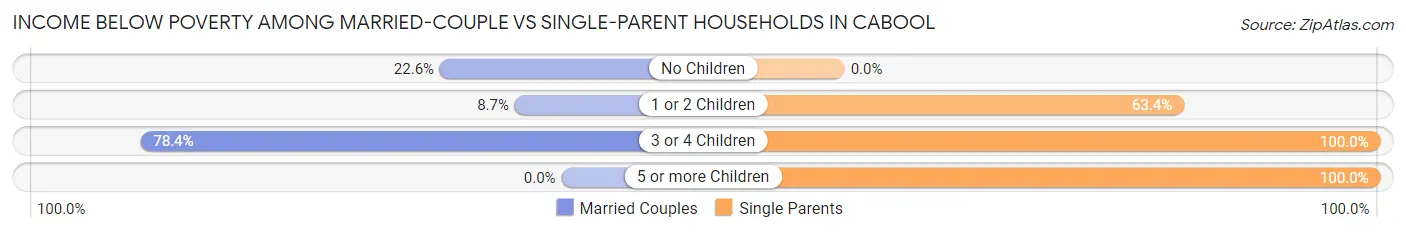
| Children | Married-Couple Families | Single-Parent Households |
| No Children | 48 (22.6%) | 0 (0.0%) |
| 1 or 2 Children | 14 (8.7%) | 52 (63.4%) |
| 3 or 4 Children | 40 (78.4%) | 1 (100.0%) |
| 5 or more Children | 0 (0.0%) | 16 (100.0%) |
| Total | 102 (24.1%) | 69 (36.9%) |
Race in Cabool
The most populous races in Cabool are White / Caucasian (2,157 | 84.8%), Hispanic or Latino (172 | 6.8%), and Two or more Races (165 | 6.5%).
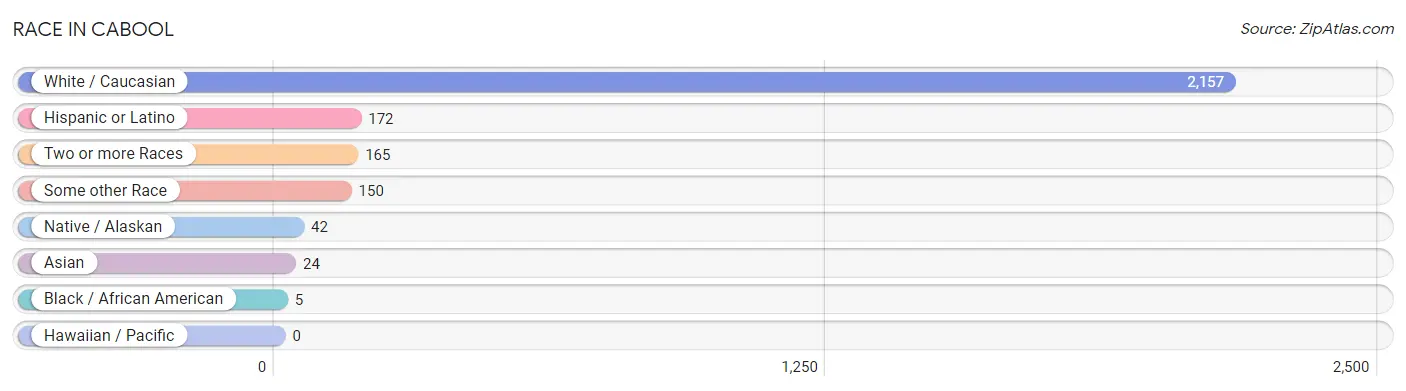
| Race | # Population | % Population |
| Asian | 24 | 0.9% |
| Black / African American | 5 | 0.2% |
| Hawaiian / Pacific | 0 | 0.0% |
| Hispanic or Latino | 172 | 6.8% |
| Native / Alaskan | 42 | 1.7% |
| White / Caucasian | 2,157 | 84.8% |
| Two or more Races | 165 | 6.5% |
| Some other Race | 150 | 5.9% |
| Total | 2,543 | 100.0% |
Ancestry in Cabool
The most populous ancestries reported in Cabool are American (380 | 14.9%), Irish (310 | 12.2%), German (287 | 11.3%), English (233 | 9.2%), and Mexican (116 | 4.6%), together accounting for 52.1% of all Cabool residents.
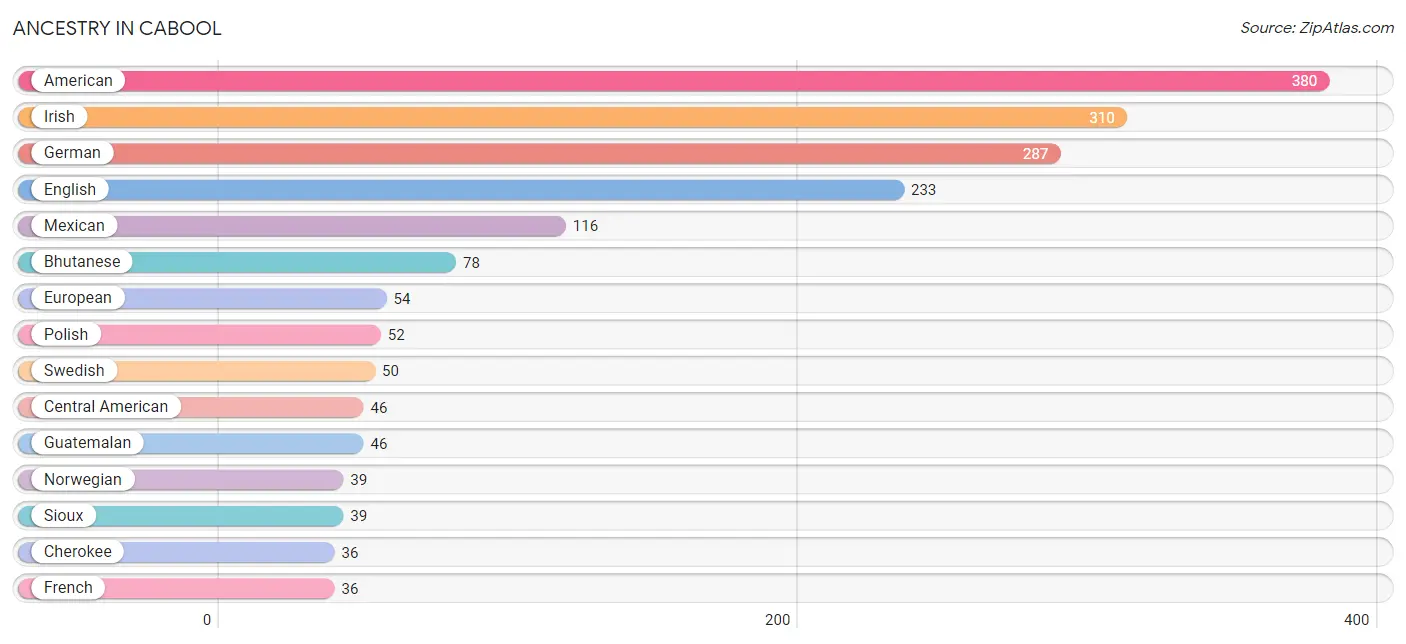
| Ancestry | # Population | % Population |
| American | 380 | 14.9% |
| Bhutanese | 78 | 3.1% |
| British | 33 | 1.3% |
| Central American | 46 | 1.8% |
| Cherokee | 36 | 1.4% |
| Choctaw | 2 | 0.1% |
| Dutch | 20 | 0.8% |
| English | 233 | 9.2% |
| European | 54 | 2.1% |
| French | 36 | 1.4% |
| French Canadian | 5 | 0.2% |
| German | 287 | 11.3% |
| Guatemalan | 46 | 1.8% |
| Irish | 310 | 12.2% |
| Italian | 21 | 0.8% |
| Korean | 3 | 0.1% |
| Mexican | 116 | 4.6% |
| Northern European | 4 | 0.2% |
| Norwegian | 39 | 1.5% |
| Polish | 52 | 2.0% |
| Puerto Rican | 8 | 0.3% |
| Scotch-Irish | 19 | 0.7% |
| Scottish | 9 | 0.4% |
| Sioux | 39 | 1.5% |
| Sri Lankan | 3 | 0.1% |
| Swedish | 50 | 2.0% |
| Swiss | 4 | 0.2% |
| Welsh | 13 | 0.5% | View All 28 Rows |
Immigrants in Cabool
The most numerous immigrant groups reported in Cabool came from Central America (61 | 2.4%), Guatemala (61 | 2.4%), Latin America (61 | 2.4%), Asia (24 | 0.9%), and Kazakhstan (18 | 0.7%), together accounting for 8.9% of all Cabool residents.
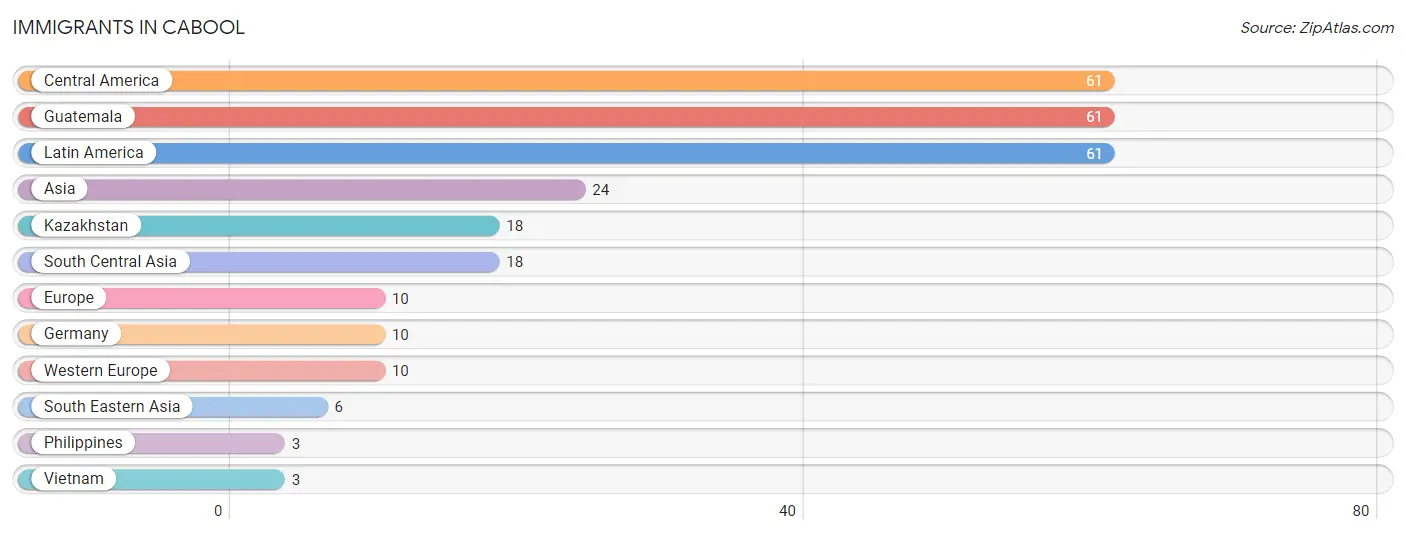
| Immigration Origin | # Population | % Population |
| Asia | 24 | 0.9% |
| Central America | 61 | 2.4% |
| Europe | 10 | 0.4% |
| Germany | 10 | 0.4% |
| Guatemala | 61 | 2.4% |
| Kazakhstan | 18 | 0.7% |
| Latin America | 61 | 2.4% |
| Philippines | 3 | 0.1% |
| South Central Asia | 18 | 0.7% |
| South Eastern Asia | 6 | 0.2% |
| Vietnam | 3 | 0.1% |
| Western Europe | 10 | 0.4% | View All 12 Rows |
Sex and Age in Cabool
Sex and Age in Cabool
The most populous age groups in Cabool are 5 to 9 Years (140 | 11.8%) for men and Under 5 Years (126 | 9.3%) for women.
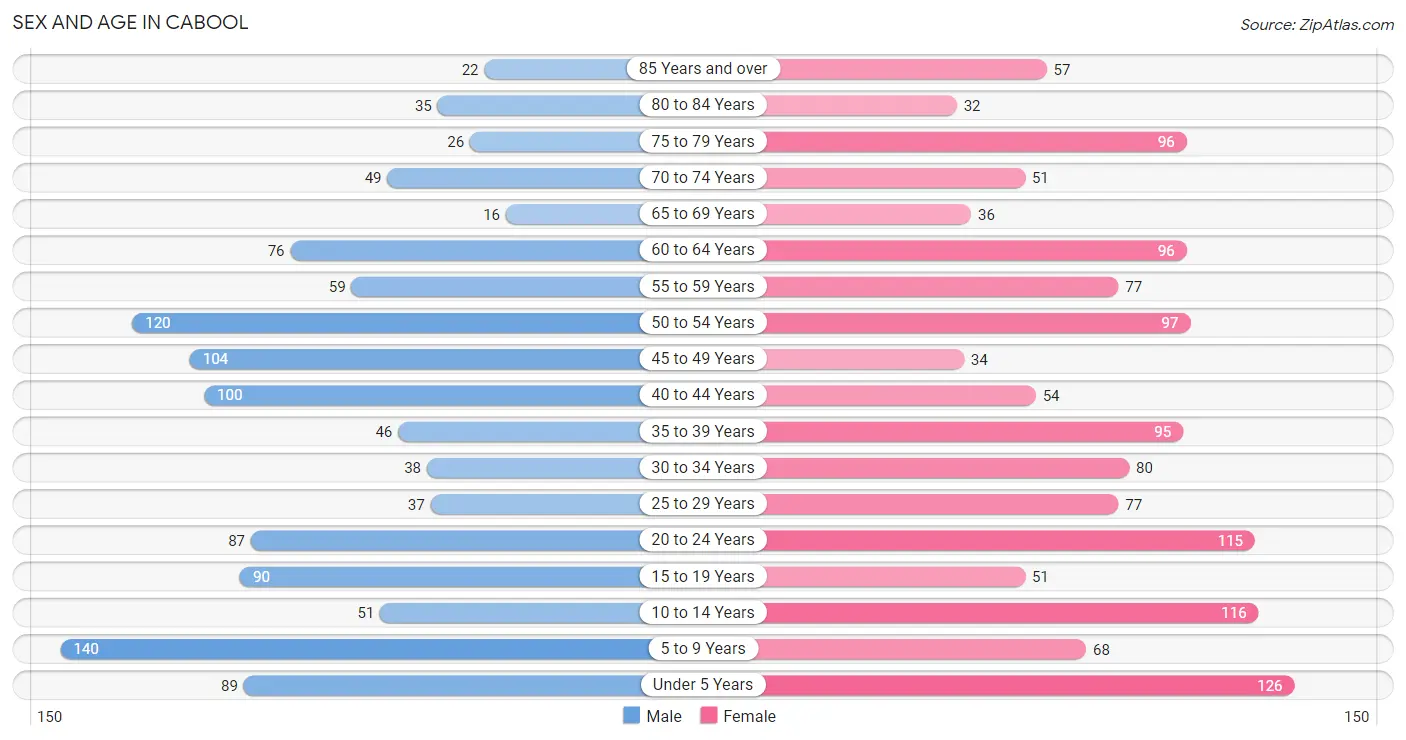
| Age Bracket | Male | Female |
| Under 5 Years | 89 (7.5%) | 126 (9.3%) |
| 5 to 9 Years | 140 (11.8%) | 68 (5.0%) |
| 10 to 14 Years | 51 (4.3%) | 116 (8.5%) |
| 15 to 19 Years | 90 (7.6%) | 51 (3.8%) |
| 20 to 24 Years | 87 (7.3%) | 115 (8.5%) |
| 25 to 29 Years | 37 (3.1%) | 77 (5.7%) |
| 30 to 34 Years | 38 (3.2%) | 80 (5.9%) |
| 35 to 39 Years | 46 (3.9%) | 95 (7.0%) |
| 40 to 44 Years | 100 (8.4%) | 54 (4.0%) |
| 45 to 49 Years | 104 (8.8%) | 34 (2.5%) |
| 50 to 54 Years | 120 (10.1%) | 97 (7.1%) |
| 55 to 59 Years | 59 (5.0%) | 77 (5.7%) |
| 60 to 64 Years | 76 (6.4%) | 96 (7.1%) |
| 65 to 69 Years | 16 (1.3%) | 36 (2.6%) |
| 70 to 74 Years | 49 (4.1%) | 51 (3.8%) |
| 75 to 79 Years | 26 (2.2%) | 96 (7.1%) |
| 80 to 84 Years | 35 (2.9%) | 32 (2.4%) |
| 85 Years and over | 22 (1.9%) | 57 (4.2%) |
| Total | 1,185 (100.0%) | 1,358 (100.0%) |
Families and Households in Cabool
Median Family Size in Cabool
The median family size in Cabool is 3.22 persons per family, with single male/father families (22 | 3.6%) accounting for the largest median family size of 3.82 persons per family. On the other hand, single female/mother families (165 | 27.0%) represent the smallest median family size with 2.88 persons per family.
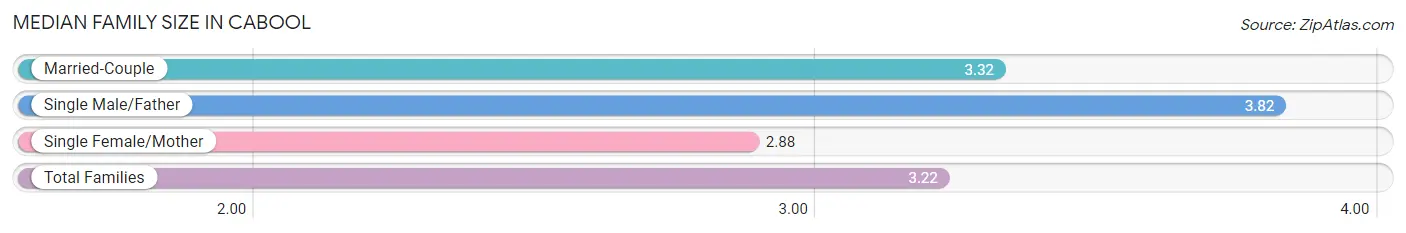
| Family Type | # Families | Family Size |
| Married-Couple | 424 (69.4%) | 3.32 |
| Single Male/Father | 22 (3.6%) | 3.82 |
| Single Female/Mother | 165 (27.0%) | 2.88 |
| Total Families | 611 (100.0%) | 3.22 |
Median Household Size in Cabool
The median household size in Cabool is 2.48 persons per household, with single male/father households (22 | 2.2%) accounting for the largest median household size of 4.55 persons per household. non-family households (373 | 37.9%) represent the smallest median household size with 1.10 persons per household.
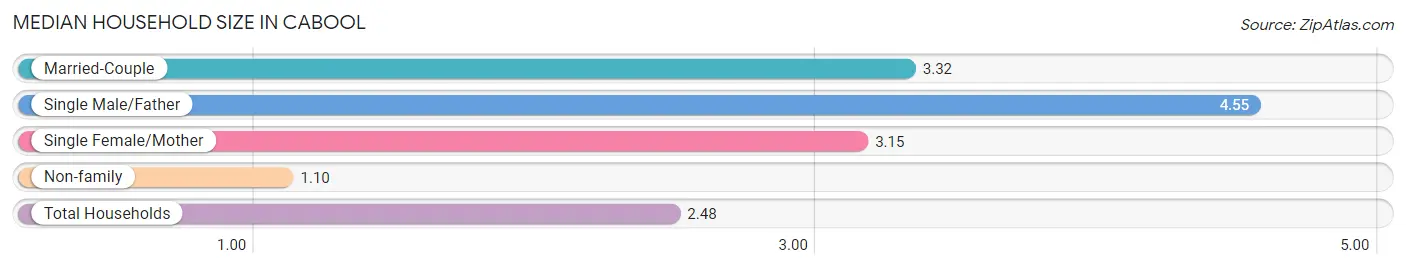
| Household Type | # Households | Household Size |
| Married-Couple | 424 (43.1%) | 3.32 |
| Single Male/Father | 22 (2.2%) | 4.55 |
| Single Female/Mother | 165 (16.8%) | 3.15 |
| Non-family | 373 (37.9%) | 1.10 |
| Total Households | 984 (100.0%) | 2.48 |
Household Size by Marriage Status in Cabool
Out of a total of 984 households in Cabool, 611 (62.1%) are family households, while 373 (37.9%) are nonfamily households. The most numerous type of family households are 2-person households, comprising 276, and the most common type of nonfamily households are 1-person households, comprising 340.
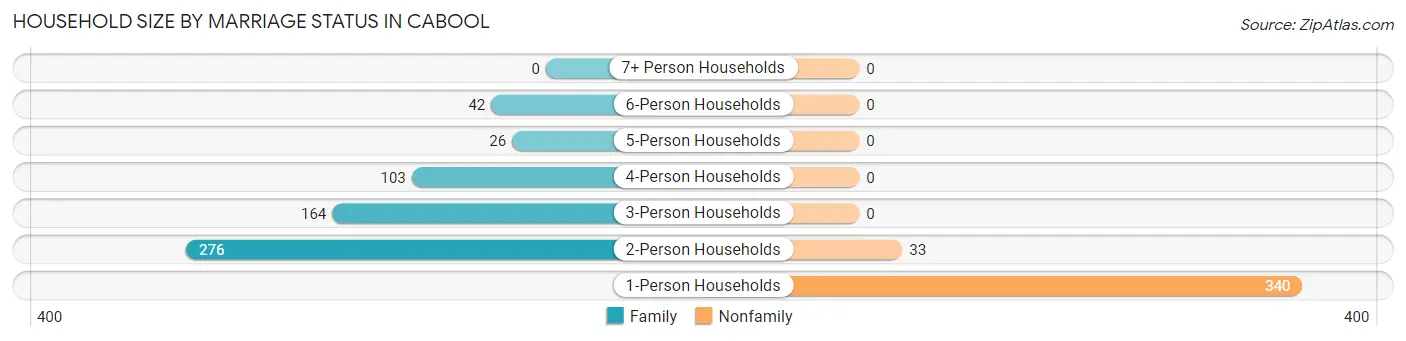
| Household Size | Family Households | Nonfamily Households |
| 1-Person Households | - | 340 (34.5%) |
| 2-Person Households | 276 (28.1%) | 33 (3.4%) |
| 3-Person Households | 164 (16.7%) | 0 (0.0%) |
| 4-Person Households | 103 (10.5%) | 0 (0.0%) |
| 5-Person Households | 26 (2.6%) | 0 (0.0%) |
| 6-Person Households | 42 (4.3%) | 0 (0.0%) |
| 7+ Person Households | 0 (0.0%) | 0 (0.0%) |
| Total | 611 (62.1%) | 373 (37.9%) |
Female Fertility in Cabool
Fertility by Age in Cabool
Average fertility rate in Cabool is 198.0 births per 1,000 women. Women in the age bracket of 20 to 34 years have the highest fertility rate with 268.0 births per 1,000 women. Women in the age bracket of 20 to 34 years acount for 72.3% of all women with births.
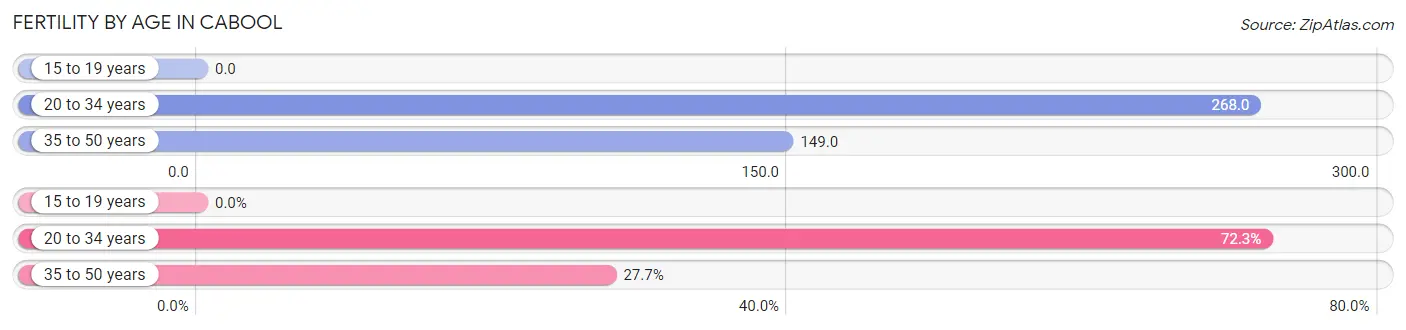
| Age Bracket | Women with Births | Births / 1,000 Women |
| 15 to 19 years | 0 (0.0%) | 0.0 |
| 20 to 34 years | 73 (72.3%) | 268.0 |
| 35 to 50 years | 28 (27.7%) | 149.0 |
| Total | 101 (100.0%) | 198.0 |
Fertility by Age by Marriage Status in Cabool
89.1% of women with births (101) in Cabool are married. The highest percentage of unmarried women with births falls into 20 to 34 years age bracket with 15.1% of them unmarried at the time of birth, while the lowest percentage of unmarried women with births belong to 35 to 50 years age bracket with 0.0% of them unmarried.
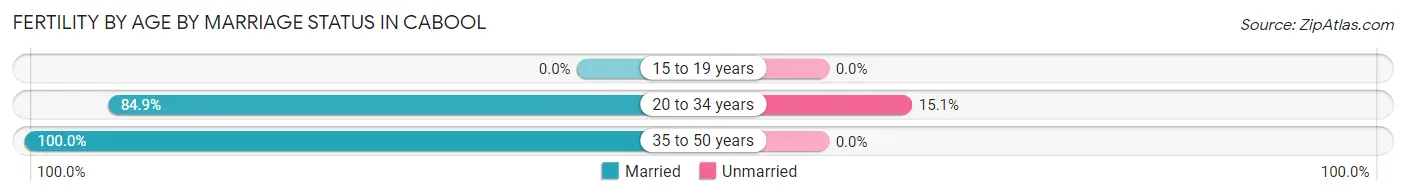
| Age Bracket | Married | Unmarried |
| 15 to 19 years | 0 (0.0%) | 0 (0.0%) |
| 20 to 34 years | 62 (84.9%) | 11 (15.1%) |
| 35 to 50 years | 28 (100.0%) | 0 (0.0%) |
| Total | 90 (89.1%) | 11 (10.9%) |
Fertility by Education in Cabool
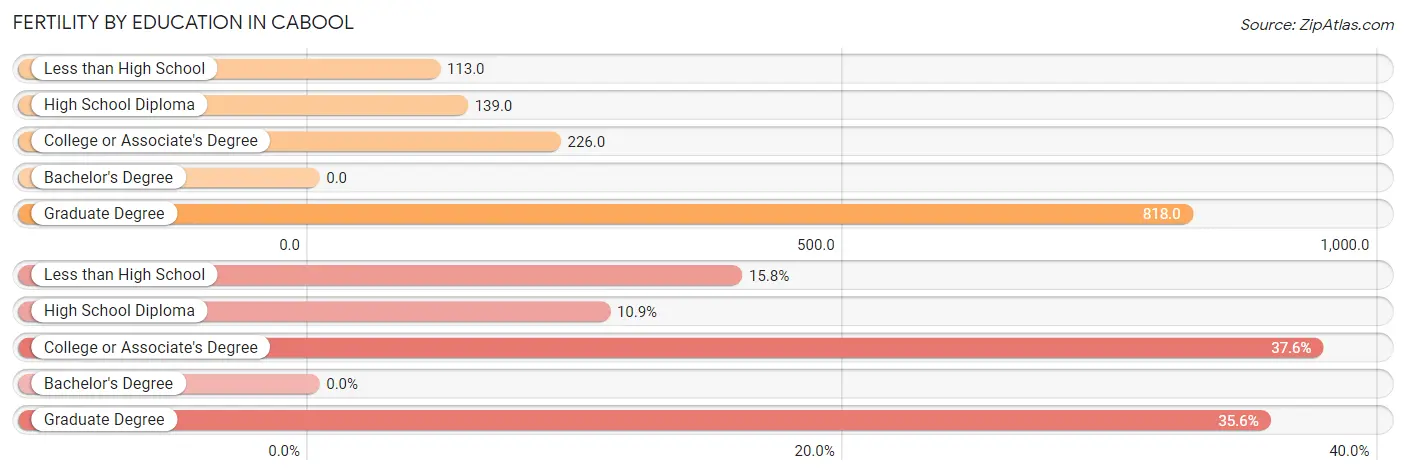
| Educational Attainment | Women with Births | Births / 1,000 Women |
| Less than High School | 16 (15.8%) | 113.0 |
| High School Diploma | 11 (10.9%) | 139.0 |
| College or Associate's Degree | 38 (37.6%) | 226.0 |
| Bachelor's Degree | 0 (0.0%) | 0.0 |
| Graduate Degree | 36 (35.6%) | 818.0 |
| Total | 101 (100.0%) | 198.0 |
Fertility by Education by Marriage Status in Cabool
10.9% of women with births in Cabool are unmarried. Women with the educational attainment of less than high school are most likely to be married with 100.0% of them married at childbirth, while women with the educational attainment of high school diploma are least likely to be married with 100.0% of them unmarried at childbirth.
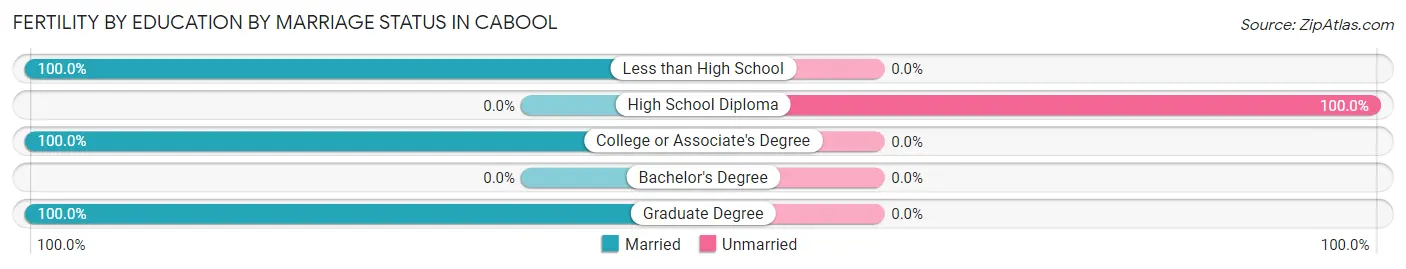
| Educational Attainment | Married | Unmarried |
| Less than High School | 16 (100.0%) | 0 (0.0%) |
| High School Diploma | 0 (0.0%) | 11 (100.0%) |
| College or Associate's Degree | 38 (100.0%) | 0 (0.0%) |
| Bachelor's Degree | 0 (0.0%) | 0 (0.0%) |
| Graduate Degree | 36 (100.0%) | 0 (0.0%) |
| Total | 90 (89.1%) | 11 (10.9%) |
Employment Characteristics in Cabool
Employment by Class of Employer in Cabool
Among the 891 employed individuals in Cabool, private company employees (544 | 61.1%), self-employed (not incorporated) (140 | 15.7%), and local government employees (81 | 9.1%) make up the most common classes of employment.
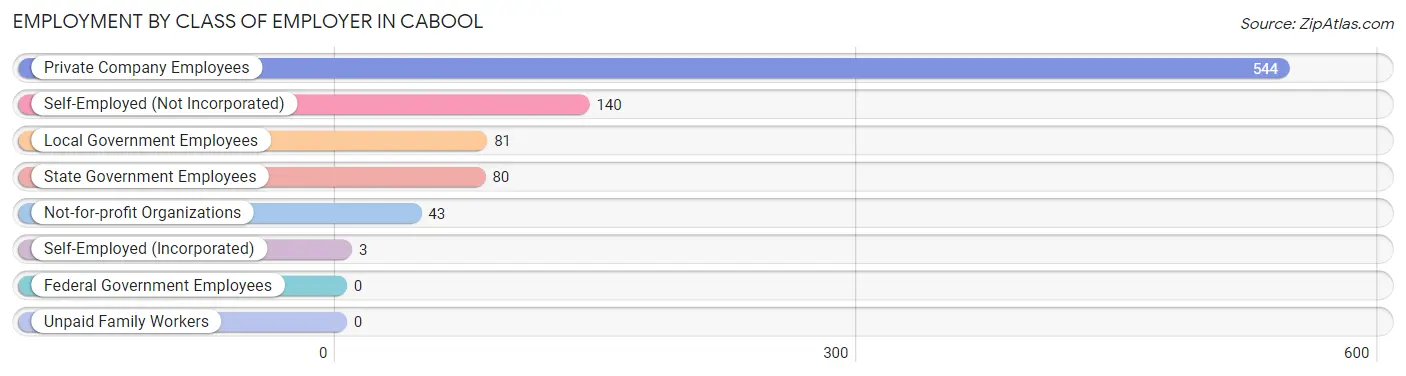
| Employer Class | # Employees | % Employees |
| Private Company Employees | 544 | 61.1% |
| Self-Employed (Incorporated) | 3 | 0.3% |
| Self-Employed (Not Incorporated) | 140 | 15.7% |
| Not-for-profit Organizations | 43 | 4.8% |
| Local Government Employees | 81 | 9.1% |
| State Government Employees | 80 | 9.0% |
| Federal Government Employees | 0 | 0.0% |
| Unpaid Family Workers | 0 | 0.0% |
| Total | 891 | 100.0% |
Employment Status by Age in Cabool
According to the labor force statistics for Cabool, out of the total population over 16 years of age (1,886), 49.2% or 928 individuals are in the labor force, with 2.4% or 22 of them unemployed. The age group with the highest labor force participation rate is 25 to 29 years, with 79.8% or 91 individuals in the labor force. Within the labor force, the 16 to 19 years age range has the highest percentage of unemployed individuals, with 36.8% or 7 of them being unemployed.
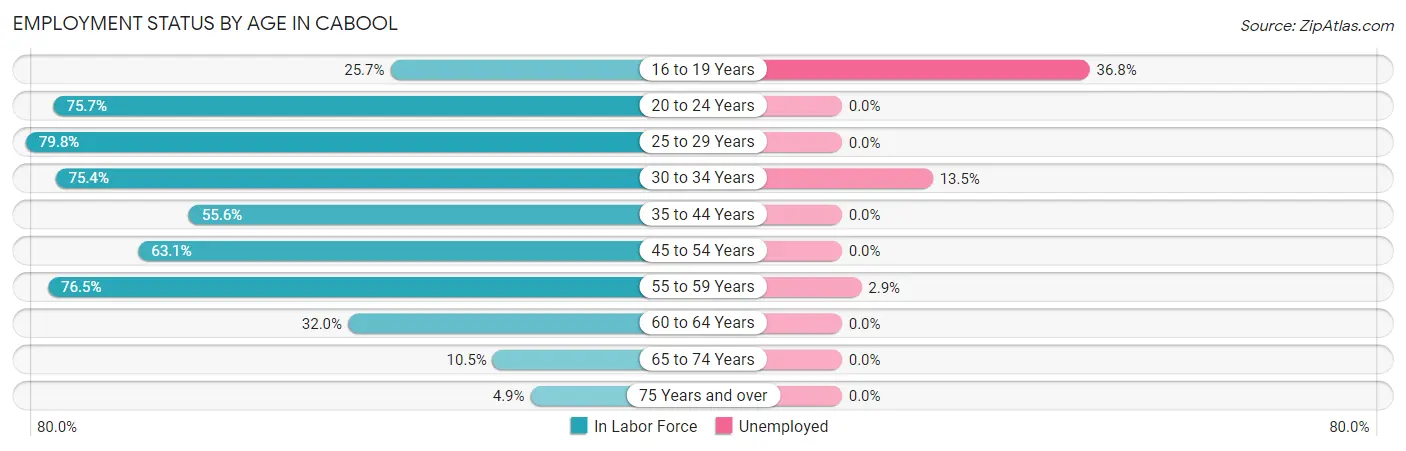
| Age Bracket | In Labor Force | Unemployed |
| 16 to 19 Years | 19 (25.7%) | 7 (36.8%) |
| 20 to 24 Years | 153 (75.7%) | 0 (0.0%) |
| 25 to 29 Years | 91 (79.8%) | 0 (0.0%) |
| 30 to 34 Years | 89 (75.4%) | 12 (13.5%) |
| 35 to 44 Years | 164 (55.6%) | 0 (0.0%) |
| 45 to 54 Years | 224 (63.1%) | 0 (0.0%) |
| 55 to 59 Years | 104 (76.5%) | 3 (2.9%) |
| 60 to 64 Years | 55 (32.0%) | 0 (0.0%) |
| 65 to 74 Years | 16 (10.5%) | 0 (0.0%) |
| 75 Years and over | 13 (4.9%) | 0 (0.0%) |
| Total | 928 (49.2%) | 22 (2.4%) |
Employment Status by Educational Attainment in Cabool
According to labor force statistics for Cabool, 61.1% of individuals (727) out of the total population between 25 and 64 years of age (1,190) are in the labor force, with 2.1% or 15 of them being unemployed. The group with the highest labor force participation rate are those with the educational attainment of bachelor's degree or higher, with 85.7% or 216 individuals in the labor force. Within the labor force, individuals with college / associate degree education have the highest percentage of unemployment, with 5.5% or 11 of them being unemployed.
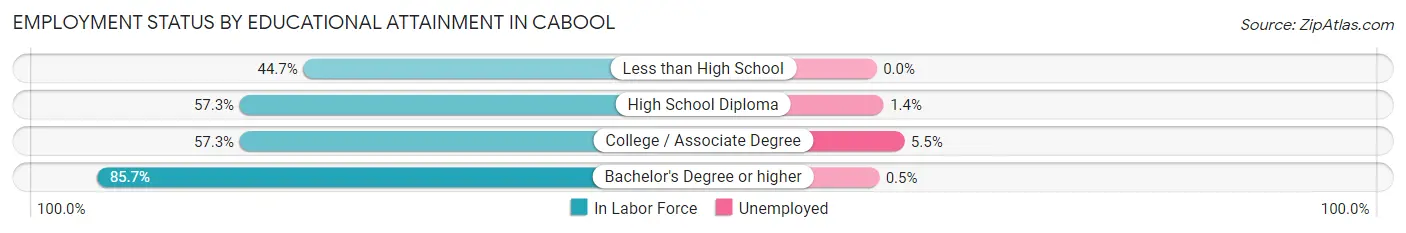
| Educational Attainment | In Labor Force | Unemployed |
| Less than High School | 93 (44.7%) | 0 (0.0%) |
| High School Diploma | 217 (57.3%) | 5 (1.4%) |
| College / Associate Degree | 201 (57.3%) | 19 (5.5%) |
| Bachelor's Degree or higher | 216 (85.7%) | 1 (0.5%) |
| Total | 727 (61.1%) | 25 (2.1%) |
Employment Occupations by Sex in Cabool
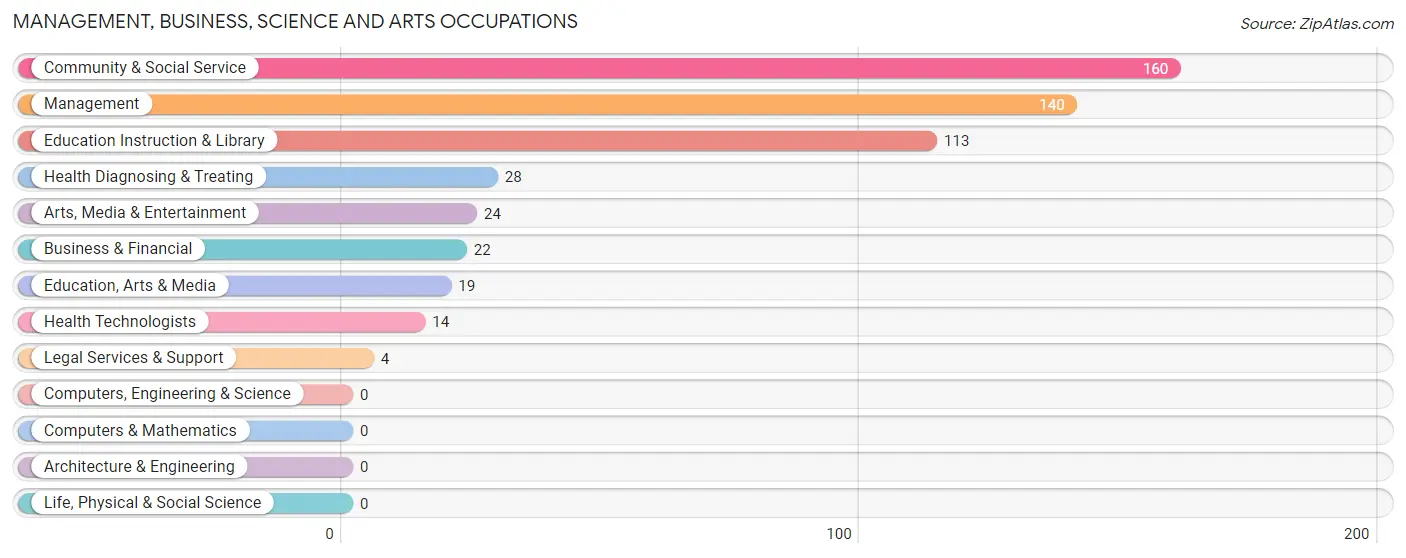
Management, Business, Science and Arts Occupations
The most common Management, Business, Science and Arts occupations in Cabool are Community & Social Service (160 | 17.7%), Management (140 | 15.4%), Education Instruction & Library (113 | 12.5%), Health Diagnosing & Treating (28 | 3.1%), and Arts, Media & Entertainment (24 | 2.6%).
Management, Business, Science and Arts Occupations by Sex
Within the Management, Business, Science and Arts occupations in Cabool, the most male-oriented occupations are Business & Financial (100.0%), Management (55.7%), and Education Instruction & Library (20.3%), while the most female-oriented occupations are Education, Arts & Media (100.0%), Legal Services & Support (100.0%), and Arts, Media & Entertainment (100.0%).
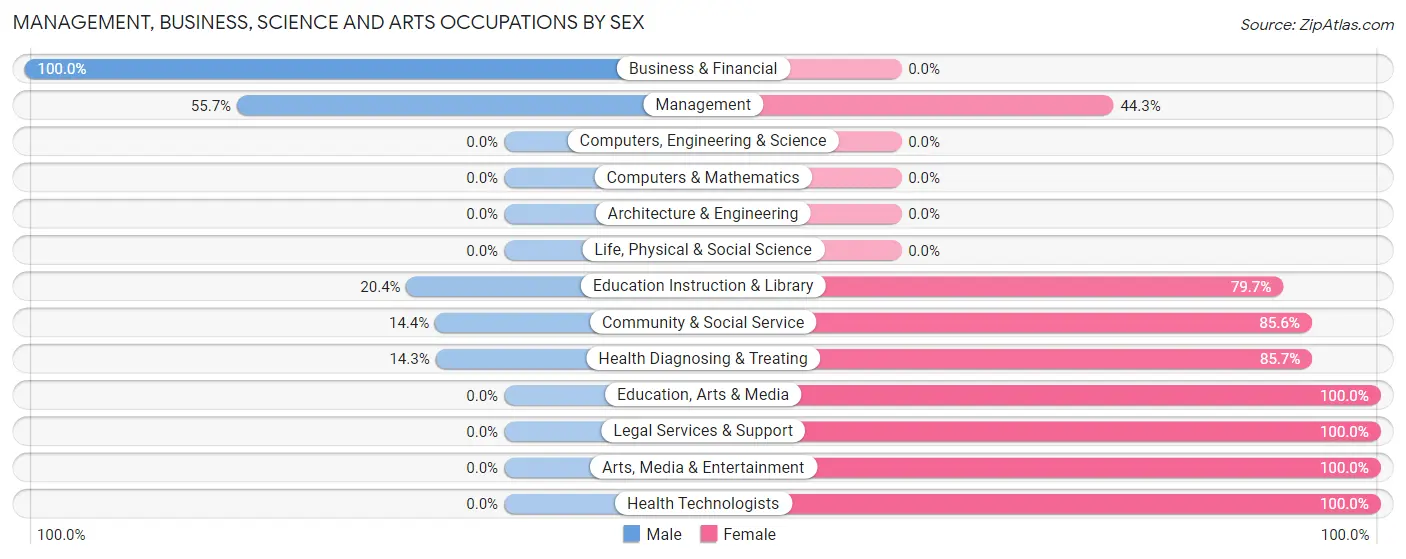
| Occupation | Male | Female |
| Management | 78 (55.7%) | 62 (44.3%) |
| Business & Financial | 22 (100.0%) | 0 (0.0%) |
| Computers, Engineering & Science | 0 (0.0%) | 0 (0.0%) |
| Computers & Mathematics | 0 (0.0%) | 0 (0.0%) |
| Architecture & Engineering | 0 (0.0%) | 0 (0.0%) |
| Life, Physical & Social Science | 0 (0.0%) | 0 (0.0%) |
| Community & Social Service | 23 (14.4%) | 137 (85.6%) |
| Education, Arts & Media | 0 (0.0%) | 19 (100.0%) |
| Legal Services & Support | 0 (0.0%) | 4 (100.0%) |
| Education Instruction & Library | 23 (20.3%) | 90 (79.6%) |
| Arts, Media & Entertainment | 0 (0.0%) | 24 (100.0%) |
| Health Diagnosing & Treating | 4 (14.3%) | 24 (85.7%) |
| Health Technologists | 0 (0.0%) | 14 (100.0%) |
| Total (Category) | 127 (36.3%) | 223 (63.7%) |
| Total (Overall) | 465 (51.3%) | 441 (48.7%) |
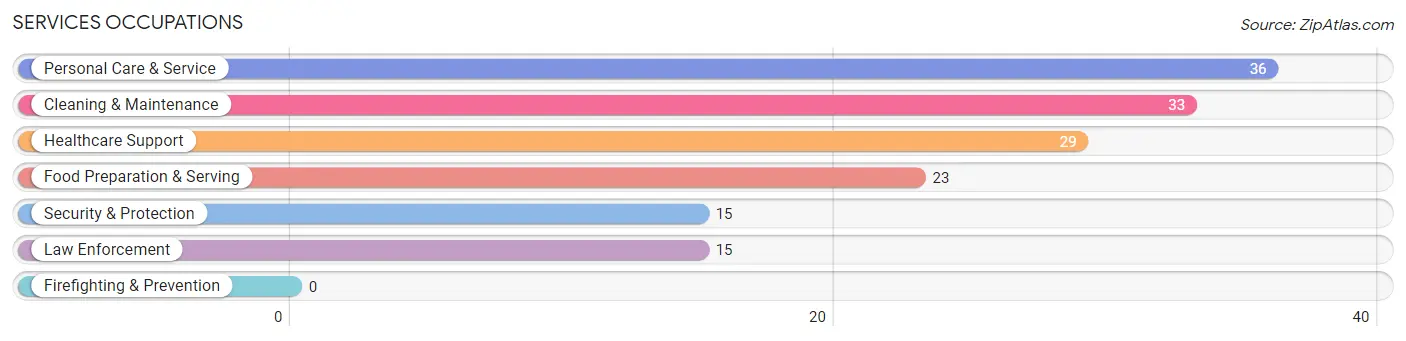
Services Occupations
The most common Services occupations in Cabool are Personal Care & Service (36 | 4.0%), Cleaning & Maintenance (33 | 3.6%), Healthcare Support (29 | 3.2%), Food Preparation & Serving (23 | 2.5%), and Security & Protection (15 | 1.7%).
Services Occupations by Sex
Within the Services occupations in Cabool, the most male-oriented occupations are Security & Protection (100.0%), Law Enforcement (100.0%), and Food Preparation & Serving (95.7%), while the most female-oriented occupations are Cleaning & Maintenance (69.7%), Healthcare Support (58.6%), and Personal Care & Service (16.7%).
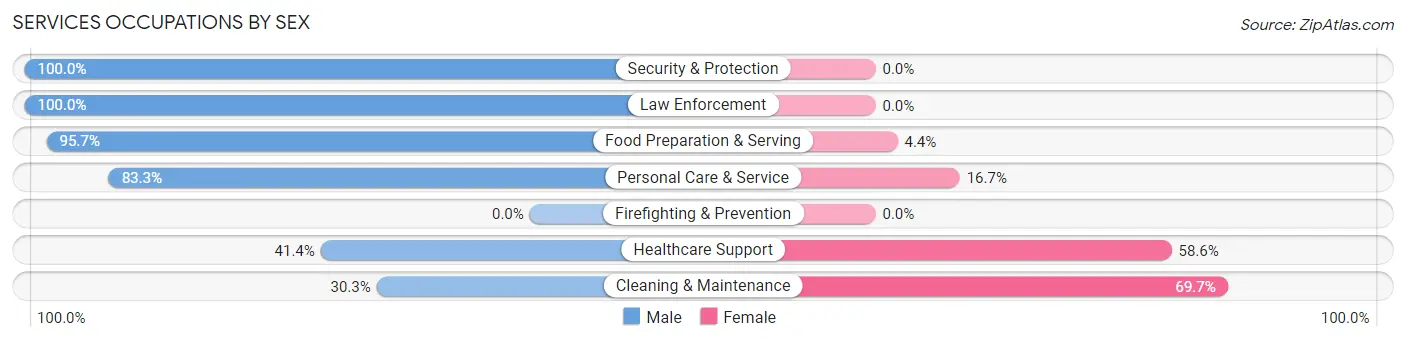
| Occupation | Male | Female |
| Healthcare Support | 12 (41.4%) | 17 (58.6%) |
| Security & Protection | 15 (100.0%) | 0 (0.0%) |
| Firefighting & Prevention | 0 (0.0%) | 0 (0.0%) |
| Law Enforcement | 15 (100.0%) | 0 (0.0%) |
| Food Preparation & Serving | 22 (95.7%) | 1 (4.3%) |
| Cleaning & Maintenance | 10 (30.3%) | 23 (69.7%) |
| Personal Care & Service | 30 (83.3%) | 6 (16.7%) |
| Total (Category) | 89 (65.4%) | 47 (34.6%) |
| Total (Overall) | 465 (51.3%) | 441 (48.7%) |
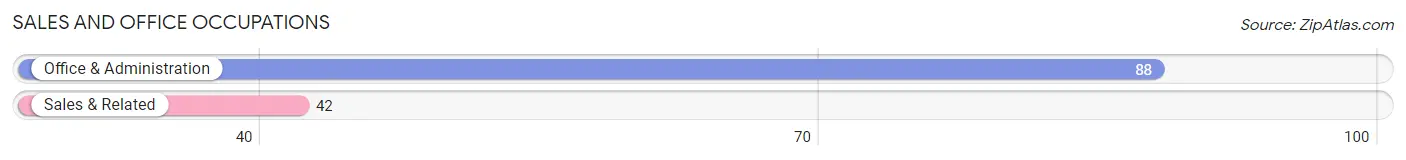
Sales and Office Occupations
The most common Sales and Office occupations in Cabool are Office & Administration (88 | 9.7%), and Sales & Related (42 | 4.6%).
Sales and Office Occupations by Sex
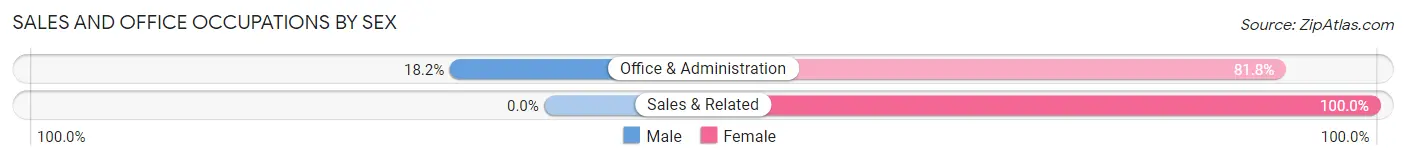
| Occupation | Male | Female |
| Sales & Related | 0 (0.0%) | 42 (100.0%) |
| Office & Administration | 16 (18.2%) | 72 (81.8%) |
| Total (Category) | 16 (12.3%) | 114 (87.7%) |
| Total (Overall) | 465 (51.3%) | 441 (48.7%) |
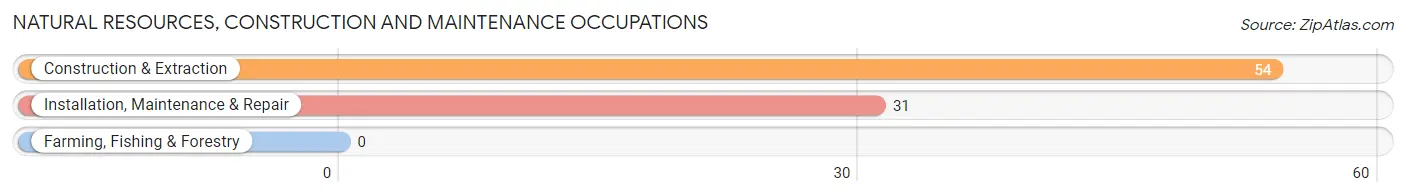
Natural Resources, Construction and Maintenance Occupations
The most common Natural Resources, Construction and Maintenance occupations in Cabool are Construction & Extraction (54 | 6.0%), and Installation, Maintenance & Repair (31 | 3.4%).
Natural Resources, Construction and Maintenance Occupations by Sex
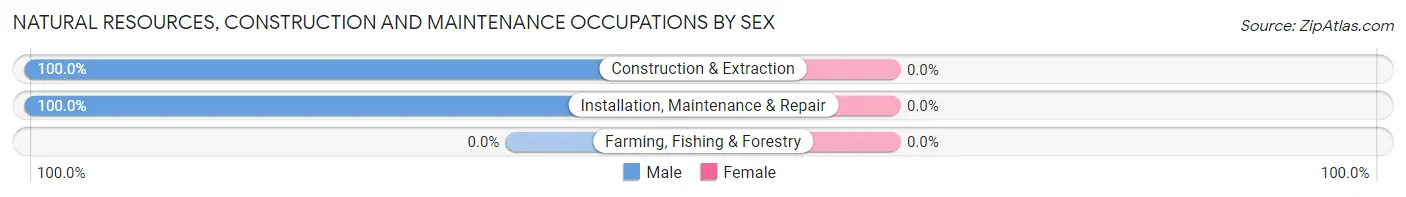
| Occupation | Male | Female |
| Farming, Fishing & Forestry | 0 (0.0%) | 0 (0.0%) |
| Construction & Extraction | 54 (100.0%) | 0 (0.0%) |
| Installation, Maintenance & Repair | 31 (100.0%) | 0 (0.0%) |
| Total (Category) | 85 (100.0%) | 0 (0.0%) |
| Total (Overall) | 465 (51.3%) | 441 (48.7%) |
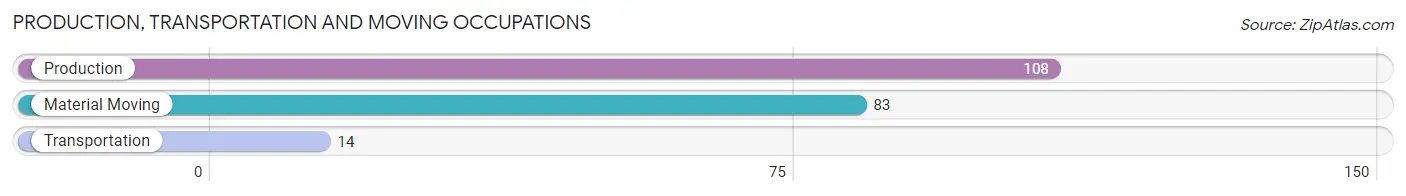
Production, Transportation and Moving Occupations
The most common Production, Transportation and Moving occupations in Cabool are Production (108 | 11.9%), Material Moving (83 | 9.2%), and Transportation (14 | 1.5%).
Production, Transportation and Moving Occupations by Sex
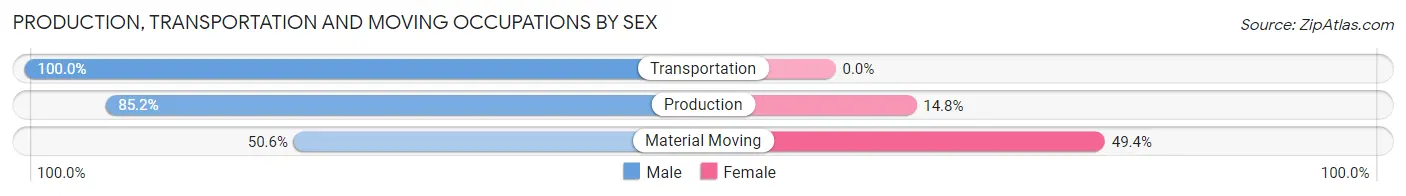
| Occupation | Male | Female |
| Production | 92 (85.2%) | 16 (14.8%) |
| Transportation | 14 (100.0%) | 0 (0.0%) |
| Material Moving | 42 (50.6%) | 41 (49.4%) |
| Total (Category) | 148 (72.2%) | 57 (27.8%) |
| Total (Overall) | 465 (51.3%) | 441 (48.7%) |
Employment Industries by Sex in Cabool
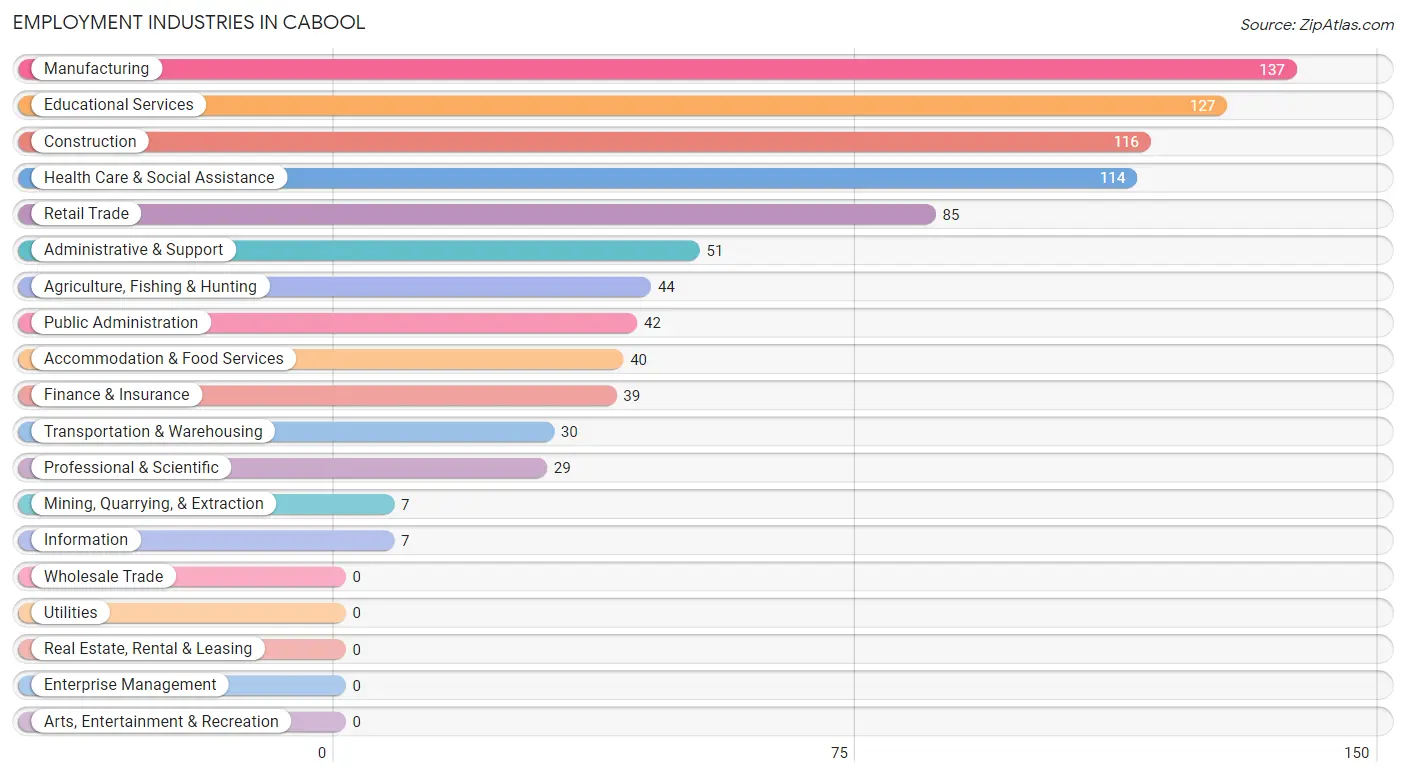
Employment Industries in Cabool
The major employment industries in Cabool include Manufacturing (137 | 15.1%), Educational Services (127 | 14.0%), Construction (116 | 12.8%), Health Care & Social Assistance (114 | 12.6%), and Retail Trade (85 | 9.4%).
Employment Industries by Sex in Cabool
The Cabool industries that see more men than women are Mining, Quarrying, & Extraction (100.0%), Construction (100.0%), and Information (100.0%), whereas the industries that tend to have a higher number of women are Retail Trade (87.1%), Educational Services (81.9%), and Health Care & Social Assistance (81.6%).
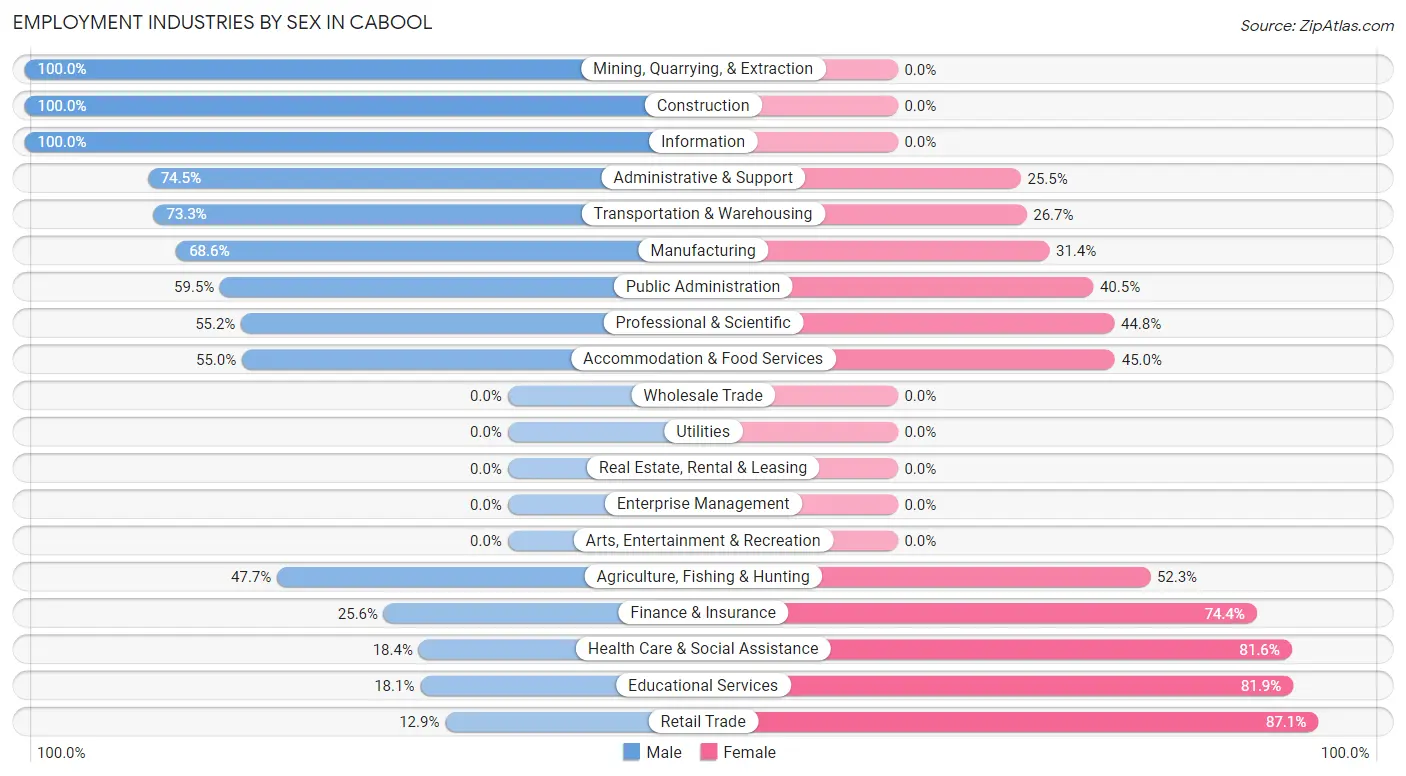
| Industry | Male | Female |
| Agriculture, Fishing & Hunting | 21 (47.7%) | 23 (52.3%) |
| Mining, Quarrying, & Extraction | 7 (100.0%) | 0 (0.0%) |
| Construction | 116 (100.0%) | 0 (0.0%) |
| Manufacturing | 94 (68.6%) | 43 (31.4%) |
| Wholesale Trade | 0 (0.0%) | 0 (0.0%) |
| Retail Trade | 11 (12.9%) | 74 (87.1%) |
| Transportation & Warehousing | 22 (73.3%) | 8 (26.7%) |
| Utilities | 0 (0.0%) | 0 (0.0%) |
| Information | 7 (100.0%) | 0 (0.0%) |
| Finance & Insurance | 10 (25.6%) | 29 (74.4%) |
| Real Estate, Rental & Leasing | 0 (0.0%) | 0 (0.0%) |
| Professional & Scientific | 16 (55.2%) | 13 (44.8%) |
| Enterprise Management | 0 (0.0%) | 0 (0.0%) |
| Administrative & Support | 38 (74.5%) | 13 (25.5%) |
| Educational Services | 23 (18.1%) | 104 (81.9%) |
| Health Care & Social Assistance | 21 (18.4%) | 93 (81.6%) |
| Arts, Entertainment & Recreation | 0 (0.0%) | 0 (0.0%) |
| Accommodation & Food Services | 22 (55.0%) | 18 (45.0%) |
| Public Administration | 25 (59.5%) | 17 (40.5%) |
| Total | 465 (51.3%) | 441 (48.7%) |
Education in Cabool
School Enrollment in Cabool
The most common levels of schooling among the 651 students in Cabool are elementary school (177 | 27.2%), high school (146 | 22.4%), and middle school (109 | 16.7%).
| School Level | # Students | % Students |
| Nursery / Preschool | 37 | 5.7% |
| Kindergarten | 48 | 7.4% |
| Elementary School | 177 | 27.2% |
| Middle School | 109 | 16.7% |
| High School | 146 | 22.4% |
| College / Undergraduate | 103 | 15.8% |
| Graduate / Professional | 31 | 4.8% |
| Total | 651 | 100.0% |
School Enrollment by Age by Funding Source in Cabool
Out of a total of 651 students who are enrolled in schools in Cabool, 119 (18.3%) attend a private institution, while the remaining 532 (81.7%) are enrolled in public schools. The age group of 3 to 4 year olds has the highest likelihood of being enrolled in private schools, with 17 (63.0% in the age bracket) enrolled. Conversely, the age group of 18 to 19 year olds has the lowest likelihood of being enrolled in a private school, with 37 (100.0% in the age bracket) attending a public institution.
| Age Bracket | Public School | Private School |
| 3 to 4 Year Olds | 10 (37.0%) | 17 (63.0%) |
| 5 to 9 Year Old | 193 (92.8%) | 15 (7.2%) |
| 10 to 14 Year Olds | 114 (74.5%) | 39 (25.5%) |
| 15 to 17 Year Olds | 90 (86.5%) | 14 (13.5%) |
| 18 to 19 Year Olds | 37 (100.0%) | 0 (0.0%) |
| 20 to 24 Year Olds | 14 (63.6%) | 8 (36.4%) |
| 25 to 34 Year Olds | 41 (61.2%) | 26 (38.8%) |
| 35 Years and over | 33 (100.0%) | 0 (0.0%) |
| Total | 532 (81.7%) | 119 (18.3%) |
Educational Attainment by Field of Study in Cabool
Education (68 | 18.1%), liberal arts & history (57 | 15.2%), literature & languages (53 | 14.1%), psychology (47 | 12.5%), and science & technology (42 | 11.2%) are the most common fields of study among 376 individuals in Cabool who have obtained a bachelor's degree or higher.
| Field of Study | # Graduates | % Graduates |
| Computers & Mathematics | 0 | 0.0% |
| Bio, Nature & Agricultural | 9 | 2.4% |
| Physical & Health Sciences | 5 | 1.3% |
| Psychology | 47 | 12.5% |
| Social Sciences | 8 | 2.1% |
| Engineering | 0 | 0.0% |
| Multidisciplinary Studies | 0 | 0.0% |
| Science & Technology | 42 | 11.2% |
| Business | 18 | 4.8% |
| Education | 68 | 18.1% |
| Literature & Languages | 53 | 14.1% |
| Liberal Arts & History | 57 | 15.2% |
| Visual & Performing Arts | 24 | 6.4% |
| Communications | 22 | 5.9% |
| Arts & Humanities | 23 | 6.1% |
| Total | 376 | 100.0% |
Transportation & Commute in Cabool
Vehicle Availability by Sex in Cabool
The most prevalent vehicle ownership categories in Cabool are males with 2 vehicles (199, accounting for 42.8%) and females with 2 vehicles (193, making up 46.8%).
| Vehicles Available | Male | Female |
| No Vehicle | 9 (1.9%) | 9 (2.1%) |
| 1 Vehicle | 74 (15.9%) | 67 (15.8%) |
| 2 Vehicles | 199 (42.8%) | 193 (45.4%) |
| 3 Vehicles | 124 (26.7%) | 112 (26.4%) |
| 4 Vehicles | 59 (12.7%) | 44 (10.3%) |
| 5 or more Vehicles | 0 (0.0%) | 0 (0.0%) |
| Total | 465 (100.0%) | 425 (100.0%) |
Commute Time in Cabool
The most frequently occuring commute durations in Cabool are less than 5 minutes (296 commuters, 34.1%), 5 to 9 minutes (171 commuters, 19.7%), and 15 to 19 minutes (131 commuters, 15.1%).
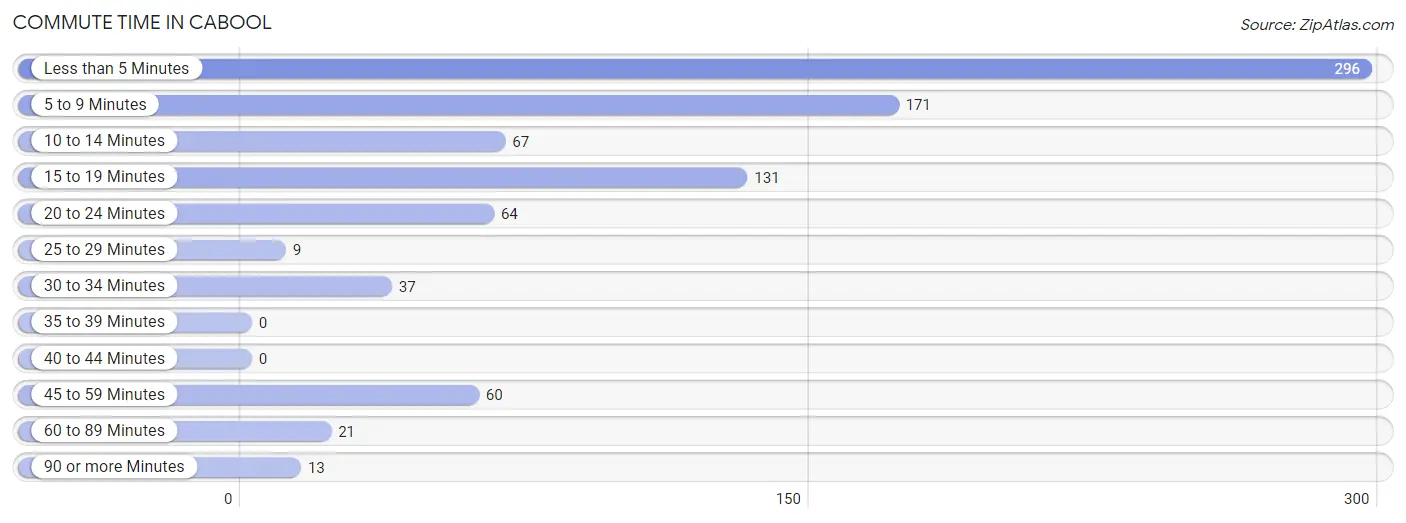
| Commute Time | # Commuters | % Commuters |
| Less than 5 Minutes | 296 | 34.1% |
| 5 to 9 Minutes | 171 | 19.7% |
| 10 to 14 Minutes | 67 | 7.7% |
| 15 to 19 Minutes | 131 | 15.1% |
| 20 to 24 Minutes | 64 | 7.4% |
| 25 to 29 Minutes | 9 | 1.0% |
| 30 to 34 Minutes | 37 | 4.3% |
| 35 to 39 Minutes | 0 | 0.0% |
| 40 to 44 Minutes | 0 | 0.0% |
| 45 to 59 Minutes | 60 | 6.9% |
| 60 to 89 Minutes | 21 | 2.4% |
| 90 or more Minutes | 13 | 1.5% |
Commute Time by Sex in Cabool
The most common commute times in Cabool are less than 5 minutes (157 commuters, 34.1%) for males and less than 5 minutes (139 commuters, 34.1%) for females.
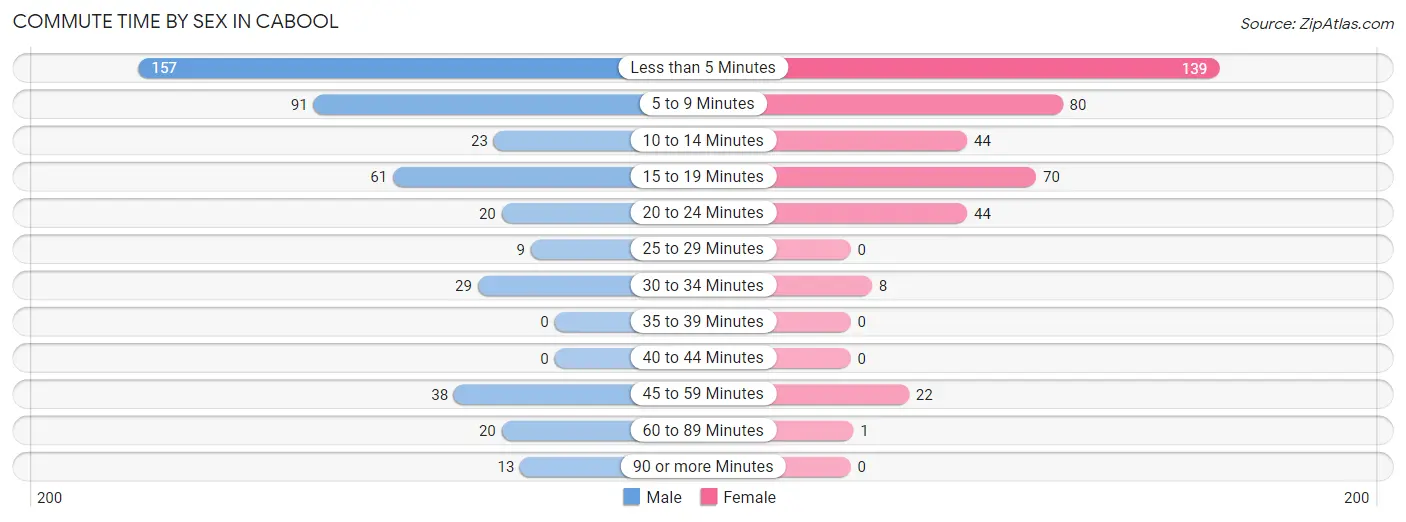
| Commute Time | Male | Female |
| Less than 5 Minutes | 157 (34.1%) | 139 (34.1%) |
| 5 to 9 Minutes | 91 (19.7%) | 80 (19.6%) |
| 10 to 14 Minutes | 23 (5.0%) | 44 (10.8%) |
| 15 to 19 Minutes | 61 (13.2%) | 70 (17.2%) |
| 20 to 24 Minutes | 20 (4.3%) | 44 (10.8%) |
| 25 to 29 Minutes | 9 (1.9%) | 0 (0.0%) |
| 30 to 34 Minutes | 29 (6.3%) | 8 (2.0%) |
| 35 to 39 Minutes | 0 (0.0%) | 0 (0.0%) |
| 40 to 44 Minutes | 0 (0.0%) | 0 (0.0%) |
| 45 to 59 Minutes | 38 (8.2%) | 22 (5.4%) |
| 60 to 89 Minutes | 20 (4.3%) | 1 (0.3%) |
| 90 or more Minutes | 13 (2.8%) | 0 (0.0%) |
Time of Departure to Work by Sex in Cabool
The most frequent times of departure to work in Cabool are 6:30 AM to 6:59 AM (104, 22.6%) for males and 7:30 AM to 7:59 AM (108, 26.5%) for females.
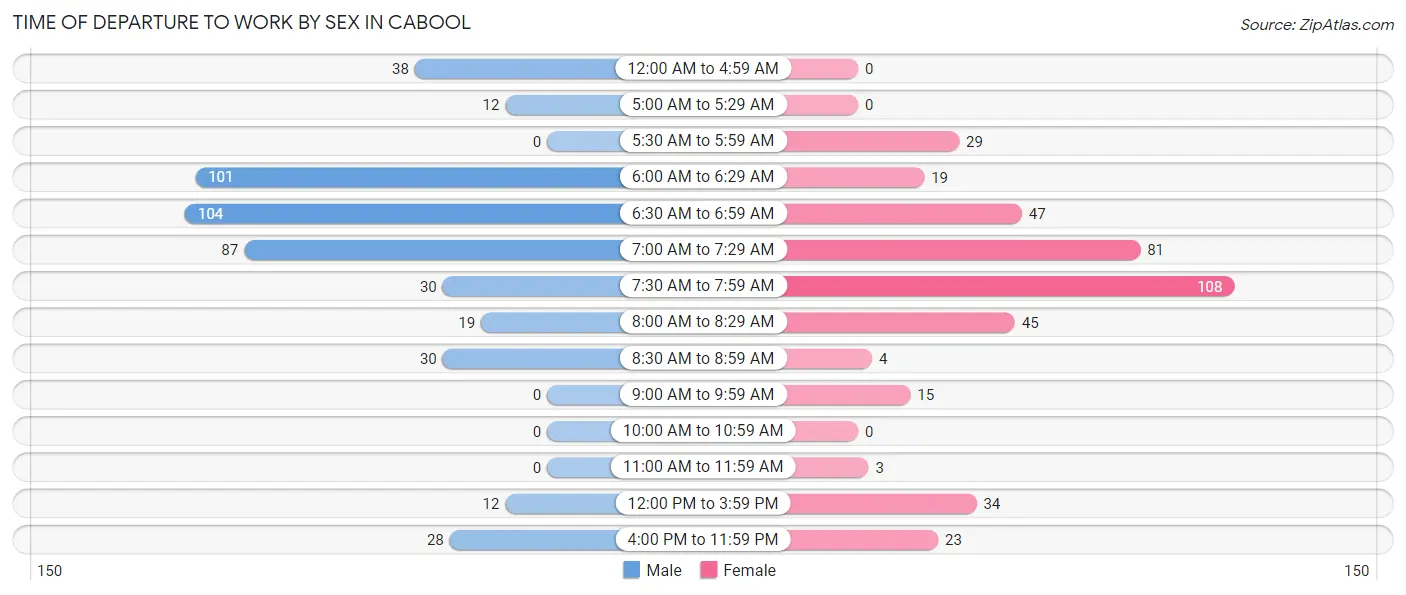
| Time of Departure | Male | Female |
| 12:00 AM to 4:59 AM | 38 (8.2%) | 0 (0.0%) |
| 5:00 AM to 5:29 AM | 12 (2.6%) | 0 (0.0%) |
| 5:30 AM to 5:59 AM | 0 (0.0%) | 29 (7.1%) |
| 6:00 AM to 6:29 AM | 101 (21.9%) | 19 (4.7%) |
| 6:30 AM to 6:59 AM | 104 (22.6%) | 47 (11.5%) |
| 7:00 AM to 7:29 AM | 87 (18.9%) | 81 (19.9%) |
| 7:30 AM to 7:59 AM | 30 (6.5%) | 108 (26.5%) |
| 8:00 AM to 8:29 AM | 19 (4.1%) | 45 (11.0%) |
| 8:30 AM to 8:59 AM | 30 (6.5%) | 4 (1.0%) |
| 9:00 AM to 9:59 AM | 0 (0.0%) | 15 (3.7%) |
| 10:00 AM to 10:59 AM | 0 (0.0%) | 0 (0.0%) |
| 11:00 AM to 11:59 AM | 0 (0.0%) | 3 (0.7%) |
| 12:00 PM to 3:59 PM | 12 (2.6%) | 34 (8.3%) |
| 4:00 PM to 11:59 PM | 28 (6.1%) | 23 (5.6%) |
| Total | 461 (100.0%) | 408 (100.0%) |
Housing Occupancy in Cabool
Occupancy by Ownership in Cabool
Of the total 984 dwellings in Cabool, owner-occupied units account for 585 (59.5%), while renter-occupied units make up 399 (40.6%).
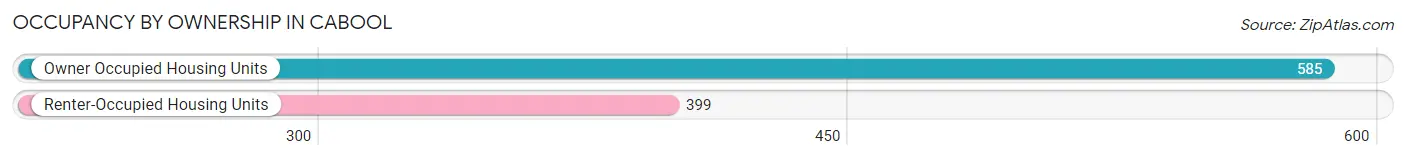
| Occupancy | # Housing Units | % Housing Units |
| Owner Occupied Housing Units | 585 | 59.5% |
| Renter-Occupied Housing Units | 399 | 40.6% |
| Total Occupied Housing Units | 984 | 100.0% |
Occupancy by Household Size in Cabool
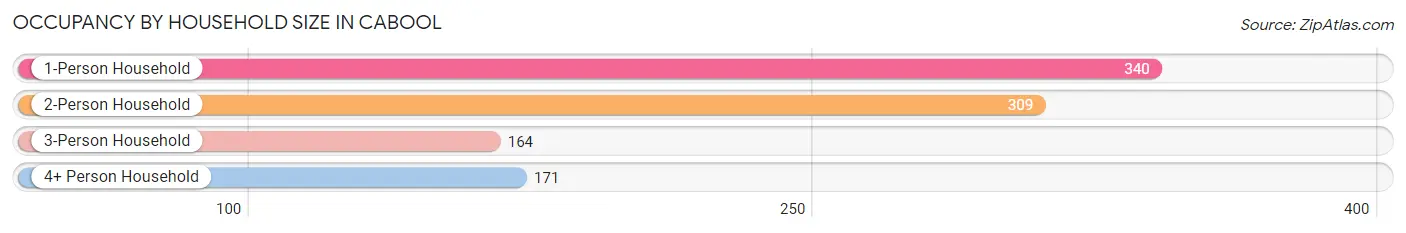
| Household Size | # Housing Units | % Housing Units |
| 1-Person Household | 340 | 34.5% |
| 2-Person Household | 309 | 31.4% |
| 3-Person Household | 164 | 16.7% |
| 4+ Person Household | 171 | 17.4% |
| Total Housing Units | 984 | 100.0% |
Occupancy by Ownership by Household Size in Cabool
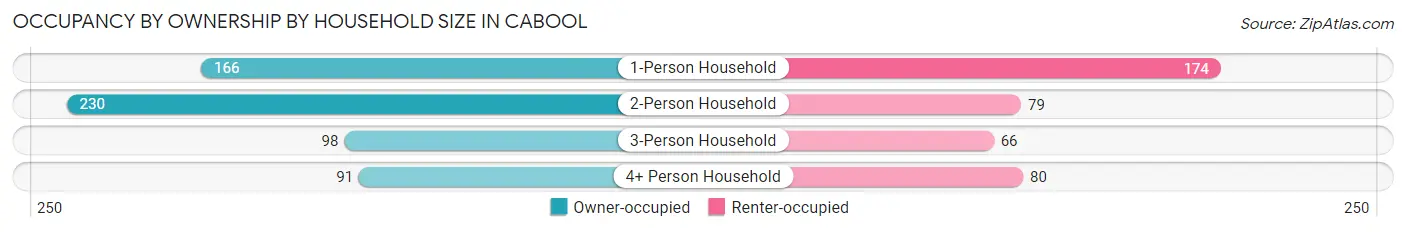
| Household Size | Owner-occupied | Renter-occupied |
| 1-Person Household | 166 (48.8%) | 174 (51.2%) |
| 2-Person Household | 230 (74.4%) | 79 (25.6%) |
| 3-Person Household | 98 (59.8%) | 66 (40.2%) |
| 4+ Person Household | 91 (53.2%) | 80 (46.8%) |
| Total Housing Units | 585 (59.5%) | 399 (40.6%) |
Occupancy by Educational Attainment in Cabool
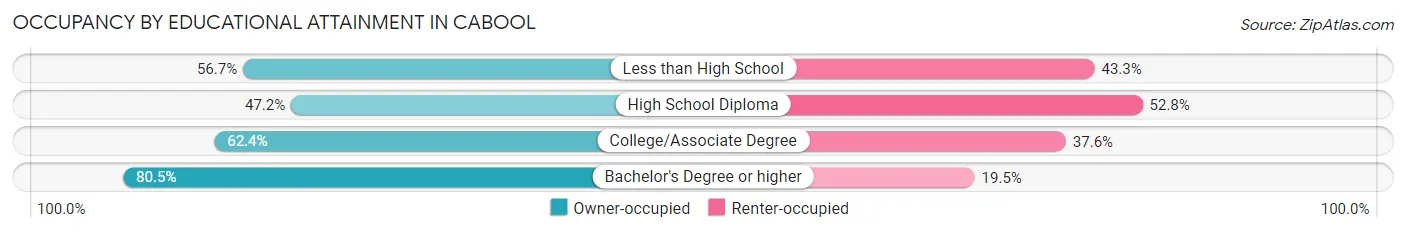
| Household Size | Owner-occupied | Renter-occupied |
| Less than High School | 110 (56.7%) | 84 (43.3%) |
| High School Diploma | 150 (47.2%) | 168 (52.8%) |
| College/Associate Degree | 189 (62.4%) | 114 (37.6%) |
| Bachelor's Degree or higher | 136 (80.5%) | 33 (19.5%) |
Occupancy by Age of Householder in Cabool
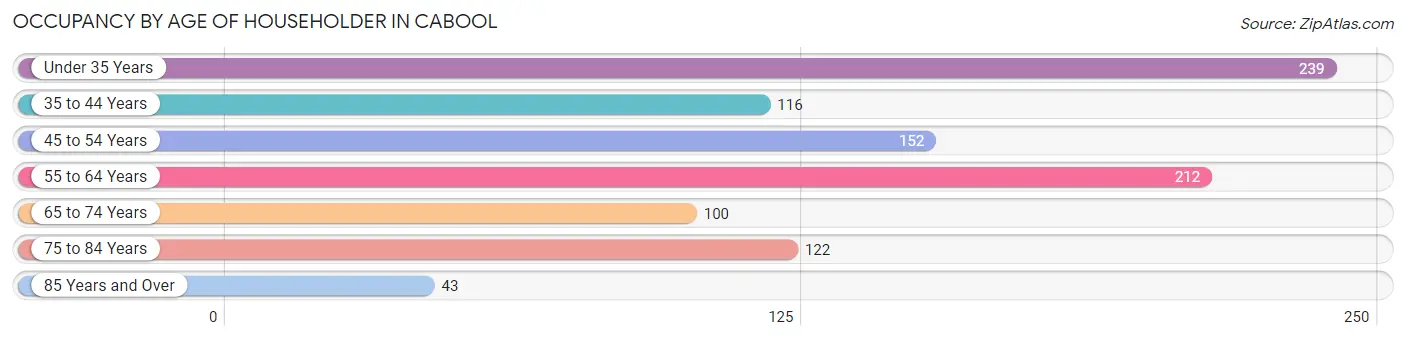
| Age Bracket | # Households | % Households |
| Under 35 Years | 239 | 24.3% |
| 35 to 44 Years | 116 | 11.8% |
| 45 to 54 Years | 152 | 15.4% |
| 55 to 64 Years | 212 | 21.5% |
| 65 to 74 Years | 100 | 10.2% |
| 75 to 84 Years | 122 | 12.4% |
| 85 Years and Over | 43 | 4.4% |
| Total | 984 | 100.0% |
Housing Finances in Cabool
Median Income by Occupancy in Cabool
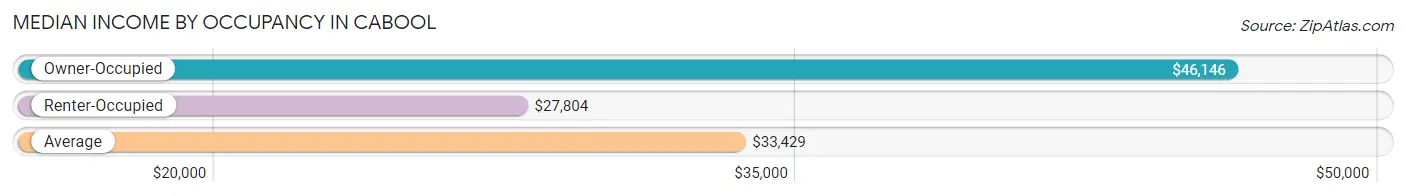
| Occupancy Type | # Households | Median Income |
| Owner-Occupied | 585 (59.5%) | $46,146 |
| Renter-Occupied | 399 (40.6%) | $27,804 |
| Average | 984 (100.0%) | $33,429 |
Occupancy by Householder Income Bracket in Cabool
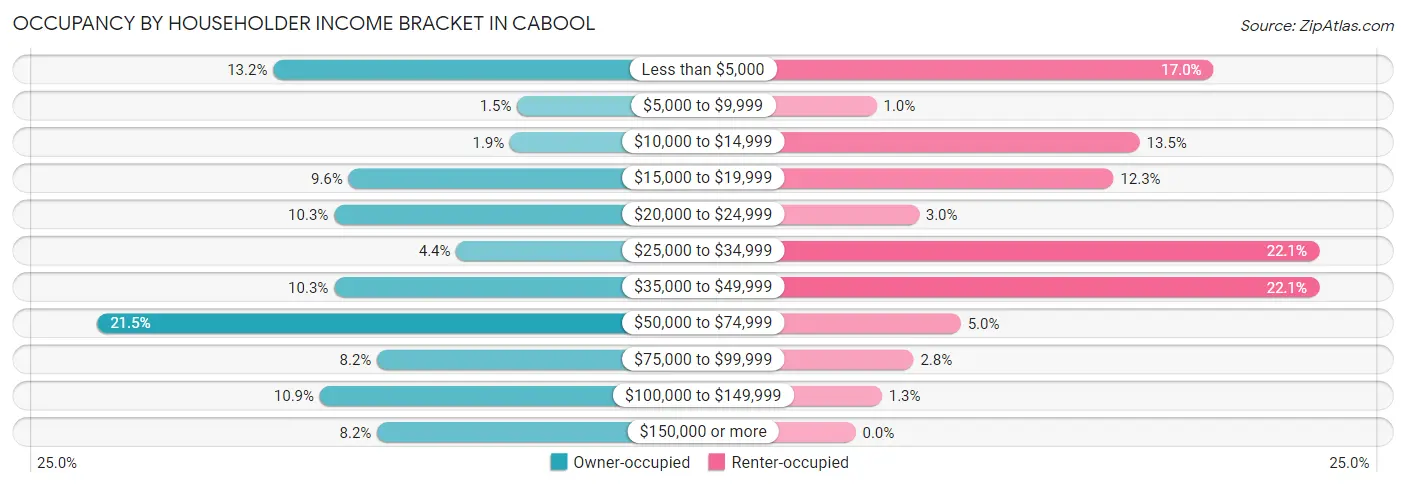
| Income Bracket | Owner-occupied | Renter-occupied |
| Less than $5,000 | 77 (13.2%) | 68 (17.0%) |
| $5,000 to $9,999 | 9 (1.5%) | 4 (1.0%) |
| $10,000 to $14,999 | 11 (1.9%) | 54 (13.5%) |
| $15,000 to $19,999 | 56 (9.6%) | 49 (12.3%) |
| $20,000 to $24,999 | 60 (10.3%) | 12 (3.0%) |
| $25,000 to $34,999 | 26 (4.4%) | 88 (22.1%) |
| $35,000 to $49,999 | 60 (10.3%) | 88 (22.1%) |
| $50,000 to $74,999 | 126 (21.5%) | 20 (5.0%) |
| $75,000 to $99,999 | 48 (8.2%) | 11 (2.8%) |
| $100,000 to $149,999 | 64 (10.9%) | 5 (1.3%) |
| $150,000 or more | 48 (8.2%) | 0 (0.0%) |
| Total | 585 (100.0%) | 399 (100.0%) |
Monthly Housing Cost Tiers in Cabool
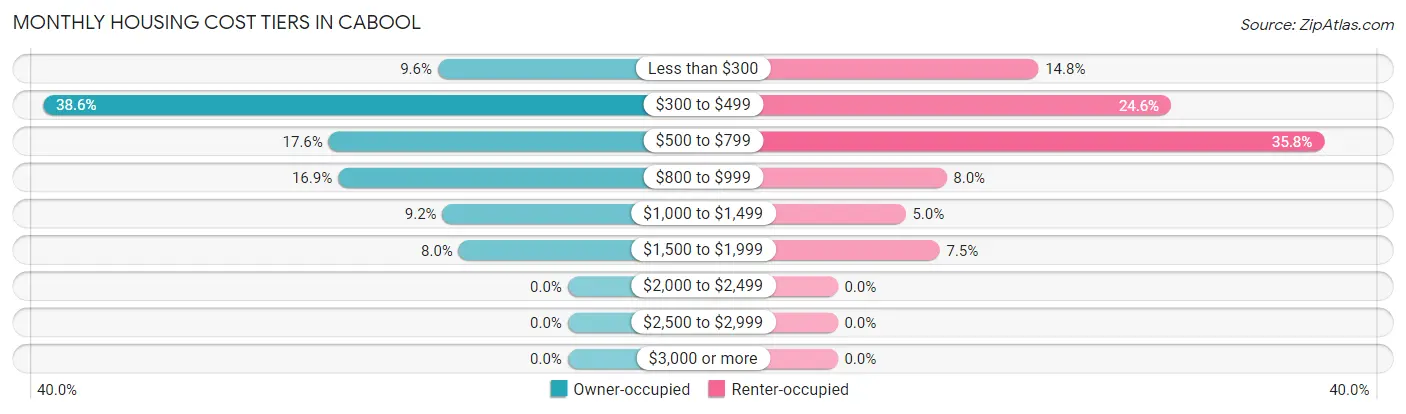
| Monthly Cost | Owner-occupied | Renter-occupied |
| Less than $300 | 56 (9.6%) | 59 (14.8%) |
| $300 to $499 | 226 (38.6%) | 98 (24.6%) |
| $500 to $799 | 103 (17.6%) | 143 (35.8%) |
| $800 to $999 | 99 (16.9%) | 32 (8.0%) |
| $1,000 to $1,499 | 54 (9.2%) | 20 (5.0%) |
| $1,500 to $1,999 | 47 (8.0%) | 30 (7.5%) |
| $2,000 to $2,499 | 0 (0.0%) | 0 (0.0%) |
| $2,500 to $2,999 | 0 (0.0%) | 0 (0.0%) |
| $3,000 or more | 0 (0.0%) | 0 (0.0%) |
| Total | 585 (100.0%) | 399 (100.0%) |
Physical Housing Characteristics in Cabool
Housing Structures in Cabool
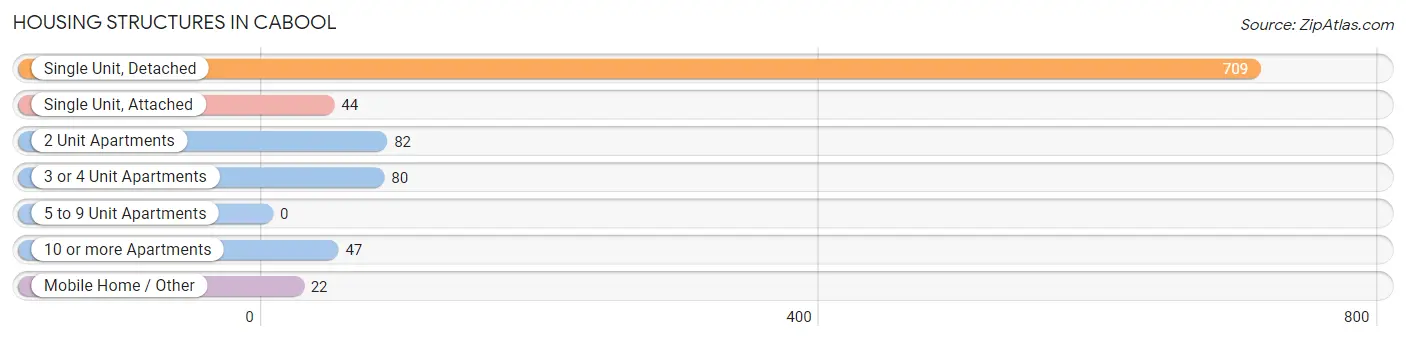
| Structure Type | # Housing Units | % Housing Units |
| Single Unit, Detached | 709 | 72.1% |
| Single Unit, Attached | 44 | 4.5% |
| 2 Unit Apartments | 82 | 8.3% |
| 3 or 4 Unit Apartments | 80 | 8.1% |
| 5 to 9 Unit Apartments | 0 | 0.0% |
| 10 or more Apartments | 47 | 4.8% |
| Mobile Home / Other | 22 | 2.2% |
| Total | 984 | 100.0% |
Housing Structures by Occupancy in Cabool
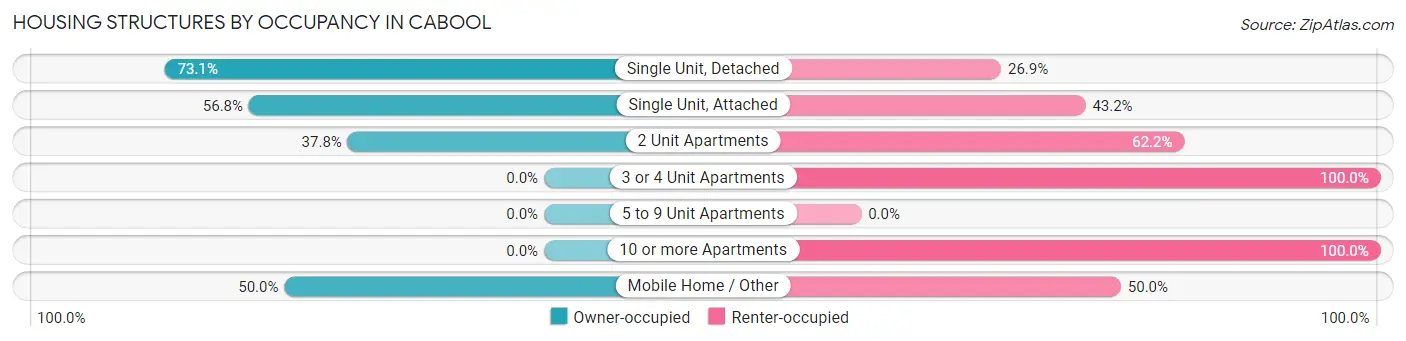
| Structure Type | Owner-occupied | Renter-occupied |
| Single Unit, Detached | 518 (73.1%) | 191 (26.9%) |
| Single Unit, Attached | 25 (56.8%) | 19 (43.2%) |
| 2 Unit Apartments | 31 (37.8%) | 51 (62.2%) |
| 3 or 4 Unit Apartments | 0 (0.0%) | 80 (100.0%) |
| 5 to 9 Unit Apartments | 0 (0.0%) | 0 (0.0%) |
| 10 or more Apartments | 0 (0.0%) | 47 (100.0%) |
| Mobile Home / Other | 11 (50.0%) | 11 (50.0%) |
| Total | 585 (59.5%) | 399 (40.6%) |
Housing Structures by Number of Rooms in Cabool
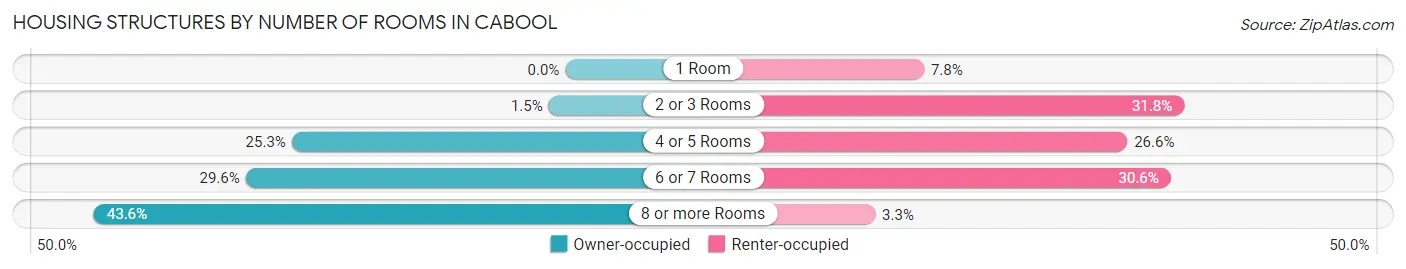
| Number of Rooms | Owner-occupied | Renter-occupied |
| 1 Room | 0 (0.0%) | 31 (7.8%) |
| 2 or 3 Rooms | 9 (1.5%) | 127 (31.8%) |
| 4 or 5 Rooms | 148 (25.3%) | 106 (26.6%) |
| 6 or 7 Rooms | 173 (29.6%) | 122 (30.6%) |
| 8 or more Rooms | 255 (43.6%) | 13 (3.3%) |
| Total | 585 (100.0%) | 399 (100.0%) |
Housing Structure by Heating Type in Cabool
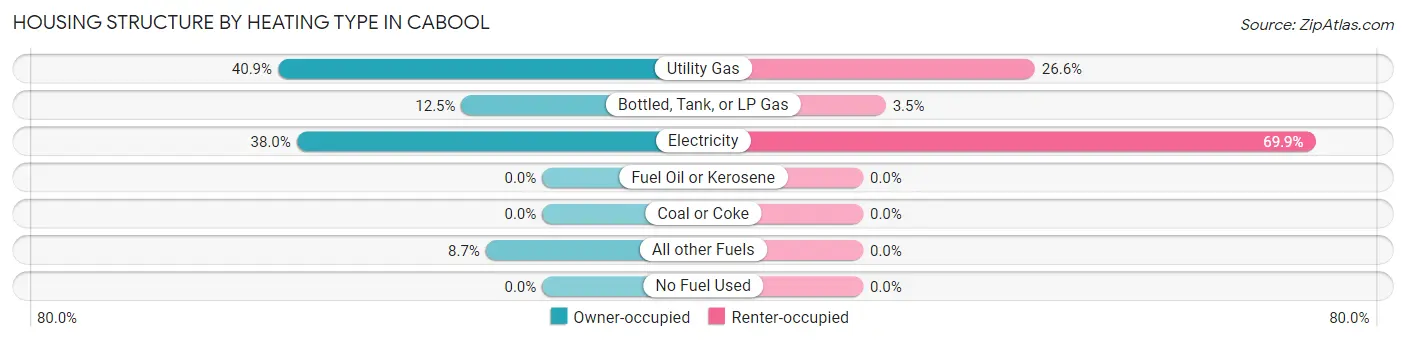
| Heating Type | Owner-occupied | Renter-occupied |
| Utility Gas | 239 (40.8%) | 106 (26.6%) |
| Bottled, Tank, or LP Gas | 73 (12.5%) | 14 (3.5%) |
| Electricity | 222 (38.0%) | 279 (69.9%) |
| Fuel Oil or Kerosene | 0 (0.0%) | 0 (0.0%) |
| Coal or Coke | 0 (0.0%) | 0 (0.0%) |
| All other Fuels | 51 (8.7%) | 0 (0.0%) |
| No Fuel Used | 0 (0.0%) | 0 (0.0%) |
| Total | 585 (100.0%) | 399 (100.0%) |
Household Vehicle Usage in Cabool
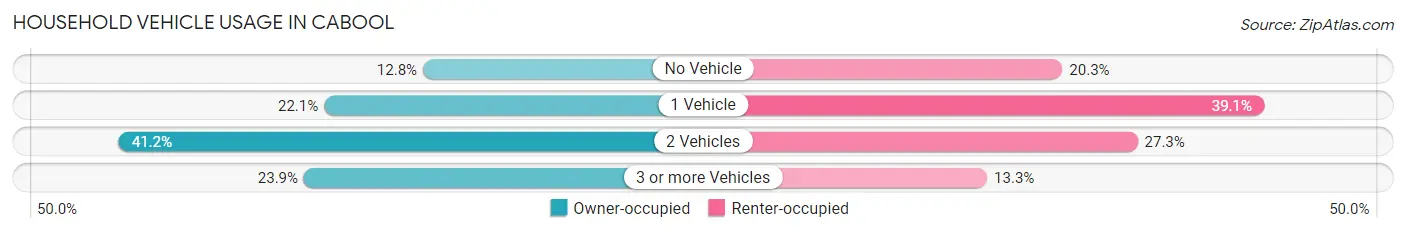
| Vehicles per Household | Owner-occupied | Renter-occupied |
| No Vehicle | 75 (12.8%) | 81 (20.3%) |
| 1 Vehicle | 129 (22.1%) | 156 (39.1%) |
| 2 Vehicles | 241 (41.2%) | 109 (27.3%) |
| 3 or more Vehicles | 140 (23.9%) | 53 (13.3%) |
| Total | 585 (100.0%) | 399 (100.0%) |
Real Estate & Mortgages in Cabool
Real Estate and Mortgage Overview in Cabool
| Characteristic | Without Mortgage | With Mortgage |
| Housing Units | 299 | 286 |
| Median Property Value | $95,600 | $103,100 |
| Median Household Income | $34,531 | $33 |
| Monthly Housing Costs | $347 | $0 |
| Real Estate Taxes | $594 | $0 |
Property Value by Mortgage Status in Cabool
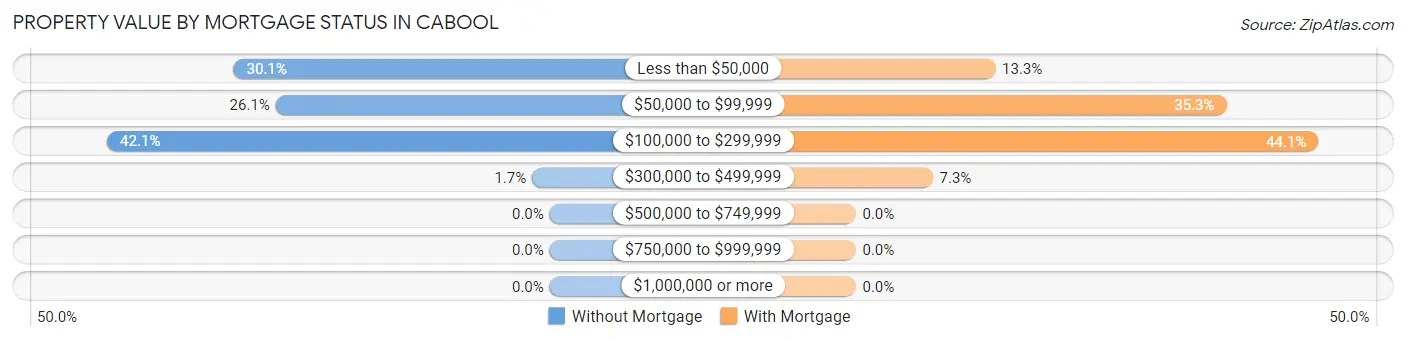
| Property Value | Without Mortgage | With Mortgage |
| Less than $50,000 | 90 (30.1%) | 38 (13.3%) |
| $50,000 to $99,999 | 78 (26.1%) | 101 (35.3%) |
| $100,000 to $299,999 | 126 (42.1%) | 126 (44.1%) |
| $300,000 to $499,999 | 5 (1.7%) | 21 (7.3%) |
| $500,000 to $749,999 | 0 (0.0%) | 0 (0.0%) |
| $750,000 to $999,999 | 0 (0.0%) | 0 (0.0%) |
| $1,000,000 or more | 0 (0.0%) | 0 (0.0%) |
| Total | 299 (100.0%) | 286 (100.0%) |
Household Income by Mortgage Status in Cabool
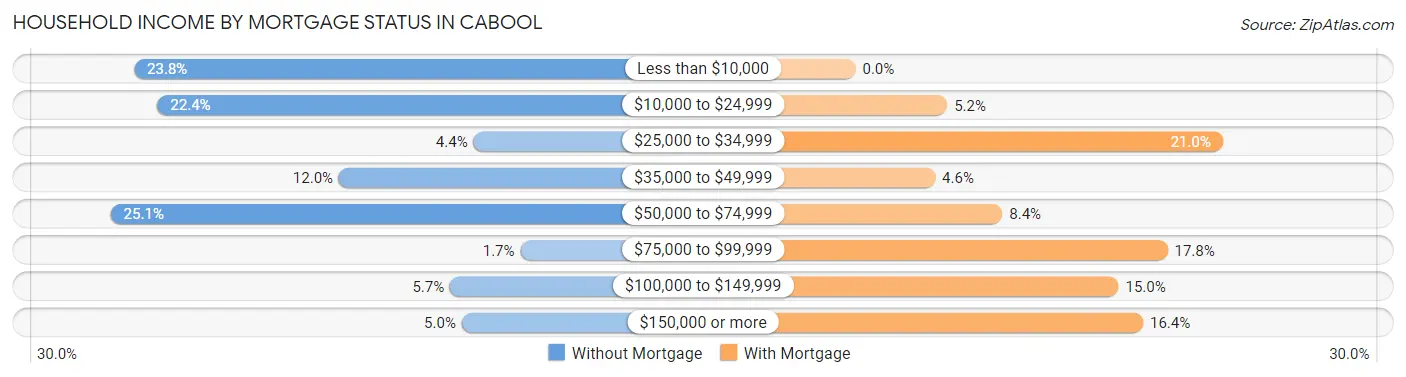
| Household Income | Without Mortgage | With Mortgage |
| Less than $10,000 | 71 (23.7%) | 0 (0.0%) |
| $10,000 to $24,999 | 67 (22.4%) | 15 (5.2%) |
| $25,000 to $34,999 | 13 (4.3%) | 60 (21.0%) |
| $35,000 to $49,999 | 36 (12.0%) | 13 (4.5%) |
| $50,000 to $74,999 | 75 (25.1%) | 24 (8.4%) |
| $75,000 to $99,999 | 5 (1.7%) | 51 (17.8%) |
| $100,000 to $149,999 | 17 (5.7%) | 43 (15.0%) |
| $150,000 or more | 15 (5.0%) | 47 (16.4%) |
| Total | 299 (100.0%) | 286 (100.0%) |
Property Value to Household Income Ratio in Cabool
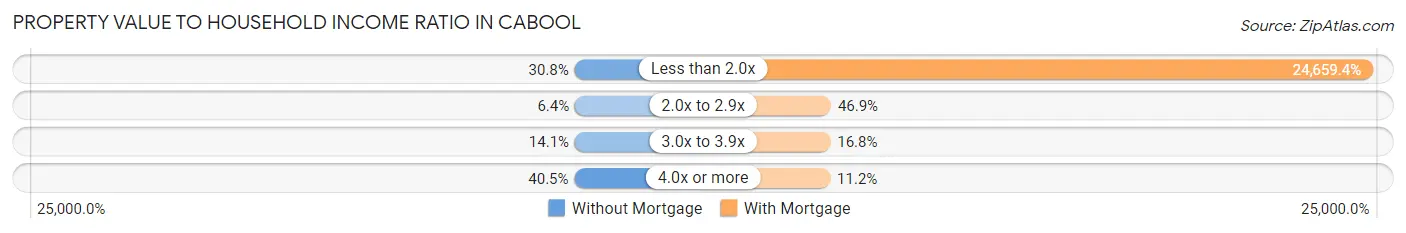
| Value-to-Income Ratio | Without Mortgage | With Mortgage |
| Less than 2.0x | 92 (30.8%) | 70,526 (24,659.4%) |
| 2.0x to 2.9x | 19 (6.4%) | 134 (46.9%) |
| 3.0x to 3.9x | 42 (14.1%) | 48 (16.8%) |
| 4.0x or more | 121 (40.5%) | 32 (11.2%) |
| Total | 299 (100.0%) | 286 (100.0%) |
Real Estate Taxes by Mortgage Status in Cabool
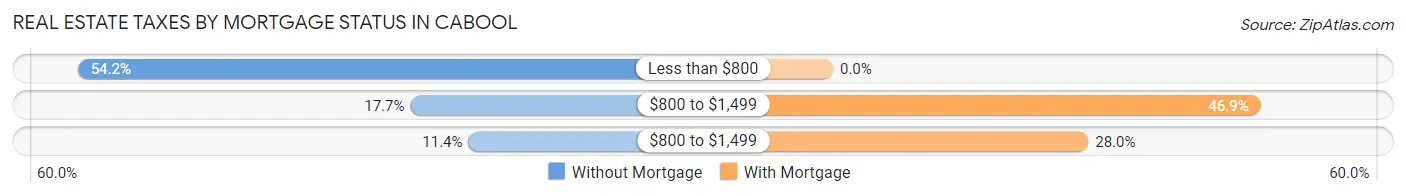
| Property Taxes | Without Mortgage | With Mortgage |
| Less than $800 | 162 (54.2%) | 0 (0.0%) |
| $800 to $1,499 | 53 (17.7%) | 134 (46.9%) |
| $800 to $1,499 | 34 (11.4%) | 80 (28.0%) |
| Total | 299 (100.0%) | 286 (100.0%) |
Health & Disability in Cabool
Health Insurance Coverage by Age in Cabool
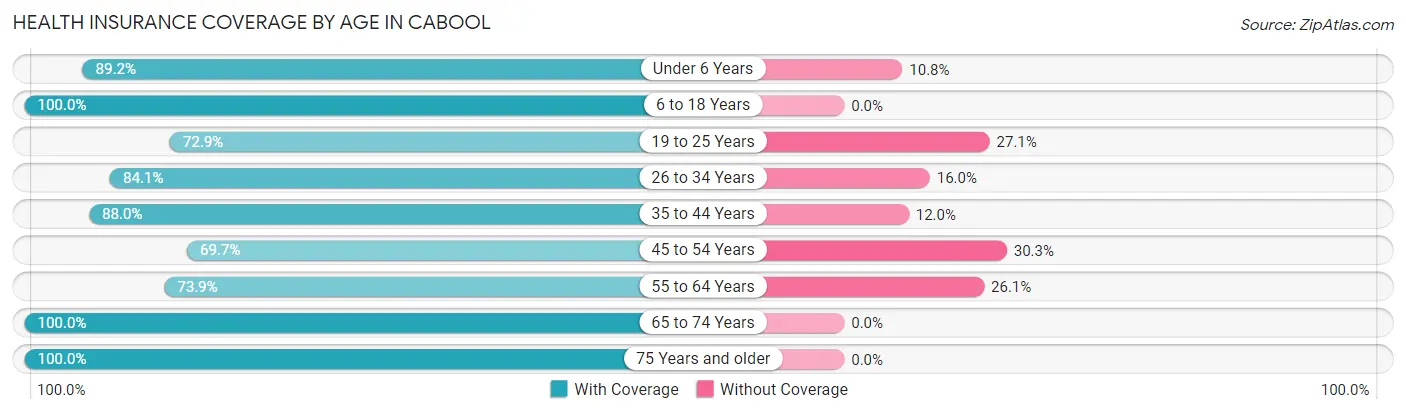
| Age Bracket | With Coverage | Without Coverage |
| Under 6 Years | 214 (89.2%) | 26 (10.8%) |
| 6 to 18 Years | 459 (100.0%) | 0 (0.0%) |
| 19 to 25 Years | 156 (72.9%) | 58 (27.1%) |
| 26 to 34 Years | 195 (84.1%) | 37 (16.0%) |
| 35 to 44 Years | 256 (88.0%) | 35 (12.0%) |
| 45 to 54 Years | 246 (69.7%) | 107 (30.3%) |
| 55 to 64 Years | 224 (73.9%) | 79 (26.1%) |
| 65 to 74 Years | 121 (100.0%) | 0 (0.0%) |
| 75 Years and older | 226 (100.0%) | 0 (0.0%) |
| Total | 2,097 (86.0%) | 342 (14.0%) |
Health Insurance Coverage by Citizenship Status in Cabool
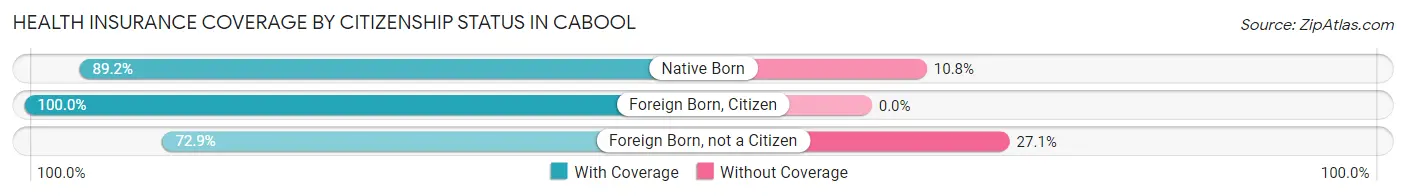
| Citizenship Status | With Coverage | Without Coverage |
| Native Born | 214 (89.2%) | 26 (10.8%) |
| Foreign Born, Citizen | 459 (100.0%) | 0 (0.0%) |
| Foreign Born, not a Citizen | 156 (72.9%) | 58 (27.1%) |
Health Insurance Coverage by Household Income in Cabool
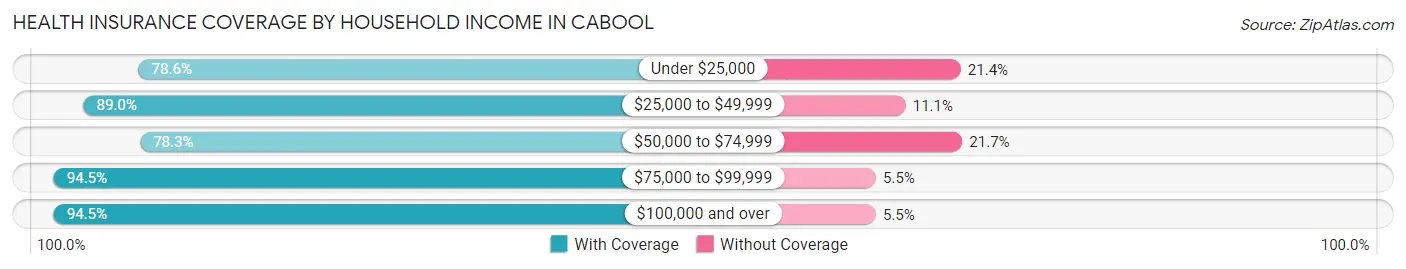
| Household Income | With Coverage | Without Coverage |
| Under $25,000 | 526 (78.6%) | 143 (21.4%) |
| $25,000 to $49,999 | 604 (88.9%) | 75 (11.1%) |
| $50,000 to $74,999 | 311 (78.3%) | 86 (21.7%) |
| $75,000 to $99,999 | 224 (94.5%) | 13 (5.5%) |
| $100,000 and over | 431 (94.5%) | 25 (5.5%) |
Public vs Private Health Insurance Coverage by Age in Cabool
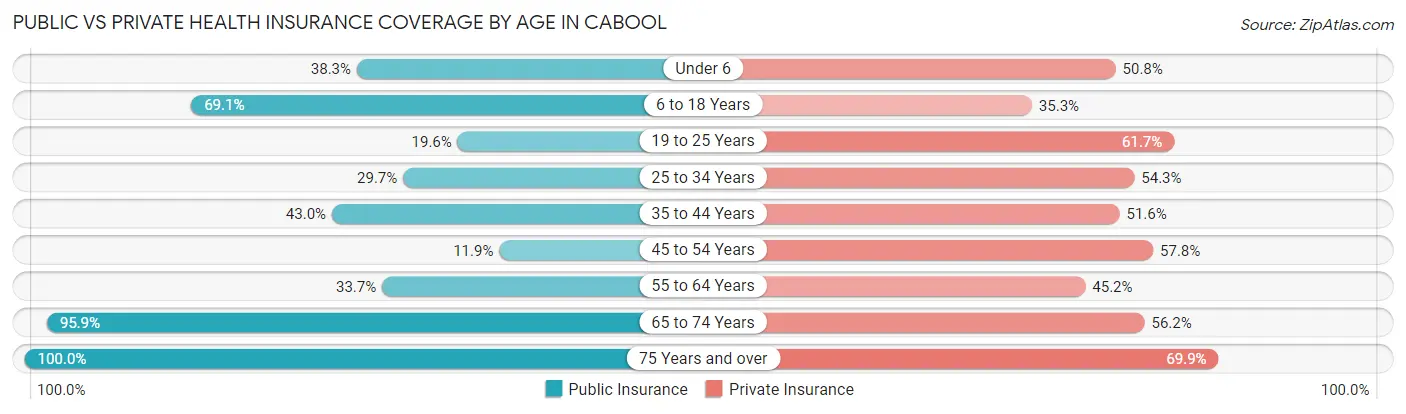
| Age Bracket | Public Insurance | Private Insurance |
| Under 6 | 92 (38.3%) | 122 (50.8%) |
| 6 to 18 Years | 317 (69.1%) | 162 (35.3%) |
| 19 to 25 Years | 42 (19.6%) | 132 (61.7%) |
| 25 to 34 Years | 69 (29.7%) | 126 (54.3%) |
| 35 to 44 Years | 125 (43.0%) | 150 (51.5%) |
| 45 to 54 Years | 42 (11.9%) | 204 (57.8%) |
| 55 to 64 Years | 102 (33.7%) | 137 (45.2%) |
| 65 to 74 Years | 116 (95.9%) | 68 (56.2%) |
| 75 Years and over | 226 (100.0%) | 158 (69.9%) |
| Total | 1,131 (46.4%) | 1,259 (51.6%) |
Disability Status by Sex by Age in Cabool
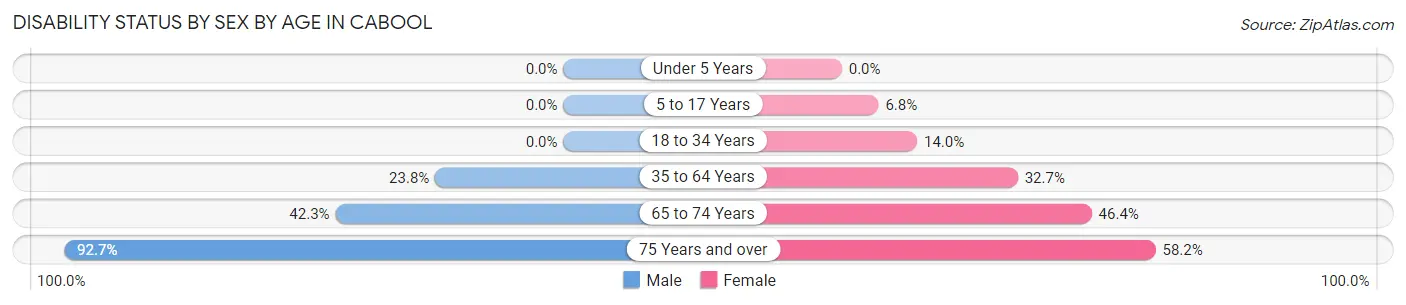
| Age Bracket | Male | Female |
| Under 5 Years | 0 (0.0%) | 0 (0.0%) |
| 5 to 17 Years | 0 (0.0%) | 16 (6.8%) |
| 18 to 34 Years | 0 (0.0%) | 38 (14.0%) |
| 35 to 64 Years | 119 (23.8%) | 146 (32.7%) |
| 65 to 74 Years | 22 (42.3%) | 32 (46.4%) |
| 75 Years and over | 63 (92.6%) | 92 (58.2%) |
Disability Class by Sex by Age in Cabool
Disability Class: Hearing Difficulty
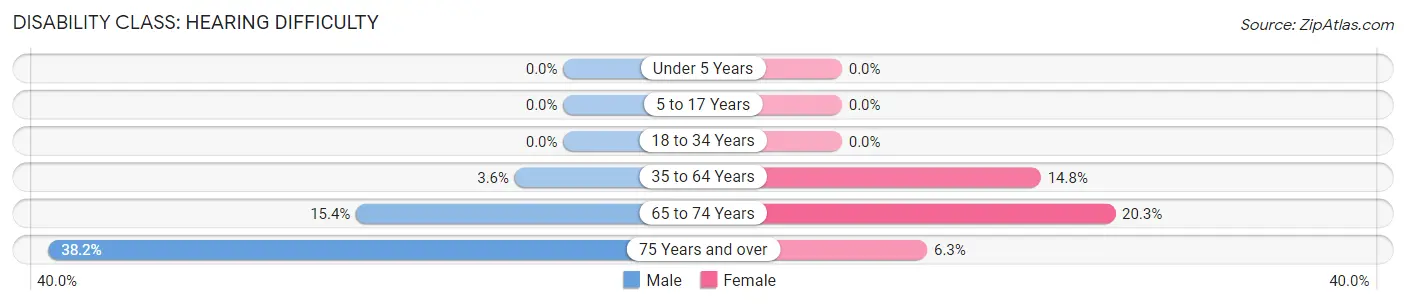
| Age Bracket | Male | Female |
| Under 5 Years | 0 (0.0%) | 0 (0.0%) |
| 5 to 17 Years | 0 (0.0%) | 0 (0.0%) |
| 18 to 34 Years | 0 (0.0%) | 0 (0.0%) |
| 35 to 64 Years | 18 (3.6%) | 66 (14.8%) |
| 65 to 74 Years | 8 (15.4%) | 14 (20.3%) |
| 75 Years and over | 26 (38.2%) | 10 (6.3%) |
Disability Class: Vision Difficulty
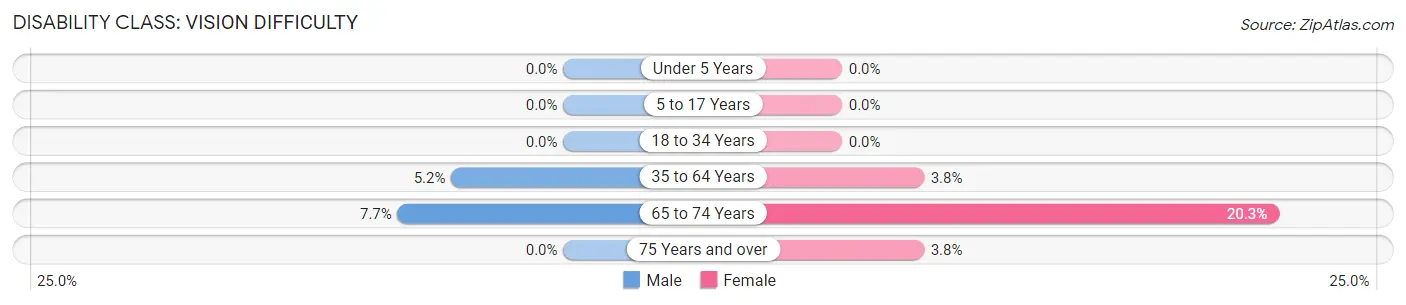
| Age Bracket | Male | Female |
| Under 5 Years | 0 (0.0%) | 0 (0.0%) |
| 5 to 17 Years | 0 (0.0%) | 0 (0.0%) |
| 18 to 34 Years | 0 (0.0%) | 0 (0.0%) |
| 35 to 64 Years | 26 (5.2%) | 17 (3.8%) |
| 65 to 74 Years | 4 (7.7%) | 14 (20.3%) |
| 75 Years and over | 0 (0.0%) | 6 (3.8%) |
Disability Class: Cognitive Difficulty
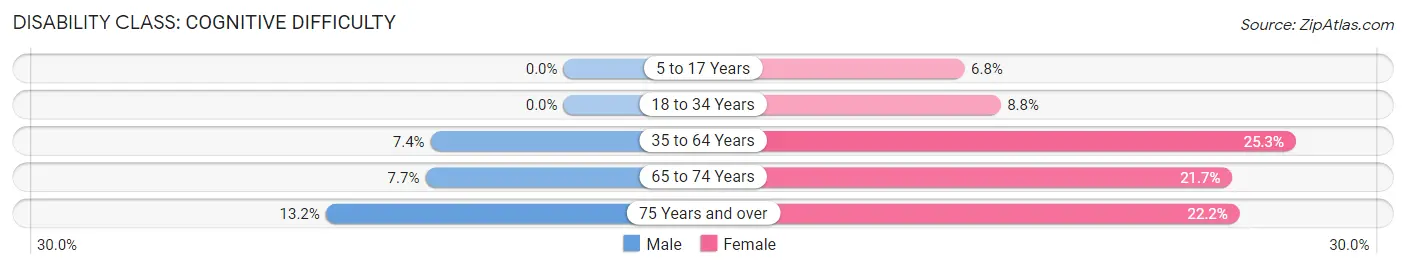
| Age Bracket | Male | Female |
| 5 to 17 Years | 0 (0.0%) | 16 (6.8%) |
| 18 to 34 Years | 0 (0.0%) | 24 (8.8%) |
| 35 to 64 Years | 37 (7.4%) | 113 (25.3%) |
| 65 to 74 Years | 4 (7.7%) | 15 (21.7%) |
| 75 Years and over | 9 (13.2%) | 35 (22.2%) |
Disability Class: Ambulatory Difficulty
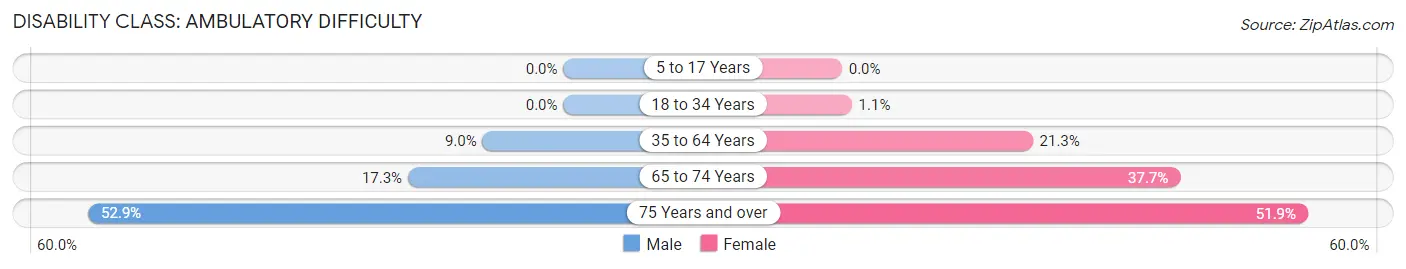
| Age Bracket | Male | Female |
| 5 to 17 Years | 0 (0.0%) | 0 (0.0%) |
| 18 to 34 Years | 0 (0.0%) | 3 (1.1%) |
| 35 to 64 Years | 45 (9.0%) | 95 (21.2%) |
| 65 to 74 Years | 9 (17.3%) | 26 (37.7%) |
| 75 Years and over | 36 (52.9%) | 82 (51.9%) |
Disability Class: Self-Care Difficulty
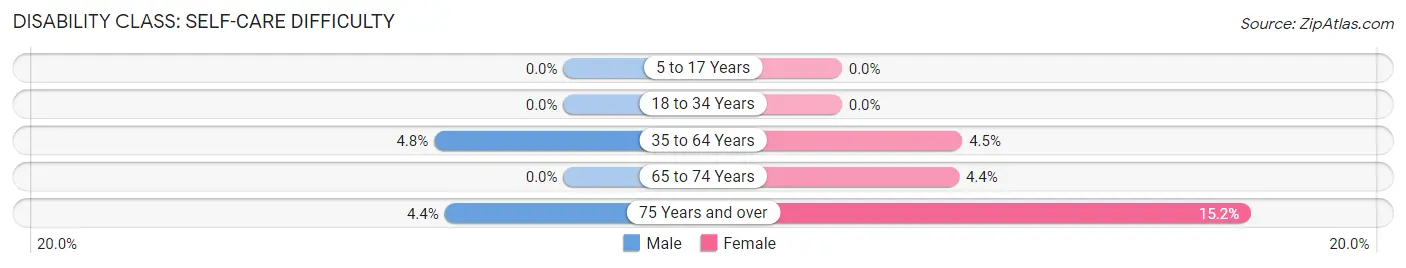
| Age Bracket | Male | Female |
| 5 to 17 Years | 0 (0.0%) | 0 (0.0%) |
| 18 to 34 Years | 0 (0.0%) | 0 (0.0%) |
| 35 to 64 Years | 24 (4.8%) | 20 (4.5%) |
| 65 to 74 Years | 0 (0.0%) | 3 (4.3%) |
| 75 Years and over | 3 (4.4%) | 24 (15.2%) |
Technology Access in Cabool
Computing Device Access in Cabool
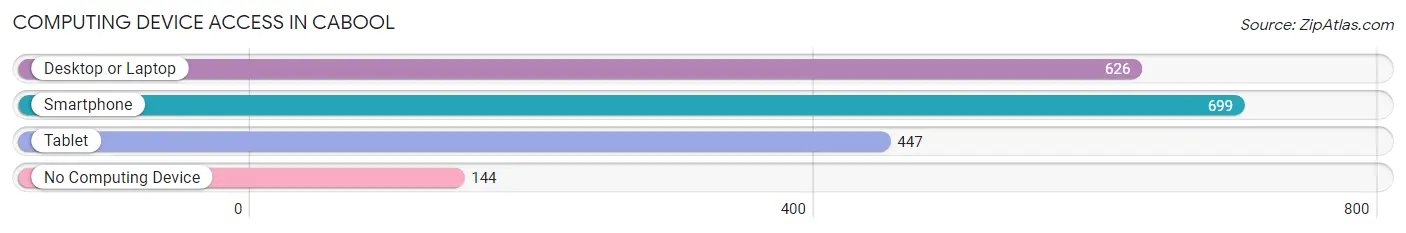
| Device Type | # Households | % Households |
| Desktop or Laptop | 626 | 63.6% |
| Smartphone | 699 | 71.0% |
| Tablet | 447 | 45.4% |
| No Computing Device | 144 | 14.6% |
| Total | 984 | 100.0% |
Internet Access in Cabool
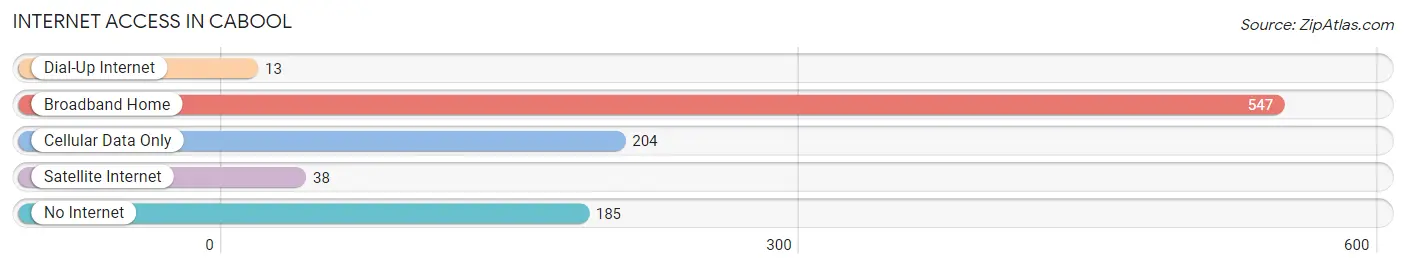
| Internet Type | # Households | % Households |
| Dial-Up Internet | 13 | 1.3% |
| Broadband Home | 547 | 55.6% |
| Cellular Data Only | 204 | 20.7% |
| Satellite Internet | 38 | 3.9% |
| No Internet | 185 | 18.8% |
| Total | 984 | 100.0% |
Cabool Summary
Cabool is a small city located in Texas County, Missouri, United States. The population was 2,072 at the 2010 census. It is the county seat of Texas County.
History
Cabool was founded in 1883 by the Missouri Pacific Railroad. The city was named after the nearby Cabool Creek, which was named after the Native American word for "deer". The city was incorporated in 1887.
In the early 1900s, Cabool was a thriving agricultural center, with a population of over 1,000. The city was home to several businesses, including a bank, a hotel, a newspaper, and a variety of stores.
In the 1920s, the city experienced a period of growth, with the construction of a new school, a new courthouse, and a new hospital. The city also had a movie theater, a bowling alley, and a variety of other businesses.
In the 1950s, the city experienced a period of decline, as many of the businesses closed and the population decreased. The city was also affected by the Great Depression and World War II.
In the 1970s, the city experienced a period of revitalization, with the construction of a new library, a new post office, and a new city hall. The city also had a new fire station and a new police station.
Geography
Cabool is located at 37°14'25" North, 91°51'45" West (37.240278, -91.862444). The city is situated in the Ozark Mountains, at an elevation of 1,068 feet (326 m).
The city is located in the Ozark Plateau, which is characterized by rolling hills and valleys. The city is surrounded by forests and is home to several creeks and streams.
Economy
Cabool's economy is largely based on agriculture. The city is home to several farms, which produce a variety of crops, including corn, soybeans, wheat, and hay. The city also has a number of businesses, including a lumber yard, a feed store, and a variety of other stores.
Demographics
As of the 2010 census, there were 2,072 people, 845 households, and 545 families residing in the city. The population density was 1,072.2 people per square mile (414.7/km2). There were 945 housing units at an average density of 486.2 per square mile (187.7/km2). The racial makeup of the city was 97.2% White, 0.2% African American, 0.4% Native American, 0.2% Asian, 0.2% from other races, and 1.9% from two or more races. Hispanic or Latino of any race were 1.2% of the population.
There were 845 households, out of which 28.2% had children under the age of 18 living with them, 48.2% were married couples living together, 11.2% had a female householder with no husband present, and 36.2% were non-families. 32.2% of all households were made up of individuals, and 16.2% had someone living alone who was 65 years of age or older. The average household size was 2.35 and the average family size was 2.94.
In the city, the population was spread out, with 24.2% under the age of 18, 8.2% from 18 to 24, 24.2% from 25 to 44, 24.2% from 45 to 64, and 19.2% who were 65 years of age or older. The median age was 40 years. For every 100 females, there were 87.2 males. For every 100 females age 18 and over, there were 83.2 males.
The median income for a household in the city was $25,938, and the median income for a family was $31,250. Males had a median income of $25,000 versus $18,750 for females. The per capita income for the city was $14,845. About 14.2% of families and 17.2% of the population were below the poverty line, including 22.2% of those under age 18 and 14.2% of those age 65 or over.
Common Questions
What is Per Capita Income in Cabool?
Per Capita income in Cabool is $20,037.
What is the Median Family Income in Cabool?
Median Family Income in Cabool is $41,302.
What is the Median Household income in Cabool?
Median Household Income in Cabool is $33,429.
What is Income or Wage Gap in Cabool?
Income or Wage Gap in Cabool is 39.2%.
Women in Cabool earn 60.8 cents for every dollar earned by a man.
What is Inequality or Gini Index in Cabool?
Inequality or Gini Index in Cabool is 0.51.
What is the Total Population of Cabool?
Total Population of Cabool is 2,543.
What is the Total Male Population of Cabool?
Total Male Population of Cabool is 1,185.
What is the Total Female Population of Cabool?
Total Female Population of Cabool is 1,358.
What is the Ratio of Males per 100 Females in Cabool?
There are 87.26 Males per 100 Females in Cabool.
What is the Ratio of Females per 100 Males in Cabool?
There are 114.60 Females per 100 Males in Cabool.
What is the Median Population Age in Cabool?
Median Population Age in Cabool is 38.7 Years.
What is the Average Family Size in Cabool
Average Family Size in Cabool is 3.2 People.
What is the Average Household Size in Cabool
Average Household Size in Cabool is 2.5 People.
How Large is the Labor Force in Cabool?
There are 928 People in the Labor Forcein in Cabool.
What is the Percentage of People in the Labor Force in Cabool?
49.2% of People are in the Labor Force in Cabool.
What is the Unemployment Rate in Cabool?
Unemployment Rate in Cabool is 2.4%.