Tanaina, AK Map & Demographics
Tanaina Map
Tanaina Overview
$38,705
PER CAPITA INCOME
$94,017
AVG FAMILY INCOME
$86,418
AVG HOUSEHOLD INCOME
38.3%
WAGE / INCOME GAP [ % ]
61.7¢/ $1
WAGE / INCOME GAP [ $ ]
$13,273
FAMILY INCOME DEFICIT
0.39
INEQUALITY / GINI INDEX
9,682
TOTAL POPULATION
5,050
MALE POPULATION
4,632
FEMALE POPULATION
109.02
MALES / 100 FEMALES
91.72
FEMALES / 100 MALES
34.9
MEDIAN AGE
3.2
AVG FAMILY SIZE
2.9
AVG HOUSEHOLD SIZE
4,944
LABOR FORCE [ PEOPLE ]
67.4%
PERCENT IN LABOR FORCE
6.4%
UNEMPLOYMENT RATE
Income in Tanaina
Income Overview in Tanaina
Per Capita Income in Tanaina is $38,705, while median incomes of families and households are $94,017 and $86,418 respectively.
| Characteristic | Number | Measure |
| Per Capita Income | 9,682 | $38,705 |
| Median Family Income | 2,645 | $94,017 |
| Mean Family Income | 2,645 | $117,173 |
| Median Household Income | 3,338 | $86,418 |
| Mean Household Income | 3,338 | $108,514 |
| Income Deficit | 2,645 | $13,273 |
| Wage / Income Gap (%) | 9,682 | 38.28% |
| Wage / Income Gap ($) | 9,682 | 61.72¢ per $1 |
| Gini / Inequality Index | 9,682 | 0.39 |
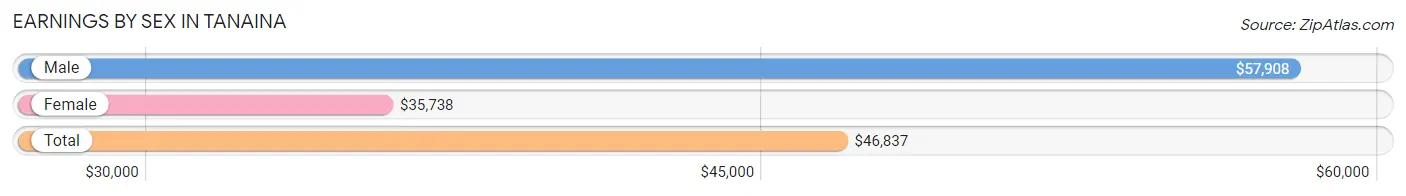
Earnings by Sex in Tanaina
Average Earnings in Tanaina are $46,837, $57,908 for men and $35,738 for women, a difference of 38.3%.
| Sex | Number | Average Earnings |
| Male | 2,896 (55.9%) | $57,908 |
| Female | 2,288 (44.1%) | $35,738 |
| Total | 5,184 (100.0%) | $46,837 |
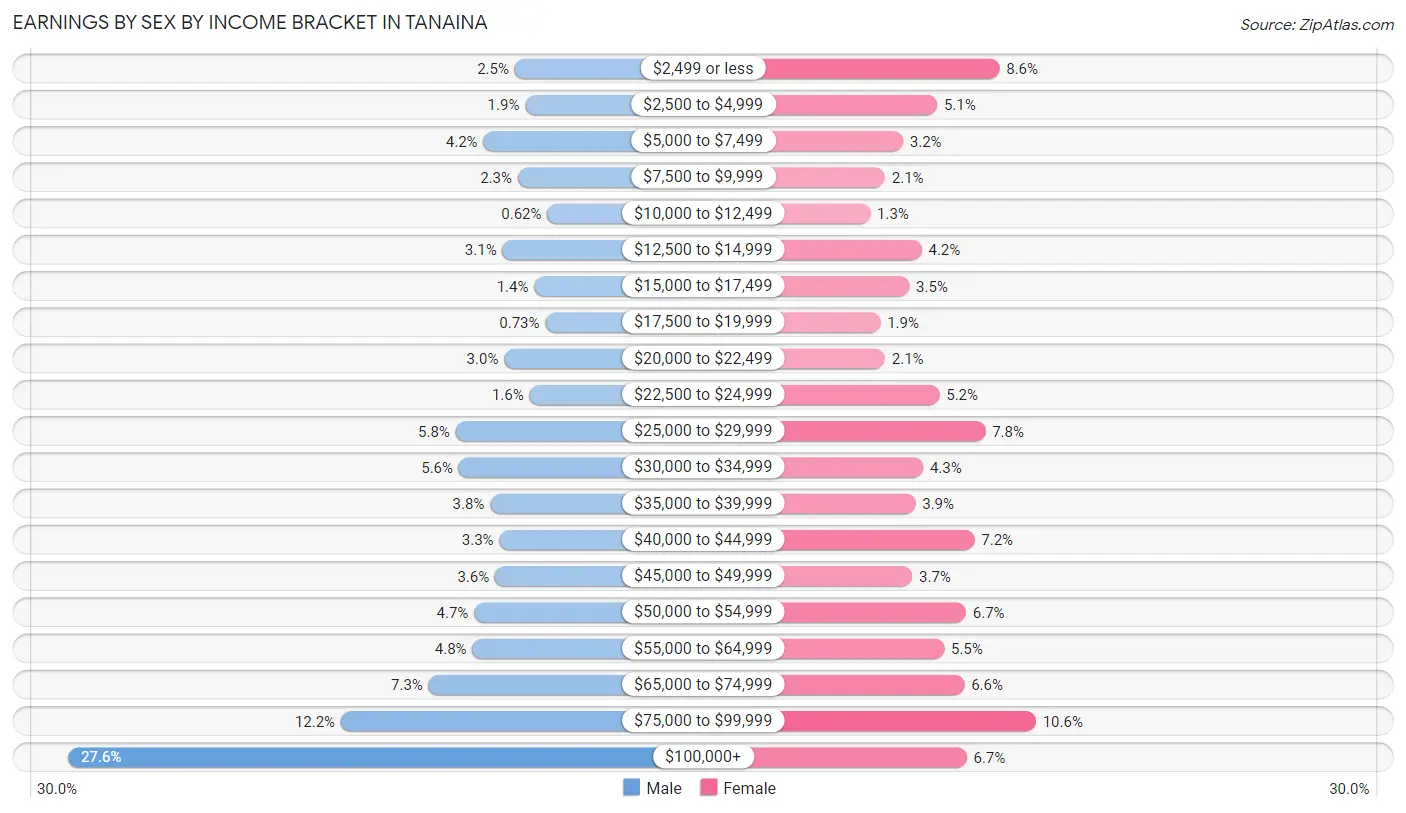
Earnings by Sex by Income Bracket in Tanaina
The most common earnings brackets in Tanaina are $100,000+ for men (798 | 27.6%) and $75,000 to $99,999 for women (243 | 10.6%).
| Income | Male | Female |
| $2,499 or less | 71 (2.5%) | 196 (8.6%) |
| $2,500 to $4,999 | 54 (1.9%) | 116 (5.1%) |
| $5,000 to $7,499 | 122 (4.2%) | 72 (3.2%) |
| $7,500 to $9,999 | 66 (2.3%) | 49 (2.1%) |
| $10,000 to $12,499 | 18 (0.6%) | 30 (1.3%) |
| $12,500 to $14,999 | 91 (3.1%) | 96 (4.2%) |
| $15,000 to $17,499 | 39 (1.3%) | 80 (3.5%) |
| $17,500 to $19,999 | 21 (0.7%) | 43 (1.9%) |
| $20,000 to $22,499 | 88 (3.0%) | 49 (2.1%) |
| $22,500 to $24,999 | 47 (1.6%) | 119 (5.2%) |
| $25,000 to $29,999 | 167 (5.8%) | 178 (7.8%) |
| $30,000 to $34,999 | 162 (5.6%) | 98 (4.3%) |
| $35,000 to $39,999 | 111 (3.8%) | 88 (3.8%) |
| $40,000 to $44,999 | 96 (3.3%) | 164 (7.2%) |
| $45,000 to $49,999 | 103 (3.6%) | 84 (3.7%) |
| $50,000 to $54,999 | 137 (4.7%) | 153 (6.7%) |
| $55,000 to $64,999 | 140 (4.8%) | 125 (5.5%) |
| $65,000 to $74,999 | 211 (7.3%) | 151 (6.6%) |
| $75,000 to $99,999 | 354 (12.2%) | 243 (10.6%) |
| $100,000+ | 798 (27.6%) | 154 (6.7%) |
| Total | 2,896 (100.0%) | 2,288 (100.0%) |
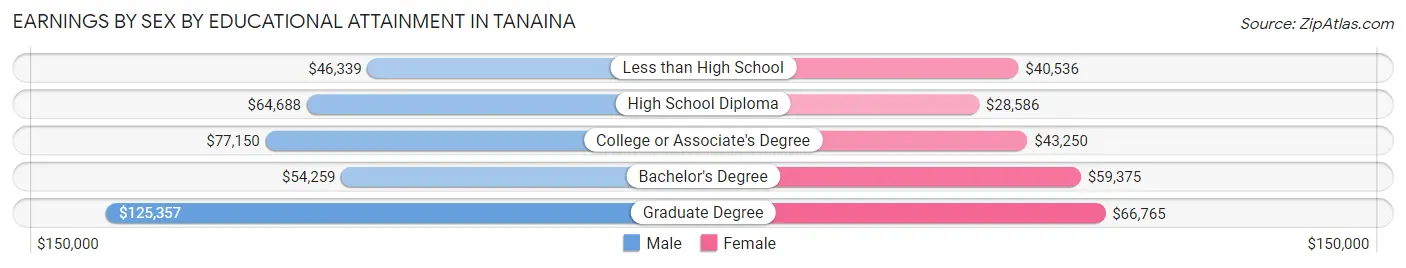
Earnings by Sex by Educational Attainment in Tanaina
Average earnings in Tanaina are $71,197 for men and $41,095 for women, a difference of 42.3%. Men with an educational attainment of graduate degree enjoy the highest average annual earnings of $125,357, while those with less than high school education earn the least with $46,339. Women with an educational attainment of graduate degree earn the most with the average annual earnings of $66,765, while those with high school diploma education have the smallest earnings of $28,586.
| Educational Attainment | Male Income | Female Income |
| Less than High School | $46,339 | $40,536 |
| High School Diploma | $64,688 | $28,586 |
| College or Associate's Degree | $77,150 | $43,250 |
| Bachelor's Degree | $54,259 | $59,375 |
| Graduate Degree | $125,357 | $66,765 |
| Total | $71,197 | $41,095 |
Family Income in Tanaina
Family Income Brackets in Tanaina
According to the Tanaina family income data, there are 555 families falling into the $100,000 to $149,999 income range, which is the most common income bracket and makes up 21.0% of all families. Conversely, the $10,000 to $14,999 income bracket is the least frequent group with only 26 families (1.0%) belonging to this category.
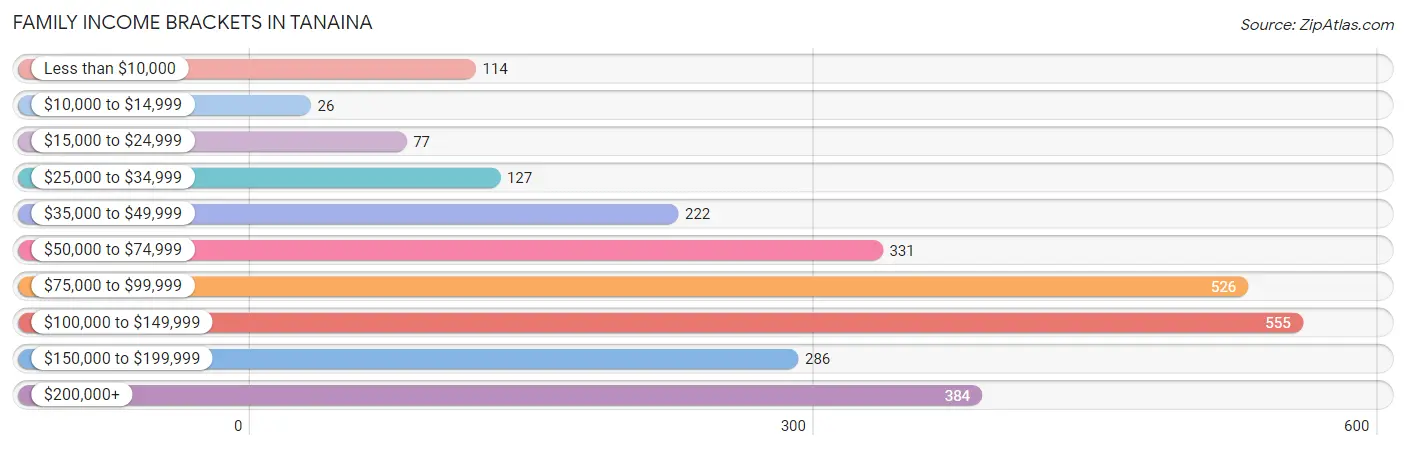
| Income Bracket | # Families | % Families |
| Less than $10,000 | 114 | 4.3% |
| $10,000 to $14,999 | 26 | 1.0% |
| $15,000 to $24,999 | 77 | 2.9% |
| $25,000 to $34,999 | 127 | 4.8% |
| $35,000 to $49,999 | 222 | 8.4% |
| $50,000 to $74,999 | 331 | 12.5% |
| $75,000 to $99,999 | 526 | 19.9% |
| $100,000 to $149,999 | 555 | 21.0% |
| $150,000 to $199,999 | 286 | 10.8% |
| $200,000+ | 384 | 14.5% |
Family Income by Famaliy Size in Tanaina
6-person families (62 | 2.3%) account for the highest median family income in Tanaina with $169,643 per family, while 2-person families (1,048 | 39.6%) have the highest median income of $42,841 per family member.
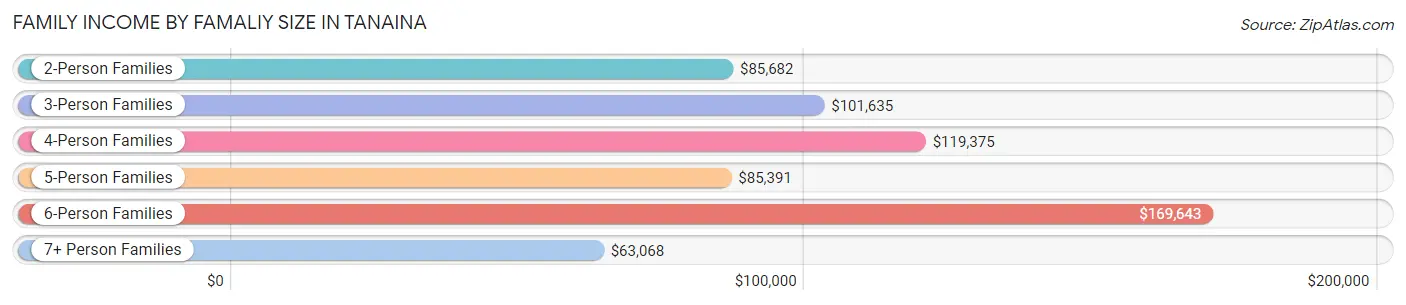
| Income Bracket | # Families | Median Income |
| 2-Person Families | 1,048 (39.6%) | $85,682 |
| 3-Person Families | 603 (22.8%) | $101,635 |
| 4-Person Families | 491 (18.6%) | $119,375 |
| 5-Person Families | 396 (15.0%) | $85,391 |
| 6-Person Families | 62 (2.3%) | $169,643 |
| 7+ Person Families | 45 (1.7%) | $63,068 |
| Total | 2,645 (100.0%) | $94,017 |
Family Income by Number of Earners in Tanaina
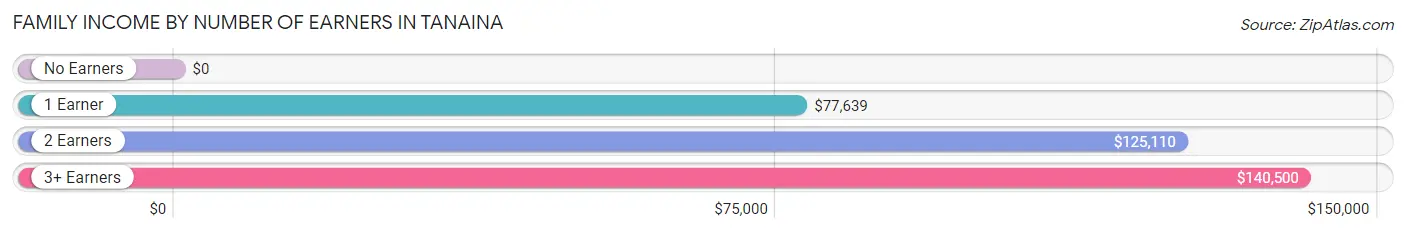
| Number of Earners | # Families | Median Income |
| No Earners | 305 (11.5%) | $0 |
| 1 Earner | 857 (32.4%) | $77,639 |
| 2 Earners | 1,205 (45.6%) | $125,110 |
| 3+ Earners | 278 (10.5%) | $140,500 |
| Total | 2,645 (100.0%) | $94,017 |
Household Income in Tanaina
Household Income Brackets in Tanaina
With 671 households falling in the category, the $100,000 to $149,999 income range is the most frequent in Tanaina, accounting for 20.1% of all households. In contrast, only 63 households (1.9%) fall into the $10,000 to $14,999 income bracket, making it the least populous group.
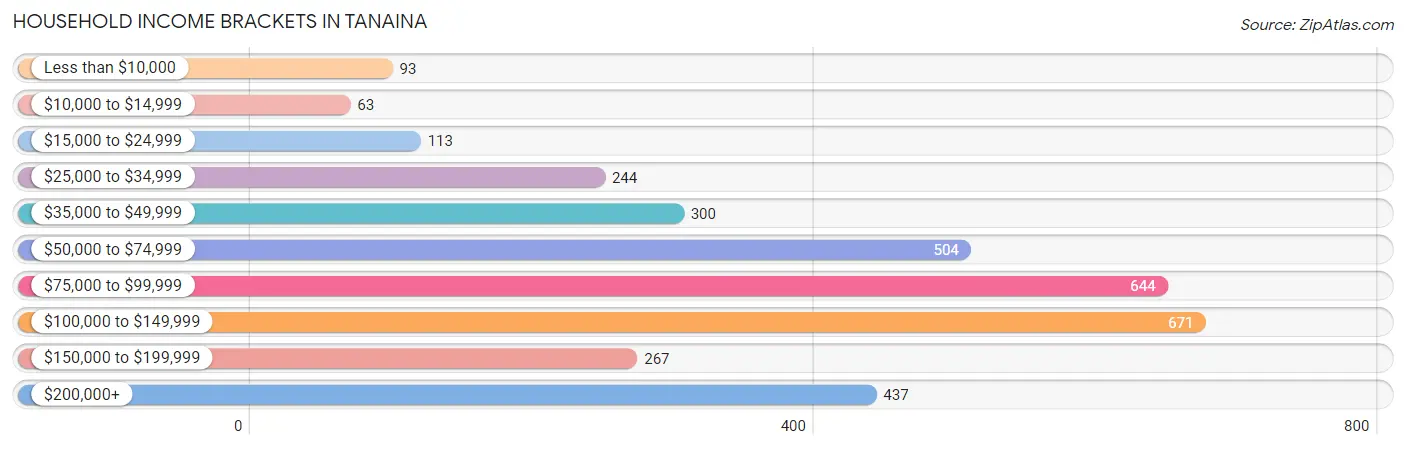
| Income Bracket | # Households | % Households |
| Less than $10,000 | 93 | 2.8% |
| $10,000 to $14,999 | 63 | 1.9% |
| $15,000 to $24,999 | 113 | 3.4% |
| $25,000 to $34,999 | 244 | 7.3% |
| $35,000 to $49,999 | 300 | 9.0% |
| $50,000 to $74,999 | 504 | 15.1% |
| $75,000 to $99,999 | 644 | 19.3% |
| $100,000 to $149,999 | 671 | 20.1% |
| $150,000 to $199,999 | 267 | 8.0% |
| $200,000+ | 437 | 13.1% |
Household Income by Householder Age in Tanaina
The median household income in Tanaina is $86,418, with the highest median household income of $118,125 found in the 45 to 64 years age bracket for the primary householder. A total of 1,292 households (38.7%) fall into this category. Meanwhile, the 15 to 24 years age bracket for the primary householder has the lowest median household income of $0, with 94 households (2.8%) in this group.
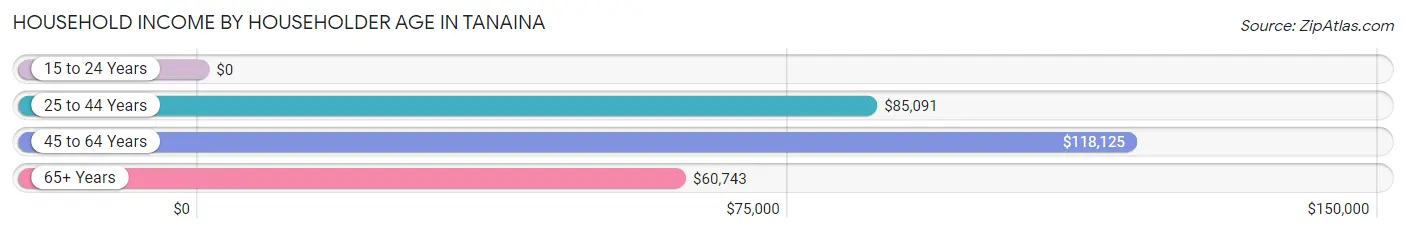
| Income Bracket | # Households | Median Income |
| 15 to 24 Years | 94 (2.8%) | $0 |
| 25 to 44 Years | 1,454 (43.6%) | $85,091 |
| 45 to 64 Years | 1,292 (38.7%) | $118,125 |
| 65+ Years | 498 (14.9%) | $60,743 |
| Total | 3,338 (100.0%) | $86,418 |
Poverty in Tanaina
Income Below Poverty by Sex and Age in Tanaina
With 10.0% poverty level for males and 11.6% for females among the residents of Tanaina, 5 year old males and 15 year old females are the most vulnerable to poverty, with 12 males (22.6%) and 54 females (48.2%) in their respective age groups living below the poverty level.
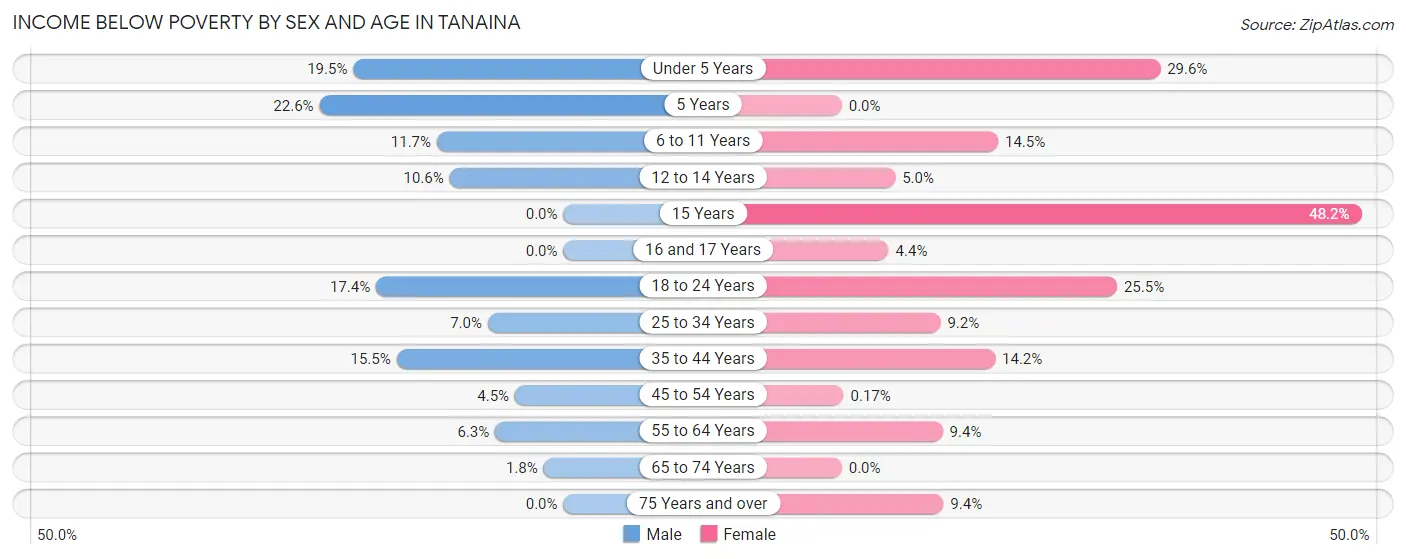
| Age Bracket | Male | Female |
| Under 5 Years | 55 (19.5%) | 73 (29.5%) |
| 5 Years | 12 (22.6%) | 0 (0.0%) |
| 6 to 11 Years | 48 (11.7%) | 69 (14.5%) |
| 12 to 14 Years | 30 (10.6%) | 13 (5.0%) |
| 15 Years | 0 (0.0%) | 54 (48.2%) |
| 16 and 17 Years | 0 (0.0%) | 5 (4.3%) |
| 18 to 24 Years | 98 (17.4%) | 94 (25.5%) |
| 25 to 34 Years | 50 (7.0%) | 60 (9.2%) |
| 35 to 44 Years | 130 (15.5%) | 104 (14.2%) |
| 45 to 54 Years | 28 (4.5%) | 1 (0.2%) |
| 55 to 64 Years | 43 (6.3%) | 50 (9.4%) |
| 65 to 74 Years | 4 (1.8%) | 0 (0.0%) |
| 75 Years and over | 0 (0.0%) | 10 (9.4%) |
| Total | 498 (10.0%) | 533 (11.6%) |
Income Above Poverty by Sex and Age in Tanaina
According to the poverty statistics in Tanaina, males aged 15 years and females aged 5 years are the age groups that are most secure financially, with 100.0% of males and 100.0% of females in these age groups living above the poverty line.
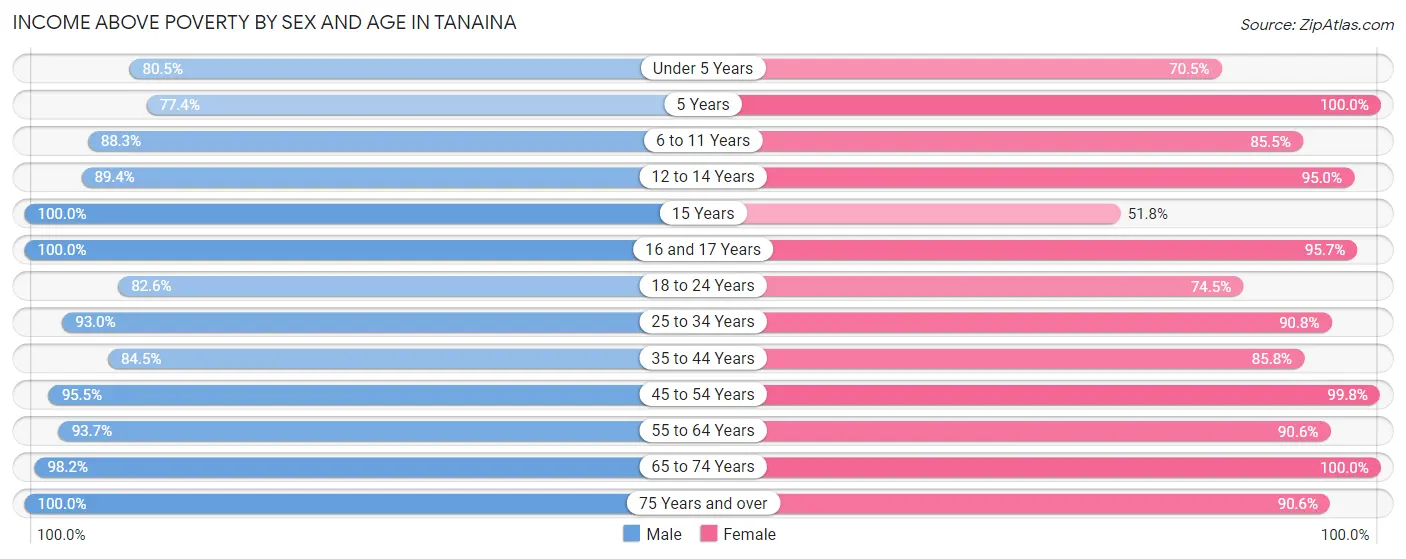
| Age Bracket | Male | Female |
| Under 5 Years | 227 (80.5%) | 174 (70.5%) |
| 5 Years | 41 (77.4%) | 76 (100.0%) |
| 6 to 11 Years | 361 (88.3%) | 407 (85.5%) |
| 12 to 14 Years | 254 (89.4%) | 249 (95.0%) |
| 15 Years | 76 (100.0%) | 58 (51.8%) |
| 16 and 17 Years | 95 (100.0%) | 110 (95.7%) |
| 18 to 24 Years | 466 (82.6%) | 274 (74.5%) |
| 25 to 34 Years | 663 (93.0%) | 595 (90.8%) |
| 35 to 44 Years | 710 (84.5%) | 627 (85.8%) |
| 45 to 54 Years | 596 (95.5%) | 593 (99.8%) |
| 55 to 64 Years | 635 (93.7%) | 484 (90.6%) |
| 65 to 74 Years | 213 (98.2%) | 334 (100.0%) |
| 75 Years and over | 168 (100.0%) | 96 (90.6%) |
| Total | 4,505 (90.0%) | 4,077 (88.4%) |
Income Below Poverty Among Married-Couple Families in Tanaina
The poverty statistics for married-couple families in Tanaina show that 3.7% or 73 of the total 1,964 families live below the poverty line. Families with 5 or more children have the highest poverty rate of 64.5%, comprising of 20 families. On the other hand, families with 3 or 4 children have the lowest poverty rate of 0.0%, which includes 0 families.
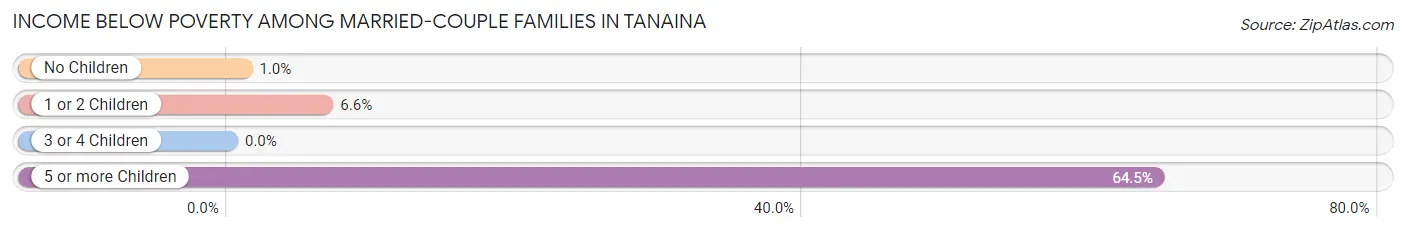
| Children | Above Poverty | Below Poverty |
| No Children | 978 (99.0%) | 10 (1.0%) |
| 1 or 2 Children | 605 (93.4%) | 43 (6.6%) |
| 3 or 4 Children | 297 (100.0%) | 0 (0.0%) |
| 5 or more Children | 11 (35.5%) | 20 (64.5%) |
| Total | 1,891 (96.3%) | 73 (3.7%) |
Income Below Poverty Among Single-Parent Households in Tanaina
According to the poverty data in Tanaina, 27.0% or 88 single-father households and 23.7% or 84 single-mother households are living below the poverty line. Among single-father households, those with 3 or 4 children have the highest poverty rate, with 33 households (100.0%) experiencing poverty. Likewise, among single-mother households, those with 3 or 4 children have the highest poverty rate, with 12 households (100.0%) falling below the poverty line.
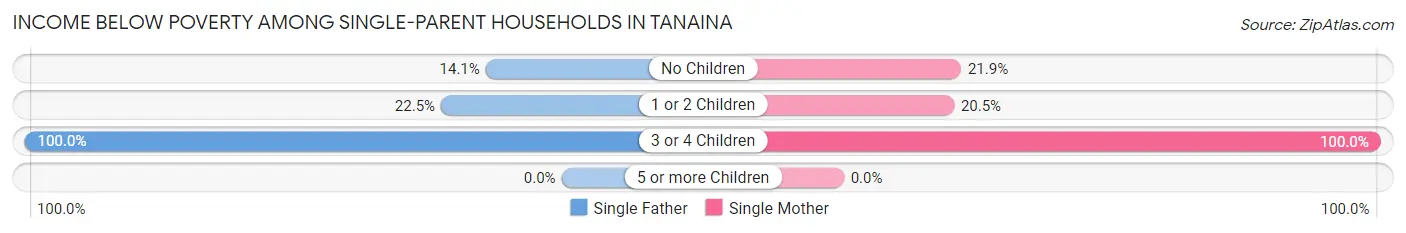
| Children | Single Father | Single Mother |
| No Children | 13 (14.1%) | 26 (21.8%) |
| 1 or 2 Children | 42 (22.5%) | 46 (20.5%) |
| 3 or 4 Children | 33 (100.0%) | 12 (100.0%) |
| 5 or more Children | 0 (0.0%) | 0 (0.0%) |
| Total | 88 (27.0%) | 84 (23.7%) |
Income Below Poverty Among Married-Couple vs Single-Parent Households in Tanaina
The poverty data for Tanaina shows that 73 of the married-couple family households (3.7%) and 172 of the single-parent households (25.3%) are living below the poverty level. Within the married-couple family households, those with 5 or more children have the highest poverty rate, with 20 households (64.5%) falling below the poverty line. Among the single-parent households, those with 3 or 4 children have the highest poverty rate, with 45 household (100.0%) living below poverty.
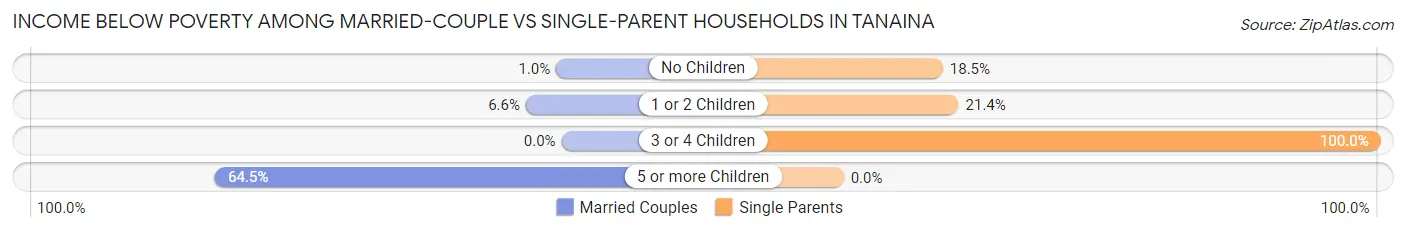
| Children | Married-Couple Families | Single-Parent Households |
| No Children | 10 (1.0%) | 39 (18.5%) |
| 1 or 2 Children | 43 (6.6%) | 88 (21.4%) |
| 3 or 4 Children | 0 (0.0%) | 45 (100.0%) |
| 5 or more Children | 20 (64.5%) | 0 (0.0%) |
| Total | 73 (3.7%) | 172 (25.3%) |
Race in Tanaina
The most populous races in Tanaina are White / Caucasian (7,795 | 80.5%), Two or more Races (926 | 9.6%), and Hispanic or Latino (754 | 7.8%).
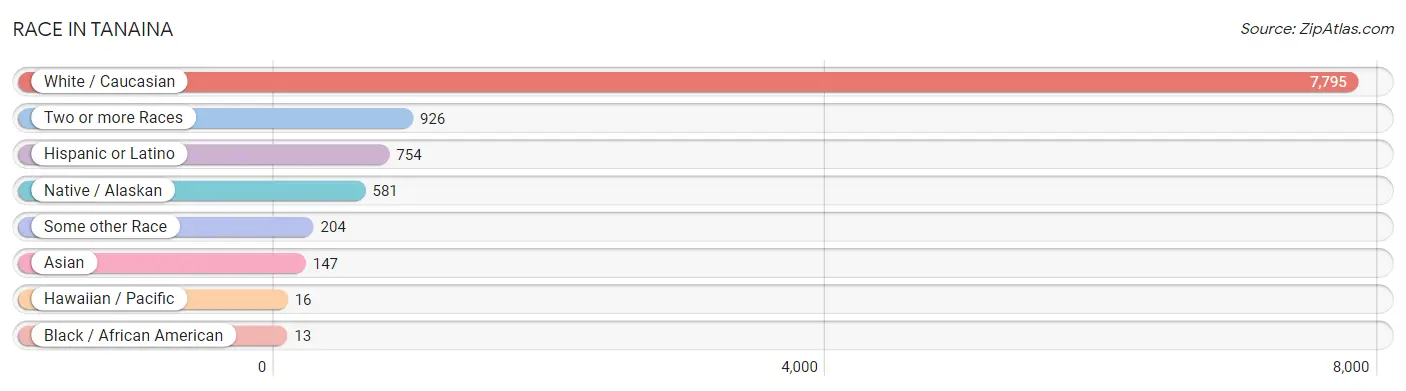
| Race | # Population | % Population |
| Asian | 147 | 1.5% |
| Black / African American | 13 | 0.1% |
| Hawaiian / Pacific | 16 | 0.2% |
| Hispanic or Latino | 754 | 7.8% |
| Native / Alaskan | 581 | 6.0% |
| White / Caucasian | 7,795 | 80.5% |
| Two or more Races | 926 | 9.6% |
| Some other Race | 204 | 2.1% |
| Total | 9,682 | 100.0% |
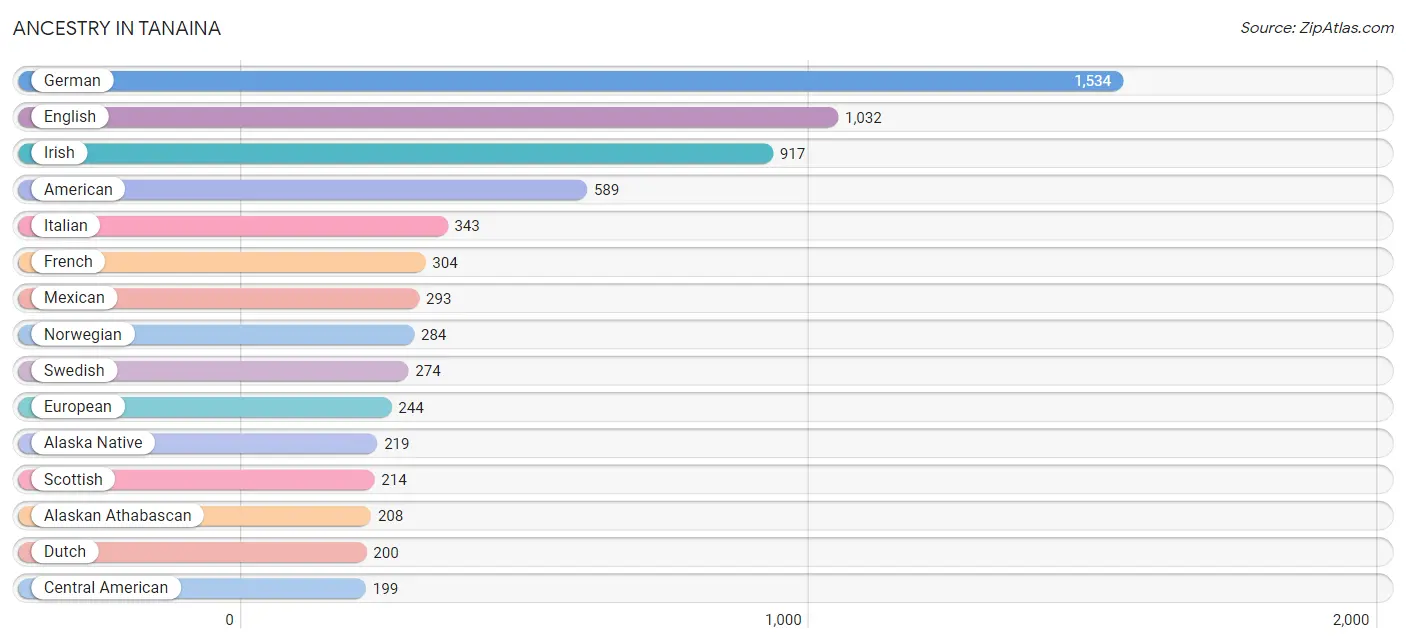
Ancestry in Tanaina
The most populous ancestries reported in Tanaina are German (1,534 | 15.8%), English (1,032 | 10.7%), Irish (917 | 9.5%), American (589 | 6.1%), and Italian (343 | 3.5%), together accounting for 45.6% of all Tanaina residents.
| Ancestry | # Population | % Population |
| African | 7 | 0.1% |
| Alaska Native | 219 | 2.3% |
| Alaskan Athabascan | 208 | 2.1% |
| Aleut | 185 | 1.9% |
| American | 589 | 6.1% |
| Apache | 19 | 0.2% |
| Argentinean | 21 | 0.2% |
| Bangladeshi | 77 | 0.8% |
| Bhutanese | 48 | 0.5% |
| Blackfeet | 7 | 0.1% |
| British | 53 | 0.5% |
| Burmese | 73 | 0.7% |
| Canadian | 10 | 0.1% |
| Central American | 199 | 2.1% |
| Cherokee | 75 | 0.8% |
| Cheyenne | 39 | 0.4% |
| Chickasaw | 12 | 0.1% |
| Chippewa | 9 | 0.1% |
| Colombian | 12 | 0.1% |
| Costa Rican | 63 | 0.6% |
| Czech | 31 | 0.3% |
| Danish | 100 | 1.0% |
| Dutch | 200 | 2.1% |
| Eastern European | 58 | 0.6% |
| English | 1,032 | 10.7% |
| European | 244 | 2.5% |
| Finnish | 124 | 1.3% |
| French | 304 | 3.1% |
| French Canadian | 50 | 0.5% |
| German | 1,534 | 15.8% |
| Guamanian / Chamorro | 16 | 0.2% |
| Honduran | 39 | 0.4% |
| Hungarian | 10 | 0.1% |
| Icelander | 14 | 0.1% |
| Indian (Asian) | 37 | 0.4% |
| Inupiat | 125 | 1.3% |
| Irish | 917 | 9.5% |
| Italian | 343 | 3.5% |
| Korean | 75 | 0.8% |
| Lithuanian | 23 | 0.2% |
| Mexican | 293 | 3.0% |
| Native Hawaiian | 32 | 0.3% |
| Nicaraguan | 49 | 0.5% |
| Northern European | 64 | 0.7% |
| Norwegian | 284 | 2.9% |
| Panamanian | 13 | 0.1% |
| Polish | 160 | 1.7% |
| Portuguese | 19 | 0.2% |
| Puerto Rican | 89 | 0.9% |
| Puget Sound Salish | 15 | 0.2% |
| Russian | 161 | 1.7% |
| Salvadoran | 35 | 0.4% |
| Scandinavian | 65 | 0.7% |
| Scotch-Irish | 168 | 1.7% |
| Scottish | 214 | 2.2% |
| Seminole | 9 | 0.1% |
| Serbian | 11 | 0.1% |
| Sioux | 6 | 0.1% |
| Slavic | 26 | 0.3% |
| Slovak | 40 | 0.4% |
| Slovene | 13 | 0.1% |
| South American | 84 | 0.9% |
| Subsaharan African | 7 | 0.1% |
| Swedish | 274 | 2.8% |
| Swiss | 20 | 0.2% |
| Tlingit-Haida | 38 | 0.4% |
| Ukrainian | 60 | 0.6% |
| Venezuelan | 51 | 0.5% |
| Welsh | 29 | 0.3% |
| Yugoslavian | 12 | 0.1% |
| Yup'ik | 194 | 2.0% | View All 71 Rows |
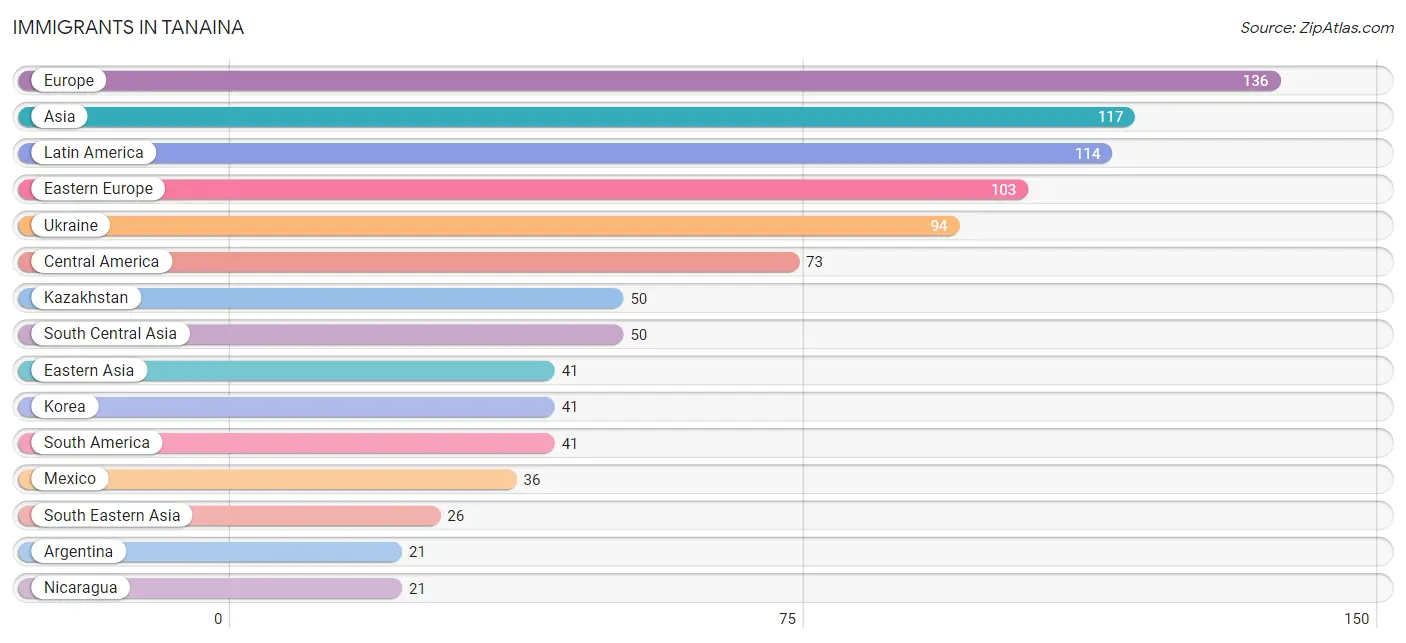
Immigrants in Tanaina
The most numerous immigrant groups reported in Tanaina came from Europe (136 | 1.4%), Asia (117 | 1.2%), Latin America (114 | 1.2%), Eastern Europe (103 | 1.1%), and Ukraine (94 | 1.0%), together accounting for 5.8% of all Tanaina residents.
| Immigration Origin | # Population | % Population |
| Argentina | 21 | 0.2% |
| Asia | 117 | 1.2% |
| Canada | 10 | 0.1% |
| Central America | 73 | 0.7% |
| Colombia | 12 | 0.1% |
| Eastern Asia | 41 | 0.4% |
| Eastern Europe | 103 | 1.1% |
| England | 12 | 0.1% |
| Europe | 136 | 1.4% |
| France | 12 | 0.1% |
| Honduras | 16 | 0.2% |
| Kazakhstan | 50 | 0.5% |
| Korea | 41 | 0.4% |
| Laos | 9 | 0.1% |
| Latin America | 114 | 1.2% |
| Mexico | 36 | 0.4% |
| Nicaragua | 21 | 0.2% |
| Northern Europe | 12 | 0.1% |
| Oceania | 12 | 0.1% |
| Philippines | 8 | 0.1% |
| Portugal | 9 | 0.1% |
| Russia | 9 | 0.1% |
| South America | 41 | 0.4% |
| South Central Asia | 50 | 0.5% |
| South Eastern Asia | 26 | 0.3% |
| Southern Europe | 9 | 0.1% |
| Thailand | 9 | 0.1% |
| Ukraine | 94 | 1.0% |
| Western Europe | 12 | 0.1% | View All 29 Rows |
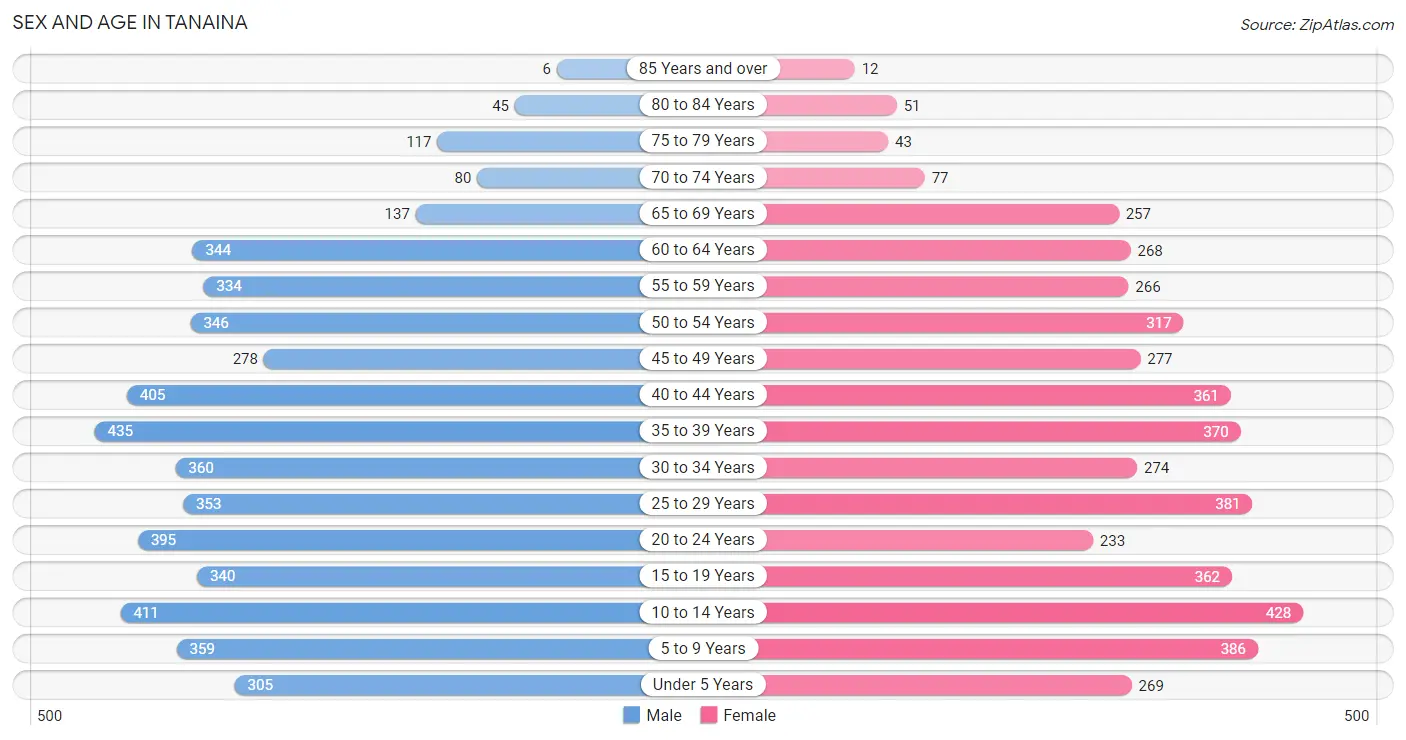
Sex and Age in Tanaina
Sex and Age in Tanaina
The most populous age groups in Tanaina are 35 to 39 Years (435 | 8.6%) for men and 10 to 14 Years (428 | 9.2%) for women.
| Age Bracket | Male | Female |
| Under 5 Years | 305 (6.0%) | 269 (5.8%) |
| 5 to 9 Years | 359 (7.1%) | 386 (8.3%) |
| 10 to 14 Years | 411 (8.1%) | 428 (9.2%) |
| 15 to 19 Years | 340 (6.7%) | 362 (7.8%) |
| 20 to 24 Years | 395 (7.8%) | 233 (5.0%) |
| 25 to 29 Years | 353 (7.0%) | 381 (8.2%) |
| 30 to 34 Years | 360 (7.1%) | 274 (5.9%) |
| 35 to 39 Years | 435 (8.6%) | 370 (8.0%) |
| 40 to 44 Years | 405 (8.0%) | 361 (7.8%) |
| 45 to 49 Years | 278 (5.5%) | 277 (6.0%) |
| 50 to 54 Years | 346 (6.9%) | 317 (6.8%) |
| 55 to 59 Years | 334 (6.6%) | 266 (5.7%) |
| 60 to 64 Years | 344 (6.8%) | 268 (5.8%) |
| 65 to 69 Years | 137 (2.7%) | 257 (5.6%) |
| 70 to 74 Years | 80 (1.6%) | 77 (1.7%) |
| 75 to 79 Years | 117 (2.3%) | 43 (0.9%) |
| 80 to 84 Years | 45 (0.9%) | 51 (1.1%) |
| 85 Years and over | 6 (0.1%) | 12 (0.3%) |
| Total | 5,050 (100.0%) | 4,632 (100.0%) |
Families and Households in Tanaina
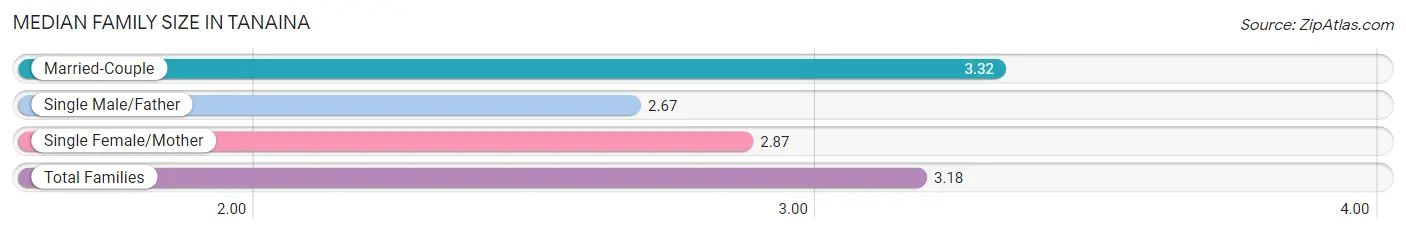
Median Family Size in Tanaina
The median family size in Tanaina is 3.18 persons per family, with married-couple families (1,964 | 74.3%) accounting for the largest median family size of 3.32 persons per family. On the other hand, single male/father families (326 | 12.3%) represent the smallest median family size with 2.67 persons per family.
| Family Type | # Families | Family Size |
| Married-Couple | 1,964 (74.3%) | 3.32 |
| Single Male/Father | 326 (12.3%) | 2.67 |
| Single Female/Mother | 355 (13.4%) | 2.87 |
| Total Families | 2,645 (100.0%) | 3.18 |
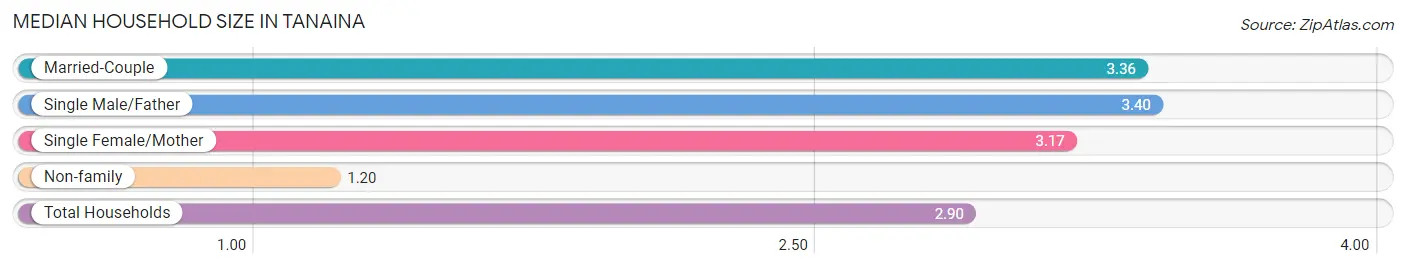
Median Household Size in Tanaina
The median household size in Tanaina is 2.90 persons per household, with single male/father households (326 | 9.8%) accounting for the largest median household size of 3.4 persons per household. non-family households (693 | 20.8%) represent the smallest median household size with 1.20 persons per household.
| Household Type | # Households | Household Size |
| Married-Couple | 1,964 (58.8%) | 3.36 |
| Single Male/Father | 326 (9.8%) | 3.40 |
| Single Female/Mother | 355 (10.6%) | 3.17 |
| Non-family | 693 (20.8%) | 1.20 |
| Total Households | 3,338 (100.0%) | 2.90 |
Household Size by Marriage Status in Tanaina
Out of a total of 3,338 households in Tanaina, 2,645 (79.2%) are family households, while 693 (20.8%) are nonfamily households. The most numerous type of family households are 2-person households, comprising 934, and the most common type of nonfamily households are 1-person households, comprising 560.
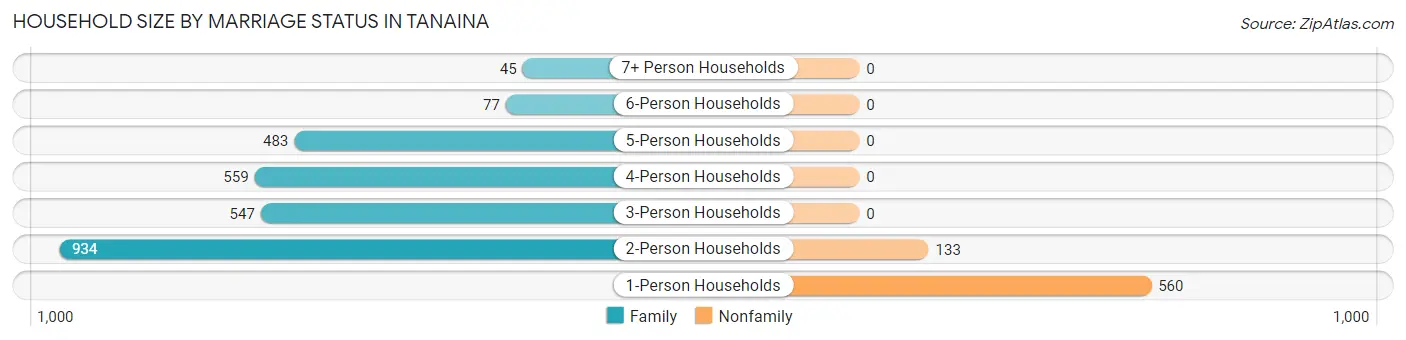
| Household Size | Family Households | Nonfamily Households |
| 1-Person Households | - | 560 (16.8%) |
| 2-Person Households | 934 (28.0%) | 133 (4.0%) |
| 3-Person Households | 547 (16.4%) | 0 (0.0%) |
| 4-Person Households | 559 (16.8%) | 0 (0.0%) |
| 5-Person Households | 483 (14.5%) | 0 (0.0%) |
| 6-Person Households | 77 (2.3%) | 0 (0.0%) |
| 7+ Person Households | 45 (1.3%) | 0 (0.0%) |
| Total | 2,645 (79.2%) | 693 (20.8%) |
Female Fertility in Tanaina
Fertility by Age in Tanaina
Average fertility rate in Tanaina is 82.0 births per 1,000 women. Women in the age bracket of 20 to 34 years have the highest fertility rate with 175.0 births per 1,000 women. Women in the age bracket of 20 to 34 years acount for 82.0% of all women with births.
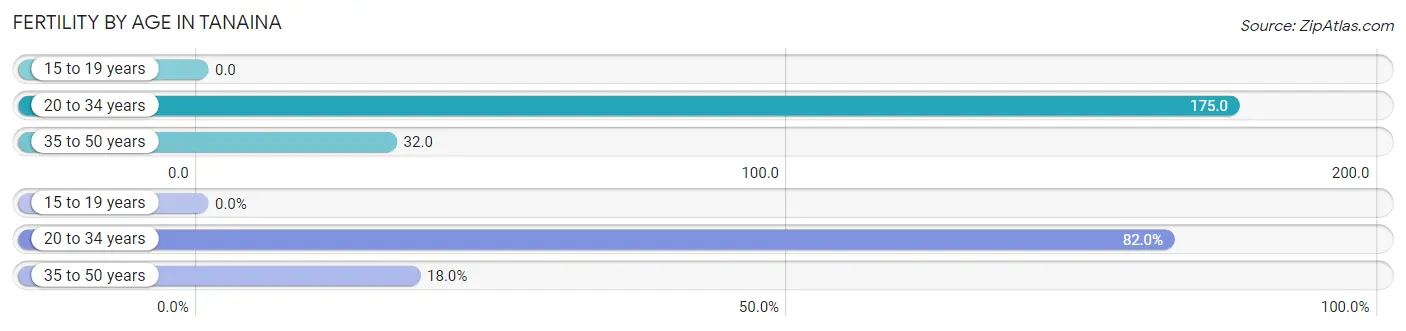
| Age Bracket | Women with Births | Births / 1,000 Women |
| 15 to 19 years | 0 (0.0%) | 0.0 |
| 20 to 34 years | 155 (82.0%) | 175.0 |
| 35 to 50 years | 34 (18.0%) | 32.0 |
| Total | 189 (100.0%) | 82.0 |
Fertility by Age by Marriage Status in Tanaina
63.5% of women with births (189) in Tanaina are married. The highest percentage of unmarried women with births falls into 20 to 34 years age bracket with 44.5% of them unmarried at the time of birth, while the lowest percentage of unmarried women with births belong to 35 to 50 years age bracket with 0.0% of them unmarried.
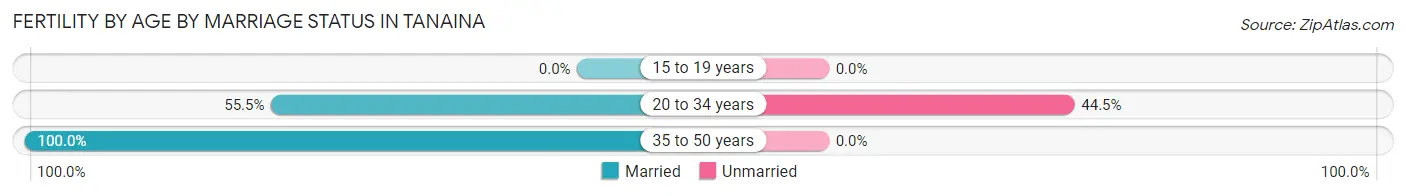
| Age Bracket | Married | Unmarried |
| 15 to 19 years | 0 (0.0%) | 0 (0.0%) |
| 20 to 34 years | 86 (55.5%) | 69 (44.5%) |
| 35 to 50 years | 34 (100.0%) | 0 (0.0%) |
| Total | 120 (63.5%) | 69 (36.5%) |
Fertility by Education in Tanaina
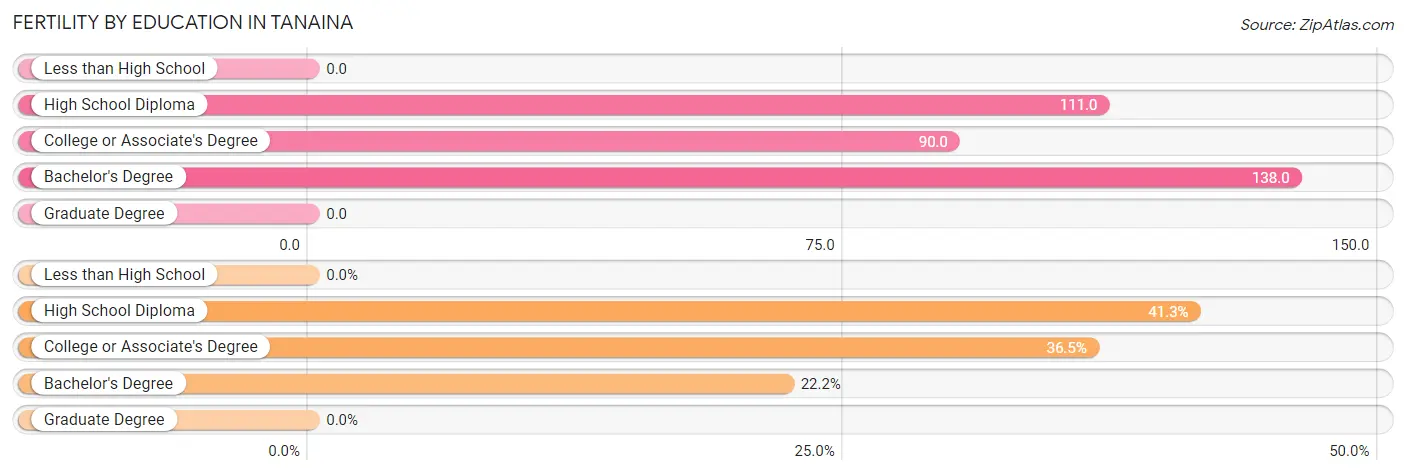
| Educational Attainment | Women with Births | Births / 1,000 Women |
| Less than High School | 0 (0.0%) | 0.0 |
| High School Diploma | 78 (41.3%) | 111.0 |
| College or Associate's Degree | 69 (36.5%) | 90.0 |
| Bachelor's Degree | 42 (22.2%) | 138.0 |
| Graduate Degree | 0 (0.0%) | 0.0 |
| Total | 189 (100.0%) | 82.0 |
Fertility by Education by Marriage Status in Tanaina
36.5% of women with births in Tanaina are unmarried. Women with the educational attainment of bachelor's degree are most likely to be married with 100.0% of them married at childbirth, while women with the educational attainment of high school diploma are least likely to be married with 53.8% of them unmarried at childbirth.
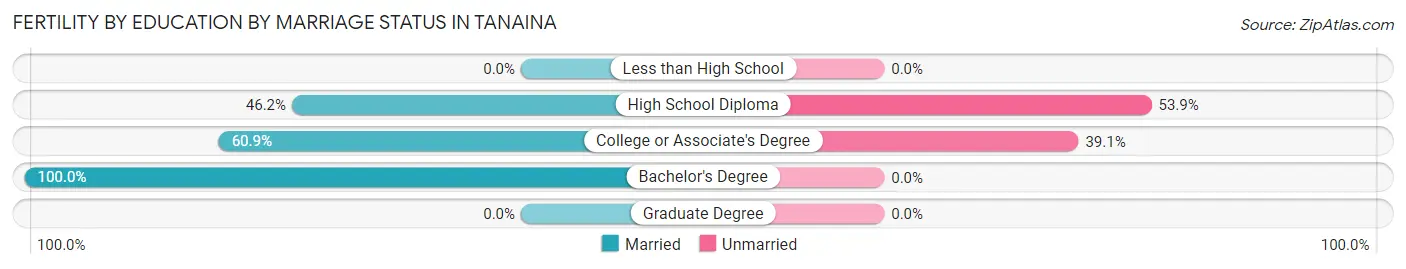
| Educational Attainment | Married | Unmarried |
| Less than High School | 0 (0.0%) | 0 (0.0%) |
| High School Diploma | 36 (46.2%) | 42 (53.8%) |
| College or Associate's Degree | 42 (60.9%) | 27 (39.1%) |
| Bachelor's Degree | 42 (100.0%) | 0 (0.0%) |
| Graduate Degree | 0 (0.0%) | 0 (0.0%) |
| Total | 120 (63.5%) | 69 (36.5%) |
Employment Characteristics in Tanaina
Employment by Class of Employer in Tanaina
Among the 4,445 employed individuals in Tanaina, private company employees (2,864 | 64.4%), not-for-profit organizations (314 | 7.1%), and self-employed (not incorporated) (312 | 7.0%) make up the most common classes of employment.
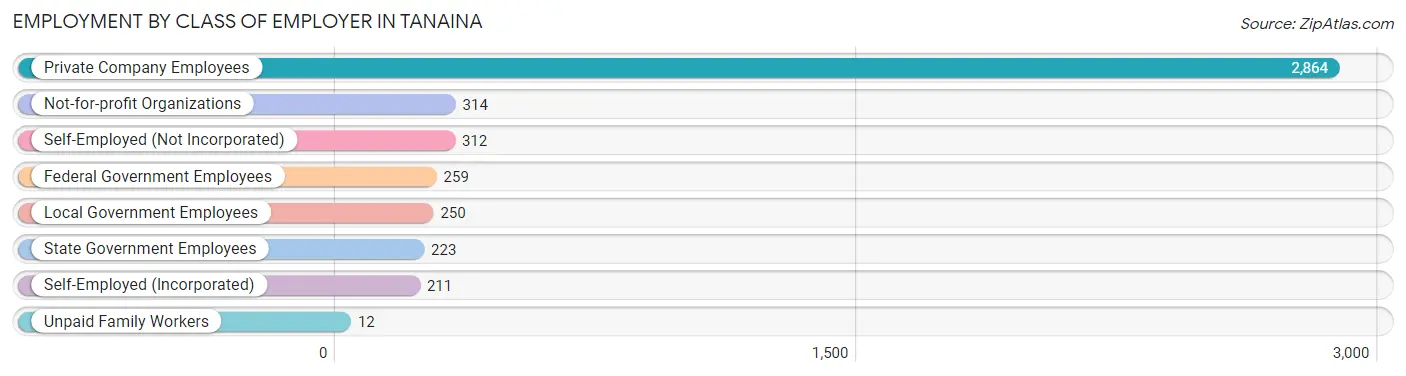
| Employer Class | # Employees | % Employees |
| Private Company Employees | 2,864 | 64.4% |
| Self-Employed (Incorporated) | 211 | 4.8% |
| Self-Employed (Not Incorporated) | 312 | 7.0% |
| Not-for-profit Organizations | 314 | 7.1% |
| Local Government Employees | 250 | 5.6% |
| State Government Employees | 223 | 5.0% |
| Federal Government Employees | 259 | 5.8% |
| Unpaid Family Workers | 12 | 0.3% |
| Total | 4,445 | 100.0% |
Employment Status by Age in Tanaina
According to the labor force statistics for Tanaina, out of the total population over 16 years of age (7,336), 67.4% or 4,944 individuals are in the labor force, with 6.4% or 316 of them unemployed. The age group with the highest labor force participation rate is 25 to 29 years, with 84.3% or 619 individuals in the labor force. Within the labor force, the 20 to 24 years age range has the highest percentage of unemployed individuals, with 12.6% or 55 of them being unemployed.
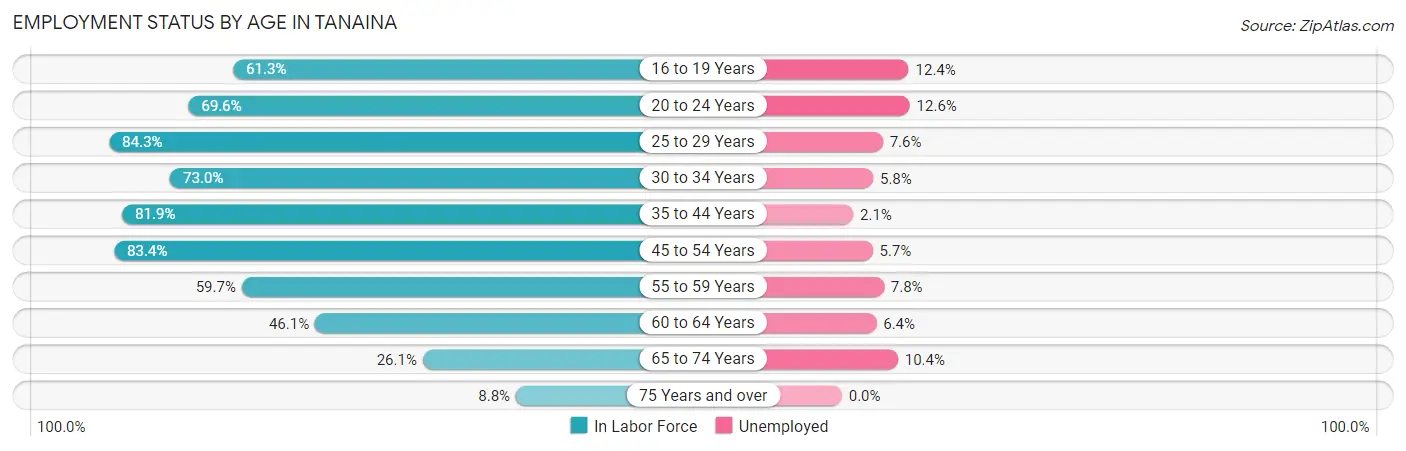
| Age Bracket | In Labor Force | Unemployed |
| 16 to 19 Years | 315 (61.3%) | 39 (12.4%) |
| 20 to 24 Years | 437 (69.6%) | 55 (12.6%) |
| 25 to 29 Years | 619 (84.3%) | 47 (7.6%) |
| 30 to 34 Years | 463 (73.0%) | 27 (5.8%) |
| 35 to 44 Years | 1,287 (81.9%) | 27 (2.1%) |
| 45 to 54 Years | 1,016 (83.4%) | 58 (5.7%) |
| 55 to 59 Years | 358 (59.7%) | 28 (7.8%) |
| 60 to 64 Years | 282 (46.1%) | 18 (6.4%) |
| 65 to 74 Years | 144 (26.1%) | 15 (10.4%) |
| 75 Years and over | 24 (8.8%) | 0 (0.0%) |
| Total | 4,944 (67.4%) | 316 (6.4%) |
Employment Status by Educational Attainment in Tanaina
According to labor force statistics for Tanaina, 74.9% of individuals (4,021) out of the total population between 25 and 64 years of age (5,369) are in the labor force, with 5.1% or 205 of them being unemployed. The group with the highest labor force participation rate are those with the educational attainment of bachelor's degree or higher, with 78.1% or 950 individuals in the labor force. Within the labor force, individuals with high school diploma education have the highest percentage of unemployment, with 7.5% or 102 of them being unemployed.
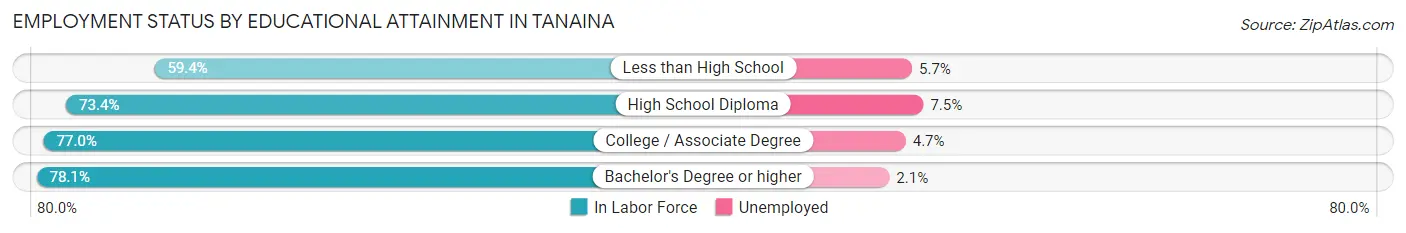
| Educational Attainment | In Labor Force | Unemployed |
| Less than High School | 192 (59.4%) | 18 (5.7%) |
| High School Diploma | 1,359 (73.4%) | 139 (7.5%) |
| College / Associate Degree | 1,524 (77.0%) | 93 (4.7%) |
| Bachelor's Degree or higher | 950 (78.1%) | 26 (2.1%) |
| Total | 4,021 (74.9%) | 274 (5.1%) |
Employment Occupations by Sex in Tanaina
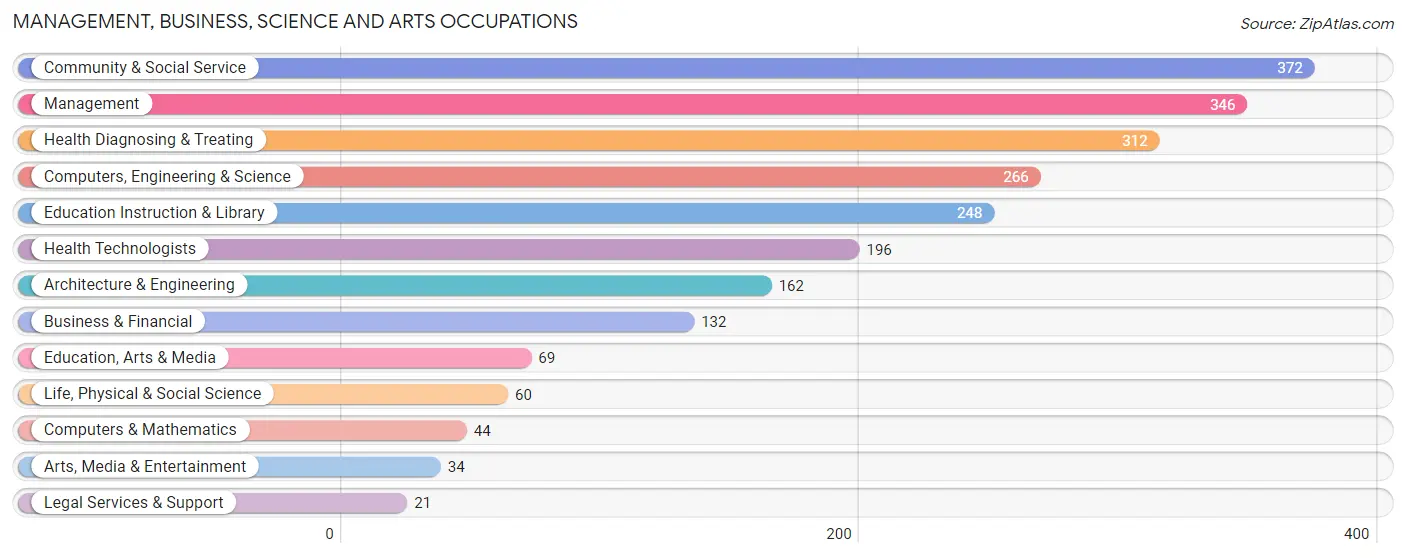
Management, Business, Science and Arts Occupations
The most common Management, Business, Science and Arts occupations in Tanaina are Community & Social Service (372 | 8.1%), Management (346 | 7.6%), Health Diagnosing & Treating (312 | 6.8%), Computers, Engineering & Science (266 | 5.8%), and Education Instruction & Library (248 | 5.4%).
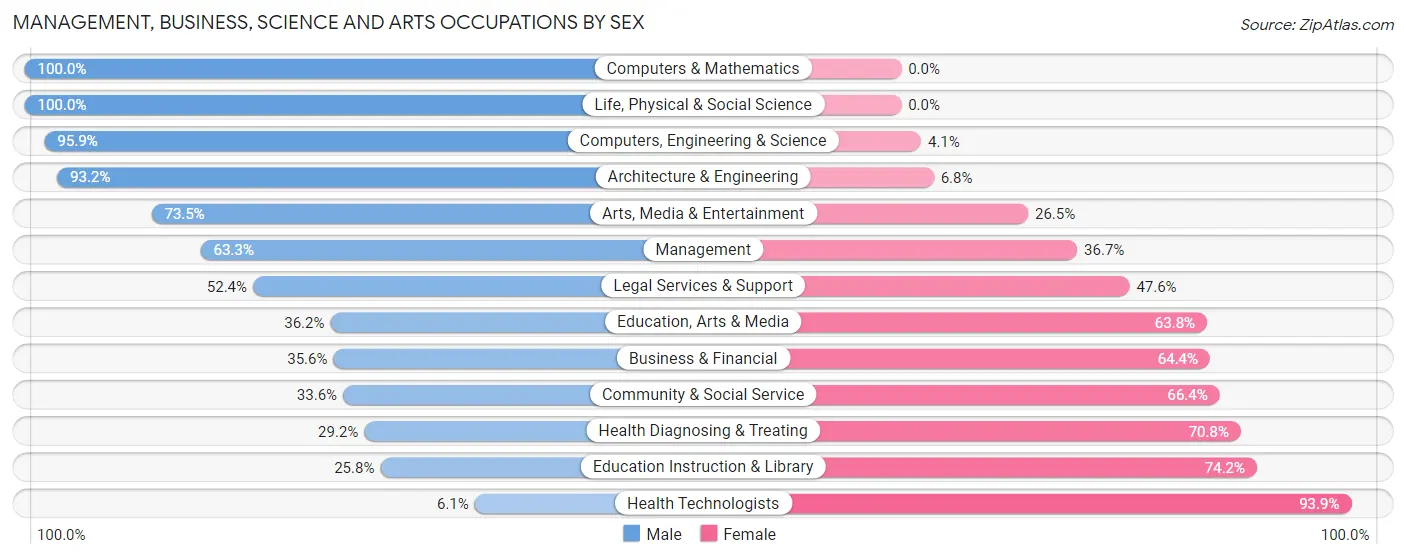
Management, Business, Science and Arts Occupations by Sex
Within the Management, Business, Science and Arts occupations in Tanaina, the most male-oriented occupations are Computers & Mathematics (100.0%), Life, Physical & Social Science (100.0%), and Computers, Engineering & Science (95.9%), while the most female-oriented occupations are Health Technologists (93.9%), Education Instruction & Library (74.2%), and Health Diagnosing & Treating (70.8%).
| Occupation | Male | Female |
| Management | 219 (63.3%) | 127 (36.7%) |
| Business & Financial | 47 (35.6%) | 85 (64.4%) |
| Computers, Engineering & Science | 255 (95.9%) | 11 (4.1%) |
| Computers & Mathematics | 44 (100.0%) | 0 (0.0%) |
| Architecture & Engineering | 151 (93.2%) | 11 (6.8%) |
| Life, Physical & Social Science | 60 (100.0%) | 0 (0.0%) |
| Community & Social Service | 125 (33.6%) | 247 (66.4%) |
| Education, Arts & Media | 25 (36.2%) | 44 (63.8%) |
| Legal Services & Support | 11 (52.4%) | 10 (47.6%) |
| Education Instruction & Library | 64 (25.8%) | 184 (74.2%) |
| Arts, Media & Entertainment | 25 (73.5%) | 9 (26.5%) |
| Health Diagnosing & Treating | 91 (29.2%) | 221 (70.8%) |
| Health Technologists | 12 (6.1%) | 184 (93.9%) |
| Total (Category) | 737 (51.6%) | 691 (48.4%) |
| Total (Overall) | 2,617 (57.2%) | 1,961 (42.8%) |
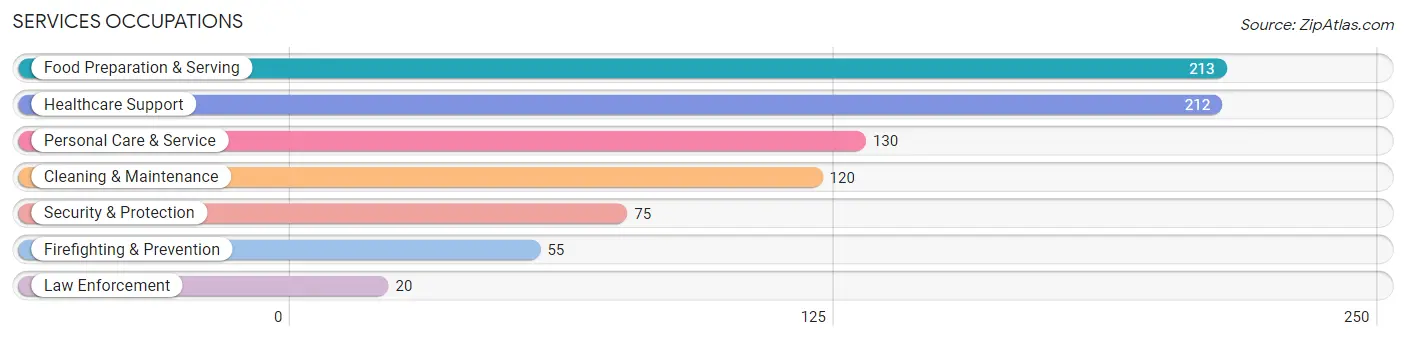
Services Occupations
The most common Services occupations in Tanaina are Food Preparation & Serving (213 | 4.6%), Healthcare Support (212 | 4.6%), Personal Care & Service (130 | 2.8%), Cleaning & Maintenance (120 | 2.6%), and Security & Protection (75 | 1.6%).
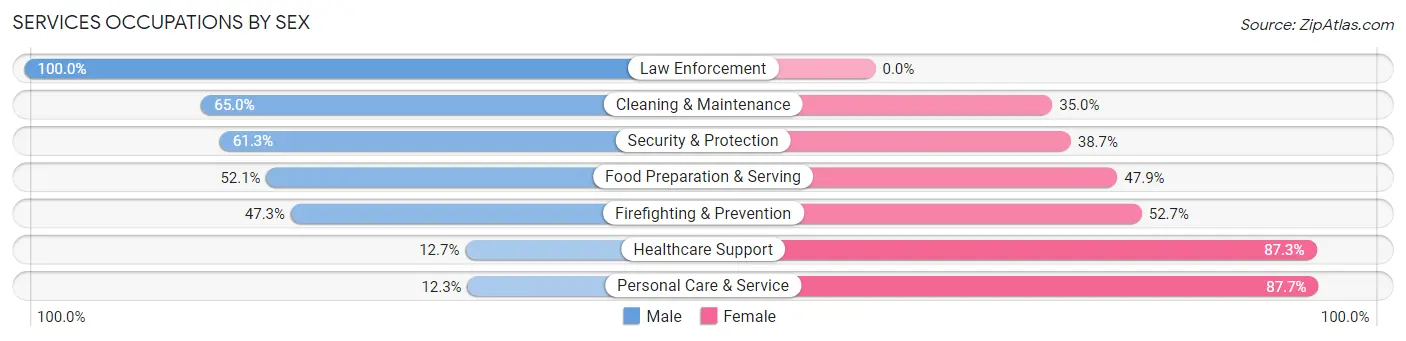
Services Occupations by Sex
Within the Services occupations in Tanaina, the most male-oriented occupations are Law Enforcement (100.0%), Cleaning & Maintenance (65.0%), and Security & Protection (61.3%), while the most female-oriented occupations are Personal Care & Service (87.7%), Healthcare Support (87.3%), and Firefighting & Prevention (52.7%).
| Occupation | Male | Female |
| Healthcare Support | 27 (12.7%) | 185 (87.3%) |
| Security & Protection | 46 (61.3%) | 29 (38.7%) |
| Firefighting & Prevention | 26 (47.3%) | 29 (52.7%) |
| Law Enforcement | 20 (100.0%) | 0 (0.0%) |
| Food Preparation & Serving | 111 (52.1%) | 102 (47.9%) |
| Cleaning & Maintenance | 78 (65.0%) | 42 (35.0%) |
| Personal Care & Service | 16 (12.3%) | 114 (87.7%) |
| Total (Category) | 278 (37.1%) | 472 (62.9%) |
| Total (Overall) | 2,617 (57.2%) | 1,961 (42.8%) |
Sales and Office Occupations
The most common Sales and Office occupations in Tanaina are Office & Administration (478 | 10.4%), and Sales & Related (430 | 9.4%).
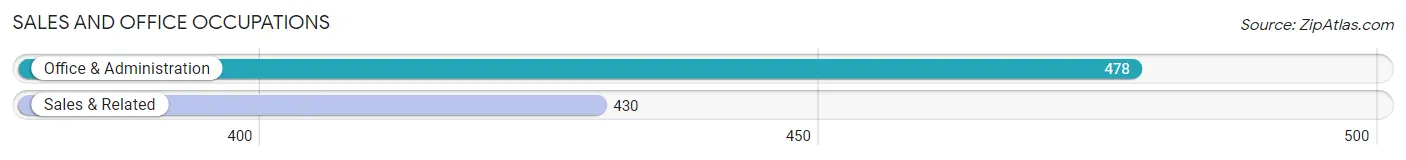
Sales and Office Occupations by Sex
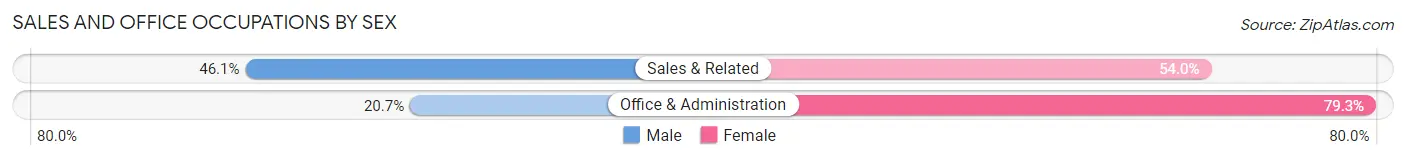
| Occupation | Male | Female |
| Sales & Related | 198 (46.1%) | 232 (53.9%) |
| Office & Administration | 99 (20.7%) | 379 (79.3%) |
| Total (Category) | 297 (32.7%) | 611 (67.3%) |
| Total (Overall) | 2,617 (57.2%) | 1,961 (42.8%) |
Natural Resources, Construction and Maintenance Occupations
The most common Natural Resources, Construction and Maintenance occupations in Tanaina are Construction & Extraction (589 | 12.9%), and Installation, Maintenance & Repair (329 | 7.2%).
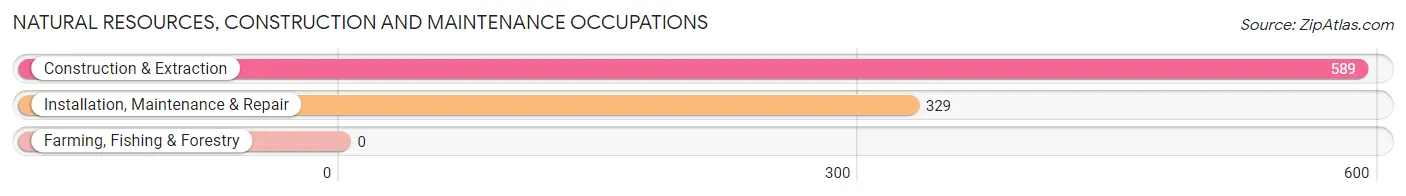
Natural Resources, Construction and Maintenance Occupations by Sex
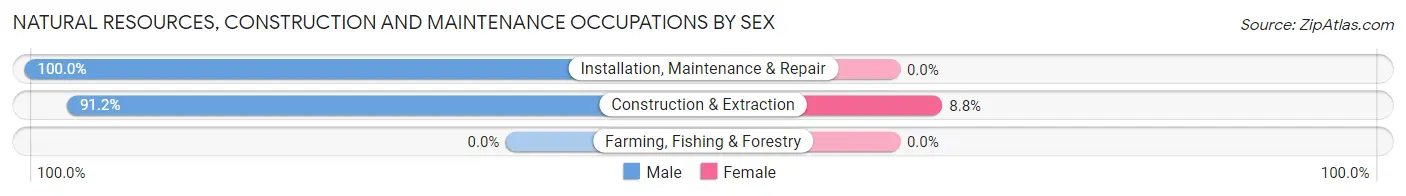
| Occupation | Male | Female |
| Farming, Fishing & Forestry | 0 (0.0%) | 0 (0.0%) |
| Construction & Extraction | 537 (91.2%) | 52 (8.8%) |
| Installation, Maintenance & Repair | 329 (100.0%) | 0 (0.0%) |
| Total (Category) | 866 (94.3%) | 52 (5.7%) |
| Total (Overall) | 2,617 (57.2%) | 1,961 (42.8%) |
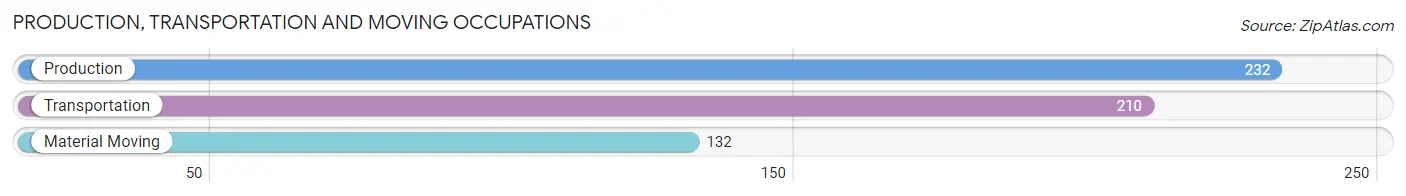
Production, Transportation and Moving Occupations
The most common Production, Transportation and Moving occupations in Tanaina are Production (232 | 5.1%), Transportation (210 | 4.6%), and Material Moving (132 | 2.9%).
Production, Transportation and Moving Occupations by Sex
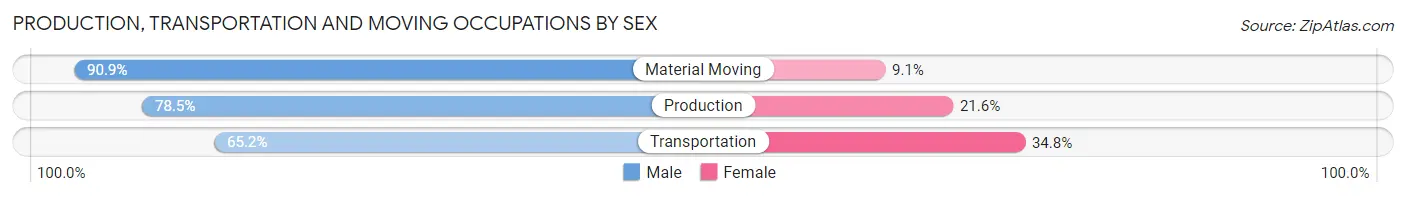
| Occupation | Male | Female |
| Production | 182 (78.4%) | 50 (21.5%) |
| Transportation | 137 (65.2%) | 73 (34.8%) |
| Material Moving | 120 (90.9%) | 12 (9.1%) |
| Total (Category) | 439 (76.5%) | 135 (23.5%) |
| Total (Overall) | 2,617 (57.2%) | 1,961 (42.8%) |
Employment Industries by Sex in Tanaina
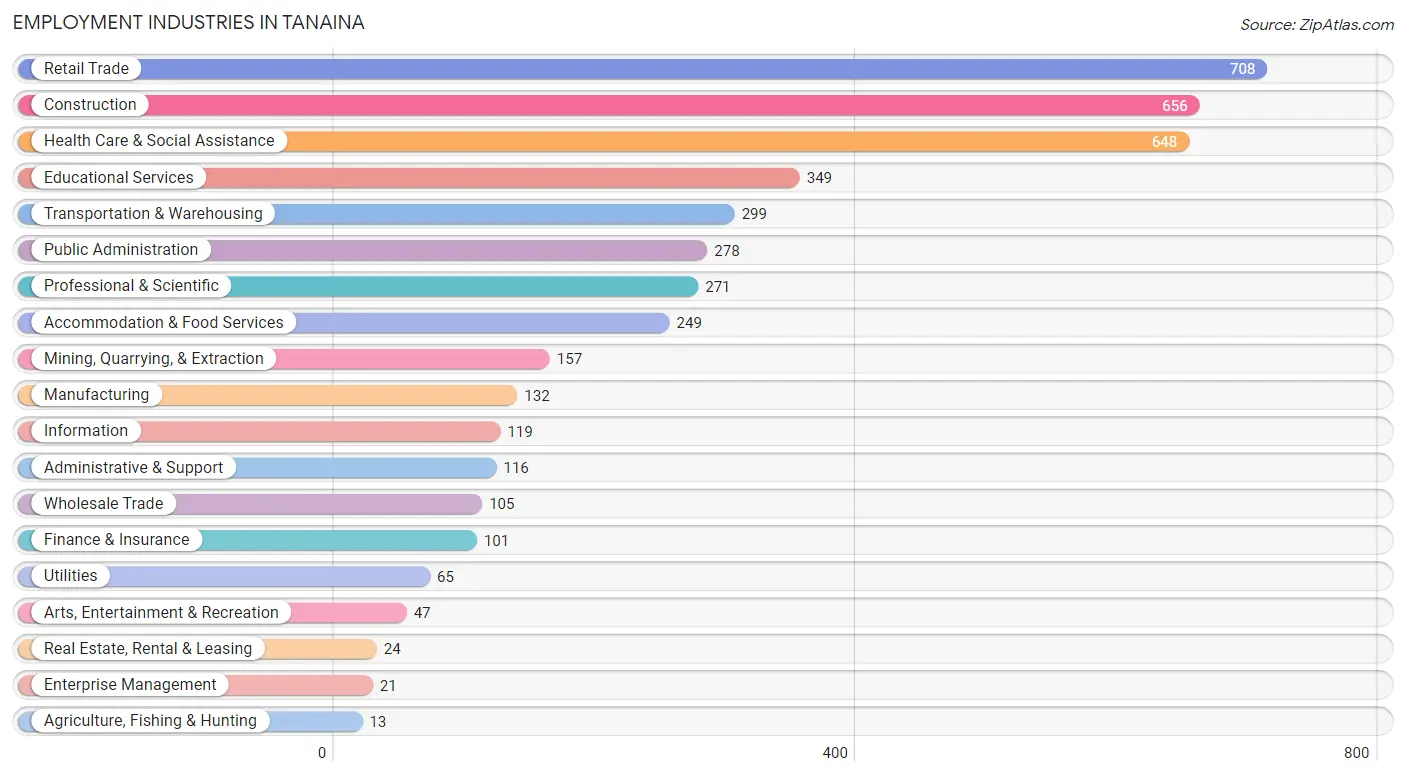
Employment Industries in Tanaina
The major employment industries in Tanaina include Retail Trade (708 | 15.5%), Construction (656 | 14.3%), Health Care & Social Assistance (648 | 14.1%), Educational Services (349 | 7.6%), and Transportation & Warehousing (299 | 6.5%).
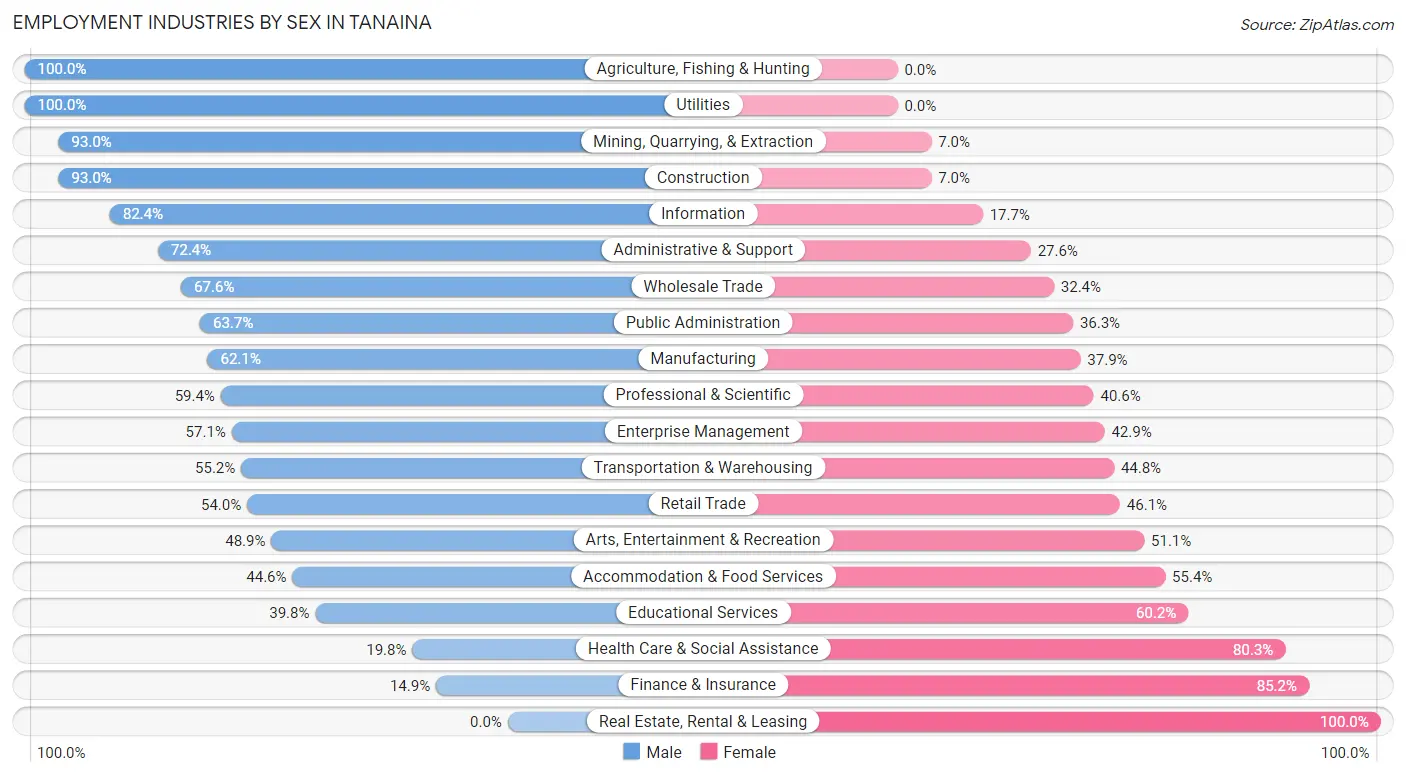
Employment Industries by Sex in Tanaina
The Tanaina industries that see more men than women are Agriculture, Fishing & Hunting (100.0%), Utilities (100.0%), and Mining, Quarrying, & Extraction (93.0%), whereas the industries that tend to have a higher number of women are Real Estate, Rental & Leasing (100.0%), Finance & Insurance (85.2%), and Health Care & Social Assistance (80.2%).
| Industry | Male | Female |
| Agriculture, Fishing & Hunting | 13 (100.0%) | 0 (0.0%) |
| Mining, Quarrying, & Extraction | 146 (93.0%) | 11 (7.0%) |
| Construction | 610 (93.0%) | 46 (7.0%) |
| Manufacturing | 82 (62.1%) | 50 (37.9%) |
| Wholesale Trade | 71 (67.6%) | 34 (32.4%) |
| Retail Trade | 382 (53.9%) | 326 (46.1%) |
| Transportation & Warehousing | 165 (55.2%) | 134 (44.8%) |
| Utilities | 65 (100.0%) | 0 (0.0%) |
| Information | 98 (82.4%) | 21 (17.6%) |
| Finance & Insurance | 15 (14.8%) | 86 (85.2%) |
| Real Estate, Rental & Leasing | 0 (0.0%) | 24 (100.0%) |
| Professional & Scientific | 161 (59.4%) | 110 (40.6%) |
| Enterprise Management | 12 (57.1%) | 9 (42.9%) |
| Administrative & Support | 84 (72.4%) | 32 (27.6%) |
| Educational Services | 139 (39.8%) | 210 (60.2%) |
| Health Care & Social Assistance | 128 (19.8%) | 520 (80.2%) |
| Arts, Entertainment & Recreation | 23 (48.9%) | 24 (51.1%) |
| Accommodation & Food Services | 111 (44.6%) | 138 (55.4%) |
| Public Administration | 177 (63.7%) | 101 (36.3%) |
| Total | 2,617 (57.2%) | 1,961 (42.8%) |
Education in Tanaina
School Enrollment in Tanaina
The most common levels of schooling among the 2,371 students in Tanaina are middle school (659 | 27.8%), high school (575 | 24.2%), and elementary school (525 | 22.1%).
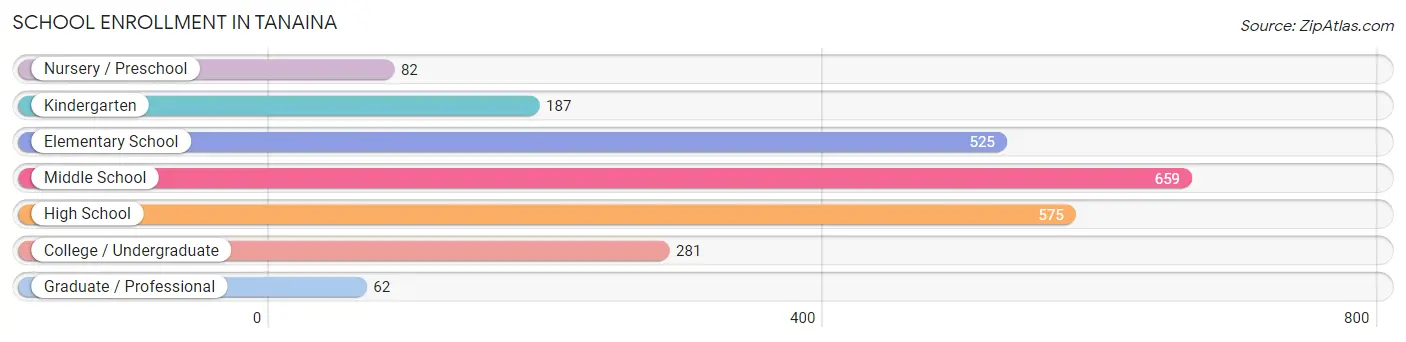
| School Level | # Students | % Students |
| Nursery / Preschool | 82 | 3.5% |
| Kindergarten | 187 | 7.9% |
| Elementary School | 525 | 22.1% |
| Middle School | 659 | 27.8% |
| High School | 575 | 24.2% |
| College / Undergraduate | 281 | 11.8% |
| Graduate / Professional | 62 | 2.6% |
| Total | 2,371 | 100.0% |
School Enrollment by Age by Funding Source in Tanaina
Out of a total of 2,371 students who are enrolled in schools in Tanaina, 332 (14.0%) attend a private institution, while the remaining 2,039 (86.0%) are enrolled in public schools. The age group of 25 to 34 year olds has the highest likelihood of being enrolled in private schools, with 38 (32.5% in the age bracket) enrolled. Conversely, the age group of 35 years and over has the lowest likelihood of being enrolled in a private school, with 72 (100.0% in the age bracket) attending a public institution.
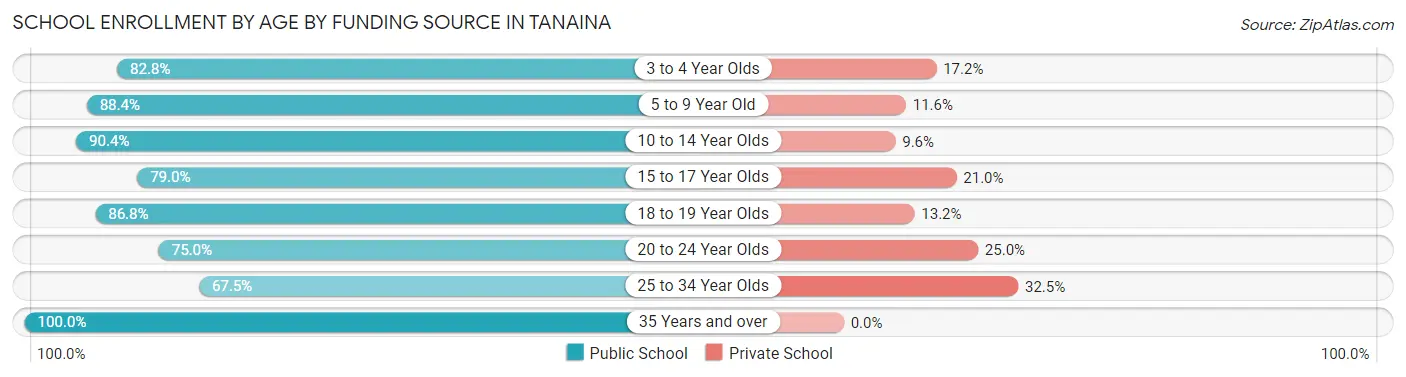
| Age Bracket | Public School | Private School |
| 3 to 4 Year Olds | 48 (82.8%) | 10 (17.2%) |
| 5 to 9 Year Old | 619 (88.4%) | 81 (11.6%) |
| 10 to 14 Year Olds | 696 (90.4%) | 74 (9.6%) |
| 15 to 17 Year Olds | 271 (79.0%) | 72 (21.0%) |
| 18 to 19 Year Olds | 145 (86.8%) | 22 (13.2%) |
| 20 to 24 Year Olds | 108 (75.0%) | 36 (25.0%) |
| 25 to 34 Year Olds | 79 (67.5%) | 38 (32.5%) |
| 35 Years and over | 72 (100.0%) | 0 (0.0%) |
| Total | 2,039 (86.0%) | 332 (14.0%) |
Educational Attainment by Field of Study in Tanaina
Education (273 | 17.8%), science & technology (216 | 14.1%), business (164 | 10.7%), arts & humanities (162 | 10.6%), and engineering (141 | 9.2%) are the most common fields of study among 1,531 individuals in Tanaina who have obtained a bachelor's degree or higher.
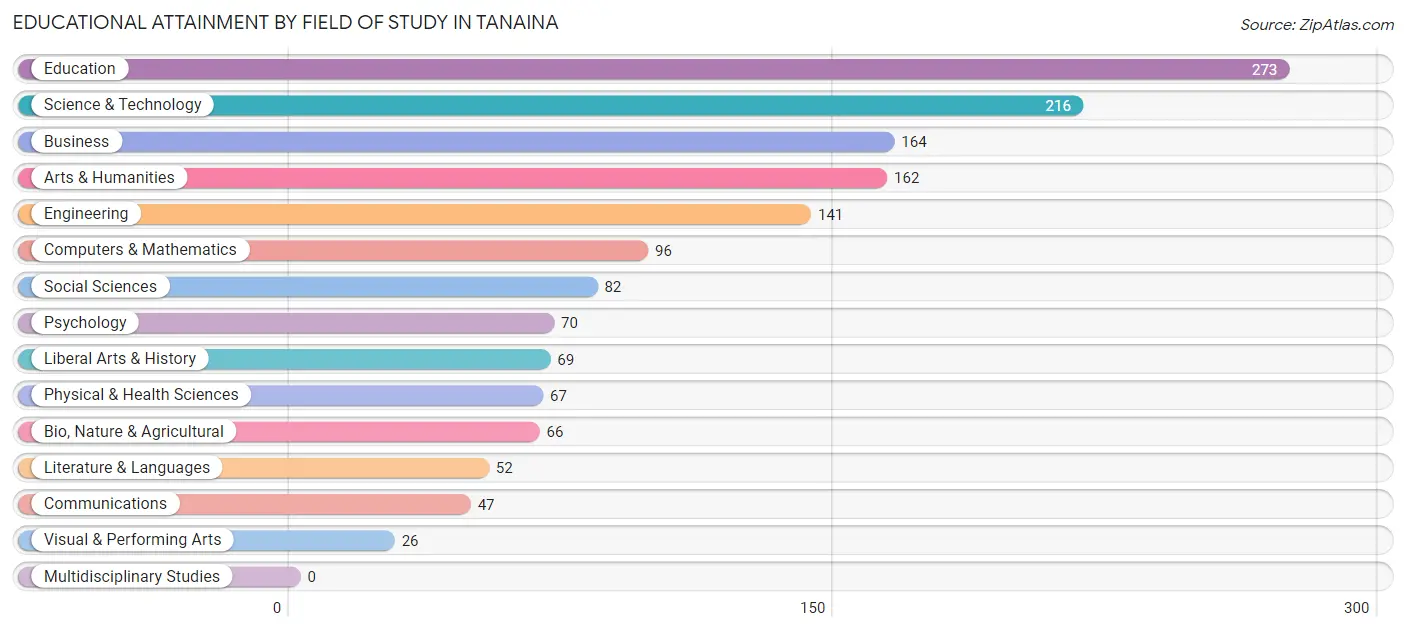
| Field of Study | # Graduates | % Graduates |
| Computers & Mathematics | 96 | 6.3% |
| Bio, Nature & Agricultural | 66 | 4.3% |
| Physical & Health Sciences | 67 | 4.4% |
| Psychology | 70 | 4.6% |
| Social Sciences | 82 | 5.4% |
| Engineering | 141 | 9.2% |
| Multidisciplinary Studies | 0 | 0.0% |
| Science & Technology | 216 | 14.1% |
| Business | 164 | 10.7% |
| Education | 273 | 17.8% |
| Literature & Languages | 52 | 3.4% |
| Liberal Arts & History | 69 | 4.5% |
| Visual & Performing Arts | 26 | 1.7% |
| Communications | 47 | 3.1% |
| Arts & Humanities | 162 | 10.6% |
| Total | 1,531 | 100.0% |
Transportation & Commute in Tanaina
Vehicle Availability by Sex in Tanaina
The most prevalent vehicle ownership categories in Tanaina are males with 2 vehicles (1,018, accounting for 39.5%) and females with 2 vehicles (834, making up 54.6%).
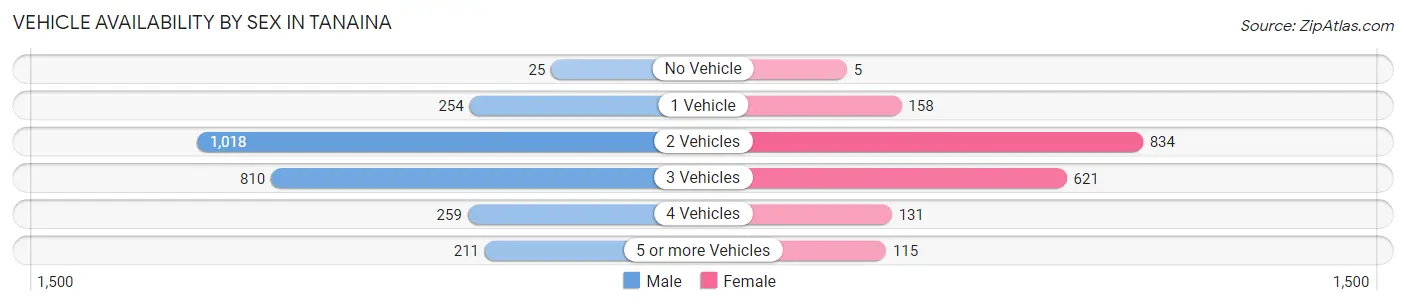
| Vehicles Available | Male | Female |
| No Vehicle | 25 (1.0%) | 5 (0.3%) |
| 1 Vehicle | 254 (9.9%) | 158 (8.5%) |
| 2 Vehicles | 1,018 (39.5%) | 834 (44.7%) |
| 3 Vehicles | 810 (31.4%) | 621 (33.3%) |
| 4 Vehicles | 259 (10.1%) | 131 (7.0%) |
| 5 or more Vehicles | 211 (8.2%) | 115 (6.2%) |
| Total | 2,577 (100.0%) | 1,864 (100.0%) |
Commute Time in Tanaina
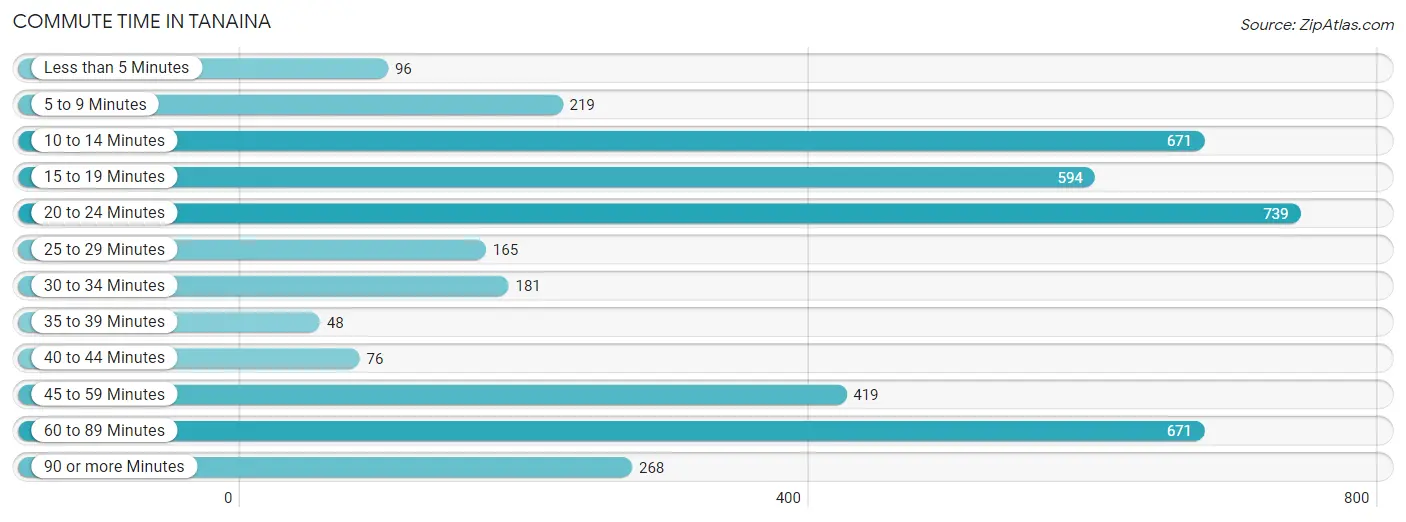
The most frequently occuring commute durations in Tanaina are 20 to 24 minutes (739 commuters, 17.8%), 10 to 14 minutes (671 commuters, 16.2%), and 60 to 89 minutes (671 commuters, 16.2%).
| Commute Time | # Commuters | % Commuters |
| Less than 5 Minutes | 96 | 2.3% |
| 5 to 9 Minutes | 219 | 5.3% |
| 10 to 14 Minutes | 671 | 16.2% |
| 15 to 19 Minutes | 594 | 14.3% |
| 20 to 24 Minutes | 739 | 17.8% |
| 25 to 29 Minutes | 165 | 4.0% |
| 30 to 34 Minutes | 181 | 4.4% |
| 35 to 39 Minutes | 48 | 1.2% |
| 40 to 44 Minutes | 76 | 1.8% |
| 45 to 59 Minutes | 419 | 10.1% |
| 60 to 89 Minutes | 671 | 16.2% |
| 90 or more Minutes | 268 | 6.5% |
Commute Time by Sex in Tanaina
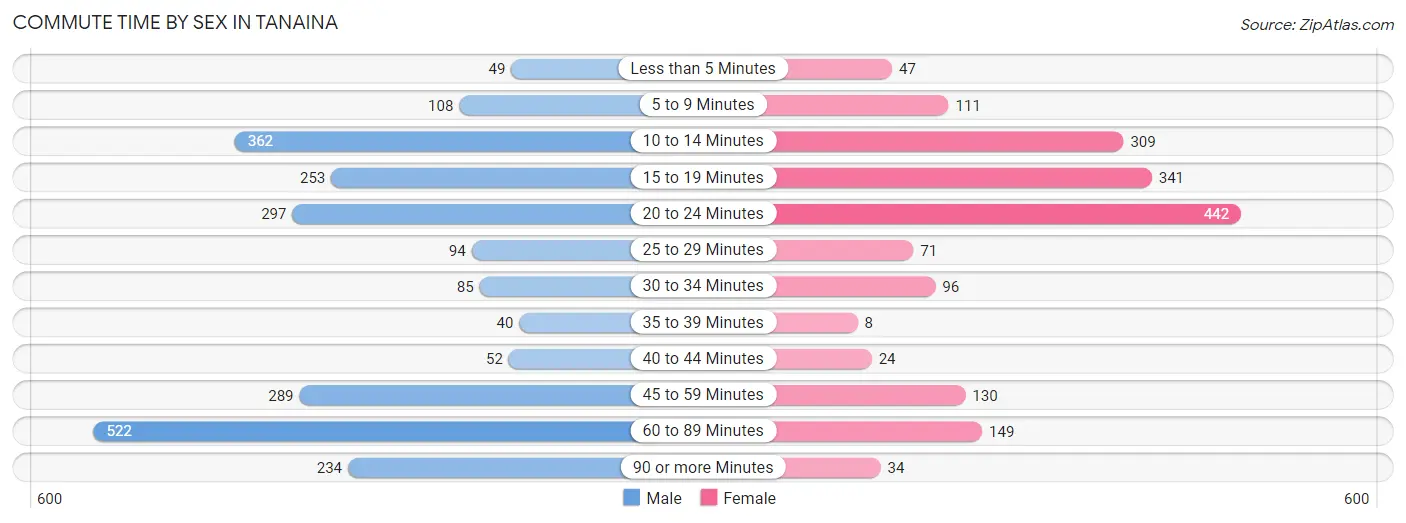
The most common commute times in Tanaina are 60 to 89 minutes (522 commuters, 21.9%) for males and 20 to 24 minutes (442 commuters, 25.1%) for females.
| Commute Time | Male | Female |
| Less than 5 Minutes | 49 (2.1%) | 47 (2.7%) |
| 5 to 9 Minutes | 108 (4.5%) | 111 (6.3%) |
| 10 to 14 Minutes | 362 (15.2%) | 309 (17.5%) |
| 15 to 19 Minutes | 253 (10.6%) | 341 (19.4%) |
| 20 to 24 Minutes | 297 (12.4%) | 442 (25.1%) |
| 25 to 29 Minutes | 94 (3.9%) | 71 (4.0%) |
| 30 to 34 Minutes | 85 (3.6%) | 96 (5.4%) |
| 35 to 39 Minutes | 40 (1.7%) | 8 (0.4%) |
| 40 to 44 Minutes | 52 (2.2%) | 24 (1.4%) |
| 45 to 59 Minutes | 289 (12.1%) | 130 (7.4%) |
| 60 to 89 Minutes | 522 (21.9%) | 149 (8.5%) |
| 90 or more Minutes | 234 (9.8%) | 34 (1.9%) |
Time of Departure to Work by Sex in Tanaina
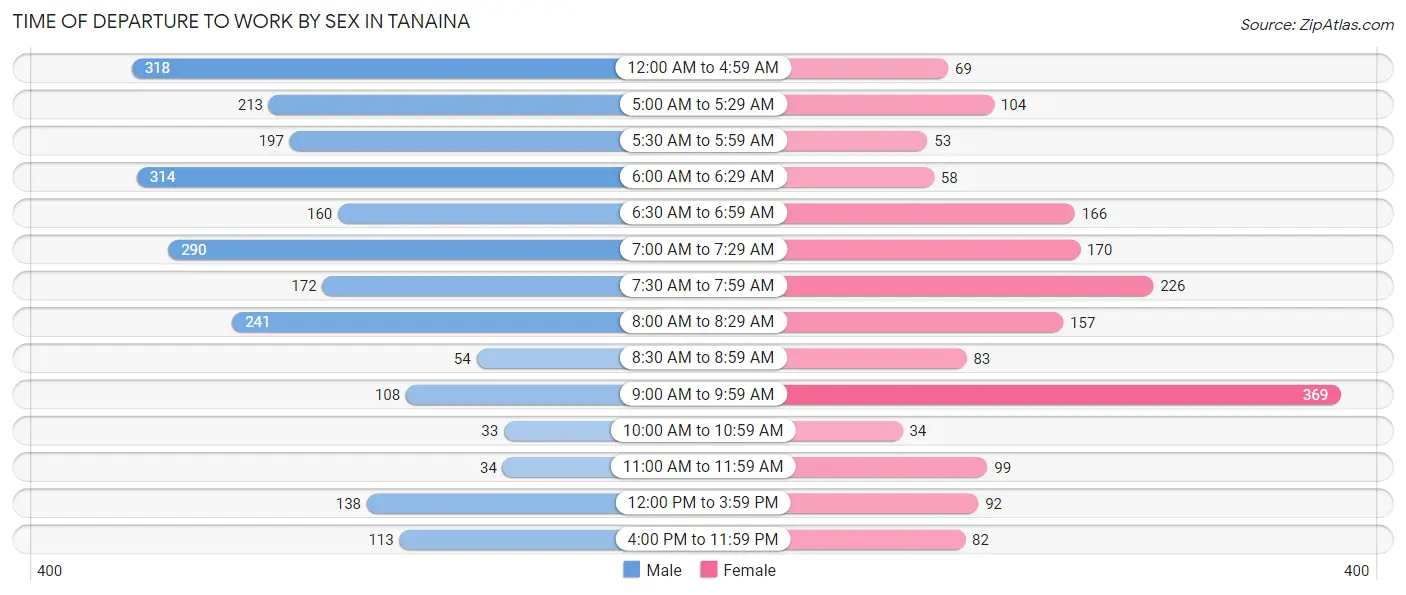
The most frequent times of departure to work in Tanaina are 12:00 AM to 4:59 AM (318, 13.3%) for males and 9:00 AM to 9:59 AM (369, 20.9%) for females.
| Time of Departure | Male | Female |
| 12:00 AM to 4:59 AM | 318 (13.3%) | 69 (3.9%) |
| 5:00 AM to 5:29 AM | 213 (8.9%) | 104 (5.9%) |
| 5:30 AM to 5:59 AM | 197 (8.3%) | 53 (3.0%) |
| 6:00 AM to 6:29 AM | 314 (13.2%) | 58 (3.3%) |
| 6:30 AM to 6:59 AM | 160 (6.7%) | 166 (9.4%) |
| 7:00 AM to 7:29 AM | 290 (12.2%) | 170 (9.7%) |
| 7:30 AM to 7:59 AM | 172 (7.2%) | 226 (12.8%) |
| 8:00 AM to 8:29 AM | 241 (10.1%) | 157 (8.9%) |
| 8:30 AM to 8:59 AM | 54 (2.3%) | 83 (4.7%) |
| 9:00 AM to 9:59 AM | 108 (4.5%) | 369 (20.9%) |
| 10:00 AM to 10:59 AM | 33 (1.4%) | 34 (1.9%) |
| 11:00 AM to 11:59 AM | 34 (1.4%) | 99 (5.6%) |
| 12:00 PM to 3:59 PM | 138 (5.8%) | 92 (5.2%) |
| 4:00 PM to 11:59 PM | 113 (4.7%) | 82 (4.6%) |
| Total | 2,385 (100.0%) | 1,762 (100.0%) |
Housing Occupancy in Tanaina
Occupancy by Ownership in Tanaina
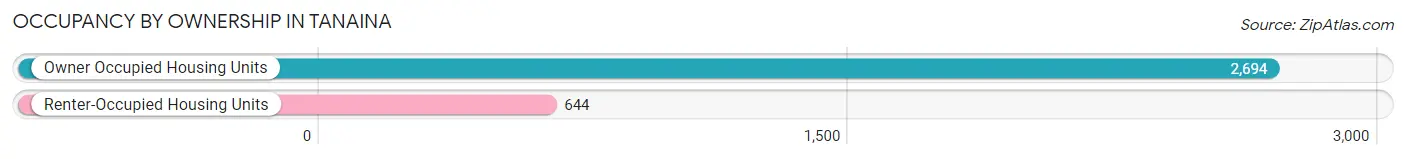
Of the total 3,338 dwellings in Tanaina, owner-occupied units account for 2,694 (80.7%), while renter-occupied units make up 644 (19.3%).
| Occupancy | # Housing Units | % Housing Units |
| Owner Occupied Housing Units | 2,694 | 80.7% |
| Renter-Occupied Housing Units | 644 | 19.3% |
| Total Occupied Housing Units | 3,338 | 100.0% |
Occupancy by Household Size in Tanaina
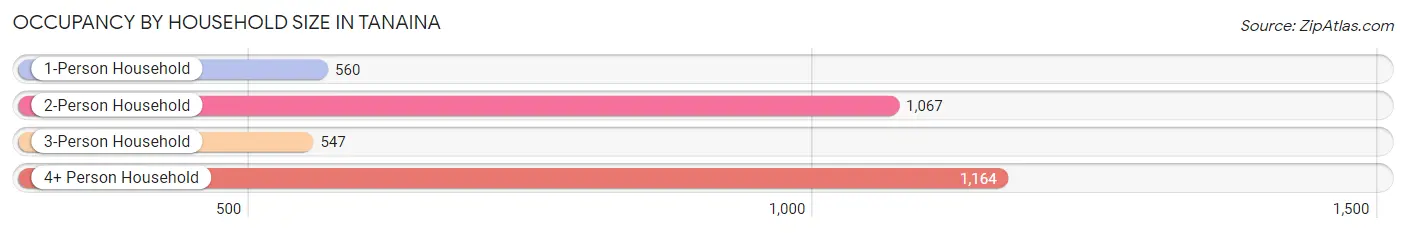
| Household Size | # Housing Units | % Housing Units |
| 1-Person Household | 560 | 16.8% |
| 2-Person Household | 1,067 | 32.0% |
| 3-Person Household | 547 | 16.4% |
| 4+ Person Household | 1,164 | 34.9% |
| Total Housing Units | 3,338 | 100.0% |
Occupancy by Ownership by Household Size in Tanaina
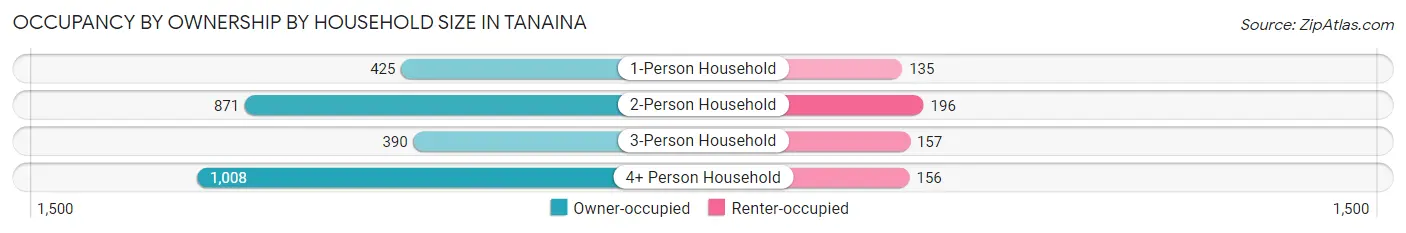
| Household Size | Owner-occupied | Renter-occupied |
| 1-Person Household | 425 (75.9%) | 135 (24.1%) |
| 2-Person Household | 871 (81.6%) | 196 (18.4%) |
| 3-Person Household | 390 (71.3%) | 157 (28.7%) |
| 4+ Person Household | 1,008 (86.6%) | 156 (13.4%) |
| Total Housing Units | 2,694 (80.7%) | 644 (19.3%) |
Occupancy by Educational Attainment in Tanaina
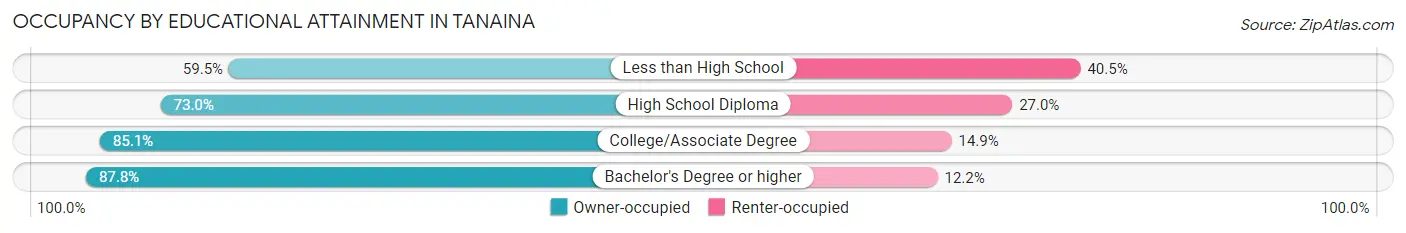
| Household Size | Owner-occupied | Renter-occupied |
| Less than High School | 116 (59.5%) | 79 (40.5%) |
| High School Diploma | 715 (73.0%) | 264 (27.0%) |
| College/Associate Degree | 1,156 (85.1%) | 203 (14.9%) |
| Bachelor's Degree or higher | 707 (87.8%) | 98 (12.2%) |
Occupancy by Age of Householder in Tanaina
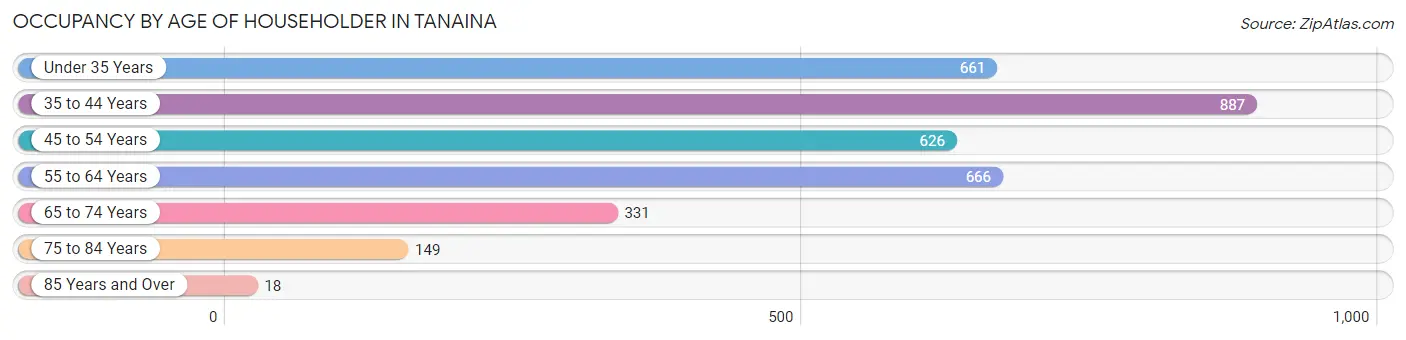
| Age Bracket | # Households | % Households |
| Under 35 Years | 661 | 19.8% |
| 35 to 44 Years | 887 | 26.6% |
| 45 to 54 Years | 626 | 18.8% |
| 55 to 64 Years | 666 | 20.0% |
| 65 to 74 Years | 331 | 9.9% |
| 75 to 84 Years | 149 | 4.5% |
| 85 Years and Over | 18 | 0.5% |
| Total | 3,338 | 100.0% |
Housing Finances in Tanaina
Median Income by Occupancy in Tanaina
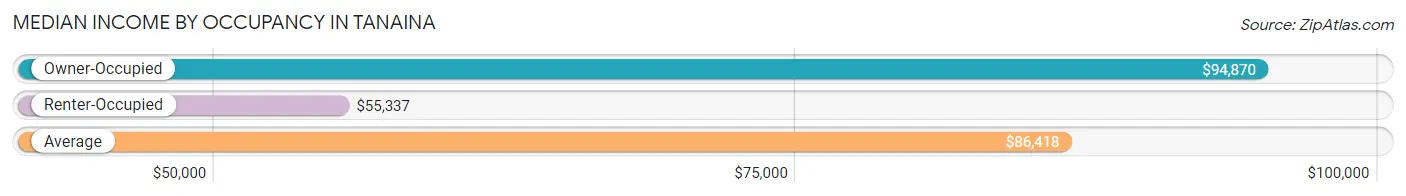
| Occupancy Type | # Households | Median Income |
| Owner-Occupied | 2,694 (80.7%) | $94,870 |
| Renter-Occupied | 644 (19.3%) | $55,337 |
| Average | 3,338 (100.0%) | $86,418 |
Occupancy by Householder Income Bracket in Tanaina
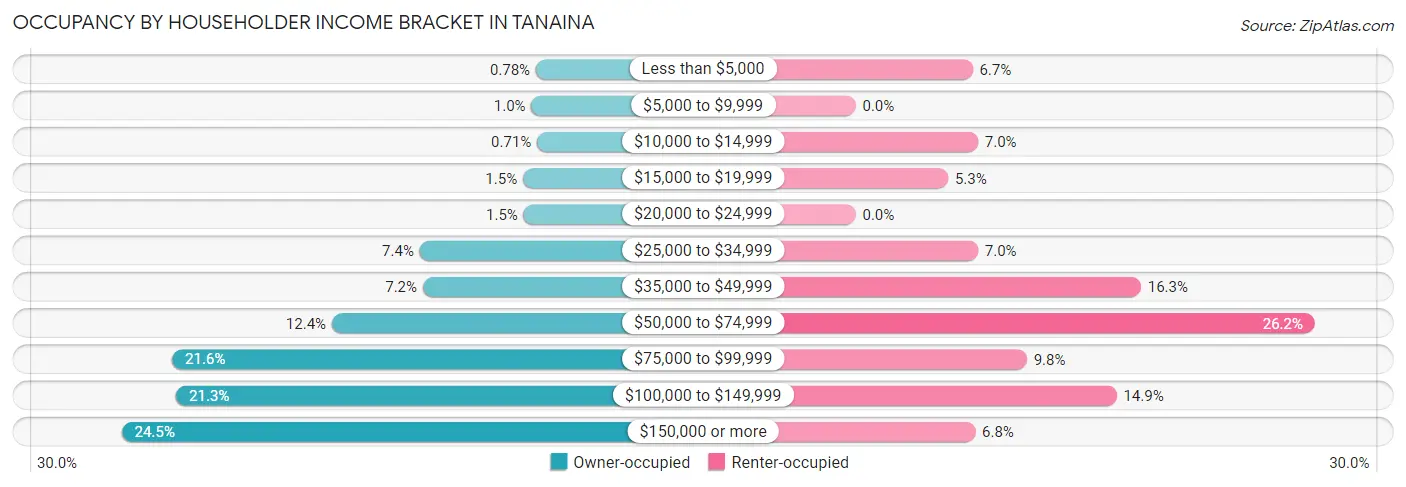
| Income Bracket | Owner-occupied | Renter-occupied |
| Less than $5,000 | 21 (0.8%) | 43 (6.7%) |
| $5,000 to $9,999 | 28 (1.0%) | 0 (0.0%) |
| $10,000 to $14,999 | 19 (0.7%) | 45 (7.0%) |
| $15,000 to $19,999 | 41 (1.5%) | 34 (5.3%) |
| $20,000 to $24,999 | 40 (1.5%) | 0 (0.0%) |
| $25,000 to $34,999 | 200 (7.4%) | 45 (7.0%) |
| $35,000 to $49,999 | 195 (7.2%) | 105 (16.3%) |
| $50,000 to $74,999 | 335 (12.4%) | 169 (26.2%) |
| $75,000 to $99,999 | 581 (21.6%) | 63 (9.8%) |
| $100,000 to $149,999 | 575 (21.3%) | 96 (14.9%) |
| $150,000 or more | 659 (24.5%) | 44 (6.8%) |
| Total | 2,694 (100.0%) | 644 (100.0%) |
Monthly Housing Cost Tiers in Tanaina
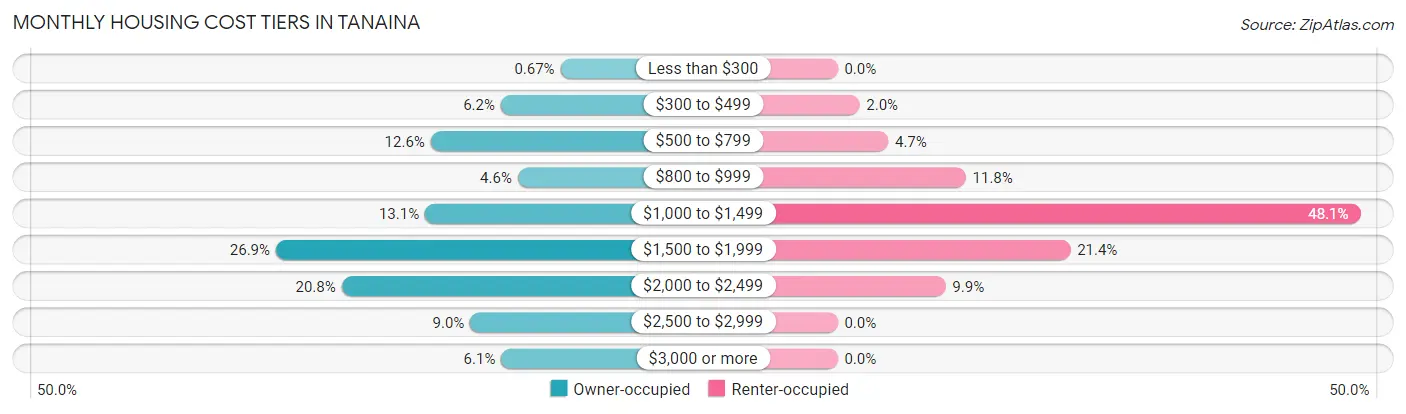
| Monthly Cost | Owner-occupied | Renter-occupied |
| Less than $300 | 18 (0.7%) | 0 (0.0%) |
| $300 to $499 | 166 (6.2%) | 13 (2.0%) |
| $500 to $799 | 340 (12.6%) | 30 (4.7%) |
| $800 to $999 | 124 (4.6%) | 76 (11.8%) |
| $1,000 to $1,499 | 354 (13.1%) | 310 (48.1%) |
| $1,500 to $1,999 | 724 (26.9%) | 138 (21.4%) |
| $2,000 to $2,499 | 561 (20.8%) | 64 (9.9%) |
| $2,500 to $2,999 | 242 (9.0%) | 0 (0.0%) |
| $3,000 or more | 165 (6.1%) | 0 (0.0%) |
| Total | 2,694 (100.0%) | 644 (100.0%) |
Physical Housing Characteristics in Tanaina
Housing Structures in Tanaina
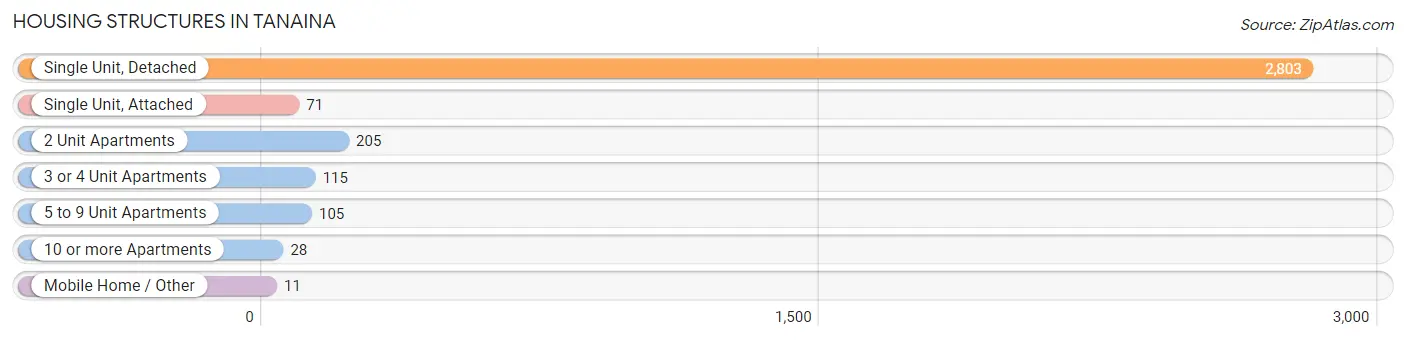
| Structure Type | # Housing Units | % Housing Units |
| Single Unit, Detached | 2,803 | 84.0% |
| Single Unit, Attached | 71 | 2.1% |
| 2 Unit Apartments | 205 | 6.1% |
| 3 or 4 Unit Apartments | 115 | 3.5% |
| 5 to 9 Unit Apartments | 105 | 3.2% |
| 10 or more Apartments | 28 | 0.8% |
| Mobile Home / Other | 11 | 0.3% |
| Total | 3,338 | 100.0% |
Housing Structures by Occupancy in Tanaina
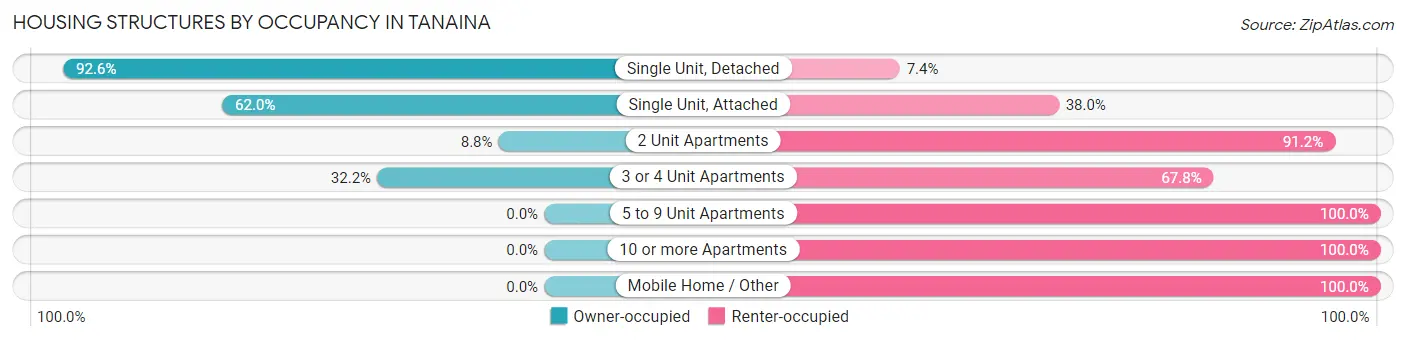
| Structure Type | Owner-occupied | Renter-occupied |
| Single Unit, Detached | 2,595 (92.6%) | 208 (7.4%) |
| Single Unit, Attached | 44 (62.0%) | 27 (38.0%) |
| 2 Unit Apartments | 18 (8.8%) | 187 (91.2%) |
| 3 or 4 Unit Apartments | 37 (32.2%) | 78 (67.8%) |
| 5 to 9 Unit Apartments | 0 (0.0%) | 105 (100.0%) |
| 10 or more Apartments | 0 (0.0%) | 28 (100.0%) |
| Mobile Home / Other | 0 (0.0%) | 11 (100.0%) |
| Total | 2,694 (80.7%) | 644 (19.3%) |
Housing Structures by Number of Rooms in Tanaina
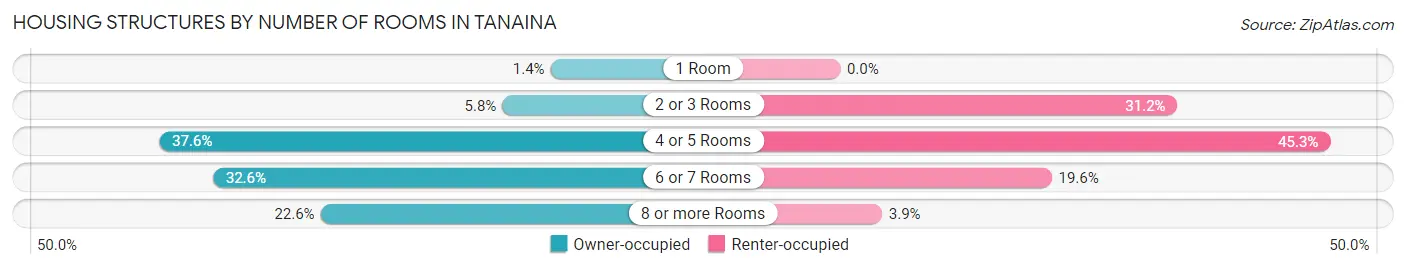
| Number of Rooms | Owner-occupied | Renter-occupied |
| 1 Room | 37 (1.4%) | 0 (0.0%) |
| 2 or 3 Rooms | 157 (5.8%) | 201 (31.2%) |
| 4 or 5 Rooms | 1,012 (37.6%) | 292 (45.3%) |
| 6 or 7 Rooms | 878 (32.6%) | 126 (19.6%) |
| 8 or more Rooms | 610 (22.6%) | 25 (3.9%) |
| Total | 2,694 (100.0%) | 644 (100.0%) |
Housing Structure by Heating Type in Tanaina
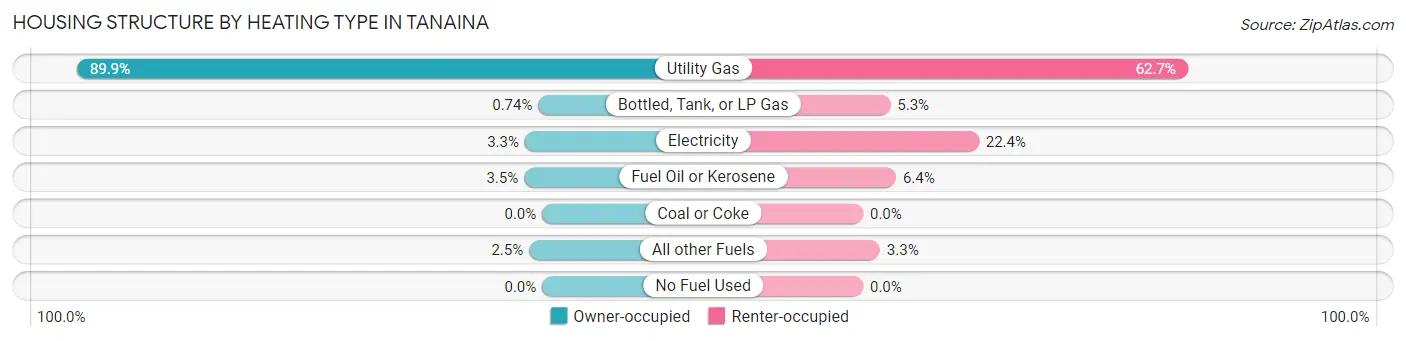
| Heating Type | Owner-occupied | Renter-occupied |
| Utility Gas | 2,422 (89.9%) | 404 (62.7%) |
| Bottled, Tank, or LP Gas | 20 (0.7%) | 34 (5.3%) |
| Electricity | 90 (3.3%) | 144 (22.4%) |
| Fuel Oil or Kerosene | 94 (3.5%) | 41 (6.4%) |
| Coal or Coke | 0 (0.0%) | 0 (0.0%) |
| All other Fuels | 68 (2.5%) | 21 (3.3%) |
| No Fuel Used | 0 (0.0%) | 0 (0.0%) |
| Total | 2,694 (100.0%) | 644 (100.0%) |
Household Vehicle Usage in Tanaina
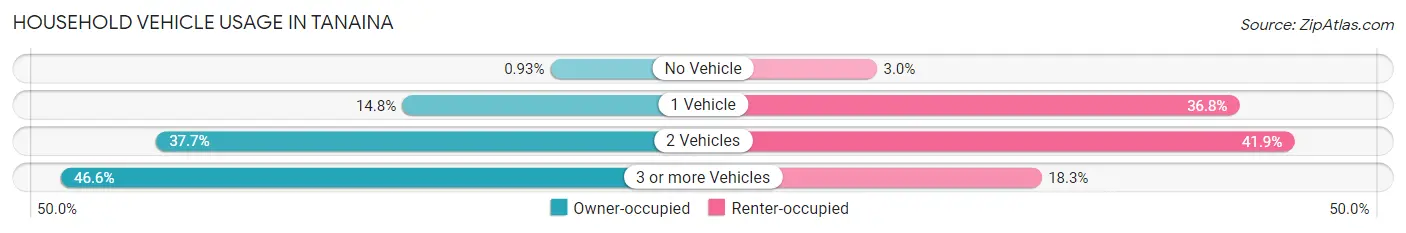
| Vehicles per Household | Owner-occupied | Renter-occupied |
| No Vehicle | 25 (0.9%) | 19 (2.9%) |
| 1 Vehicle | 398 (14.8%) | 237 (36.8%) |
| 2 Vehicles | 1,016 (37.7%) | 270 (41.9%) |
| 3 or more Vehicles | 1,255 (46.6%) | 118 (18.3%) |
| Total | 2,694 (100.0%) | 644 (100.0%) |
Real Estate & Mortgages in Tanaina
Real Estate and Mortgage Overview in Tanaina
| Characteristic | Without Mortgage | With Mortgage |
| Housing Units | 669 | 2,025 |
| Median Property Value | $293,800 | $287,600 |
| Median Household Income | $75,845 | $555 |
| Monthly Housing Costs | $657 | $165 |
| Real Estate Taxes | $3,369 | $174 |
Property Value by Mortgage Status in Tanaina
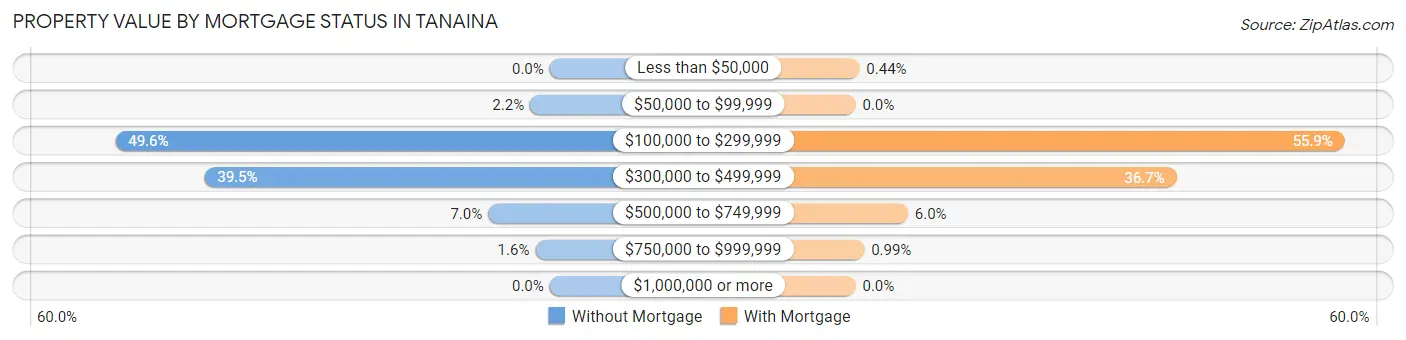
| Property Value | Without Mortgage | With Mortgage |
| Less than $50,000 | 0 (0.0%) | 9 (0.4%) |
| $50,000 to $99,999 | 15 (2.2%) | 0 (0.0%) |
| $100,000 to $299,999 | 332 (49.6%) | 1,132 (55.9%) |
| $300,000 to $499,999 | 264 (39.5%) | 743 (36.7%) |
| $500,000 to $749,999 | 47 (7.0%) | 121 (6.0%) |
| $750,000 to $999,999 | 11 (1.6%) | 20 (1.0%) |
| $1,000,000 or more | 0 (0.0%) | 0 (0.0%) |
| Total | 669 (100.0%) | 2,025 (100.0%) |
Household Income by Mortgage Status in Tanaina
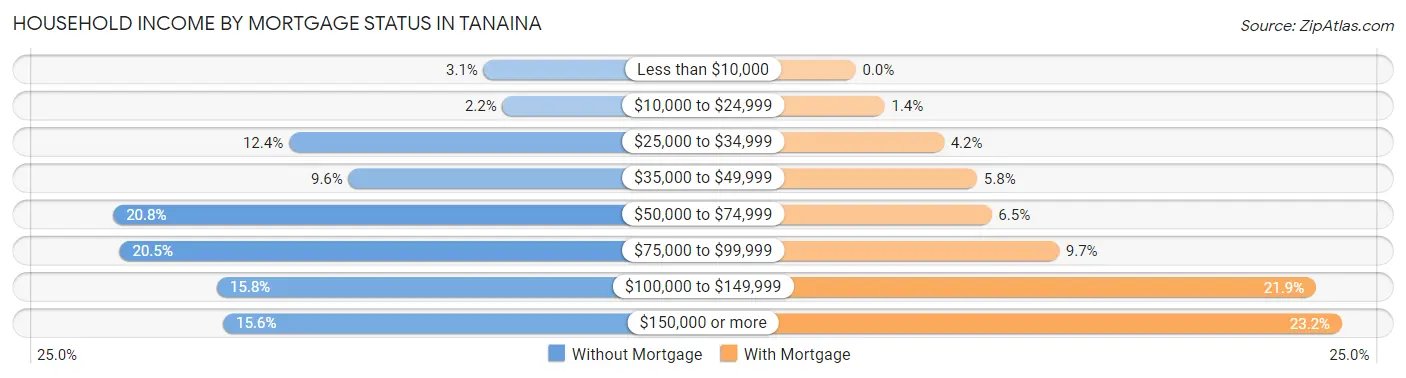
| Household Income | Without Mortgage | With Mortgage |
| Less than $10,000 | 21 (3.1%) | 0 (0.0%) |
| $10,000 to $24,999 | 15 (2.2%) | 28 (1.4%) |
| $25,000 to $34,999 | 83 (12.4%) | 85 (4.2%) |
| $35,000 to $49,999 | 64 (9.6%) | 117 (5.8%) |
| $50,000 to $74,999 | 139 (20.8%) | 131 (6.5%) |
| $75,000 to $99,999 | 137 (20.5%) | 196 (9.7%) |
| $100,000 to $149,999 | 106 (15.8%) | 444 (21.9%) |
| $150,000 or more | 104 (15.5%) | 469 (23.2%) |
| Total | 669 (100.0%) | 2,025 (100.0%) |
Property Value to Household Income Ratio in Tanaina
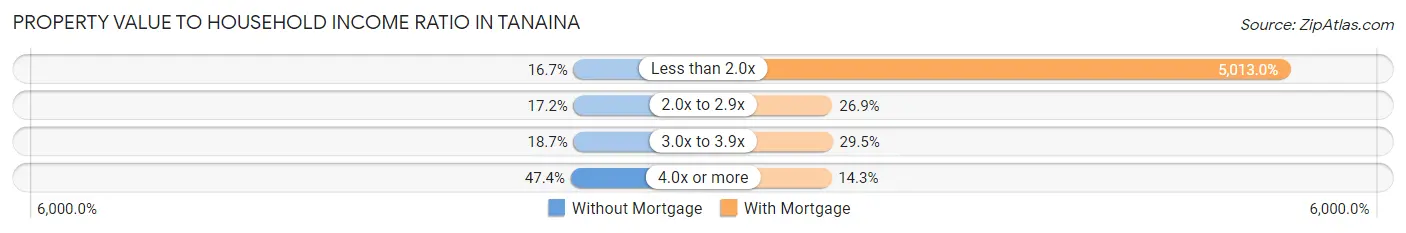
| Value-to-Income Ratio | Without Mortgage | With Mortgage |
| Less than 2.0x | 112 (16.7%) | 101,513 (5,013.0%) |
| 2.0x to 2.9x | 115 (17.2%) | 545 (26.9%) |
| 3.0x to 3.9x | 125 (18.7%) | 598 (29.5%) |
| 4.0x or more | 317 (47.4%) | 289 (14.3%) |
| Total | 669 (100.0%) | 2,025 (100.0%) |
Real Estate Taxes by Mortgage Status in Tanaina
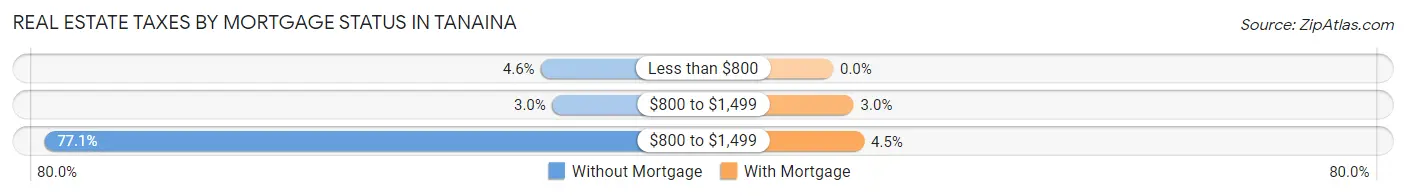
| Property Taxes | Without Mortgage | With Mortgage |
| Less than $800 | 31 (4.6%) | 0 (0.0%) |
| $800 to $1,499 | 20 (3.0%) | 61 (3.0%) |
| $800 to $1,499 | 516 (77.1%) | 92 (4.5%) |
| Total | 669 (100.0%) | 2,025 (100.0%) |
Health & Disability in Tanaina
Health Insurance Coverage by Age in Tanaina
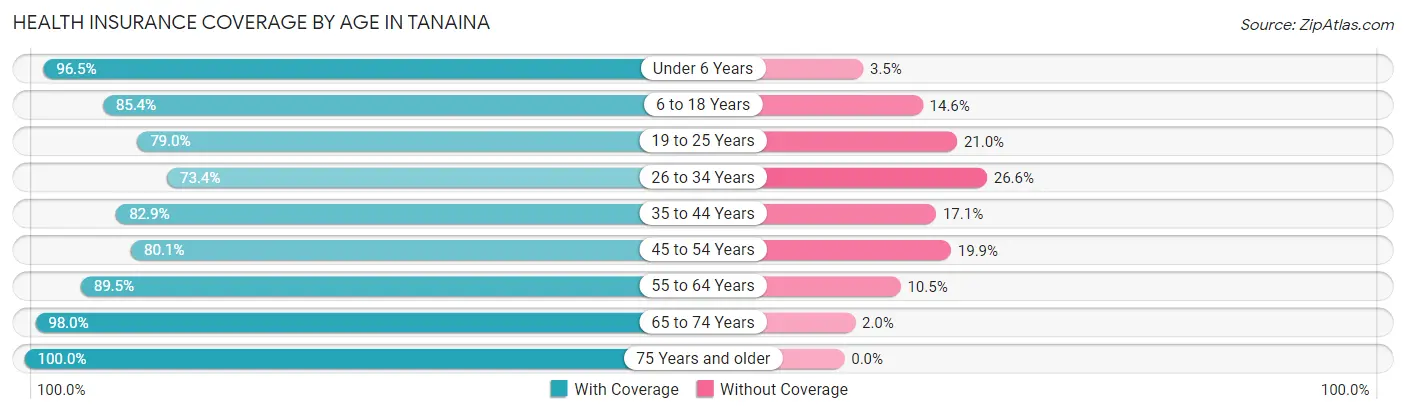
| Age Bracket | With Coverage | Without Coverage |
| Under 6 Years | 690 (96.5%) | 25 (3.5%) |
| 6 to 18 Years | 1,755 (85.4%) | 300 (14.6%) |
| 19 to 25 Years | 673 (79.0%) | 179 (21.0%) |
| 26 to 34 Years | 890 (73.4%) | 322 (26.6%) |
| 35 to 44 Years | 1,275 (82.9%) | 263 (17.1%) |
| 45 to 54 Years | 976 (80.1%) | 242 (19.9%) |
| 55 to 64 Years | 1,085 (89.5%) | 127 (10.5%) |
| 65 to 74 Years | 540 (98.0%) | 11 (2.0%) |
| 75 Years and older | 274 (100.0%) | 0 (0.0%) |
| Total | 8,158 (84.7%) | 1,469 (15.3%) |
Health Insurance Coverage by Citizenship Status in Tanaina
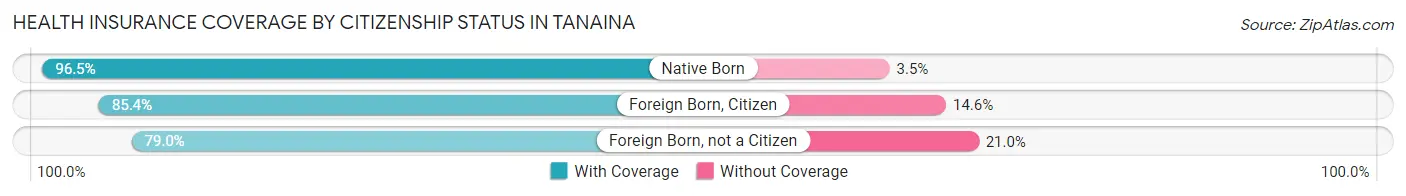
| Citizenship Status | With Coverage | Without Coverage |
| Native Born | 690 (96.5%) | 25 (3.5%) |
| Foreign Born, Citizen | 1,755 (85.4%) | 300 (14.6%) |
| Foreign Born, not a Citizen | 673 (79.0%) | 179 (21.0%) |
Health Insurance Coverage by Household Income in Tanaina
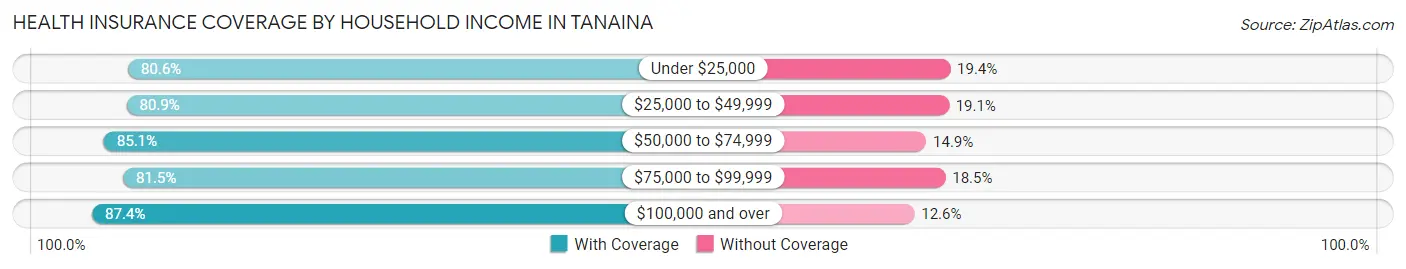
| Household Income | With Coverage | Without Coverage |
| Under $25,000 | 454 (80.6%) | 109 (19.4%) |
| $25,000 to $49,999 | 1,047 (80.9%) | 247 (19.1%) |
| $50,000 to $74,999 | 1,192 (85.1%) | 208 (14.9%) |
| $75,000 to $99,999 | 1,427 (81.5%) | 323 (18.5%) |
| $100,000 and over | 4,024 (87.4%) | 582 (12.6%) |
Public vs Private Health Insurance Coverage by Age in Tanaina
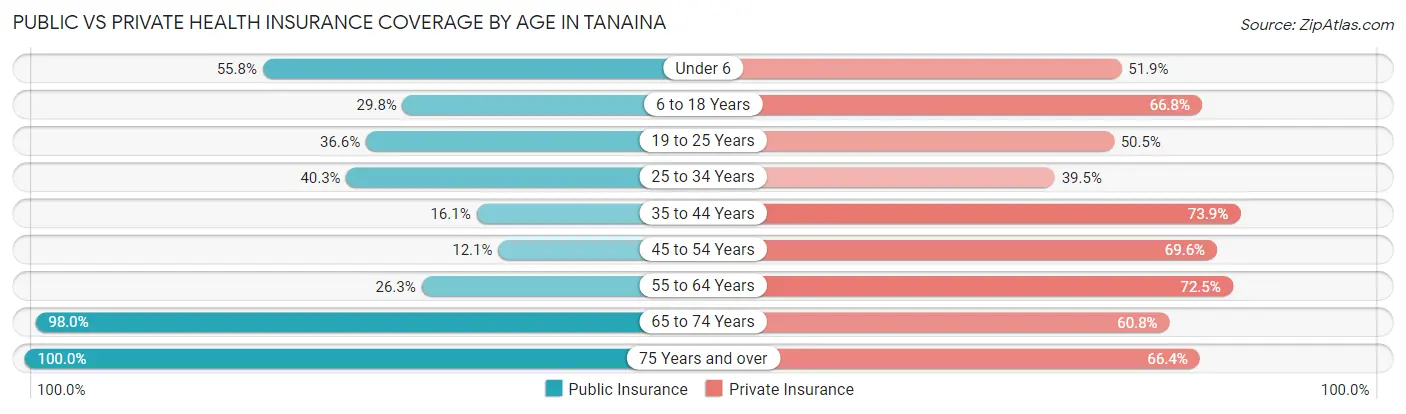
| Age Bracket | Public Insurance | Private Insurance |
| Under 6 | 399 (55.8%) | 371 (51.9%) |
| 6 to 18 Years | 613 (29.8%) | 1,373 (66.8%) |
| 19 to 25 Years | 312 (36.6%) | 430 (50.5%) |
| 25 to 34 Years | 488 (40.3%) | 479 (39.5%) |
| 35 to 44 Years | 248 (16.1%) | 1,137 (73.9%) |
| 45 to 54 Years | 147 (12.1%) | 848 (69.6%) |
| 55 to 64 Years | 319 (26.3%) | 879 (72.5%) |
| 65 to 74 Years | 540 (98.0%) | 335 (60.8%) |
| 75 Years and over | 274 (100.0%) | 182 (66.4%) |
| Total | 3,340 (34.7%) | 6,034 (62.7%) |
Disability Status by Sex by Age in Tanaina
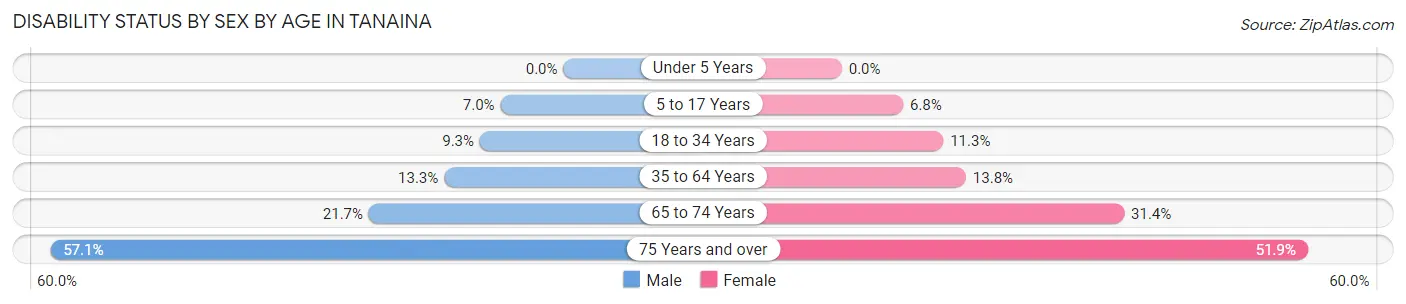
| Age Bracket | Male | Female |
| Under 5 Years | 0 (0.0%) | 0 (0.0%) |
| 5 to 17 Years | 66 (7.0%) | 71 (6.8%) |
| 18 to 34 Years | 118 (9.3%) | 114 (11.3%) |
| 35 to 64 Years | 280 (13.3%) | 257 (13.8%) |
| 65 to 74 Years | 47 (21.7%) | 105 (31.4%) |
| 75 Years and over | 96 (57.1%) | 55 (51.9%) |
Disability Class by Sex by Age in Tanaina
Disability Class: Hearing Difficulty
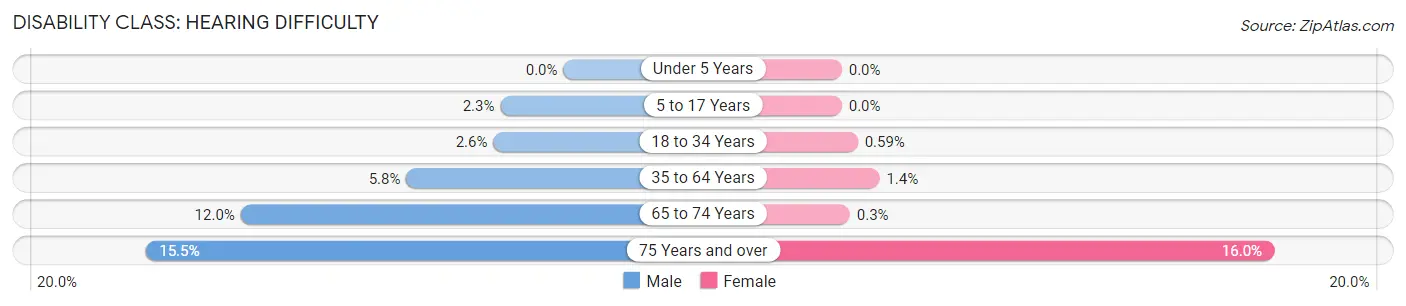
| Age Bracket | Male | Female |
| Under 5 Years | 0 (0.0%) | 0 (0.0%) |
| 5 to 17 Years | 22 (2.3%) | 0 (0.0%) |
| 18 to 34 Years | 33 (2.6%) | 6 (0.6%) |
| 35 to 64 Years | 123 (5.8%) | 26 (1.4%) |
| 65 to 74 Years | 26 (12.0%) | 1 (0.3%) |
| 75 Years and over | 26 (15.5%) | 17 (16.0%) |
Disability Class: Vision Difficulty
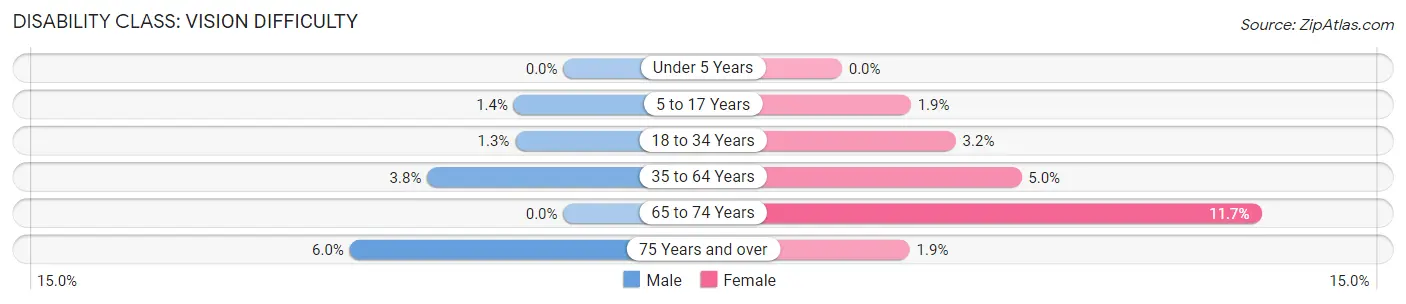
| Age Bracket | Male | Female |
| Under 5 Years | 0 (0.0%) | 0 (0.0%) |
| 5 to 17 Years | 13 (1.4%) | 20 (1.9%) |
| 18 to 34 Years | 17 (1.3%) | 32 (3.2%) |
| 35 to 64 Years | 80 (3.8%) | 93 (5.0%) |
| 65 to 74 Years | 0 (0.0%) | 39 (11.7%) |
| 75 Years and over | 10 (5.9%) | 2 (1.9%) |
Disability Class: Cognitive Difficulty
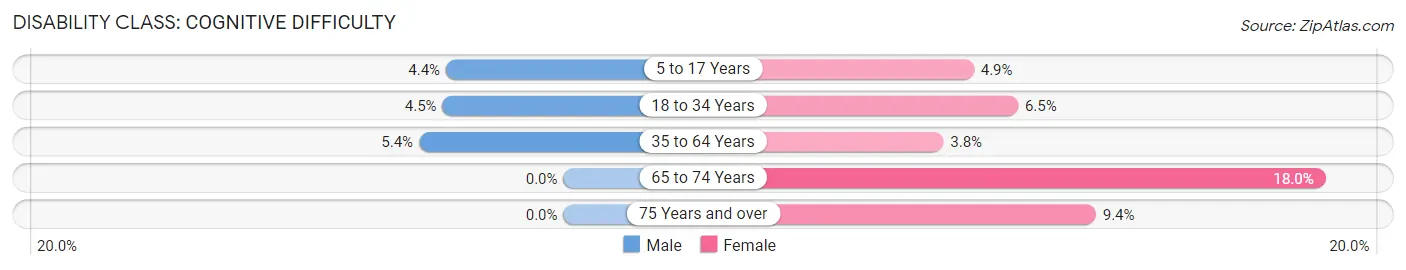
| Age Bracket | Male | Female |
| 5 to 17 Years | 41 (4.4%) | 51 (4.9%) |
| 18 to 34 Years | 57 (4.5%) | 66 (6.5%) |
| 35 to 64 Years | 113 (5.4%) | 70 (3.8%) |
| 65 to 74 Years | 0 (0.0%) | 60 (18.0%) |
| 75 Years and over | 0 (0.0%) | 10 (9.4%) |
Disability Class: Ambulatory Difficulty
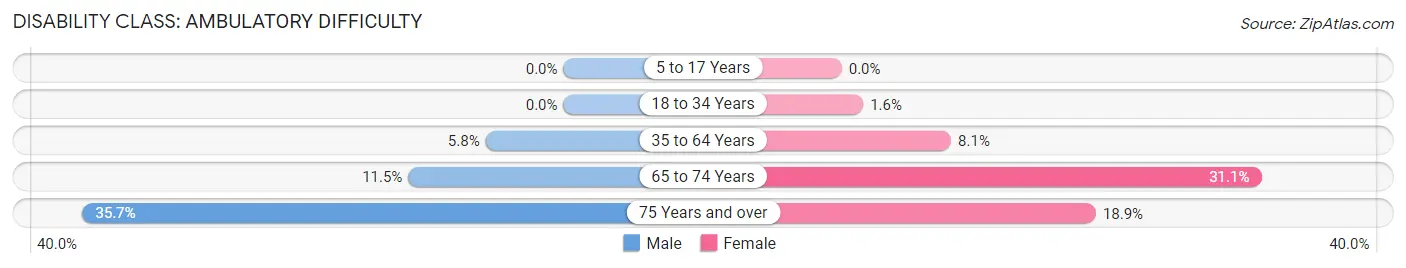
| Age Bracket | Male | Female |
| 5 to 17 Years | 0 (0.0%) | 0 (0.0%) |
| 18 to 34 Years | 0 (0.0%) | 16 (1.6%) |
| 35 to 64 Years | 122 (5.8%) | 151 (8.1%) |
| 65 to 74 Years | 25 (11.5%) | 104 (31.1%) |
| 75 Years and over | 60 (35.7%) | 20 (18.9%) |
Disability Class: Self-Care Difficulty
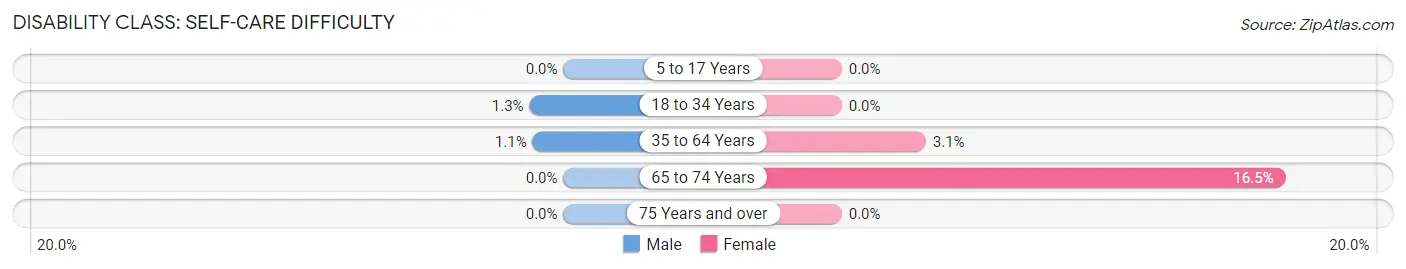
| Age Bracket | Male | Female |
| 5 to 17 Years | 0 (0.0%) | 0 (0.0%) |
| 18 to 34 Years | 16 (1.3%) | 0 (0.0%) |
| 35 to 64 Years | 24 (1.1%) | 58 (3.1%) |
| 65 to 74 Years | 0 (0.0%) | 55 (16.5%) |
| 75 Years and over | 0 (0.0%) | 0 (0.0%) |
Technology Access in Tanaina
Computing Device Access in Tanaina
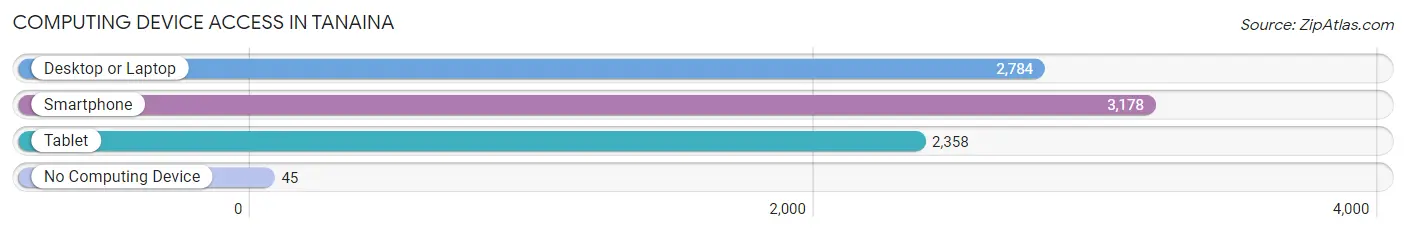
| Device Type | # Households | % Households |
| Desktop or Laptop | 2,784 | 83.4% |
| Smartphone | 3,178 | 95.2% |
| Tablet | 2,358 | 70.6% |
| No Computing Device | 45 | 1.3% |
| Total | 3,338 | 100.0% |
Internet Access in Tanaina
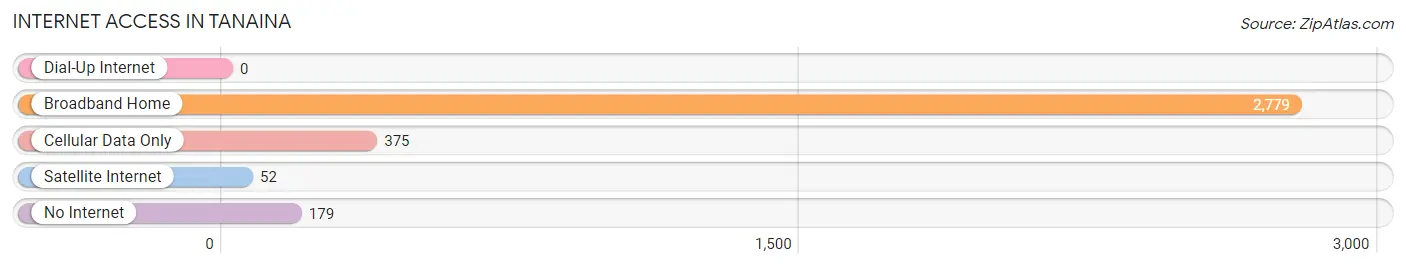
| Internet Type | # Households | % Households |
| Dial-Up Internet | 0 | 0.0% |
| Broadband Home | 2,779 | 83.3% |
| Cellular Data Only | 375 | 11.2% |
| Satellite Internet | 52 | 1.6% |
| No Internet | 179 | 5.4% |
| Total | 3,338 | 100.0% |
Tanaina Summary
History
The Tanaina people are an Alaska Native Athabaskan people who have lived in the Cook Inlet region of Alaska for thousands of years. The Tanaina people are divided into two distinct groups, the Upper Inlet Tanaina and the Lower Inlet Tanaina. The Upper Inlet Tanaina are the Dena'ina people, who live in the Susitna Valley and the Matanuska-Susitna Borough. The Lower Inlet Tanaina are the Kenaitze people, who live in the Kenai Peninsula Borough.
The Tanaina people have a long and rich history in the Cook Inlet region. They have been living in the area since at least the late 1700s, when Russian explorers first arrived in the area. The Tanaina people were heavily involved in the fur trade with the Russians, and they also traded with other Native groups in the area.
The Tanaina people were also heavily involved in the gold rush of the late 1800s. Many of the Tanaina people moved to the area to take advantage of the gold rush, and they were instrumental in the development of the towns and cities in the area.
The Tanaina people have also been heavily involved in the fishing industry in the Cook Inlet region. They have been fishing in the area for thousands of years, and they continue to be heavily involved in the commercial fishing industry today.
Geography
The Tanaina people live in the Cook Inlet region of Alaska, which is located in the south-central part of the state. The Cook Inlet region is bordered by the Chugach Mountains to the east, the Alaska Range to the west, and the Gulf of Alaska to the south. The region is home to numerous rivers, lakes, and glaciers, as well as the cities of Anchorage, Wasilla, and Kenai.
The Tanaina people live in both the Upper Inlet and Lower Inlet regions of the Cook Inlet. The Upper Inlet region is located in the Susitna Valley and the Matanuska-Susitna Borough, while the Lower Inlet region is located in the Kenai Peninsula Borough.
Economy
The Tanaina people have a long history of involvement in the fishing industry in the Cook Inlet region. They have been fishing in the area for thousands of years, and they continue to be heavily involved in the commercial fishing industry today. The Tanaina people are also involved in the tourism industry, as well as the oil and gas industry.
The Tanaina people are also heavily involved in the subsistence lifestyle. They hunt, fish, and gather food from the land and sea to provide for their families. This subsistence lifestyle is an important part of the Tanaina culture, and it is a way for them to maintain their connection to the land and their traditional way of life.
Demographics
According to the 2010 census, there were approximately 4,000 Tanaina people living in the Cook Inlet region. The majority of the Tanaina people live in the Upper Inlet region, with approximately 2,500 living in the Susitna Valley and the Matanuska-Susitna Borough. The remaining 1,500 Tanaina people live in the Lower Inlet region, in the Kenai Peninsula Borough.
The Tanaina people are a diverse group, with many different cultures and languages. The Upper Inlet Tanaina are the Dena'ina people, who speak the Dena'ina language. The Lower Inlet Tanaina are the Kenaitze people, who speak the Kenaitze language. Both languages are part of the Athabaskan language family.
The Tanaina people are also a diverse group in terms of religion. Many of the Tanaina people are Christian, while others practice traditional Native religions. The Tanaina people also have a strong connection to the land, and they continue to practice traditional subsistence activities such as hunting, fishing, and gathering.
Common Questions
What is Per Capita Income in Tanaina?
Per Capita income in Tanaina is $38,705.
What is the Median Family Income in Tanaina?
Median Family Income in Tanaina is $94,017.
What is the Median Household income in Tanaina?
Median Household Income in Tanaina is $86,418.
What is Income or Wage Gap in Tanaina?
Income or Wage Gap in Tanaina is 38.3%.
Women in Tanaina earn 61.7 cents for every dollar earned by a man.
What is Family Income Deficit in Tanaina?
Family Income Deficit in Tanaina is $13,273.
Families that are below poverty line in Tanaina earn $13,273 less on average than the poverty threshold level.
What is Inequality or Gini Index in Tanaina?
Inequality or Gini Index in Tanaina is 0.39.
What is the Total Population of Tanaina?
Total Population of Tanaina is 9,682.
What is the Total Male Population of Tanaina?
Total Male Population of Tanaina is 5,050.
What is the Total Female Population of Tanaina?
Total Female Population of Tanaina is 4,632.
What is the Ratio of Males per 100 Females in Tanaina?
There are 109.02 Males per 100 Females in Tanaina.
What is the Ratio of Females per 100 Males in Tanaina?
There are 91.72 Females per 100 Males in Tanaina.
What is the Median Population Age in Tanaina?
Median Population Age in Tanaina is 34.9 Years.
What is the Average Family Size in Tanaina
Average Family Size in Tanaina is 3.2 People.
What is the Average Household Size in Tanaina
Average Household Size in Tanaina is 2.9 People.
How Large is the Labor Force in Tanaina?
There are 4,944 People in the Labor Forcein in Tanaina.
What is the Percentage of People in the Labor Force in Tanaina?
67.4% of People are in the Labor Force in Tanaina.
What is the Unemployment Rate in Tanaina?
Unemployment Rate in Tanaina is 6.4%.