Micro, NC Map & Demographics
Micro Map
Micro Overview
$30,556
PER CAPITA INCOME
$75,139
AVG FAMILY INCOME
$45,000
AVG HOUSEHOLD INCOME
0.47
INEQUALITY / GINI INDEX
477
TOTAL POPULATION
212
MALE POPULATION
265
FEMALE POPULATION
80.00
MALES / 100 FEMALES
125.00
FEMALES / 100 MALES
38.7
MEDIAN AGE
3.0
AVG FAMILY SIZE
2.5
AVG HOUSEHOLD SIZE
193
LABOR FORCE [ PEOPLE ]
54.8%
PERCENT IN LABOR FORCE
6.2%
UNEMPLOYMENT RATE
Micro Zip Codes
Income in Micro
Income Overview in Micro
Per Capita Income in Micro is $30,556, while median incomes of families and households are $75,139 and $45,000 respectively.
| Characteristic | Number | Measure |
| Per Capita Income | 477 | $30,556 |
| Median Family Income | 131 | $75,139 |
| Mean Family Income | 131 | $93,203 |
| Median Household Income | 194 | $45,000 |
| Mean Household Income | 194 | $73,469 |
| Income Deficit | 131 | $0 |
| Wage / Income Gap (%) | 477 | 0.00% |
| Wage / Income Gap ($) | 477 | 100.00¢ per $1 |
| Gini / Inequality Index | 477 | 0.47 |
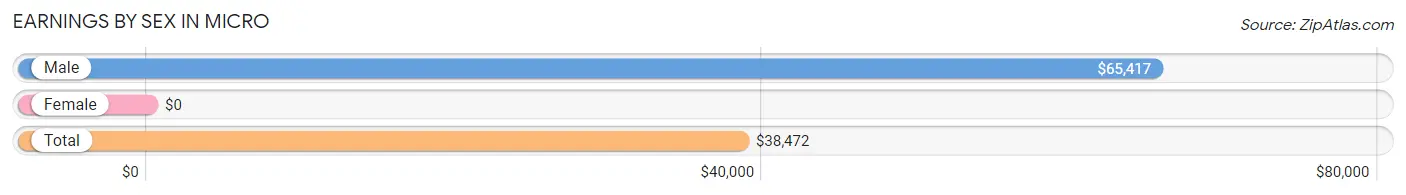
Earnings by Sex in Micro
| Sex | Number | Average Earnings |
| Male | 105 (51.7%) | $65,417 |
| Female | 98 (48.3%) | $0 |
| Total | 203 (100.0%) | $38,472 |
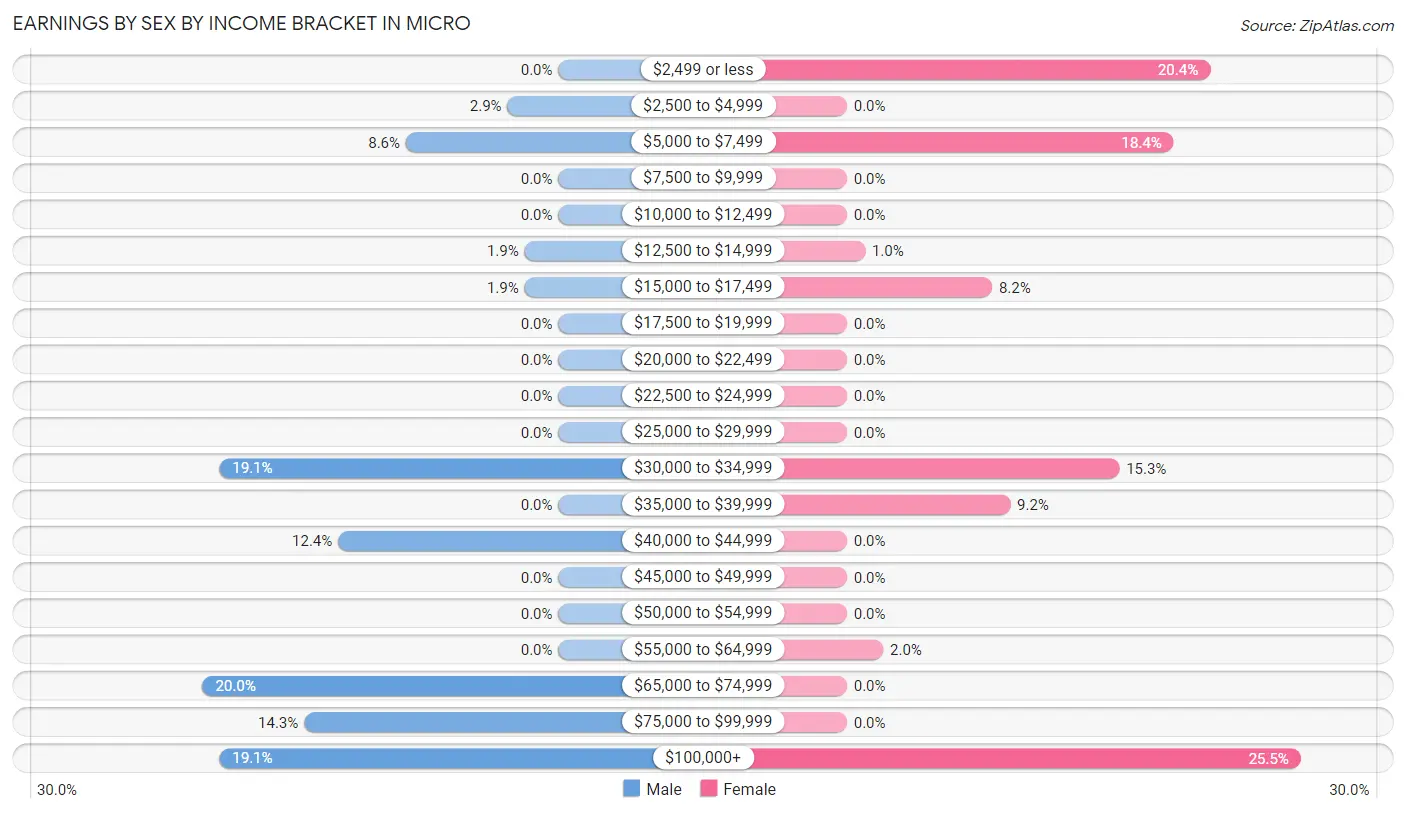
Earnings by Sex by Income Bracket in Micro
The most common earnings brackets in Micro are $65,000 to $74,999 for men (21 | 20.0%) and $100,000+ for women (25 | 25.5%).
| Income | Male | Female |
| $2,499 or less | 0 (0.0%) | 20 (20.4%) |
| $2,500 to $4,999 | 3 (2.9%) | 0 (0.0%) |
| $5,000 to $7,499 | 9 (8.6%) | 18 (18.4%) |
| $7,500 to $9,999 | 0 (0.0%) | 0 (0.0%) |
| $10,000 to $12,499 | 0 (0.0%) | 0 (0.0%) |
| $12,500 to $14,999 | 2 (1.9%) | 1 (1.0%) |
| $15,000 to $17,499 | 2 (1.9%) | 8 (8.2%) |
| $17,500 to $19,999 | 0 (0.0%) | 0 (0.0%) |
| $20,000 to $22,499 | 0 (0.0%) | 0 (0.0%) |
| $22,500 to $24,999 | 0 (0.0%) | 0 (0.0%) |
| $25,000 to $29,999 | 0 (0.0%) | 0 (0.0%) |
| $30,000 to $34,999 | 20 (19.1%) | 15 (15.3%) |
| $35,000 to $39,999 | 0 (0.0%) | 9 (9.2%) |
| $40,000 to $44,999 | 13 (12.4%) | 0 (0.0%) |
| $45,000 to $49,999 | 0 (0.0%) | 0 (0.0%) |
| $50,000 to $54,999 | 0 (0.0%) | 0 (0.0%) |
| $55,000 to $64,999 | 0 (0.0%) | 2 (2.0%) |
| $65,000 to $74,999 | 21 (20.0%) | 0 (0.0%) |
| $75,000 to $99,999 | 15 (14.3%) | 0 (0.0%) |
| $100,000+ | 20 (19.1%) | 25 (25.5%) |
| Total | 105 (100.0%) | 98 (100.0%) |
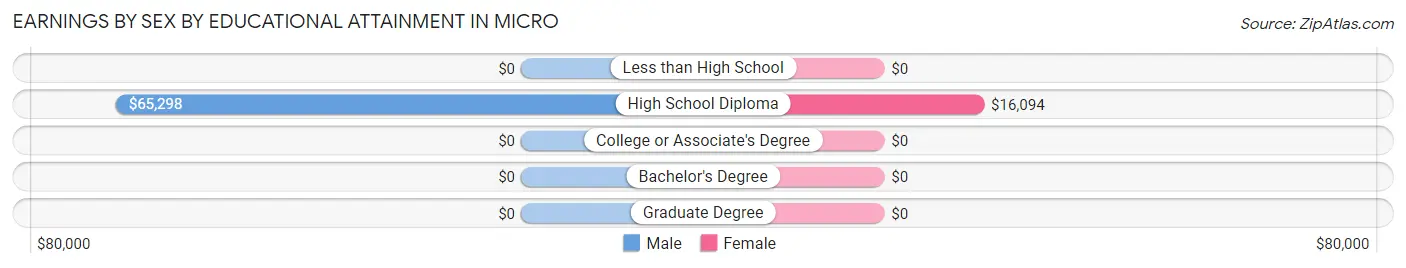
Earnings by Sex by Educational Attainment in Micro
| Educational Attainment | Male Income | Female Income |
| Less than High School | - | - |
| High School Diploma | $65,298 | $16,094 |
| College or Associate's Degree | - | - |
| Bachelor's Degree | - | - |
| Graduate Degree | - | - |
| Total | $65,417 | $0 |
Family Income in Micro
Family Income Brackets in Micro
According to the Micro family income data, there are 27 families falling into the $35,000 to $49,999 income range, which is the most common income bracket and makes up 20.6% of all families.
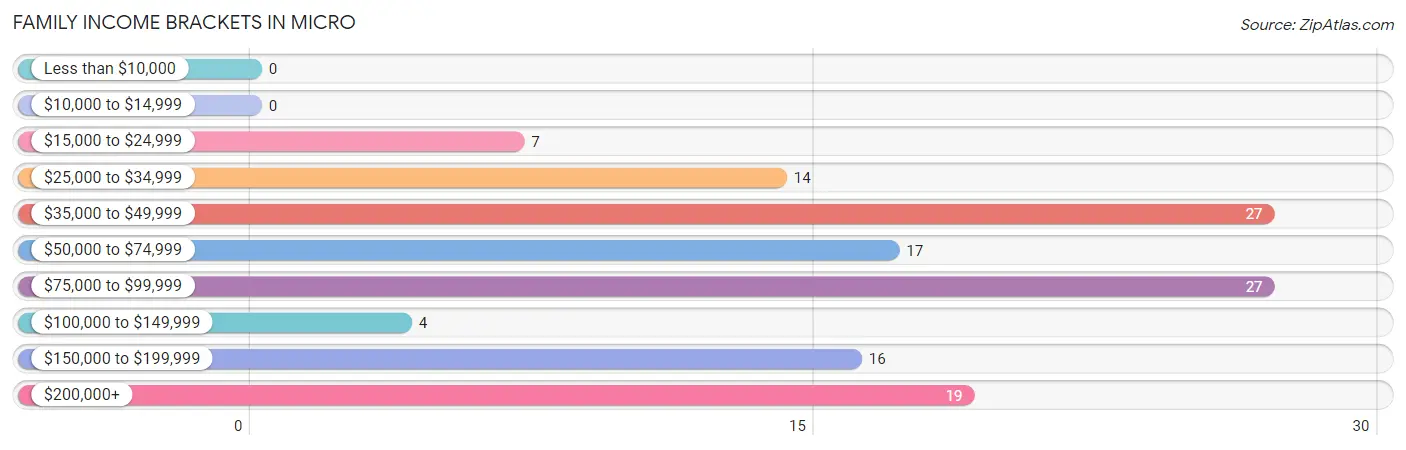
| Income Bracket | # Families | % Families |
| Less than $10,000 | 0 | 0.0% |
| $10,000 to $14,999 | 0 | 0.0% |
| $15,000 to $24,999 | 7 | 5.3% |
| $25,000 to $34,999 | 14 | 10.7% |
| $35,000 to $49,999 | 27 | 20.6% |
| $50,000 to $74,999 | 17 | 13.0% |
| $75,000 to $99,999 | 27 | 20.6% |
| $100,000 to $149,999 | 4 | 3.1% |
| $150,000 to $199,999 | 16 | 12.2% |
| $200,000+ | 19 | 14.5% |
Family Income by Famaliy Size in Micro
2-person families (50 | 38.2%) account for the highest median family income in Micro with $73,750 per family, while 2-person families (50 | 38.2%) have the highest median income of $36,875 per family member.
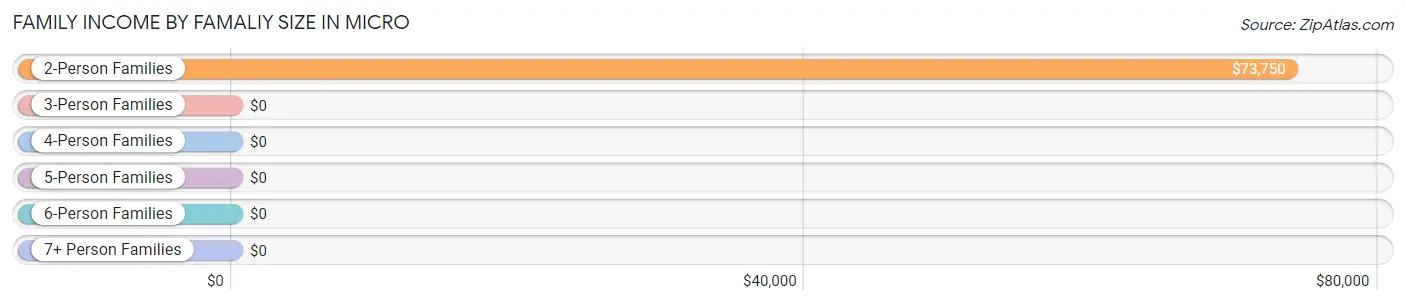
| Income Bracket | # Families | Median Income |
| 2-Person Families | 50 (38.2%) | $73,750 |
| 3-Person Families | 48 (36.6%) | $0 |
| 4-Person Families | 20 (15.3%) | $0 |
| 5-Person Families | 13 (9.9%) | $0 |
| 6-Person Families | 0 (0.0%) | $0 |
| 7+ Person Families | 0 (0.0%) | $0 |
| Total | 131 (100.0%) | $75,139 |
Family Income by Number of Earners in Micro
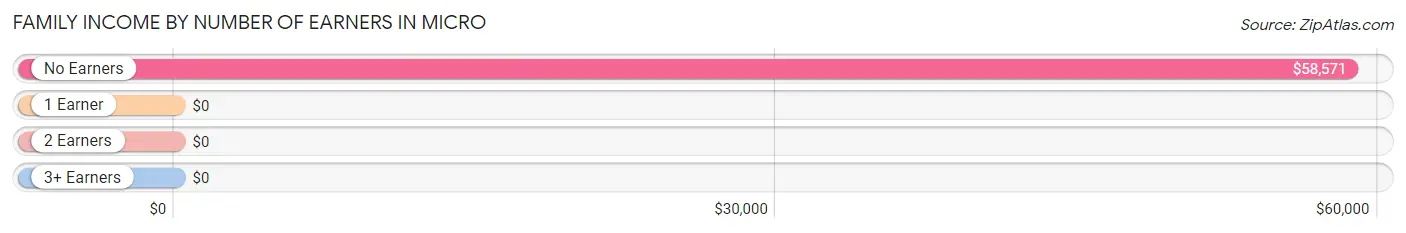
| Number of Earners | # Families | Median Income |
| No Earners | 16 (12.2%) | $58,571 |
| 1 Earner | 76 (58.0%) | $0 |
| 2 Earners | 20 (15.3%) | $0 |
| 3+ Earners | 19 (14.5%) | $0 |
| Total | 131 (100.0%) | $75,139 |
Household Income in Micro
Household Income Brackets in Micro
With 33 households falling in the category, the $35,000 to $49,999 income range is the most frequent in Micro, accounting for 17.0% of all households. In contrast, only 3 households (1.5%) fall into the less than $10,000 income bracket, making it the least populous group.
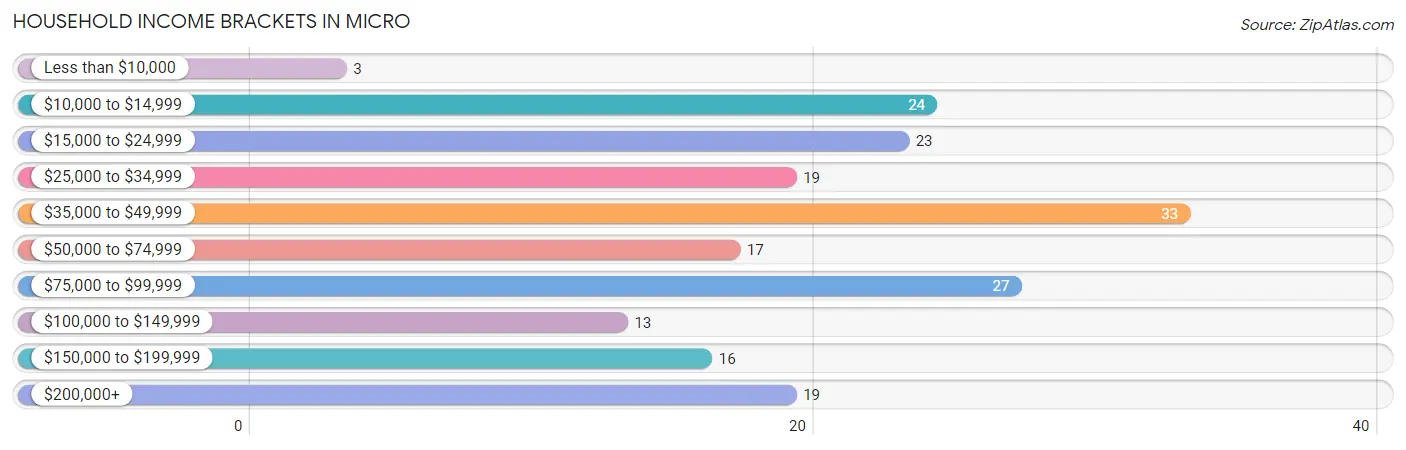
| Income Bracket | # Households | % Households |
| Less than $10,000 | 3 | 1.5% |
| $10,000 to $14,999 | 24 | 12.4% |
| $15,000 to $24,999 | 23 | 11.9% |
| $25,000 to $34,999 | 19 | 9.8% |
| $35,000 to $49,999 | 33 | 17.0% |
| $50,000 to $74,999 | 17 | 8.8% |
| $75,000 to $99,999 | 27 | 13.9% |
| $100,000 to $149,999 | 13 | 6.7% |
| $150,000 to $199,999 | 16 | 8.2% |
| $200,000+ | 19 | 9.8% |
Household Income by Householder Age in Micro
The median household income in Micro is $45,000, with the highest median household income of $77,083 found in the 45 to 64 years age bracket for the primary householder. A total of 59 households (30.4%) fall into this category. Meanwhile, the 15 to 24 years age bracket for the primary householder has the lowest median household income of $0, with 3 households (1.5%) in this group.
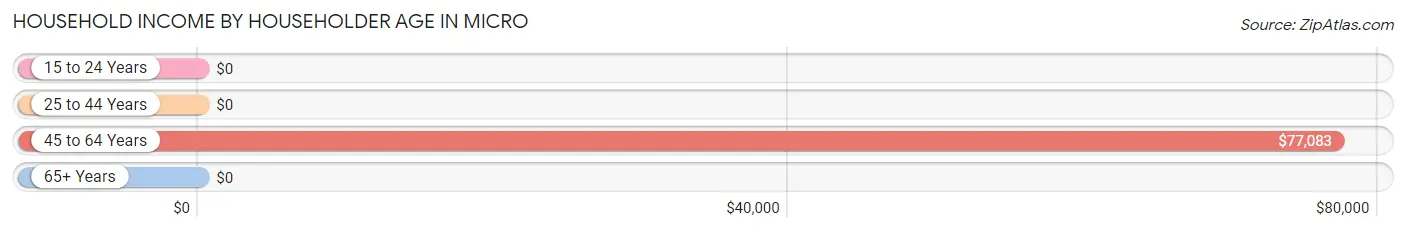
| Income Bracket | # Households | Median Income |
| 15 to 24 Years | 3 (1.5%) | $0 |
| 25 to 44 Years | 73 (37.6%) | $0 |
| 45 to 64 Years | 59 (30.4%) | $77,083 |
| 65+ Years | 59 (30.4%) | $0 |
| Total | 194 (100.0%) | $45,000 |
Poverty in Micro
Income Below Poverty by Sex and Age in Micro
With 25.0% poverty level for males and 15.6% for females among the residents of Micro, 6 to 11 year old males and 18 to 24 year old females are the most vulnerable to poverty, with 15 males (71.4%) and 15 females (53.6%) in their respective age groups living below the poverty level.
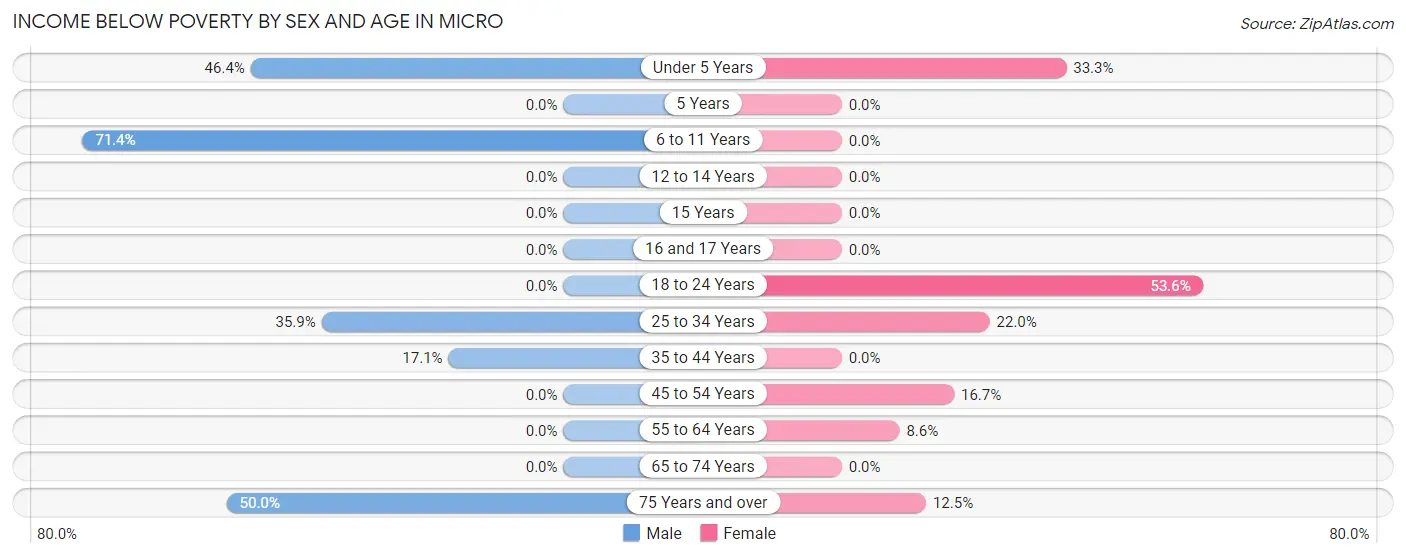
| Age Bracket | Male | Female |
| Under 5 Years | 13 (46.4%) | 7 (33.3%) |
| 5 Years | 0 (0.0%) | 0 (0.0%) |
| 6 to 11 Years | 15 (71.4%) | 0 (0.0%) |
| 12 to 14 Years | 0 (0.0%) | 0 (0.0%) |
| 15 Years | 0 (0.0%) | 0 (0.0%) |
| 16 and 17 Years | 0 (0.0%) | 0 (0.0%) |
| 18 to 24 Years | 0 (0.0%) | 15 (53.6%) |
| 25 to 34 Years | 14 (35.9%) | 9 (22.0%) |
| 35 to 44 Years | 7 (17.1%) | 0 (0.0%) |
| 45 to 54 Years | 0 (0.0%) | 2 (16.7%) |
| 55 to 64 Years | 0 (0.0%) | 3 (8.6%) |
| 65 to 74 Years | 0 (0.0%) | 0 (0.0%) |
| 75 Years and over | 4 (50.0%) | 4 (12.5%) |
| Total | 53 (25.0%) | 40 (15.6%) |
Income Above Poverty by Sex and Age in Micro
According to the poverty statistics in Micro, males aged 12 to 14 years and females aged 6 to 11 years are the age groups that are most secure financially, with 100.0% of males and 100.0% of females in these age groups living above the poverty line.
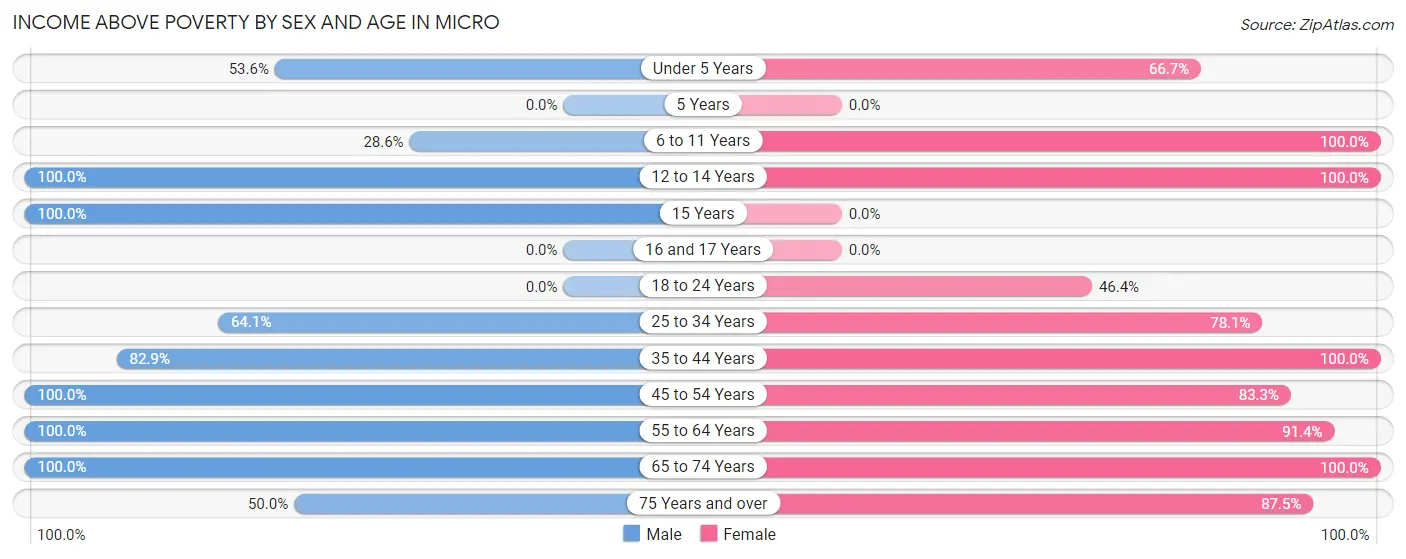
| Age Bracket | Male | Female |
| Under 5 Years | 15 (53.6%) | 14 (66.7%) |
| 5 Years | 0 (0.0%) | 0 (0.0%) |
| 6 to 11 Years | 6 (28.6%) | 24 (100.0%) |
| 12 to 14 Years | 8 (100.0%) | 8 (100.0%) |
| 15 Years | 7 (100.0%) | 0 (0.0%) |
| 16 and 17 Years | 0 (0.0%) | 0 (0.0%) |
| 18 to 24 Years | 0 (0.0%) | 13 (46.4%) |
| 25 to 34 Years | 25 (64.1%) | 32 (78.0%) |
| 35 to 44 Years | 34 (82.9%) | 32 (100.0%) |
| 45 to 54 Years | 11 (100.0%) | 10 (83.3%) |
| 55 to 64 Years | 33 (100.0%) | 32 (91.4%) |
| 65 to 74 Years | 16 (100.0%) | 24 (100.0%) |
| 75 Years and over | 4 (50.0%) | 28 (87.5%) |
| Total | 159 (75.0%) | 217 (84.4%) |
Income Below Poverty Among Married-Couple Families in Micro
The poverty statistics for married-couple families in Micro show that 10.7% or 11 of the total 103 families live below the poverty line. Families with 3 or 4 children have the highest poverty rate of 46.2%, comprising of 6 families. On the other hand, families with no children have the lowest poverty rate of 0.0%, which includes 0 families.
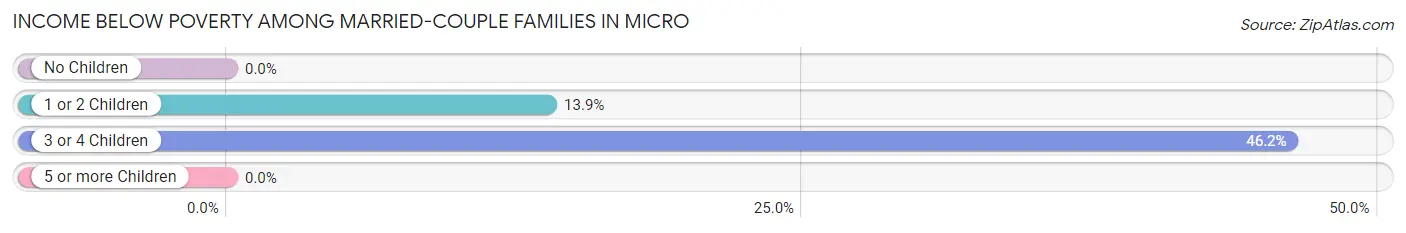
| Children | Above Poverty | Below Poverty |
| No Children | 54 (100.0%) | 0 (0.0%) |
| 1 or 2 Children | 31 (86.1%) | 5 (13.9%) |
| 3 or 4 Children | 7 (53.8%) | 6 (46.2%) |
| 5 or more Children | 0 (0.0%) | 0 (0.0%) |
| Total | 92 (89.3%) | 11 (10.7%) |
Income Below Poverty Among Single-Parent Households in Micro
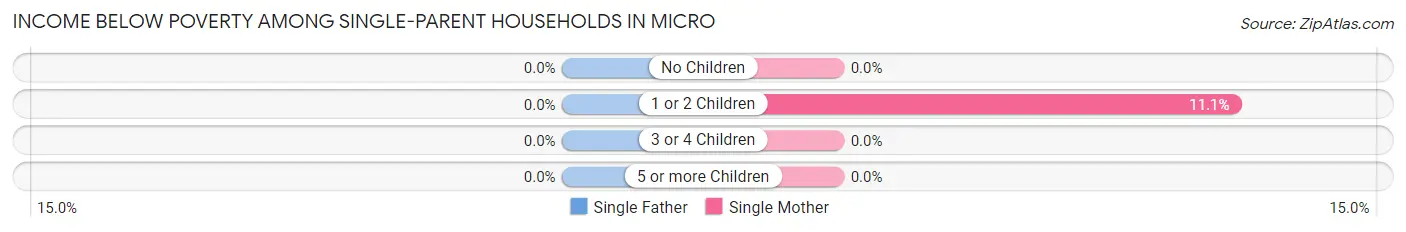
| Children | Single Father | Single Mother |
| No Children | 0 (0.0%) | 0 (0.0%) |
| 1 or 2 Children | 0 (0.0%) | 2 (11.1%) |
| 3 or 4 Children | 0 (0.0%) | 0 (0.0%) |
| 5 or more Children | 0 (0.0%) | 0 (0.0%) |
| Total | 0 (0.0%) | 2 (8.0%) |
Income Below Poverty Among Married-Couple vs Single-Parent Households in Micro
The poverty data for Micro shows that 11 of the married-couple family households (10.7%) and 2 of the single-parent households (7.1%) are living below the poverty level. Within the married-couple family households, those with 3 or 4 children have the highest poverty rate, with 6 households (46.2%) falling below the poverty line. Among the single-parent households, those with 1 or 2 children have the highest poverty rate, with 2 household (9.5%) living below poverty.
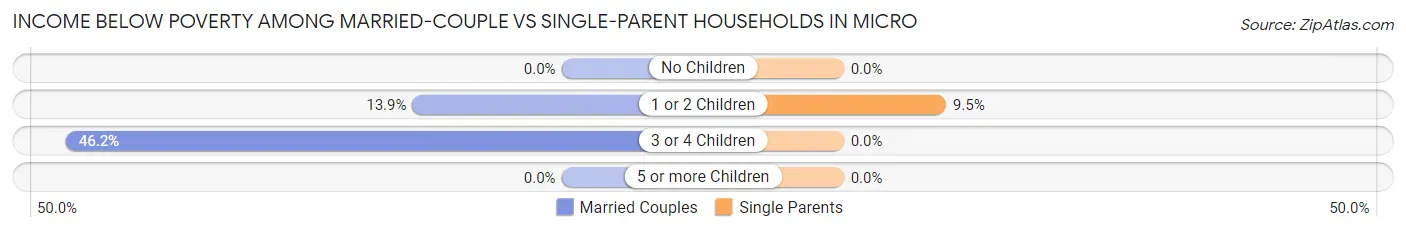
| Children | Married-Couple Families | Single-Parent Households |
| No Children | 0 (0.0%) | 0 (0.0%) |
| 1 or 2 Children | 5 (13.9%) | 2 (9.5%) |
| 3 or 4 Children | 6 (46.2%) | 0 (0.0%) |
| 5 or more Children | 0 (0.0%) | 0 (0.0%) |
| Total | 11 (10.7%) | 2 (7.1%) |
Race in Micro
The most populous races in Micro are White / Caucasian (342 | 71.7%), Hispanic or Latino (105 | 22.0%), and Some other Race (57 | 11.9%).
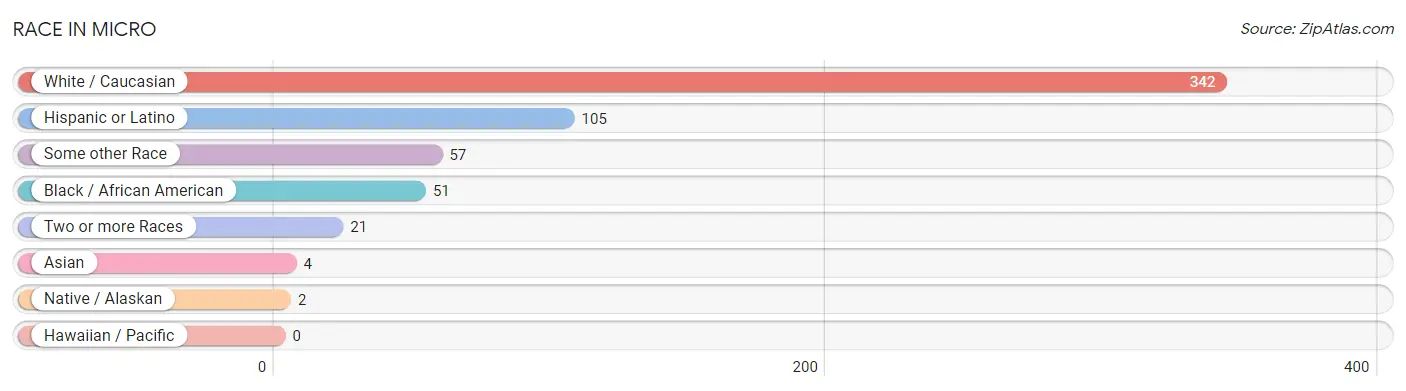
| Race | # Population | % Population |
| Asian | 4 | 0.8% |
| Black / African American | 51 | 10.7% |
| Hawaiian / Pacific | 0 | 0.0% |
| Hispanic or Latino | 105 | 22.0% |
| Native / Alaskan | 2 | 0.4% |
| White / Caucasian | 342 | 71.7% |
| Two or more Races | 21 | 4.4% |
| Some other Race | 57 | 11.9% |
| Total | 477 | 100.0% |
Ancestry in Micro
The most populous ancestries reported in Micro are Mexican (91 | 19.1%), American (71 | 14.9%), European (35 | 7.3%), English (23 | 4.8%), and French (18 | 3.8%), together accounting for 49.9% of all Micro residents.
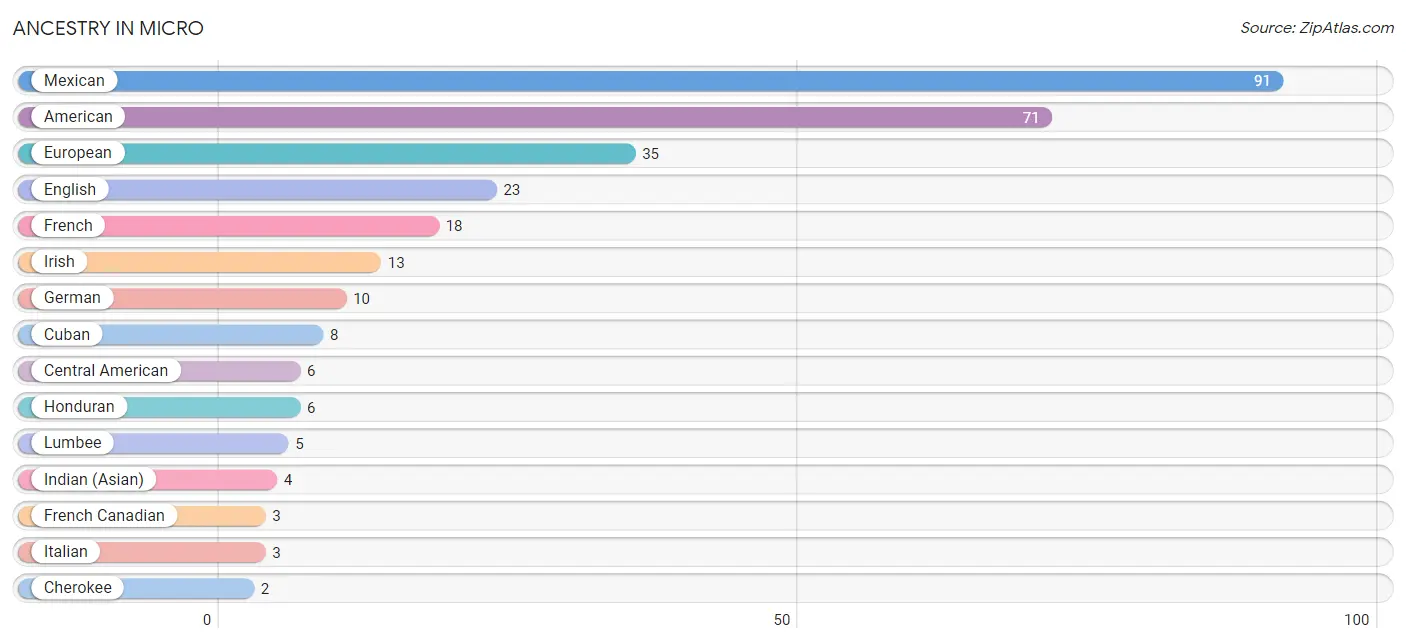
| Ancestry | # Population | % Population |
| American | 71 | 14.9% |
| Central American | 6 | 1.3% |
| Cherokee | 2 | 0.4% |
| Cuban | 8 | 1.7% |
| English | 23 | 4.8% |
| European | 35 | 7.3% |
| French | 18 | 3.8% |
| French Canadian | 3 | 0.6% |
| German | 10 | 2.1% |
| Honduran | 6 | 1.3% |
| Indian (Asian) | 4 | 0.8% |
| Irish | 13 | 2.7% |
| Italian | 3 | 0.6% |
| Lumbee | 5 | 1.1% |
| Mexican | 91 | 19.1% |
| Swedish | 2 | 0.4% | View All 16 Rows |
Immigrants in Micro
The most numerous immigrant groups reported in Micro came from Latin America (39 | 8.2%), Central America (31 | 6.5%), Mexico (25 | 5.2%), Caribbean (8 | 1.7%), and Cuba (8 | 1.7%), together accounting for 23.3% of all Micro residents.
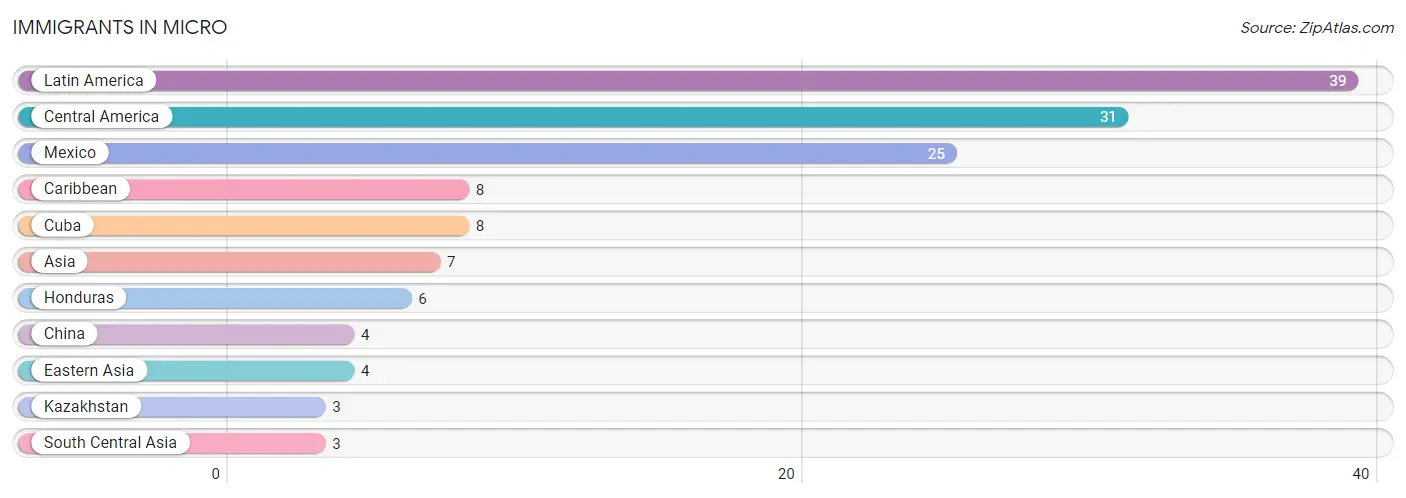
| Immigration Origin | # Population | % Population |
| Asia | 7 | 1.5% |
| Caribbean | 8 | 1.7% |
| Central America | 31 | 6.5% |
| China | 4 | 0.8% |
| Cuba | 8 | 1.7% |
| Eastern Asia | 4 | 0.8% |
| Honduras | 6 | 1.3% |
| Kazakhstan | 3 | 0.6% |
| Latin America | 39 | 8.2% |
| Mexico | 25 | 5.2% |
| South Central Asia | 3 | 0.6% | View All 11 Rows |
Sex and Age in Micro
Sex and Age in Micro
The most populous age groups in Micro are 40 to 44 Years (33 | 15.6%) for men and Under 5 Years (29 | 10.9%) for women.
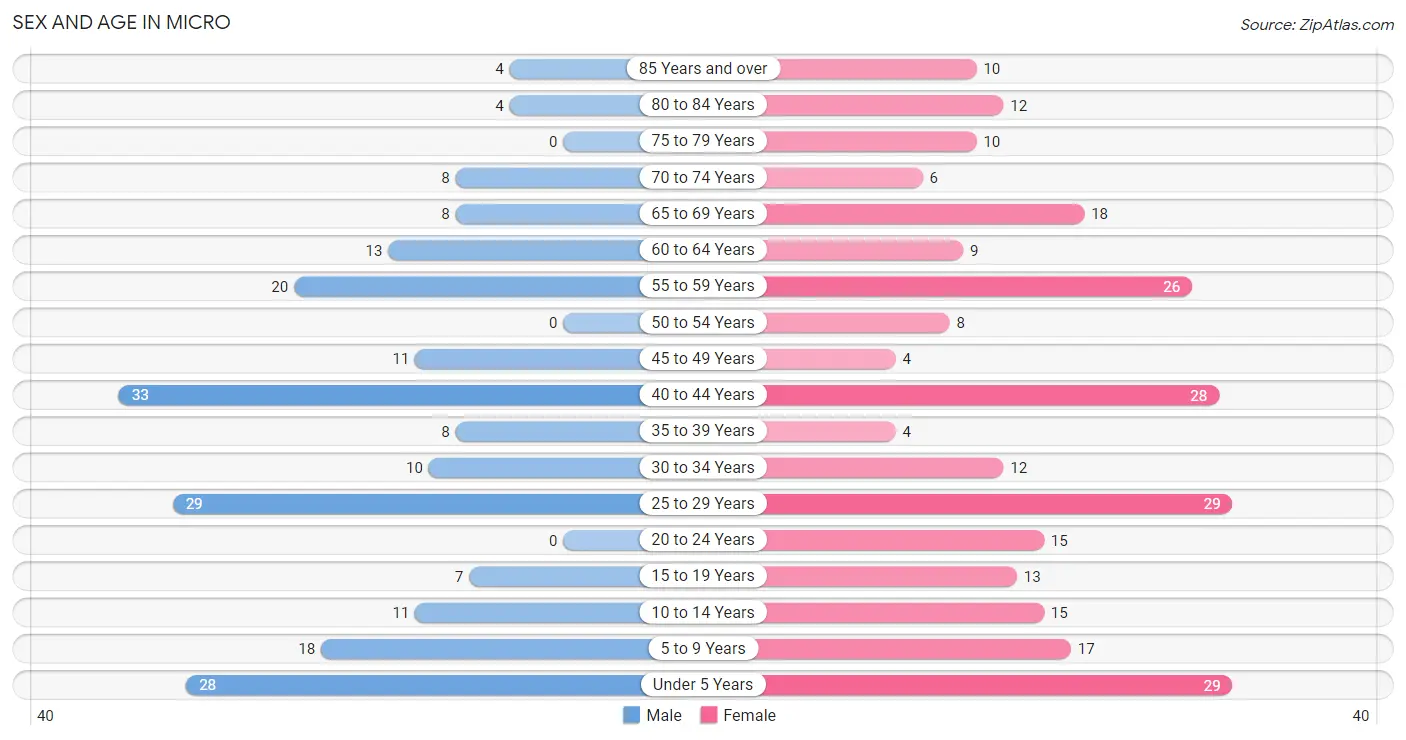
| Age Bracket | Male | Female |
| Under 5 Years | 28 (13.2%) | 29 (10.9%) |
| 5 to 9 Years | 18 (8.5%) | 17 (6.4%) |
| 10 to 14 Years | 11 (5.2%) | 15 (5.7%) |
| 15 to 19 Years | 7 (3.3%) | 13 (4.9%) |
| 20 to 24 Years | 0 (0.0%) | 15 (5.7%) |
| 25 to 29 Years | 29 (13.7%) | 29 (10.9%) |
| 30 to 34 Years | 10 (4.7%) | 12 (4.5%) |
| 35 to 39 Years | 8 (3.8%) | 4 (1.5%) |
| 40 to 44 Years | 33 (15.6%) | 28 (10.6%) |
| 45 to 49 Years | 11 (5.2%) | 4 (1.5%) |
| 50 to 54 Years | 0 (0.0%) | 8 (3.0%) |
| 55 to 59 Years | 20 (9.4%) | 26 (9.8%) |
| 60 to 64 Years | 13 (6.1%) | 9 (3.4%) |
| 65 to 69 Years | 8 (3.8%) | 18 (6.8%) |
| 70 to 74 Years | 8 (3.8%) | 6 (2.3%) |
| 75 to 79 Years | 0 (0.0%) | 10 (3.8%) |
| 80 to 84 Years | 4 (1.9%) | 12 (4.5%) |
| 85 Years and over | 4 (1.9%) | 10 (3.8%) |
| Total | 212 (100.0%) | 265 (100.0%) |
Families and Households in Micro
Median Family Size in Micro
The median family size in Micro is 3.01 persons per family, with single male/father families (3 | 2.3%) accounting for the largest median family size of 3.67 persons per family. On the other hand, single female/mother families (25 | 19.1%) represent the smallest median family size with 2.52 persons per family.
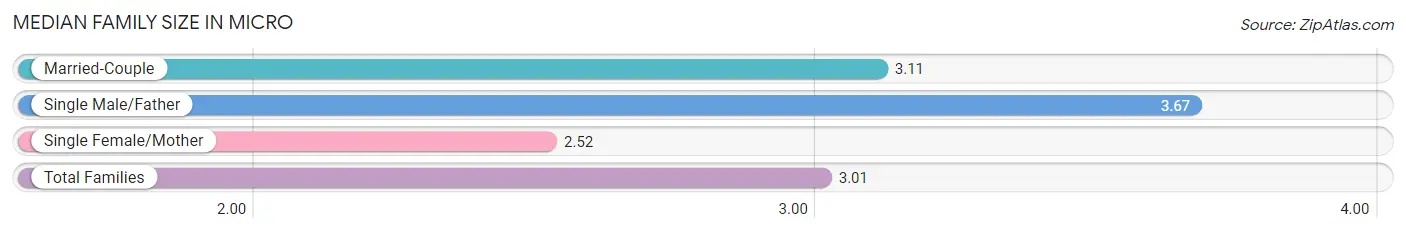
| Family Type | # Families | Family Size |
| Married-Couple | 103 (78.6%) | 3.11 |
| Single Male/Father | 3 (2.3%) | 3.67 |
| Single Female/Mother | 25 (19.1%) | 2.52 |
| Total Families | 131 (100.0%) | 3.01 |
Median Household Size in Micro
The median household size in Micro is 2.46 persons per household, with single male/father households (3 | 1.5%) accounting for the largest median household size of 3.67 persons per household. non-family households (63 | 32.5%) represent the smallest median household size with 1.19 persons per household.
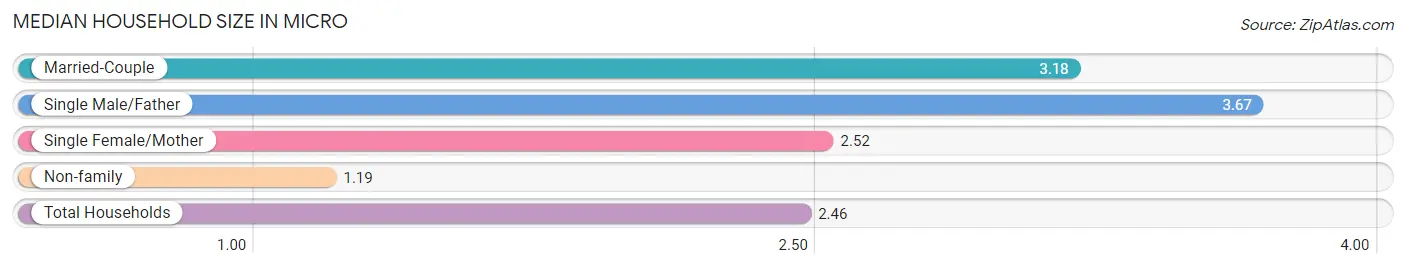
| Household Type | # Households | Household Size |
| Married-Couple | 103 (53.1%) | 3.18 |
| Single Male/Father | 3 (1.5%) | 3.67 |
| Single Female/Mother | 25 (12.9%) | 2.52 |
| Non-family | 63 (32.5%) | 1.19 |
| Total Households | 194 (100.0%) | 2.46 |
Household Size by Marriage Status in Micro
Out of a total of 194 households in Micro, 131 (67.5%) are family households, while 63 (32.5%) are nonfamily households. The most numerous type of family households are 2-person households, comprising 50, and the most common type of nonfamily households are 1-person households, comprising 51.
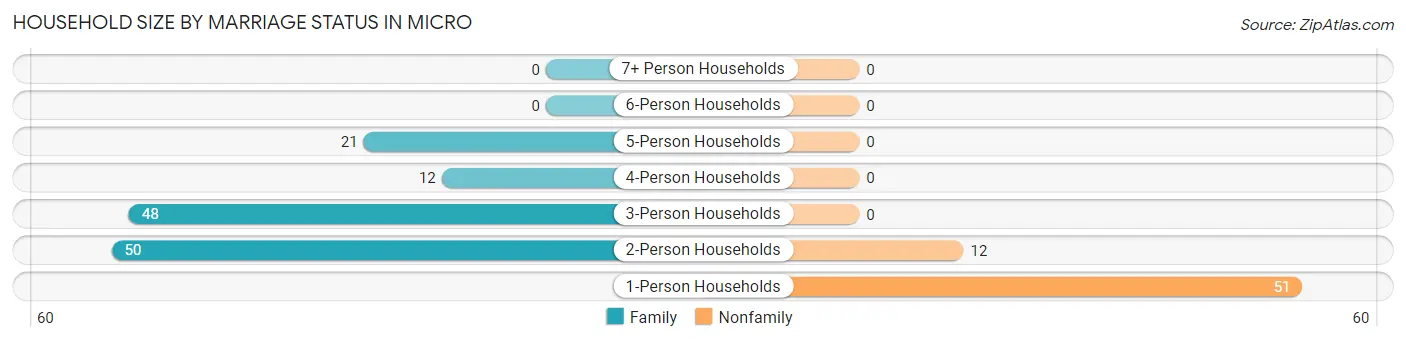
| Household Size | Family Households | Nonfamily Households |
| 1-Person Households | - | 51 (26.3%) |
| 2-Person Households | 50 (25.8%) | 12 (6.2%) |
| 3-Person Households | 48 (24.7%) | 0 (0.0%) |
| 4-Person Households | 12 (6.2%) | 0 (0.0%) |
| 5-Person Households | 21 (10.8%) | 0 (0.0%) |
| 6-Person Households | 0 (0.0%) | 0 (0.0%) |
| 7+ Person Households | 0 (0.0%) | 0 (0.0%) |
| Total | 131 (67.5%) | 63 (32.5%) |
Female Fertility in Micro
Fertility by Age in Micro
Average fertility rate in Micro is 143.0 births per 1,000 women. Women in the age bracket of 20 to 34 years have the highest fertility rate with 268.0 births per 1,000 women. Women in the age bracket of 20 to 34 years acount for 100.0% of all women with births.
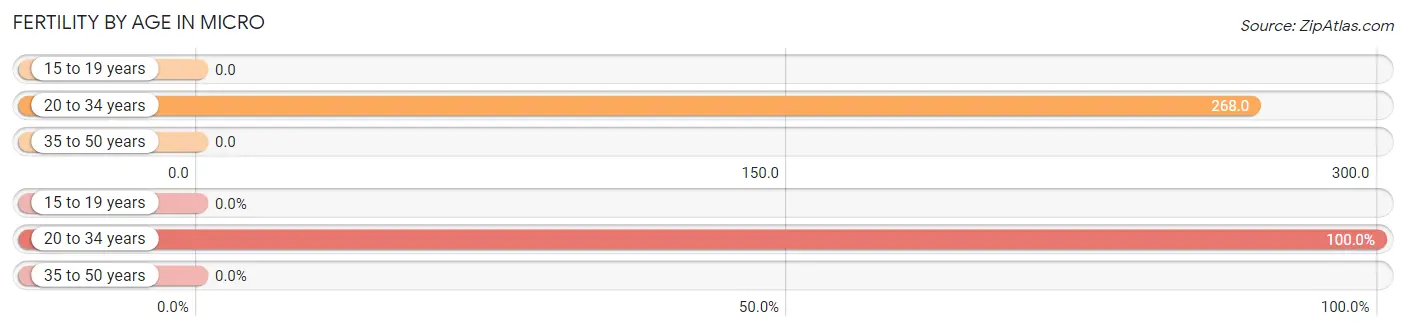
| Age Bracket | Women with Births | Births / 1,000 Women |
| 15 to 19 years | 0 (0.0%) | 0.0 |
| 20 to 34 years | 15 (100.0%) | 268.0 |
| 35 to 50 years | 0 (0.0%) | 0.0 |
| Total | 15 (100.0%) | 143.0 |
Fertility by Age by Marriage Status in Micro
46.7% of women with births (15) in Micro are married. The highest percentage of unmarried women with births falls into 20 to 34 years age bracket with 53.3% of them unmarried at the time of birth, while the lowest percentage of unmarried women with births belong to 20 to 34 years age bracket with 53.3% of them unmarried.
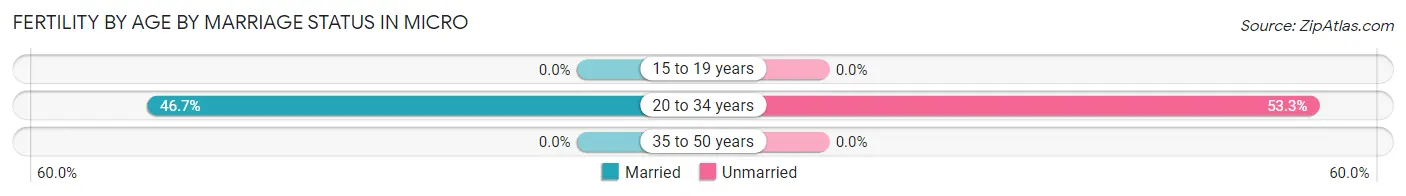
| Age Bracket | Married | Unmarried |
| 15 to 19 years | 0 (0.0%) | 0 (0.0%) |
| 20 to 34 years | 7 (46.7%) | 8 (53.3%) |
| 35 to 50 years | 0 (0.0%) | 0 (0.0%) |
| Total | 7 (46.7%) | 8 (53.3%) |
Fertility by Education in Micro
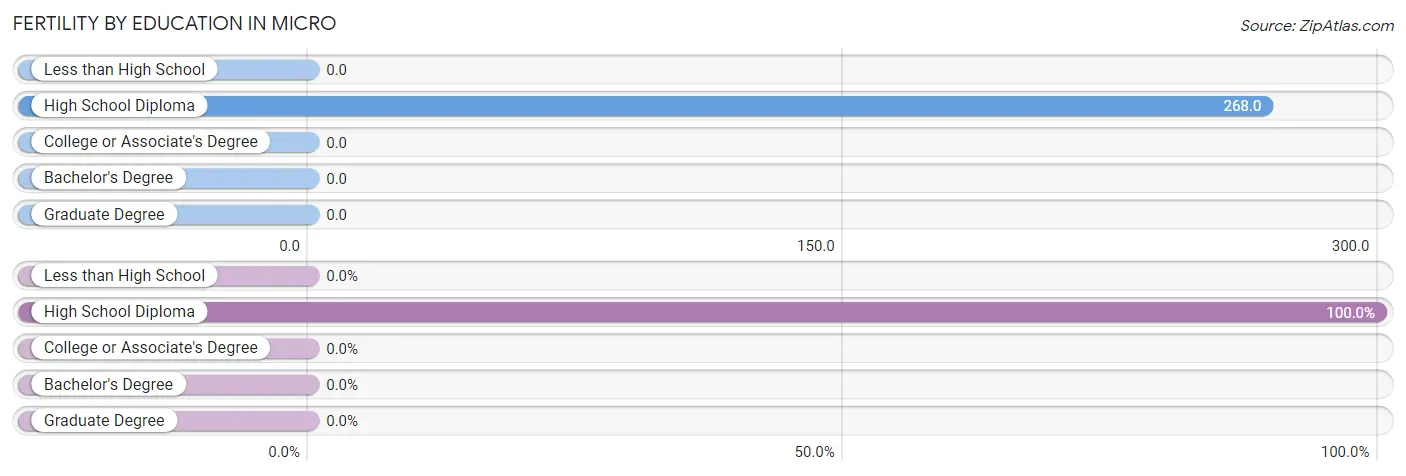
| Educational Attainment | Women with Births | Births / 1,000 Women |
| Less than High School | 0 (0.0%) | 0.0 |
| High School Diploma | 15 (100.0%) | 268.0 |
| College or Associate's Degree | 0 (0.0%) | 0.0 |
| Bachelor's Degree | 0 (0.0%) | 0.0 |
| Graduate Degree | 0 (0.0%) | 0.0 |
| Total | 15 (100.0%) | 143.0 |
Fertility by Education by Marriage Status in Micro
53.3% of women with births in Micro are unmarried. Women with the educational attainment of high school diploma are most likely to be married with 46.7% of them married at childbirth, while women with the educational attainment of high school diploma are least likely to be married with 53.3% of them unmarried at childbirth.
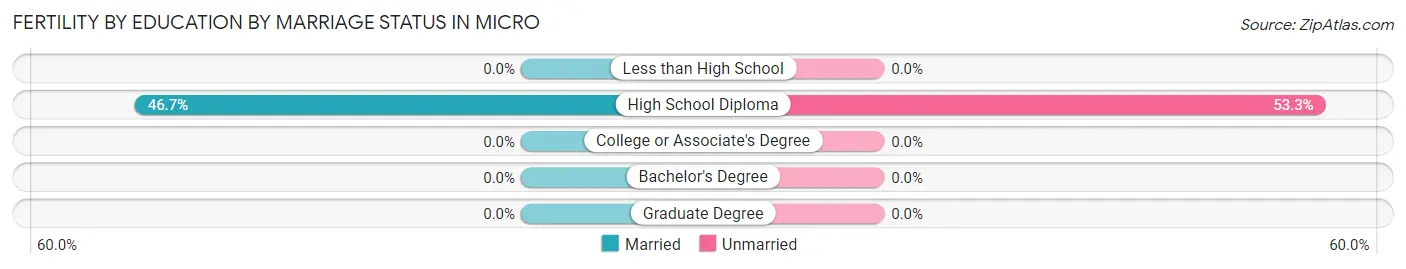
| Educational Attainment | Married | Unmarried |
| Less than High School | 0 (0.0%) | 0 (0.0%) |
| High School Diploma | 7 (46.7%) | 8 (53.3%) |
| College or Associate's Degree | 0 (0.0%) | 0 (0.0%) |
| Bachelor's Degree | 0 (0.0%) | 0 (0.0%) |
| Graduate Degree | 0 (0.0%) | 0 (0.0%) |
| Total | 7 (46.7%) | 8 (53.3%) |
Employment Characteristics in Micro
Employment by Class of Employer in Micro
Among the 175 employed individuals in Micro, private company employees (146 | 83.4%), state government employees (21 | 12.0%), and self-employed (not incorporated) (6 | 3.4%) make up the most common classes of employment.
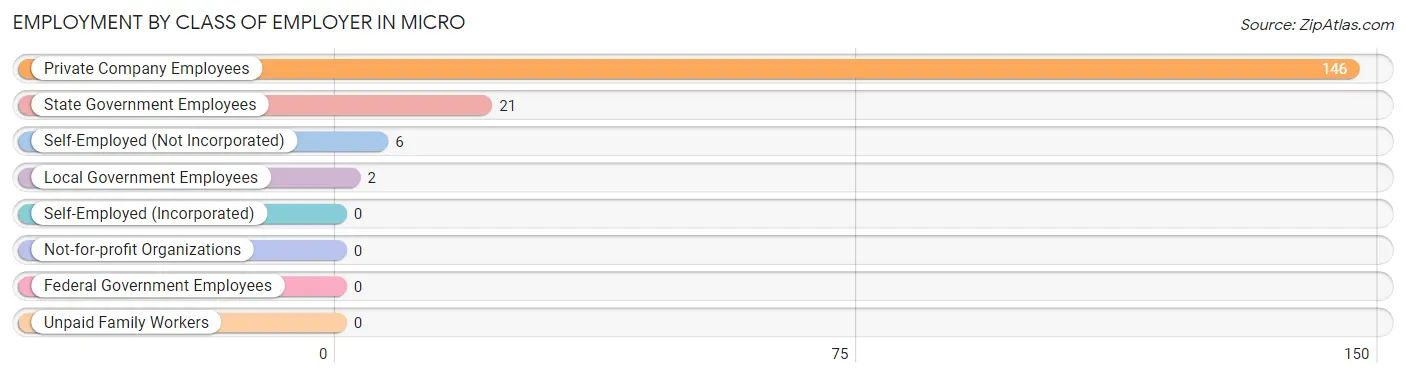
| Employer Class | # Employees | % Employees |
| Private Company Employees | 146 | 83.4% |
| Self-Employed (Incorporated) | 0 | 0.0% |
| Self-Employed (Not Incorporated) | 6 | 3.4% |
| Not-for-profit Organizations | 0 | 0.0% |
| Local Government Employees | 2 | 1.1% |
| State Government Employees | 21 | 12.0% |
| Federal Government Employees | 0 | 0.0% |
| Unpaid Family Workers | 0 | 0.0% |
| Total | 175 | 100.0% |
Employment Status by Age in Micro
According to the labor force statistics for Micro, out of the total population over 16 years of age (352), 54.8% or 193 individuals are in the labor force, with 6.2% or 12 of them unemployed. The age group with the highest labor force participation rate is 35 to 44 years, with 100.0% or 73 individuals in the labor force. Within the labor force, the 30 to 34 years age range has the highest percentage of unemployed individuals, with 52.6% or 10 of them being unemployed.
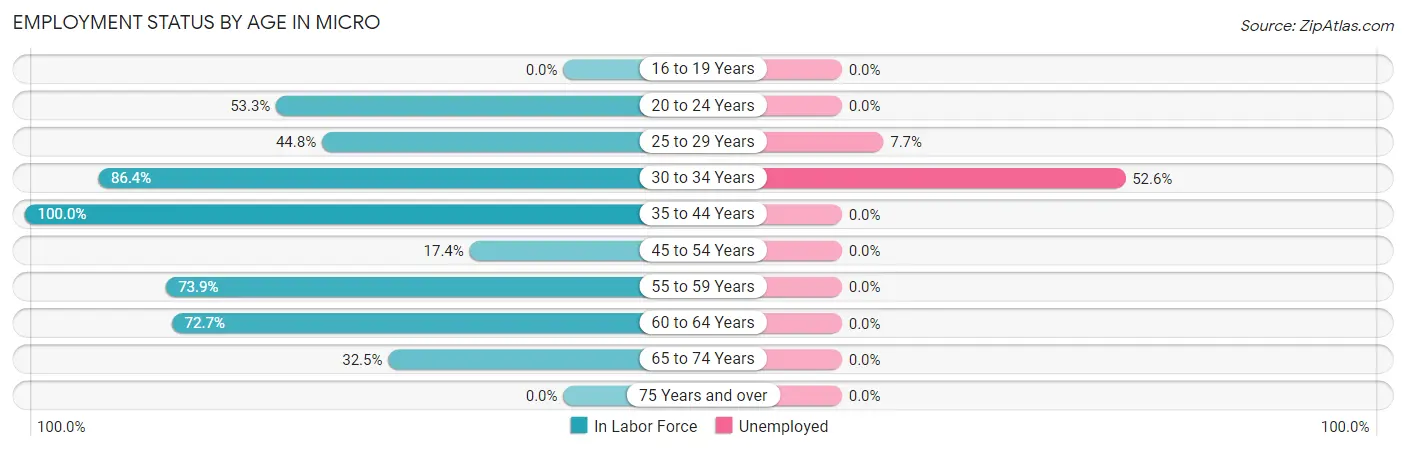
| Age Bracket | In Labor Force | Unemployed |
| 16 to 19 Years | 0 (0.0%) | 0 (0.0%) |
| 20 to 24 Years | 8 (53.3%) | 0 (0.0%) |
| 25 to 29 Years | 26 (44.8%) | 2 (7.7%) |
| 30 to 34 Years | 19 (86.4%) | 10 (52.6%) |
| 35 to 44 Years | 73 (100.0%) | 0 (0.0%) |
| 45 to 54 Years | 4 (17.4%) | 0 (0.0%) |
| 55 to 59 Years | 34 (73.9%) | 0 (0.0%) |
| 60 to 64 Years | 16 (72.7%) | 0 (0.0%) |
| 65 to 74 Years | 13 (32.5%) | 0 (0.0%) |
| 75 Years and over | 0 (0.0%) | 0 (0.0%) |
| Total | 193 (54.8%) | 12 (6.2%) |
Employment Status by Educational Attainment in Micro
According to labor force statistics for Micro, 70.5% of individuals (172) out of the total population between 25 and 64 years of age (244) are in the labor force, with 7.0% or 12 of them being unemployed. The group with the highest labor force participation rate are those with the educational attainment of bachelor's degree or higher, with 100.0% or 47 individuals in the labor force. Within the labor force, individuals with high school diploma education have the highest percentage of unemployment, with 16.7% or 12 of them being unemployed.
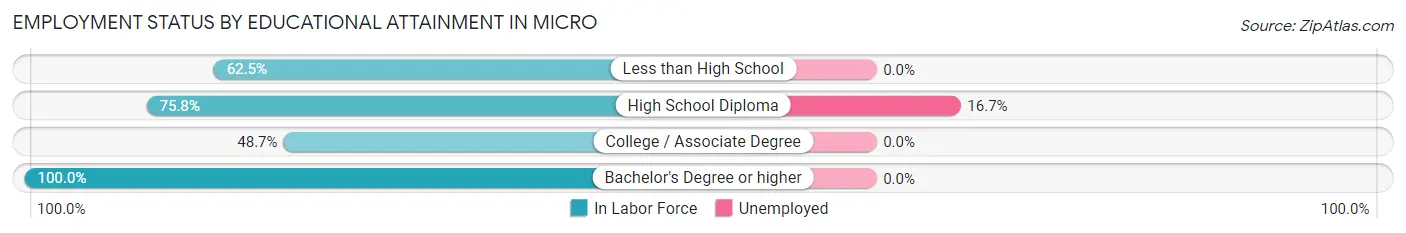
| Educational Attainment | In Labor Force | Unemployed |
| Less than High School | 15 (62.5%) | 0 (0.0%) |
| High School Diploma | 72 (75.8%) | 16 (16.7%) |
| College / Associate Degree | 38 (48.7%) | 0 (0.0%) |
| Bachelor's Degree or higher | 47 (100.0%) | 0 (0.0%) |
| Total | 172 (70.5%) | 17 (7.0%) |
Employment Occupations by Sex in Micro
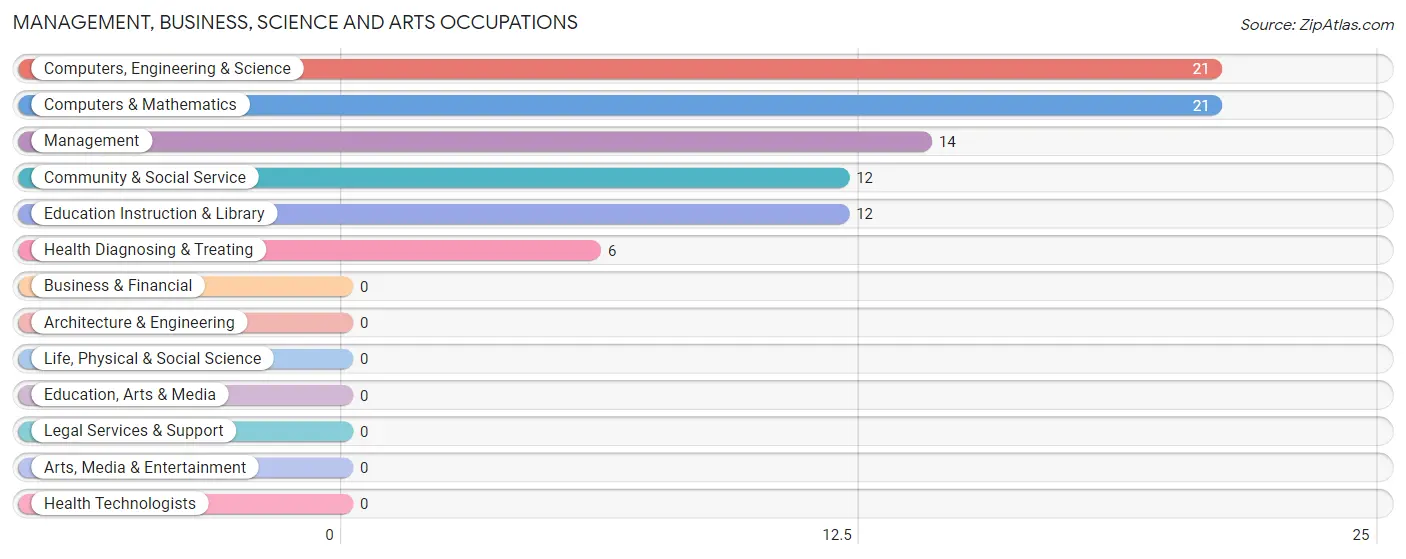
Management, Business, Science and Arts Occupations
The most common Management, Business, Science and Arts occupations in Micro are Computers, Engineering & Science (21 | 11.6%), Computers & Mathematics (21 | 11.6%), Management (14 | 7.7%), Community & Social Service (12 | 6.6%), and Education Instruction & Library (12 | 6.6%).
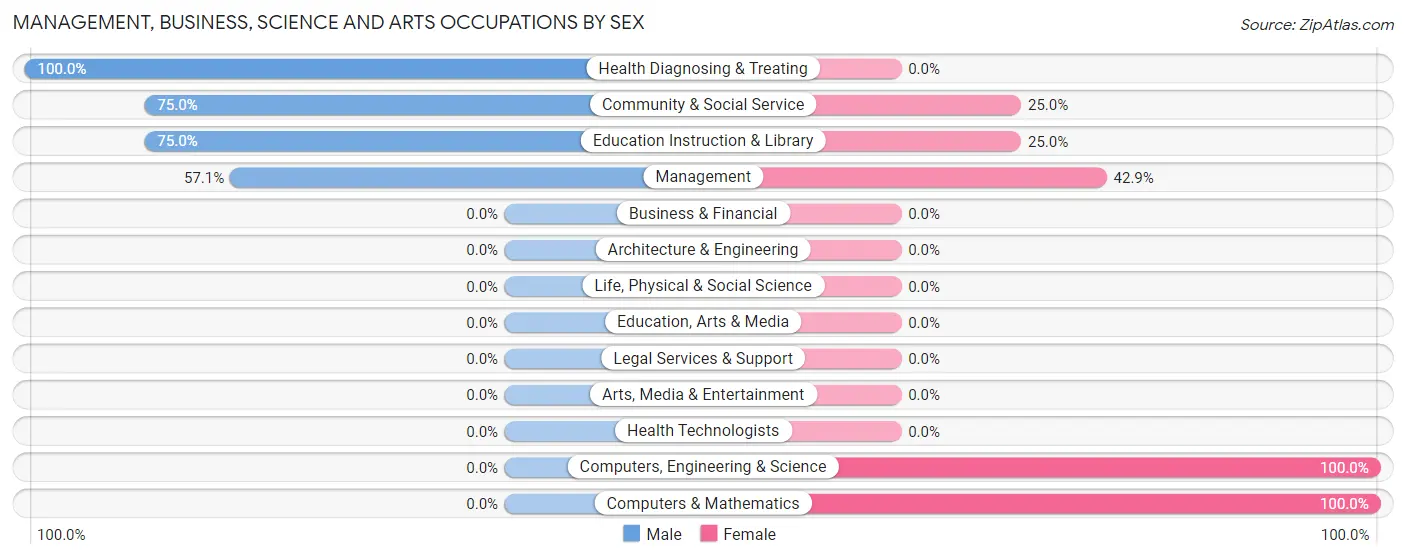
Management, Business, Science and Arts Occupations by Sex
Within the Management, Business, Science and Arts occupations in Micro, the most male-oriented occupations are Health Diagnosing & Treating (100.0%), Community & Social Service (75.0%), and Education Instruction & Library (75.0%), while the most female-oriented occupations are Computers, Engineering & Science (100.0%), Computers & Mathematics (100.0%), and Management (42.9%).
| Occupation | Male | Female |
| Management | 8 (57.1%) | 6 (42.9%) |
| Business & Financial | 0 (0.0%) | 0 (0.0%) |
| Computers, Engineering & Science | 0 (0.0%) | 21 (100.0%) |
| Computers & Mathematics | 0 (0.0%) | 21 (100.0%) |
| Architecture & Engineering | 0 (0.0%) | 0 (0.0%) |
| Life, Physical & Social Science | 0 (0.0%) | 0 (0.0%) |
| Community & Social Service | 9 (75.0%) | 3 (25.0%) |
| Education, Arts & Media | 0 (0.0%) | 0 (0.0%) |
| Legal Services & Support | 0 (0.0%) | 0 (0.0%) |
| Education Instruction & Library | 9 (75.0%) | 3 (25.0%) |
| Arts, Media & Entertainment | 0 (0.0%) | 0 (0.0%) |
| Health Diagnosing & Treating | 6 (100.0%) | 0 (0.0%) |
| Health Technologists | 0 (0.0%) | 0 (0.0%) |
| Total (Category) | 23 (43.4%) | 30 (56.6%) |
| Total (Overall) | 103 (56.9%) | 78 (43.1%) |
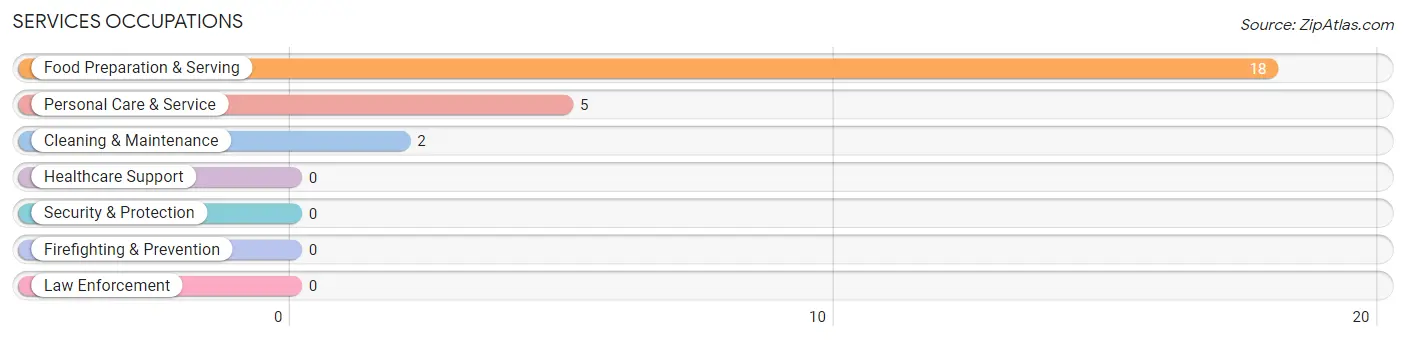
Services Occupations
The most common Services occupations in Micro are Food Preparation & Serving (18 | 9.9%), Personal Care & Service (5 | 2.8%), and Cleaning & Maintenance (2 | 1.1%).
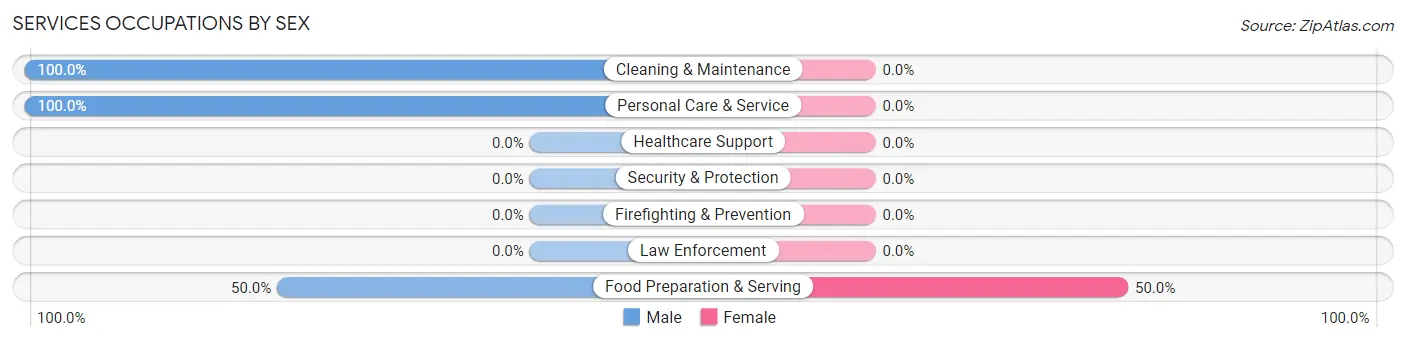
Services Occupations by Sex
| Occupation | Male | Female |
| Healthcare Support | 0 (0.0%) | 0 (0.0%) |
| Security & Protection | 0 (0.0%) | 0 (0.0%) |
| Firefighting & Prevention | 0 (0.0%) | 0 (0.0%) |
| Law Enforcement | 0 (0.0%) | 0 (0.0%) |
| Food Preparation & Serving | 9 (50.0%) | 9 (50.0%) |
| Cleaning & Maintenance | 2 (100.0%) | 0 (0.0%) |
| Personal Care & Service | 5 (100.0%) | 0 (0.0%) |
| Total (Category) | 16 (64.0%) | 9 (36.0%) |
| Total (Overall) | 103 (56.9%) | 78 (43.1%) |
Sales and Office Occupations
The most common Sales and Office occupations in Micro are Office & Administration (21 | 11.6%), and Sales & Related (11 | 6.1%).
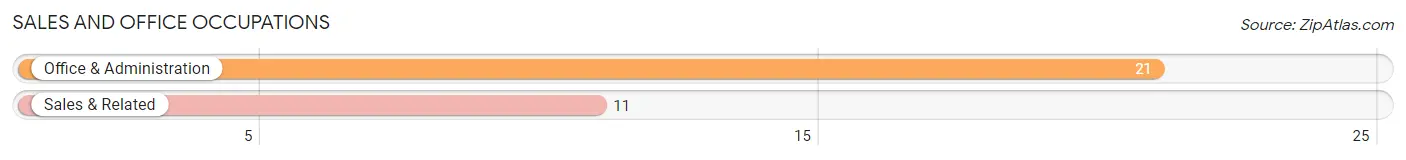
Sales and Office Occupations by Sex

| Occupation | Male | Female |
| Sales & Related | 3 (27.3%) | 8 (72.7%) |
| Office & Administration | 0 (0.0%) | 21 (100.0%) |
| Total (Category) | 3 (9.4%) | 29 (90.6%) |
| Total (Overall) | 103 (56.9%) | 78 (43.1%) |
Natural Resources, Construction and Maintenance Occupations
The most common Natural Resources, Construction and Maintenance occupations in Micro are , and Construction & Extraction (49 | 27.1%).
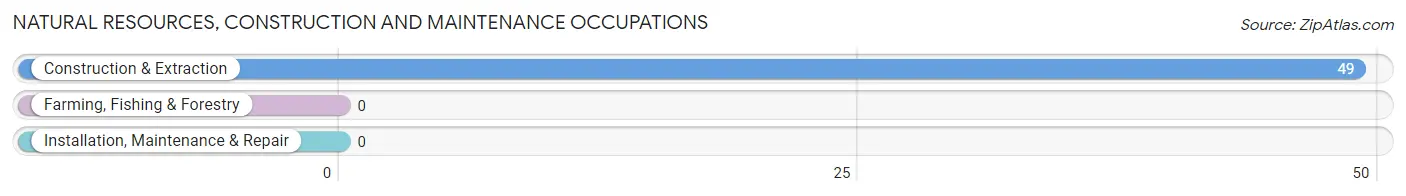
Natural Resources, Construction and Maintenance Occupations by Sex
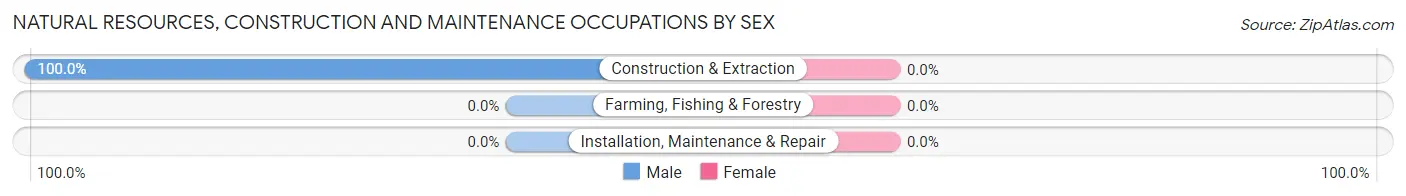
| Occupation | Male | Female |
| Farming, Fishing & Forestry | 0 (0.0%) | 0 (0.0%) |
| Construction & Extraction | 49 (100.0%) | 0 (0.0%) |
| Installation, Maintenance & Repair | 0 (0.0%) | 0 (0.0%) |
| Total (Category) | 49 (100.0%) | 0 (0.0%) |
| Total (Overall) | 103 (56.9%) | 78 (43.1%) |
Production, Transportation and Moving Occupations
The most common Production, Transportation and Moving occupations in Micro are Production (17 | 9.4%), and Transportation (5 | 2.8%).
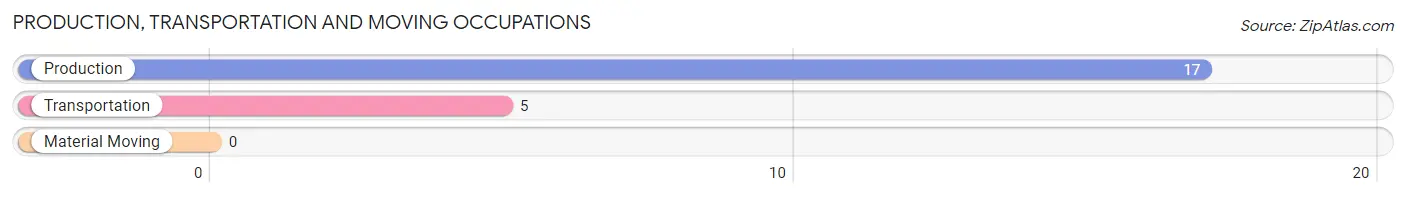
Production, Transportation and Moving Occupations by Sex
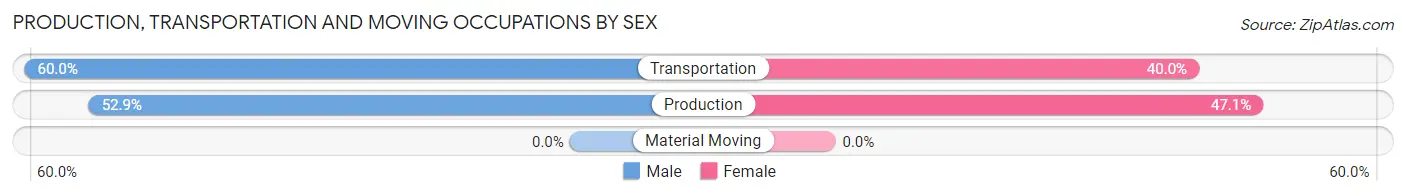
| Occupation | Male | Female |
| Production | 9 (52.9%) | 8 (47.1%) |
| Transportation | 3 (60.0%) | 2 (40.0%) |
| Material Moving | 0 (0.0%) | 0 (0.0%) |
| Total (Category) | 12 (54.5%) | 10 (45.5%) |
| Total (Overall) | 103 (56.9%) | 78 (43.1%) |
Employment Industries by Sex in Micro
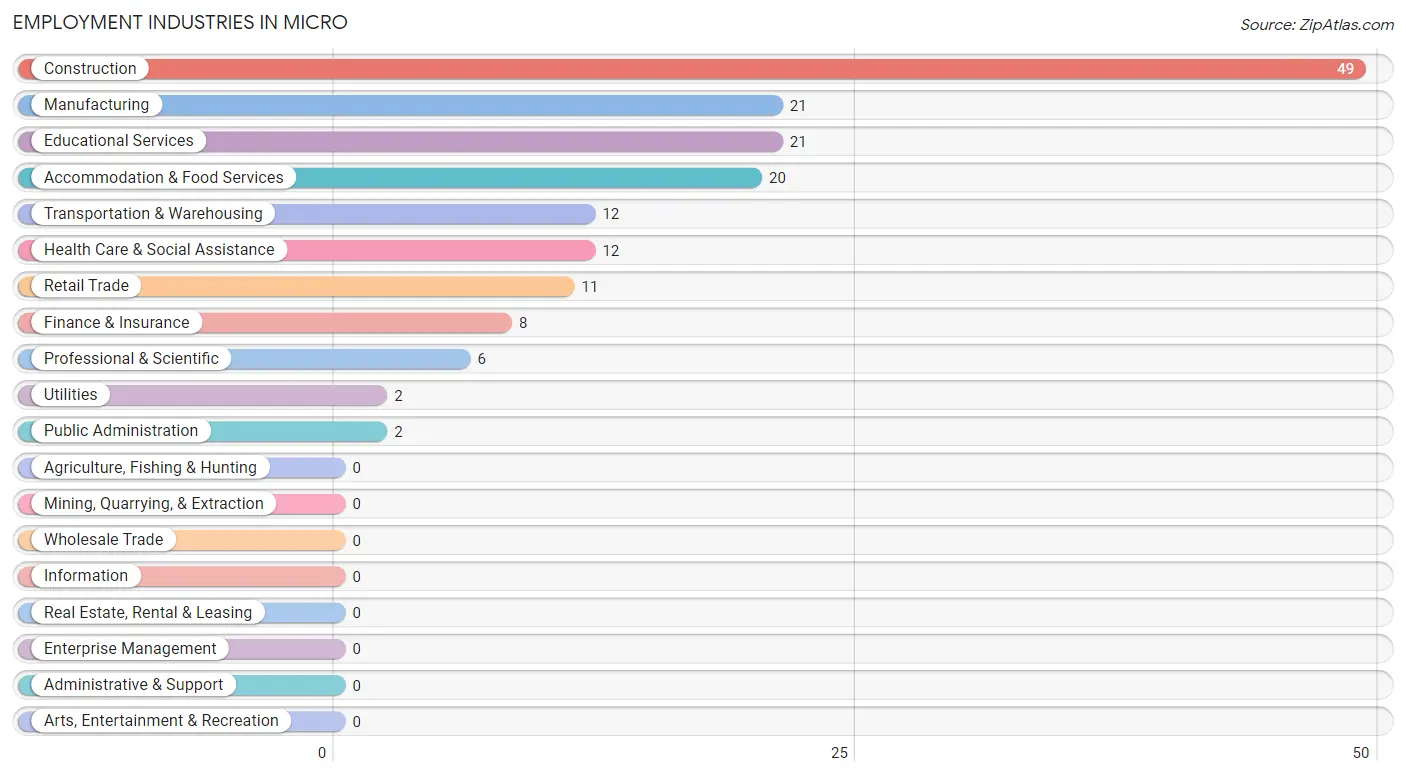
Employment Industries in Micro
The major employment industries in Micro include Construction (49 | 27.1%), Manufacturing (21 | 11.6%), Educational Services (21 | 11.6%), Accommodation & Food Services (20 | 11.1%), and Transportation & Warehousing (12 | 6.6%).
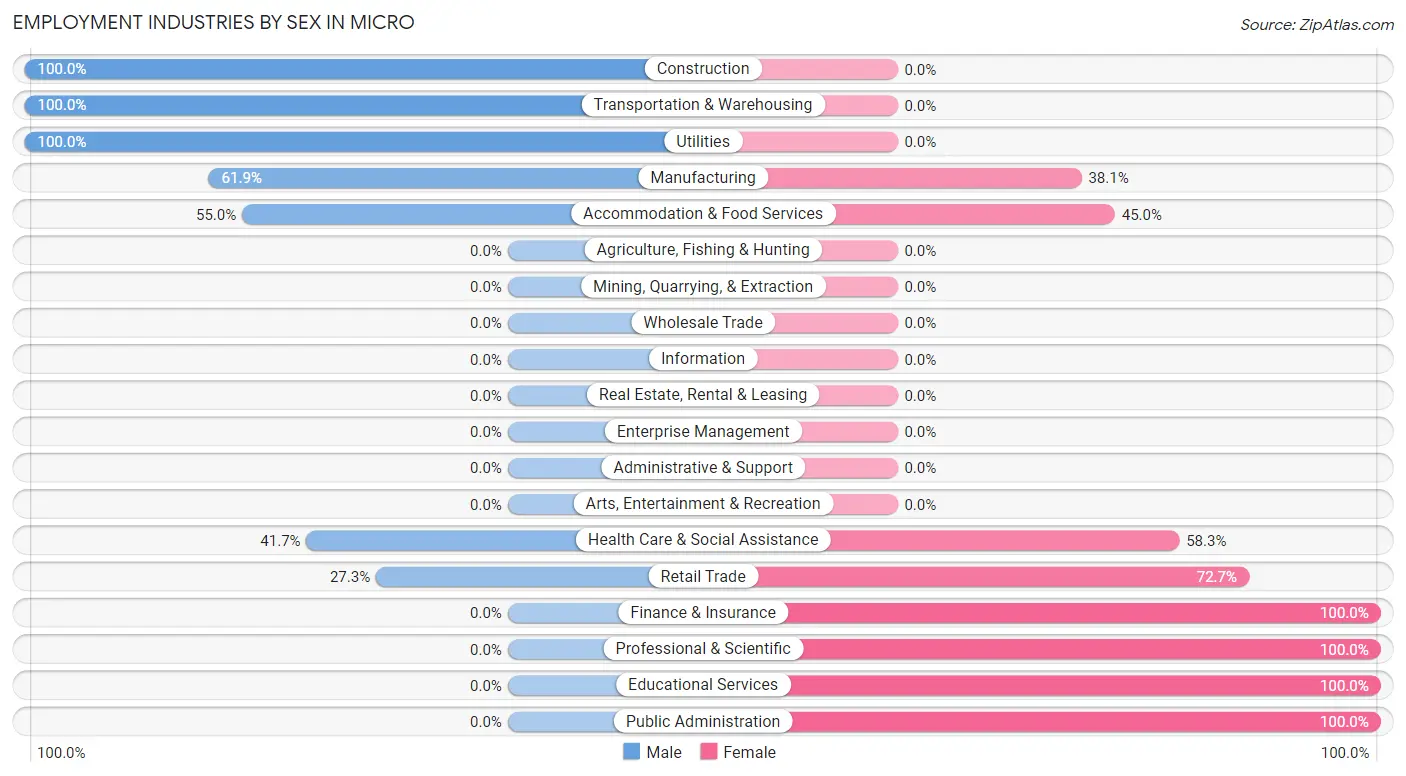
Employment Industries by Sex in Micro
The Micro industries that see more men than women are Construction (100.0%), Transportation & Warehousing (100.0%), and Utilities (100.0%), whereas the industries that tend to have a higher number of women are Finance & Insurance (100.0%), Professional & Scientific (100.0%), and Educational Services (100.0%).
| Industry | Male | Female |
| Agriculture, Fishing & Hunting | 0 (0.0%) | 0 (0.0%) |
| Mining, Quarrying, & Extraction | 0 (0.0%) | 0 (0.0%) |
| Construction | 49 (100.0%) | 0 (0.0%) |
| Manufacturing | 13 (61.9%) | 8 (38.1%) |
| Wholesale Trade | 0 (0.0%) | 0 (0.0%) |
| Retail Trade | 3 (27.3%) | 8 (72.7%) |
| Transportation & Warehousing | 12 (100.0%) | 0 (0.0%) |
| Utilities | 2 (100.0%) | 0 (0.0%) |
| Information | 0 (0.0%) | 0 (0.0%) |
| Finance & Insurance | 0 (0.0%) | 8 (100.0%) |
| Real Estate, Rental & Leasing | 0 (0.0%) | 0 (0.0%) |
| Professional & Scientific | 0 (0.0%) | 6 (100.0%) |
| Enterprise Management | 0 (0.0%) | 0 (0.0%) |
| Administrative & Support | 0 (0.0%) | 0 (0.0%) |
| Educational Services | 0 (0.0%) | 21 (100.0%) |
| Health Care & Social Assistance | 5 (41.7%) | 7 (58.3%) |
| Arts, Entertainment & Recreation | 0 (0.0%) | 0 (0.0%) |
| Accommodation & Food Services | 11 (55.0%) | 9 (45.0%) |
| Public Administration | 0 (0.0%) | 2 (100.0%) |
| Total | 103 (56.9%) | 78 (43.1%) |
Education in Micro
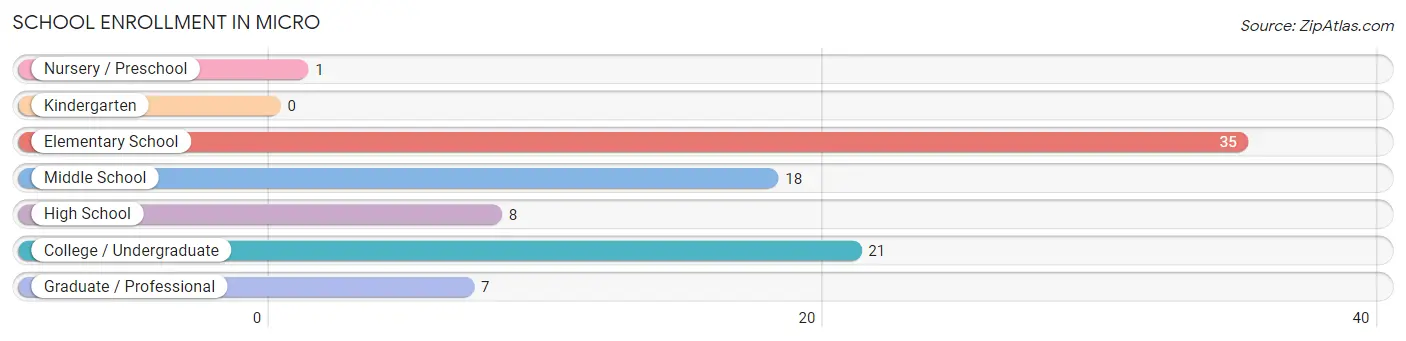
School Enrollment in Micro
The most common levels of schooling among the 90 students in Micro are elementary school (35 | 38.9%), college / undergraduate (21 | 23.3%), and middle school (18 | 20.0%).
| School Level | # Students | % Students |
| Nursery / Preschool | 1 | 1.1% |
| Kindergarten | 0 | 0.0% |
| Elementary School | 35 | 38.9% |
| Middle School | 18 | 20.0% |
| High School | 8 | 8.9% |
| College / Undergraduate | 21 | 23.3% |
| Graduate / Professional | 7 | 7.8% |
| Total | 90 | 100.0% |
School Enrollment by Age by Funding Source in Micro
Out of a total of 90 students who are enrolled in schools in Micro, 24 (26.7%) attend a private institution, while the remaining 66 (73.3%) are enrolled in public schools. The age group of 20 to 24 year olds has the highest likelihood of being enrolled in private schools, with 7 (100.0% in the age bracket) enrolled. Conversely, the age group of 3 to 4 year olds has the lowest likelihood of being enrolled in a private school, with 1 (100.0% in the age bracket) attending a public institution.
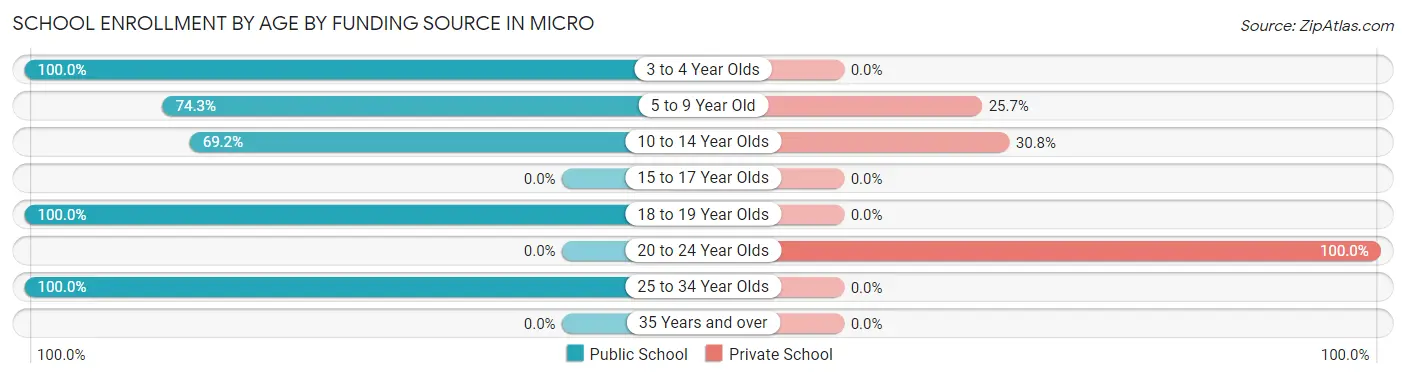
| Age Bracket | Public School | Private School |
| 3 to 4 Year Olds | 1 (100.0%) | 0 (0.0%) |
| 5 to 9 Year Old | 26 (74.3%) | 9 (25.7%) |
| 10 to 14 Year Olds | 18 (69.2%) | 8 (30.8%) |
| 15 to 17 Year Olds | 0 (0.0%) | 0 (0.0%) |
| 18 to 19 Year Olds | 13 (100.0%) | 0 (0.0%) |
| 20 to 24 Year Olds | 0 (0.0%) | 7 (100.0%) |
| 25 to 34 Year Olds | 8 (100.0%) | 0 (0.0%) |
| 35 Years and over | 0 (0.0%) | 0 (0.0%) |
| Total | 66 (73.3%) | 24 (26.7%) |
Educational Attainment by Field of Study in Micro
Business (19 | 37.2%), science & technology (11 | 21.6%), education (9 | 17.6%), engineering (8 | 15.7%), and computers & mathematics (4 | 7.8%) are the most common fields of study among 51 individuals in Micro who have obtained a bachelor's degree or higher.
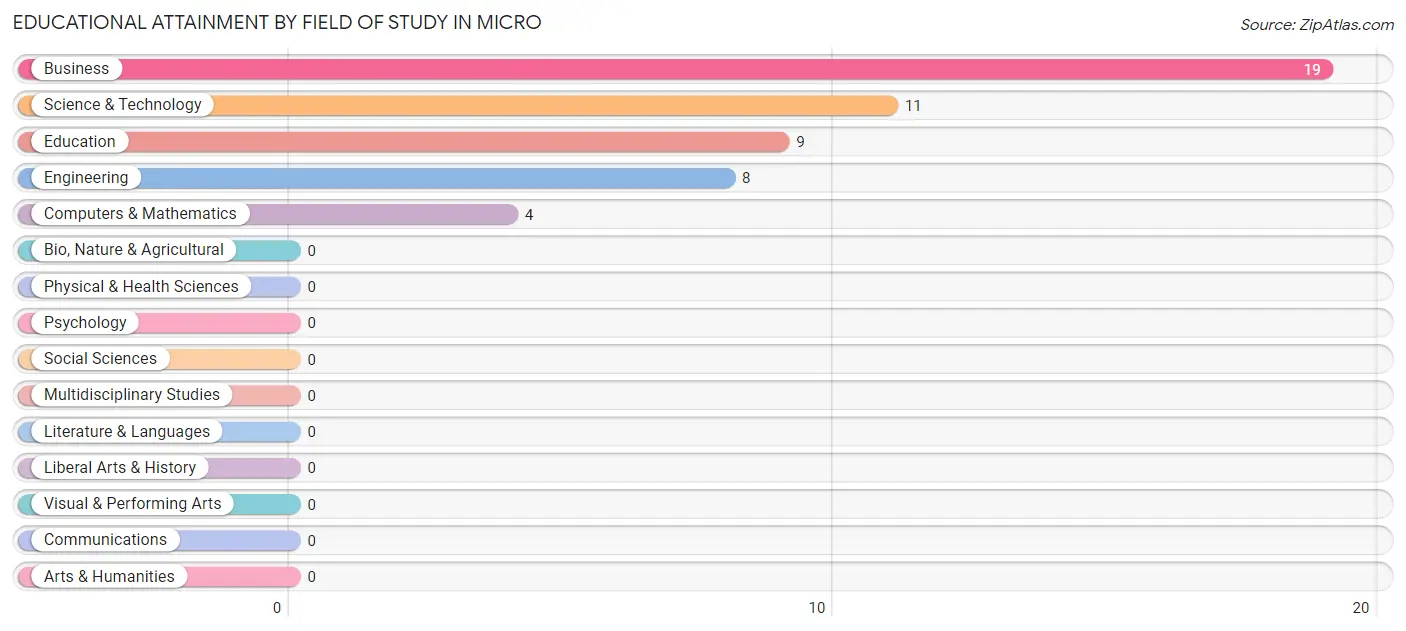
| Field of Study | # Graduates | % Graduates |
| Computers & Mathematics | 4 | 7.8% |
| Bio, Nature & Agricultural | 0 | 0.0% |
| Physical & Health Sciences | 0 | 0.0% |
| Psychology | 0 | 0.0% |
| Social Sciences | 0 | 0.0% |
| Engineering | 8 | 15.7% |
| Multidisciplinary Studies | 0 | 0.0% |
| Science & Technology | 11 | 21.6% |
| Business | 19 | 37.2% |
| Education | 9 | 17.6% |
| Literature & Languages | 0 | 0.0% |
| Liberal Arts & History | 0 | 0.0% |
| Visual & Performing Arts | 0 | 0.0% |
| Communications | 0 | 0.0% |
| Arts & Humanities | 0 | 0.0% |
| Total | 51 | 100.0% |
Transportation & Commute in Micro
Vehicle Availability by Sex in Micro
The most prevalent vehicle ownership categories in Micro are males with 2 vehicles (34, accounting for 33.0%) and females with 2 vehicles (30, making up 47.2%).
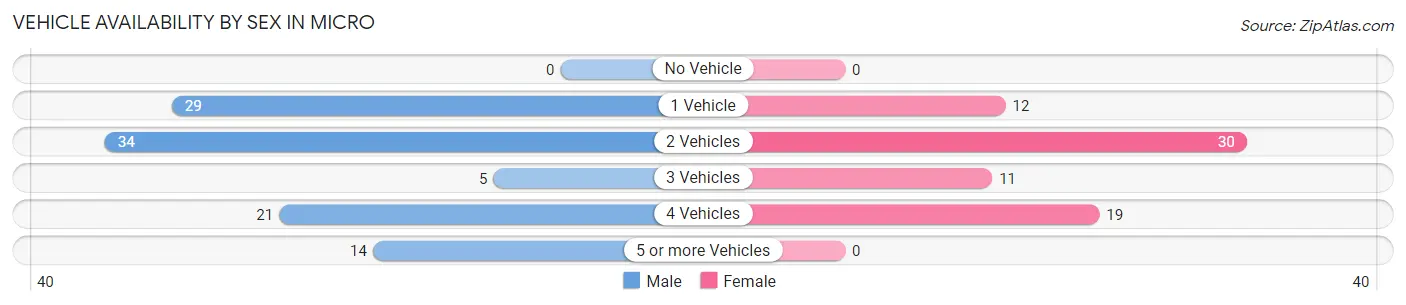
| Vehicles Available | Male | Female |
| No Vehicle | 0 (0.0%) | 0 (0.0%) |
| 1 Vehicle | 29 (28.2%) | 12 (16.7%) |
| 2 Vehicles | 34 (33.0%) | 30 (41.7%) |
| 3 Vehicles | 5 (4.9%) | 11 (15.3%) |
| 4 Vehicles | 21 (20.4%) | 19 (26.4%) |
| 5 or more Vehicles | 14 (13.6%) | 0 (0.0%) |
| Total | 103 (100.0%) | 72 (100.0%) |
Commute Time in Micro
The most frequently occuring commute durations in Micro are 15 to 19 minutes (35 commuters, 28.0%), 20 to 24 minutes (33 commuters, 26.4%), and 5 to 9 minutes (17 commuters, 13.6%).
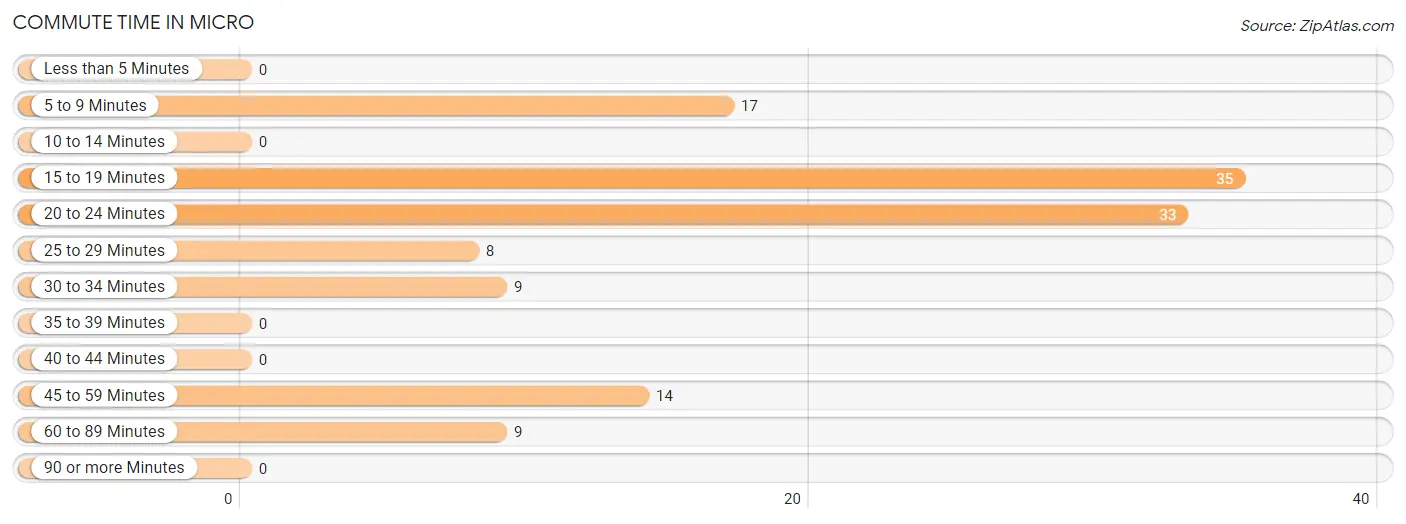
| Commute Time | # Commuters | % Commuters |
| Less than 5 Minutes | 0 | 0.0% |
| 5 to 9 Minutes | 17 | 13.6% |
| 10 to 14 Minutes | 0 | 0.0% |
| 15 to 19 Minutes | 35 | 28.0% |
| 20 to 24 Minutes | 33 | 26.4% |
| 25 to 29 Minutes | 8 | 6.4% |
| 30 to 34 Minutes | 9 | 7.2% |
| 35 to 39 Minutes | 0 | 0.0% |
| 40 to 44 Minutes | 0 | 0.0% |
| 45 to 59 Minutes | 14 | 11.2% |
| 60 to 89 Minutes | 9 | 7.2% |
| 90 or more Minutes | 0 | 0.0% |
Commute Time by Sex in Micro
The most common commute times in Micro are 15 to 19 minutes (28 commuters, 31.8%) for males and 20 to 24 minutes (13 commuters, 35.1%) for females.
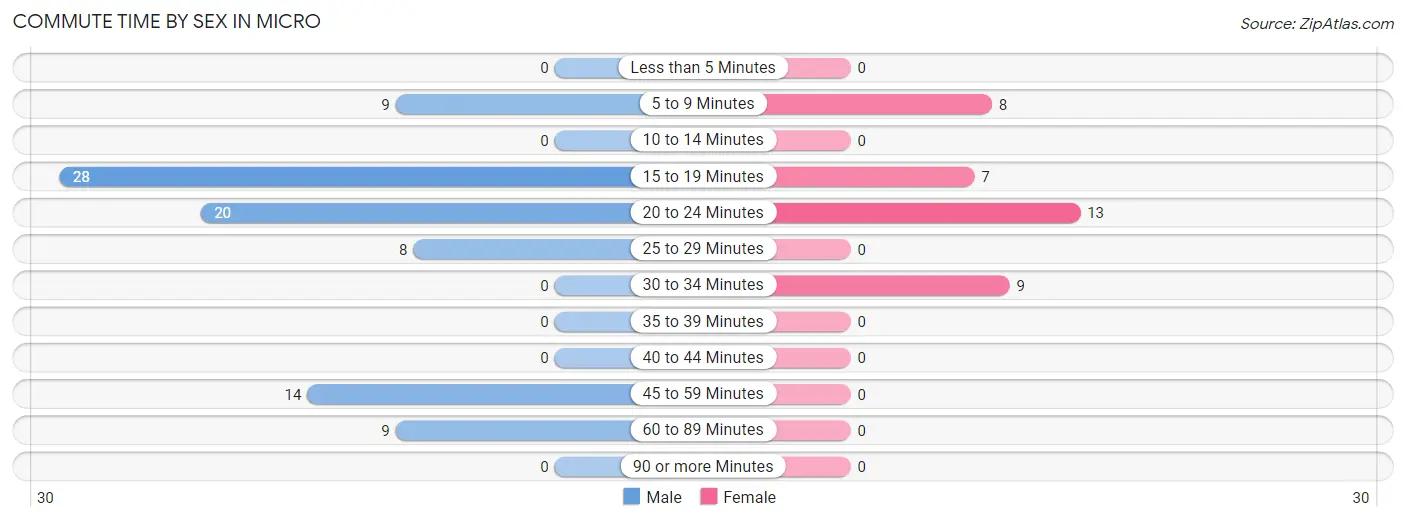
| Commute Time | Male | Female |
| Less than 5 Minutes | 0 (0.0%) | 0 (0.0%) |
| 5 to 9 Minutes | 9 (10.2%) | 8 (21.6%) |
| 10 to 14 Minutes | 0 (0.0%) | 0 (0.0%) |
| 15 to 19 Minutes | 28 (31.8%) | 7 (18.9%) |
| 20 to 24 Minutes | 20 (22.7%) | 13 (35.1%) |
| 25 to 29 Minutes | 8 (9.1%) | 0 (0.0%) |
| 30 to 34 Minutes | 0 (0.0%) | 9 (24.3%) |
| 35 to 39 Minutes | 0 (0.0%) | 0 (0.0%) |
| 40 to 44 Minutes | 0 (0.0%) | 0 (0.0%) |
| 45 to 59 Minutes | 14 (15.9%) | 0 (0.0%) |
| 60 to 89 Minutes | 9 (10.2%) | 0 (0.0%) |
| 90 or more Minutes | 0 (0.0%) | 0 (0.0%) |
Time of Departure to Work by Sex in Micro
The most frequent times of departure to work in Micro are 6:00 AM to 6:29 AM (47, 53.4%) for males and 7:00 AM to 7:29 AM (19, 51.3%) for females.
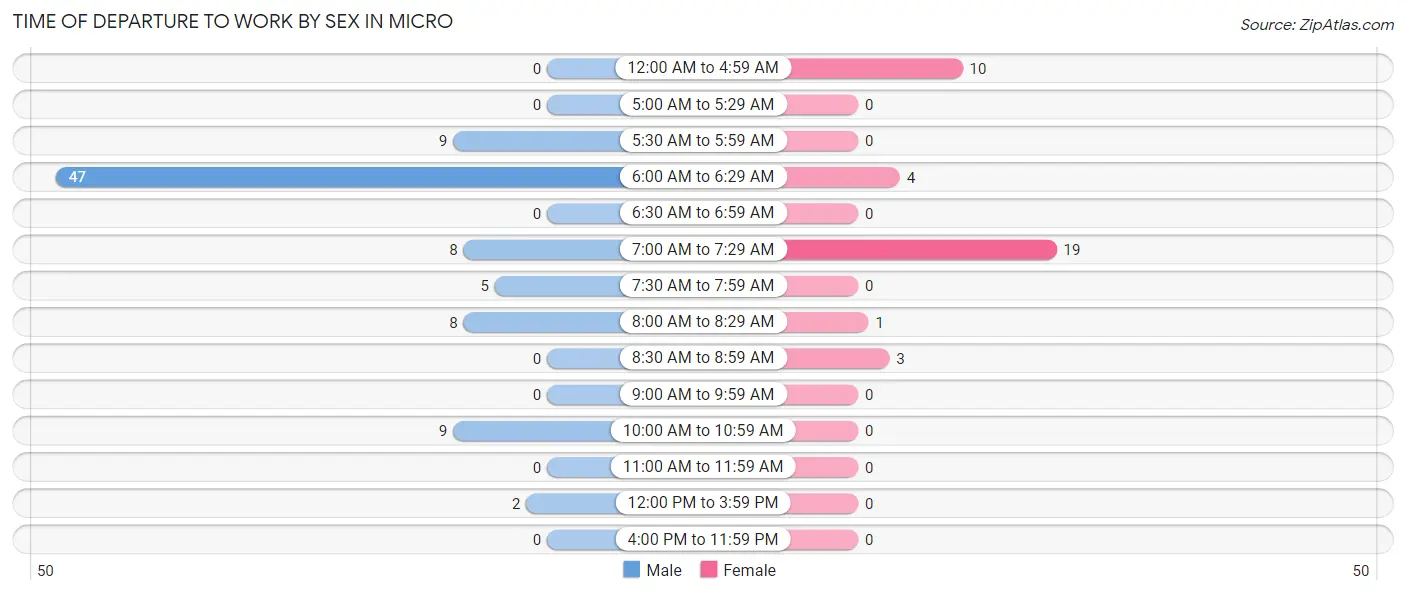
| Time of Departure | Male | Female |
| 12:00 AM to 4:59 AM | 0 (0.0%) | 10 (27.0%) |
| 5:00 AM to 5:29 AM | 0 (0.0%) | 0 (0.0%) |
| 5:30 AM to 5:59 AM | 9 (10.2%) | 0 (0.0%) |
| 6:00 AM to 6:29 AM | 47 (53.4%) | 4 (10.8%) |
| 6:30 AM to 6:59 AM | 0 (0.0%) | 0 (0.0%) |
| 7:00 AM to 7:29 AM | 8 (9.1%) | 19 (51.3%) |
| 7:30 AM to 7:59 AM | 5 (5.7%) | 0 (0.0%) |
| 8:00 AM to 8:29 AM | 8 (9.1%) | 1 (2.7%) |
| 8:30 AM to 8:59 AM | 0 (0.0%) | 3 (8.1%) |
| 9:00 AM to 9:59 AM | 0 (0.0%) | 0 (0.0%) |
| 10:00 AM to 10:59 AM | 9 (10.2%) | 0 (0.0%) |
| 11:00 AM to 11:59 AM | 0 (0.0%) | 0 (0.0%) |
| 12:00 PM to 3:59 PM | 2 (2.3%) | 0 (0.0%) |
| 4:00 PM to 11:59 PM | 0 (0.0%) | 0 (0.0%) |
| Total | 88 (100.0%) | 37 (100.0%) |
Housing Occupancy in Micro
Occupancy by Ownership in Micro
Of the total 194 dwellings in Micro, owner-occupied units account for 99 (51.0%), while renter-occupied units make up 95 (49.0%).
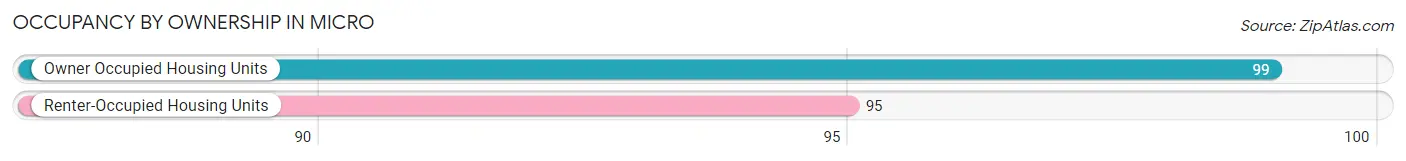
| Occupancy | # Housing Units | % Housing Units |
| Owner Occupied Housing Units | 99 | 51.0% |
| Renter-Occupied Housing Units | 95 | 49.0% |
| Total Occupied Housing Units | 194 | 100.0% |
Occupancy by Household Size in Micro
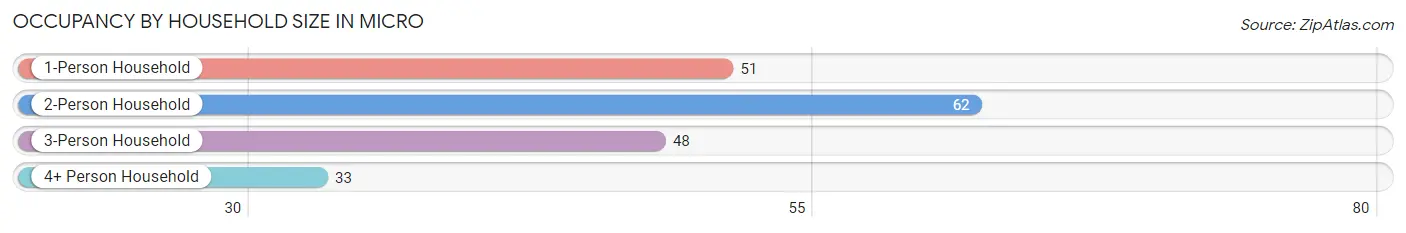
| Household Size | # Housing Units | % Housing Units |
| 1-Person Household | 51 | 26.3% |
| 2-Person Household | 62 | 32.0% |
| 3-Person Household | 48 | 24.7% |
| 4+ Person Household | 33 | 17.0% |
| Total Housing Units | 194 | 100.0% |
Occupancy by Ownership by Household Size in Micro
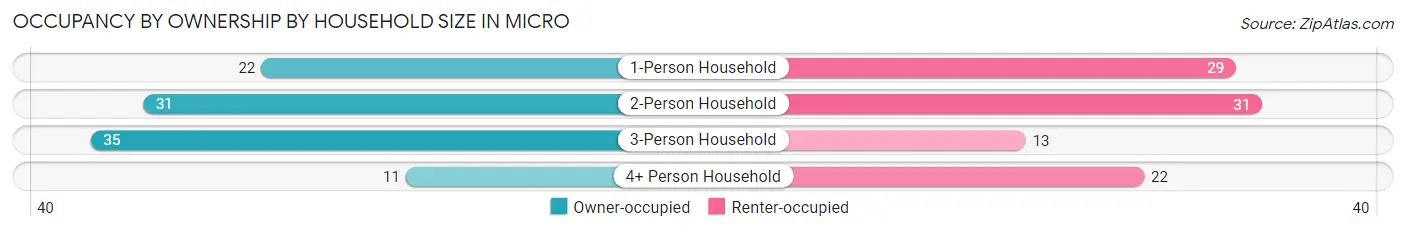
| Household Size | Owner-occupied | Renter-occupied |
| 1-Person Household | 22 (43.1%) | 29 (56.9%) |
| 2-Person Household | 31 (50.0%) | 31 (50.0%) |
| 3-Person Household | 35 (72.9%) | 13 (27.1%) |
| 4+ Person Household | 11 (33.3%) | 22 (66.7%) |
| Total Housing Units | 99 (51.0%) | 95 (49.0%) |
Occupancy by Educational Attainment in Micro
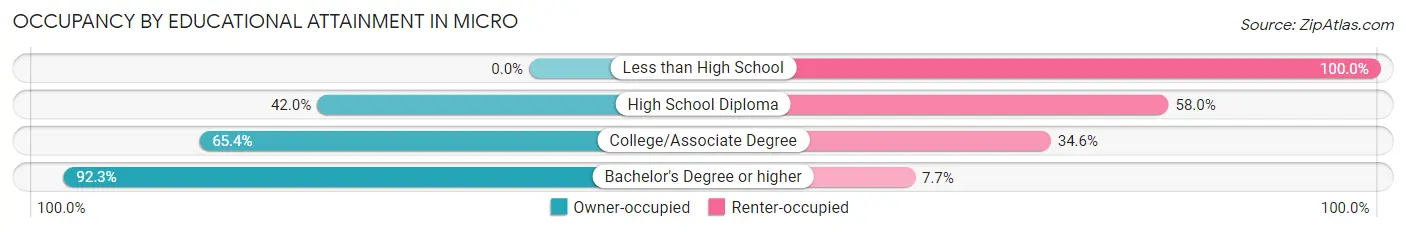
| Household Size | Owner-occupied | Renter-occupied |
| Less than High School | 0 (0.0%) | 34 (100.0%) |
| High School Diploma | 29 (42.0%) | 40 (58.0%) |
| College/Associate Degree | 34 (65.4%) | 18 (34.6%) |
| Bachelor's Degree or higher | 36 (92.3%) | 3 (7.7%) |
Occupancy by Age of Householder in Micro
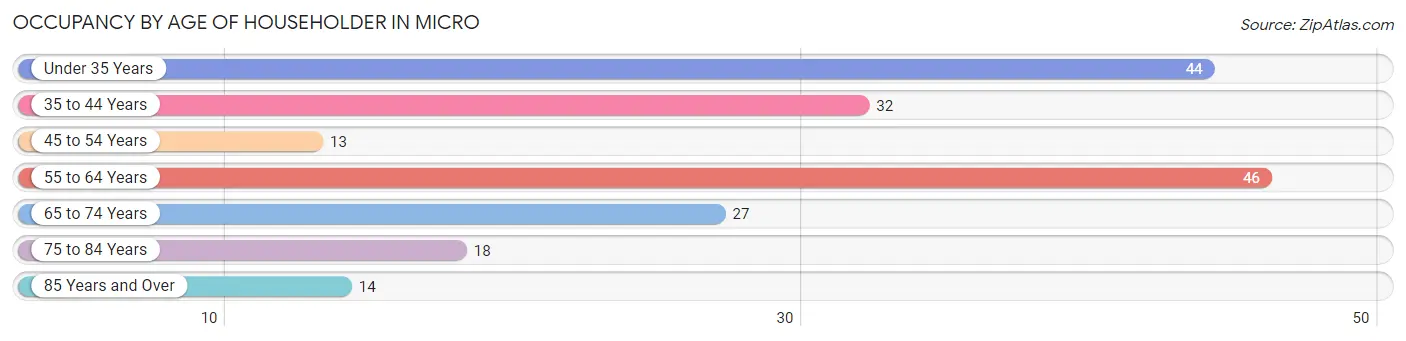
| Age Bracket | # Households | % Households |
| Under 35 Years | 44 | 22.7% |
| 35 to 44 Years | 32 | 16.5% |
| 45 to 54 Years | 13 | 6.7% |
| 55 to 64 Years | 46 | 23.7% |
| 65 to 74 Years | 27 | 13.9% |
| 75 to 84 Years | 18 | 9.3% |
| 85 Years and Over | 14 | 7.2% |
| Total | 194 | 100.0% |
Housing Finances in Micro
Median Income by Occupancy in Micro
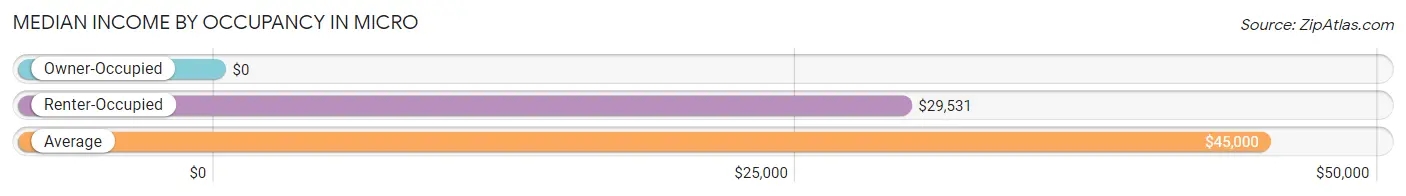
| Occupancy Type | # Households | Median Income |
| Owner-Occupied | 99 (51.0%) | $0 |
| Renter-Occupied | 95 (49.0%) | $29,531 |
| Average | 194 (100.0%) | $45,000 |
Occupancy by Householder Income Bracket in Micro
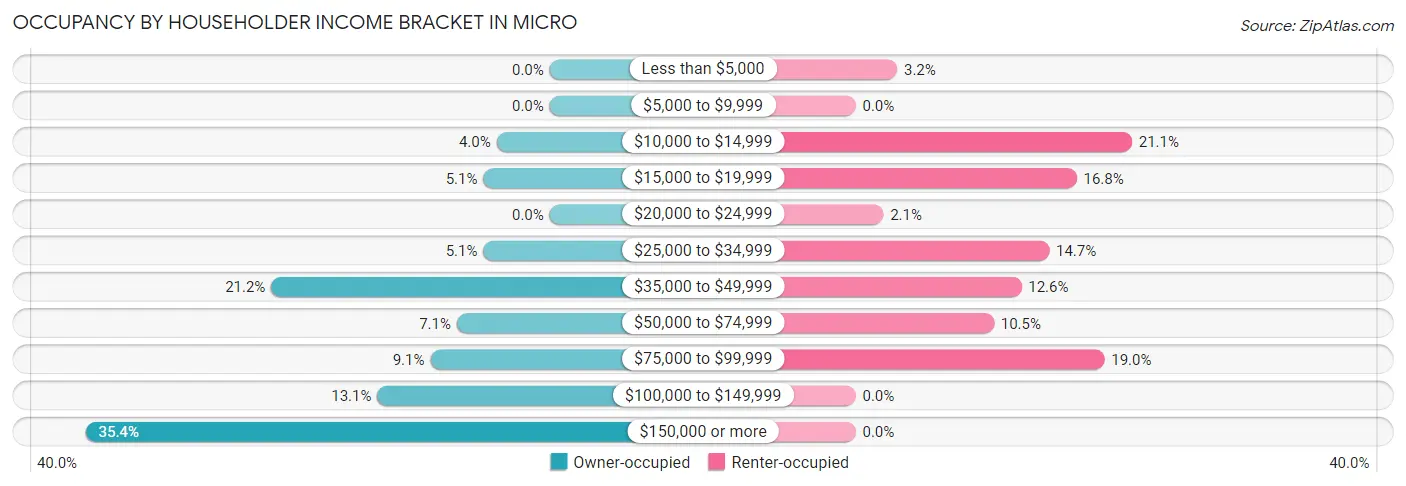
| Income Bracket | Owner-occupied | Renter-occupied |
| Less than $5,000 | 0 (0.0%) | 3 (3.2%) |
| $5,000 to $9,999 | 0 (0.0%) | 0 (0.0%) |
| $10,000 to $14,999 | 4 (4.0%) | 20 (21.0%) |
| $15,000 to $19,999 | 5 (5.1%) | 16 (16.8%) |
| $20,000 to $24,999 | 0 (0.0%) | 2 (2.1%) |
| $25,000 to $34,999 | 5 (5.1%) | 14 (14.7%) |
| $35,000 to $49,999 | 21 (21.2%) | 12 (12.6%) |
| $50,000 to $74,999 | 7 (7.1%) | 10 (10.5%) |
| $75,000 to $99,999 | 9 (9.1%) | 18 (19.0%) |
| $100,000 to $149,999 | 13 (13.1%) | 0 (0.0%) |
| $150,000 or more | 35 (35.3%) | 0 (0.0%) |
| Total | 99 (100.0%) | 95 (100.0%) |
Monthly Housing Cost Tiers in Micro
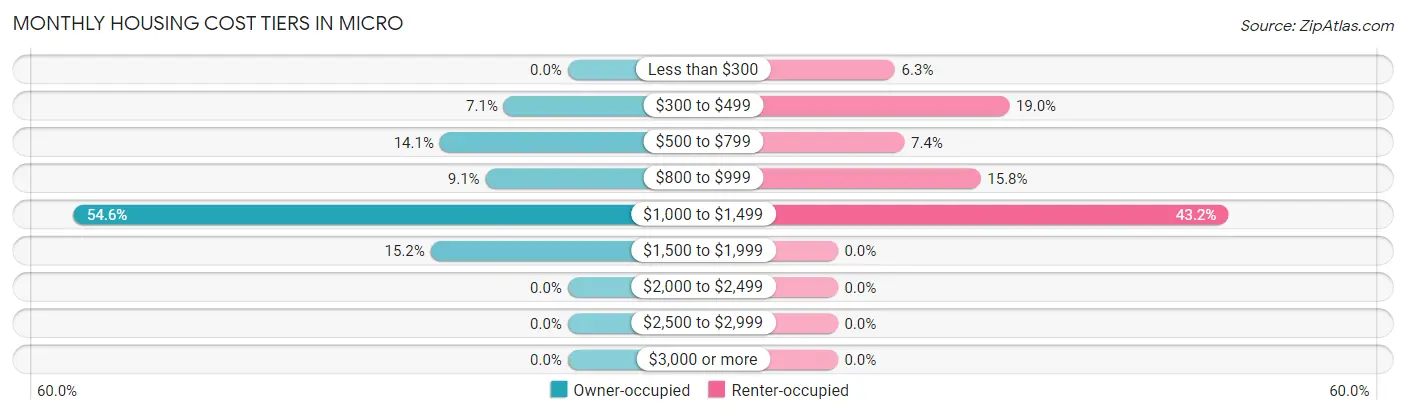
| Monthly Cost | Owner-occupied | Renter-occupied |
| Less than $300 | 0 (0.0%) | 6 (6.3%) |
| $300 to $499 | 7 (7.1%) | 18 (19.0%) |
| $500 to $799 | 14 (14.1%) | 7 (7.4%) |
| $800 to $999 | 9 (9.1%) | 15 (15.8%) |
| $1,000 to $1,499 | 54 (54.5%) | 41 (43.2%) |
| $1,500 to $1,999 | 15 (15.1%) | 0 (0.0%) |
| $2,000 to $2,499 | 0 (0.0%) | 0 (0.0%) |
| $2,500 to $2,999 | 0 (0.0%) | 0 (0.0%) |
| $3,000 or more | 0 (0.0%) | 0 (0.0%) |
| Total | 99 (100.0%) | 95 (100.0%) |
Physical Housing Characteristics in Micro
Housing Structures in Micro
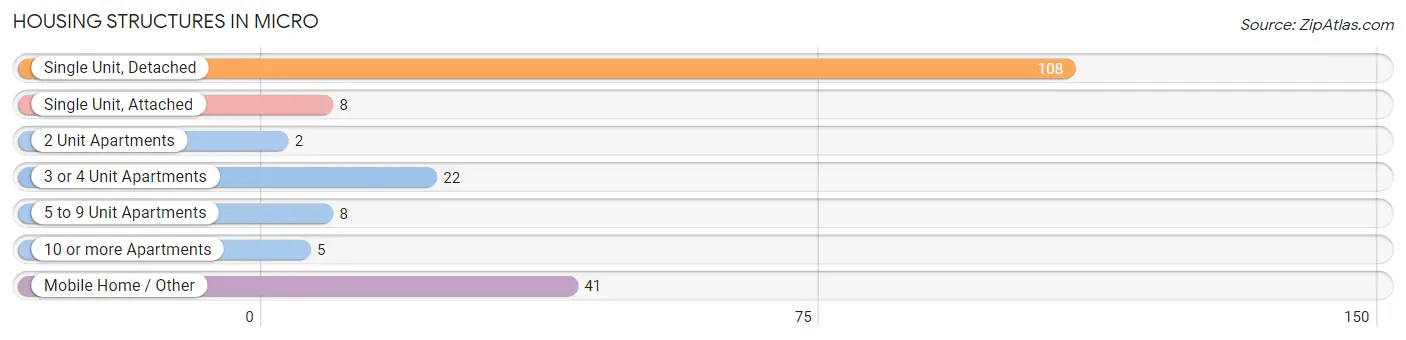
| Structure Type | # Housing Units | % Housing Units |
| Single Unit, Detached | 108 | 55.7% |
| Single Unit, Attached | 8 | 4.1% |
| 2 Unit Apartments | 2 | 1.0% |
| 3 or 4 Unit Apartments | 22 | 11.3% |
| 5 to 9 Unit Apartments | 8 | 4.1% |
| 10 or more Apartments | 5 | 2.6% |
| Mobile Home / Other | 41 | 21.1% |
| Total | 194 | 100.0% |
Housing Structures by Occupancy in Micro
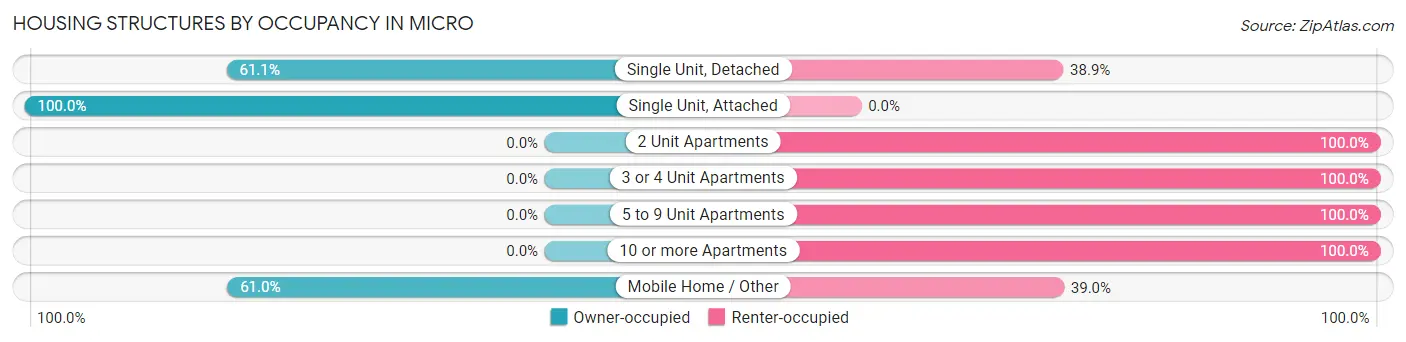
| Structure Type | Owner-occupied | Renter-occupied |
| Single Unit, Detached | 66 (61.1%) | 42 (38.9%) |
| Single Unit, Attached | 8 (100.0%) | 0 (0.0%) |
| 2 Unit Apartments | 0 (0.0%) | 2 (100.0%) |
| 3 or 4 Unit Apartments | 0 (0.0%) | 22 (100.0%) |
| 5 to 9 Unit Apartments | 0 (0.0%) | 8 (100.0%) |
| 10 or more Apartments | 0 (0.0%) | 5 (100.0%) |
| Mobile Home / Other | 25 (61.0%) | 16 (39.0%) |
| Total | 99 (51.0%) | 95 (49.0%) |
Housing Structures by Number of Rooms in Micro
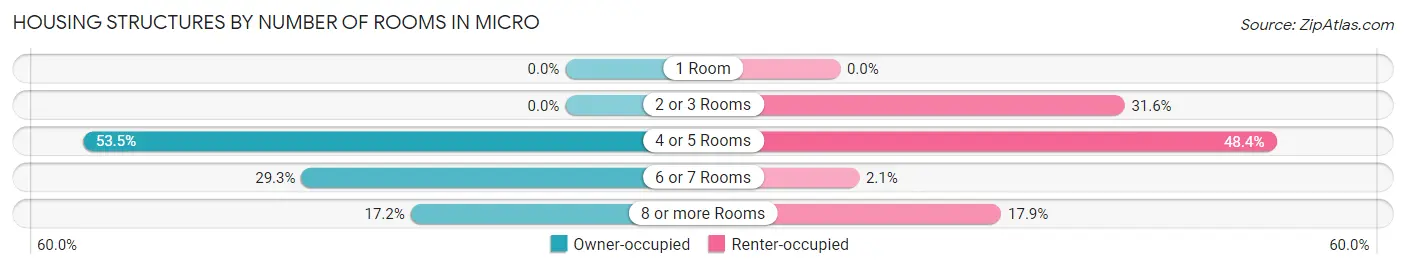
| Number of Rooms | Owner-occupied | Renter-occupied |
| 1 Room | 0 (0.0%) | 0 (0.0%) |
| 2 or 3 Rooms | 0 (0.0%) | 30 (31.6%) |
| 4 or 5 Rooms | 53 (53.5%) | 46 (48.4%) |
| 6 or 7 Rooms | 29 (29.3%) | 2 (2.1%) |
| 8 or more Rooms | 17 (17.2%) | 17 (17.9%) |
| Total | 99 (100.0%) | 95 (100.0%) |
Housing Structure by Heating Type in Micro
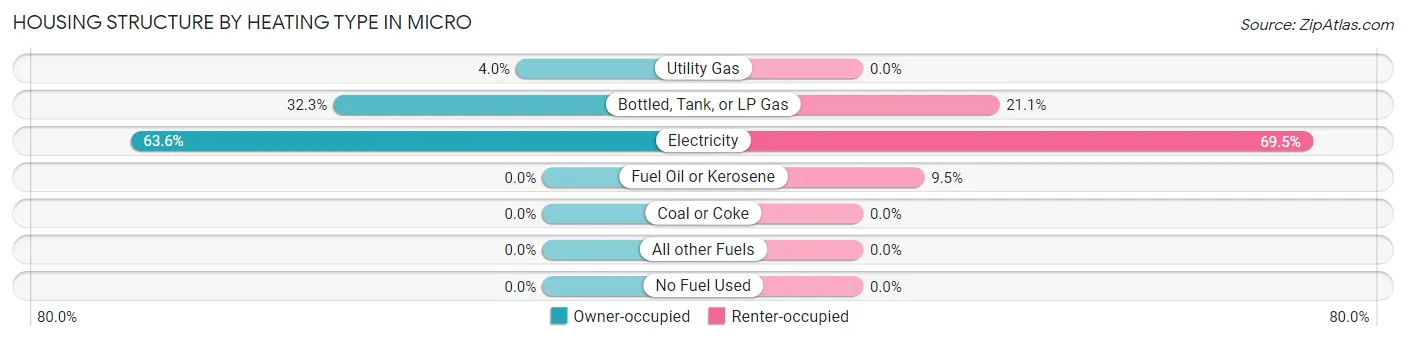
| Heating Type | Owner-occupied | Renter-occupied |
| Utility Gas | 4 (4.0%) | 0 (0.0%) |
| Bottled, Tank, or LP Gas | 32 (32.3%) | 20 (21.0%) |
| Electricity | 63 (63.6%) | 66 (69.5%) |
| Fuel Oil or Kerosene | 0 (0.0%) | 9 (9.5%) |
| Coal or Coke | 0 (0.0%) | 0 (0.0%) |
| All other Fuels | 0 (0.0%) | 0 (0.0%) |
| No Fuel Used | 0 (0.0%) | 0 (0.0%) |
| Total | 99 (100.0%) | 95 (100.0%) |
Household Vehicle Usage in Micro
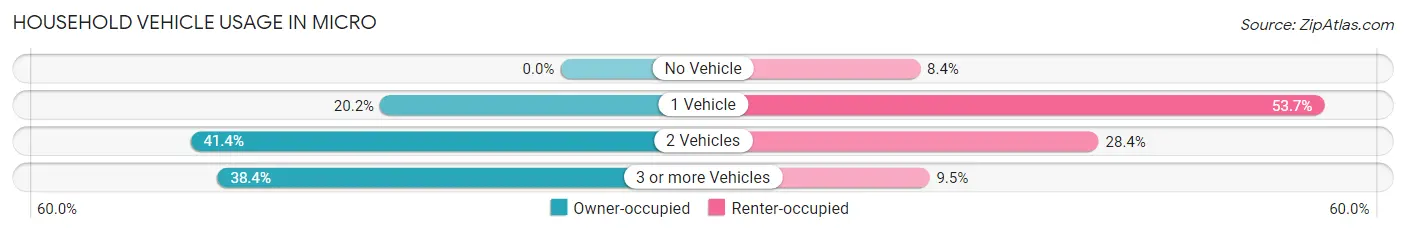
| Vehicles per Household | Owner-occupied | Renter-occupied |
| No Vehicle | 0 (0.0%) | 8 (8.4%) |
| 1 Vehicle | 20 (20.2%) | 51 (53.7%) |
| 2 Vehicles | 41 (41.4%) | 27 (28.4%) |
| 3 or more Vehicles | 38 (38.4%) | 9 (9.5%) |
| Total | 99 (100.0%) | 95 (100.0%) |
Real Estate & Mortgages in Micro
Real Estate and Mortgage Overview in Micro
| Characteristic | Without Mortgage | With Mortgage |
| Housing Units | 25 | 74 |
| Median Property Value | $158,900 | $153,600 |
| Median Household Income | $58,036 | $35 |
| Monthly Housing Costs | $550 | $0 |
| Real Estate Taxes | $1,304 | $8 |
Property Value by Mortgage Status in Micro
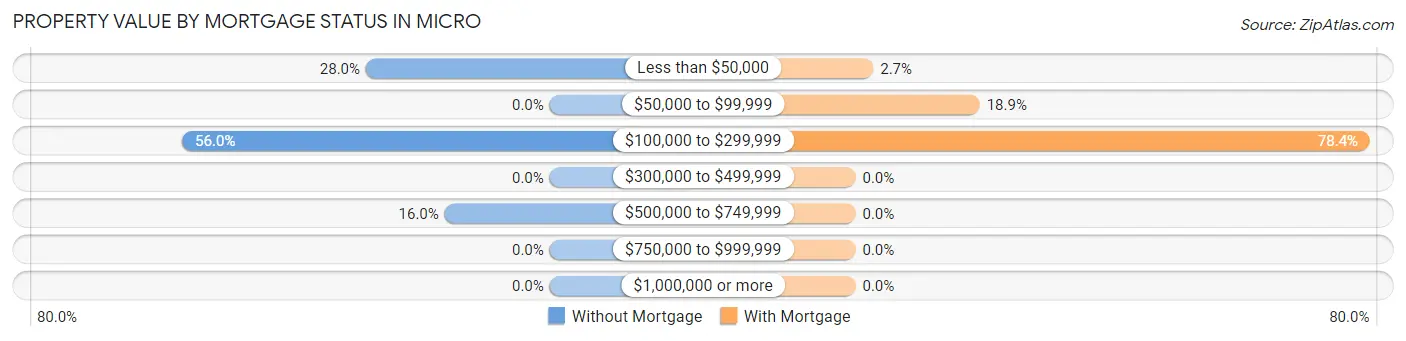
| Property Value | Without Mortgage | With Mortgage |
| Less than $50,000 | 7 (28.0%) | 2 (2.7%) |
| $50,000 to $99,999 | 0 (0.0%) | 14 (18.9%) |
| $100,000 to $299,999 | 14 (56.0%) | 58 (78.4%) |
| $300,000 to $499,999 | 0 (0.0%) | 0 (0.0%) |
| $500,000 to $749,999 | 4 (16.0%) | 0 (0.0%) |
| $750,000 to $999,999 | 0 (0.0%) | 0 (0.0%) |
| $1,000,000 or more | 0 (0.0%) | 0 (0.0%) |
| Total | 25 (100.0%) | 74 (100.0%) |
Household Income by Mortgage Status in Micro
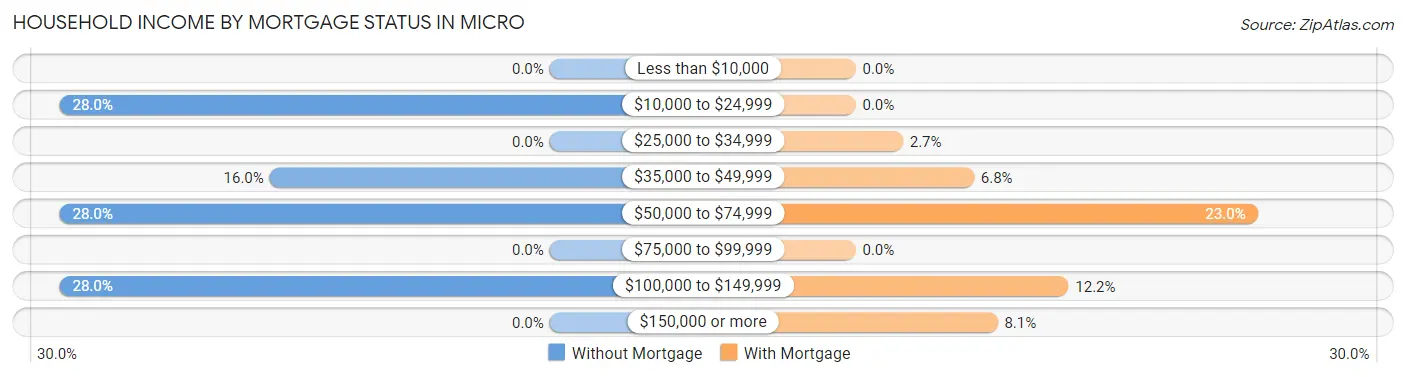
| Household Income | Without Mortgage | With Mortgage |
| Less than $10,000 | 0 (0.0%) | 0 (0.0%) |
| $10,000 to $24,999 | 7 (28.0%) | 0 (0.0%) |
| $25,000 to $34,999 | 0 (0.0%) | 2 (2.7%) |
| $35,000 to $49,999 | 4 (16.0%) | 5 (6.8%) |
| $50,000 to $74,999 | 7 (28.0%) | 17 (23.0%) |
| $75,000 to $99,999 | 0 (0.0%) | 0 (0.0%) |
| $100,000 to $149,999 | 7 (28.0%) | 9 (12.2%) |
| $150,000 or more | 0 (0.0%) | 6 (8.1%) |
| Total | 25 (100.0%) | 74 (100.0%) |
Property Value to Household Income Ratio in Micro
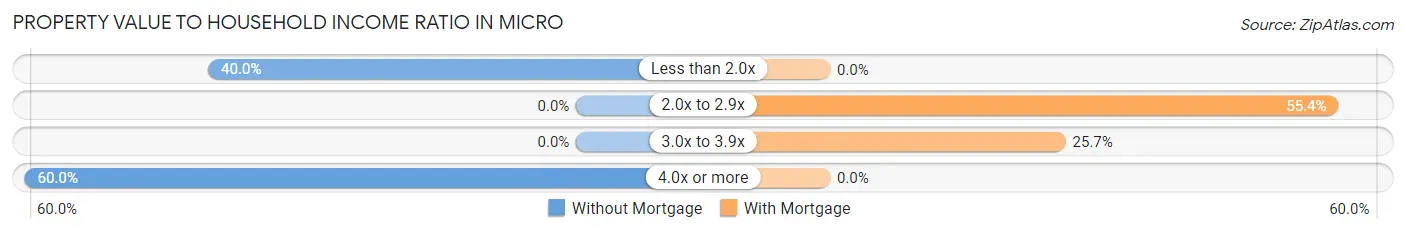
| Value-to-Income Ratio | Without Mortgage | With Mortgage |
| Less than 2.0x | 10 (40.0%) | 0 (0.0%) |
| 2.0x to 2.9x | 0 (0.0%) | 41 (55.4%) |
| 3.0x to 3.9x | 0 (0.0%) | 19 (25.7%) |
| 4.0x or more | 15 (60.0%) | 0 (0.0%) |
| Total | 25 (100.0%) | 74 (100.0%) |
Real Estate Taxes by Mortgage Status in Micro
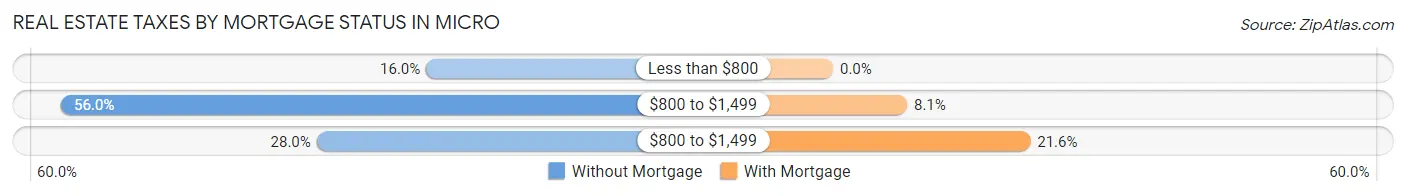
| Property Taxes | Without Mortgage | With Mortgage |
| Less than $800 | 4 (16.0%) | 0 (0.0%) |
| $800 to $1,499 | 14 (56.0%) | 6 (8.1%) |
| $800 to $1,499 | 7 (28.0%) | 16 (21.6%) |
| Total | 25 (100.0%) | 74 (100.0%) |
Health & Disability in Micro
Health Insurance Coverage by Age in Micro
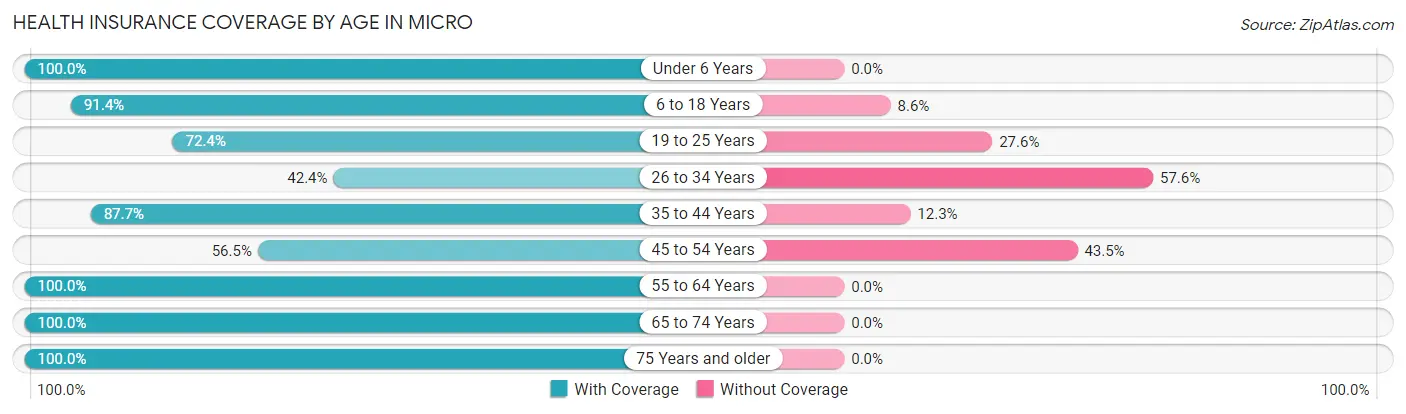
| Age Bracket | With Coverage | Without Coverage |
| Under 6 Years | 57 (100.0%) | 0 (0.0%) |
| 6 to 18 Years | 74 (91.4%) | 7 (8.6%) |
| 19 to 25 Years | 21 (72.4%) | 8 (27.6%) |
| 26 to 34 Years | 28 (42.4%) | 38 (57.6%) |
| 35 to 44 Years | 64 (87.7%) | 9 (12.3%) |
| 45 to 54 Years | 13 (56.5%) | 10 (43.5%) |
| 55 to 64 Years | 68 (100.0%) | 0 (0.0%) |
| 65 to 74 Years | 40 (100.0%) | 0 (0.0%) |
| 75 Years and older | 40 (100.0%) | 0 (0.0%) |
| Total | 405 (84.9%) | 72 (15.1%) |
Health Insurance Coverage by Citizenship Status in Micro
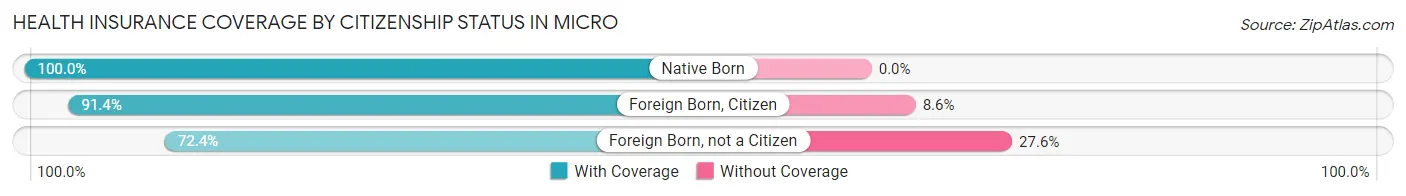
| Citizenship Status | With Coverage | Without Coverage |
| Native Born | 57 (100.0%) | 0 (0.0%) |
| Foreign Born, Citizen | 74 (91.4%) | 7 (8.6%) |
| Foreign Born, not a Citizen | 21 (72.4%) | 8 (27.6%) |
Health Insurance Coverage by Household Income in Micro
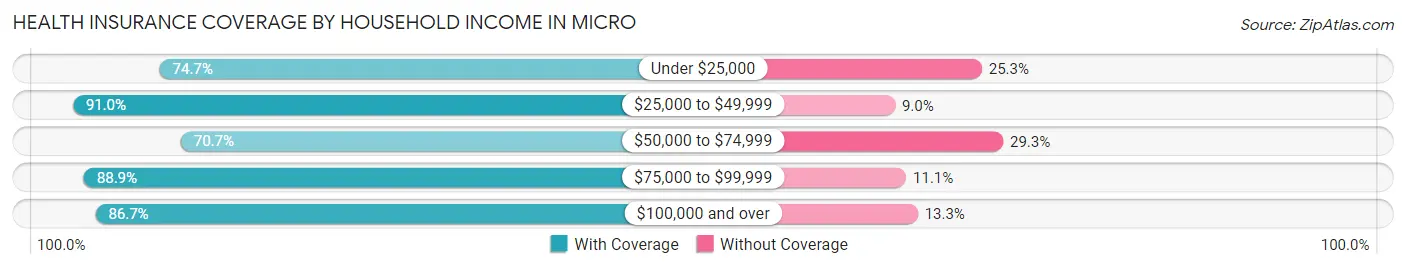
| Household Income | With Coverage | Without Coverage |
| Under $25,000 | 62 (74.7%) | 21 (25.3%) |
| $25,000 to $49,999 | 131 (91.0%) | 13 (9.0%) |
| $50,000 to $74,999 | 29 (70.7%) | 12 (29.3%) |
| $75,000 to $99,999 | 72 (88.9%) | 9 (11.1%) |
| $100,000 and over | 111 (86.7%) | 17 (13.3%) |
Public vs Private Health Insurance Coverage by Age in Micro
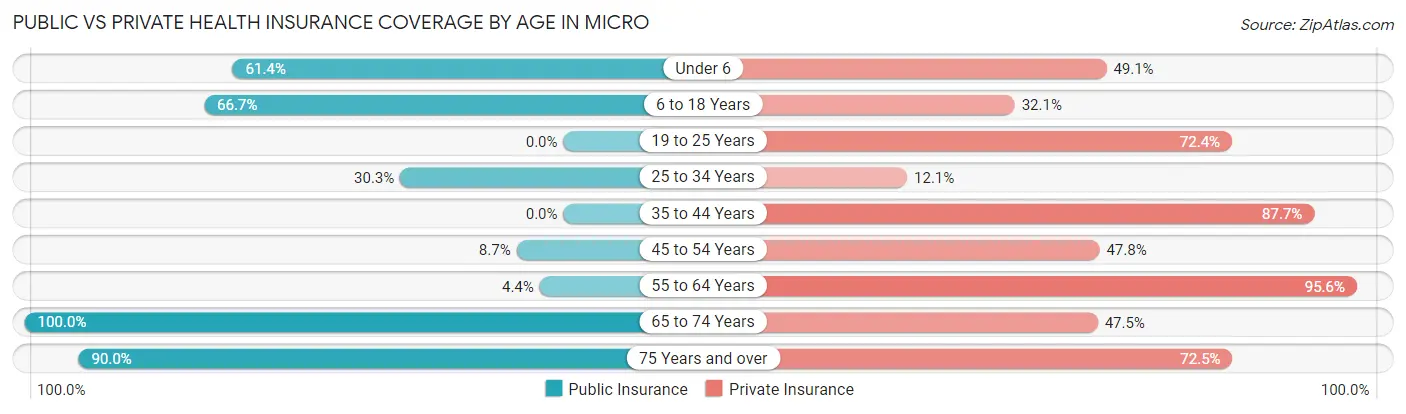
| Age Bracket | Public Insurance | Private Insurance |
| Under 6 | 35 (61.4%) | 28 (49.1%) |
| 6 to 18 Years | 54 (66.7%) | 26 (32.1%) |
| 19 to 25 Years | 0 (0.0%) | 21 (72.4%) |
| 25 to 34 Years | 20 (30.3%) | 8 (12.1%) |
| 35 to 44 Years | 0 (0.0%) | 64 (87.7%) |
| 45 to 54 Years | 2 (8.7%) | 11 (47.8%) |
| 55 to 64 Years | 3 (4.4%) | 65 (95.6%) |
| 65 to 74 Years | 40 (100.0%) | 19 (47.5%) |
| 75 Years and over | 36 (90.0%) | 29 (72.5%) |
| Total | 190 (39.8%) | 271 (56.8%) |
Disability Status by Sex by Age in Micro
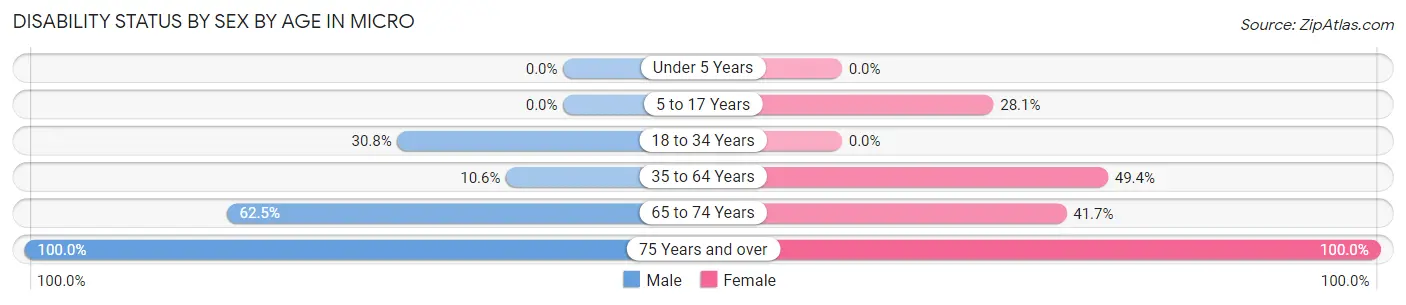
| Age Bracket | Male | Female |
| Under 5 Years | 0 (0.0%) | 0 (0.0%) |
| 5 to 17 Years | 0 (0.0%) | 9 (28.1%) |
| 18 to 34 Years | 12 (30.8%) | 0 (0.0%) |
| 35 to 64 Years | 9 (10.6%) | 39 (49.4%) |
| 65 to 74 Years | 10 (62.5%) | 10 (41.7%) |
| 75 Years and over | 8 (100.0%) | 32 (100.0%) |
Disability Class by Sex by Age in Micro
Disability Class: Hearing Difficulty
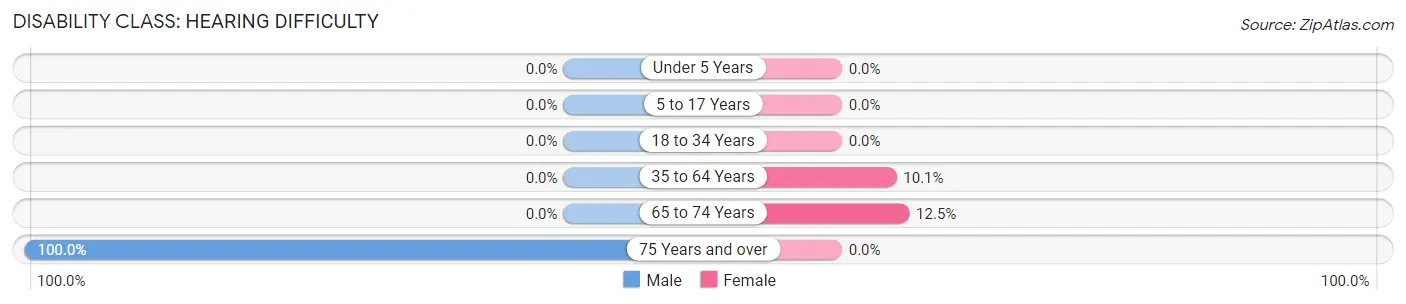
| Age Bracket | Male | Female |
| Under 5 Years | 0 (0.0%) | 0 (0.0%) |
| 5 to 17 Years | 0 (0.0%) | 0 (0.0%) |
| 18 to 34 Years | 0 (0.0%) | 0 (0.0%) |
| 35 to 64 Years | 0 (0.0%) | 8 (10.1%) |
| 65 to 74 Years | 0 (0.0%) | 3 (12.5%) |
| 75 Years and over | 8 (100.0%) | 0 (0.0%) |
Disability Class: Vision Difficulty
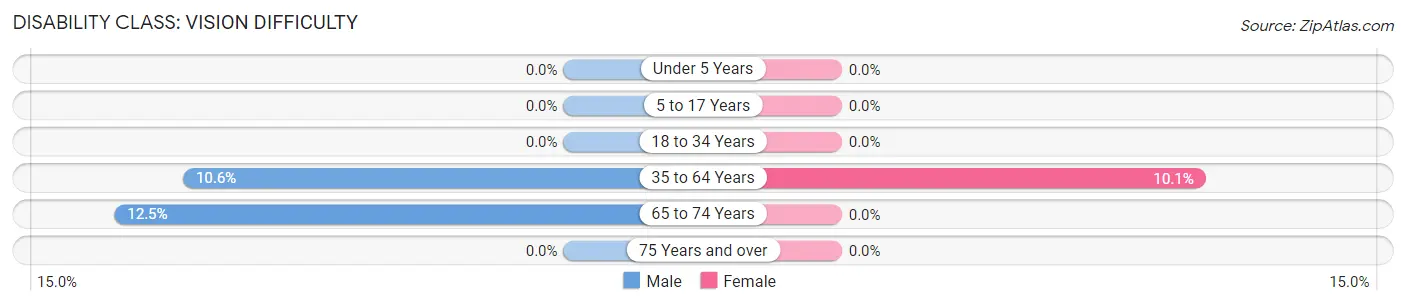
| Age Bracket | Male | Female |
| Under 5 Years | 0 (0.0%) | 0 (0.0%) |
| 5 to 17 Years | 0 (0.0%) | 0 (0.0%) |
| 18 to 34 Years | 0 (0.0%) | 0 (0.0%) |
| 35 to 64 Years | 9 (10.6%) | 8 (10.1%) |
| 65 to 74 Years | 2 (12.5%) | 0 (0.0%) |
| 75 Years and over | 0 (0.0%) | 0 (0.0%) |
Disability Class: Cognitive Difficulty
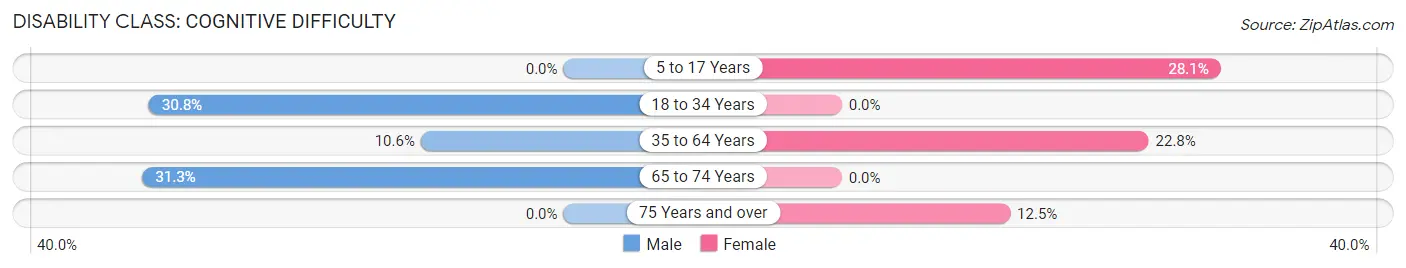
| Age Bracket | Male | Female |
| 5 to 17 Years | 0 (0.0%) | 9 (28.1%) |
| 18 to 34 Years | 12 (30.8%) | 0 (0.0%) |
| 35 to 64 Years | 9 (10.6%) | 18 (22.8%) |
| 65 to 74 Years | 5 (31.2%) | 0 (0.0%) |
| 75 Years and over | 0 (0.0%) | 4 (12.5%) |
Disability Class: Ambulatory Difficulty
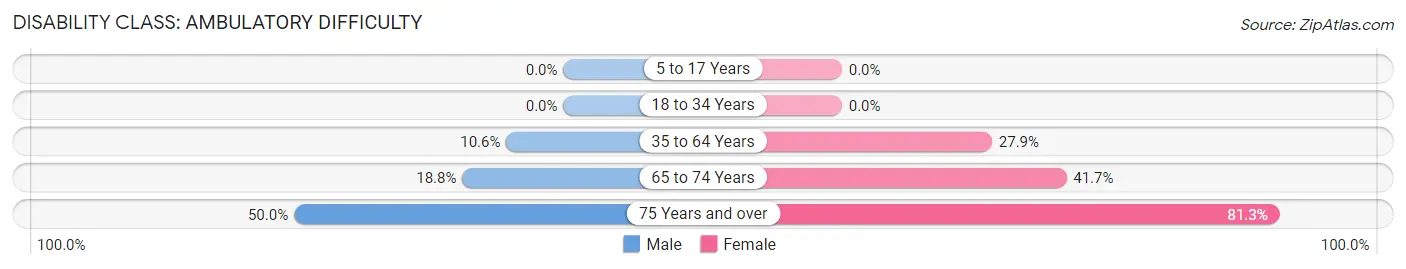
| Age Bracket | Male | Female |
| 5 to 17 Years | 0 (0.0%) | 0 (0.0%) |
| 18 to 34 Years | 0 (0.0%) | 0 (0.0%) |
| 35 to 64 Years | 9 (10.6%) | 22 (27.9%) |
| 65 to 74 Years | 3 (18.8%) | 10 (41.7%) |
| 75 Years and over | 4 (50.0%) | 26 (81.2%) |
Disability Class: Self-Care Difficulty
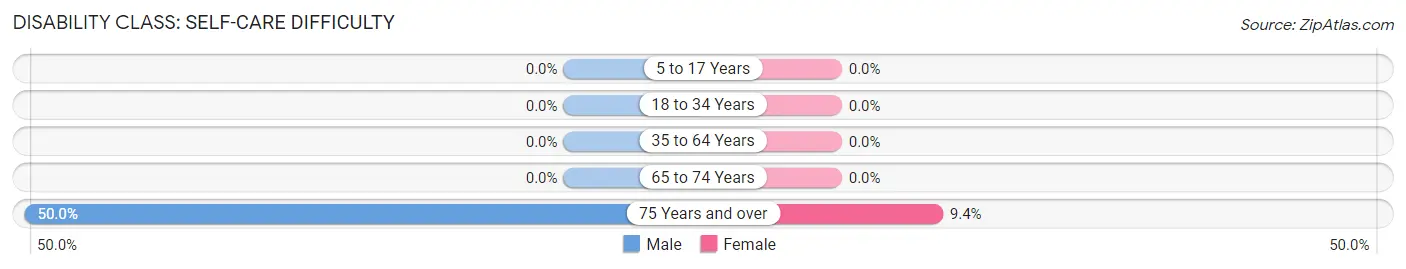
| Age Bracket | Male | Female |
| 5 to 17 Years | 0 (0.0%) | 0 (0.0%) |
| 18 to 34 Years | 0 (0.0%) | 0 (0.0%) |
| 35 to 64 Years | 0 (0.0%) | 0 (0.0%) |
| 65 to 74 Years | 0 (0.0%) | 0 (0.0%) |
| 75 Years and over | 4 (50.0%) | 3 (9.4%) |
Technology Access in Micro
Computing Device Access in Micro
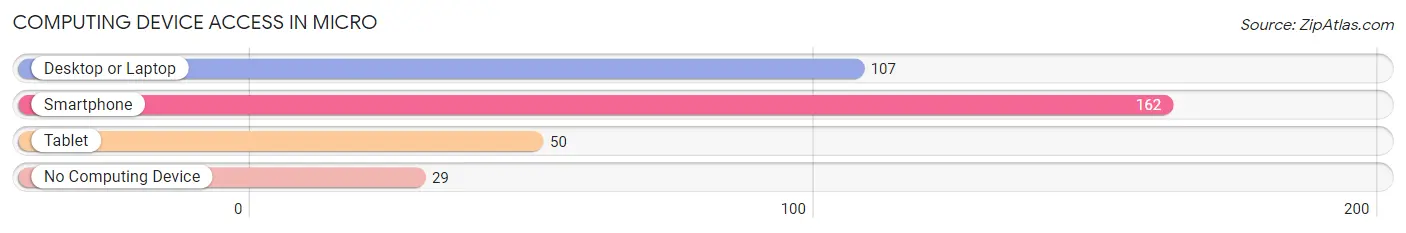
| Device Type | # Households | % Households |
| Desktop or Laptop | 107 | 55.1% |
| Smartphone | 162 | 83.5% |
| Tablet | 50 | 25.8% |
| No Computing Device | 29 | 14.9% |
| Total | 194 | 100.0% |
Internet Access in Micro
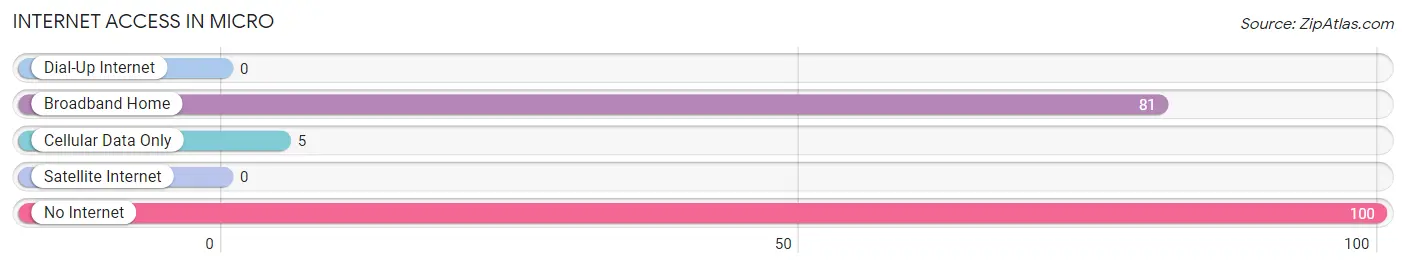
| Internet Type | # Households | % Households |
| Dial-Up Internet | 0 | 0.0% |
| Broadband Home | 81 | 41.7% |
| Cellular Data Only | 5 | 2.6% |
| Satellite Internet | 0 | 0.0% |
| No Internet | 100 | 51.5% |
| Total | 194 | 100.0% |
Micro Summary
North Carolina is a state located in the southeastern United States. It is bordered by South Carolina to the south, Georgia to the southwest, Tennessee to the west, Virginia to the north, and the Atlantic Ocean to the east. North Carolina is the 28th most populous state in the United States, with an estimated population of 10.3 million in 2019.
Geography
North Carolina is divided into three distinct geographic regions: the Coastal Plain, the Piedmont, and the Appalachian Mountains. The Coastal Plain is a low-lying region that extends from the Atlantic Ocean to the fall line, which marks the boundary between the Coastal Plain and the Piedmont. The Coastal Plain is home to the state’s largest cities, including Charlotte, Raleigh, and Wilmington. The Piedmont is a hilly region that extends from the fall line to the Blue Ridge Mountains. The Piedmont is home to the state’s capital, Raleigh, as well as the cities of Durham, Greensboro, and Winston-Salem. The Appalachian Mountains are the highest mountain range in the eastern United States and extend from the Blue Ridge Mountains to the Great Smoky Mountains.
Economy
North Carolina’s economy is largely driven by its diverse industries, including agriculture, manufacturing, technology, and tourism. Agriculture is the state’s largest industry, accounting for nearly one-third of the state’s total economic output. North Carolina is the leading producer of tobacco, sweet potatoes, and Christmas trees in the United States. Manufacturing is the second-largest industry in the state, accounting for nearly one-quarter of the state’s total economic output. North Carolina is home to a number of major manufacturing companies, including Dell, IBM, and Goodyear. Technology is the third-largest industry in the state, accounting for nearly one-fifth of the state’s total economic output. North Carolina is home to a number of major technology companies, including Apple, Google, and Microsoft. Tourism is the fourth-largest industry in the state, accounting for nearly one-tenth of the state’s total economic output. North Carolina is home to a number of popular tourist destinations, including the Outer Banks, the Blue Ridge Mountains, and the Great Smoky Mountains.
Demographics
North Carolina is a diverse state with a population that is roughly evenly divided between white and African American residents. The state’s population is also diverse in terms of age, with nearly one-third of the population under the age of 18 and nearly one-third of the population over the age of 65. The state’s population is also diverse in terms of religion, with nearly one-third of the population identifying as Christian and nearly one-third of the population identifying as non-religious.
Conclusion
North Carolina is a diverse state with a rich history, geography, economy, and demographics. The state’s economy is largely driven by its diverse industries, including agriculture, manufacturing, technology, and tourism. The state’s population is also diverse in terms of age, religion, and ethnicity. North Carolina is a vibrant and dynamic state that is sure to continue to grow and thrive in the years to come.
Common Questions
What is Per Capita Income in Micro?
Per Capita income in Micro is $30,556.
What is the Median Family Income in Micro?
Median Family Income in Micro is $75,139.
What is the Median Household income in Micro?
Median Household Income in Micro is $45,000.
What is Inequality or Gini Index in Micro?
Inequality or Gini Index in Micro is 0.47.
What is the Total Population of Micro?
Total Population of Micro is 477.
What is the Total Male Population of Micro?
Total Male Population of Micro is 212.
What is the Total Female Population of Micro?
Total Female Population of Micro is 265.
What is the Ratio of Males per 100 Females in Micro?
There are 80.00 Males per 100 Females in Micro.
What is the Ratio of Females per 100 Males in Micro?
There are 125.00 Females per 100 Males in Micro.
What is the Median Population Age in Micro?
Median Population Age in Micro is 38.7 Years.
What is the Average Family Size in Micro
Average Family Size in Micro is 3.0 People.
What is the Average Household Size in Micro
Average Household Size in Micro is 2.5 People.
How Large is the Labor Force in Micro?
There are 193 People in the Labor Forcein in Micro.
What is the Percentage of People in the Labor Force in Micro?
54.8% of People are in the Labor Force in Micro.
What is the Unemployment Rate in Micro?
Unemployment Rate in Micro is 6.2%.