Fulton, MD Map & Demographics
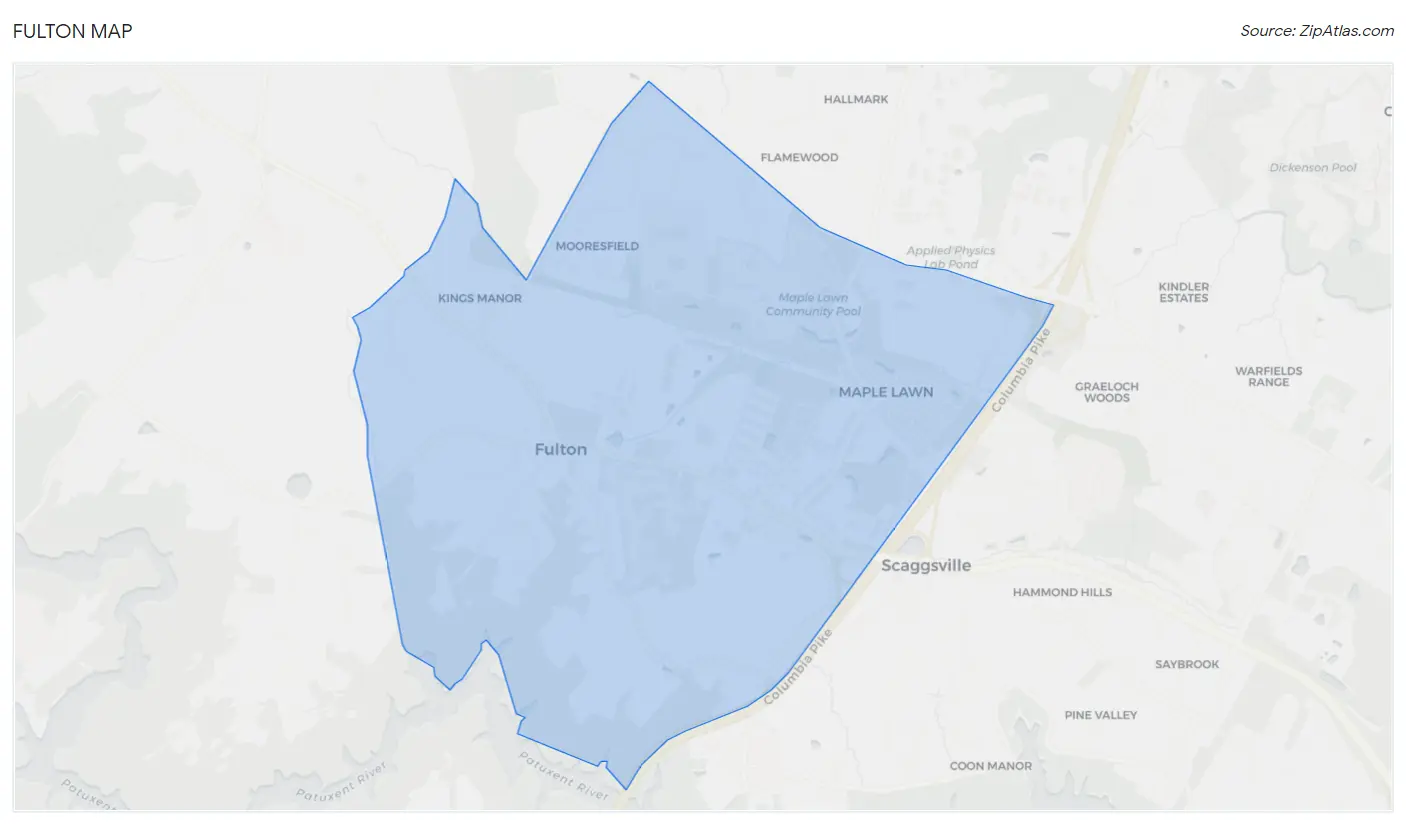
Fulton Map
Fulton Overview
$97,869
PER CAPITA INCOME
$247,019
AVG FAMILY INCOME
$215,455
AVG HOUSEHOLD INCOME
11.6%
WAGE / INCOME GAP [ % ]
88.4¢/ $1
WAGE / INCOME GAP [ $ ]
0.42
INEQUALITY / GINI INDEX
5,435
TOTAL POPULATION
2,825
MALE POPULATION
2,610
FEMALE POPULATION
108.24
MALES / 100 FEMALES
92.39
FEMALES / 100 MALES
39.3
MEDIAN AGE
3.4
AVG FAMILY SIZE
3.0
AVG HOUSEHOLD SIZE
3,017
LABOR FORCE [ PEOPLE ]
78.1%
PERCENT IN LABOR FORCE
1.2%
UNEMPLOYMENT RATE
Fulton Zip Codes
Fulton Area Codes
Income in Fulton
Income Overview in Fulton
Per Capita Income in Fulton is $97,869, while median incomes of families and households are $247,019 and $215,455 respectively.
| Characteristic | Number | Measure |
| Per Capita Income | 5,435 | $97,869 |
| Median Family Income | 1,472 | $247,019 |
| Mean Family Income | 1,472 | $319,471 |
| Median Household Income | 1,822 | $215,455 |
| Mean Household Income | 1,822 | $285,357 |
| Income Deficit | 1,472 | $0 |
| Wage / Income Gap (%) | 5,435 | 11.56% |
| Wage / Income Gap ($) | 5,435 | 88.44¢ per $1 |
| Gini / Inequality Index | 5,435 | 0.42 |
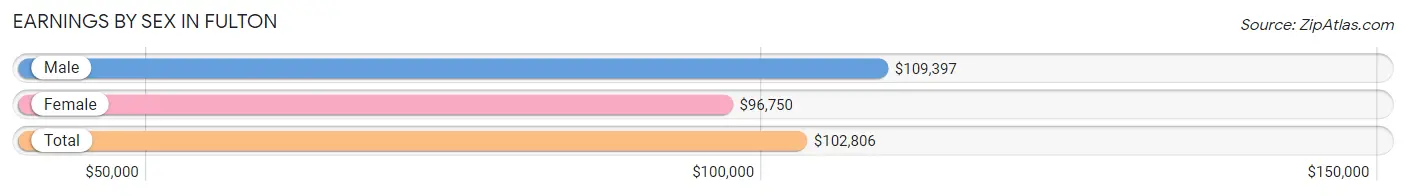
Earnings by Sex in Fulton
Average Earnings in Fulton are $102,806, $109,397 for men and $96,750 for women, a difference of 11.6%.
| Sex | Number | Average Earnings |
| Male | 1,697 (54.2%) | $109,397 |
| Female | 1,436 (45.8%) | $96,750 |
| Total | 3,133 (100.0%) | $102,806 |
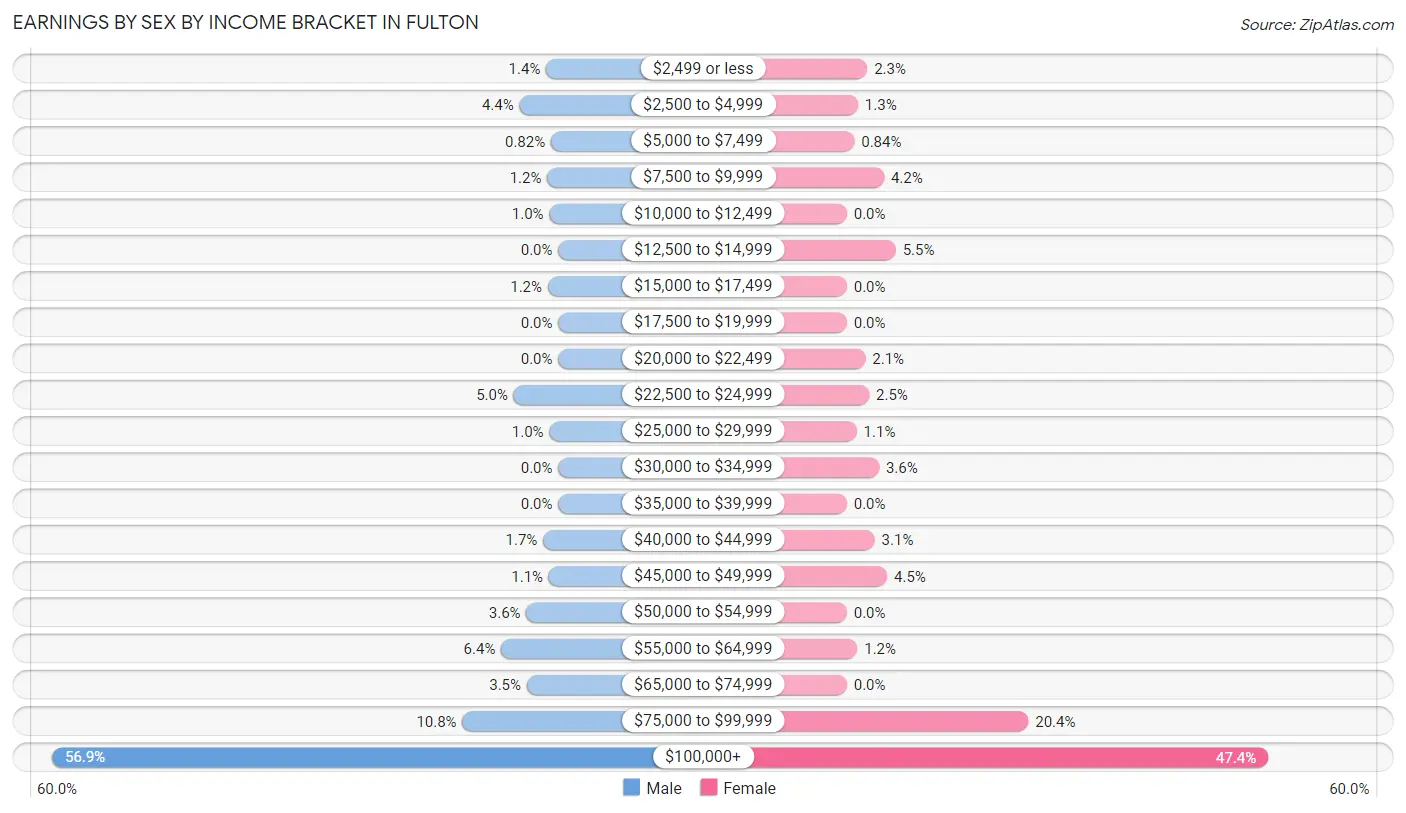
Earnings by Sex by Income Bracket in Fulton
The most common earnings brackets in Fulton are $100,000+ for men (966 | 56.9%) and $100,000+ for women (680 | 47.3%).
| Income | Male | Female |
| $2,499 or less | 23 (1.4%) | 33 (2.3%) |
| $2,500 to $4,999 | 74 (4.4%) | 18 (1.3%) |
| $5,000 to $7,499 | 14 (0.8%) | 12 (0.8%) |
| $7,500 to $9,999 | 21 (1.2%) | 60 (4.2%) |
| $10,000 to $12,499 | 17 (1.0%) | 0 (0.0%) |
| $12,500 to $14,999 | 0 (0.0%) | 79 (5.5%) |
| $15,000 to $17,499 | 20 (1.2%) | 0 (0.0%) |
| $17,500 to $19,999 | 0 (0.0%) | 0 (0.0%) |
| $20,000 to $22,499 | 0 (0.0%) | 30 (2.1%) |
| $22,500 to $24,999 | 85 (5.0%) | 36 (2.5%) |
| $25,000 to $29,999 | 17 (1.0%) | 16 (1.1%) |
| $30,000 to $34,999 | 0 (0.0%) | 52 (3.6%) |
| $35,000 to $39,999 | 0 (0.0%) | 0 (0.0%) |
| $40,000 to $44,999 | 29 (1.7%) | 45 (3.1%) |
| $45,000 to $49,999 | 18 (1.1%) | 65 (4.5%) |
| $50,000 to $54,999 | 61 (3.6%) | 0 (0.0%) |
| $55,000 to $64,999 | 109 (6.4%) | 17 (1.2%) |
| $65,000 to $74,999 | 60 (3.5%) | 0 (0.0%) |
| $75,000 to $99,999 | 183 (10.8%) | 293 (20.4%) |
| $100,000+ | 966 (56.9%) | 680 (47.3%) |
| Total | 1,697 (100.0%) | 1,436 (100.0%) |
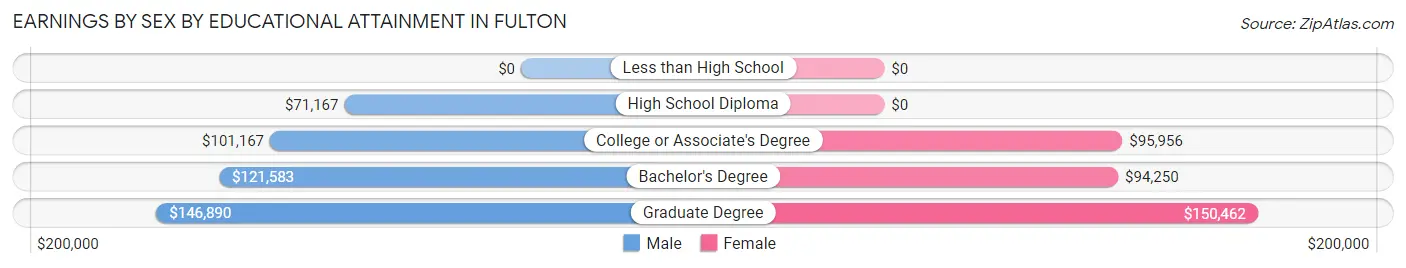
Earnings by Sex by Educational Attainment in Fulton
Average earnings in Fulton are $125,804 for men and $102,273 for women, a difference of 18.7%. Men with an educational attainment of graduate degree enjoy the highest average annual earnings of $146,890, while those with high school diploma education earn the least with $71,167. Women with an educational attainment of graduate degree earn the most with the average annual earnings of $150,462, while those with bachelor's degree education have the smallest earnings of $94,250.
| Educational Attainment | Male Income | Female Income |
| Less than High School | - | - |
| High School Diploma | $71,167 | $0 |
| College or Associate's Degree | $101,167 | $95,956 |
| Bachelor's Degree | $121,583 | $94,250 |
| Graduate Degree | $146,890 | $150,462 |
| Total | $125,804 | $102,273 |
Family Income in Fulton
Family Income Brackets in Fulton
According to the Fulton family income data, there are 882 families falling into the $200,000+ income range, which is the most common income bracket and makes up 59.9% of all families.
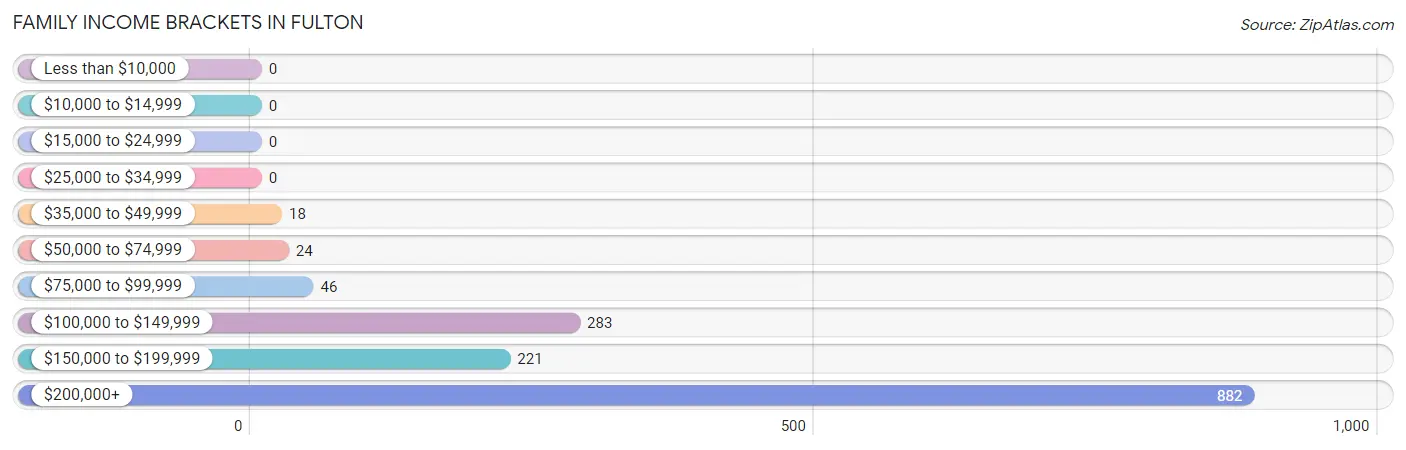
| Income Bracket | # Families | % Families |
| Less than $10,000 | 0 | 0.0% |
| $10,000 to $14,999 | 0 | 0.0% |
| $15,000 to $24,999 | 0 | 0.0% |
| $25,000 to $34,999 | 0 | 0.0% |
| $35,000 to $49,999 | 18 | 1.2% |
| $50,000 to $74,999 | 24 | 1.6% |
| $75,000 to $99,999 | 46 | 3.1% |
| $100,000 to $149,999 | 283 | 19.2% |
| $150,000 to $199,999 | 221 | 15.0% |
| $200,000+ | 882 | 59.9% |
Family Income by Famaliy Size in Fulton
4-person families (347 | 23.6%) account for the highest median family income in Fulton with $250,001 per family, while 2-person families (426 | 28.9%) have the highest median income of $103,334 per family member.
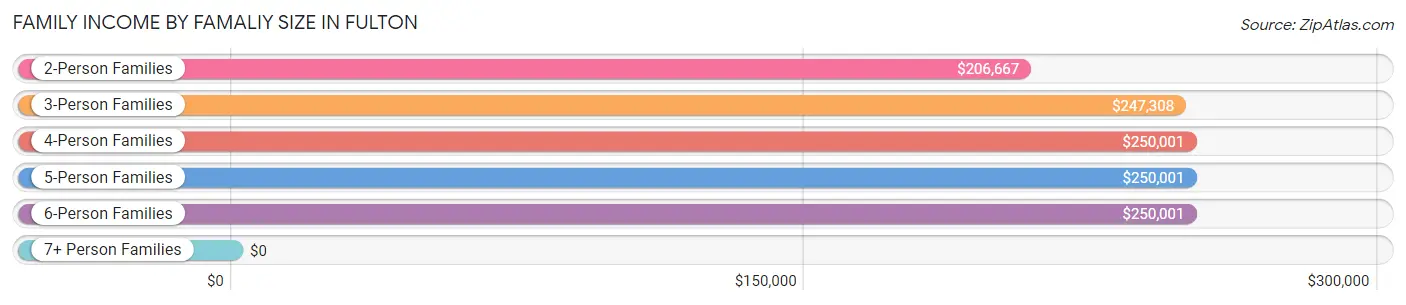
| Income Bracket | # Families | Median Income |
| 2-Person Families | 426 (28.9%) | $206,667 |
| 3-Person Families | 476 (32.3%) | $247,308 |
| 4-Person Families | 347 (23.6%) | $250,001 |
| 5-Person Families | 165 (11.2%) | $250,001 |
| 6-Person Families | 58 (3.9%) | $250,001 |
| 7+ Person Families | 0 (0.0%) | $0 |
| Total | 1,472 (100.0%) | $247,019 |
Family Income by Number of Earners in Fulton
The median family income in Fulton is $247,019, with families comprising 2 earners (803) having the highest median family income of $250,001, while families with no earners (74) have the lowest median family income of $162,566, accounting for 54.5% and 5.0% of families, respectively.
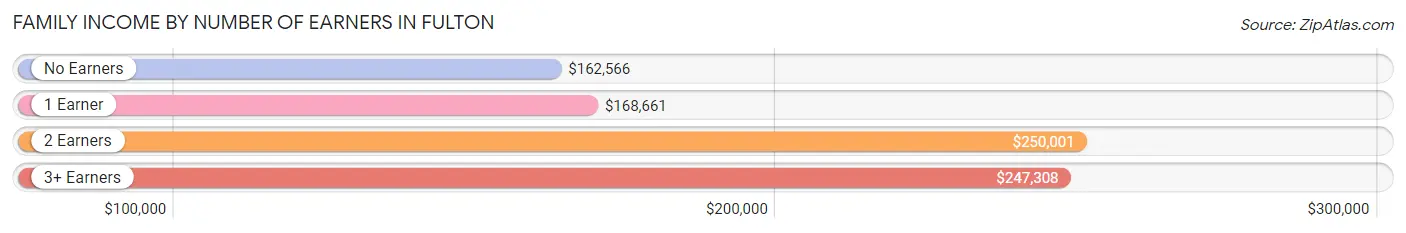
| Number of Earners | # Families | Median Income |
| No Earners | 74 (5.0%) | $162,566 |
| 1 Earner | 369 (25.1%) | $168,661 |
| 2 Earners | 803 (54.5%) | $250,001 |
| 3+ Earners | 226 (15.3%) | $247,308 |
| Total | 1,472 (100.0%) | $247,019 |
Household Income in Fulton
Household Income Brackets in Fulton
With 940 households falling in the category, the $200,000+ income range is the most frequent in Fulton, accounting for 51.6% of all households.
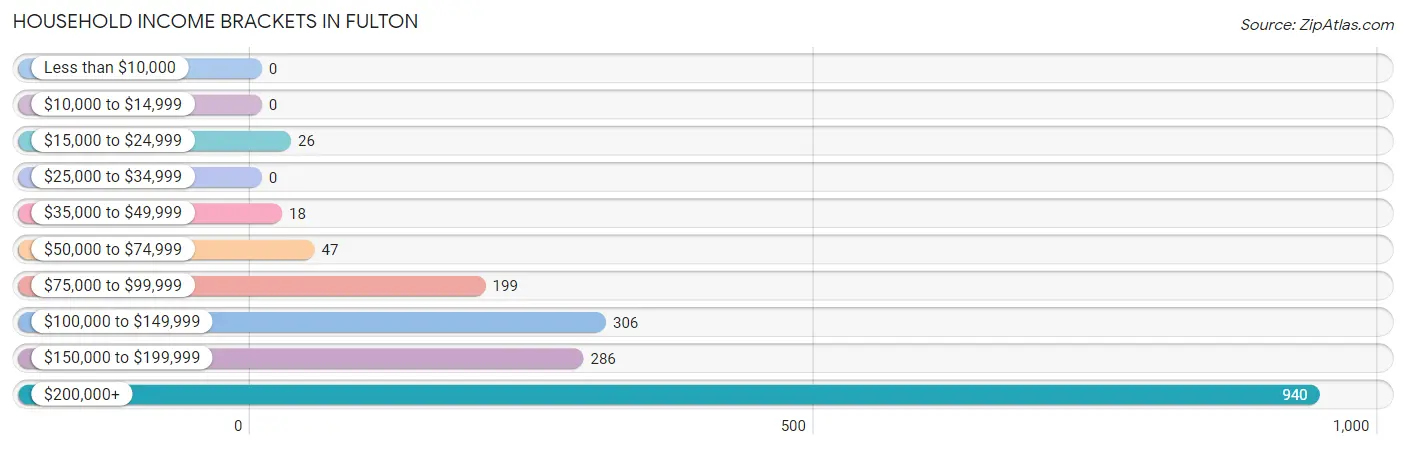
| Income Bracket | # Households | % Households |
| Less than $10,000 | 0 | 0.0% |
| $10,000 to $14,999 | 0 | 0.0% |
| $15,000 to $24,999 | 26 | 1.4% |
| $25,000 to $34,999 | 0 | 0.0% |
| $35,000 to $49,999 | 18 | 1.0% |
| $50,000 to $74,999 | 47 | 2.6% |
| $75,000 to $99,999 | 199 | 10.9% |
| $100,000 to $149,999 | 306 | 16.8% |
| $150,000 to $199,999 | 286 | 15.7% |
| $200,000+ | 940 | 51.6% |
Household Income by Householder Age in Fulton
The median household income in Fulton is $215,455, with the highest median household income of $244,618 found in the 25 to 44 years age bracket for the primary householder. A total of 751 households (41.2%) fall into this category. Meanwhile, the 15 to 24 years age bracket for the primary householder has the lowest median household income of $0, with 30 households (1.7%) in this group.
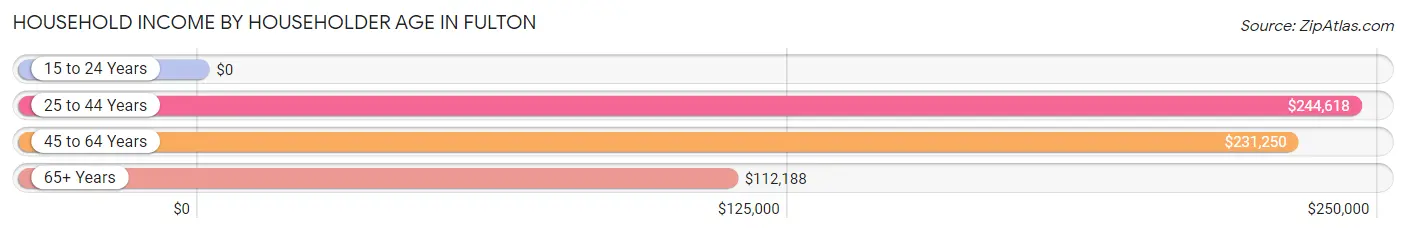
| Income Bracket | # Households | Median Income |
| 15 to 24 Years | 30 (1.7%) | $0 |
| 25 to 44 Years | 751 (41.2%) | $244,618 |
| 45 to 64 Years | 799 (43.9%) | $231,250 |
| 65+ Years | 242 (13.3%) | $112,188 |
| Total | 1,822 (100.0%) | $215,455 |
Poverty in Fulton
Income Below Poverty by Sex and Age in Fulton
With 0.1% poverty level for males and 0.1% for females among the residents of Fulton, 35 to 44 year old males and 18 to 24 year old females are the most vulnerable to poverty, with 3 males (0.5%) and 2 females (1.7%) in their respective age groups living below the poverty level.
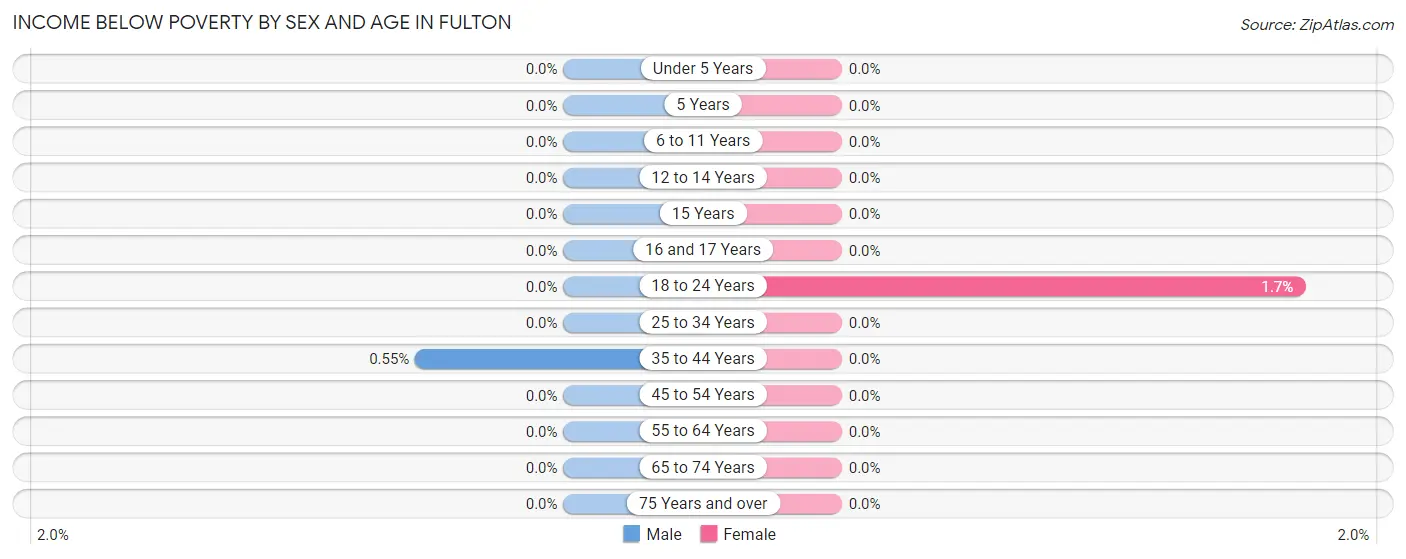
| Age Bracket | Male | Female |
| Under 5 Years | 0 (0.0%) | 0 (0.0%) |
| 5 Years | 0 (0.0%) | 0 (0.0%) |
| 6 to 11 Years | 0 (0.0%) | 0 (0.0%) |
| 12 to 14 Years | 0 (0.0%) | 0 (0.0%) |
| 15 Years | 0 (0.0%) | 0 (0.0%) |
| 16 and 17 Years | 0 (0.0%) | 0 (0.0%) |
| 18 to 24 Years | 0 (0.0%) | 2 (1.7%) |
| 25 to 34 Years | 0 (0.0%) | 0 (0.0%) |
| 35 to 44 Years | 3 (0.5%) | 0 (0.0%) |
| 45 to 54 Years | 0 (0.0%) | 0 (0.0%) |
| 55 to 64 Years | 0 (0.0%) | 0 (0.0%) |
| 65 to 74 Years | 0 (0.0%) | 0 (0.0%) |
| 75 Years and over | 0 (0.0%) | 0 (0.0%) |
| Total | 3 (0.1%) | 2 (0.1%) |
Income Above Poverty by Sex and Age in Fulton
According to the poverty statistics in Fulton, males aged under 5 years and females aged under 5 years are the age groups that are most secure financially, with 100.0% of males and 100.0% of females in these age groups living above the poverty line.
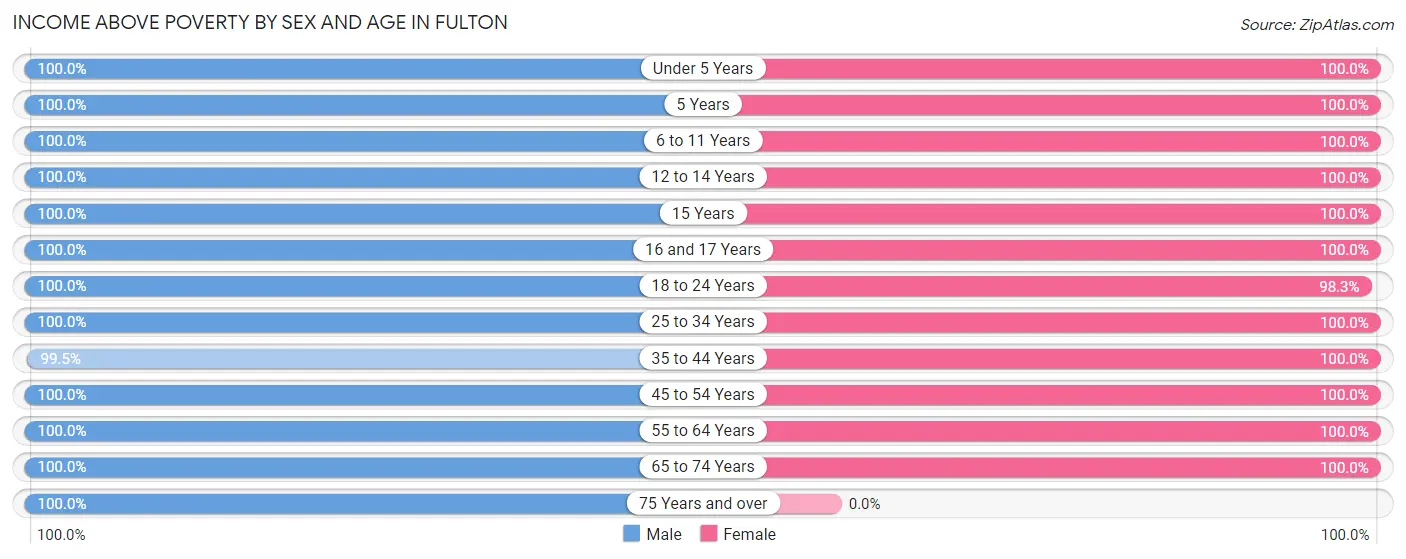
| Age Bracket | Male | Female |
| Under 5 Years | 313 (100.0%) | 179 (100.0%) |
| 5 Years | 25 (100.0%) | 20 (100.0%) |
| 6 to 11 Years | 319 (100.0%) | 315 (100.0%) |
| 12 to 14 Years | 82 (100.0%) | 97 (100.0%) |
| 15 Years | 124 (100.0%) | 71 (100.0%) |
| 16 and 17 Years | 77 (100.0%) | 42 (100.0%) |
| 18 to 24 Years | 186 (100.0%) | 114 (98.3%) |
| 25 to 34 Years | 232 (100.0%) | 217 (100.0%) |
| 35 to 44 Years | 543 (99.5%) | 560 (100.0%) |
| 45 to 54 Years | 335 (100.0%) | 485 (100.0%) |
| 55 to 64 Years | 311 (100.0%) | 270 (100.0%) |
| 65 to 74 Years | 118 (100.0%) | 225 (100.0%) |
| 75 Years and over | 129 (100.0%) | 0 (0.0%) |
| Total | 2,794 (99.9%) | 2,595 (99.9%) |
Income Below Poverty Among Married-Couple Families in Fulton
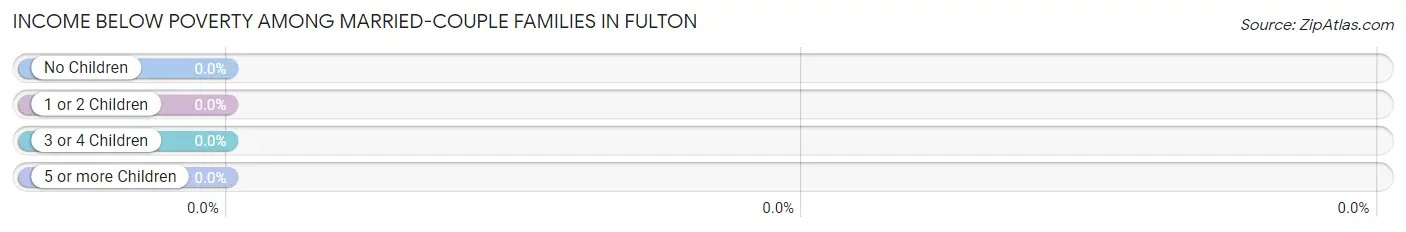
| Children | Above Poverty | Below Poverty |
| No Children | 465 (100.0%) | 0 (0.0%) |
| 1 or 2 Children | 637 (100.0%) | 0 (0.0%) |
| 3 or 4 Children | 145 (100.0%) | 0 (0.0%) |
| 5 or more Children | 0 (0.0%) | 0 (0.0%) |
| Total | 1,247 (100.0%) | 0 (0.0%) |
Income Below Poverty Among Single-Parent Households in Fulton
| Children | Single Father | Single Mother |
| No Children | 0 (0.0%) | 0 (0.0%) |
| 1 or 2 Children | 0 (0.0%) | 0 (0.0%) |
| 3 or 4 Children | 0 (0.0%) | 0 (0.0%) |
| 5 or more Children | 0 (0.0%) | 0 (0.0%) |
| Total | 0 (0.0%) | 0 (0.0%) |
Income Below Poverty Among Married-Couple vs Single-Parent Households in Fulton
| Children | Married-Couple Families | Single-Parent Households |
| No Children | 0 (0.0%) | 0 (0.0%) |
| 1 or 2 Children | 0 (0.0%) | 0 (0.0%) |
| 3 or 4 Children | 0 (0.0%) | 0 (0.0%) |
| 5 or more Children | 0 (0.0%) | 0 (0.0%) |
| Total | 0 (0.0%) | 0 (0.0%) |
Race in Fulton
The most populous races in Fulton are White / Caucasian (2,751 | 50.6%), Asian (1,220 | 22.5%), and Black / African American (829 | 15.2%).
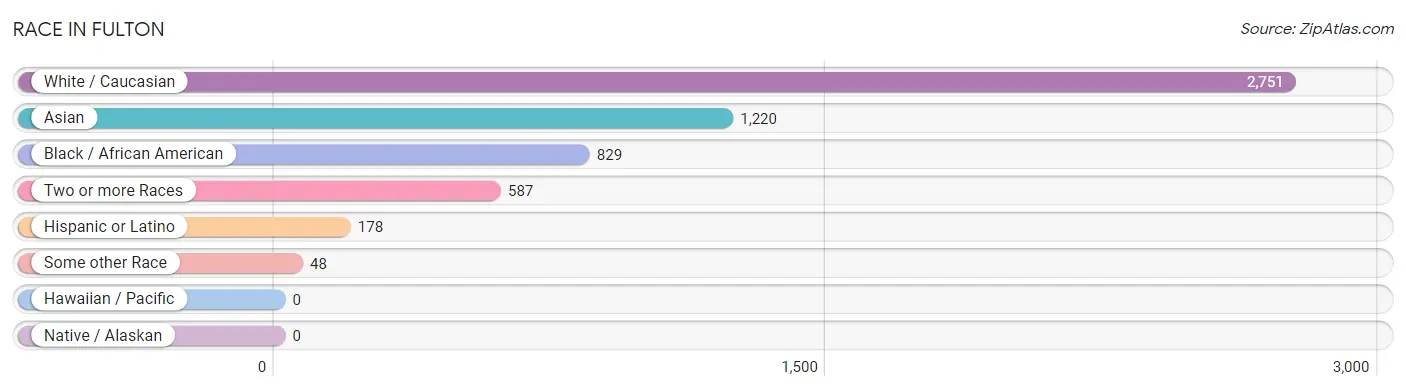
| Race | # Population | % Population |
| Asian | 1,220 | 22.5% |
| Black / African American | 829 | 15.2% |
| Hawaiian / Pacific | 0 | 0.0% |
| Hispanic or Latino | 178 | 3.3% |
| Native / Alaskan | 0 | 0.0% |
| White / Caucasian | 2,751 | 50.6% |
| Two or more Races | 587 | 10.8% |
| Some other Race | 48 | 0.9% |
| Total | 5,435 | 100.0% |
Ancestry in Fulton
The most populous ancestries reported in Fulton are German (909 | 16.7%), Irish (684 | 12.6%), Burmese (660 | 12.1%), Italian (643 | 11.8%), and Indian (Asian) (303 | 5.6%), together accounting for 58.9% of all Fulton residents.
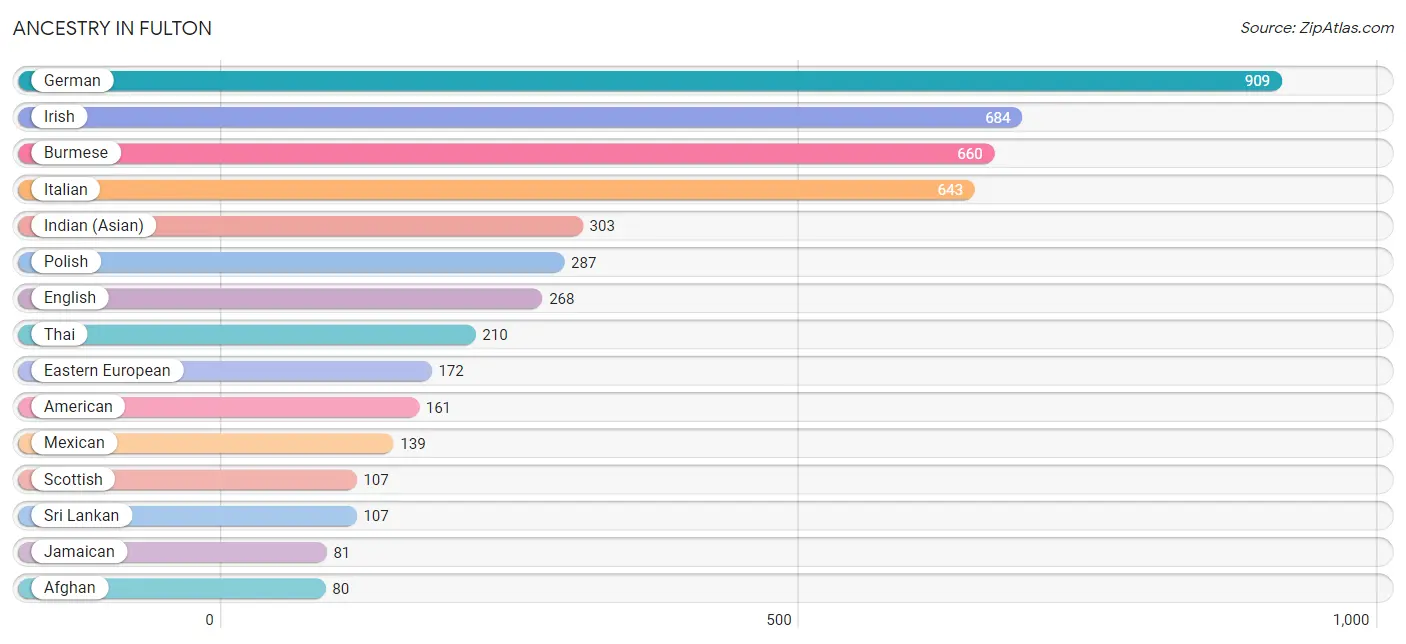
| Ancestry | # Population | % Population |
| Afghan | 80 | 1.5% |
| American | 161 | 3.0% |
| Austrian | 57 | 1.1% |
| Bhutanese | 79 | 1.5% |
| Brazilian | 17 | 0.3% |
| Burmese | 660 | 12.1% |
| Cajun | 9 | 0.2% |
| Central American | 24 | 0.4% |
| Cherokee | 36 | 0.7% |
| Czech | 15 | 0.3% |
| Eastern European | 172 | 3.2% |
| English | 268 | 4.9% |
| European | 78 | 1.4% |
| French | 53 | 1.0% |
| French Canadian | 3 | 0.1% |
| German | 909 | 16.7% |
| Guyanese | 50 | 0.9% |
| Indian (Asian) | 303 | 5.6% |
| Irish | 684 | 12.6% |
| Italian | 643 | 11.8% |
| Jamaican | 81 | 1.5% |
| Japanese | 27 | 0.5% |
| Korean | 36 | 0.7% |
| Latvian | 30 | 0.5% |
| Mexican | 139 | 2.6% |
| Norwegian | 61 | 1.1% |
| Panamanian | 24 | 0.4% |
| Polish | 287 | 5.3% |
| Portuguese | 15 | 0.3% |
| Russian | 77 | 1.4% |
| Scotch-Irish | 13 | 0.2% |
| Scottish | 107 | 2.0% |
| Slavic | 1 | 0.0% |
| Spanish | 15 | 0.3% |
| Sri Lankan | 107 | 2.0% |
| Swedish | 31 | 0.6% |
| Thai | 210 | 3.9% |
| Ukrainian | 20 | 0.4% |
| Welsh | 35 | 0.6% | View All 39 Rows |
Immigrants in Fulton
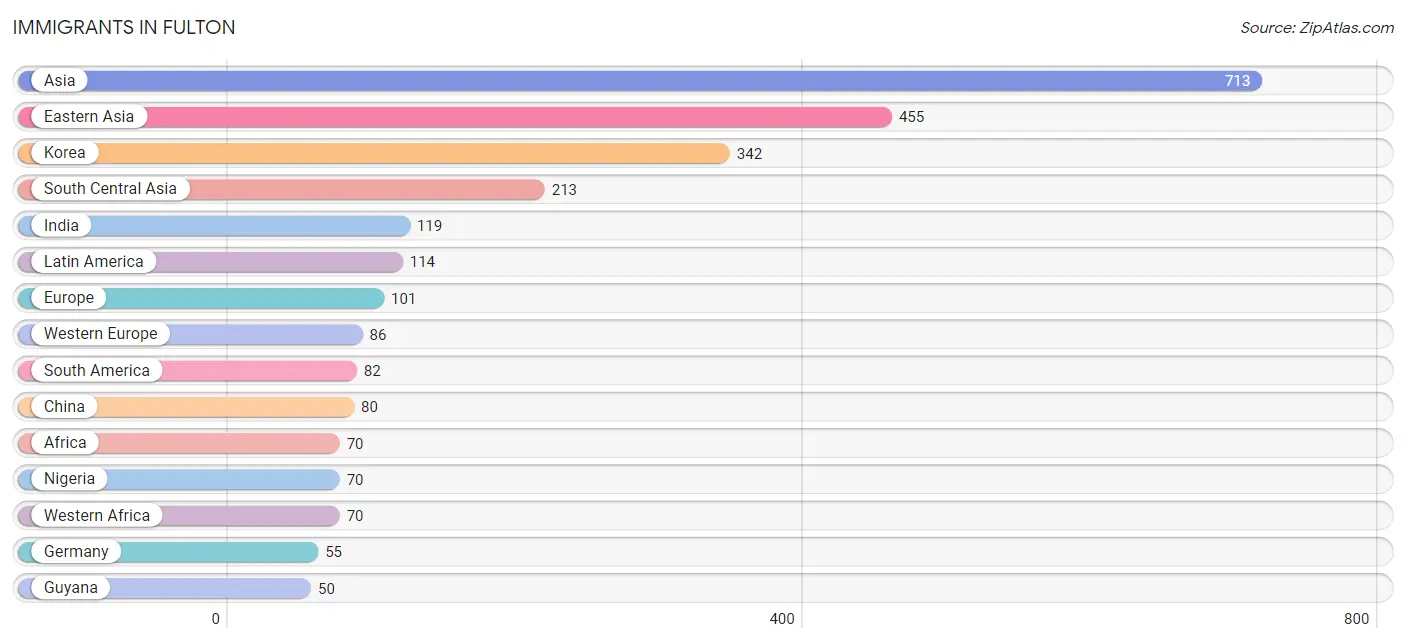
The most numerous immigrant groups reported in Fulton came from Asia (713 | 13.1%), Eastern Asia (455 | 8.4%), Korea (342 | 6.3%), South Central Asia (213 | 3.9%), and India (119 | 2.2%), together accounting for 33.9% of all Fulton residents.
| Immigration Origin | # Population | % Population |
| Afghanistan | 18 | 0.3% |
| Africa | 70 | 1.3% |
| Asia | 713 | 13.1% |
| Austria | 31 | 0.6% |
| Brazil | 32 | 0.6% |
| Canada | 20 | 0.4% |
| Caribbean | 32 | 0.6% |
| China | 80 | 1.5% |
| Eastern Asia | 455 | 8.4% |
| Europe | 101 | 1.9% |
| Germany | 55 | 1.0% |
| Guyana | 50 | 0.9% |
| Hong Kong | 12 | 0.2% |
| India | 119 | 2.2% |
| Indonesia | 7 | 0.1% |
| Jamaica | 32 | 0.6% |
| Japan | 33 | 0.6% |
| Kazakhstan | 29 | 0.5% |
| Korea | 342 | 6.3% |
| Latin America | 114 | 2.1% |
| Nepal | 31 | 0.6% |
| Nigeria | 70 | 1.3% |
| Northern Europe | 15 | 0.3% |
| South America | 82 | 1.5% |
| South Central Asia | 213 | 3.9% |
| South Eastern Asia | 45 | 0.8% |
| Taiwan | 31 | 0.6% |
| Vietnam | 38 | 0.7% |
| Western Africa | 70 | 1.3% |
| Western Europe | 86 | 1.6% | View All 30 Rows |
Sex and Age in Fulton
Sex and Age in Fulton
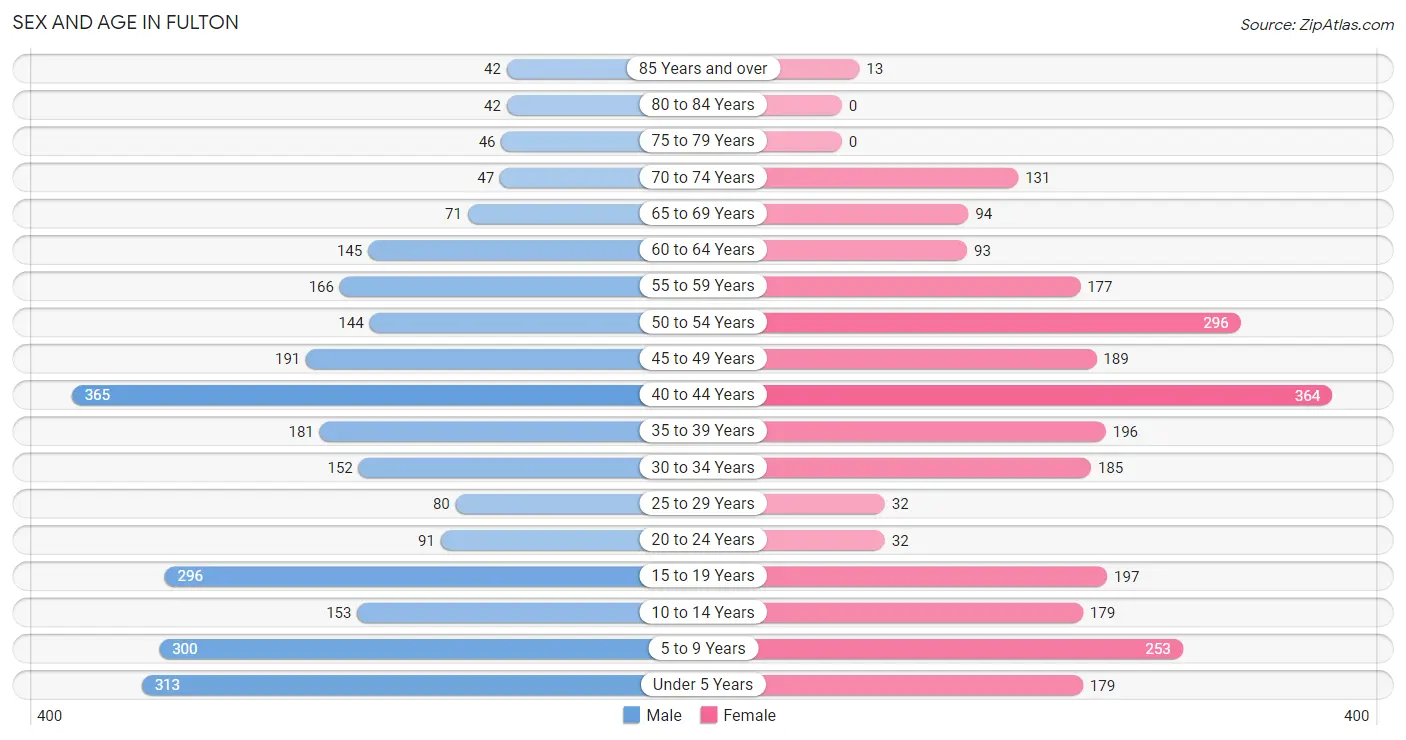
The most populous age groups in Fulton are 40 to 44 Years (365 | 12.9%) for men and 40 to 44 Years (364 | 14.0%) for women.
| Age Bracket | Male | Female |
| Under 5 Years | 313 (11.1%) | 179 (6.9%) |
| 5 to 9 Years | 300 (10.6%) | 253 (9.7%) |
| 10 to 14 Years | 153 (5.4%) | 179 (6.9%) |
| 15 to 19 Years | 296 (10.5%) | 197 (7.5%) |
| 20 to 24 Years | 91 (3.2%) | 32 (1.2%) |
| 25 to 29 Years | 80 (2.8%) | 32 (1.2%) |
| 30 to 34 Years | 152 (5.4%) | 185 (7.1%) |
| 35 to 39 Years | 181 (6.4%) | 196 (7.5%) |
| 40 to 44 Years | 365 (12.9%) | 364 (14.0%) |
| 45 to 49 Years | 191 (6.8%) | 189 (7.2%) |
| 50 to 54 Years | 144 (5.1%) | 296 (11.3%) |
| 55 to 59 Years | 166 (5.9%) | 177 (6.8%) |
| 60 to 64 Years | 145 (5.1%) | 93 (3.6%) |
| 65 to 69 Years | 71 (2.5%) | 94 (3.6%) |
| 70 to 74 Years | 47 (1.7%) | 131 (5.0%) |
| 75 to 79 Years | 46 (1.6%) | 0 (0.0%) |
| 80 to 84 Years | 42 (1.5%) | 0 (0.0%) |
| 85 Years and over | 42 (1.5%) | 13 (0.5%) |
| Total | 2,825 (100.0%) | 2,610 (100.0%) |
Families and Households in Fulton
Median Family Size in Fulton
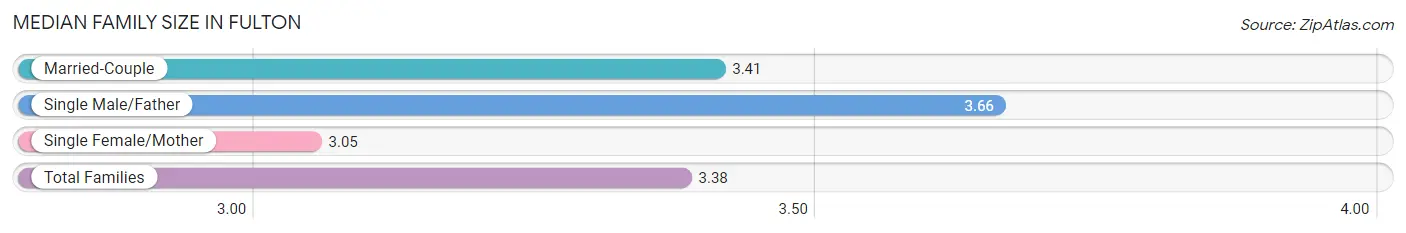
The median family size in Fulton is 3.38 persons per family, with single male/father families (41 | 2.8%) accounting for the largest median family size of 3.66 persons per family. On the other hand, single female/mother families (184 | 12.5%) represent the smallest median family size with 3.05 persons per family.
| Family Type | # Families | Family Size |
| Married-Couple | 1,247 (84.7%) | 3.41 |
| Single Male/Father | 41 (2.8%) | 3.66 |
| Single Female/Mother | 184 (12.5%) | 3.05 |
| Total Families | 1,472 (100.0%) | 3.38 |
Median Household Size in Fulton
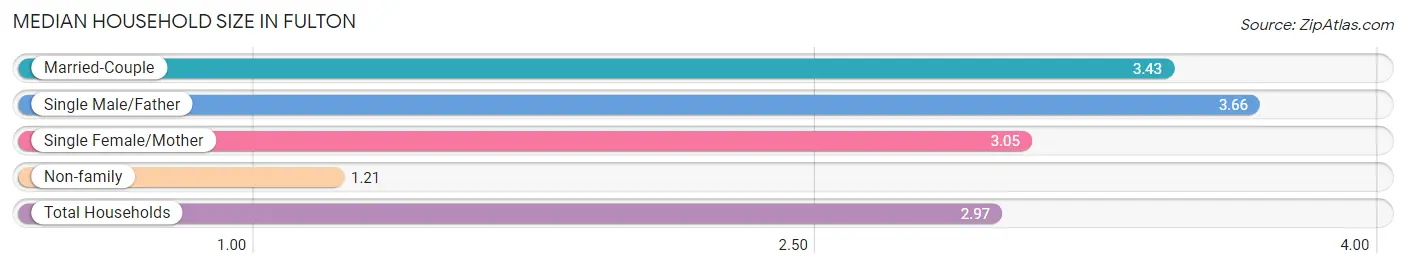
The median household size in Fulton is 2.97 persons per household, with single male/father households (41 | 2.2%) accounting for the largest median household size of 3.66 persons per household. non-family households (350 | 19.2%) represent the smallest median household size with 1.21 persons per household.
| Household Type | # Households | Household Size |
| Married-Couple | 1,247 (68.4%) | 3.43 |
| Single Male/Father | 41 (2.2%) | 3.66 |
| Single Female/Mother | 184 (10.1%) | 3.05 |
| Non-family | 350 (19.2%) | 1.21 |
| Total Households | 1,822 (100.0%) | 2.97 |
Household Size by Marriage Status in Fulton
Out of a total of 1,822 households in Fulton, 1,472 (80.8%) are family households, while 350 (19.2%) are nonfamily households. The most numerous type of family households are 3-person households, comprising 476, and the most common type of nonfamily households are 1-person households, comprising 301.
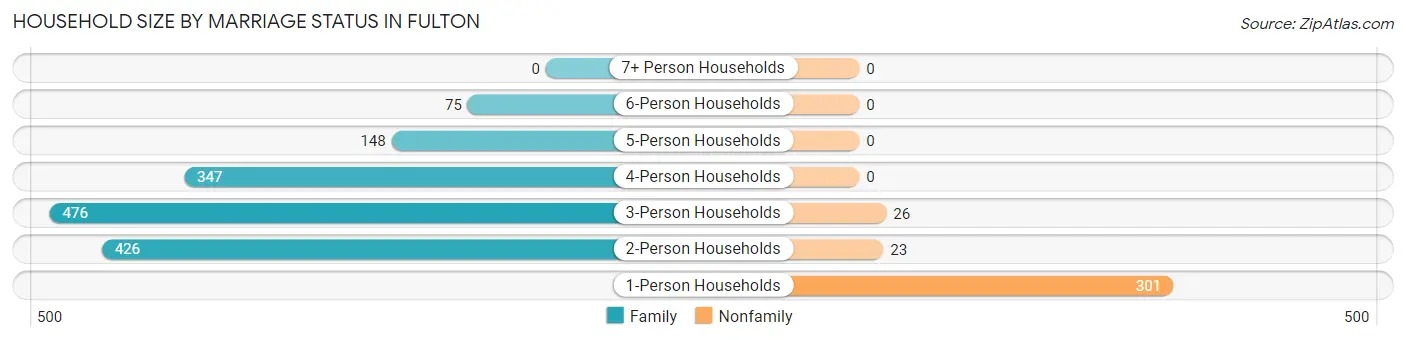
| Household Size | Family Households | Nonfamily Households |
| 1-Person Households | - | 301 (16.5%) |
| 2-Person Households | 426 (23.4%) | 23 (1.3%) |
| 3-Person Households | 476 (26.1%) | 26 (1.4%) |
| 4-Person Households | 347 (19.1%) | 0 (0.0%) |
| 5-Person Households | 148 (8.1%) | 0 (0.0%) |
| 6-Person Households | 75 (4.1%) | 0 (0.0%) |
| 7+ Person Households | 0 (0.0%) | 0 (0.0%) |
| Total | 1,472 (80.8%) | 350 (19.2%) |
Female Fertility in Fulton
Fertility by Age in Fulton
Average fertility rate in Fulton is 72.0 births per 1,000 women. Women in the age bracket of 20 to 34 years have the highest fertility rate with 201.0 births per 1,000 women. Women in the age bracket of 20 to 34 years acount for 56.2% of all women with births.
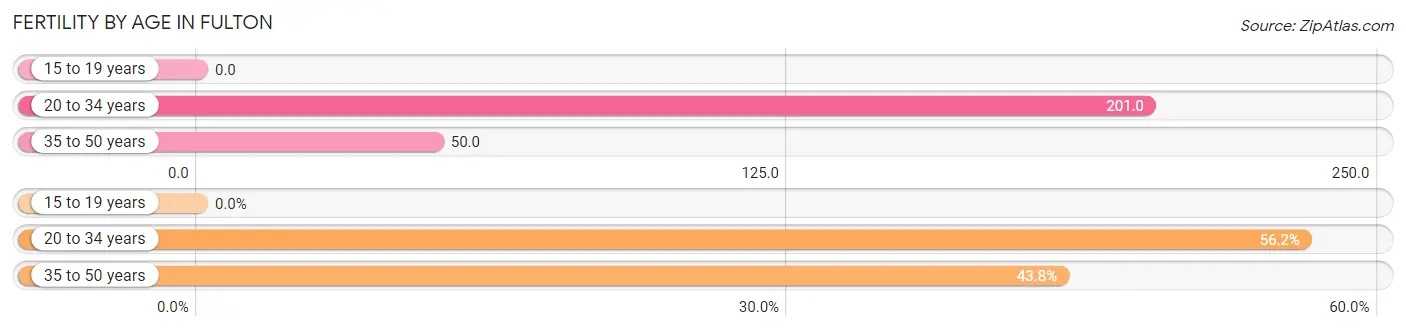
| Age Bracket | Women with Births | Births / 1,000 Women |
| 15 to 19 years | 0 (0.0%) | 0.0 |
| 20 to 34 years | 50 (56.2%) | 201.0 |
| 35 to 50 years | 39 (43.8%) | 50.0 |
| Total | 89 (100.0%) | 72.0 |
Fertility by Age by Marriage Status in Fulton
71.9% of women with births (89) in Fulton are married. The highest percentage of unmarried women with births falls into 35 to 50 years age bracket with 64.1% of them unmarried at the time of birth, while the lowest percentage of unmarried women with births belong to 20 to 34 years age bracket with 0.0% of them unmarried.
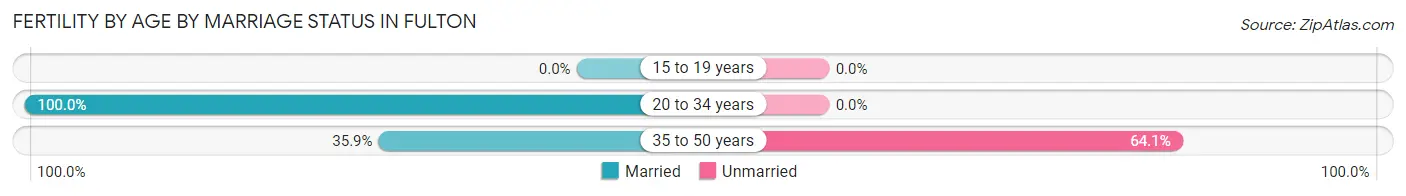
| Age Bracket | Married | Unmarried |
| 15 to 19 years | 0 (0.0%) | 0 (0.0%) |
| 20 to 34 years | 50 (100.0%) | 0 (0.0%) |
| 35 to 50 years | 14 (35.9%) | 25 (64.1%) |
| Total | 64 (71.9%) | 25 (28.1%) |
Fertility by Education in Fulton
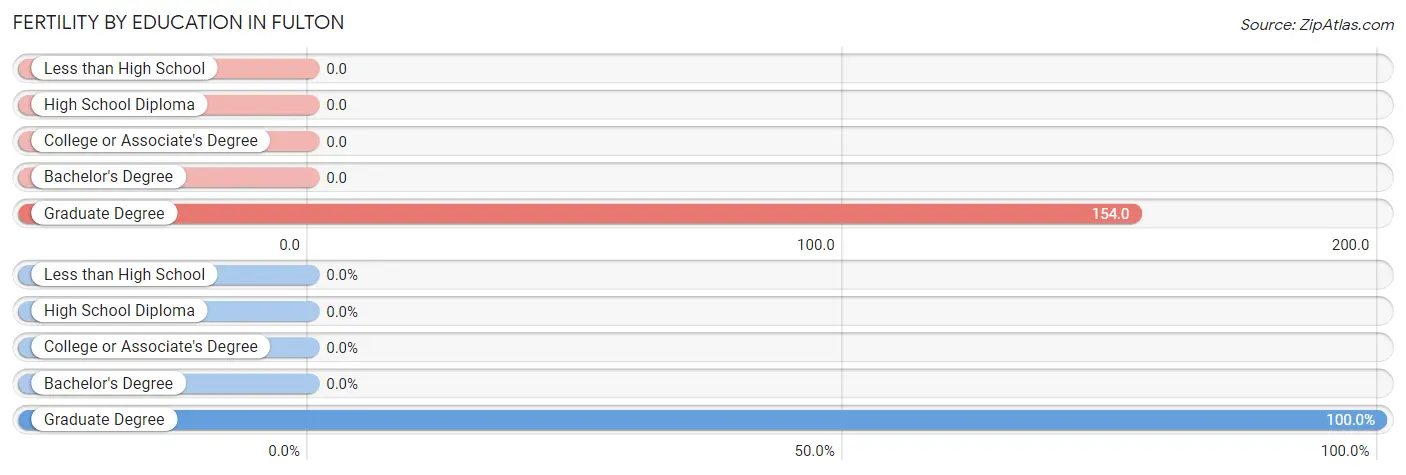
| Educational Attainment | Women with Births | Births / 1,000 Women |
| Less than High School | 0 (0.0%) | 0.0 |
| High School Diploma | 0 (0.0%) | 0.0 |
| College or Associate's Degree | 0 (0.0%) | 0.0 |
| Bachelor's Degree | 0 (0.0%) | 0.0 |
| Graduate Degree | 89 (100.0%) | 154.0 |
| Total | 89 (100.0%) | 72.0 |
Fertility by Education by Marriage Status in Fulton
28.1% of women with births in Fulton are unmarried. Women with the educational attainment of graduate degree are most likely to be married with 71.9% of them married at childbirth, while women with the educational attainment of graduate degree are least likely to be married with 28.1% of them unmarried at childbirth.
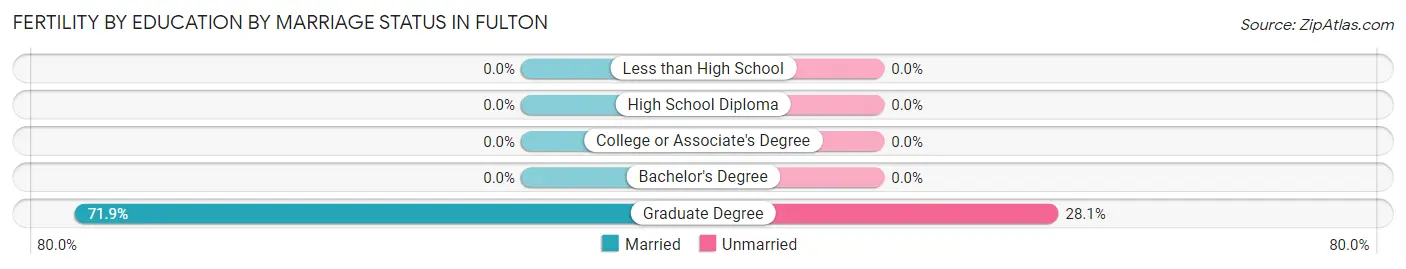
| Educational Attainment | Married | Unmarried |
| Less than High School | 0 (0.0%) | 0 (0.0%) |
| High School Diploma | 0 (0.0%) | 0 (0.0%) |
| College or Associate's Degree | 0 (0.0%) | 0 (0.0%) |
| Bachelor's Degree | 0 (0.0%) | 0 (0.0%) |
| Graduate Degree | 64 (71.9%) | 25 (28.1%) |
| Total | 64 (71.9%) | 25 (28.1%) |
Employment Characteristics in Fulton
Employment by Class of Employer in Fulton
Among the 2,929 employed individuals in Fulton, private company employees (1,423 | 48.6%), not-for-profit organizations (460 | 15.7%), and federal government employees (365 | 12.5%) make up the most common classes of employment.
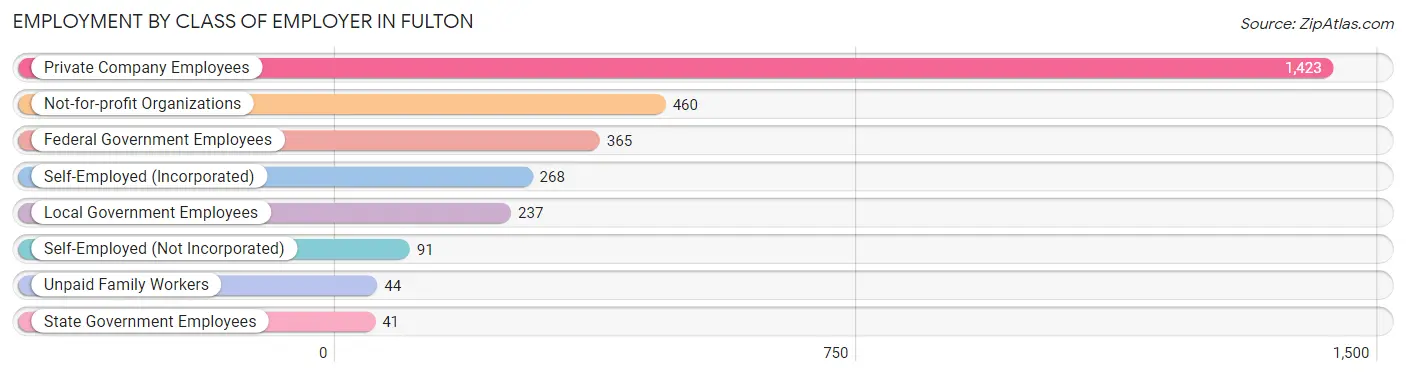
| Employer Class | # Employees | % Employees |
| Private Company Employees | 1,423 | 48.6% |
| Self-Employed (Incorporated) | 268 | 9.1% |
| Self-Employed (Not Incorporated) | 91 | 3.1% |
| Not-for-profit Organizations | 460 | 15.7% |
| Local Government Employees | 237 | 8.1% |
| State Government Employees | 41 | 1.4% |
| Federal Government Employees | 365 | 12.5% |
| Unpaid Family Workers | 44 | 1.5% |
| Total | 2,929 | 100.0% |
Employment Status by Age in Fulton
According to the labor force statistics for Fulton, out of the total population over 16 years of age (3,863), 78.1% or 3,017 individuals are in the labor force, with 1.2% or 36 of them unemployed. The age group with the highest labor force participation rate is 20 to 24 years, with 100.0% or 123 individuals in the labor force. Within the labor force, the 16 to 19 years age range has the highest percentage of unemployed individuals, with 16.8% or 33 of them being unemployed.
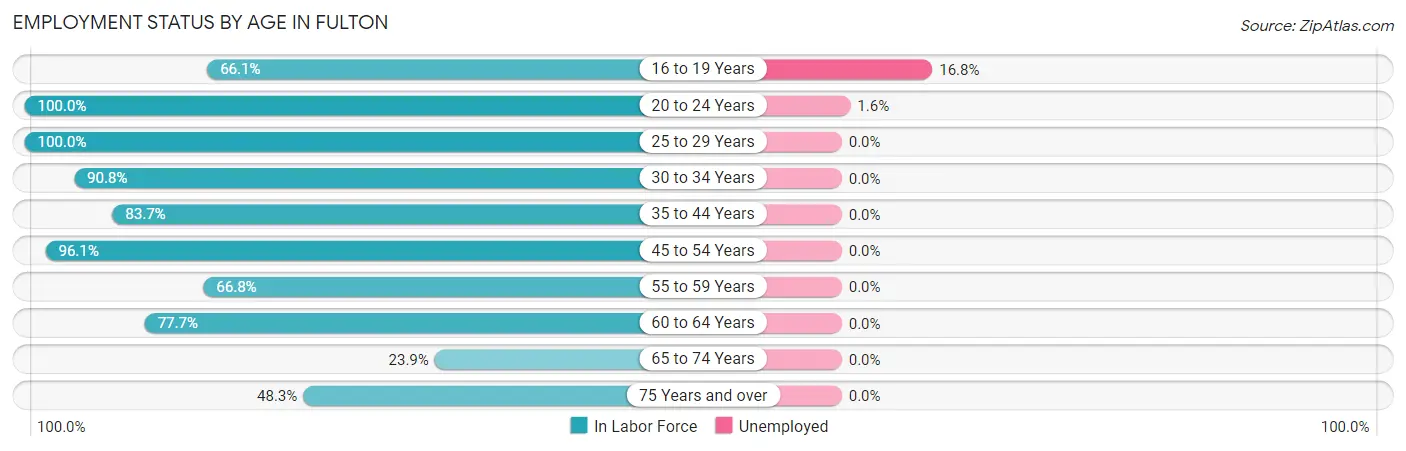
| Age Bracket | In Labor Force | Unemployed |
| 16 to 19 Years | 197 (66.1%) | 33 (16.8%) |
| 20 to 24 Years | 123 (100.0%) | 2 (1.6%) |
| 25 to 29 Years | 112 (100.0%) | 0 (0.0%) |
| 30 to 34 Years | 306 (90.8%) | 0 (0.0%) |
| 35 to 44 Years | 926 (83.7%) | 0 (0.0%) |
| 45 to 54 Years | 788 (96.1%) | 0 (0.0%) |
| 55 to 59 Years | 229 (66.8%) | 0 (0.0%) |
| 60 to 64 Years | 185 (77.7%) | 0 (0.0%) |
| 65 to 74 Years | 82 (23.9%) | 0 (0.0%) |
| 75 Years and over | 69 (48.3%) | 0 (0.0%) |
| Total | 3,017 (78.1%) | 36 (1.2%) |
Employment Status by Educational Attainment in Fulton
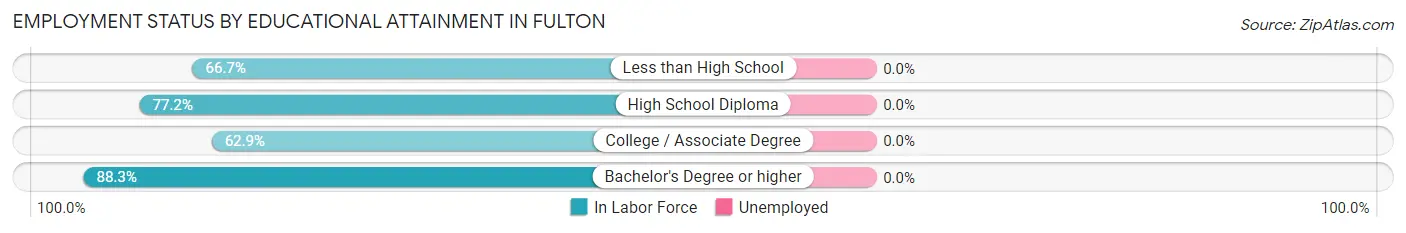
| Educational Attainment | In Labor Force | Unemployed |
| Less than High School | 16 (66.7%) | 0 (0.0%) |
| High School Diploma | 105 (77.2%) | 0 (0.0%) |
| College / Associate Degree | 112 (62.9%) | 0 (0.0%) |
| Bachelor's Degree or higher | 2,312 (88.3%) | 0 (0.0%) |
| Total | 2,545 (86.1%) | 0 (0.0%) |
Employment Occupations by Sex in Fulton
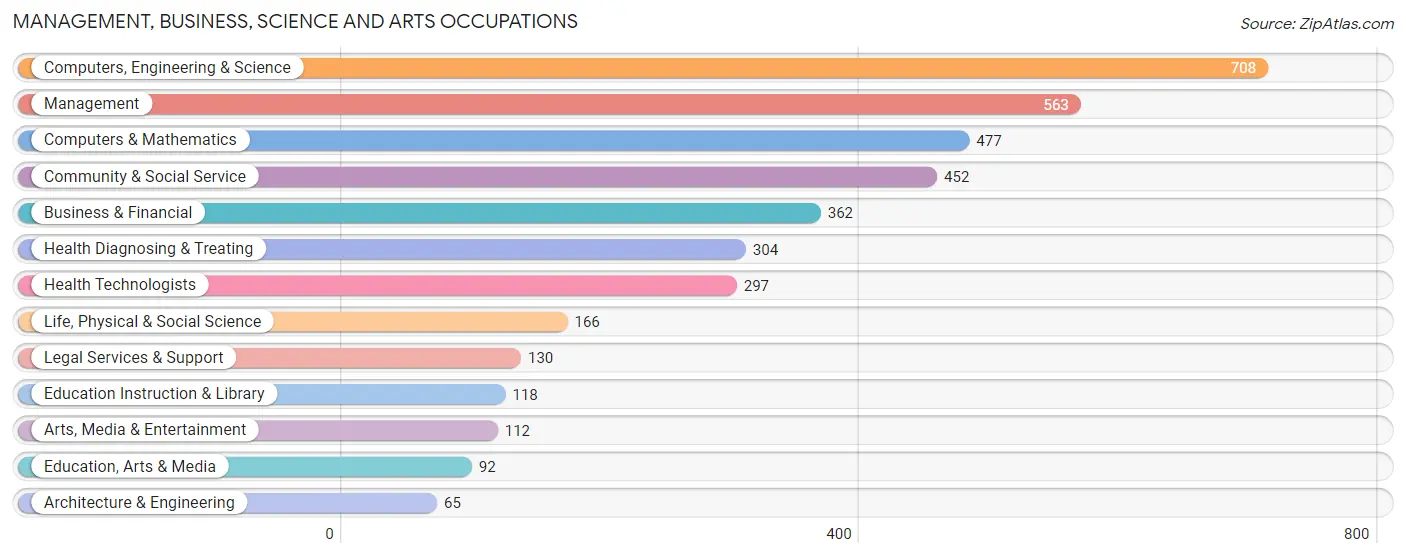
Management, Business, Science and Arts Occupations
The most common Management, Business, Science and Arts occupations in Fulton are Computers, Engineering & Science (708 | 23.7%), Management (563 | 18.9%), Computers & Mathematics (477 | 16.0%), Community & Social Service (452 | 15.2%), and Business & Financial (362 | 12.1%).
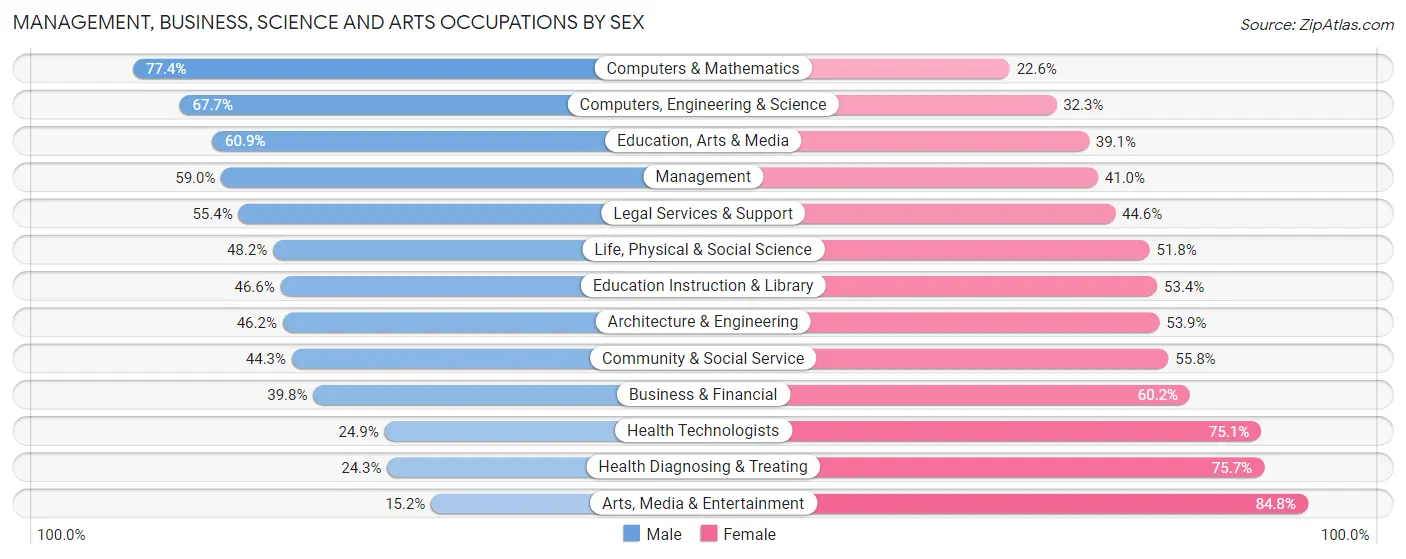
Management, Business, Science and Arts Occupations by Sex
Within the Management, Business, Science and Arts occupations in Fulton, the most male-oriented occupations are Computers & Mathematics (77.4%), Computers, Engineering & Science (67.7%), and Education, Arts & Media (60.9%), while the most female-oriented occupations are Arts, Media & Entertainment (84.8%), Health Diagnosing & Treating (75.7%), and Health Technologists (75.1%).
| Occupation | Male | Female |
| Management | 332 (59.0%) | 231 (41.0%) |
| Business & Financial | 144 (39.8%) | 218 (60.2%) |
| Computers, Engineering & Science | 479 (67.7%) | 229 (32.3%) |
| Computers & Mathematics | 369 (77.4%) | 108 (22.6%) |
| Architecture & Engineering | 30 (46.2%) | 35 (53.8%) |
| Life, Physical & Social Science | 80 (48.2%) | 86 (51.8%) |
| Community & Social Service | 200 (44.3%) | 252 (55.7%) |
| Education, Arts & Media | 56 (60.9%) | 36 (39.1%) |
| Legal Services & Support | 72 (55.4%) | 58 (44.6%) |
| Education Instruction & Library | 55 (46.6%) | 63 (53.4%) |
| Arts, Media & Entertainment | 17 (15.2%) | 95 (84.8%) |
| Health Diagnosing & Treating | 74 (24.3%) | 230 (75.7%) |
| Health Technologists | 74 (24.9%) | 223 (75.1%) |
| Total (Category) | 1,229 (51.4%) | 1,160 (48.6%) |
| Total (Overall) | 1,586 (53.2%) | 1,396 (46.8%) |
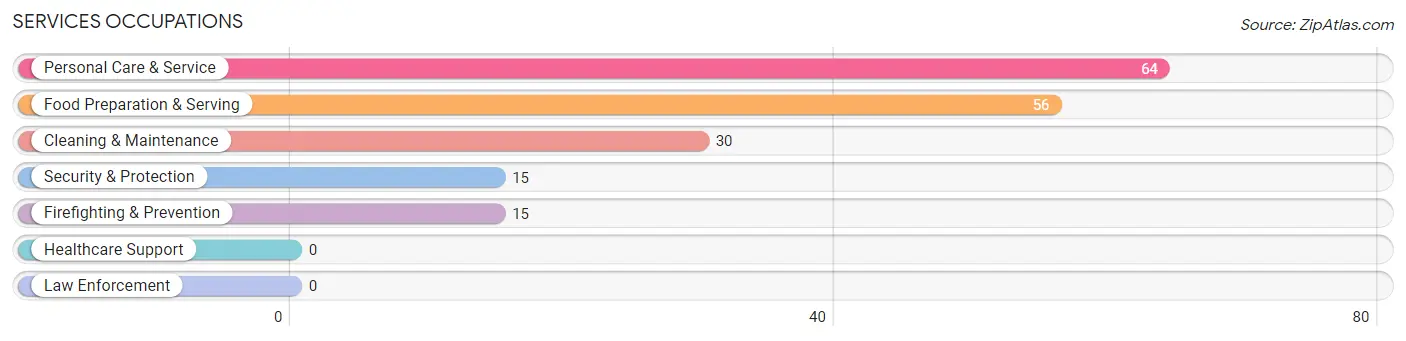
Services Occupations
The most common Services occupations in Fulton are Personal Care & Service (64 | 2.1%), Food Preparation & Serving (56 | 1.9%), Cleaning & Maintenance (30 | 1.0%), Security & Protection (15 | 0.5%), and Firefighting & Prevention (15 | 0.5%).
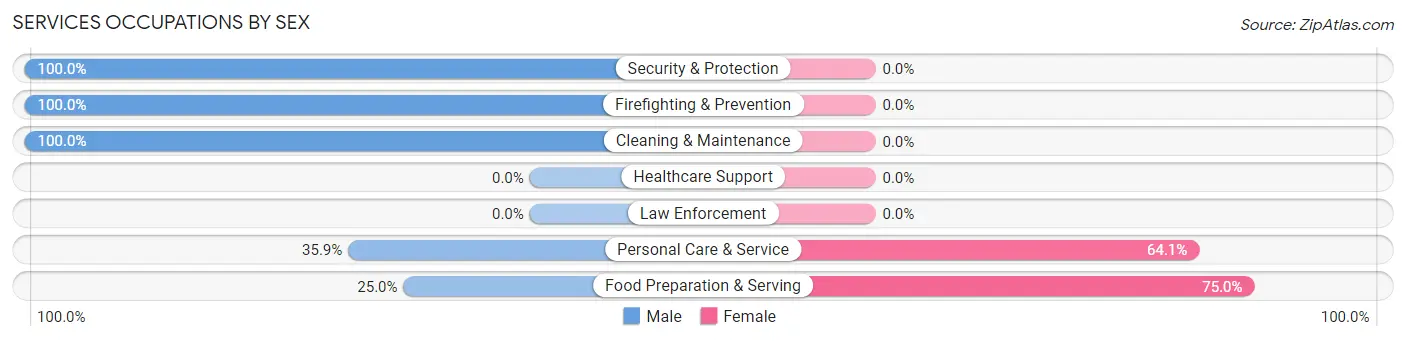
Services Occupations by Sex
Within the Services occupations in Fulton, the most male-oriented occupations are Security & Protection (100.0%), Firefighting & Prevention (100.0%), and Cleaning & Maintenance (100.0%), while the most female-oriented occupations are Food Preparation & Serving (75.0%), and Personal Care & Service (64.1%).
| Occupation | Male | Female |
| Healthcare Support | 0 (0.0%) | 0 (0.0%) |
| Security & Protection | 15 (100.0%) | 0 (0.0%) |
| Firefighting & Prevention | 15 (100.0%) | 0 (0.0%) |
| Law Enforcement | 0 (0.0%) | 0 (0.0%) |
| Food Preparation & Serving | 14 (25.0%) | 42 (75.0%) |
| Cleaning & Maintenance | 30 (100.0%) | 0 (0.0%) |
| Personal Care & Service | 23 (35.9%) | 41 (64.1%) |
| Total (Category) | 82 (49.7%) | 83 (50.3%) |
| Total (Overall) | 1,586 (53.2%) | 1,396 (46.8%) |
Sales and Office Occupations
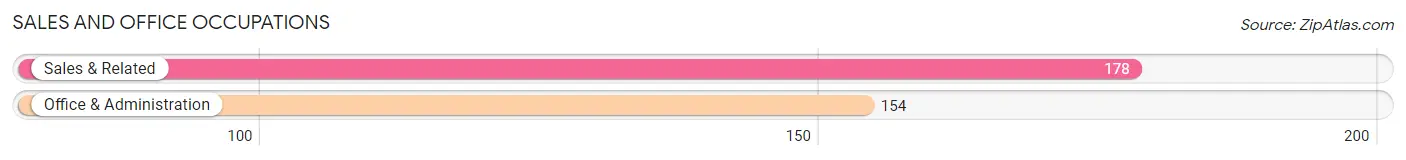
The most common Sales and Office occupations in Fulton are Sales & Related (178 | 6.0%), and Office & Administration (154 | 5.2%).
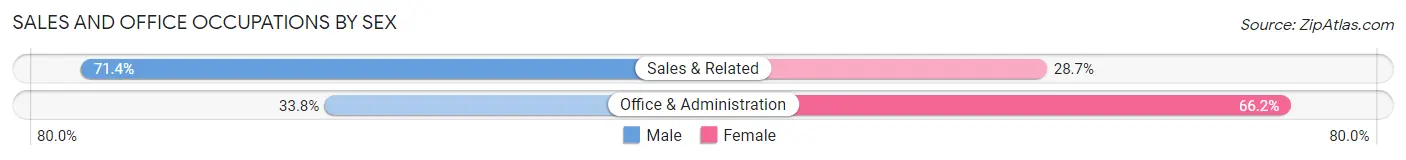
Sales and Office Occupations by Sex
| Occupation | Male | Female |
| Sales & Related | 127 (71.4%) | 51 (28.6%) |
| Office & Administration | 52 (33.8%) | 102 (66.2%) |
| Total (Category) | 179 (53.9%) | 153 (46.1%) |
| Total (Overall) | 1,586 (53.2%) | 1,396 (46.8%) |
Natural Resources, Construction and Maintenance Occupations
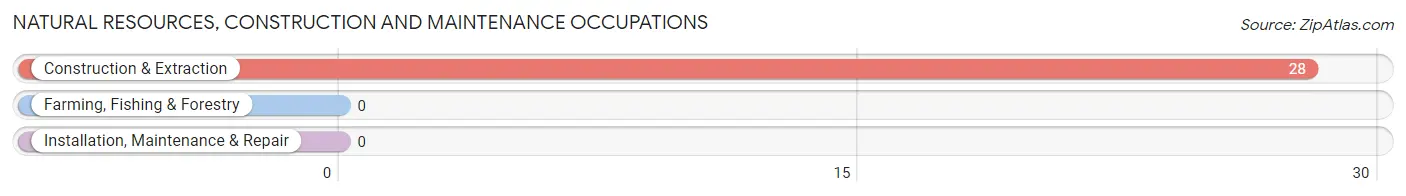
The most common Natural Resources, Construction and Maintenance occupations in Fulton are , and Construction & Extraction (28 | 0.9%).
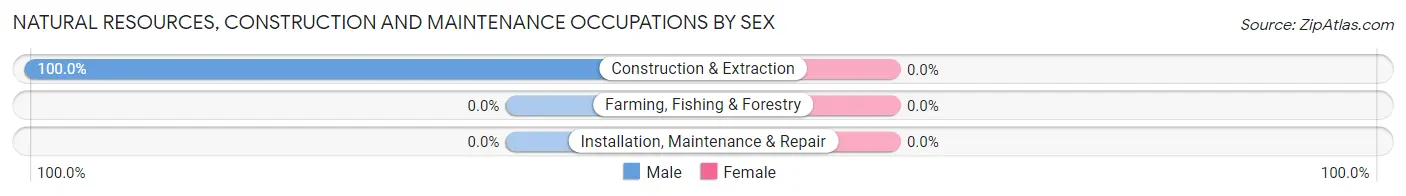
Natural Resources, Construction and Maintenance Occupations by Sex
| Occupation | Male | Female |
| Farming, Fishing & Forestry | 0 (0.0%) | 0 (0.0%) |
| Construction & Extraction | 28 (100.0%) | 0 (0.0%) |
| Installation, Maintenance & Repair | 0 (0.0%) | 0 (0.0%) |
| Total (Category) | 28 (100.0%) | 0 (0.0%) |
| Total (Overall) | 1,586 (53.2%) | 1,396 (46.8%) |
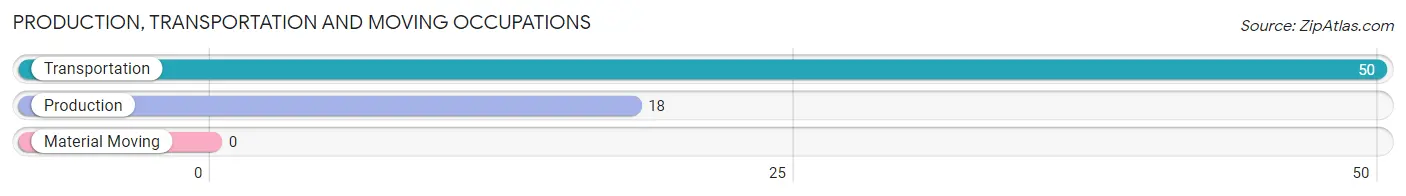
Production, Transportation and Moving Occupations
The most common Production, Transportation and Moving occupations in Fulton are Transportation (50 | 1.7%), and Production (18 | 0.6%).
Production, Transportation and Moving Occupations by Sex
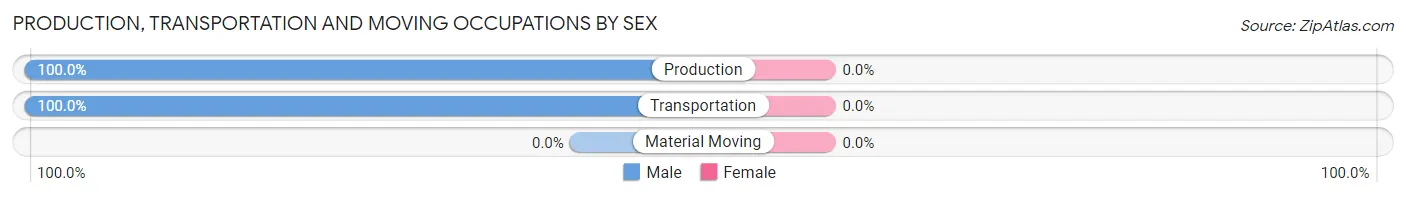
| Occupation | Male | Female |
| Production | 18 (100.0%) | 0 (0.0%) |
| Transportation | 50 (100.0%) | 0 (0.0%) |
| Material Moving | 0 (0.0%) | 0 (0.0%) |
| Total (Category) | 68 (100.0%) | 0 (0.0%) |
| Total (Overall) | 1,586 (53.2%) | 1,396 (46.8%) |
Employment Industries by Sex in Fulton
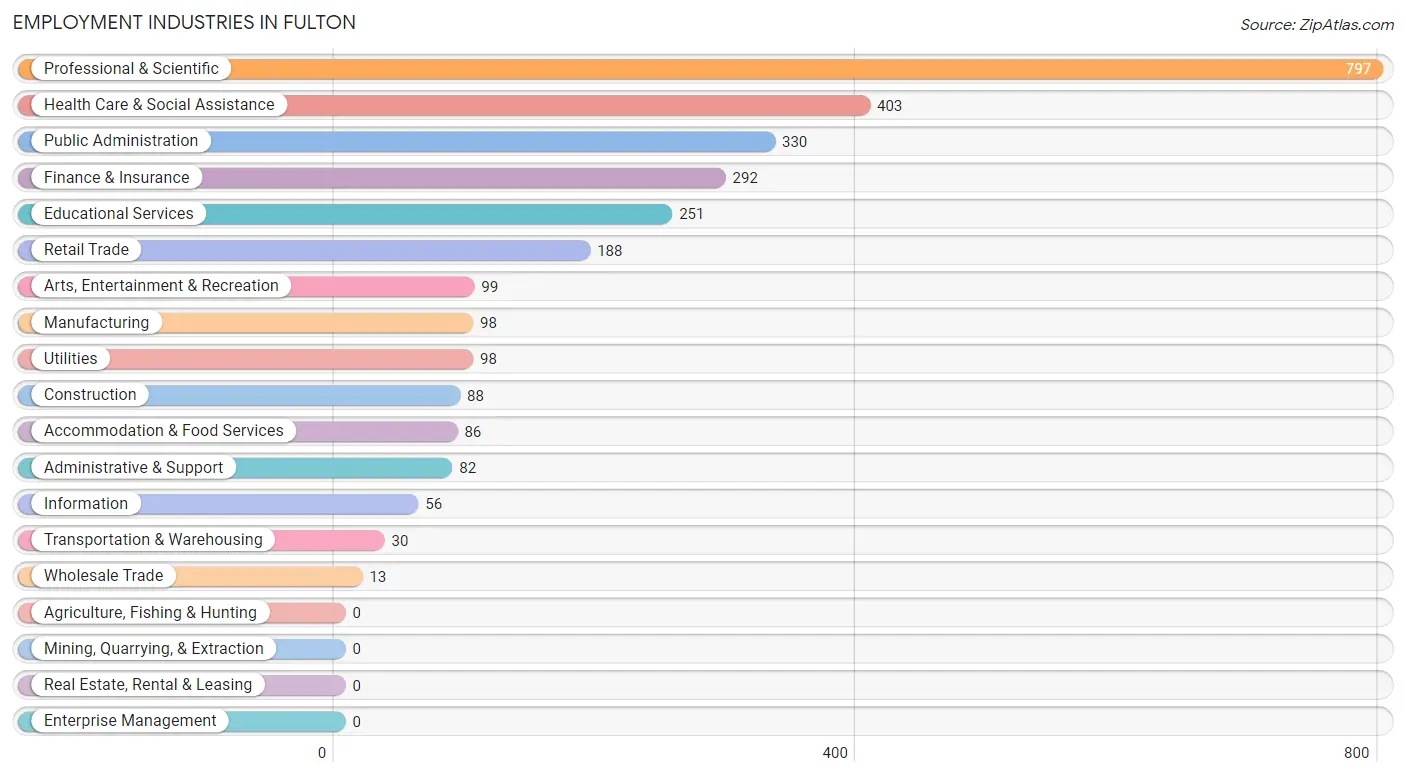
Employment Industries in Fulton
The major employment industries in Fulton include Professional & Scientific (797 | 26.7%), Health Care & Social Assistance (403 | 13.5%), Public Administration (330 | 11.1%), Finance & Insurance (292 | 9.8%), and Educational Services (251 | 8.4%).
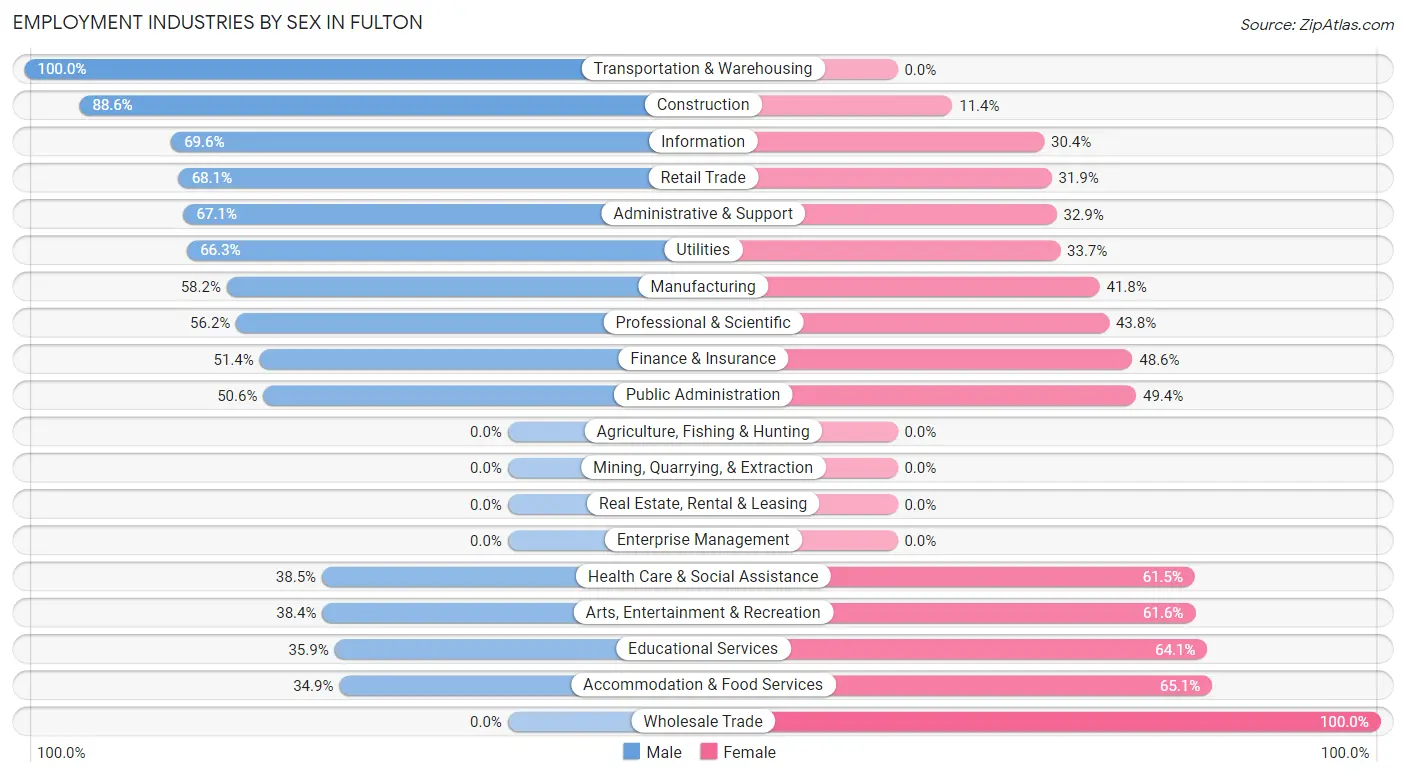
Employment Industries by Sex in Fulton
The Fulton industries that see more men than women are Transportation & Warehousing (100.0%), Construction (88.6%), and Information (69.6%), whereas the industries that tend to have a higher number of women are Wholesale Trade (100.0%), Accommodation & Food Services (65.1%), and Educational Services (64.1%).
| Industry | Male | Female |
| Agriculture, Fishing & Hunting | 0 (0.0%) | 0 (0.0%) |
| Mining, Quarrying, & Extraction | 0 (0.0%) | 0 (0.0%) |
| Construction | 78 (88.6%) | 10 (11.4%) |
| Manufacturing | 57 (58.2%) | 41 (41.8%) |
| Wholesale Trade | 0 (0.0%) | 13 (100.0%) |
| Retail Trade | 128 (68.1%) | 60 (31.9%) |
| Transportation & Warehousing | 30 (100.0%) | 0 (0.0%) |
| Utilities | 65 (66.3%) | 33 (33.7%) |
| Information | 39 (69.6%) | 17 (30.4%) |
| Finance & Insurance | 150 (51.4%) | 142 (48.6%) |
| Real Estate, Rental & Leasing | 0 (0.0%) | 0 (0.0%) |
| Professional & Scientific | 448 (56.2%) | 349 (43.8%) |
| Enterprise Management | 0 (0.0%) | 0 (0.0%) |
| Administrative & Support | 55 (67.1%) | 27 (32.9%) |
| Educational Services | 90 (35.9%) | 161 (64.1%) |
| Health Care & Social Assistance | 155 (38.5%) | 248 (61.5%) |
| Arts, Entertainment & Recreation | 38 (38.4%) | 61 (61.6%) |
| Accommodation & Food Services | 30 (34.9%) | 56 (65.1%) |
| Public Administration | 167 (50.6%) | 163 (49.4%) |
| Total | 1,586 (53.2%) | 1,396 (46.8%) |
Education in Fulton
School Enrollment in Fulton
The most common levels of schooling among the 1,578 students in Fulton are elementary school (474 | 30.0%), high school (366 | 23.2%), and middle school (279 | 17.7%).
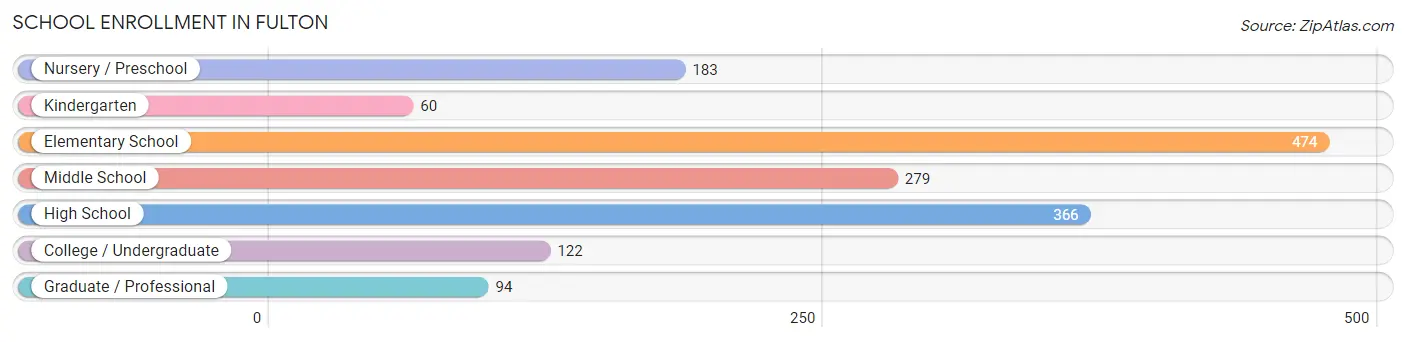
| School Level | # Students | % Students |
| Nursery / Preschool | 183 | 11.6% |
| Kindergarten | 60 | 3.8% |
| Elementary School | 474 | 30.0% |
| Middle School | 279 | 17.7% |
| High School | 366 | 23.2% |
| College / Undergraduate | 122 | 7.7% |
| Graduate / Professional | 94 | 6.0% |
| Total | 1,578 | 100.0% |
School Enrollment by Age by Funding Source in Fulton
Out of a total of 1,578 students who are enrolled in schools in Fulton, 349 (22.1%) attend a private institution, while the remaining 1,229 (77.9%) are enrolled in public schools. The age group of 3 to 4 year olds has the highest likelihood of being enrolled in private schools, with 121 (69.5% in the age bracket) enrolled. Conversely, the age group of 15 to 17 year olds has the lowest likelihood of being enrolled in a private school, with 314 (100.0% in the age bracket) attending a public institution.
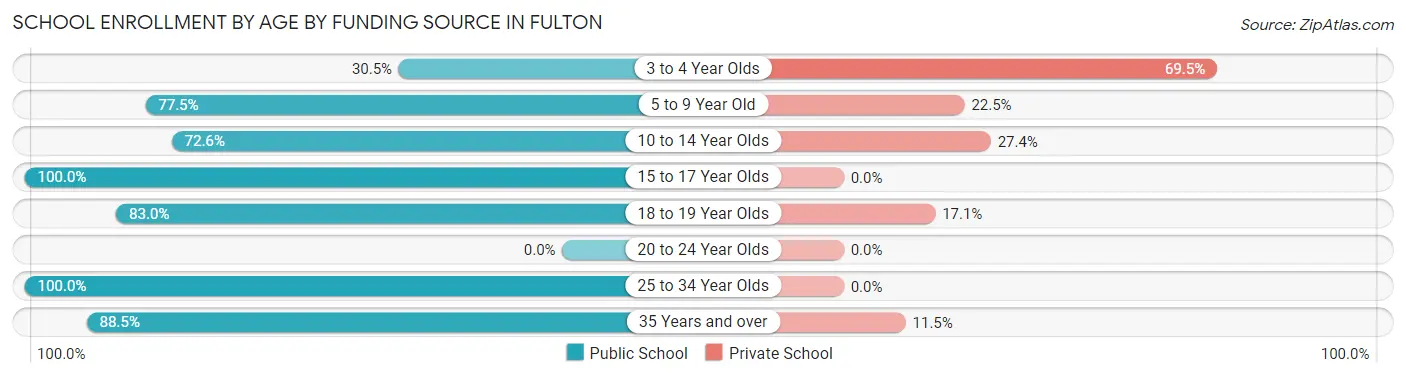
| Age Bracket | Public School | Private School |
| 3 to 4 Year Olds | 53 (30.5%) | 121 (69.5%) |
| 5 to 9 Year Old | 403 (77.5%) | 117 (22.5%) |
| 10 to 14 Year Olds | 228 (72.6%) | 86 (27.4%) |
| 15 to 17 Year Olds | 314 (100.0%) | 0 (0.0%) |
| 18 to 19 Year Olds | 73 (83.0%) | 15 (17.1%) |
| 20 to 24 Year Olds | 0 (0.0%) | 0 (0.0%) |
| 25 to 34 Year Olds | 90 (100.0%) | 0 (0.0%) |
| 35 Years and over | 69 (88.5%) | 9 (11.5%) |
| Total | 1,229 (77.9%) | 349 (22.1%) |
Educational Attainment by Field of Study in Fulton
Computers & mathematics (478 | 14.9%), business (449 | 14.0%), social sciences (410 | 12.8%), bio, nature & agricultural (343 | 10.7%), and science & technology (274 | 8.6%) are the most common fields of study among 3,200 individuals in Fulton who have obtained a bachelor's degree or higher.
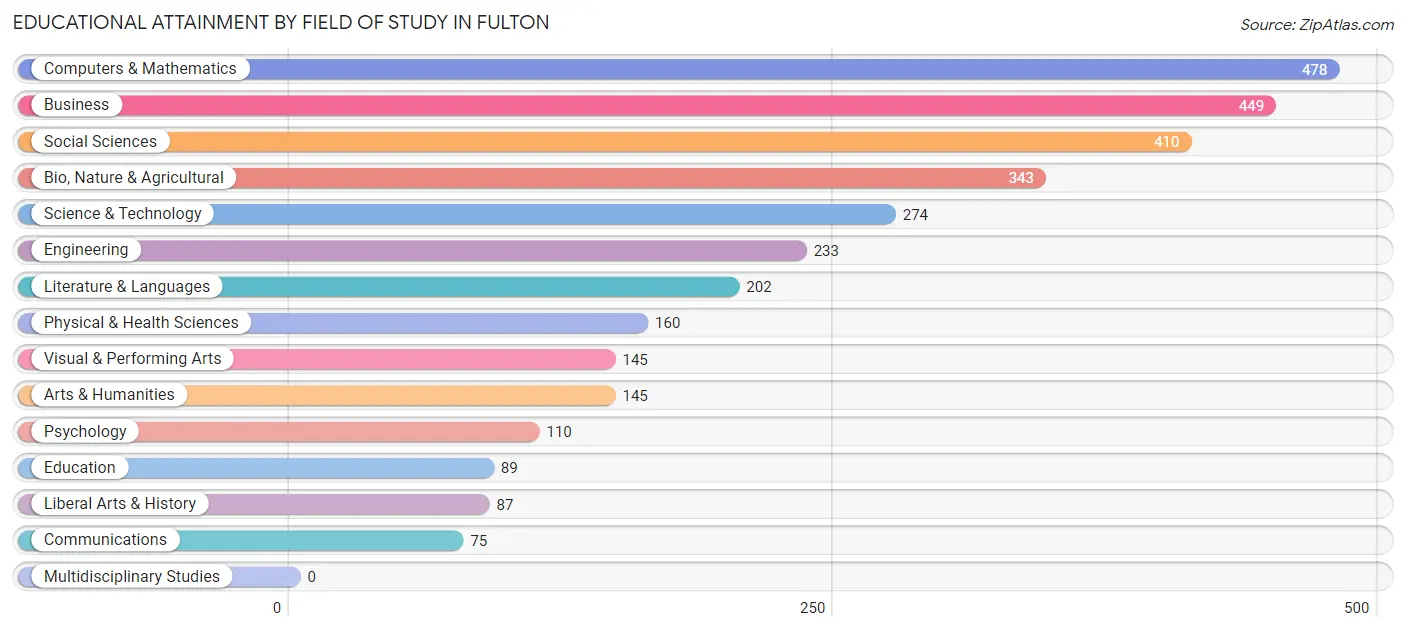
| Field of Study | # Graduates | % Graduates |
| Computers & Mathematics | 478 | 14.9% |
| Bio, Nature & Agricultural | 343 | 10.7% |
| Physical & Health Sciences | 160 | 5.0% |
| Psychology | 110 | 3.4% |
| Social Sciences | 410 | 12.8% |
| Engineering | 233 | 7.3% |
| Multidisciplinary Studies | 0 | 0.0% |
| Science & Technology | 274 | 8.6% |
| Business | 449 | 14.0% |
| Education | 89 | 2.8% |
| Literature & Languages | 202 | 6.3% |
| Liberal Arts & History | 87 | 2.7% |
| Visual & Performing Arts | 145 | 4.5% |
| Communications | 75 | 2.3% |
| Arts & Humanities | 145 | 4.5% |
| Total | 3,200 | 100.0% |
Transportation & Commute in Fulton
Vehicle Availability by Sex in Fulton
The most prevalent vehicle ownership categories in Fulton are males with 2 vehicles (801, accounting for 50.7%) and females with 2 vehicles (663, making up 59.6%).
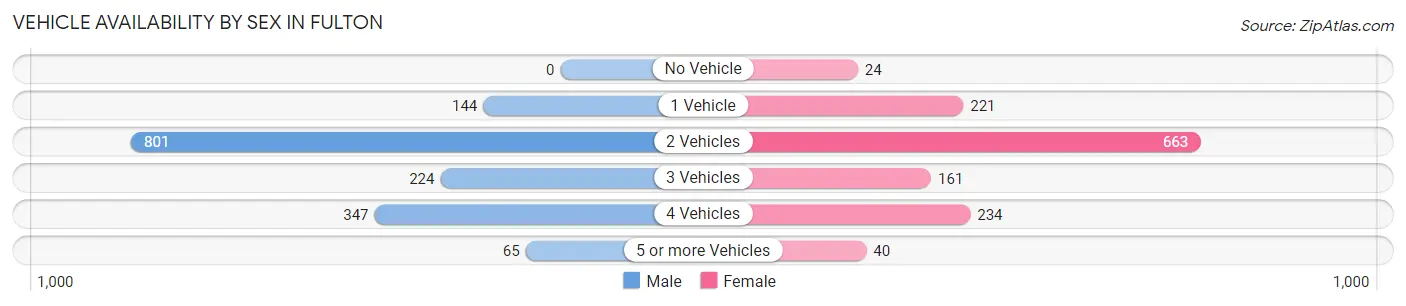
| Vehicles Available | Male | Female |
| No Vehicle | 0 (0.0%) | 24 (1.8%) |
| 1 Vehicle | 144 (9.1%) | 221 (16.5%) |
| 2 Vehicles | 801 (50.7%) | 663 (49.4%) |
| 3 Vehicles | 224 (14.2%) | 161 (12.0%) |
| 4 Vehicles | 347 (22.0%) | 234 (17.4%) |
| 5 or more Vehicles | 65 (4.1%) | 40 (3.0%) |
| Total | 1,581 (100.0%) | 1,343 (100.0%) |
Commute Time in Fulton
The most frequently occuring commute durations in Fulton are 20 to 24 minutes (364 commuters, 17.3%), 60 to 89 minutes (280 commuters, 13.3%), and 15 to 19 minutes (234 commuters, 11.1%).
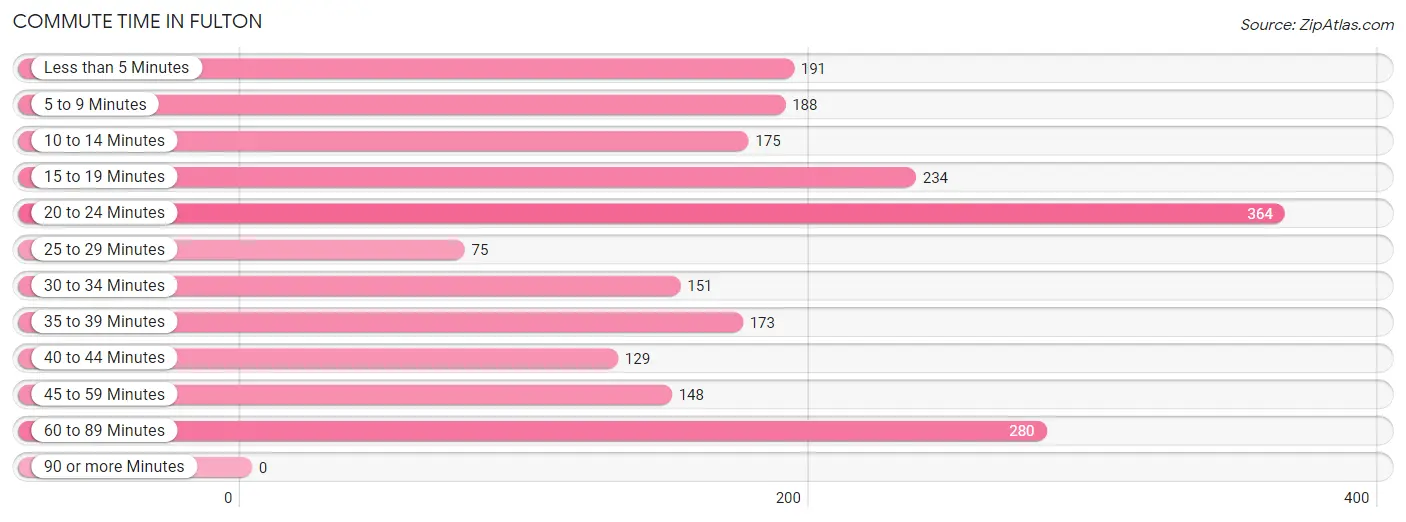
| Commute Time | # Commuters | % Commuters |
| Less than 5 Minutes | 191 | 9.1% |
| 5 to 9 Minutes | 188 | 8.9% |
| 10 to 14 Minutes | 175 | 8.3% |
| 15 to 19 Minutes | 234 | 11.1% |
| 20 to 24 Minutes | 364 | 17.3% |
| 25 to 29 Minutes | 75 | 3.6% |
| 30 to 34 Minutes | 151 | 7.2% |
| 35 to 39 Minutes | 173 | 8.2% |
| 40 to 44 Minutes | 129 | 6.1% |
| 45 to 59 Minutes | 148 | 7.0% |
| 60 to 89 Minutes | 280 | 13.3% |
| 90 or more Minutes | 0 | 0.0% |
Commute Time by Sex in Fulton
The most common commute times in Fulton are 60 to 89 minutes (183 commuters, 15.9%) for males and 20 to 24 minutes (193 commuters, 20.2%) for females.
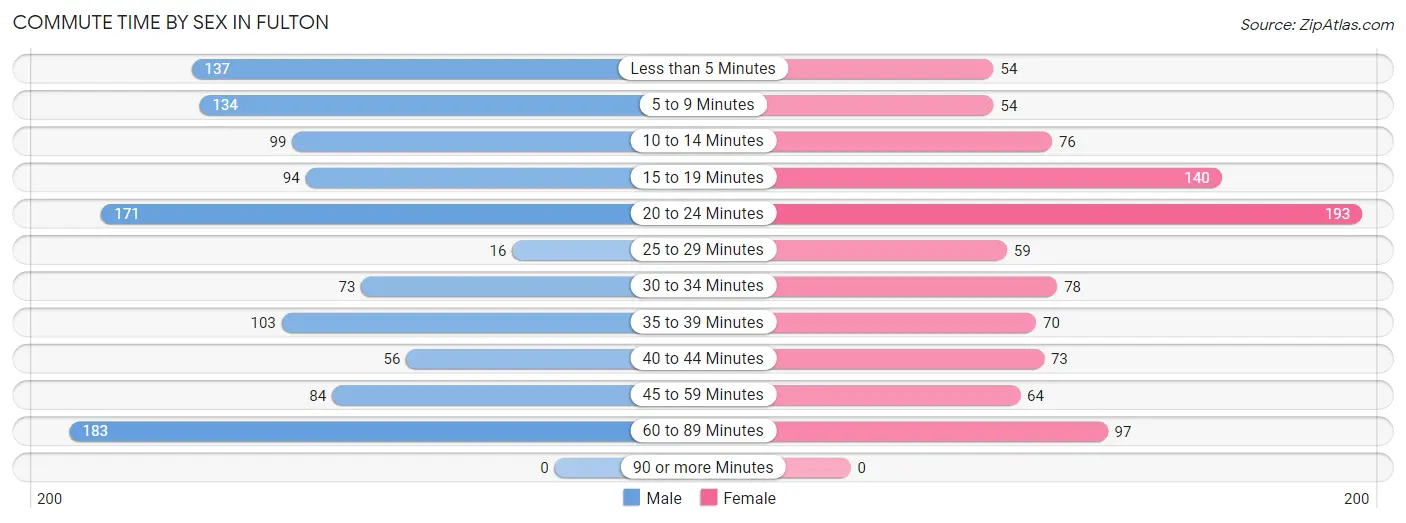
| Commute Time | Male | Female |
| Less than 5 Minutes | 137 (11.9%) | 54 (5.6%) |
| 5 to 9 Minutes | 134 (11.7%) | 54 (5.6%) |
| 10 to 14 Minutes | 99 (8.6%) | 76 (7.9%) |
| 15 to 19 Minutes | 94 (8.2%) | 140 (14.6%) |
| 20 to 24 Minutes | 171 (14.9%) | 193 (20.2%) |
| 25 to 29 Minutes | 16 (1.4%) | 59 (6.2%) |
| 30 to 34 Minutes | 73 (6.4%) | 78 (8.1%) |
| 35 to 39 Minutes | 103 (9.0%) | 70 (7.3%) |
| 40 to 44 Minutes | 56 (4.9%) | 73 (7.6%) |
| 45 to 59 Minutes | 84 (7.3%) | 64 (6.7%) |
| 60 to 89 Minutes | 183 (15.9%) | 97 (10.1%) |
| 90 or more Minutes | 0 (0.0%) | 0 (0.0%) |
Time of Departure to Work by Sex in Fulton
The most frequent times of departure to work in Fulton are 9:00 AM to 9:59 AM (215, 18.7%) for males and 7:00 AM to 7:29 AM (205, 21.4%) for females.
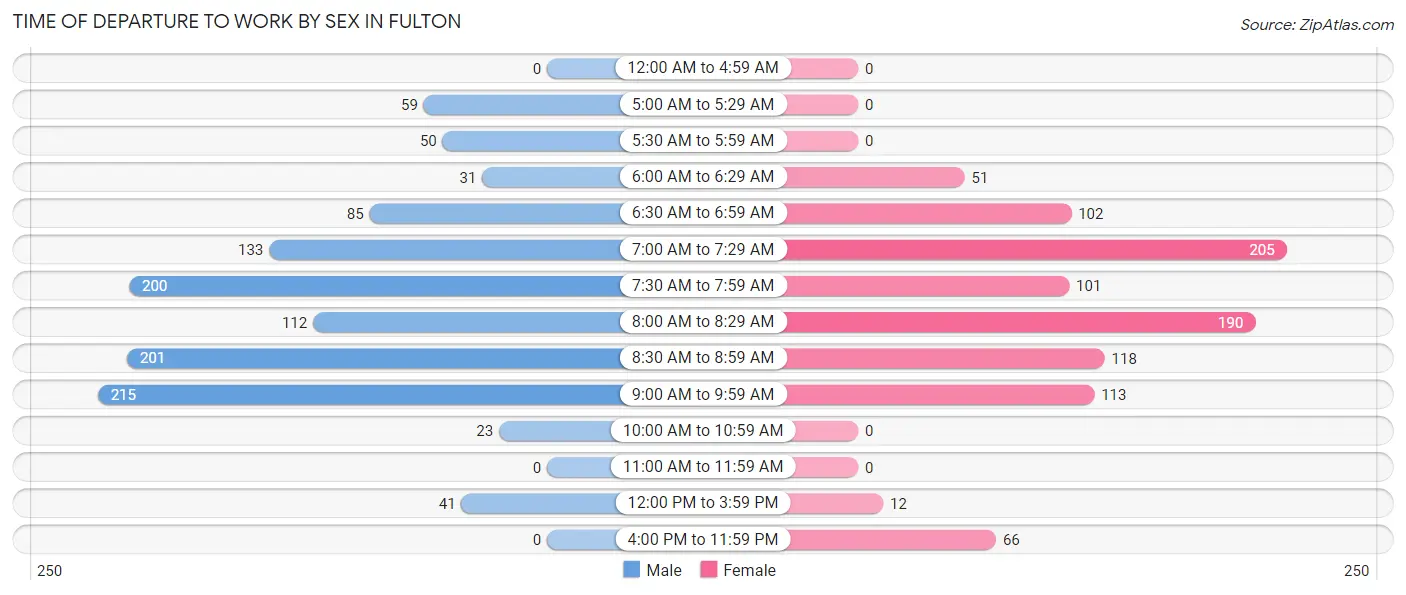
| Time of Departure | Male | Female |
| 12:00 AM to 4:59 AM | 0 (0.0%) | 0 (0.0%) |
| 5:00 AM to 5:29 AM | 59 (5.1%) | 0 (0.0%) |
| 5:30 AM to 5:59 AM | 50 (4.3%) | 0 (0.0%) |
| 6:00 AM to 6:29 AM | 31 (2.7%) | 51 (5.3%) |
| 6:30 AM to 6:59 AM | 85 (7.4%) | 102 (10.6%) |
| 7:00 AM to 7:29 AM | 133 (11.6%) | 205 (21.4%) |
| 7:30 AM to 7:59 AM | 200 (17.4%) | 101 (10.5%) |
| 8:00 AM to 8:29 AM | 112 (9.7%) | 190 (19.8%) |
| 8:30 AM to 8:59 AM | 201 (17.5%) | 118 (12.3%) |
| 9:00 AM to 9:59 AM | 215 (18.7%) | 113 (11.8%) |
| 10:00 AM to 10:59 AM | 23 (2.0%) | 0 (0.0%) |
| 11:00 AM to 11:59 AM | 0 (0.0%) | 0 (0.0%) |
| 12:00 PM to 3:59 PM | 41 (3.6%) | 12 (1.3%) |
| 4:00 PM to 11:59 PM | 0 (0.0%) | 66 (6.9%) |
| Total | 1,150 (100.0%) | 958 (100.0%) |
Housing Occupancy in Fulton
Occupancy by Ownership in Fulton
Of the total 1,822 dwellings in Fulton, owner-occupied units account for 1,595 (87.5%), while renter-occupied units make up 227 (12.5%).
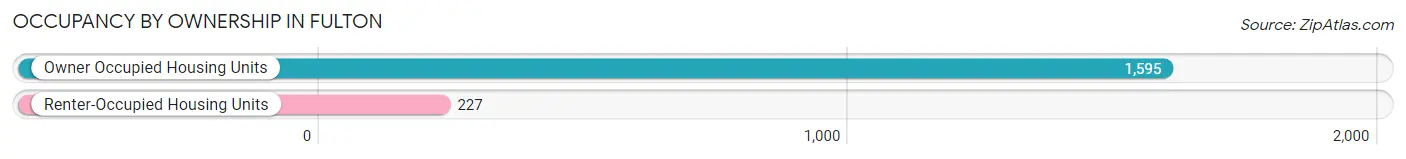
| Occupancy | # Housing Units | % Housing Units |
| Owner Occupied Housing Units | 1,595 | 87.5% |
| Renter-Occupied Housing Units | 227 | 12.5% |
| Total Occupied Housing Units | 1,822 | 100.0% |
Occupancy by Household Size in Fulton
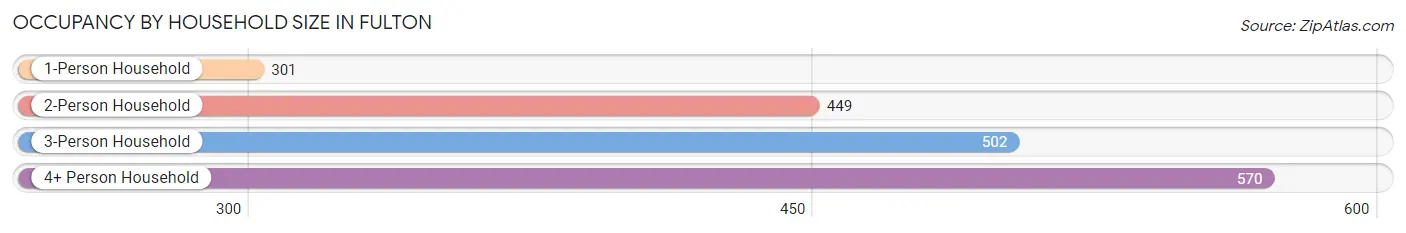
| Household Size | # Housing Units | % Housing Units |
| 1-Person Household | 301 | 16.5% |
| 2-Person Household | 449 | 24.6% |
| 3-Person Household | 502 | 27.6% |
| 4+ Person Household | 570 | 31.3% |
| Total Housing Units | 1,822 | 100.0% |
Occupancy by Ownership by Household Size in Fulton
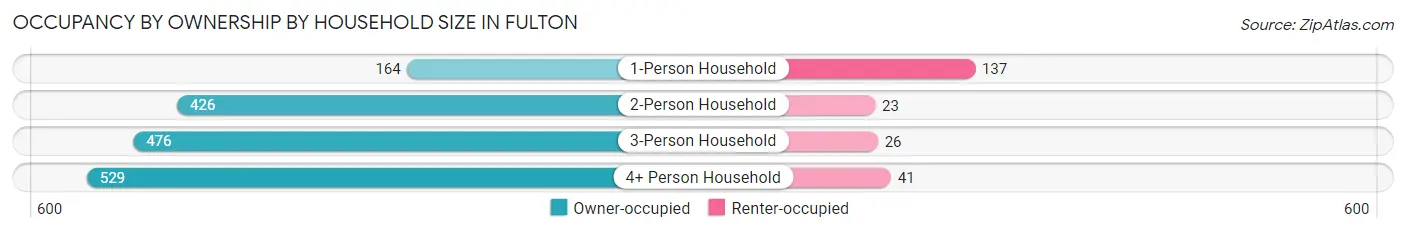
| Household Size | Owner-occupied | Renter-occupied |
| 1-Person Household | 164 (54.5%) | 137 (45.5%) |
| 2-Person Household | 426 (94.9%) | 23 (5.1%) |
| 3-Person Household | 476 (94.8%) | 26 (5.2%) |
| 4+ Person Household | 529 (92.8%) | 41 (7.2%) |
| Total Housing Units | 1,595 (87.5%) | 227 (12.5%) |
Occupancy by Educational Attainment in Fulton
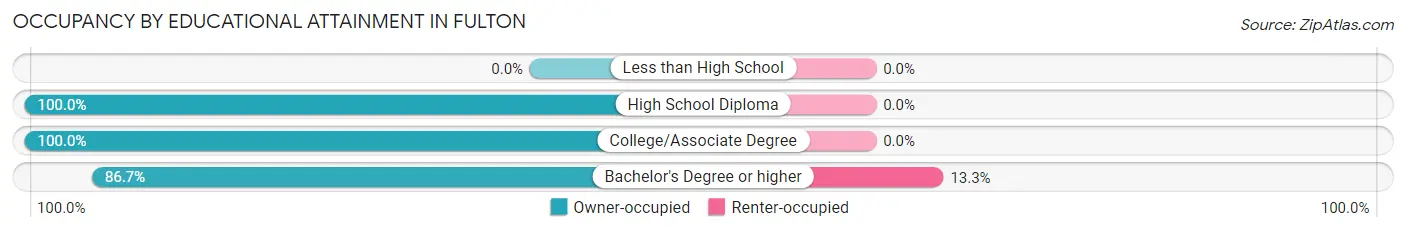
| Household Size | Owner-occupied | Renter-occupied |
| Less than High School | 0 (0.0%) | 0 (0.0%) |
| High School Diploma | 78 (100.0%) | 0 (0.0%) |
| College/Associate Degree | 42 (100.0%) | 0 (0.0%) |
| Bachelor's Degree or higher | 1,475 (86.7%) | 227 (13.3%) |
Occupancy by Age of Householder in Fulton
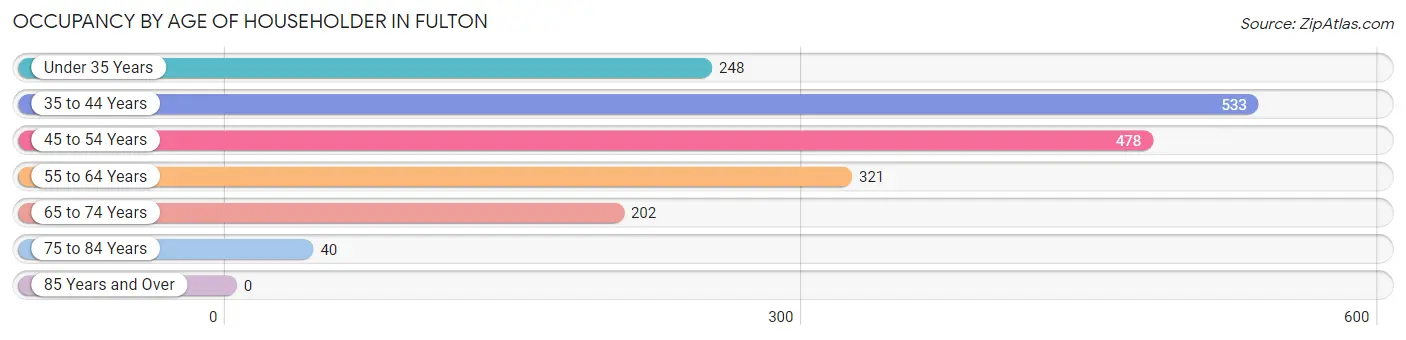
| Age Bracket | # Households | % Households |
| Under 35 Years | 248 | 13.6% |
| 35 to 44 Years | 533 | 29.2% |
| 45 to 54 Years | 478 | 26.2% |
| 55 to 64 Years | 321 | 17.6% |
| 65 to 74 Years | 202 | 11.1% |
| 75 to 84 Years | 40 | 2.2% |
| 85 Years and Over | 0 | 0.0% |
| Total | 1,822 | 100.0% |
Housing Finances in Fulton
Median Income by Occupancy in Fulton
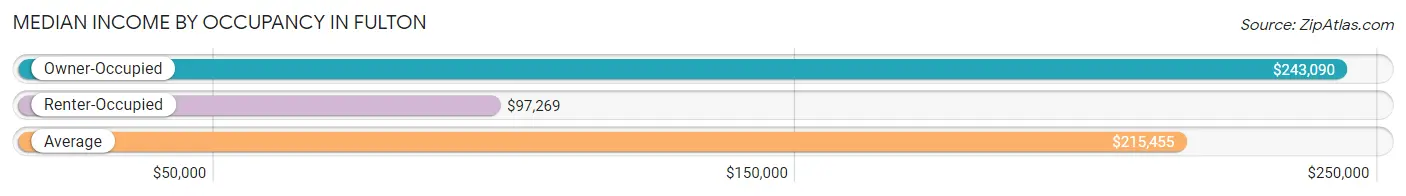
| Occupancy Type | # Households | Median Income |
| Owner-Occupied | 1,595 (87.5%) | $243,090 |
| Renter-Occupied | 227 (12.5%) | $97,269 |
| Average | 1,822 (100.0%) | $215,455 |
Occupancy by Householder Income Bracket in Fulton
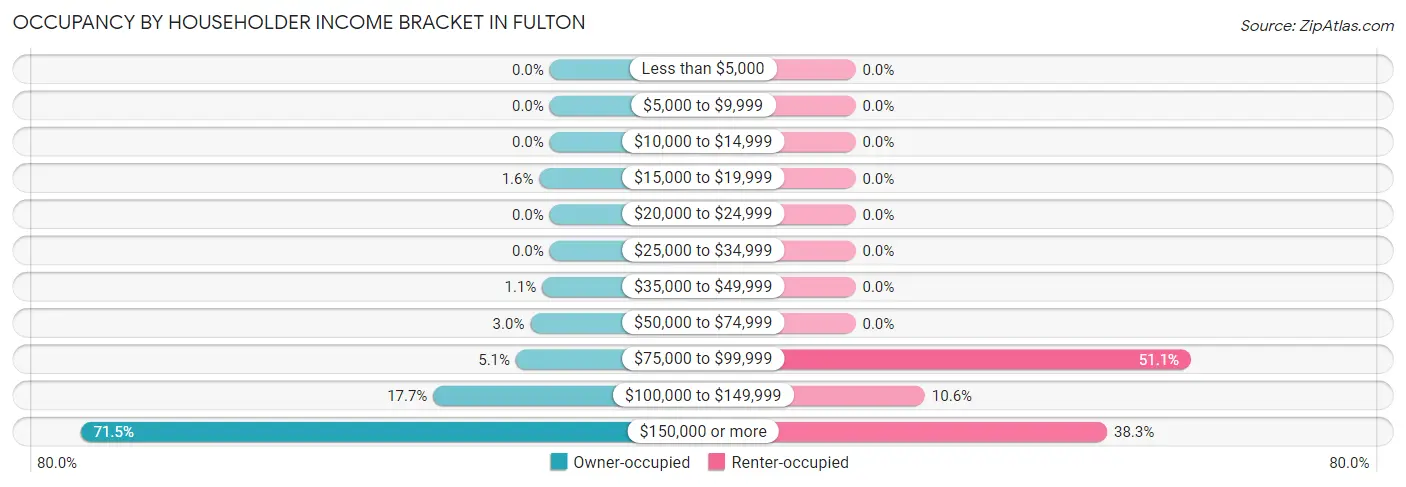
| Income Bracket | Owner-occupied | Renter-occupied |
| Less than $5,000 | 0 (0.0%) | 0 (0.0%) |
| $5,000 to $9,999 | 0 (0.0%) | 0 (0.0%) |
| $10,000 to $14,999 | 0 (0.0%) | 0 (0.0%) |
| $15,000 to $19,999 | 25 (1.6%) | 0 (0.0%) |
| $20,000 to $24,999 | 0 (0.0%) | 0 (0.0%) |
| $25,000 to $34,999 | 0 (0.0%) | 0 (0.0%) |
| $35,000 to $49,999 | 18 (1.1%) | 0 (0.0%) |
| $50,000 to $74,999 | 47 (2.9%) | 0 (0.0%) |
| $75,000 to $99,999 | 82 (5.1%) | 116 (51.1%) |
| $100,000 to $149,999 | 283 (17.7%) | 24 (10.6%) |
| $150,000 or more | 1,140 (71.5%) | 87 (38.3%) |
| Total | 1,595 (100.0%) | 227 (100.0%) |
Monthly Housing Cost Tiers in Fulton
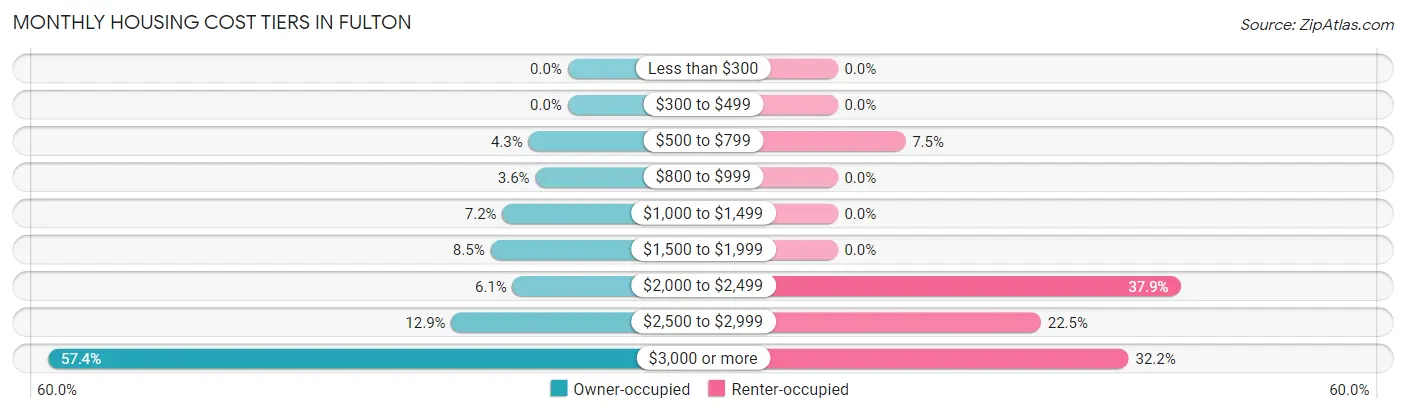
| Monthly Cost | Owner-occupied | Renter-occupied |
| Less than $300 | 0 (0.0%) | 0 (0.0%) |
| $300 to $499 | 0 (0.0%) | 0 (0.0%) |
| $500 to $799 | 69 (4.3%) | 17 (7.5%) |
| $800 to $999 | 57 (3.6%) | 0 (0.0%) |
| $1,000 to $1,499 | 115 (7.2%) | 0 (0.0%) |
| $1,500 to $1,999 | 136 (8.5%) | 0 (0.0%) |
| $2,000 to $2,499 | 97 (6.1%) | 86 (37.9%) |
| $2,500 to $2,999 | 205 (12.9%) | 51 (22.5%) |
| $3,000 or more | 916 (57.4%) | 73 (32.2%) |
| Total | 1,595 (100.0%) | 227 (100.0%) |
Physical Housing Characteristics in Fulton
Housing Structures in Fulton
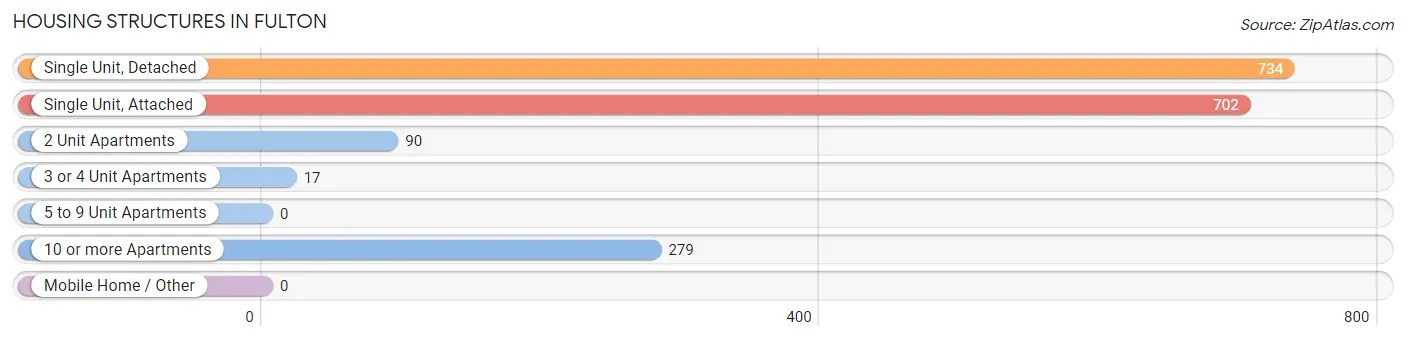
| Structure Type | # Housing Units | % Housing Units |
| Single Unit, Detached | 734 | 40.3% |
| Single Unit, Attached | 702 | 38.5% |
| 2 Unit Apartments | 90 | 4.9% |
| 3 or 4 Unit Apartments | 17 | 0.9% |
| 5 to 9 Unit Apartments | 0 | 0.0% |
| 10 or more Apartments | 279 | 15.3% |
| Mobile Home / Other | 0 | 0.0% |
| Total | 1,822 | 100.0% |
Housing Structures by Occupancy in Fulton
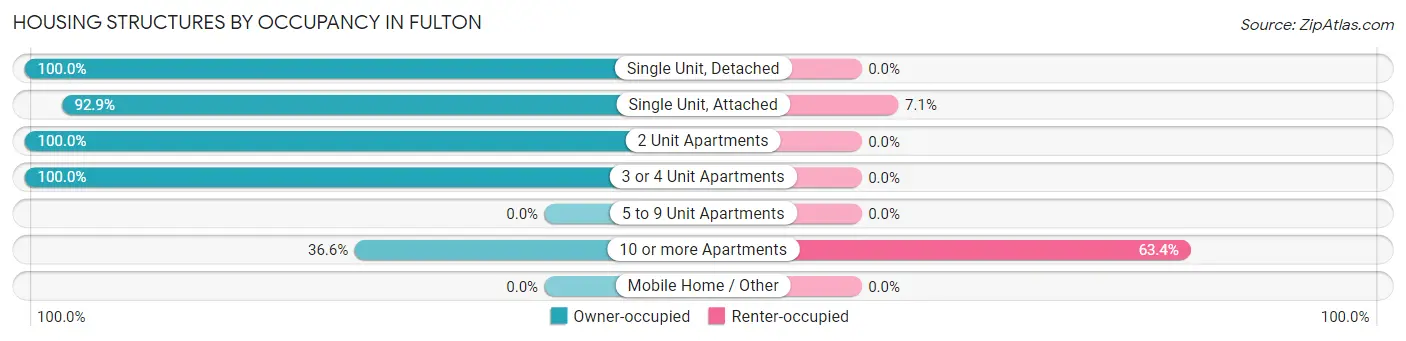
| Structure Type | Owner-occupied | Renter-occupied |
| Single Unit, Detached | 734 (100.0%) | 0 (0.0%) |
| Single Unit, Attached | 652 (92.9%) | 50 (7.1%) |
| 2 Unit Apartments | 90 (100.0%) | 0 (0.0%) |
| 3 or 4 Unit Apartments | 17 (100.0%) | 0 (0.0%) |
| 5 to 9 Unit Apartments | 0 (0.0%) | 0 (0.0%) |
| 10 or more Apartments | 102 (36.6%) | 177 (63.4%) |
| Mobile Home / Other | 0 (0.0%) | 0 (0.0%) |
| Total | 1,595 (87.5%) | 227 (12.5%) |
Housing Structures by Number of Rooms in Fulton
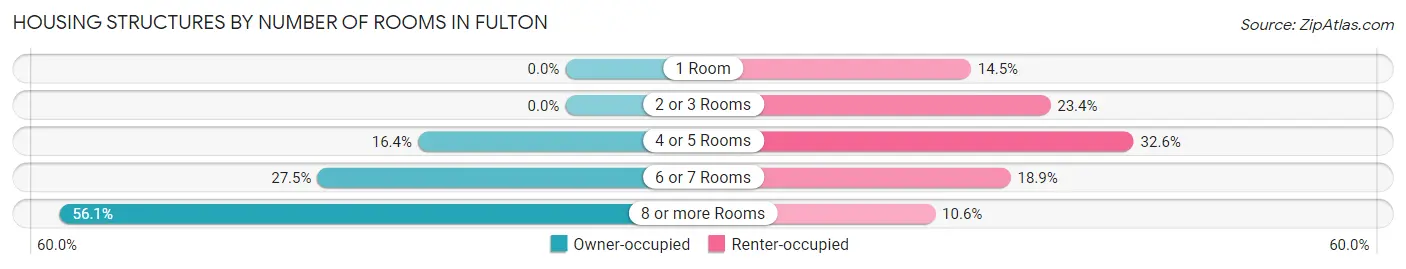
| Number of Rooms | Owner-occupied | Renter-occupied |
| 1 Room | 0 (0.0%) | 33 (14.5%) |
| 2 or 3 Rooms | 0 (0.0%) | 53 (23.4%) |
| 4 or 5 Rooms | 261 (16.4%) | 74 (32.6%) |
| 6 or 7 Rooms | 439 (27.5%) | 43 (18.9%) |
| 8 or more Rooms | 895 (56.1%) | 24 (10.6%) |
| Total | 1,595 (100.0%) | 227 (100.0%) |
Housing Structure by Heating Type in Fulton
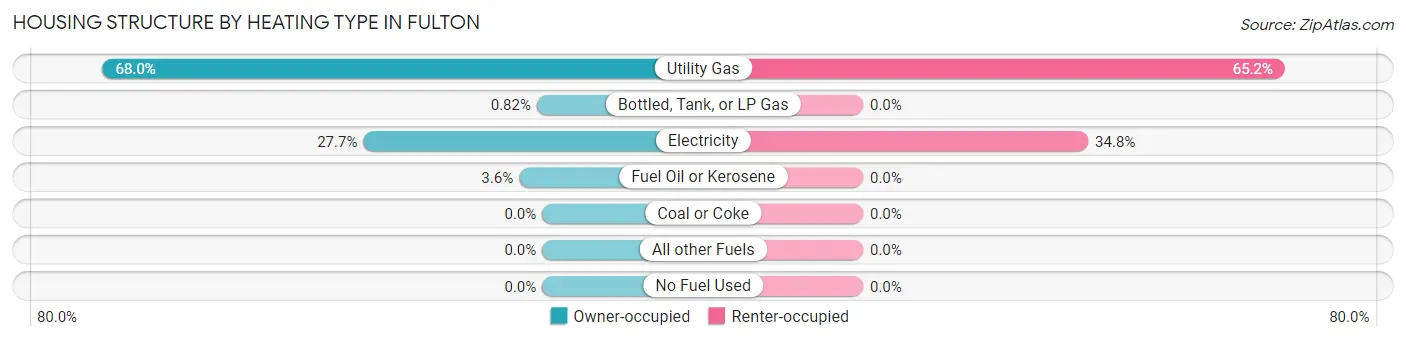
| Heating Type | Owner-occupied | Renter-occupied |
| Utility Gas | 1,084 (68.0%) | 148 (65.2%) |
| Bottled, Tank, or LP Gas | 13 (0.8%) | 0 (0.0%) |
| Electricity | 441 (27.7%) | 79 (34.8%) |
| Fuel Oil or Kerosene | 57 (3.6%) | 0 (0.0%) |
| Coal or Coke | 0 (0.0%) | 0 (0.0%) |
| All other Fuels | 0 (0.0%) | 0 (0.0%) |
| No Fuel Used | 0 (0.0%) | 0 (0.0%) |
| Total | 1,595 (100.0%) | 227 (100.0%) |
Household Vehicle Usage in Fulton
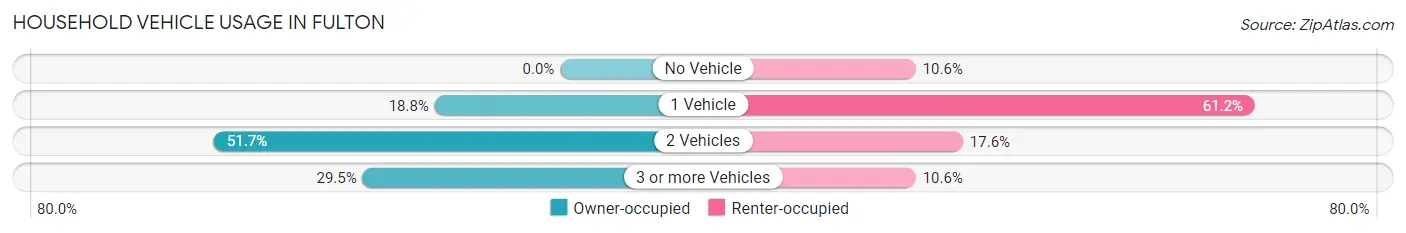
| Vehicles per Household | Owner-occupied | Renter-occupied |
| No Vehicle | 0 (0.0%) | 24 (10.6%) |
| 1 Vehicle | 299 (18.8%) | 139 (61.2%) |
| 2 Vehicles | 825 (51.7%) | 40 (17.6%) |
| 3 or more Vehicles | 471 (29.5%) | 24 (10.6%) |
| Total | 1,595 (100.0%) | 227 (100.0%) |
Real Estate & Mortgages in Fulton
Real Estate and Mortgage Overview in Fulton
| Characteristic | Without Mortgage | With Mortgage |
| Housing Units | 260 | 1,335 |
| Median Property Value | $719,000 | $735,800 |
| Median Household Income | $114,800 | $1,045 |
| Monthly Housing Costs | $1,186 | $916 |
| Real Estate Taxes | $8,077 | $27 |
Property Value by Mortgage Status in Fulton
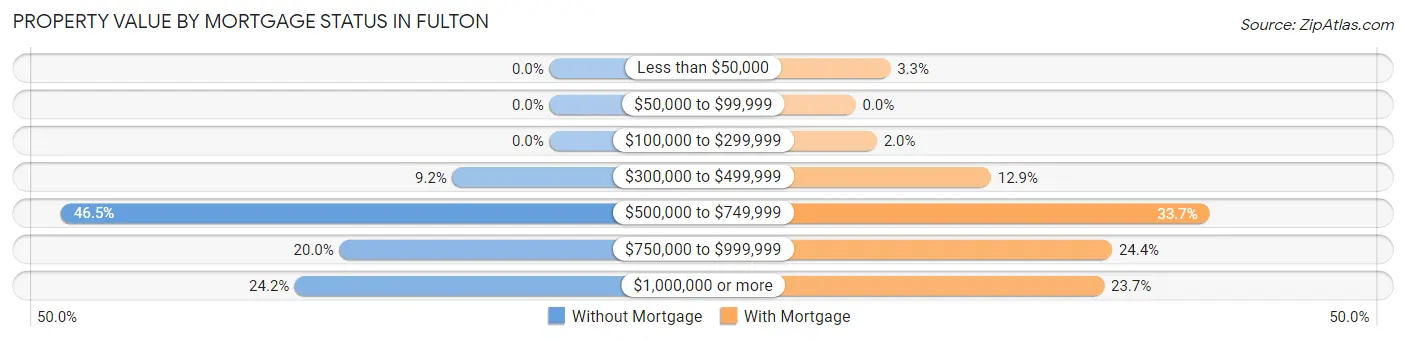
| Property Value | Without Mortgage | With Mortgage |
| Less than $50,000 | 0 (0.0%) | 44 (3.3%) |
| $50,000 to $99,999 | 0 (0.0%) | 0 (0.0%) |
| $100,000 to $299,999 | 0 (0.0%) | 27 (2.0%) |
| $300,000 to $499,999 | 24 (9.2%) | 172 (12.9%) |
| $500,000 to $749,999 | 121 (46.5%) | 450 (33.7%) |
| $750,000 to $999,999 | 52 (20.0%) | 326 (24.4%) |
| $1,000,000 or more | 63 (24.2%) | 316 (23.7%) |
| Total | 260 (100.0%) | 1,335 (100.0%) |
Household Income by Mortgage Status in Fulton
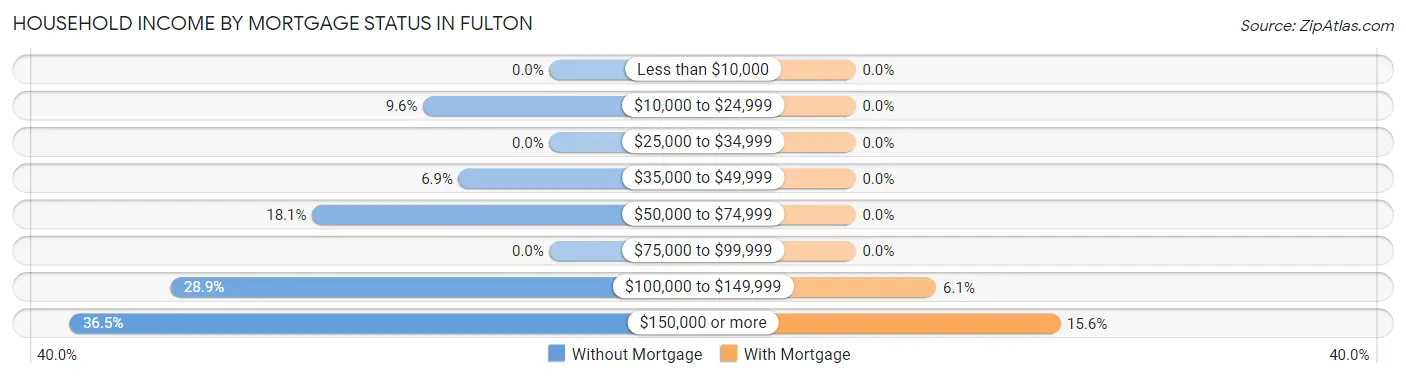
| Household Income | Without Mortgage | With Mortgage |
| Less than $10,000 | 0 (0.0%) | 0 (0.0%) |
| $10,000 to $24,999 | 25 (9.6%) | 0 (0.0%) |
| $25,000 to $34,999 | 0 (0.0%) | 0 (0.0%) |
| $35,000 to $49,999 | 18 (6.9%) | 0 (0.0%) |
| $50,000 to $74,999 | 47 (18.1%) | 0 (0.0%) |
| $75,000 to $99,999 | 0 (0.0%) | 0 (0.0%) |
| $100,000 to $149,999 | 75 (28.8%) | 82 (6.1%) |
| $150,000 or more | 95 (36.5%) | 208 (15.6%) |
| Total | 260 (100.0%) | 1,335 (100.0%) |
Property Value to Household Income Ratio in Fulton
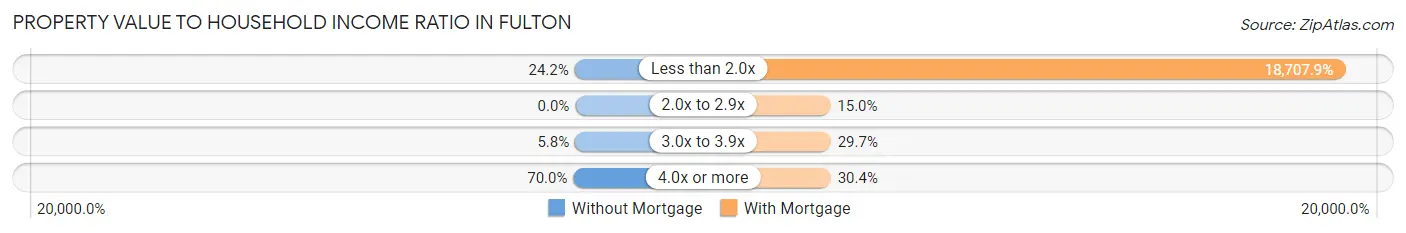
| Value-to-Income Ratio | Without Mortgage | With Mortgage |
| Less than 2.0x | 63 (24.2%) | 249,750 (18,707.9%) |
| 2.0x to 2.9x | 0 (0.0%) | 200 (15.0%) |
| 3.0x to 3.9x | 15 (5.8%) | 397 (29.7%) |
| 4.0x or more | 182 (70.0%) | 406 (30.4%) |
| Total | 260 (100.0%) | 1,335 (100.0%) |
Real Estate Taxes by Mortgage Status in Fulton

| Property Taxes | Without Mortgage | With Mortgage |
| Less than $800 | 0 (0.0%) | 0 (0.0%) |
| $800 to $1,499 | 0 (0.0%) | 44 (3.3%) |
| $800 to $1,499 | 260 (100.0%) | 0 (0.0%) |
| Total | 260 (100.0%) | 1,335 (100.0%) |
Health & Disability in Fulton
Health Insurance Coverage by Age in Fulton
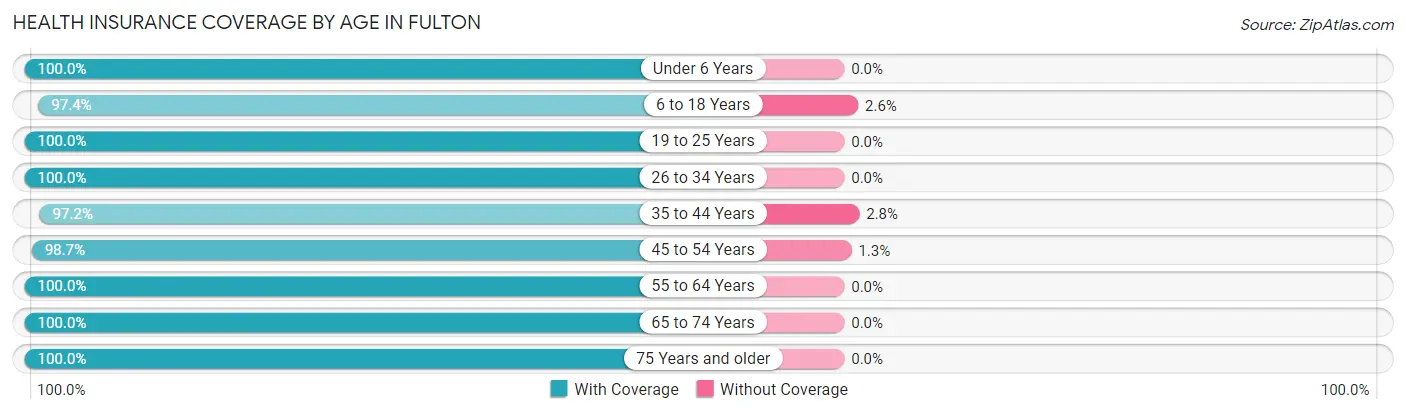
| Age Bracket | With Coverage | Without Coverage |
| Under 6 Years | 537 (100.0%) | 0 (0.0%) |
| 6 to 18 Years | 1,206 (97.4%) | 32 (2.6%) |
| 19 to 25 Years | 249 (100.0%) | 0 (0.0%) |
| 26 to 34 Years | 418 (100.0%) | 0 (0.0%) |
| 35 to 44 Years | 1,075 (97.2%) | 31 (2.8%) |
| 45 to 54 Years | 809 (98.7%) | 11 (1.3%) |
| 55 to 64 Years | 581 (100.0%) | 0 (0.0%) |
| 65 to 74 Years | 343 (100.0%) | 0 (0.0%) |
| 75 Years and older | 129 (100.0%) | 0 (0.0%) |
| Total | 5,347 (98.6%) | 74 (1.4%) |
Health Insurance Coverage by Citizenship Status in Fulton
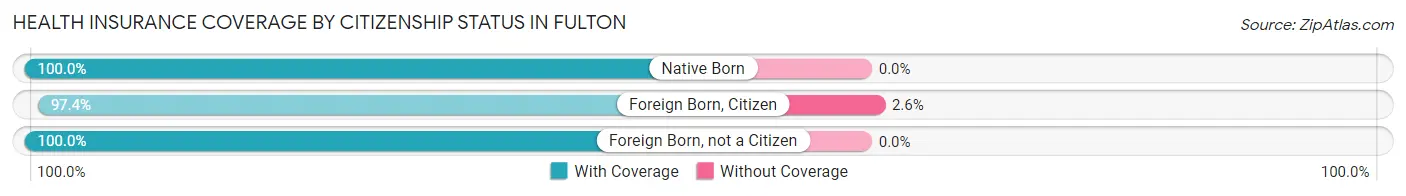
| Citizenship Status | With Coverage | Without Coverage |
| Native Born | 537 (100.0%) | 0 (0.0%) |
| Foreign Born, Citizen | 1,206 (97.4%) | 32 (2.6%) |
| Foreign Born, not a Citizen | 249 (100.0%) | 0 (0.0%) |
Health Insurance Coverage by Household Income in Fulton
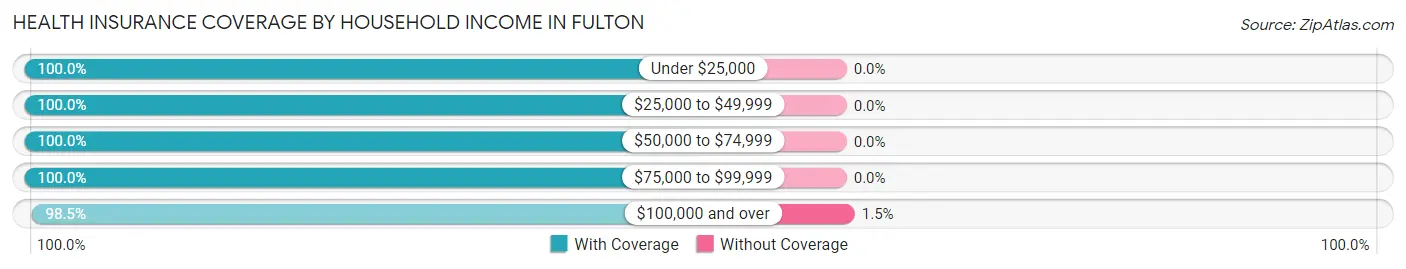
| Household Income | With Coverage | Without Coverage |
| Under $25,000 | 25 (100.0%) | 0 (0.0%) |
| $25,000 to $49,999 | 36 (100.0%) | 0 (0.0%) |
| $50,000 to $74,999 | 71 (100.0%) | 0 (0.0%) |
| $75,000 to $99,999 | 381 (100.0%) | 0 (0.0%) |
| $100,000 and over | 4,821 (98.5%) | 74 (1.5%) |
Public vs Private Health Insurance Coverage by Age in Fulton
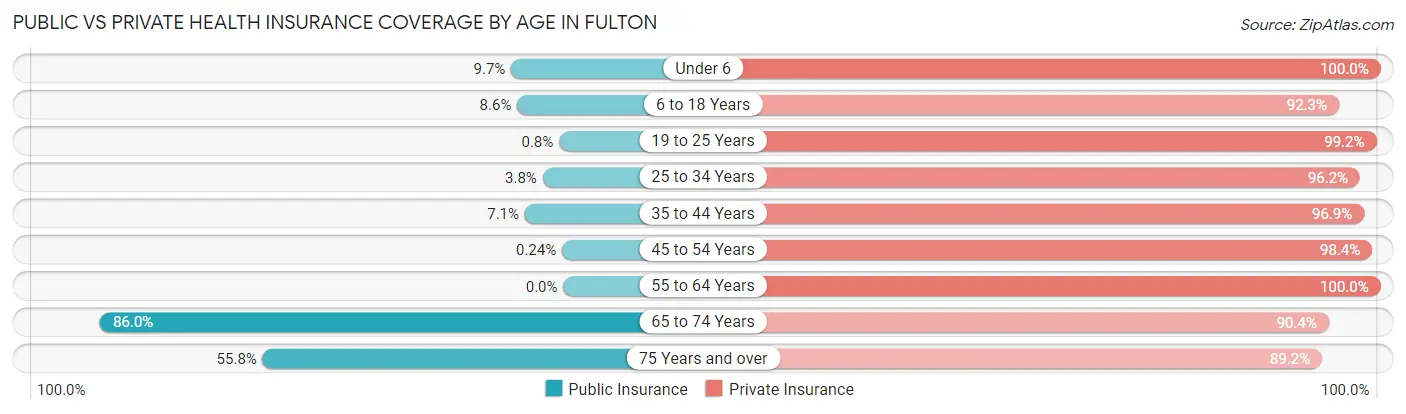
| Age Bracket | Public Insurance | Private Insurance |
| Under 6 | 52 (9.7%) | 537 (100.0%) |
| 6 to 18 Years | 106 (8.6%) | 1,142 (92.2%) |
| 19 to 25 Years | 2 (0.8%) | 247 (99.2%) |
| 25 to 34 Years | 16 (3.8%) | 402 (96.2%) |
| 35 to 44 Years | 79 (7.1%) | 1,072 (96.9%) |
| 45 to 54 Years | 2 (0.2%) | 807 (98.4%) |
| 55 to 64 Years | 0 (0.0%) | 581 (100.0%) |
| 65 to 74 Years | 295 (86.0%) | 310 (90.4%) |
| 75 Years and over | 72 (55.8%) | 115 (89.1%) |
| Total | 624 (11.5%) | 5,213 (96.2%) |
Disability Status by Sex by Age in Fulton
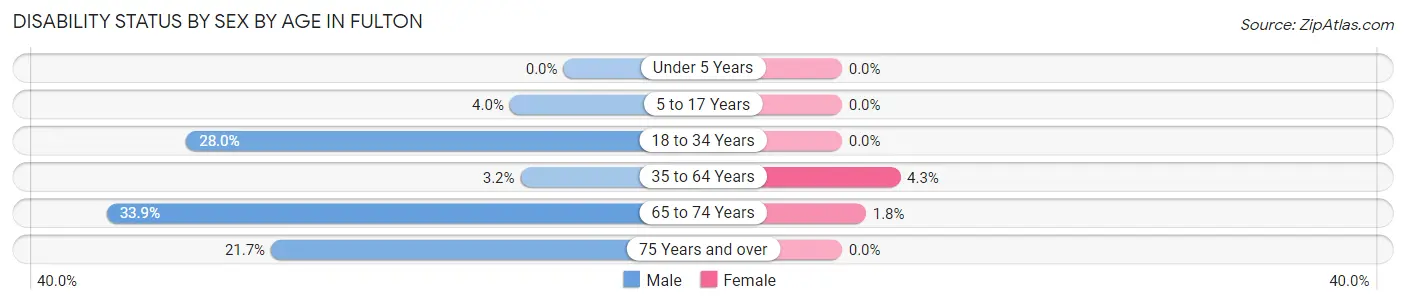
| Age Bracket | Male | Female |
| Under 5 Years | 0 (0.0%) | 0 (0.0%) |
| 5 to 17 Years | 26 (4.0%) | 0 (0.0%) |
| 18 to 34 Years | 117 (28.0%) | 0 (0.0%) |
| 35 to 64 Years | 38 (3.2%) | 57 (4.3%) |
| 65 to 74 Years | 40 (33.9%) | 4 (1.8%) |
| 75 Years and over | 28 (21.7%) | 0 (0.0%) |
Disability Class by Sex by Age in Fulton
Disability Class: Hearing Difficulty
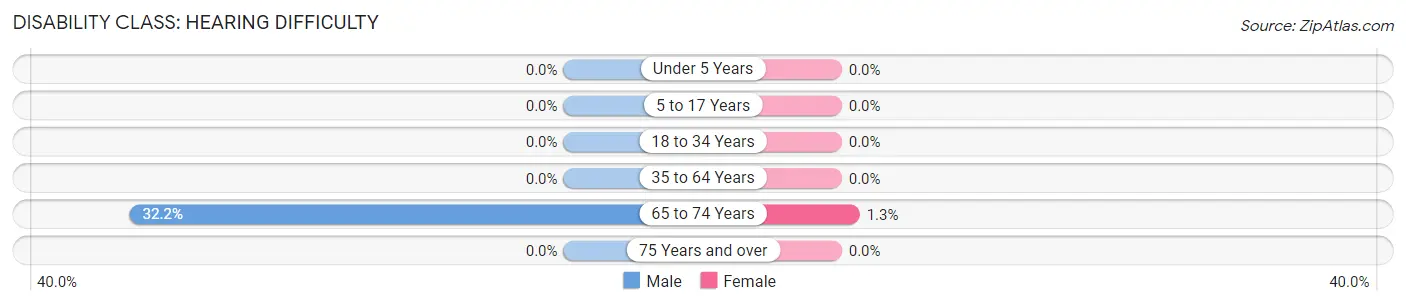
| Age Bracket | Male | Female |
| Under 5 Years | 0 (0.0%) | 0 (0.0%) |
| 5 to 17 Years | 0 (0.0%) | 0 (0.0%) |
| 18 to 34 Years | 0 (0.0%) | 0 (0.0%) |
| 35 to 64 Years | 0 (0.0%) | 0 (0.0%) |
| 65 to 74 Years | 38 (32.2%) | 3 (1.3%) |
| 75 Years and over | 0 (0.0%) | 0 (0.0%) |
Disability Class: Vision Difficulty
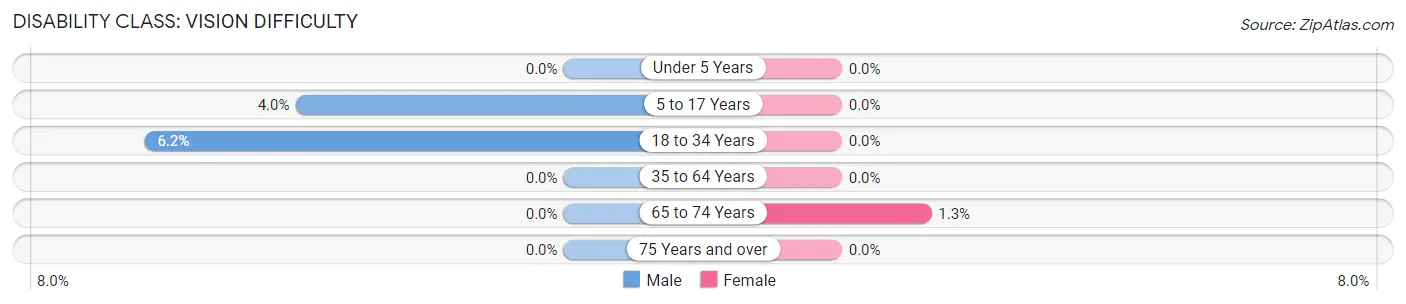
| Age Bracket | Male | Female |
| Under 5 Years | 0 (0.0%) | 0 (0.0%) |
| 5 to 17 Years | 26 (4.0%) | 0 (0.0%) |
| 18 to 34 Years | 26 (6.2%) | 0 (0.0%) |
| 35 to 64 Years | 0 (0.0%) | 0 (0.0%) |
| 65 to 74 Years | 0 (0.0%) | 3 (1.3%) |
| 75 Years and over | 0 (0.0%) | 0 (0.0%) |
Disability Class: Cognitive Difficulty
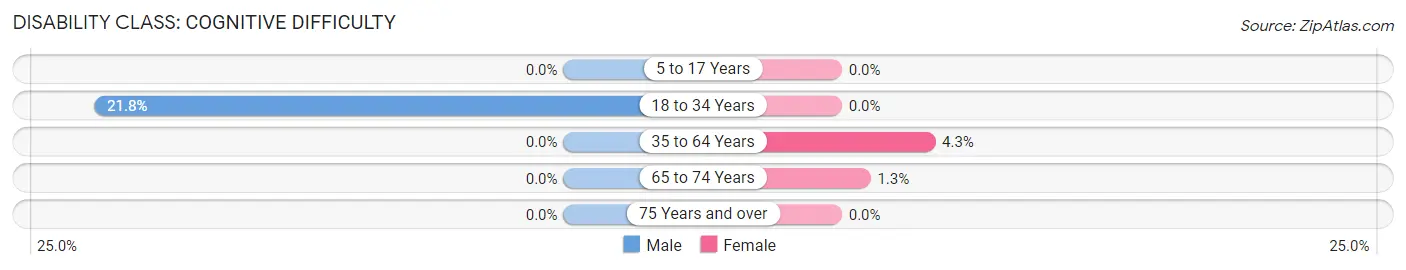
| Age Bracket | Male | Female |
| 5 to 17 Years | 0 (0.0%) | 0 (0.0%) |
| 18 to 34 Years | 91 (21.8%) | 0 (0.0%) |
| 35 to 64 Years | 0 (0.0%) | 57 (4.3%) |
| 65 to 74 Years | 0 (0.0%) | 3 (1.3%) |
| 75 Years and over | 0 (0.0%) | 0 (0.0%) |
Disability Class: Ambulatory Difficulty
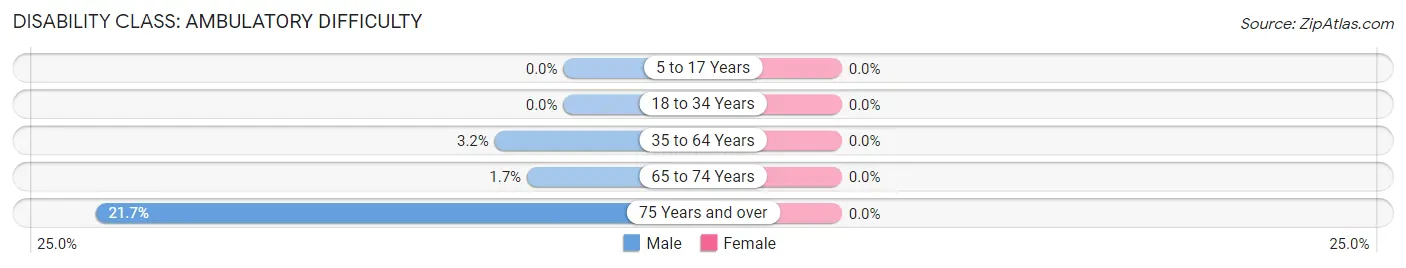
| Age Bracket | Male | Female |
| 5 to 17 Years | 0 (0.0%) | 0 (0.0%) |
| 18 to 34 Years | 0 (0.0%) | 0 (0.0%) |
| 35 to 64 Years | 38 (3.2%) | 0 (0.0%) |
| 65 to 74 Years | 2 (1.7%) | 0 (0.0%) |
| 75 Years and over | 28 (21.7%) | 0 (0.0%) |
Disability Class: Self-Care Difficulty
| Age Bracket | Male | Female |
| 5 to 17 Years | 0 (0.0%) | 0 (0.0%) |
| 18 to 34 Years | 0 (0.0%) | 0 (0.0%) |
| 35 to 64 Years | 0 (0.0%) | 0 (0.0%) |
| 65 to 74 Years | 0 (0.0%) | 0 (0.0%) |
| 75 Years and over | 0 (0.0%) | 0 (0.0%) |
Technology Access in Fulton
Computing Device Access in Fulton
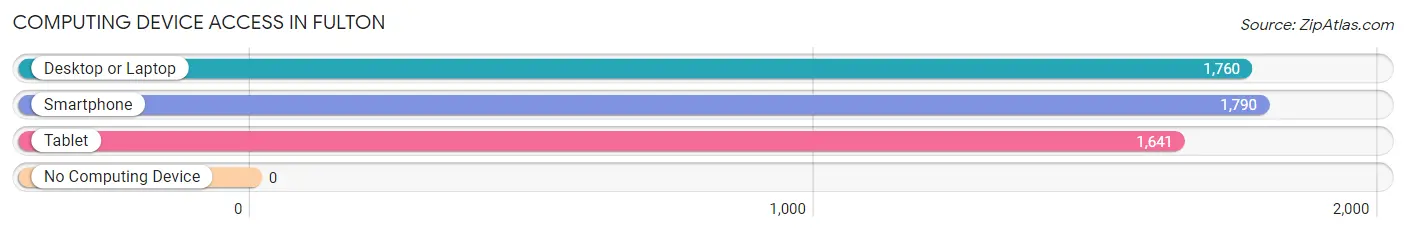
| Device Type | # Households | % Households |
| Desktop or Laptop | 1,760 | 96.6% |
| Smartphone | 1,790 | 98.2% |
| Tablet | 1,641 | 90.1% |
| No Computing Device | 0 | 0.0% |
| Total | 1,822 | 100.0% |
Internet Access in Fulton
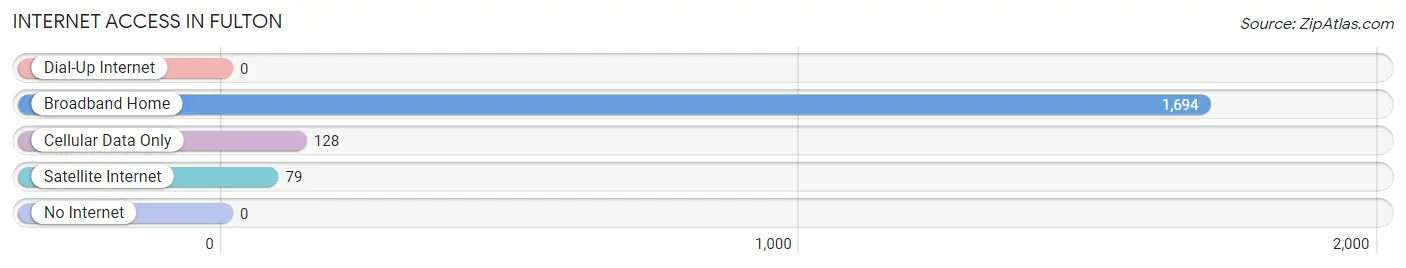
| Internet Type | # Households | % Households |
| Dial-Up Internet | 0 | 0.0% |
| Broadband Home | 1,694 | 93.0% |
| Cellular Data Only | 128 | 7.0% |
| Satellite Internet | 79 | 4.3% |
| No Internet | 0 | 0.0% |
| Total | 1,822 | 100.0% |
Fulton Summary
Fulton is a census-designated place (CDP) located in Howard County, Maryland, United States. It is situated between the cities of Columbia and Laurel, and is part of the Baltimore-Washington metropolitan area. As of the 2010 census, the population of Fulton was 8,489.
History
Fulton was first settled in the late 1700s by the Fulton family, who owned a large tract of land in the area. The family built a grist mill and a saw mill on the property, which were used to process grain and lumber for the local community. The area was known as “Fulton’s Mill” until the late 1800s, when the name was changed to “Fulton”.
In the early 1900s, the area began to develop as a residential community. The first post office was established in 1906, and the first school was built in 1908. The community continued to grow throughout the 20th century, and by the 2000 census, the population had grown to 8,489.
Geography
Fulton is located at 39°10′N 76°54′W (39.17, -76.90). According to the United States Census Bureau, the CDP has a total area of 4.2 square miles (10.8 km2), all of it land.
Economy
Fulton is primarily a residential community, but it does have a few businesses. The largest employer in the area is the Johns Hopkins Applied Physics Laboratory, which is located just outside of the CDP. Other businesses in the area include a few small retail stores, restaurants, and professional services.
Demographics
As of the 2010 census, there were 8,489 people, 3,093 households, and 2,092 families residing in the CDP. The population density was 2,019.3 people per square mile (779.2/km2). There were 3,309 housing units at an average density of 790.3 per square mile (305.3/km2). The racial makeup of the CDP was 68.2% White, 22.2% African American, 0.3% Native American, 5.2% Asian, 0.1% Pacific Islander, 1.3% from other races, and 2.7% from two or more races. Hispanic or Latino of any race were 4.2% of the population.
There were 3,093 households, out of which 33.2% had children under the age of 18 living with them, 51.2% were married couples living together, 11.7% had a female householder with no husband present, and 32.2% were non-families. 24.7% of all households were made up of individuals, and 8.2% had someone living alone who was 65 years of age or older. The average household size was 2.72 and the average family size was 3.25.
In the CDP, the population was spread out, with 25.3% under the age of 18, 7.2% from 18 to 24, 30.2% from 25 to 44, 25.2% from 45 to 64, and 12.1% who were 65 years of age or older. The median age was 37 years. For every 100 females, there were 94.2 males. For every 100 females age 18 and over, there were 91.2 males.
The median income for a household in the CDP was $76,945, and the median income for a family was $87,917. Males had a median income of $60,938 versus $45,938 for females. The per capita income for the CDP was $33,945. About 2.7% of families and 4.2% of the population were below the poverty line, including 4.3% of those under age 18 and 4.2% of those age 65 or over.
Common Questions
What is Per Capita Income in Fulton?
Per Capita income in Fulton is $97,869.
What is the Median Family Income in Fulton?
Median Family Income in Fulton is $247,019.
What is the Median Household income in Fulton?
Median Household Income in Fulton is $215,455.
What is Income or Wage Gap in Fulton?
Income or Wage Gap in Fulton is 11.6%.
Women in Fulton earn 88.4 cents for every dollar earned by a man.
What is Inequality or Gini Index in Fulton?
Inequality or Gini Index in Fulton is 0.42.
What is the Total Population of Fulton?
Total Population of Fulton is 5,435.
What is the Total Male Population of Fulton?
Total Male Population of Fulton is 2,825.
What is the Total Female Population of Fulton?
Total Female Population of Fulton is 2,610.
What is the Ratio of Males per 100 Females in Fulton?
There are 108.24 Males per 100 Females in Fulton.
What is the Ratio of Females per 100 Males in Fulton?
There are 92.39 Females per 100 Males in Fulton.
What is the Median Population Age in Fulton?
Median Population Age in Fulton is 39.3 Years.
What is the Average Family Size in Fulton
Average Family Size in Fulton is 3.4 People.
What is the Average Household Size in Fulton
Average Household Size in Fulton is 3.0 People.
How Large is the Labor Force in Fulton?
There are 3,017 People in the Labor Forcein in Fulton.
What is the Percentage of People in the Labor Force in Fulton?
78.1% of People are in the Labor Force in Fulton.
What is the Unemployment Rate in Fulton?
Unemployment Rate in Fulton is 1.2%.