Poquonock Bridge, CT Map & Demographics
Poquonock Bridge Map
Poquonock Bridge Overview
$29,079
PER CAPITA INCOME
$62,202
AVG FAMILY INCOME
$61,994
AVG HOUSEHOLD INCOME
38.8%
WAGE / INCOME GAP [ % ]
61.2¢/ $1
WAGE / INCOME GAP [ $ ]
0.40
INEQUALITY / GINI INDEX
1,390
TOTAL POPULATION
728
MALE POPULATION
662
FEMALE POPULATION
109.97
MALES / 100 FEMALES
90.93
FEMALES / 100 MALES
30.4
MEDIAN AGE
2.9
AVG FAMILY SIZE
2.8
AVG HOUSEHOLD SIZE
832
LABOR FORCE [ PEOPLE ]
80.5%
PERCENT IN LABOR FORCE
15.8%
UNEMPLOYMENT RATE
Income in Poquonock Bridge
Income Overview in Poquonock Bridge
Per Capita Income in Poquonock Bridge is $29,079, while median incomes of families and households are $62,202 and $61,994 respectively.
| Characteristic | Number | Measure |
| Per Capita Income | 1,390 | $29,079 |
| Median Family Income | 420 | $62,202 |
| Mean Family Income | 420 | $82,137 |
| Median Household Income | 501 | $61,994 |
| Mean Household Income | 501 | $78,803 |
| Income Deficit | 420 | $0 |
| Wage / Income Gap (%) | 1,390 | 38.77% |
| Wage / Income Gap ($) | 1,390 | 61.23¢ per $1 |
| Gini / Inequality Index | 1,390 | 0.40 |
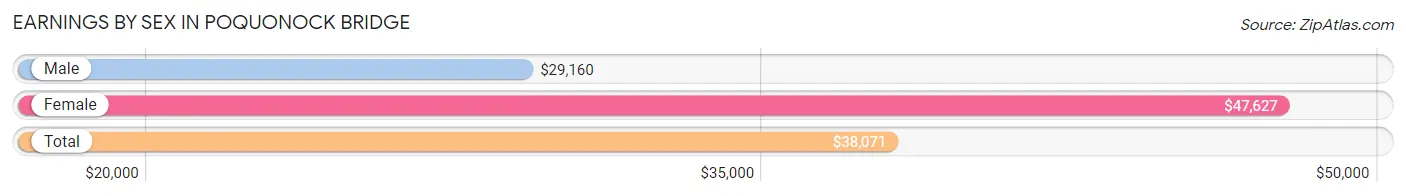
Earnings by Sex in Poquonock Bridge
Average Earnings in Poquonock Bridge are $38,071, $29,160 for men and $47,627 for women, a difference of 38.8%.
| Sex | Number | Average Earnings |
| Male | 389 (51.2%) | $29,160 |
| Female | 371 (48.8%) | $47,627 |
| Total | 760 (100.0%) | $38,071 |
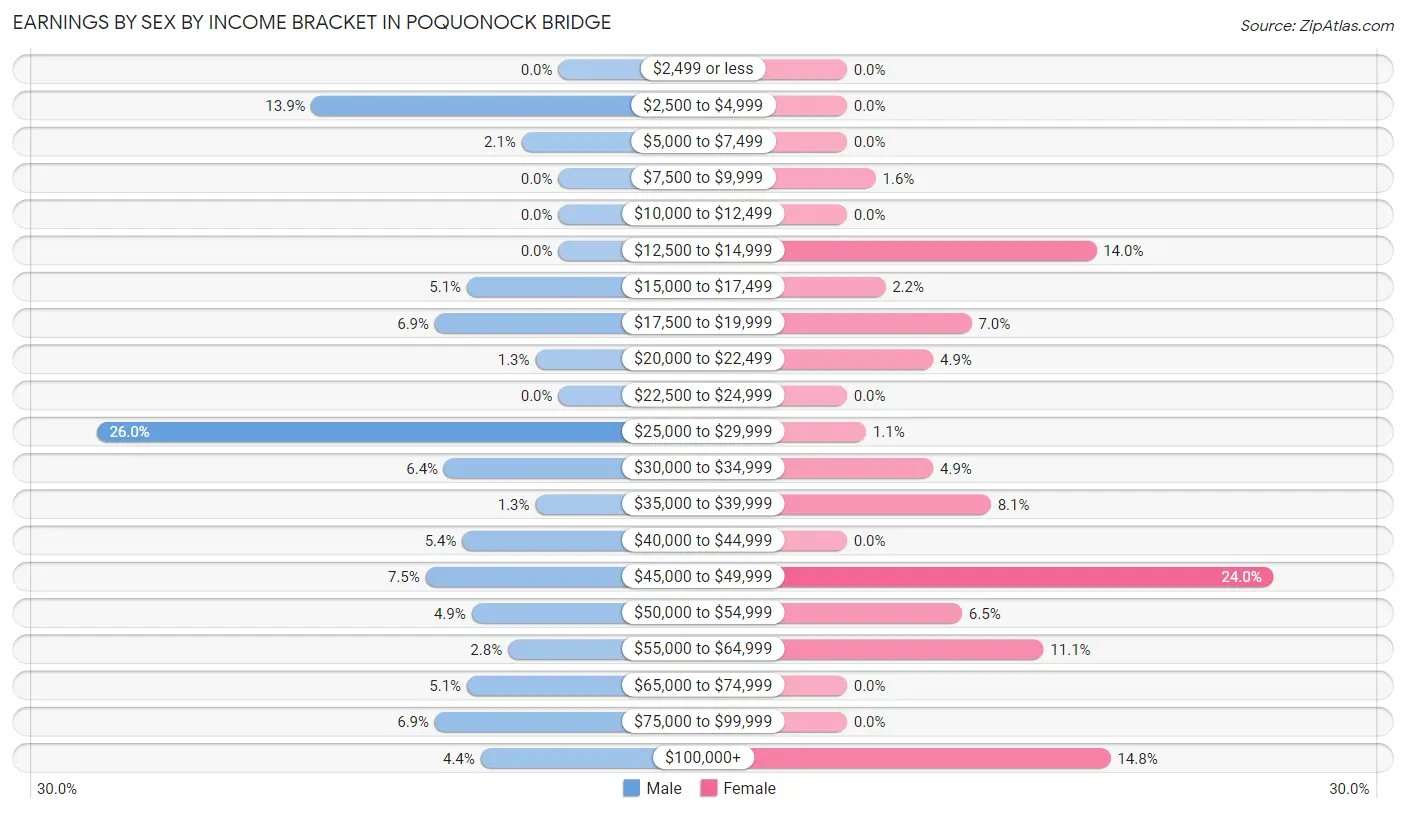
Earnings by Sex by Income Bracket in Poquonock Bridge
The most common earnings brackets in Poquonock Bridge are $25,000 to $29,999 for men (101 | 26.0%) and $45,000 to $49,999 for women (89 | 24.0%).
| Income | Male | Female |
| $2,499 or less | 0 (0.0%) | 0 (0.0%) |
| $2,500 to $4,999 | 54 (13.9%) | 0 (0.0%) |
| $5,000 to $7,499 | 8 (2.1%) | 0 (0.0%) |
| $7,500 to $9,999 | 0 (0.0%) | 6 (1.6%) |
| $10,000 to $12,499 | 0 (0.0%) | 0 (0.0%) |
| $12,500 to $14,999 | 0 (0.0%) | 52 (14.0%) |
| $15,000 to $17,499 | 20 (5.1%) | 8 (2.2%) |
| $17,500 to $19,999 | 27 (6.9%) | 26 (7.0%) |
| $20,000 to $22,499 | 5 (1.3%) | 18 (4.9%) |
| $22,500 to $24,999 | 0 (0.0%) | 0 (0.0%) |
| $25,000 to $29,999 | 101 (26.0%) | 4 (1.1%) |
| $30,000 to $34,999 | 25 (6.4%) | 18 (4.9%) |
| $35,000 to $39,999 | 5 (1.3%) | 30 (8.1%) |
| $40,000 to $44,999 | 21 (5.4%) | 0 (0.0%) |
| $45,000 to $49,999 | 29 (7.5%) | 89 (24.0%) |
| $50,000 to $54,999 | 19 (4.9%) | 24 (6.5%) |
| $55,000 to $64,999 | 11 (2.8%) | 41 (11.1%) |
| $65,000 to $74,999 | 20 (5.1%) | 0 (0.0%) |
| $75,000 to $99,999 | 27 (6.9%) | 0 (0.0%) |
| $100,000+ | 17 (4.4%) | 55 (14.8%) |
| Total | 389 (100.0%) | 371 (100.0%) |
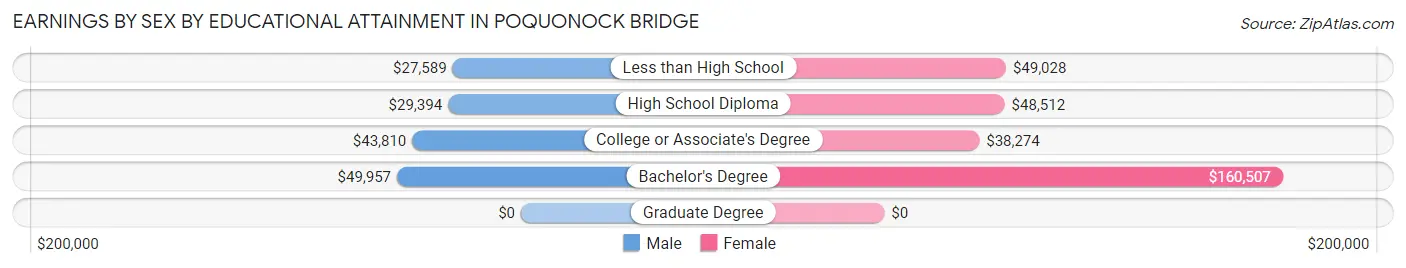
Earnings by Sex by Educational Attainment in Poquonock Bridge
Average earnings in Poquonock Bridge are $33,182 for men and $48,569 for women, a difference of 31.7%. Men with an educational attainment of bachelor's degree enjoy the highest average annual earnings of $49,957, while those with less than high school education earn the least with $27,589. Women with an educational attainment of bachelor's degree earn the most with the average annual earnings of $160,507, while those with college or associate's degree education have the smallest earnings of $38,274.
| Educational Attainment | Male Income | Female Income |
| Less than High School | $27,589 | $49,028 |
| High School Diploma | $29,394 | $48,512 |
| College or Associate's Degree | $43,810 | $38,274 |
| Bachelor's Degree | $49,957 | $160,507 |
| Graduate Degree | - | - |
| Total | $33,182 | $48,569 |
Family Income in Poquonock Bridge
Family Income Brackets in Poquonock Bridge
According to the Poquonock Bridge family income data, there are 109 families falling into the $25,000 to $34,999 income range, which is the most common income bracket and makes up 26.0% of all families.
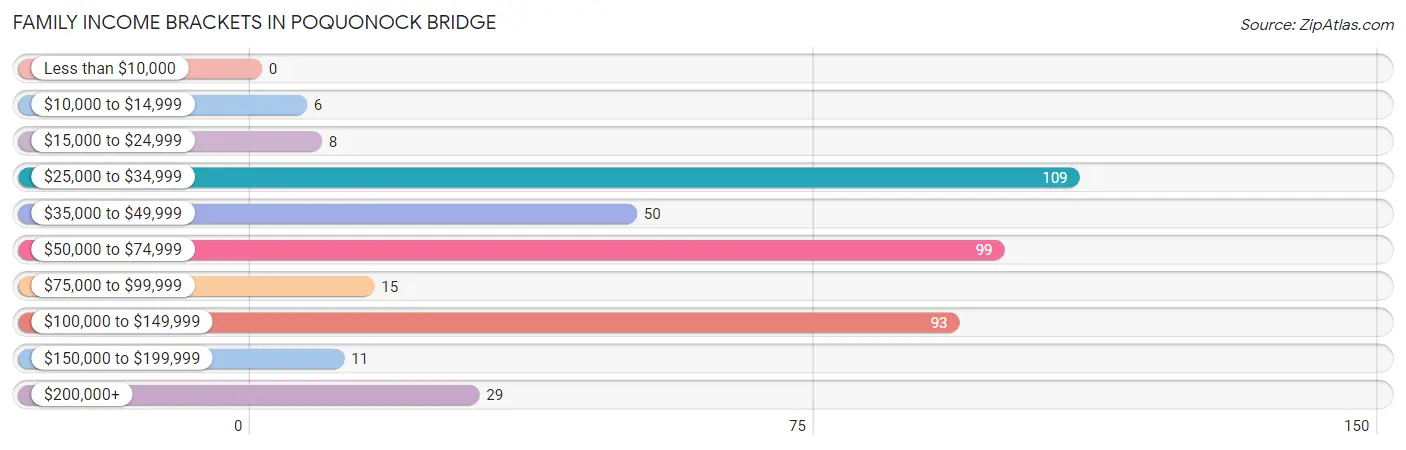
| Income Bracket | # Families | % Families |
| Less than $10,000 | 0 | 0.0% |
| $10,000 to $14,999 | 6 | 1.4% |
| $15,000 to $24,999 | 8 | 1.9% |
| $25,000 to $34,999 | 109 | 26.0% |
| $35,000 to $49,999 | 50 | 11.9% |
| $50,000 to $74,999 | 99 | 23.6% |
| $75,000 to $99,999 | 15 | 3.6% |
| $100,000 to $149,999 | 93 | 22.1% |
| $150,000 to $199,999 | 11 | 2.6% |
| $200,000+ | 29 | 6.9% |
Family Income by Famaliy Size in Poquonock Bridge
4-person families (46 | 11.0%) account for the highest median family income in Poquonock Bridge with $250,001 per family, while 4-person families (46 | 11.0%) have the highest median income of $62,500 per family member.
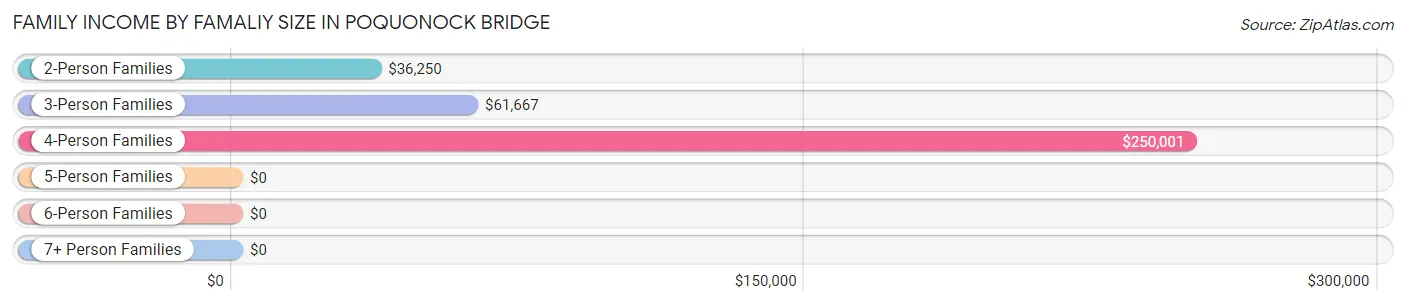
| Income Bracket | # Families | Median Income |
| 2-Person Families | 168 (40.0%) | $36,250 |
| 3-Person Families | 170 (40.5%) | $61,667 |
| 4-Person Families | 46 (11.0%) | $250,001 |
| 5-Person Families | 36 (8.6%) | $0 |
| 6-Person Families | 0 (0.0%) | $0 |
| 7+ Person Families | 0 (0.0%) | $0 |
| Total | 420 (100.0%) | $62,202 |
Family Income by Number of Earners in Poquonock Bridge
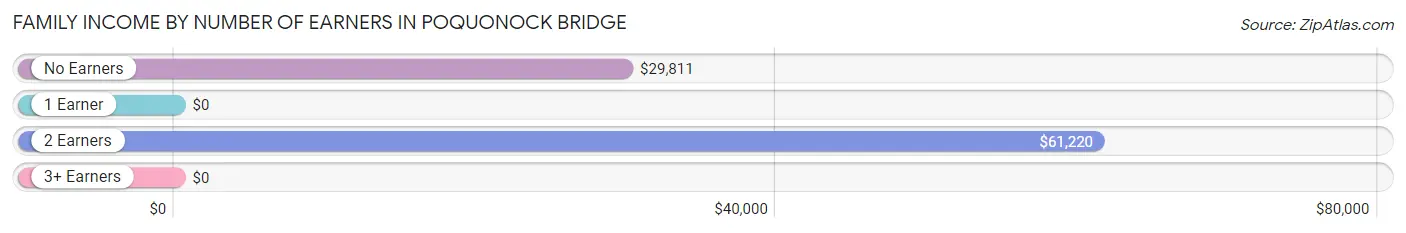
| Number of Earners | # Families | Median Income |
| No Earners | 61 (14.5%) | $29,811 |
| 1 Earner | 139 (33.1%) | $0 |
| 2 Earners | 161 (38.3%) | $61,220 |
| 3+ Earners | 59 (14.1%) | $0 |
| Total | 420 (100.0%) | $62,202 |
Household Income in Poquonock Bridge
Household Income Brackets in Poquonock Bridge
With 121 households falling in the category, the $50,000 to $74,999 income range is the most frequent in Poquonock Bridge, accounting for 24.1% of all households.
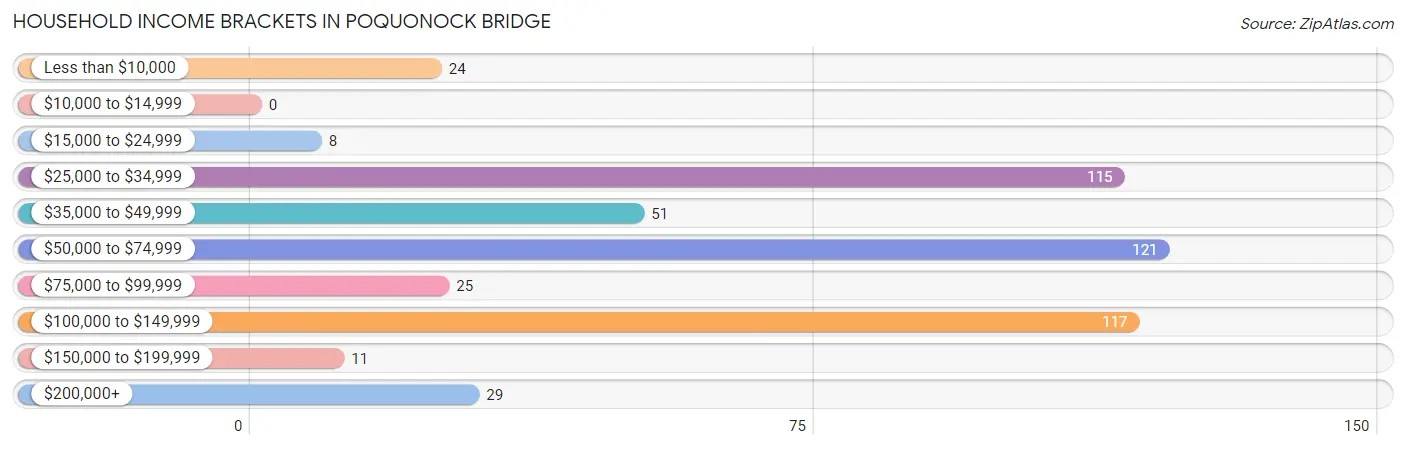
| Income Bracket | # Households | % Households |
| Less than $10,000 | 24 | 4.8% |
| $10,000 to $14,999 | 0 | 0.0% |
| $15,000 to $24,999 | 8 | 1.6% |
| $25,000 to $34,999 | 115 | 23.0% |
| $35,000 to $49,999 | 51 | 10.2% |
| $50,000 to $74,999 | 121 | 24.2% |
| $75,000 to $99,999 | 25 | 5.0% |
| $100,000 to $149,999 | 117 | 23.4% |
| $150,000 to $199,999 | 11 | 2.2% |
| $200,000+ | 29 | 5.8% |
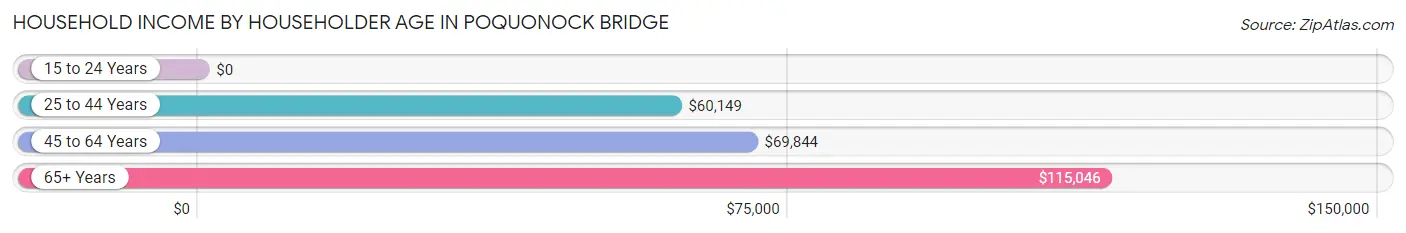
Household Income by Householder Age in Poquonock Bridge
The median household income in Poquonock Bridge is $61,994, with the highest median household income of $115,046 found in the 65+ years age bracket for the primary householder. A total of 75 households (15.0%) fall into this category. Meanwhile, the 15 to 24 years age bracket for the primary householder has the lowest median household income of $0, with 6 households (1.2%) in this group.
| Income Bracket | # Households | Median Income |
| 15 to 24 Years | 6 (1.2%) | $0 |
| 25 to 44 Years | 277 (55.3%) | $60,149 |
| 45 to 64 Years | 143 (28.5%) | $69,844 |
| 65+ Years | 75 (15.0%) | $115,046 |
| Total | 501 (100.0%) | $61,994 |
Poverty in Poquonock Bridge
Income Below Poverty by Sex and Age in Poquonock Bridge
With 7.1% poverty level for males and 8.0% for females among the residents of Poquonock Bridge, 45 to 54 year old males and 16 and 17 year old females are the most vulnerable to poverty, with 14 males (26.4%) and 7 females (100.0%) in their respective age groups living below the poverty level.
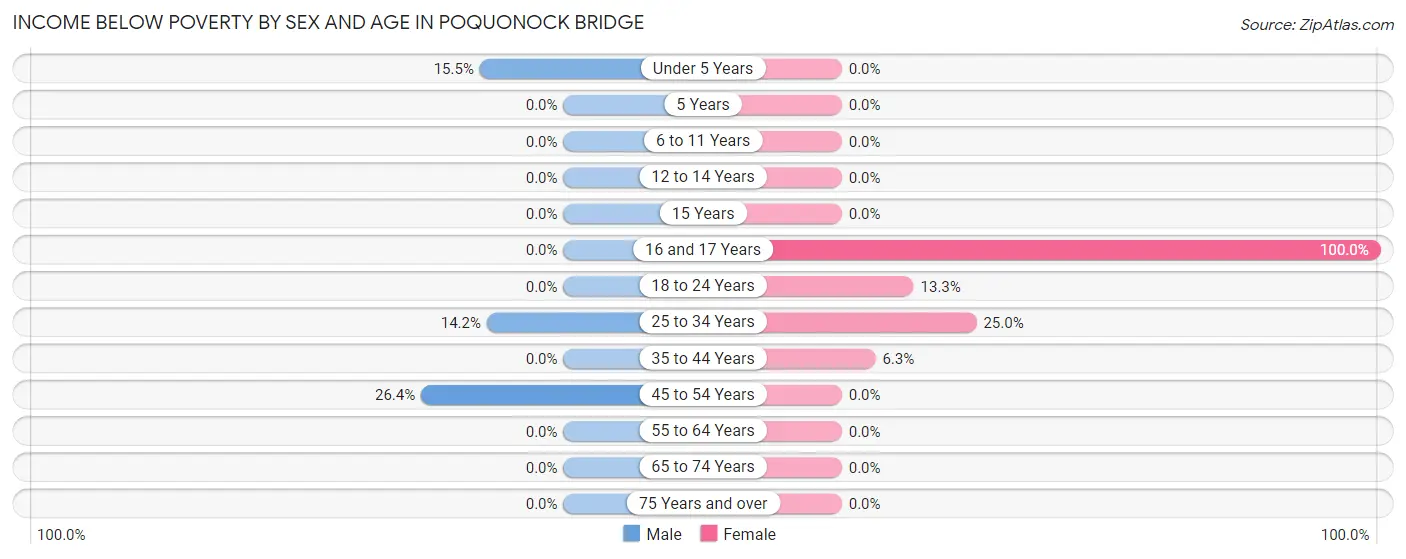
| Age Bracket | Male | Female |
| Under 5 Years | 9 (15.5%) | 0 (0.0%) |
| 5 Years | 0 (0.0%) | 0 (0.0%) |
| 6 to 11 Years | 0 (0.0%) | 0 (0.0%) |
| 12 to 14 Years | 0 (0.0%) | 0 (0.0%) |
| 15 Years | 0 (0.0%) | 0 (0.0%) |
| 16 and 17 Years | 0 (0.0%) | 7 (100.0%) |
| 18 to 24 Years | 0 (0.0%) | 8 (13.3%) |
| 25 to 34 Years | 28 (14.2%) | 32 (25.0%) |
| 35 to 44 Years | 0 (0.0%) | 6 (6.2%) |
| 45 to 54 Years | 14 (26.4%) | 0 (0.0%) |
| 55 to 64 Years | 0 (0.0%) | 0 (0.0%) |
| 65 to 74 Years | 0 (0.0%) | 0 (0.0%) |
| 75 Years and over | 0 (0.0%) | 0 (0.0%) |
| Total | 51 (7.1%) | 53 (8.0%) |
Income Above Poverty by Sex and Age in Poquonock Bridge
According to the poverty statistics in Poquonock Bridge, males aged 6 to 11 years and females aged under 5 years are the age groups that are most secure financially, with 100.0% of males and 100.0% of females in these age groups living above the poverty line.
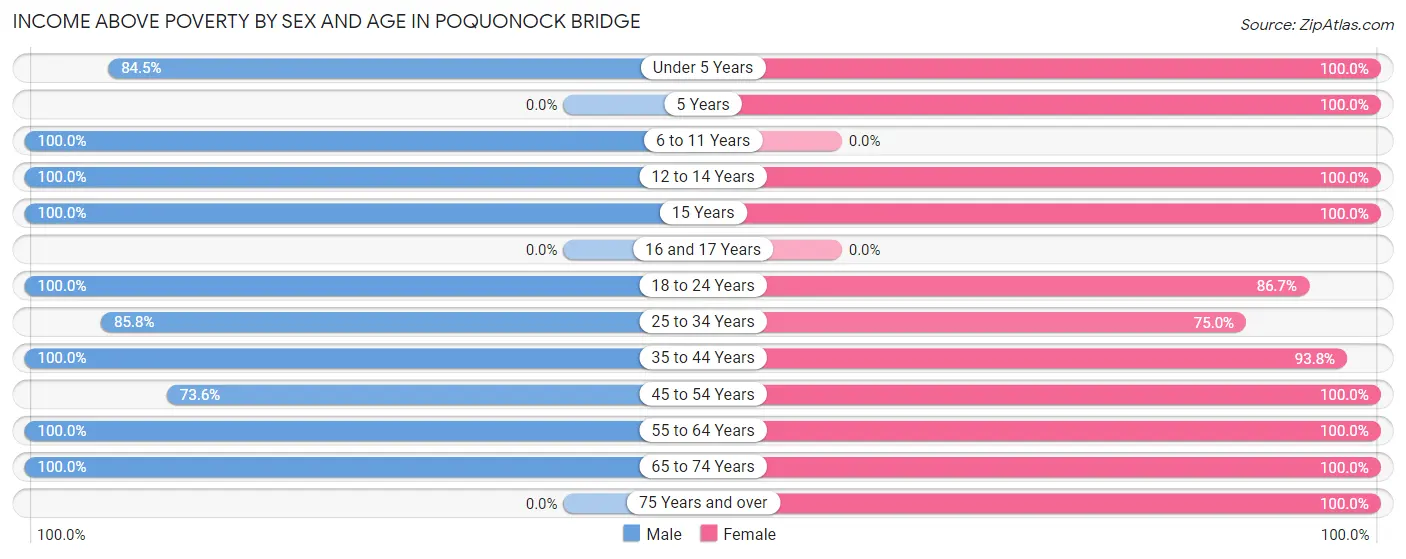
| Age Bracket | Male | Female |
| Under 5 Years | 49 (84.5%) | 19 (100.0%) |
| 5 Years | 0 (0.0%) | 17 (100.0%) |
| 6 to 11 Years | 117 (100.0%) | 0 (0.0%) |
| 12 to 14 Years | 42 (100.0%) | 42 (100.0%) |
| 15 Years | 15 (100.0%) | 36 (100.0%) |
| 16 and 17 Years | 0 (0.0%) | 0 (0.0%) |
| 18 to 24 Years | 81 (100.0%) | 52 (86.7%) |
| 25 to 34 Years | 169 (85.8%) | 96 (75.0%) |
| 35 to 44 Years | 16 (100.0%) | 90 (93.8%) |
| 45 to 54 Years | 39 (73.6%) | 143 (100.0%) |
| 55 to 64 Years | 90 (100.0%) | 50 (100.0%) |
| 65 to 74 Years | 48 (100.0%) | 37 (100.0%) |
| 75 Years and over | 0 (0.0%) | 27 (100.0%) |
| Total | 666 (92.9%) | 609 (92.0%) |
Income Below Poverty Among Married-Couple Families in Poquonock Bridge
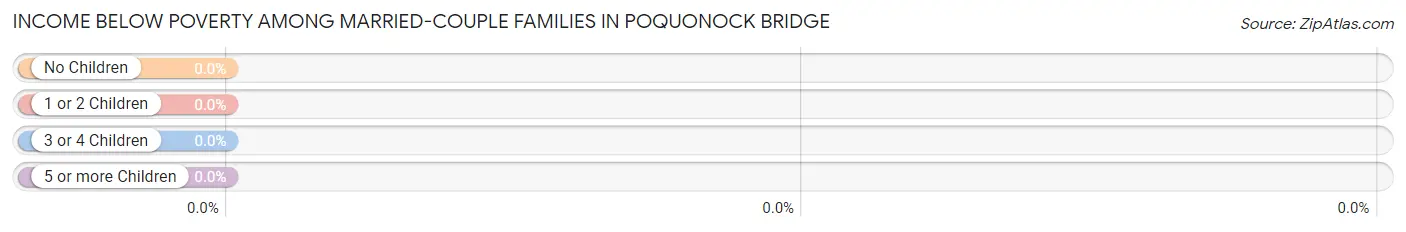
| Children | Above Poverty | Below Poverty |
| No Children | 105 (100.0%) | 0 (0.0%) |
| 1 or 2 Children | 76 (100.0%) | 0 (0.0%) |
| 3 or 4 Children | 15 (100.0%) | 0 (0.0%) |
| 5 or more Children | 0 (0.0%) | 0 (0.0%) |
| Total | 196 (100.0%) | 0 (0.0%) |
Income Below Poverty Among Single-Parent Households in Poquonock Bridge
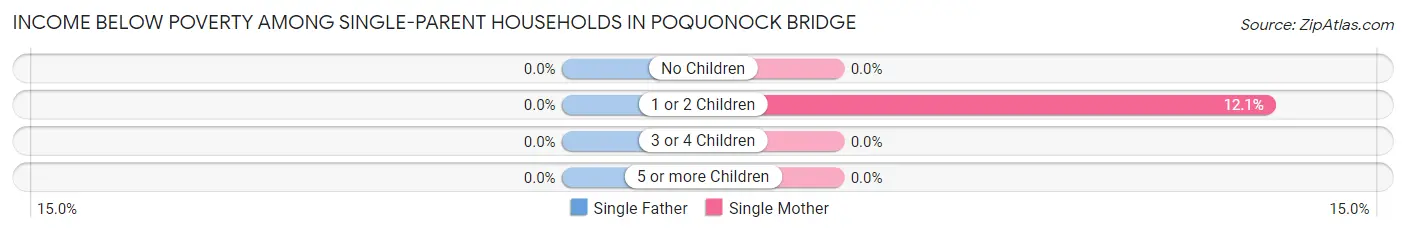
| Children | Single Father | Single Mother |
| No Children | 0 (0.0%) | 0 (0.0%) |
| 1 or 2 Children | 0 (0.0%) | 14 (12.1%) |
| 3 or 4 Children | 0 (0.0%) | 0 (0.0%) |
| 5 or more Children | 0 (0.0%) | 0 (0.0%) |
| Total | 0 (0.0%) | 14 (8.9%) |
Income Below Poverty Among Married-Couple vs Single-Parent Households in Poquonock Bridge
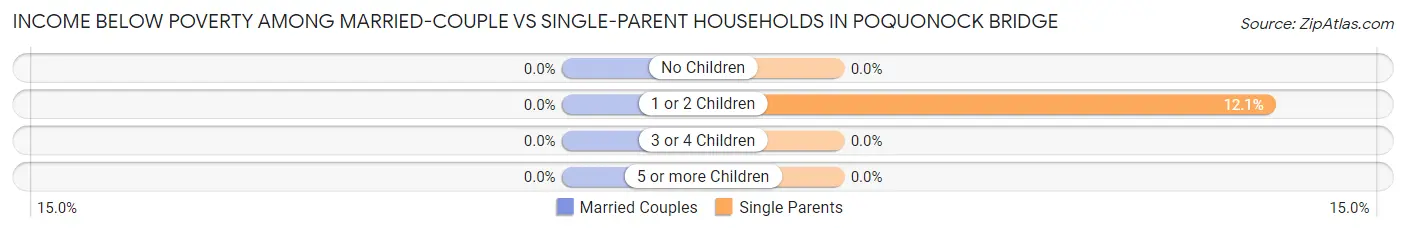
| Children | Married-Couple Families | Single-Parent Households |
| No Children | 0 (0.0%) | 0 (0.0%) |
| 1 or 2 Children | 0 (0.0%) | 14 (12.1%) |
| 3 or 4 Children | 0 (0.0%) | 0 (0.0%) |
| 5 or more Children | 0 (0.0%) | 0 (0.0%) |
| Total | 0 (0.0%) | 14 (6.2%) |
Race in Poquonock Bridge
The most populous races in Poquonock Bridge are White / Caucasian (852 | 61.3%), Hispanic or Latino (396 | 28.5%), and Two or more Races (301 | 21.6%).
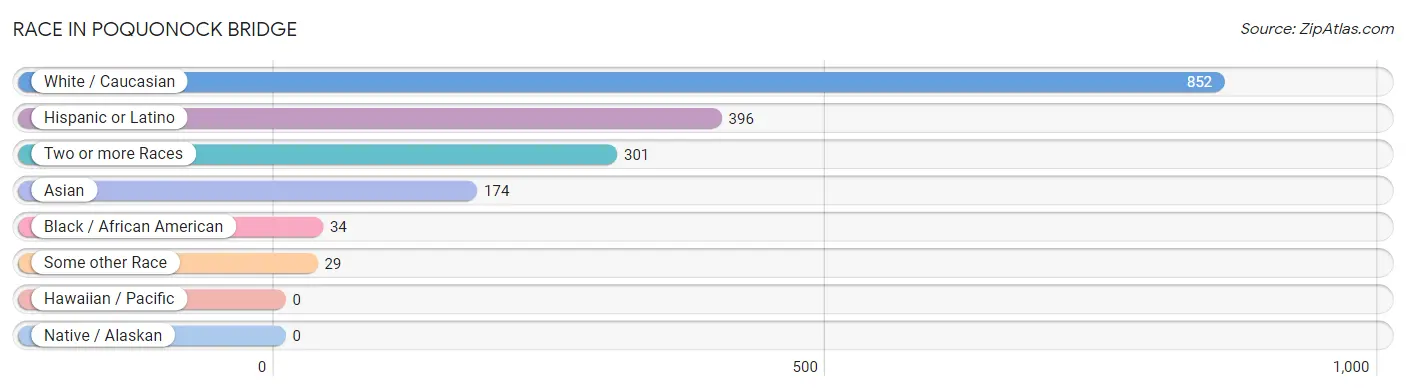
| Race | # Population | % Population |
| Asian | 174 | 12.5% |
| Black / African American | 34 | 2.5% |
| Hawaiian / Pacific | 0 | 0.0% |
| Hispanic or Latino | 396 | 28.5% |
| Native / Alaskan | 0 | 0.0% |
| White / Caucasian | 852 | 61.3% |
| Two or more Races | 301 | 21.6% |
| Some other Race | 29 | 2.1% |
| Total | 1,390 | 100.0% |
Ancestry in Poquonock Bridge
The most populous ancestries reported in Poquonock Bridge are Central American (181 | 13.0%), Korean (154 | 11.1%), Puerto Rican (136 | 9.8%), Salvadoran (132 | 9.5%), and German (130 | 9.3%), together accounting for 52.7% of all Poquonock Bridge residents.
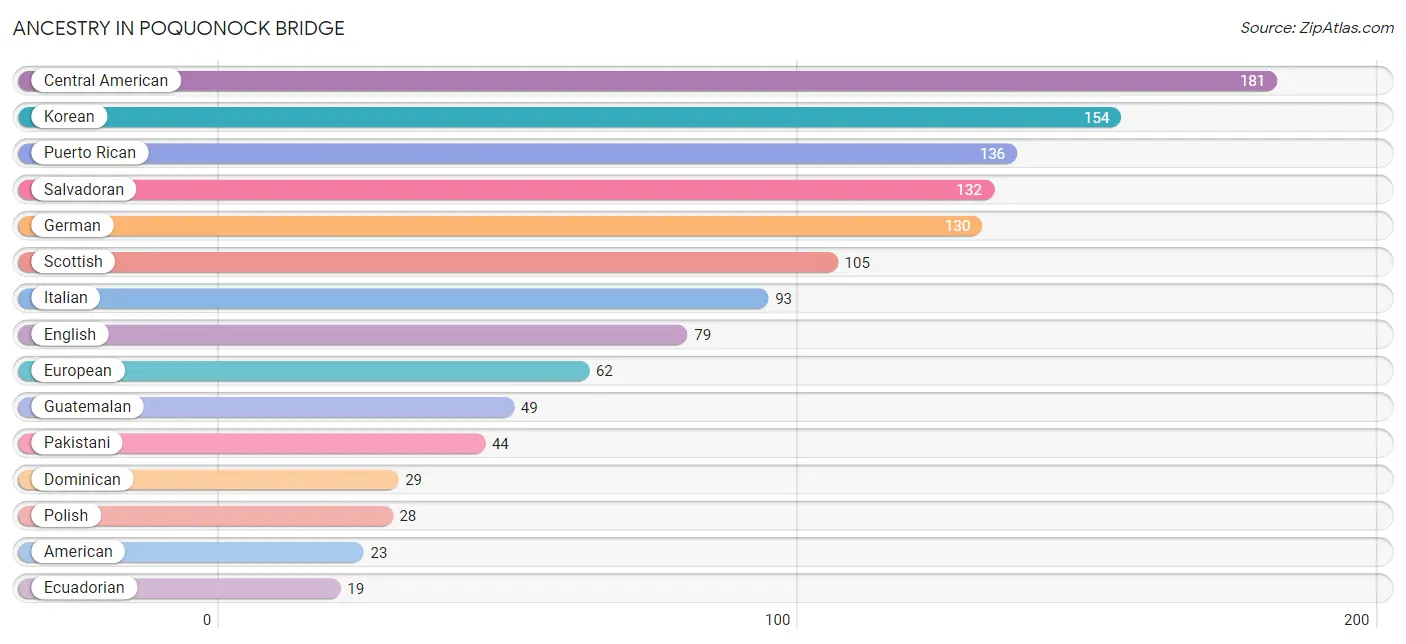
| Ancestry | # Population | % Population |
| American | 23 | 1.7% |
| Austrian | 11 | 0.8% |
| Central American | 181 | 13.0% |
| Dominican | 29 | 2.1% |
| Ecuadorian | 19 | 1.4% |
| English | 79 | 5.7% |
| European | 62 | 4.5% |
| Finnish | 17 | 1.2% |
| French | 19 | 1.4% |
| French Canadian | 8 | 0.6% |
| German | 130 | 9.3% |
| Guatemalan | 49 | 3.5% |
| Irish | 18 | 1.3% |
| Italian | 93 | 6.7% |
| Korean | 154 | 11.1% |
| Mexican | 17 | 1.2% |
| Pakistani | 44 | 3.2% |
| Polish | 28 | 2.0% |
| Portuguese | 15 | 1.1% |
| Puerto Rican | 136 | 9.8% |
| Salvadoran | 132 | 9.5% |
| Scottish | 105 | 7.5% |
| South American | 19 | 1.4% |
| Swedish | 18 | 1.3% | View All 24 Rows |
Immigrants in Poquonock Bridge
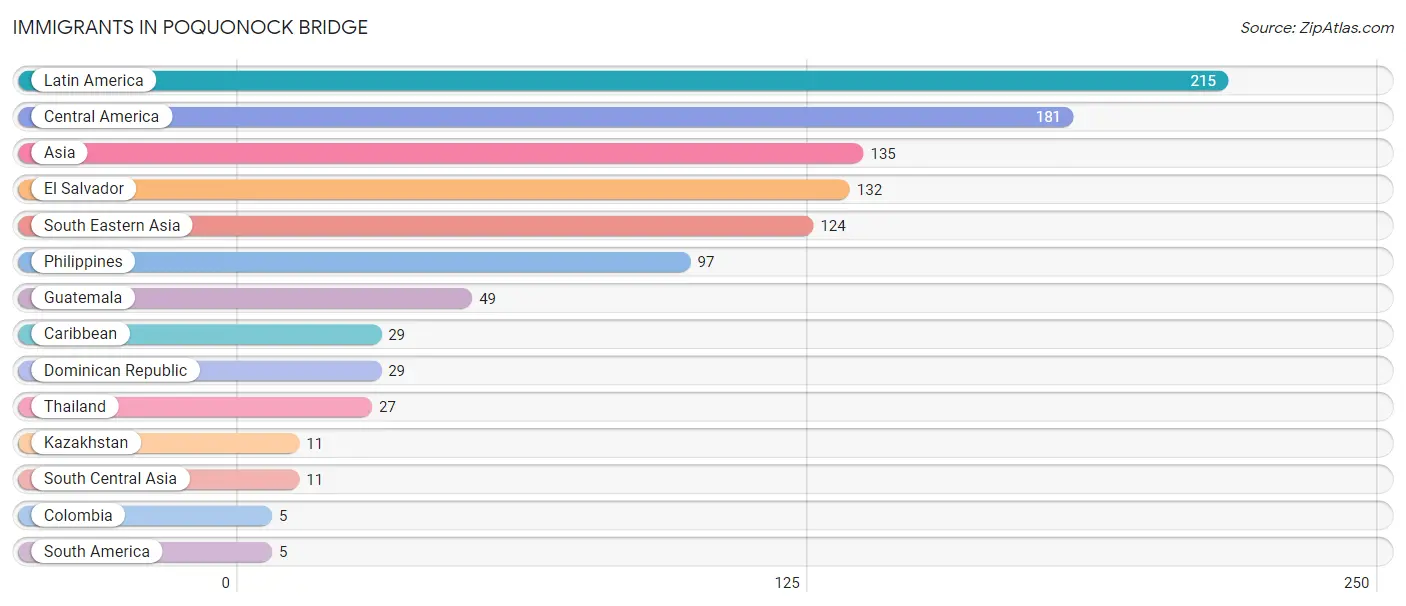
The most numerous immigrant groups reported in Poquonock Bridge came from Latin America (215 | 15.5%), Central America (181 | 13.0%), Asia (135 | 9.7%), El Salvador (132 | 9.5%), and South Eastern Asia (124 | 8.9%), together accounting for 56.6% of all Poquonock Bridge residents.
| Immigration Origin | # Population | % Population |
| Asia | 135 | 9.7% |
| Caribbean | 29 | 2.1% |
| Central America | 181 | 13.0% |
| Colombia | 5 | 0.4% |
| Dominican Republic | 29 | 2.1% |
| El Salvador | 132 | 9.5% |
| Guatemala | 49 | 3.5% |
| Kazakhstan | 11 | 0.8% |
| Latin America | 215 | 15.5% |
| Philippines | 97 | 7.0% |
| South America | 5 | 0.4% |
| South Central Asia | 11 | 0.8% |
| South Eastern Asia | 124 | 8.9% |
| Thailand | 27 | 1.9% | View All 14 Rows |
Sex and Age in Poquonock Bridge
Sex and Age in Poquonock Bridge
The most populous age groups in Poquonock Bridge are 25 to 29 Years (131 | 18.0%) for men and 50 to 54 Years (105 | 15.9%) for women.
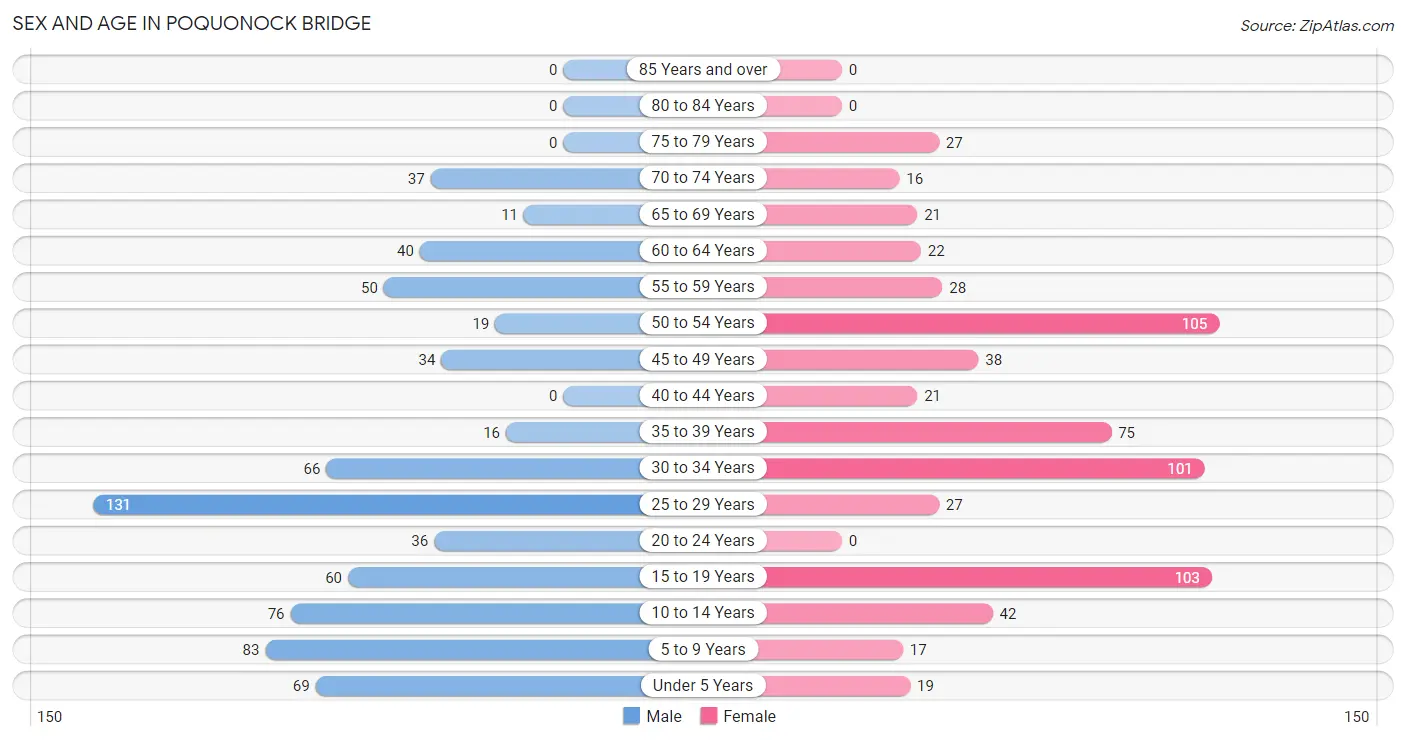
| Age Bracket | Male | Female |
| Under 5 Years | 69 (9.5%) | 19 (2.9%) |
| 5 to 9 Years | 83 (11.4%) | 17 (2.6%) |
| 10 to 14 Years | 76 (10.4%) | 42 (6.3%) |
| 15 to 19 Years | 60 (8.2%) | 103 (15.6%) |
| 20 to 24 Years | 36 (5.0%) | 0 (0.0%) |
| 25 to 29 Years | 131 (18.0%) | 27 (4.1%) |
| 30 to 34 Years | 66 (9.1%) | 101 (15.3%) |
| 35 to 39 Years | 16 (2.2%) | 75 (11.3%) |
| 40 to 44 Years | 0 (0.0%) | 21 (3.2%) |
| 45 to 49 Years | 34 (4.7%) | 38 (5.7%) |
| 50 to 54 Years | 19 (2.6%) | 105 (15.9%) |
| 55 to 59 Years | 50 (6.9%) | 28 (4.2%) |
| 60 to 64 Years | 40 (5.5%) | 22 (3.3%) |
| 65 to 69 Years | 11 (1.5%) | 21 (3.2%) |
| 70 to 74 Years | 37 (5.1%) | 16 (2.4%) |
| 75 to 79 Years | 0 (0.0%) | 27 (4.1%) |
| 80 to 84 Years | 0 (0.0%) | 0 (0.0%) |
| 85 Years and over | 0 (0.0%) | 0 (0.0%) |
| Total | 728 (100.0%) | 662 (100.0%) |
Families and Households in Poquonock Bridge
Median Family Size in Poquonock Bridge
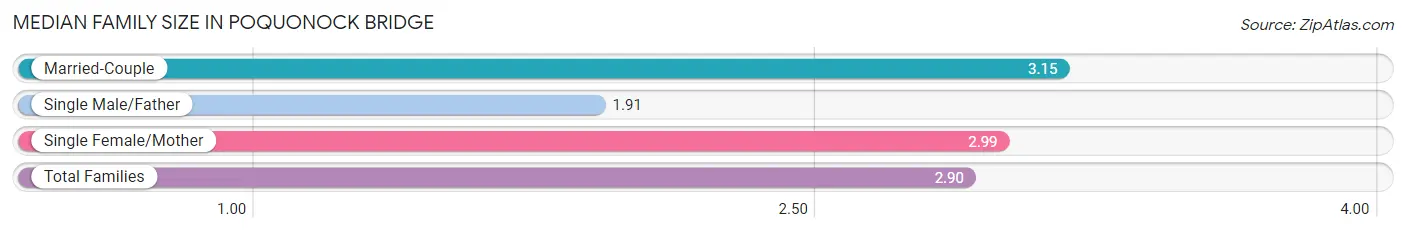
The median family size in Poquonock Bridge is 2.90 persons per family, with married-couple families (196 | 46.7%) accounting for the largest median family size of 3.15 persons per family. On the other hand, single male/father families (66 | 15.7%) represent the smallest median family size with 1.91 persons per family.
| Family Type | # Families | Family Size |
| Married-Couple | 196 (46.7%) | 3.15 |
| Single Male/Father | 66 (15.7%) | 1.91 |
| Single Female/Mother | 158 (37.6%) | 2.99 |
| Total Families | 420 (100.0%) | 2.90 |
Median Household Size in Poquonock Bridge
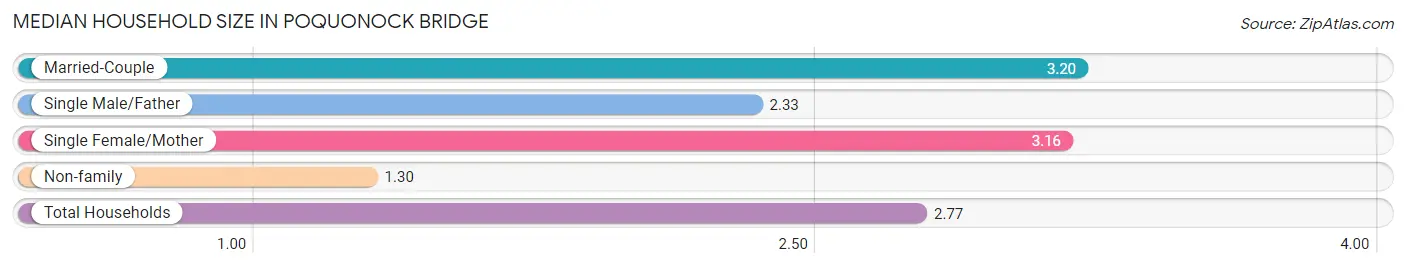
The median household size in Poquonock Bridge is 2.77 persons per household, with married-couple households (196 | 39.1%) accounting for the largest median household size of 3.2 persons per household. non-family households (81 | 16.2%) represent the smallest median household size with 1.30 persons per household.
| Household Type | # Households | Household Size |
| Married-Couple | 196 (39.1%) | 3.20 |
| Single Male/Father | 66 (13.2%) | 2.33 |
| Single Female/Mother | 158 (31.5%) | 3.16 |
| Non-family | 81 (16.2%) | 1.30 |
| Total Households | 501 (100.0%) | 2.77 |
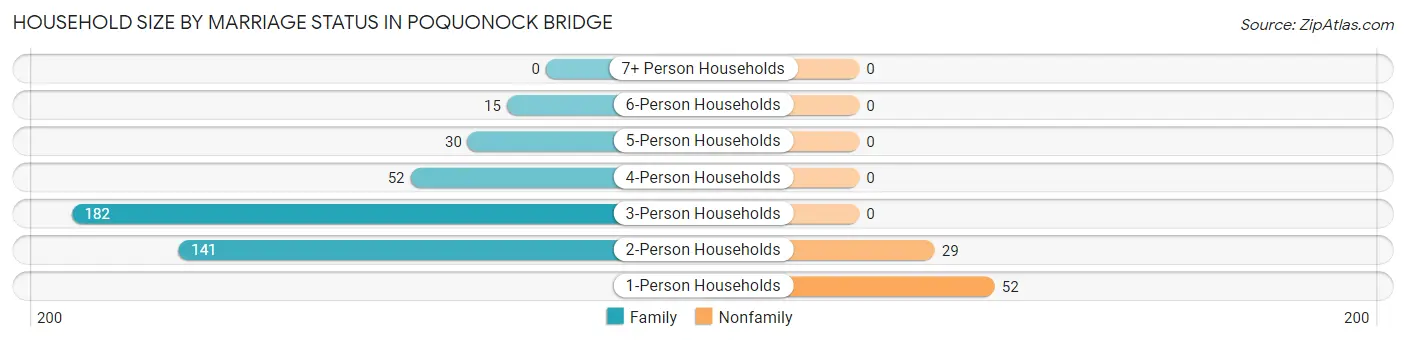
Household Size by Marriage Status in Poquonock Bridge
Out of a total of 501 households in Poquonock Bridge, 420 (83.8%) are family households, while 81 (16.2%) are nonfamily households. The most numerous type of family households are 3-person households, comprising 182, and the most common type of nonfamily households are 1-person households, comprising 52.
| Household Size | Family Households | Nonfamily Households |
| 1-Person Households | - | 52 (10.4%) |
| 2-Person Households | 141 (28.1%) | 29 (5.8%) |
| 3-Person Households | 182 (36.3%) | 0 (0.0%) |
| 4-Person Households | 52 (10.4%) | 0 (0.0%) |
| 5-Person Households | 30 (6.0%) | 0 (0.0%) |
| 6-Person Households | 15 (3.0%) | 0 (0.0%) |
| 7+ Person Households | 0 (0.0%) | 0 (0.0%) |
| Total | 420 (83.8%) | 81 (16.2%) |
Female Fertility in Poquonock Bridge
Fertility by Age in Poquonock Bridge
| Age Bracket | Women with Births | Births / 1,000 Women |
| 15 to 19 years | 0 (0.0%) | 0.0 |
| 20 to 34 years | 0 (0.0%) | 0.0 |
| 35 to 50 years | 0 (0.0%) | 0.0 |
| Total | 0 (0.0%) | 0.0 |
Fertility by Age by Marriage Status in Poquonock Bridge
| Age Bracket | Married | Unmarried |
| 15 to 19 years | 0 (0.0%) | 0 (0.0%) |
| 20 to 34 years | 0 (0.0%) | 0 (0.0%) |
| 35 to 50 years | 0 (0.0%) | 0 (0.0%) |
| Total | 0 (0.0%) | 0 (0.0%) |
Fertility by Education in Poquonock Bridge
| Educational Attainment | Women with Births | Births / 1,000 Women |
| Less than High School | 0 (0.0%) | 0.0 |
| High School Diploma | 0 (0.0%) | 0.0 |
| College or Associate's Degree | 0 (0.0%) | 0.0 |
| Bachelor's Degree | 0 (0.0%) | 0.0 |
| Graduate Degree | 0 (0.0%) | 0.0 |
| Total | 0 (0.0%) | 0.0 |
Fertility by Education by Marriage Status in Poquonock Bridge
| Educational Attainment | Married | Unmarried |
| Less than High School | 0 (0.0%) | 0 (0.0%) |
| High School Diploma | 0 (0.0%) | 0 (0.0%) |
| College or Associate's Degree | 0 (0.0%) | 0 (0.0%) |
| Bachelor's Degree | 0 (0.0%) | 0 (0.0%) |
| Graduate Degree | 0 (0.0%) | 0 (0.0%) |
| Total | 0 (0.0%) | 0 (0.0%) |
Employment Characteristics in Poquonock Bridge
Employment by Class of Employer in Poquonock Bridge
Among the 683 employed individuals in Poquonock Bridge, private company employees (527 | 77.2%), self-employed (not incorporated) (48 | 7.0%), and local government employees (34 | 5.0%) make up the most common classes of employment.
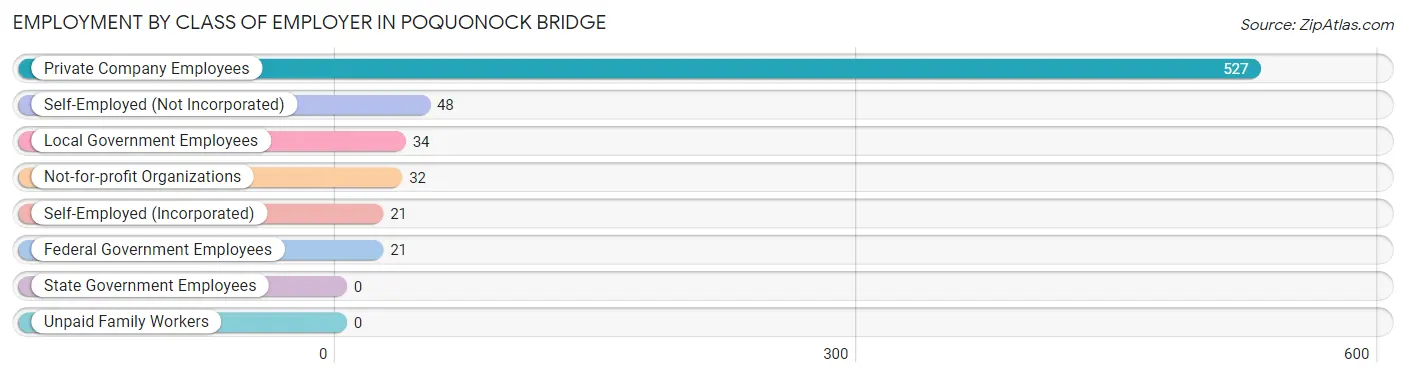
| Employer Class | # Employees | % Employees |
| Private Company Employees | 527 | 77.2% |
| Self-Employed (Incorporated) | 21 | 3.1% |
| Self-Employed (Not Incorporated) | 48 | 7.0% |
| Not-for-profit Organizations | 32 | 4.7% |
| Local Government Employees | 34 | 5.0% |
| State Government Employees | 0 | 0.0% |
| Federal Government Employees | 21 | 3.1% |
| Unpaid Family Workers | 0 | 0.0% |
| Total | 683 | 100.0% |
Employment Status by Age in Poquonock Bridge
According to the labor force statistics for Poquonock Bridge, out of the total population over 16 years of age (1,033), 80.5% or 832 individuals are in the labor force, with 15.8% or 131 of them unemployed. The age group with the highest labor force participation rate is 20 to 24 years, with 100.0% or 36 individuals in the labor force. Within the labor force, the 35 to 44 years age range has the highest percentage of unemployed individuals, with 39.3% or 44 of them being unemployed.
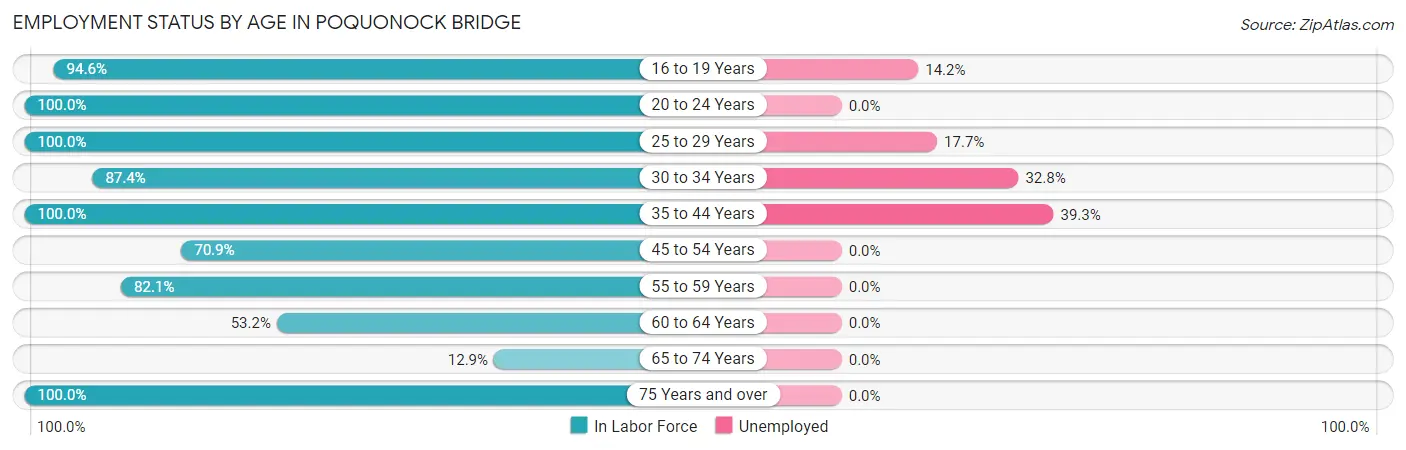
| Age Bracket | In Labor Force | Unemployed |
| 16 to 19 Years | 106 (94.6%) | 15 (14.2%) |
| 20 to 24 Years | 36 (100.0%) | 0 (0.0%) |
| 25 to 29 Years | 158 (100.0%) | 28 (17.7%) |
| 30 to 34 Years | 146 (87.4%) | 48 (32.8%) |
| 35 to 44 Years | 112 (100.0%) | 44 (39.3%) |
| 45 to 54 Years | 139 (70.9%) | 0 (0.0%) |
| 55 to 59 Years | 64 (82.1%) | 0 (0.0%) |
| 60 to 64 Years | 33 (53.2%) | 0 (0.0%) |
| 65 to 74 Years | 11 (12.9%) | 0 (0.0%) |
| 75 Years and over | 27 (100.0%) | 0 (0.0%) |
| Total | 832 (80.5%) | 131 (15.8%) |
Employment Status by Educational Attainment in Poquonock Bridge
According to labor force statistics for Poquonock Bridge, 84.3% of individuals (652) out of the total population between 25 and 64 years of age (773) are in the labor force, with 18.0% or 117 of them being unemployed. The group with the highest labor force participation rate are those with the educational attainment of bachelor's degree or higher, with 97.4% or 148 individuals in the labor force. Within the labor force, individuals with high school diploma education have the highest percentage of unemployment, with 27.9% or 53 of them being unemployed.
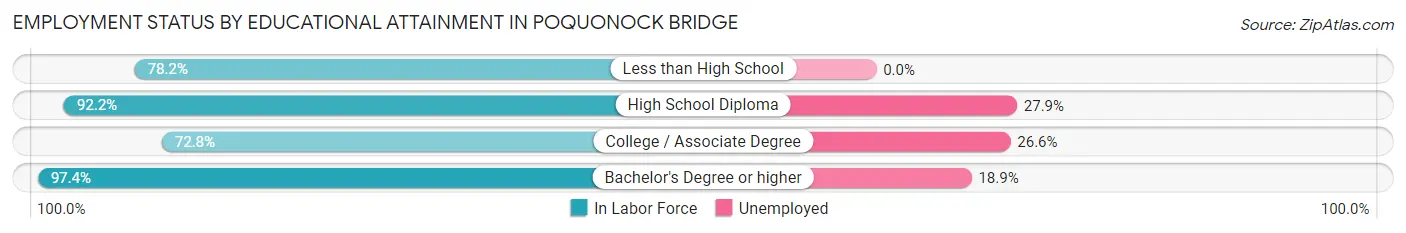
| Educational Attainment | In Labor Force | Unemployed |
| Less than High School | 172 (78.2%) | 0 (0.0%) |
| High School Diploma | 190 (92.2%) | 57 (27.9%) |
| College / Associate Degree | 142 (72.8%) | 52 (26.6%) |
| Bachelor's Degree or higher | 148 (97.4%) | 29 (18.9%) |
| Total | 652 (84.3%) | 139 (18.0%) |
Employment Occupations by Sex in Poquonock Bridge
Management, Business, Science and Arts Occupations
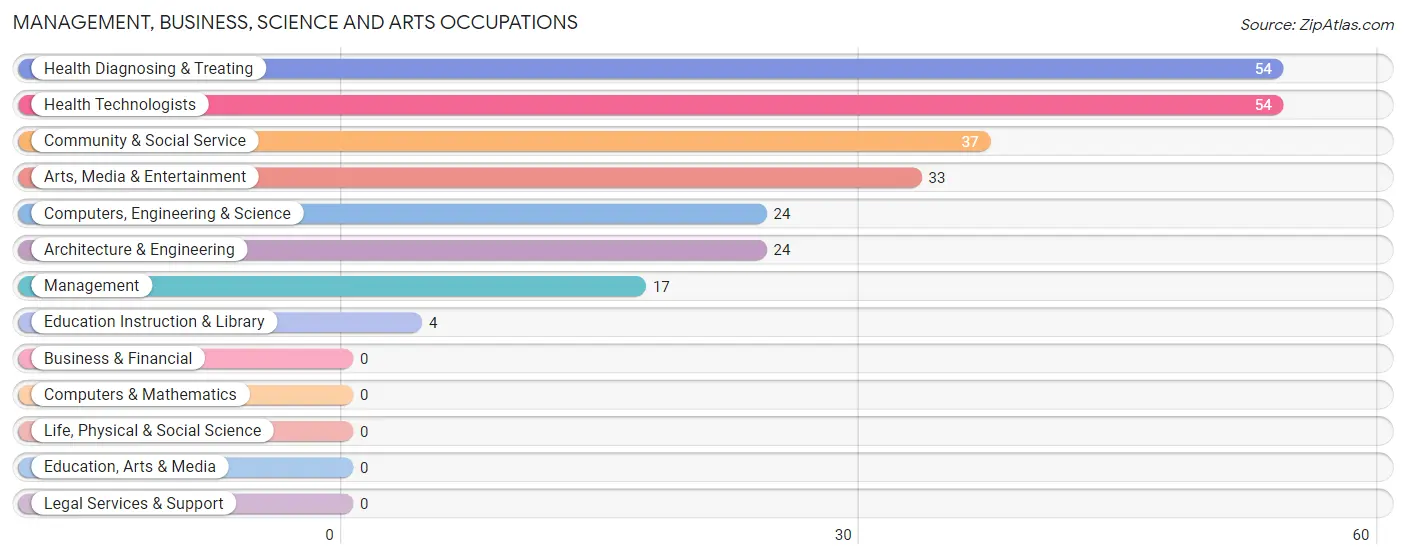
The most common Management, Business, Science and Arts occupations in Poquonock Bridge are Health Diagnosing & Treating (54 | 7.9%), Health Technologists (54 | 7.9%), Community & Social Service (37 | 5.4%), Arts, Media & Entertainment (33 | 4.8%), and Computers, Engineering & Science (24 | 3.5%).
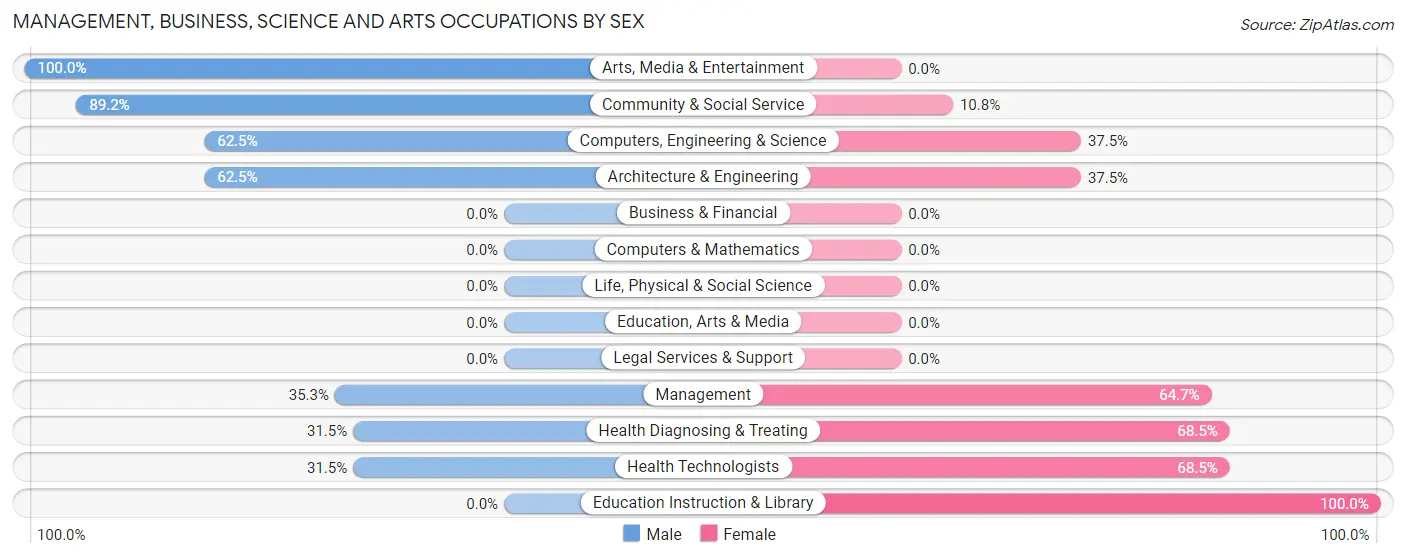
Management, Business, Science and Arts Occupations by Sex
Within the Management, Business, Science and Arts occupations in Poquonock Bridge, the most male-oriented occupations are Arts, Media & Entertainment (100.0%), Community & Social Service (89.2%), and Computers, Engineering & Science (62.5%), while the most female-oriented occupations are Education Instruction & Library (100.0%), Health Diagnosing & Treating (68.5%), and Health Technologists (68.5%).
| Occupation | Male | Female |
| Management | 6 (35.3%) | 11 (64.7%) |
| Business & Financial | 0 (0.0%) | 0 (0.0%) |
| Computers, Engineering & Science | 15 (62.5%) | 9 (37.5%) |
| Computers & Mathematics | 0 (0.0%) | 0 (0.0%) |
| Architecture & Engineering | 15 (62.5%) | 9 (37.5%) |
| Life, Physical & Social Science | 0 (0.0%) | 0 (0.0%) |
| Community & Social Service | 33 (89.2%) | 4 (10.8%) |
| Education, Arts & Media | 0 (0.0%) | 0 (0.0%) |
| Legal Services & Support | 0 (0.0%) | 0 (0.0%) |
| Education Instruction & Library | 0 (0.0%) | 4 (100.0%) |
| Arts, Media & Entertainment | 33 (100.0%) | 0 (0.0%) |
| Health Diagnosing & Treating | 17 (31.5%) | 37 (68.5%) |
| Health Technologists | 17 (31.5%) | 37 (68.5%) |
| Total (Category) | 71 (53.8%) | 61 (46.2%) |
| Total (Overall) | 332 (48.5%) | 353 (51.5%) |
Services Occupations
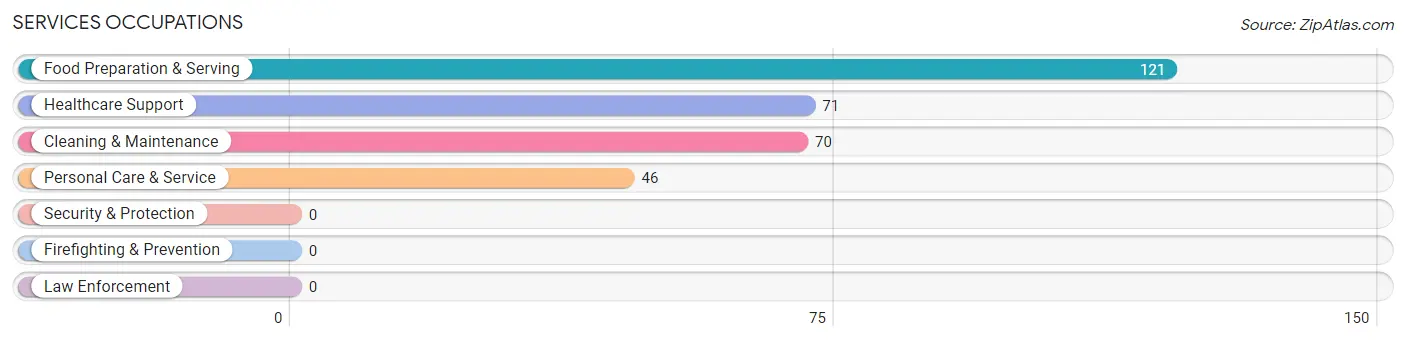
The most common Services occupations in Poquonock Bridge are Food Preparation & Serving (121 | 17.7%), Healthcare Support (71 | 10.4%), Cleaning & Maintenance (70 | 10.2%), and Personal Care & Service (46 | 6.7%).
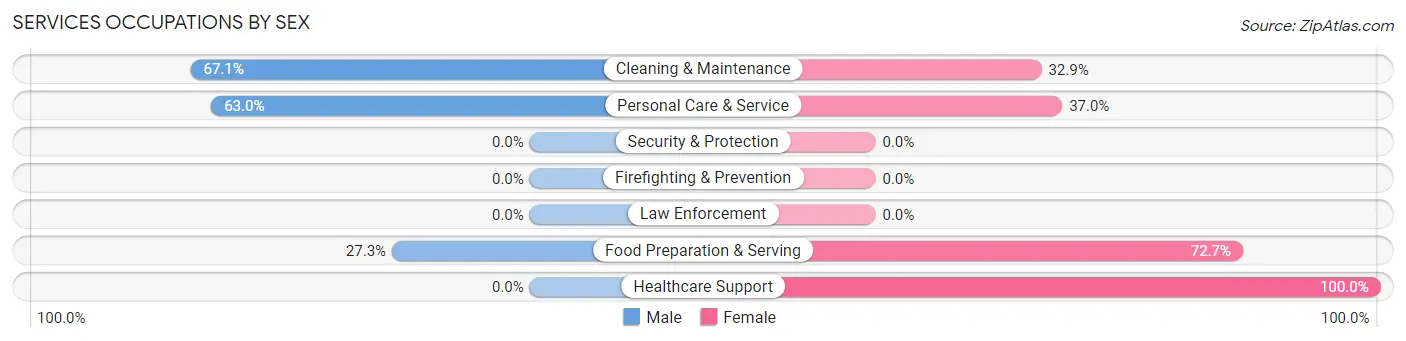
Services Occupations by Sex
Within the Services occupations in Poquonock Bridge, the most male-oriented occupations are Cleaning & Maintenance (67.1%), Personal Care & Service (63.0%), and Food Preparation & Serving (27.3%), while the most female-oriented occupations are Healthcare Support (100.0%), Food Preparation & Serving (72.7%), and Personal Care & Service (37.0%).
| Occupation | Male | Female |
| Healthcare Support | 0 (0.0%) | 71 (100.0%) |
| Security & Protection | 0 (0.0%) | 0 (0.0%) |
| Firefighting & Prevention | 0 (0.0%) | 0 (0.0%) |
| Law Enforcement | 0 (0.0%) | 0 (0.0%) |
| Food Preparation & Serving | 33 (27.3%) | 88 (72.7%) |
| Cleaning & Maintenance | 47 (67.1%) | 23 (32.9%) |
| Personal Care & Service | 29 (63.0%) | 17 (37.0%) |
| Total (Category) | 109 (35.4%) | 199 (64.6%) |
| Total (Overall) | 332 (48.5%) | 353 (51.5%) |
Sales and Office Occupations
The most common Sales and Office occupations in Poquonock Bridge are Sales & Related (98 | 14.3%), and Office & Administration (65 | 9.5%).

Sales and Office Occupations by Sex

| Occupation | Male | Female |
| Sales & Related | 80 (81.6%) | 18 (18.4%) |
| Office & Administration | 23 (35.4%) | 42 (64.6%) |
| Total (Category) | 103 (63.2%) | 60 (36.8%) |
| Total (Overall) | 332 (48.5%) | 353 (51.5%) |
Natural Resources, Construction and Maintenance Occupations
The most common Natural Resources, Construction and Maintenance occupations in Poquonock Bridge are , and Construction & Extraction (17 | 2.5%).

Natural Resources, Construction and Maintenance Occupations by Sex

| Occupation | Male | Female |
| Farming, Fishing & Forestry | 0 (0.0%) | 0 (0.0%) |
| Construction & Extraction | 11 (64.7%) | 6 (35.3%) |
| Installation, Maintenance & Repair | 0 (0.0%) | 0 (0.0%) |
| Total (Category) | 11 (64.7%) | 6 (35.3%) |
| Total (Overall) | 332 (48.5%) | 353 (51.5%) |
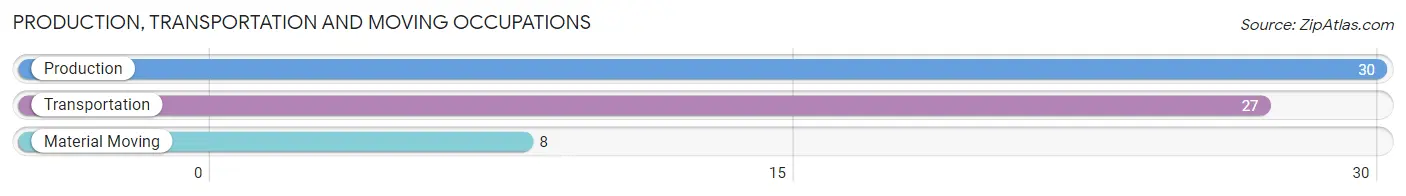
Production, Transportation and Moving Occupations
The most common Production, Transportation and Moving occupations in Poquonock Bridge are Production (30 | 4.4%), Transportation (27 | 3.9%), and Material Moving (8 | 1.2%).
Production, Transportation and Moving Occupations by Sex
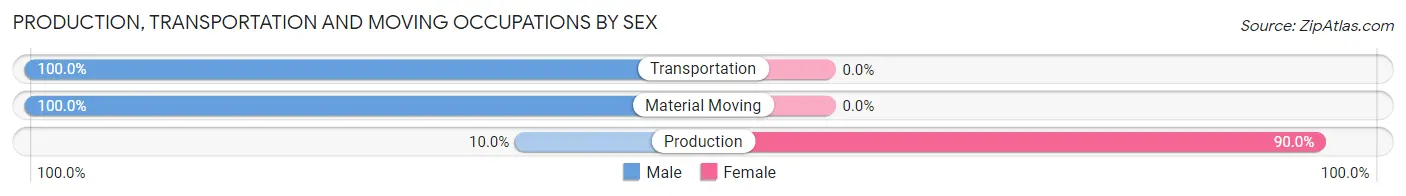
| Occupation | Male | Female |
| Production | 3 (10.0%) | 27 (90.0%) |
| Transportation | 27 (100.0%) | 0 (0.0%) |
| Material Moving | 8 (100.0%) | 0 (0.0%) |
| Total (Category) | 38 (58.5%) | 27 (41.5%) |
| Total (Overall) | 332 (48.5%) | 353 (51.5%) |
Employment Industries by Sex in Poquonock Bridge
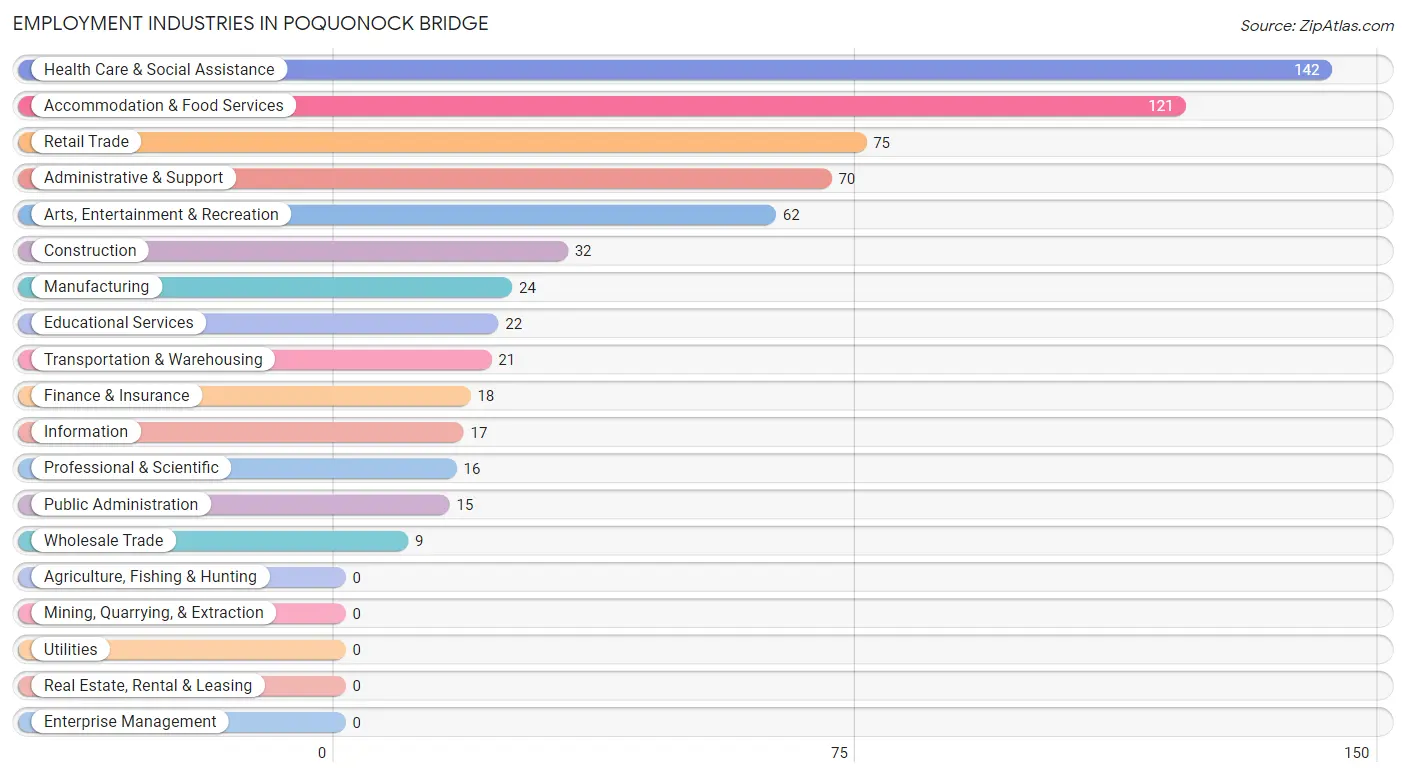
Employment Industries in Poquonock Bridge
The major employment industries in Poquonock Bridge include Health Care & Social Assistance (142 | 20.7%), Accommodation & Food Services (121 | 17.7%), Retail Trade (75 | 11.0%), Administrative & Support (70 | 10.2%), and Arts, Entertainment & Recreation (62 | 9.0%).
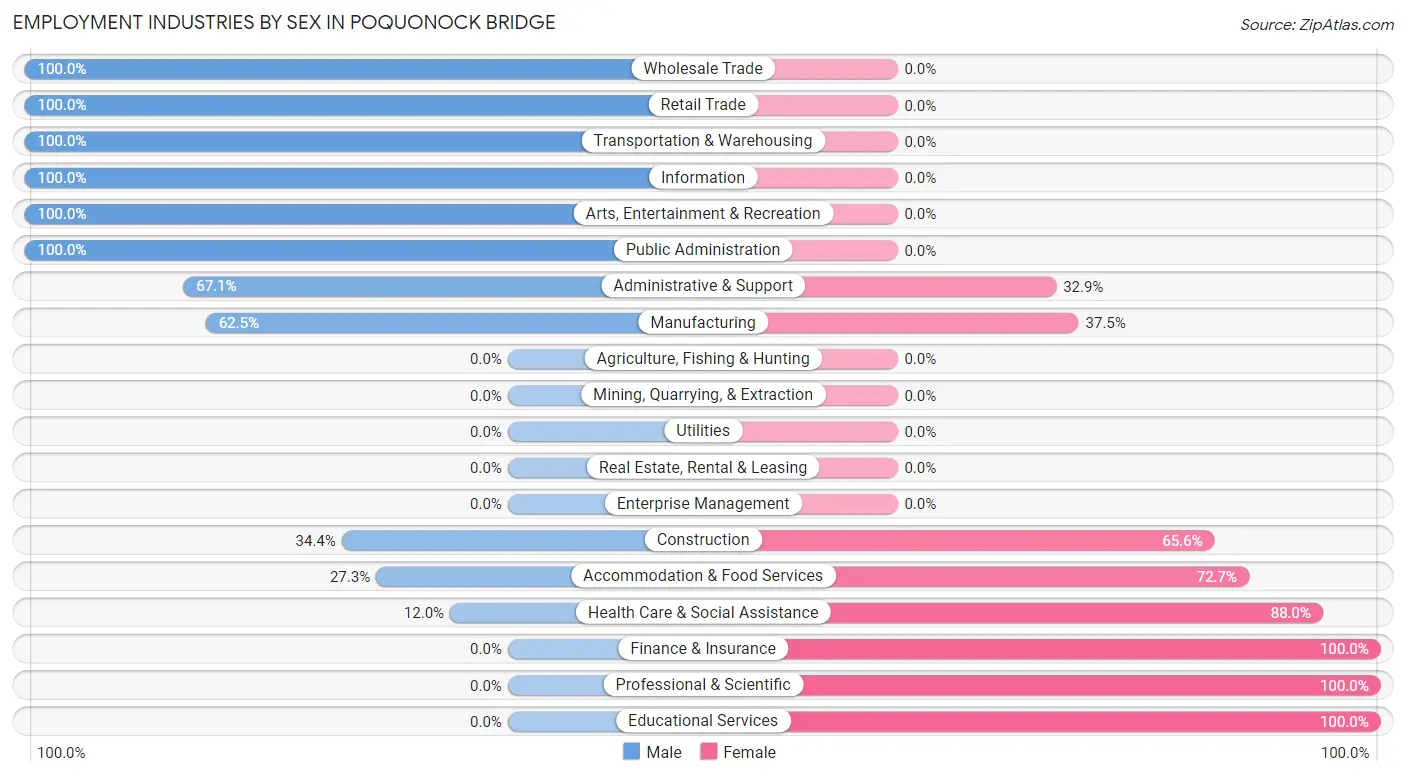
Employment Industries by Sex in Poquonock Bridge
The Poquonock Bridge industries that see more men than women are Wholesale Trade (100.0%), Retail Trade (100.0%), and Transportation & Warehousing (100.0%), whereas the industries that tend to have a higher number of women are Finance & Insurance (100.0%), Professional & Scientific (100.0%), and Educational Services (100.0%).
| Industry | Male | Female |
| Agriculture, Fishing & Hunting | 0 (0.0%) | 0 (0.0%) |
| Mining, Quarrying, & Extraction | 0 (0.0%) | 0 (0.0%) |
| Construction | 11 (34.4%) | 21 (65.6%) |
| Manufacturing | 15 (62.5%) | 9 (37.5%) |
| Wholesale Trade | 9 (100.0%) | 0 (0.0%) |
| Retail Trade | 75 (100.0%) | 0 (0.0%) |
| Transportation & Warehousing | 21 (100.0%) | 0 (0.0%) |
| Utilities | 0 (0.0%) | 0 (0.0%) |
| Information | 17 (100.0%) | 0 (0.0%) |
| Finance & Insurance | 0 (0.0%) | 18 (100.0%) |
| Real Estate, Rental & Leasing | 0 (0.0%) | 0 (0.0%) |
| Professional & Scientific | 0 (0.0%) | 16 (100.0%) |
| Enterprise Management | 0 (0.0%) | 0 (0.0%) |
| Administrative & Support | 47 (67.1%) | 23 (32.9%) |
| Educational Services | 0 (0.0%) | 22 (100.0%) |
| Health Care & Social Assistance | 17 (12.0%) | 125 (88.0%) |
| Arts, Entertainment & Recreation | 62 (100.0%) | 0 (0.0%) |
| Accommodation & Food Services | 33 (27.3%) | 88 (72.7%) |
| Public Administration | 15 (100.0%) | 0 (0.0%) |
| Total | 332 (48.5%) | 353 (51.5%) |
Education in Poquonock Bridge
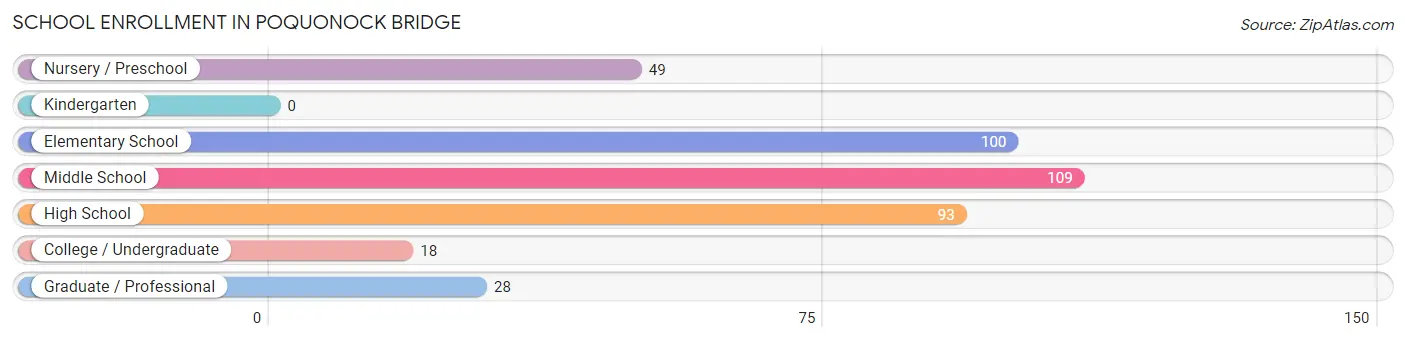
School Enrollment in Poquonock Bridge
The most common levels of schooling among the 397 students in Poquonock Bridge are middle school (109 | 27.5%), elementary school (100 | 25.2%), and high school (93 | 23.4%).
| School Level | # Students | % Students |
| Nursery / Preschool | 49 | 12.3% |
| Kindergarten | 0 | 0.0% |
| Elementary School | 100 | 25.2% |
| Middle School | 109 | 27.5% |
| High School | 93 | 23.4% |
| College / Undergraduate | 18 | 4.5% |
| Graduate / Professional | 28 | 7.0% |
| Total | 397 | 100.0% |
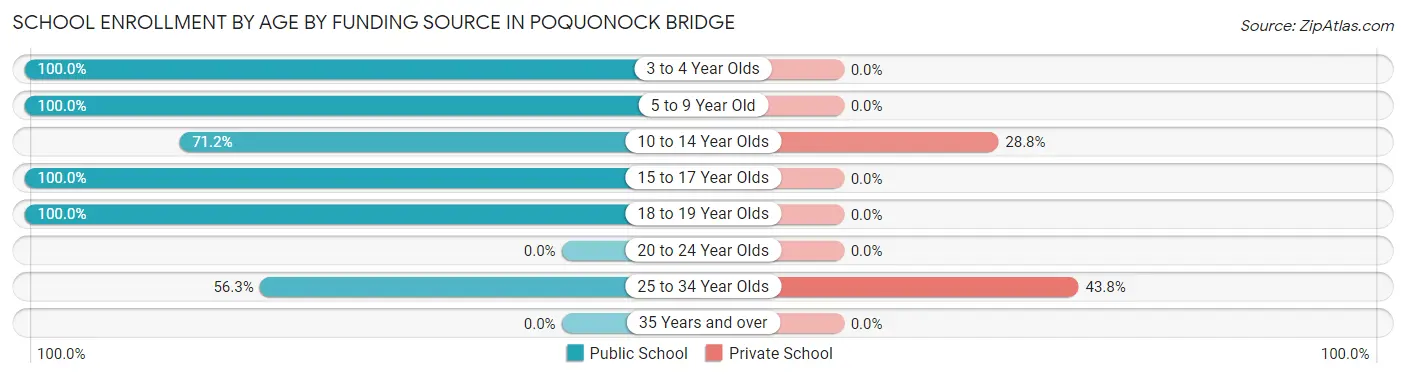
School Enrollment by Age by Funding Source in Poquonock Bridge
Out of a total of 397 students who are enrolled in schools in Poquonock Bridge, 62 (15.6%) attend a private institution, while the remaining 335 (84.4%) are enrolled in public schools. The age group of 25 to 34 year olds has the highest likelihood of being enrolled in private schools, with 28 (43.8% in the age bracket) enrolled. Conversely, the age group of 3 to 4 year olds has the lowest likelihood of being enrolled in a private school, with 49 (100.0% in the age bracket) attending a public institution.
| Age Bracket | Public School | Private School |
| 3 to 4 Year Olds | 49 (100.0%) | 0 (0.0%) |
| 5 to 9 Year Old | 100 (100.0%) | 0 (0.0%) |
| 10 to 14 Year Olds | 84 (71.2%) | 34 (28.8%) |
| 15 to 17 Year Olds | 58 (100.0%) | 0 (0.0%) |
| 18 to 19 Year Olds | 8 (100.0%) | 0 (0.0%) |
| 20 to 24 Year Olds | 0 (0.0%) | 0 (0.0%) |
| 25 to 34 Year Olds | 36 (56.2%) | 28 (43.8%) |
| 35 Years and over | 0 (0.0%) | 0 (0.0%) |
| Total | 335 (84.4%) | 62 (15.6%) |
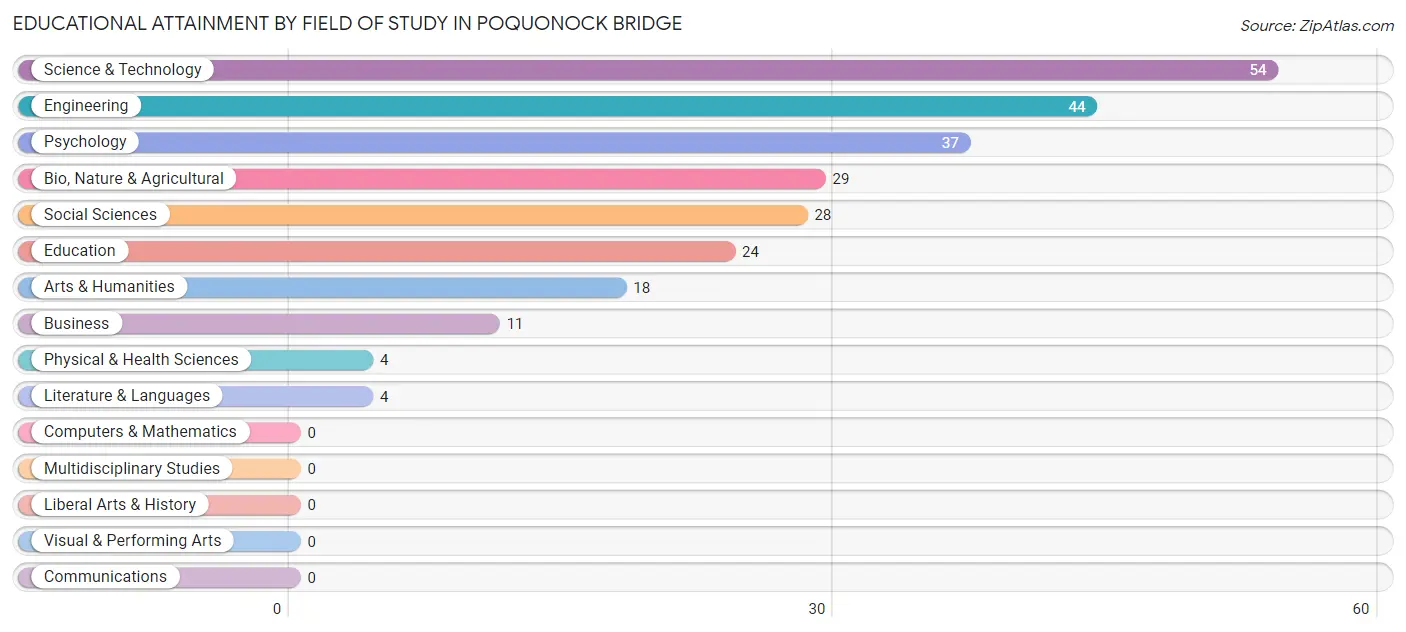
Educational Attainment by Field of Study in Poquonock Bridge
Science & technology (54 | 21.3%), engineering (44 | 17.4%), psychology (37 | 14.6%), bio, nature & agricultural (29 | 11.5%), and social sciences (28 | 11.1%) are the most common fields of study among 253 individuals in Poquonock Bridge who have obtained a bachelor's degree or higher.
| Field of Study | # Graduates | % Graduates |
| Computers & Mathematics | 0 | 0.0% |
| Bio, Nature & Agricultural | 29 | 11.5% |
| Physical & Health Sciences | 4 | 1.6% |
| Psychology | 37 | 14.6% |
| Social Sciences | 28 | 11.1% |
| Engineering | 44 | 17.4% |
| Multidisciplinary Studies | 0 | 0.0% |
| Science & Technology | 54 | 21.3% |
| Business | 11 | 4.3% |
| Education | 24 | 9.5% |
| Literature & Languages | 4 | 1.6% |
| Liberal Arts & History | 0 | 0.0% |
| Visual & Performing Arts | 0 | 0.0% |
| Communications | 0 | 0.0% |
| Arts & Humanities | 18 | 7.1% |
| Total | 253 | 100.0% |
Transportation & Commute in Poquonock Bridge
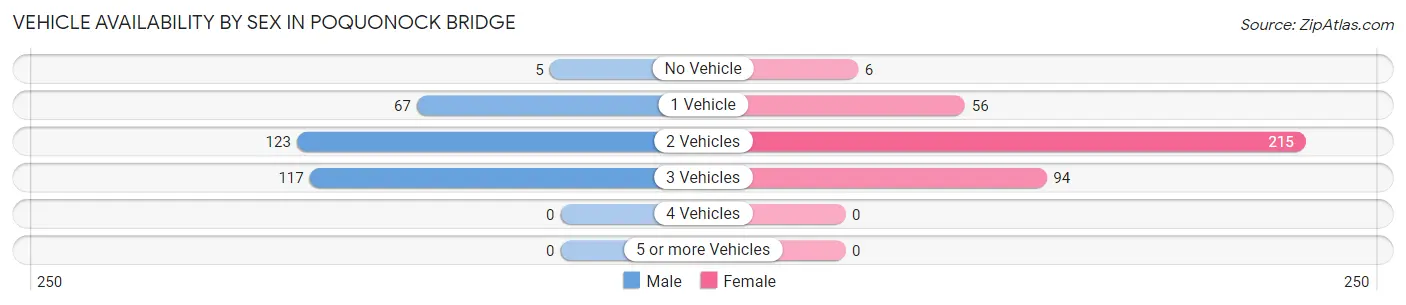
Vehicle Availability by Sex in Poquonock Bridge
The most prevalent vehicle ownership categories in Poquonock Bridge are males with 2 vehicles (123, accounting for 39.4%) and females with 2 vehicles (215, making up 33.2%).
| Vehicles Available | Male | Female |
| No Vehicle | 5 (1.6%) | 6 (1.6%) |
| 1 Vehicle | 67 (21.5%) | 56 (15.1%) |
| 2 Vehicles | 123 (39.4%) | 215 (58.0%) |
| 3 Vehicles | 117 (37.5%) | 94 (25.3%) |
| 4 Vehicles | 0 (0.0%) | 0 (0.0%) |
| 5 or more Vehicles | 0 (0.0%) | 0 (0.0%) |
| Total | 312 (100.0%) | 371 (100.0%) |
Commute Time in Poquonock Bridge
The most frequently occuring commute durations in Poquonock Bridge are 10 to 14 minutes (219 commuters, 32.4%), 5 to 9 minutes (164 commuters, 24.2%), and 30 to 34 minutes (70 commuters, 10.3%).
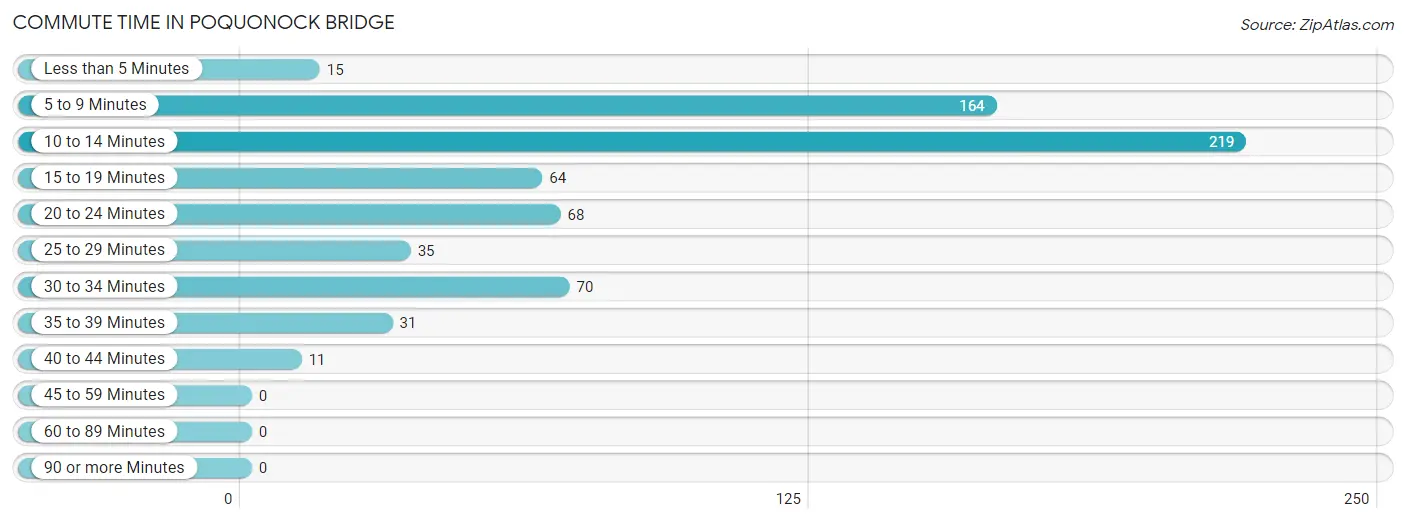
| Commute Time | # Commuters | % Commuters |
| Less than 5 Minutes | 15 | 2.2% |
| 5 to 9 Minutes | 164 | 24.2% |
| 10 to 14 Minutes | 219 | 32.4% |
| 15 to 19 Minutes | 64 | 9.5% |
| 20 to 24 Minutes | 68 | 10.0% |
| 25 to 29 Minutes | 35 | 5.2% |
| 30 to 34 Minutes | 70 | 10.3% |
| 35 to 39 Minutes | 31 | 4.6% |
| 40 to 44 Minutes | 11 | 1.6% |
| 45 to 59 Minutes | 0 | 0.0% |
| 60 to 89 Minutes | 0 | 0.0% |
| 90 or more Minutes | 0 | 0.0% |
Commute Time by Sex in Poquonock Bridge
The most common commute times in Poquonock Bridge are 5 to 9 minutes (69 commuters, 22.6%) for males and 10 to 14 minutes (150 commuters, 40.4%) for females.
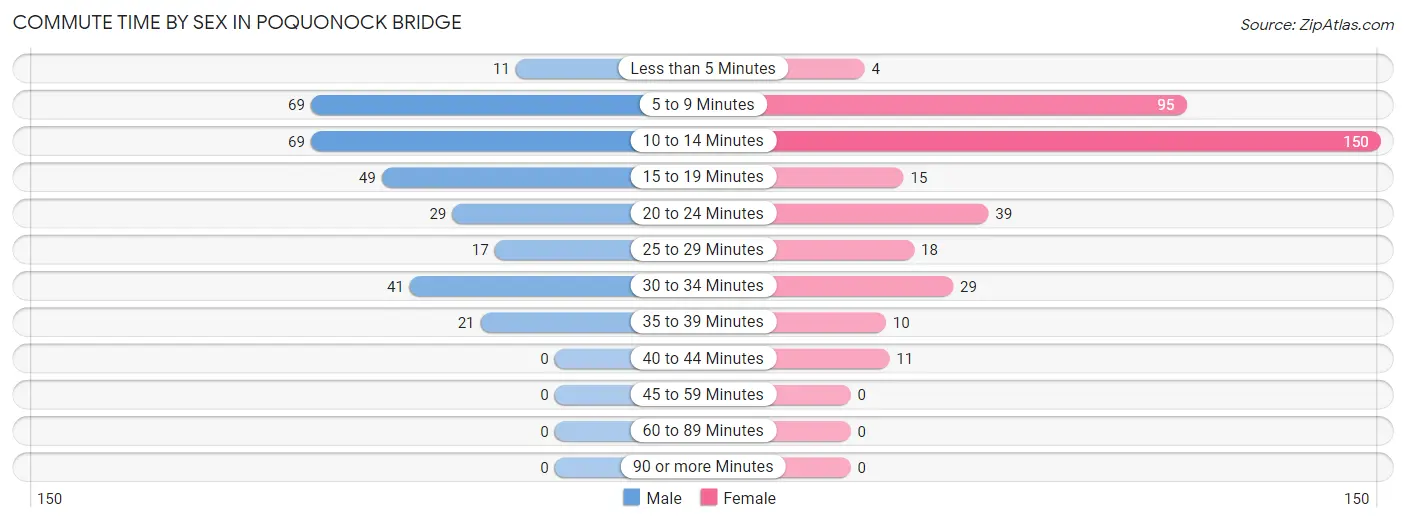
| Commute Time | Male | Female |
| Less than 5 Minutes | 11 (3.6%) | 4 (1.1%) |
| 5 to 9 Minutes | 69 (22.6%) | 95 (25.6%) |
| 10 to 14 Minutes | 69 (22.6%) | 150 (40.4%) |
| 15 to 19 Minutes | 49 (16.0%) | 15 (4.0%) |
| 20 to 24 Minutes | 29 (9.5%) | 39 (10.5%) |
| 25 to 29 Minutes | 17 (5.6%) | 18 (4.9%) |
| 30 to 34 Minutes | 41 (13.4%) | 29 (7.8%) |
| 35 to 39 Minutes | 21 (6.9%) | 10 (2.7%) |
| 40 to 44 Minutes | 0 (0.0%) | 11 (3.0%) |
| 45 to 59 Minutes | 0 (0.0%) | 0 (0.0%) |
| 60 to 89 Minutes | 0 (0.0%) | 0 (0.0%) |
| 90 or more Minutes | 0 (0.0%) | 0 (0.0%) |
Time of Departure to Work by Sex in Poquonock Bridge
The most frequent times of departure to work in Poquonock Bridge are 12:00 PM to 3:59 PM (75, 24.5%) for males and 7:30 AM to 7:59 AM (162, 43.7%) for females.
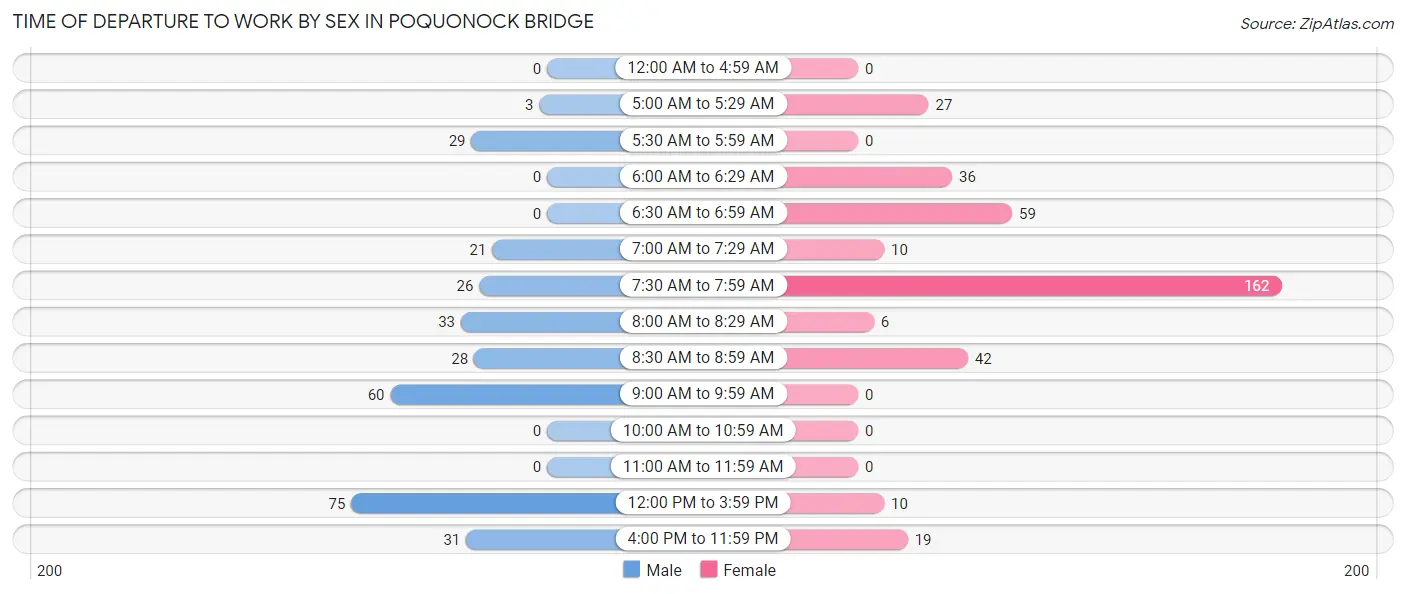
| Time of Departure | Male | Female |
| 12:00 AM to 4:59 AM | 0 (0.0%) | 0 (0.0%) |
| 5:00 AM to 5:29 AM | 3 (1.0%) | 27 (7.3%) |
| 5:30 AM to 5:59 AM | 29 (9.5%) | 0 (0.0%) |
| 6:00 AM to 6:29 AM | 0 (0.0%) | 36 (9.7%) |
| 6:30 AM to 6:59 AM | 0 (0.0%) | 59 (15.9%) |
| 7:00 AM to 7:29 AM | 21 (6.9%) | 10 (2.7%) |
| 7:30 AM to 7:59 AM | 26 (8.5%) | 162 (43.7%) |
| 8:00 AM to 8:29 AM | 33 (10.8%) | 6 (1.6%) |
| 8:30 AM to 8:59 AM | 28 (9.1%) | 42 (11.3%) |
| 9:00 AM to 9:59 AM | 60 (19.6%) | 0 (0.0%) |
| 10:00 AM to 10:59 AM | 0 (0.0%) | 0 (0.0%) |
| 11:00 AM to 11:59 AM | 0 (0.0%) | 0 (0.0%) |
| 12:00 PM to 3:59 PM | 75 (24.5%) | 10 (2.7%) |
| 4:00 PM to 11:59 PM | 31 (10.1%) | 19 (5.1%) |
| Total | 306 (100.0%) | 371 (100.0%) |
Housing Occupancy in Poquonock Bridge
Occupancy by Ownership in Poquonock Bridge
Of the total 501 dwellings in Poquonock Bridge, owner-occupied units account for 258 (51.5%), while renter-occupied units make up 243 (48.5%).
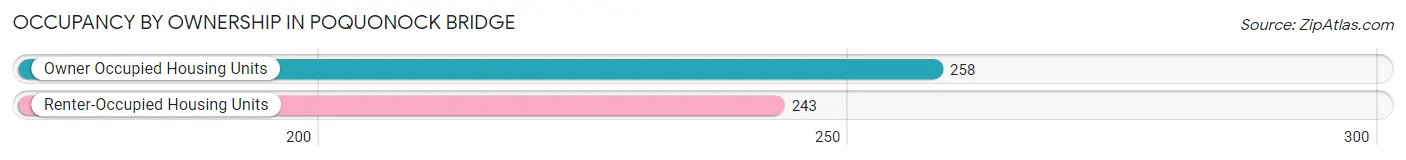
| Occupancy | # Housing Units | % Housing Units |
| Owner Occupied Housing Units | 258 | 51.5% |
| Renter-Occupied Housing Units | 243 | 48.5% |
| Total Occupied Housing Units | 501 | 100.0% |
Occupancy by Household Size in Poquonock Bridge
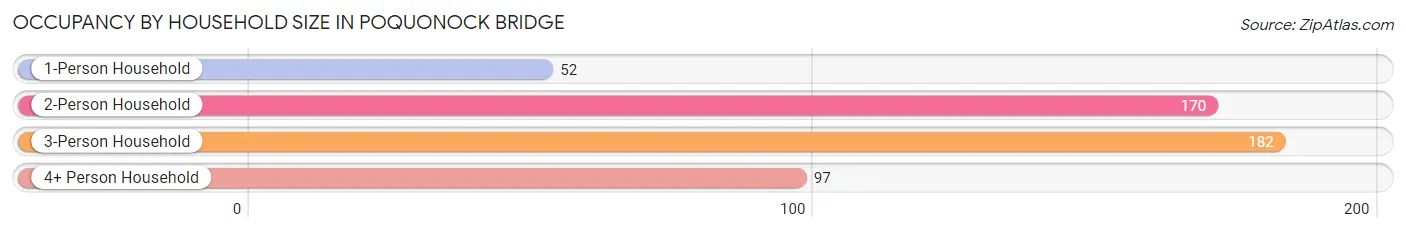
| Household Size | # Housing Units | % Housing Units |
| 1-Person Household | 52 | 10.4% |
| 2-Person Household | 170 | 33.9% |
| 3-Person Household | 182 | 36.3% |
| 4+ Person Household | 97 | 19.4% |
| Total Housing Units | 501 | 100.0% |
Occupancy by Ownership by Household Size in Poquonock Bridge
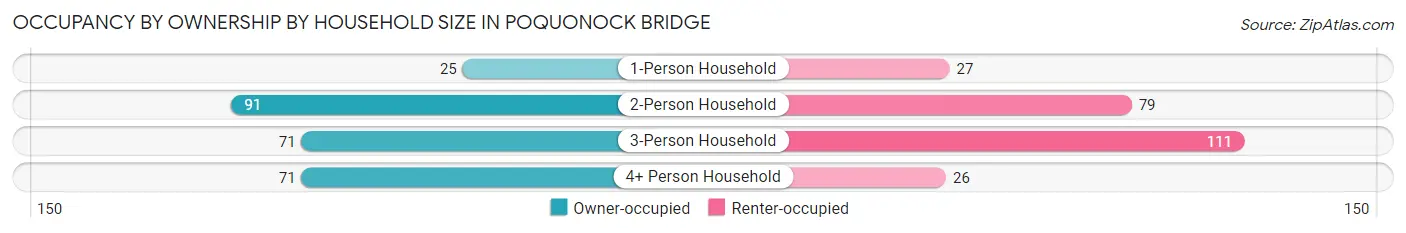
| Household Size | Owner-occupied | Renter-occupied |
| 1-Person Household | 25 (48.1%) | 27 (51.9%) |
| 2-Person Household | 91 (53.5%) | 79 (46.5%) |
| 3-Person Household | 71 (39.0%) | 111 (61.0%) |
| 4+ Person Household | 71 (73.2%) | 26 (26.8%) |
| Total Housing Units | 258 (51.5%) | 243 (48.5%) |
Occupancy by Educational Attainment in Poquonock Bridge
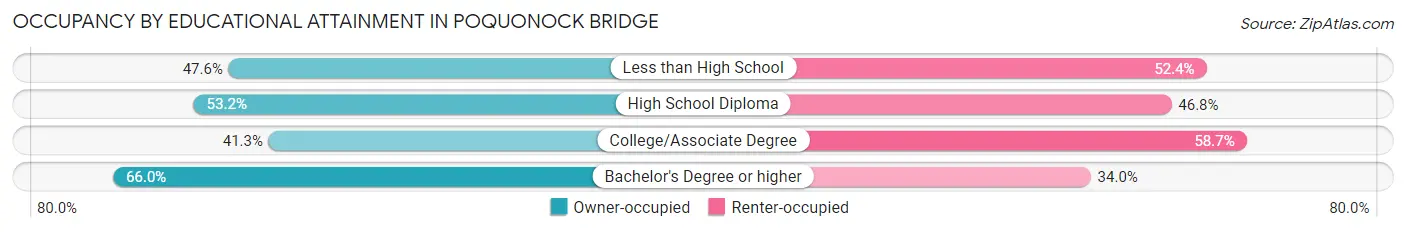
| Household Size | Owner-occupied | Renter-occupied |
| Less than High School | 50 (47.6%) | 55 (52.4%) |
| High School Diploma | 92 (53.2%) | 81 (46.8%) |
| College/Associate Degree | 52 (41.3%) | 74 (58.7%) |
| Bachelor's Degree or higher | 64 (66.0%) | 33 (34.0%) |
Occupancy by Age of Householder in Poquonock Bridge
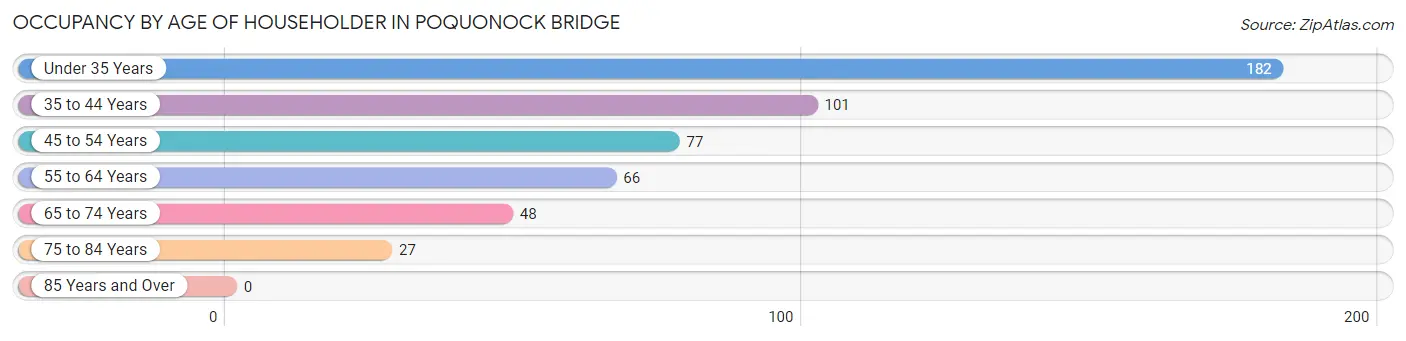
| Age Bracket | # Households | % Households |
| Under 35 Years | 182 | 36.3% |
| 35 to 44 Years | 101 | 20.2% |
| 45 to 54 Years | 77 | 15.4% |
| 55 to 64 Years | 66 | 13.2% |
| 65 to 74 Years | 48 | 9.6% |
| 75 to 84 Years | 27 | 5.4% |
| 85 Years and Over | 0 | 0.0% |
| Total | 501 | 100.0% |
Housing Finances in Poquonock Bridge
Median Income by Occupancy in Poquonock Bridge
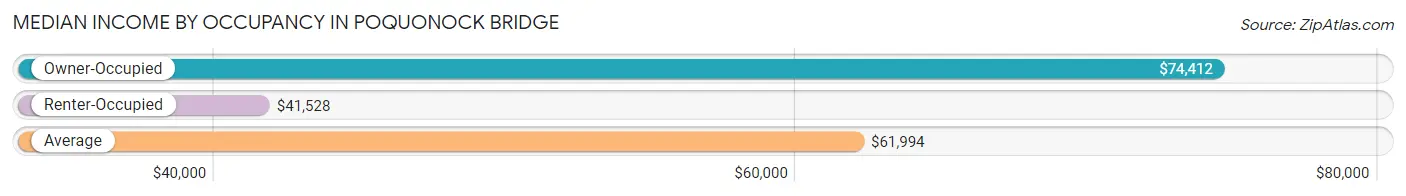
| Occupancy Type | # Households | Median Income |
| Owner-Occupied | 258 (51.5%) | $74,412 |
| Renter-Occupied | 243 (48.5%) | $41,528 |
| Average | 501 (100.0%) | $61,994 |
Occupancy by Householder Income Bracket in Poquonock Bridge
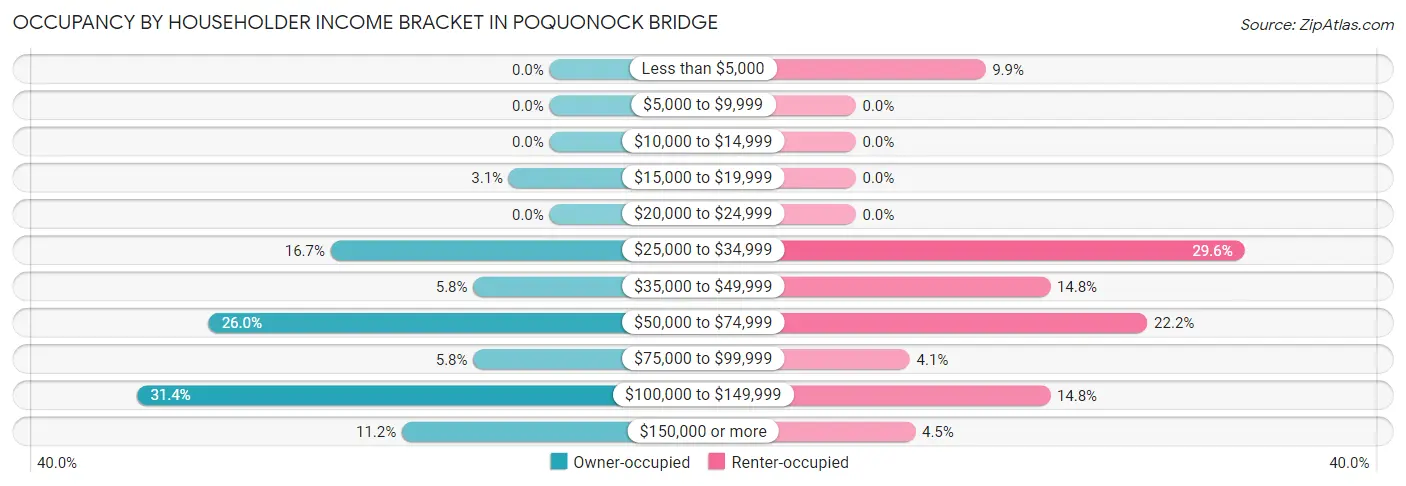
| Income Bracket | Owner-occupied | Renter-occupied |
| Less than $5,000 | 0 (0.0%) | 24 (9.9%) |
| $5,000 to $9,999 | 0 (0.0%) | 0 (0.0%) |
| $10,000 to $14,999 | 0 (0.0%) | 0 (0.0%) |
| $15,000 to $19,999 | 8 (3.1%) | 0 (0.0%) |
| $20,000 to $24,999 | 0 (0.0%) | 0 (0.0%) |
| $25,000 to $34,999 | 43 (16.7%) | 72 (29.6%) |
| $35,000 to $49,999 | 15 (5.8%) | 36 (14.8%) |
| $50,000 to $74,999 | 67 (26.0%) | 54 (22.2%) |
| $75,000 to $99,999 | 15 (5.8%) | 10 (4.1%) |
| $100,000 to $149,999 | 81 (31.4%) | 36 (14.8%) |
| $150,000 or more | 29 (11.2%) | 11 (4.5%) |
| Total | 258 (100.0%) | 243 (100.0%) |
Monthly Housing Cost Tiers in Poquonock Bridge
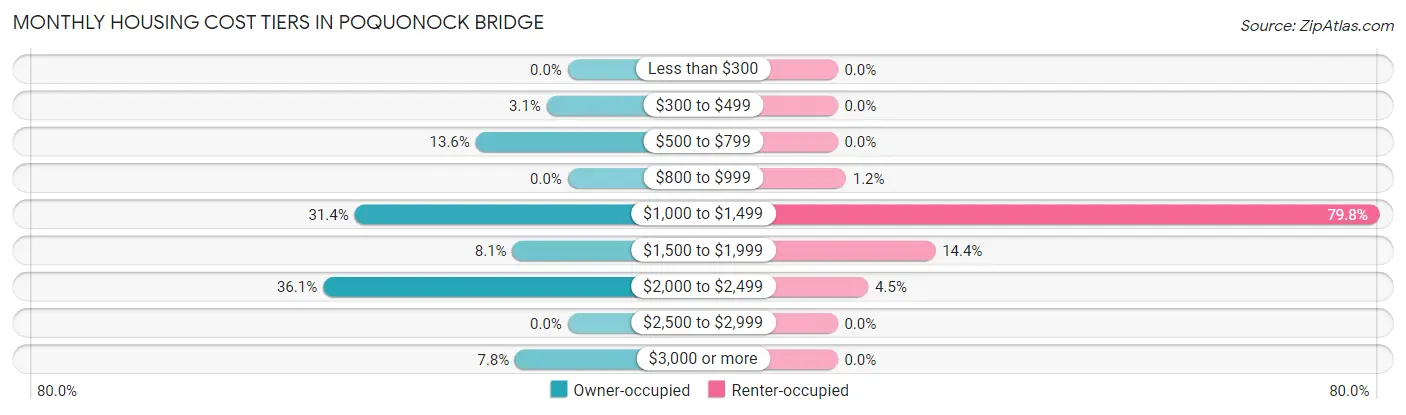
| Monthly Cost | Owner-occupied | Renter-occupied |
| Less than $300 | 0 (0.0%) | 0 (0.0%) |
| $300 to $499 | 8 (3.1%) | 0 (0.0%) |
| $500 to $799 | 35 (13.6%) | 0 (0.0%) |
| $800 to $999 | 0 (0.0%) | 3 (1.2%) |
| $1,000 to $1,499 | 81 (31.4%) | 194 (79.8%) |
| $1,500 to $1,999 | 21 (8.1%) | 35 (14.4%) |
| $2,000 to $2,499 | 93 (36.0%) | 11 (4.5%) |
| $2,500 to $2,999 | 0 (0.0%) | 0 (0.0%) |
| $3,000 or more | 20 (7.7%) | 0 (0.0%) |
| Total | 258 (100.0%) | 243 (100.0%) |
Physical Housing Characteristics in Poquonock Bridge
Housing Structures in Poquonock Bridge
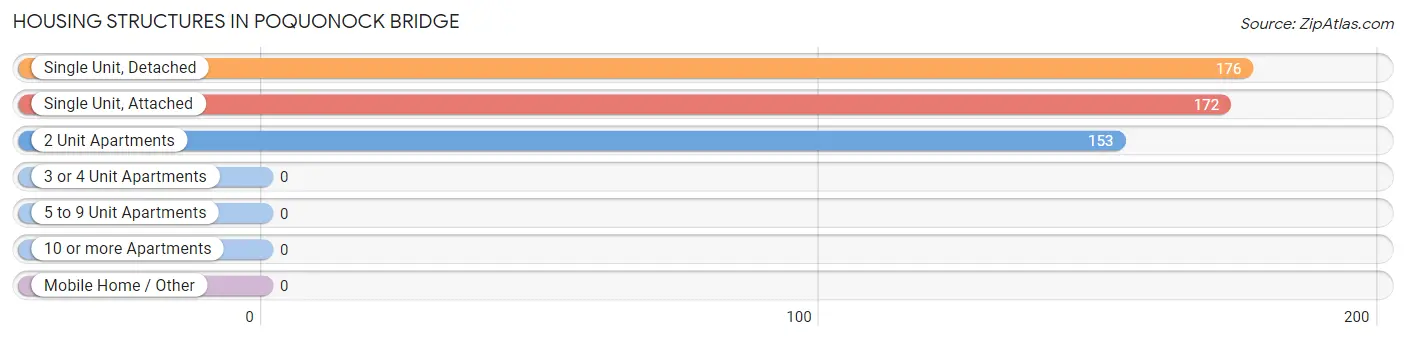
| Structure Type | # Housing Units | % Housing Units |
| Single Unit, Detached | 176 | 35.1% |
| Single Unit, Attached | 172 | 34.3% |
| 2 Unit Apartments | 153 | 30.5% |
| 3 or 4 Unit Apartments | 0 | 0.0% |
| 5 to 9 Unit Apartments | 0 | 0.0% |
| 10 or more Apartments | 0 | 0.0% |
| Mobile Home / Other | 0 | 0.0% |
| Total | 501 | 100.0% |
Housing Structures by Occupancy in Poquonock Bridge
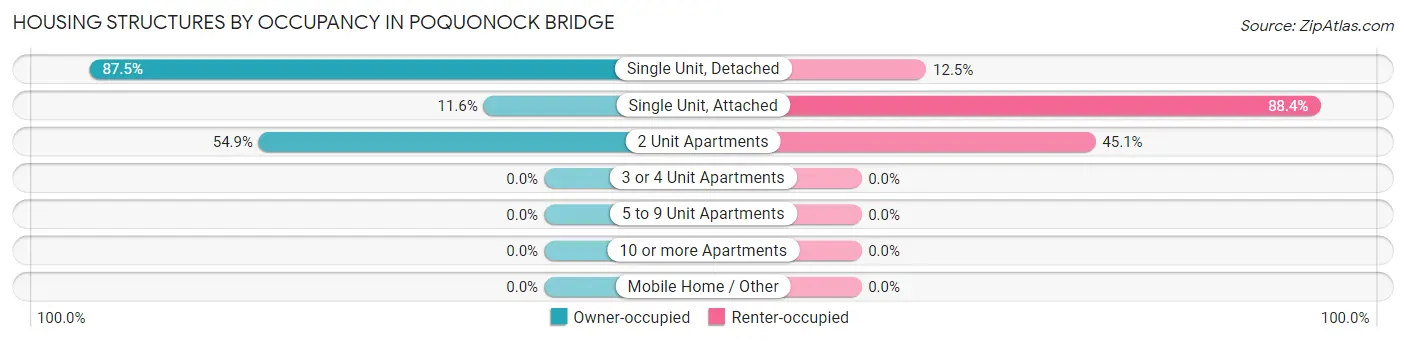
| Structure Type | Owner-occupied | Renter-occupied |
| Single Unit, Detached | 154 (87.5%) | 22 (12.5%) |
| Single Unit, Attached | 20 (11.6%) | 152 (88.4%) |
| 2 Unit Apartments | 84 (54.9%) | 69 (45.1%) |
| 3 or 4 Unit Apartments | 0 (0.0%) | 0 (0.0%) |
| 5 to 9 Unit Apartments | 0 (0.0%) | 0 (0.0%) |
| 10 or more Apartments | 0 (0.0%) | 0 (0.0%) |
| Mobile Home / Other | 0 (0.0%) | 0 (0.0%) |
| Total | 258 (51.5%) | 243 (48.5%) |
Housing Structures by Number of Rooms in Poquonock Bridge
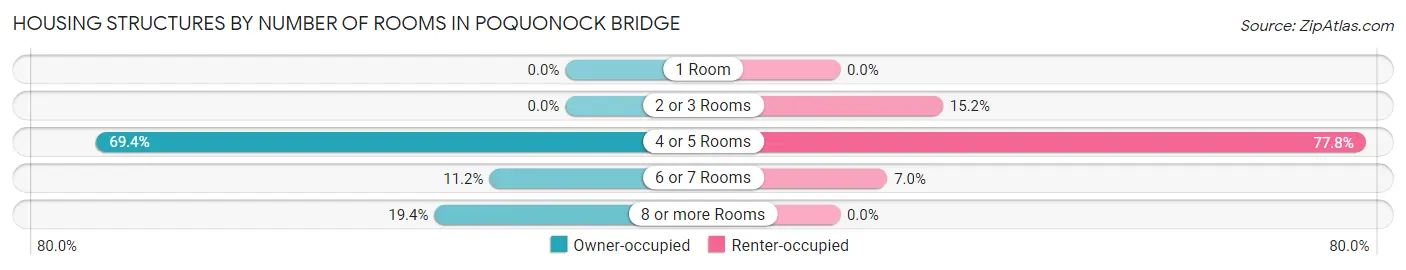
| Number of Rooms | Owner-occupied | Renter-occupied |
| 1 Room | 0 (0.0%) | 0 (0.0%) |
| 2 or 3 Rooms | 0 (0.0%) | 37 (15.2%) |
| 4 or 5 Rooms | 179 (69.4%) | 189 (77.8%) |
| 6 or 7 Rooms | 29 (11.2%) | 17 (7.0%) |
| 8 or more Rooms | 50 (19.4%) | 0 (0.0%) |
| Total | 258 (100.0%) | 243 (100.0%) |
Housing Structure by Heating Type in Poquonock Bridge
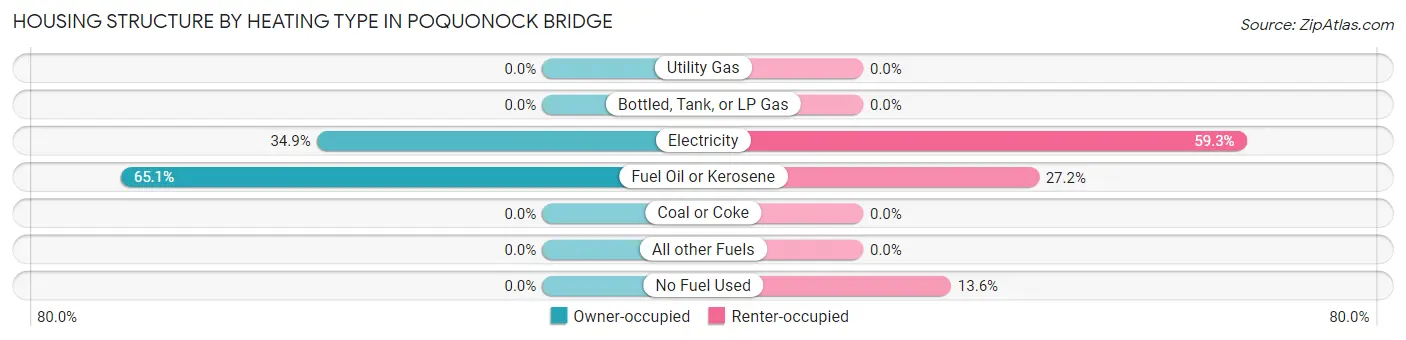
| Heating Type | Owner-occupied | Renter-occupied |
| Utility Gas | 0 (0.0%) | 0 (0.0%) |
| Bottled, Tank, or LP Gas | 0 (0.0%) | 0 (0.0%) |
| Electricity | 90 (34.9%) | 144 (59.3%) |
| Fuel Oil or Kerosene | 168 (65.1%) | 66 (27.2%) |
| Coal or Coke | 0 (0.0%) | 0 (0.0%) |
| All other Fuels | 0 (0.0%) | 0 (0.0%) |
| No Fuel Used | 0 (0.0%) | 33 (13.6%) |
| Total | 258 (100.0%) | 243 (100.0%) |
Household Vehicle Usage in Poquonock Bridge
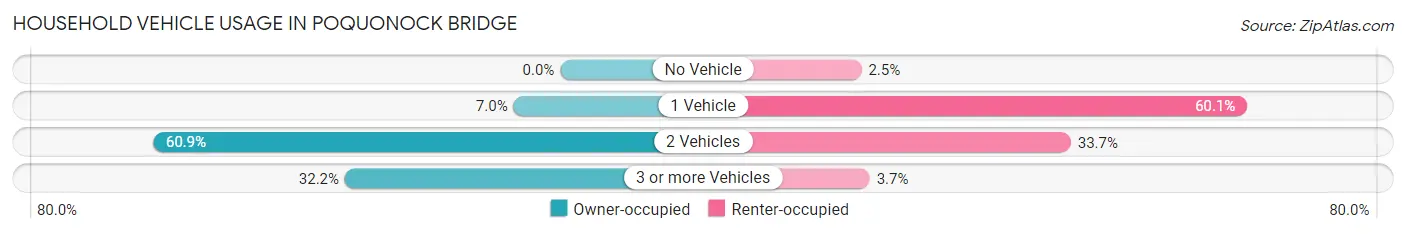
| Vehicles per Household | Owner-occupied | Renter-occupied |
| No Vehicle | 0 (0.0%) | 6 (2.5%) |
| 1 Vehicle | 18 (7.0%) | 146 (60.1%) |
| 2 Vehicles | 157 (60.9%) | 82 (33.7%) |
| 3 or more Vehicles | 83 (32.2%) | 9 (3.7%) |
| Total | 258 (100.0%) | 243 (100.0%) |
Real Estate & Mortgages in Poquonock Bridge
Real Estate and Mortgage Overview in Poquonock Bridge
| Characteristic | Without Mortgage | With Mortgage |
| Housing Units | 43 | 215 |
| Median Property Value | $219,300 | $176,100 |
| Median Household Income | $115,509 | $29 |
| Monthly Housing Costs | $720 | $20 |
| Real Estate Taxes | $2,614 | $0 |
Property Value by Mortgage Status in Poquonock Bridge
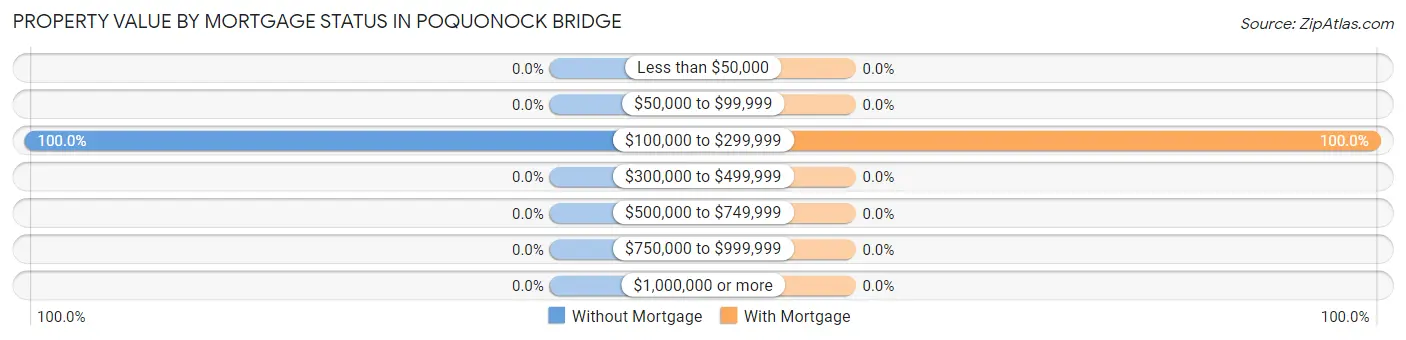
| Property Value | Without Mortgage | With Mortgage |
| Less than $50,000 | 0 (0.0%) | 0 (0.0%) |
| $50,000 to $99,999 | 0 (0.0%) | 0 (0.0%) |
| $100,000 to $299,999 | 43 (100.0%) | 215 (100.0%) |
| $300,000 to $499,999 | 0 (0.0%) | 0 (0.0%) |
| $500,000 to $749,999 | 0 (0.0%) | 0 (0.0%) |
| $750,000 to $999,999 | 0 (0.0%) | 0 (0.0%) |
| $1,000,000 or more | 0 (0.0%) | 0 (0.0%) |
| Total | 43 (100.0%) | 215 (100.0%) |
Household Income by Mortgage Status in Poquonock Bridge
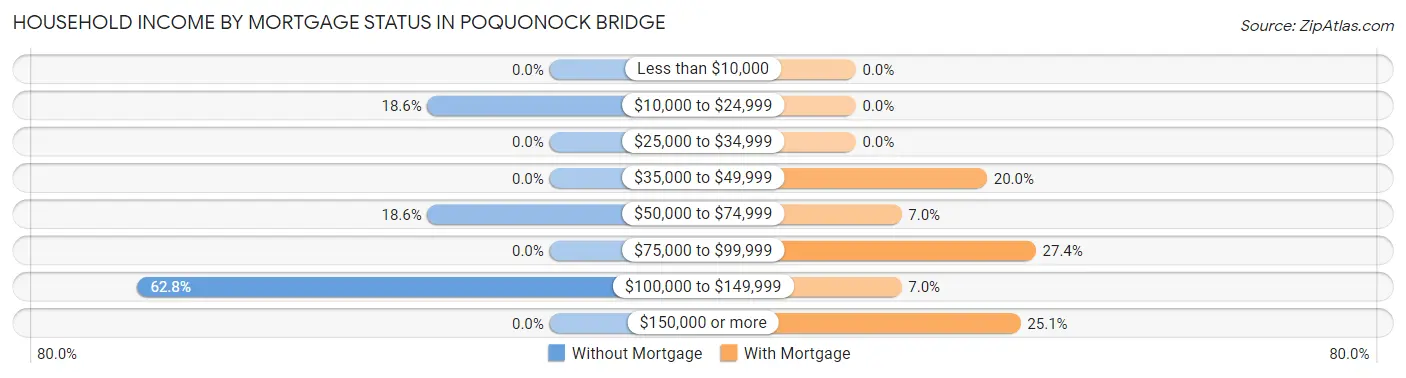
| Household Income | Without Mortgage | With Mortgage |
| Less than $10,000 | 0 (0.0%) | 0 (0.0%) |
| $10,000 to $24,999 | 8 (18.6%) | 0 (0.0%) |
| $25,000 to $34,999 | 0 (0.0%) | 0 (0.0%) |
| $35,000 to $49,999 | 0 (0.0%) | 43 (20.0%) |
| $50,000 to $74,999 | 8 (18.6%) | 15 (7.0%) |
| $75,000 to $99,999 | 0 (0.0%) | 59 (27.4%) |
| $100,000 to $149,999 | 27 (62.8%) | 15 (7.0%) |
| $150,000 or more | 0 (0.0%) | 54 (25.1%) |
| Total | 43 (100.0%) | 215 (100.0%) |
Property Value to Household Income Ratio in Poquonock Bridge
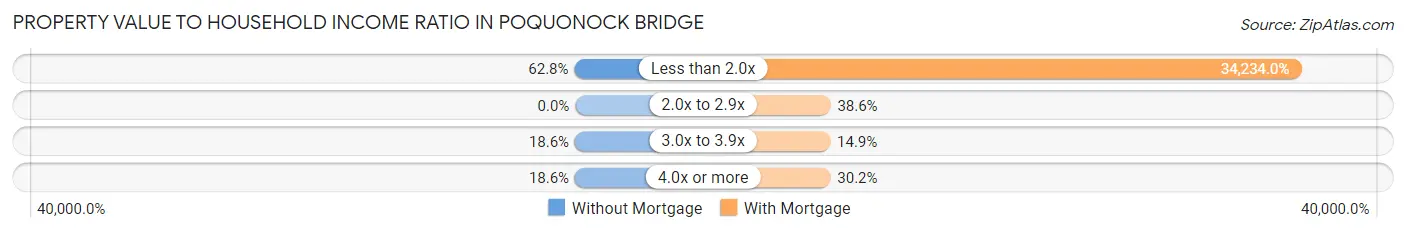
| Value-to-Income Ratio | Without Mortgage | With Mortgage |
| Less than 2.0x | 27 (62.8%) | 73,603 (34,233.9%) |
| 2.0x to 2.9x | 0 (0.0%) | 83 (38.6%) |
| 3.0x to 3.9x | 8 (18.6%) | 32 (14.9%) |
| 4.0x or more | 8 (18.6%) | 65 (30.2%) |
| Total | 43 (100.0%) | 215 (100.0%) |
Real Estate Taxes by Mortgage Status in Poquonock Bridge

| Property Taxes | Without Mortgage | With Mortgage |
| Less than $800 | 0 (0.0%) | 0 (0.0%) |
| $800 to $1,499 | 0 (0.0%) | 0 (0.0%) |
| $800 to $1,499 | 43 (100.0%) | 0 (0.0%) |
| Total | 43 (100.0%) | 215 (100.0%) |
Health & Disability in Poquonock Bridge
Health Insurance Coverage by Age in Poquonock Bridge
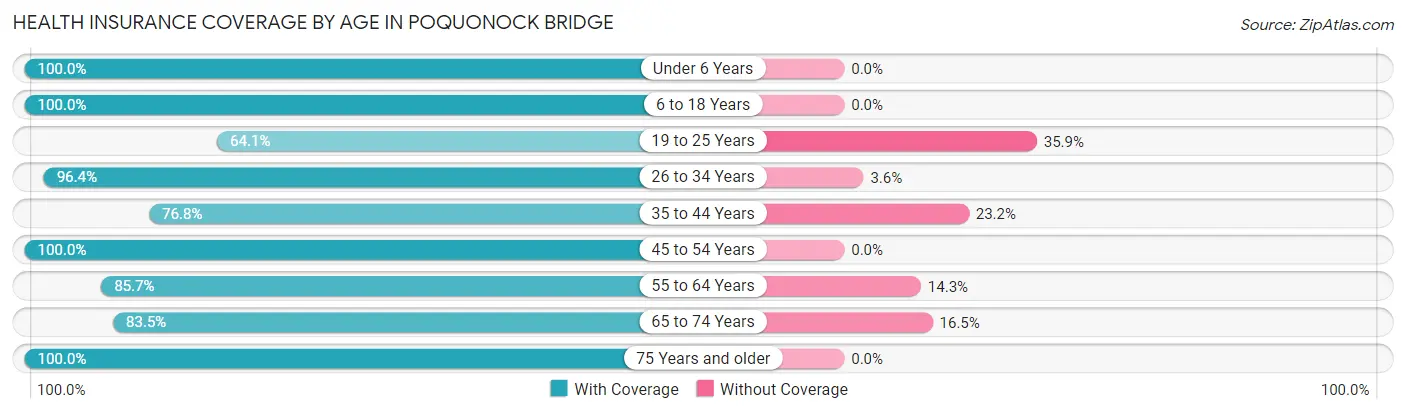
| Age Bracket | With Coverage | Without Coverage |
| Under 6 Years | 105 (100.0%) | 0 (0.0%) |
| 6 to 18 Years | 350 (100.0%) | 0 (0.0%) |
| 19 to 25 Years | 50 (64.1%) | 28 (35.9%) |
| 26 to 34 Years | 269 (96.4%) | 10 (3.6%) |
| 35 to 44 Years | 86 (76.8%) | 26 (23.2%) |
| 45 to 54 Years | 196 (100.0%) | 0 (0.0%) |
| 55 to 64 Years | 120 (85.7%) | 20 (14.3%) |
| 65 to 74 Years | 71 (83.5%) | 14 (16.5%) |
| 75 Years and older | 27 (100.0%) | 0 (0.0%) |
| Total | 1,274 (92.9%) | 98 (7.1%) |
Health Insurance Coverage by Citizenship Status in Poquonock Bridge

| Citizenship Status | With Coverage | Without Coverage |
| Native Born | 105 (100.0%) | 0 (0.0%) |
| Foreign Born, Citizen | 350 (100.0%) | 0 (0.0%) |
| Foreign Born, not a Citizen | 50 (64.1%) | 28 (35.9%) |
Health Insurance Coverage by Household Income in Poquonock Bridge
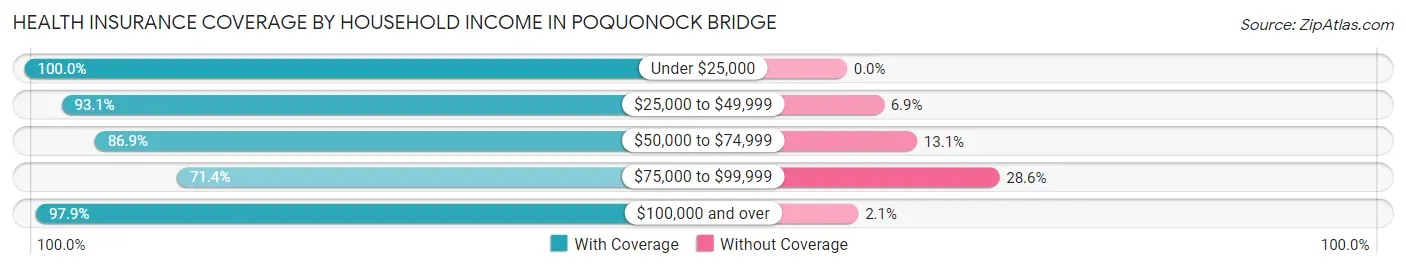
| Household Income | With Coverage | Without Coverage |
| Under $25,000 | 41 (100.0%) | 0 (0.0%) |
| $25,000 to $49,999 | 377 (93.1%) | 28 (6.9%) |
| $50,000 to $74,999 | 324 (86.9%) | 49 (13.1%) |
| $75,000 to $99,999 | 25 (71.4%) | 10 (28.6%) |
| $100,000 and over | 504 (97.9%) | 11 (2.1%) |
Public vs Private Health Insurance Coverage by Age in Poquonock Bridge
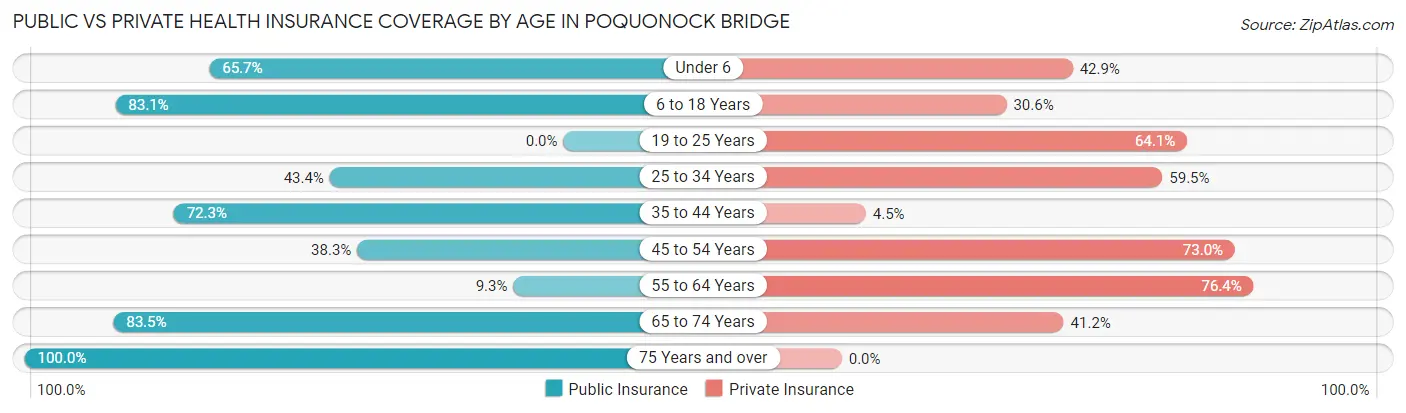
| Age Bracket | Public Insurance | Private Insurance |
| Under 6 | 69 (65.7%) | 45 (42.9%) |
| 6 to 18 Years | 291 (83.1%) | 107 (30.6%) |
| 19 to 25 Years | 0 (0.0%) | 50 (64.1%) |
| 25 to 34 Years | 121 (43.4%) | 166 (59.5%) |
| 35 to 44 Years | 81 (72.3%) | 5 (4.5%) |
| 45 to 54 Years | 75 (38.3%) | 143 (73.0%) |
| 55 to 64 Years | 13 (9.3%) | 107 (76.4%) |
| 65 to 74 Years | 71 (83.5%) | 35 (41.2%) |
| 75 Years and over | 27 (100.0%) | 0 (0.0%) |
| Total | 748 (54.5%) | 658 (48.0%) |
Disability Status by Sex by Age in Poquonock Bridge
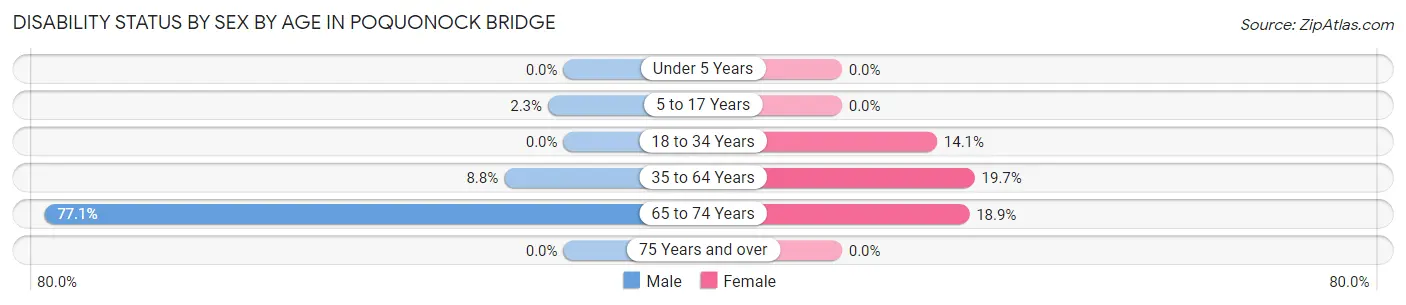
| Age Bracket | Male | Female |
| Under 5 Years | 0 (0.0%) | 0 (0.0%) |
| 5 to 17 Years | 4 (2.3%) | 0 (0.0%) |
| 18 to 34 Years | 0 (0.0%) | 24 (14.1%) |
| 35 to 64 Years | 14 (8.8%) | 57 (19.7%) |
| 65 to 74 Years | 37 (77.1%) | 7 (18.9%) |
| 75 Years and over | 0 (0.0%) | 0 (0.0%) |
Disability Class by Sex by Age in Poquonock Bridge
Disability Class: Hearing Difficulty
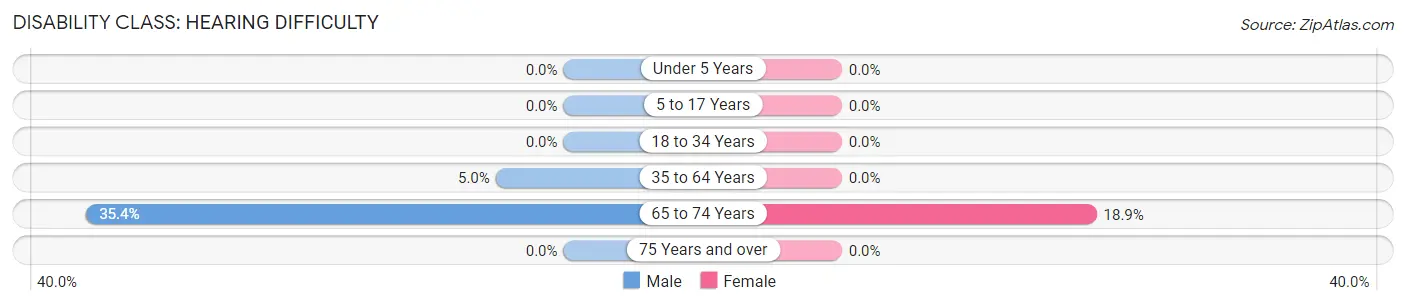
| Age Bracket | Male | Female |
| Under 5 Years | 0 (0.0%) | 0 (0.0%) |
| 5 to 17 Years | 0 (0.0%) | 0 (0.0%) |
| 18 to 34 Years | 0 (0.0%) | 0 (0.0%) |
| 35 to 64 Years | 8 (5.0%) | 0 (0.0%) |
| 65 to 74 Years | 17 (35.4%) | 7 (18.9%) |
| 75 Years and over | 0 (0.0%) | 0 (0.0%) |
Disability Class: Vision Difficulty
| Age Bracket | Male | Female |
| Under 5 Years | 0 (0.0%) | 0 (0.0%) |
| 5 to 17 Years | 0 (0.0%) | 0 (0.0%) |
| 18 to 34 Years | 0 (0.0%) | 0 (0.0%) |
| 35 to 64 Years | 0 (0.0%) | 0 (0.0%) |
| 65 to 74 Years | 0 (0.0%) | 0 (0.0%) |
| 75 Years and over | 0 (0.0%) | 0 (0.0%) |
Disability Class: Cognitive Difficulty
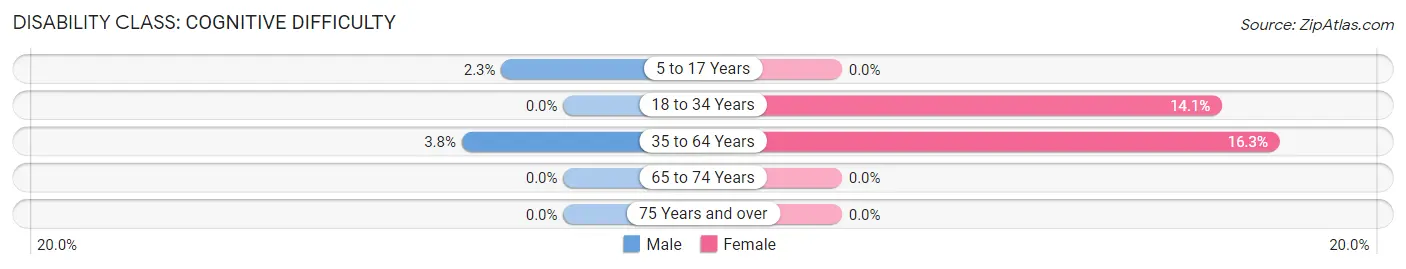
| Age Bracket | Male | Female |
| 5 to 17 Years | 4 (2.3%) | 0 (0.0%) |
| 18 to 34 Years | 0 (0.0%) | 24 (14.1%) |
| 35 to 64 Years | 6 (3.8%) | 47 (16.3%) |
| 65 to 74 Years | 0 (0.0%) | 0 (0.0%) |
| 75 Years and over | 0 (0.0%) | 0 (0.0%) |
Disability Class: Ambulatory Difficulty
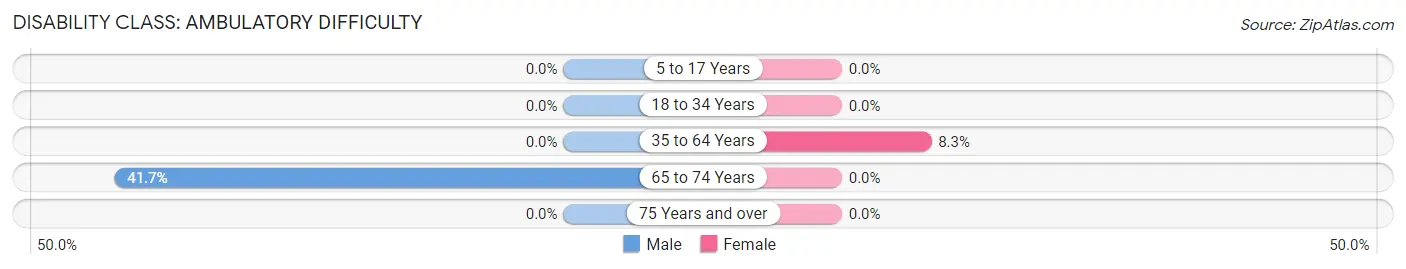
| Age Bracket | Male | Female |
| 5 to 17 Years | 0 (0.0%) | 0 (0.0%) |
| 18 to 34 Years | 0 (0.0%) | 0 (0.0%) |
| 35 to 64 Years | 0 (0.0%) | 24 (8.3%) |
| 65 to 74 Years | 20 (41.7%) | 0 (0.0%) |
| 75 Years and over | 0 (0.0%) | 0 (0.0%) |
Disability Class: Self-Care Difficulty
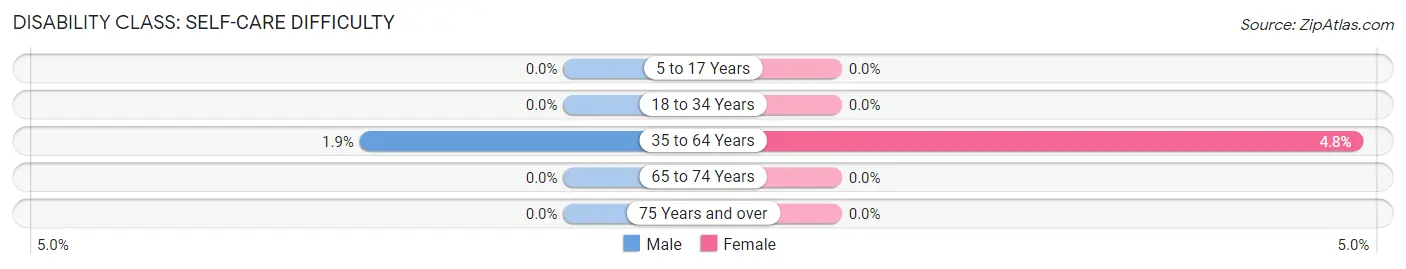
| Age Bracket | Male | Female |
| 5 to 17 Years | 0 (0.0%) | 0 (0.0%) |
| 18 to 34 Years | 0 (0.0%) | 0 (0.0%) |
| 35 to 64 Years | 3 (1.9%) | 14 (4.8%) |
| 65 to 74 Years | 0 (0.0%) | 0 (0.0%) |
| 75 Years and over | 0 (0.0%) | 0 (0.0%) |
Technology Access in Poquonock Bridge
Computing Device Access in Poquonock Bridge
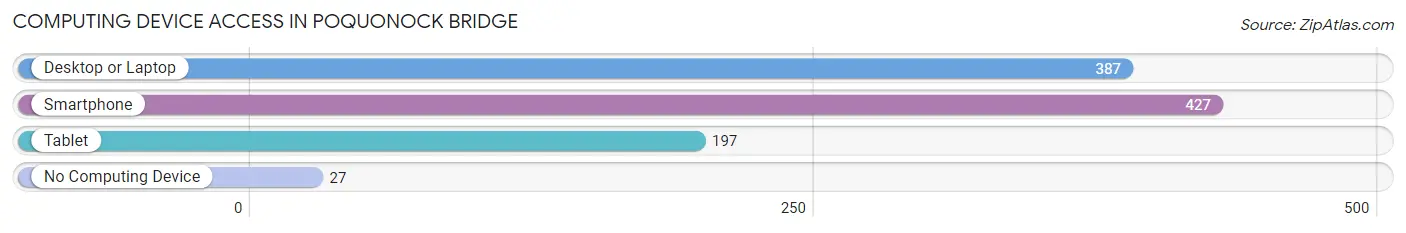
| Device Type | # Households | % Households |
| Desktop or Laptop | 387 | 77.2% |
| Smartphone | 427 | 85.2% |
| Tablet | 197 | 39.3% |
| No Computing Device | 27 | 5.4% |
| Total | 501 | 100.0% |
Internet Access in Poquonock Bridge
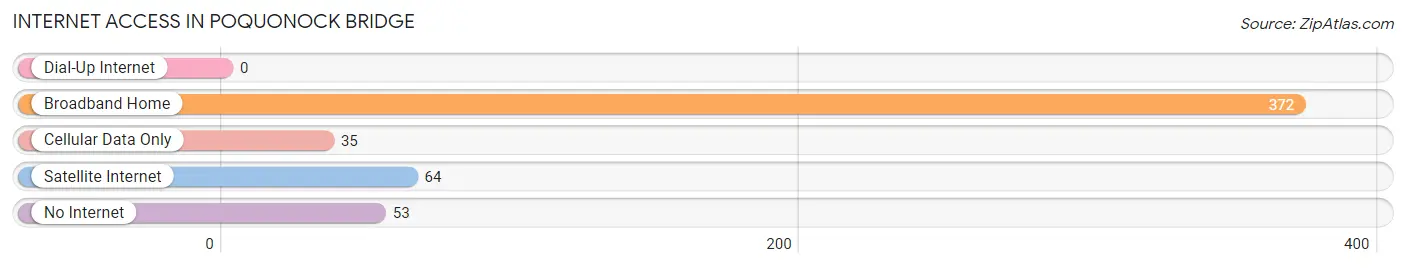
| Internet Type | # Households | % Households |
| Dial-Up Internet | 0 | 0.0% |
| Broadband Home | 372 | 74.3% |
| Cellular Data Only | 35 | 7.0% |
| Satellite Internet | 64 | 12.8% |
| No Internet | 53 | 10.6% |
| Total | 501 | 100.0% |
Poquonock Bridge Summary
Poquonock Bridge is a small, unincorporated community located in the town of Windsor, Connecticut. It is situated on the banks of the Farmington River, and is bordered by the towns of Suffield and East Granby. The community is home to approximately 1,000 people, and is known for its rural charm and small-town atmosphere.
History
The area that is now Poquonock Bridge was originally inhabited by the Poquonock Indians, a tribe of the Algonquin Nation. The tribe was driven out of the area in the late 1600s by English settlers. The area was then settled by the English in the early 1700s, and the first bridge across the Farmington River was built in 1720. The bridge was named Poquonock Bridge, and the area around it became known as Poquonock Bridge.
In the late 1700s, the area was home to a number of small farms and mills. The area was also home to a number of small businesses, including a blacksmith, a tannery, and a gristmill. The area was also home to a number of churches, including the First Congregational Church of Poquonock Bridge, which was founded in 1790.
In the early 1800s, the area was home to a number of small industries, including a paper mill, a sawmill, and a gristmill. The area was also home to a number of small stores, including a general store, a post office, and a blacksmith shop.
In the late 1800s, the area was home to a number of small businesses, including a hotel, a bank, and a number of small stores. The area was also home to a number of churches, including the First Congregational Church of Poquonock Bridge, which was founded in 1790.
In the early 1900s, the area was home to a number of small businesses, including a hotel, a bank, and a number of small stores. The area was also home to a number of churches, including the First Congregational Church of Poquonock Bridge, which was founded in 1790.
In the late 1900s, the area was home to a number of small businesses, including a hotel, a bank, and a number of small stores. The area was also home to a number of churches, including the First Congregational Church of Poquonock Bridge, which was founded in 1790.
Geography
Poquonock Bridge is located in the town of Windsor, Connecticut. It is situated on the banks of the Farmington River, and is bordered by the towns of Suffield and East Granby. The area is mostly rural, with a few small businesses and churches. The area is also home to a number of parks and recreational areas, including the Poquonock Bridge State Park.
Economy
The economy of Poquonock Bridge is largely based on small businesses and local services. The area is home to a number of small businesses, including a hotel, a bank, and a number of small stores. The area is also home to a number of churches, including the First Congregational Church of Poquonock Bridge, which was founded in 1790.
The area is also home to a number of small industries, including a paper mill, a sawmill, and a gristmill. The area is also home to a number of small farms, which produce a variety of crops, including corn, wheat, and hay.
Demographics
As of the 2010 census, the population of Poquonock Bridge was 1,000. The population is largely white (94.2%), with a small percentage of African Americans (2.2%), Asians (1.2%), and Hispanics (2.4%). The median household income is $60,000, and the median home value is $250,000. The area is largely rural, with a few small businesses and churches.
Common Questions
What is Per Capita Income in Poquonock Bridge?
Per Capita income in Poquonock Bridge is $29,079.
What is the Median Family Income in Poquonock Bridge?
Median Family Income in Poquonock Bridge is $62,202.
What is the Median Household income in Poquonock Bridge?
Median Household Income in Poquonock Bridge is $61,994.
What is Income or Wage Gap in Poquonock Bridge?
Income or Wage Gap in Poquonock Bridge is 38.8%.
Women in Poquonock Bridge earn 61.2 cents for every dollar earned by a man.
What is Inequality or Gini Index in Poquonock Bridge?
Inequality or Gini Index in Poquonock Bridge is 0.40.
What is the Total Population of Poquonock Bridge?
Total Population of Poquonock Bridge is 1,390.
What is the Total Male Population of Poquonock Bridge?
Total Male Population of Poquonock Bridge is 728.
What is the Total Female Population of Poquonock Bridge?
Total Female Population of Poquonock Bridge is 662.
What is the Ratio of Males per 100 Females in Poquonock Bridge?
There are 109.97 Males per 100 Females in Poquonock Bridge.
What is the Ratio of Females per 100 Males in Poquonock Bridge?
There are 90.93 Females per 100 Males in Poquonock Bridge.
What is the Median Population Age in Poquonock Bridge?
Median Population Age in Poquonock Bridge is 30.4 Years.
What is the Average Family Size in Poquonock Bridge
Average Family Size in Poquonock Bridge is 2.9 People.
What is the Average Household Size in Poquonock Bridge
Average Household Size in Poquonock Bridge is 2.8 People.
How Large is the Labor Force in Poquonock Bridge?
There are 832 People in the Labor Forcein in Poquonock Bridge.
What is the Percentage of People in the Labor Force in Poquonock Bridge?
80.5% of People are in the Labor Force in Poquonock Bridge.
What is the Unemployment Rate in Poquonock Bridge?
Unemployment Rate in Poquonock Bridge is 15.8%.