Bennington, NH Map & Demographics
Bennington Map
Bennington Overview
$44,127
PER CAPITA INCOME
$91,125
AVG FAMILY INCOME
$73,839
AVG HOUSEHOLD INCOME
39.0%
WAGE / INCOME GAP [ % ]
61.0¢/ $1
WAGE / INCOME GAP [ $ ]
0.35
INEQUALITY / GINI INDEX
253
TOTAL POPULATION
143
MALE POPULATION
110
FEMALE POPULATION
130.00
MALES / 100 FEMALES
76.92
FEMALES / 100 MALES
44.6
MEDIAN AGE
2.9
AVG FAMILY SIZE
2.1
AVG HOUSEHOLD SIZE
130
LABOR FORCE [ PEOPLE ]
65.0%
PERCENT IN LABOR FORCE
6.2%
UNEMPLOYMENT RATE
Bennington Zip Codes
Bennington Area Codes
Income in Bennington
Income Overview in Bennington
Per Capita Income in Bennington is $44,127, while median incomes of families and households are $91,125 and $73,839 respectively.
| Characteristic | Number | Measure |
| Per Capita Income | 253 | $44,127 |
| Median Family Income | 63 | $91,125 |
| Mean Family Income | 63 | $103,886 |
| Median Household Income | 121 | $73,839 |
| Mean Household Income | 121 | $91,328 |
| Income Deficit | 63 | $0 |
| Wage / Income Gap (%) | 253 | 39.02% |
| Wage / Income Gap ($) | 253 | 60.98¢ per $1 |
| Gini / Inequality Index | 253 | 0.35 |
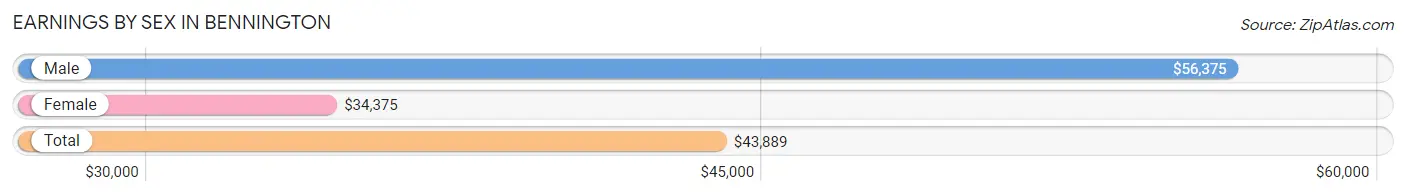
Earnings by Sex in Bennington
Average Earnings in Bennington are $43,889, $56,375 for men and $34,375 for women, a difference of 39.0%.
| Sex | Number | Average Earnings |
| Male | 75 (55.1%) | $56,375 |
| Female | 61 (44.9%) | $34,375 |
| Total | 136 (100.0%) | $43,889 |
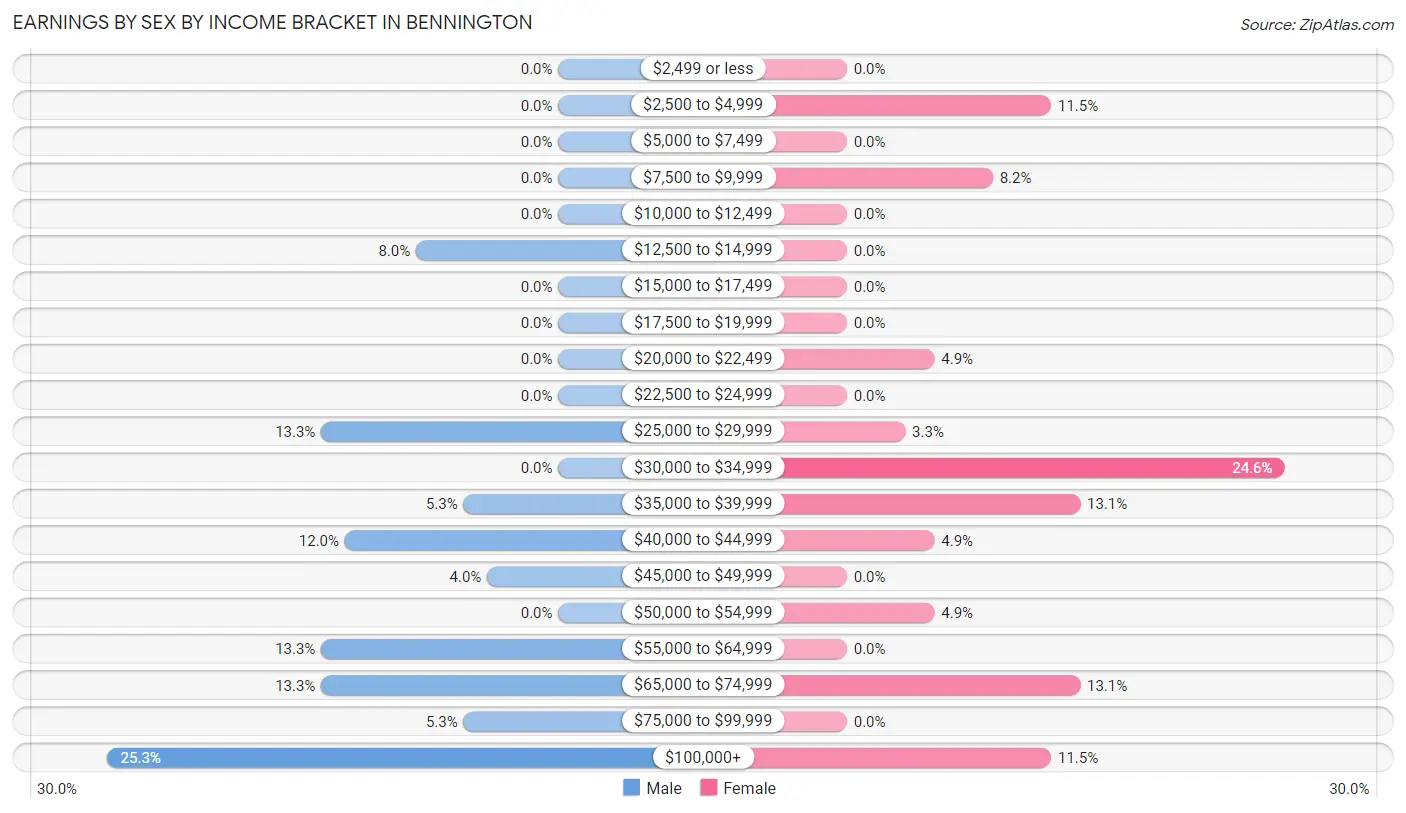
Earnings by Sex by Income Bracket in Bennington
The most common earnings brackets in Bennington are $100,000+ for men (19 | 25.3%) and $30,000 to $34,999 for women (15 | 24.6%).
| Income | Male | Female |
| $2,499 or less | 0 (0.0%) | 0 (0.0%) |
| $2,500 to $4,999 | 0 (0.0%) | 7 (11.5%) |
| $5,000 to $7,499 | 0 (0.0%) | 0 (0.0%) |
| $7,500 to $9,999 | 0 (0.0%) | 5 (8.2%) |
| $10,000 to $12,499 | 0 (0.0%) | 0 (0.0%) |
| $12,500 to $14,999 | 6 (8.0%) | 0 (0.0%) |
| $15,000 to $17,499 | 0 (0.0%) | 0 (0.0%) |
| $17,500 to $19,999 | 0 (0.0%) | 0 (0.0%) |
| $20,000 to $22,499 | 0 (0.0%) | 3 (4.9%) |
| $22,500 to $24,999 | 0 (0.0%) | 0 (0.0%) |
| $25,000 to $29,999 | 10 (13.3%) | 2 (3.3%) |
| $30,000 to $34,999 | 0 (0.0%) | 15 (24.6%) |
| $35,000 to $39,999 | 4 (5.3%) | 8 (13.1%) |
| $40,000 to $44,999 | 9 (12.0%) | 3 (4.9%) |
| $45,000 to $49,999 | 3 (4.0%) | 0 (0.0%) |
| $50,000 to $54,999 | 0 (0.0%) | 3 (4.9%) |
| $55,000 to $64,999 | 10 (13.3%) | 0 (0.0%) |
| $65,000 to $74,999 | 10 (13.3%) | 8 (13.1%) |
| $75,000 to $99,999 | 4 (5.3%) | 0 (0.0%) |
| $100,000+ | 19 (25.3%) | 7 (11.5%) |
| Total | 75 (100.0%) | 61 (100.0%) |
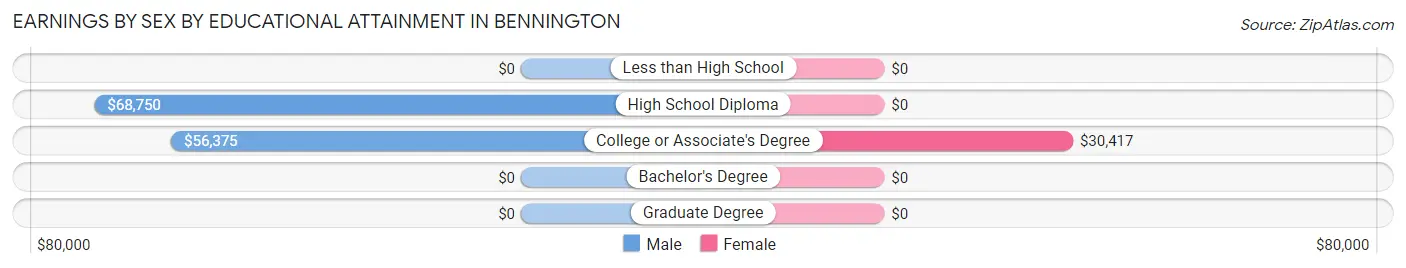
Earnings by Sex by Educational Attainment in Bennington
Average earnings in Bennington are $56,375 for men and $35,313 for women, a difference of 37.4%. Men with an educational attainment of high school diploma enjoy the highest average annual earnings of $68,750, while those with college or associate's degree education earn the least with $56,375. Women with an educational attainment of college or associate's degree earn the most with the average annual earnings of $30,417, while those with college or associate's degree education have the smallest earnings of $30,417.
| Educational Attainment | Male Income | Female Income |
| Less than High School | - | - |
| High School Diploma | $68,750 | $0 |
| College or Associate's Degree | $56,375 | $30,417 |
| Bachelor's Degree | - | - |
| Graduate Degree | - | - |
| Total | $56,375 | $35,313 |
Family Income in Bennington
Family Income Brackets in Bennington
According to the Bennington family income data, there are 17 families falling into the $75,000 to $99,999 income range, which is the most common income bracket and makes up 27.0% of all families.
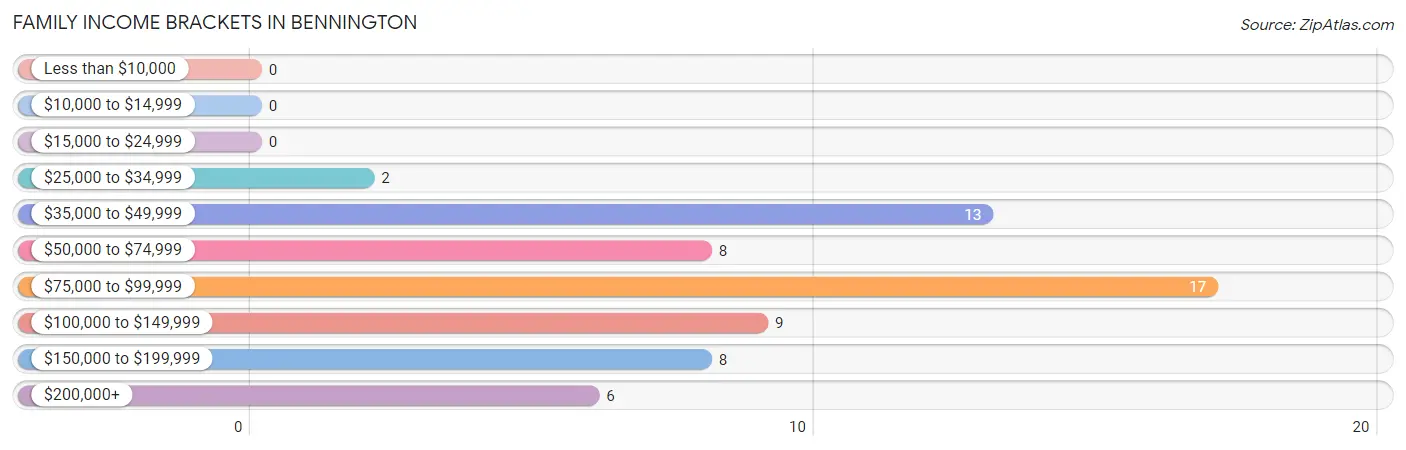
| Income Bracket | # Families | % Families |
| Less than $10,000 | 0 | 0.0% |
| $10,000 to $14,999 | 0 | 0.0% |
| $15,000 to $24,999 | 0 | 0.0% |
| $25,000 to $34,999 | 2 | 3.2% |
| $35,000 to $49,999 | 13 | 20.6% |
| $50,000 to $74,999 | 8 | 12.7% |
| $75,000 to $99,999 | 17 | 27.0% |
| $100,000 to $149,999 | 9 | 14.3% |
| $150,000 to $199,999 | 8 | 12.7% |
| $200,000+ | 6 | 9.5% |
Family Income by Famaliy Size in Bennington
2-person families (40 | 63.5%) account for the highest median family income in Bennington with $92,250 per family, while 2-person families (40 | 63.5%) have the highest median income of $46,125 per family member.
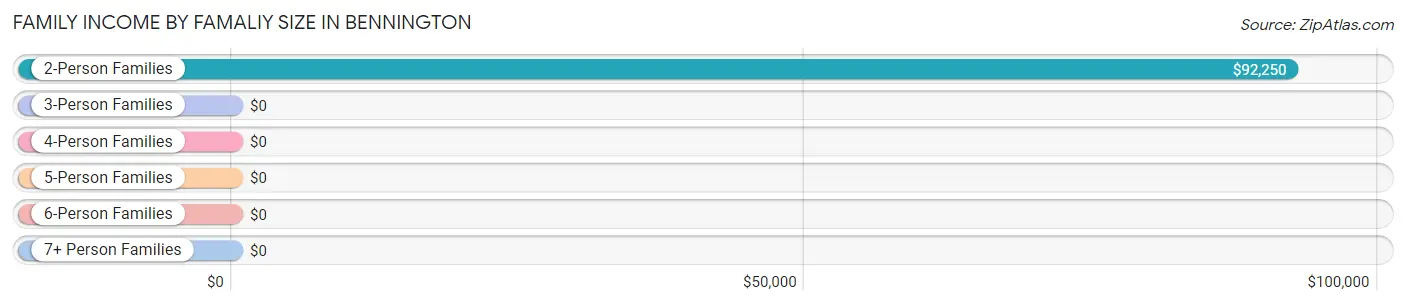
| Income Bracket | # Families | Median Income |
| 2-Person Families | 40 (63.5%) | $92,250 |
| 3-Person Families | 11 (17.5%) | $0 |
| 4-Person Families | 0 (0.0%) | $0 |
| 5-Person Families | 9 (14.3%) | $0 |
| 6-Person Families | 0 (0.0%) | $0 |
| 7+ Person Families | 3 (4.8%) | $0 |
| Total | 63 (100.0%) | $91,125 |
Family Income by Number of Earners in Bennington
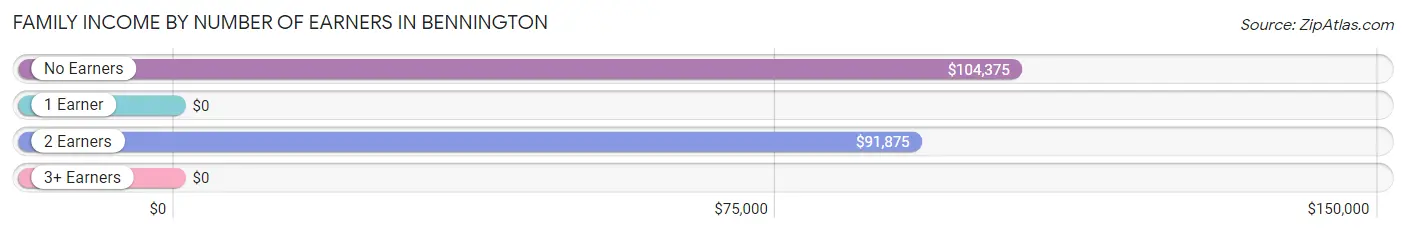
| Number of Earners | # Families | Median Income |
| No Earners | 7 (11.1%) | $104,375 |
| 1 Earner | 23 (36.5%) | $0 |
| 2 Earners | 33 (52.4%) | $91,875 |
| 3+ Earners | 0 (0.0%) | $0 |
| Total | 63 (100.0%) | $91,125 |
Household Income in Bennington
Household Income Brackets in Bennington
With 38 households falling in the category, the $50,000 to $74,999 income range is the most frequent in Bennington, accounting for 31.4% of all households.
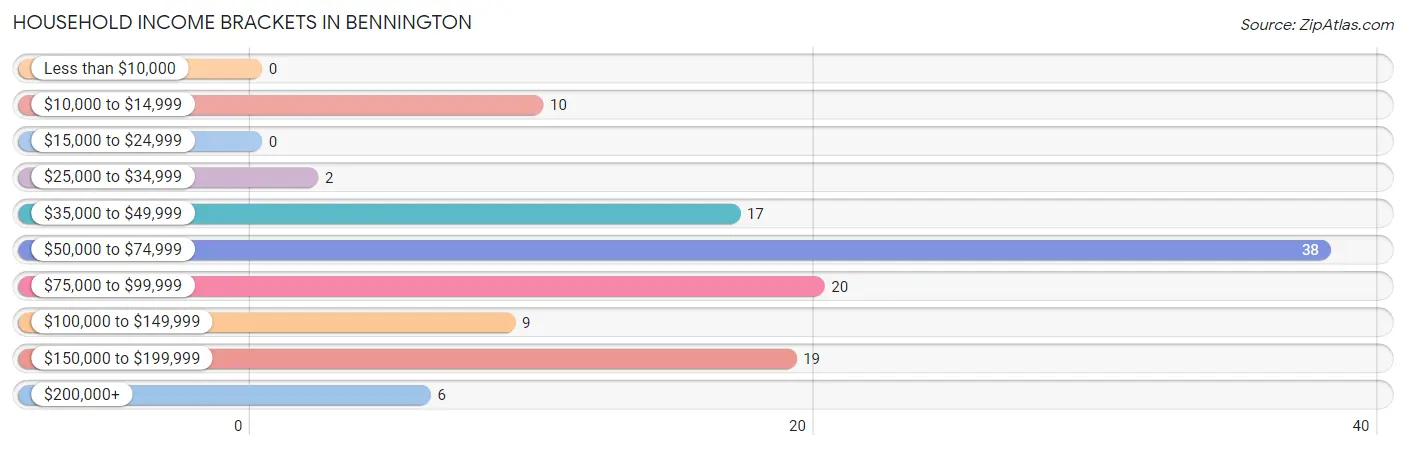
| Income Bracket | # Households | % Households |
| Less than $10,000 | 0 | 0.0% |
| $10,000 to $14,999 | 10 | 8.3% |
| $15,000 to $24,999 | 0 | 0.0% |
| $25,000 to $34,999 | 2 | 1.7% |
| $35,000 to $49,999 | 17 | 14.0% |
| $50,000 to $74,999 | 38 | 31.4% |
| $75,000 to $99,999 | 20 | 16.5% |
| $100,000 to $149,999 | 9 | 7.4% |
| $150,000 to $199,999 | 19 | 15.7% |
| $200,000+ | 6 | 5.0% |
Household Income by Householder Age in Bennington
The median household income in Bennington is $73,839, with the highest median household income of $74,318 found in the 45 to 64 years age bracket for the primary householder. A total of 40 households (33.1%) fall into this category.
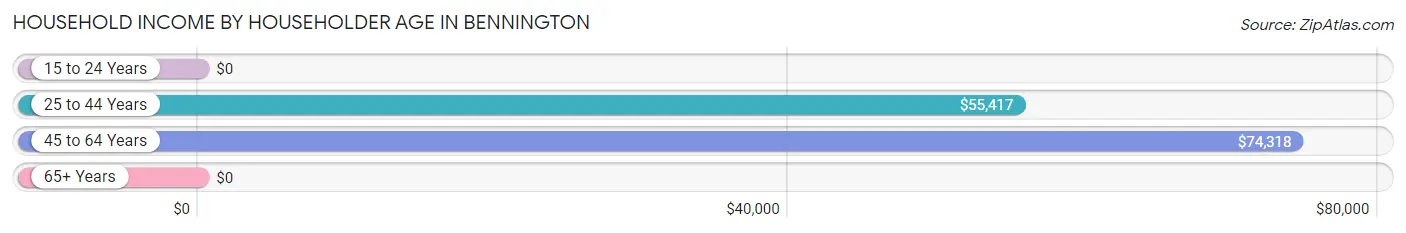
| Income Bracket | # Households | Median Income |
| 15 to 24 Years | 0 (0.0%) | $0 |
| 25 to 44 Years | 47 (38.8%) | $55,417 |
| 45 to 64 Years | 40 (33.1%) | $74,318 |
| 65+ Years | 34 (28.1%) | $0 |
| Total | 121 (100.0%) | $73,839 |
Poverty in Bennington
Income Below Poverty by Sex and Age in Bennington
With 9.1% poverty level for males and 4.5% for females among the residents of Bennington, 35 to 44 year old males and 18 to 24 year old females are the most vulnerable to poverty, with 10 males (71.4%) and 5 females (100.0%) in their respective age groups living below the poverty level.
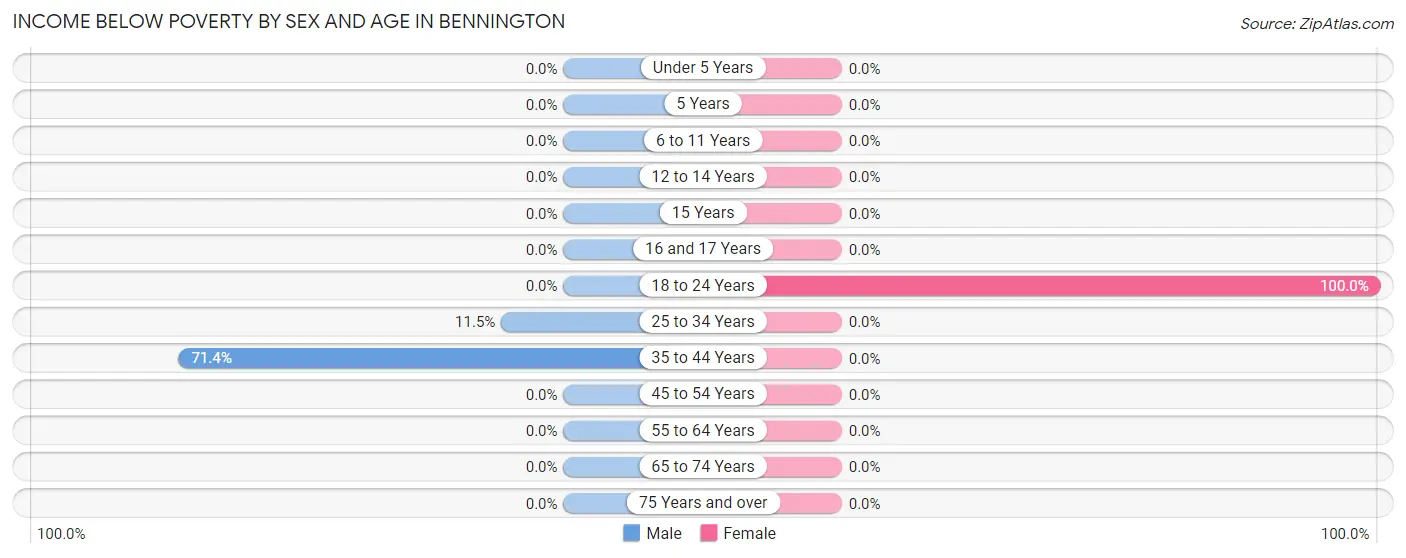
| Age Bracket | Male | Female |
| Under 5 Years | 0 (0.0%) | 0 (0.0%) |
| 5 Years | 0 (0.0%) | 0 (0.0%) |
| 6 to 11 Years | 0 (0.0%) | 0 (0.0%) |
| 12 to 14 Years | 0 (0.0%) | 0 (0.0%) |
| 15 Years | 0 (0.0%) | 0 (0.0%) |
| 16 and 17 Years | 0 (0.0%) | 0 (0.0%) |
| 18 to 24 Years | 0 (0.0%) | 5 (100.0%) |
| 25 to 34 Years | 3 (11.5%) | 0 (0.0%) |
| 35 to 44 Years | 10 (71.4%) | 0 (0.0%) |
| 45 to 54 Years | 0 (0.0%) | 0 (0.0%) |
| 55 to 64 Years | 0 (0.0%) | 0 (0.0%) |
| 65 to 74 Years | 0 (0.0%) | 0 (0.0%) |
| 75 Years and over | 0 (0.0%) | 0 (0.0%) |
| Total | 13 (9.1%) | 5 (4.5%) |
Income Above Poverty by Sex and Age in Bennington
According to the poverty statistics in Bennington, males aged under 5 years and females aged under 5 years are the age groups that are most secure financially, with 100.0% of males and 100.0% of females in these age groups living above the poverty line.
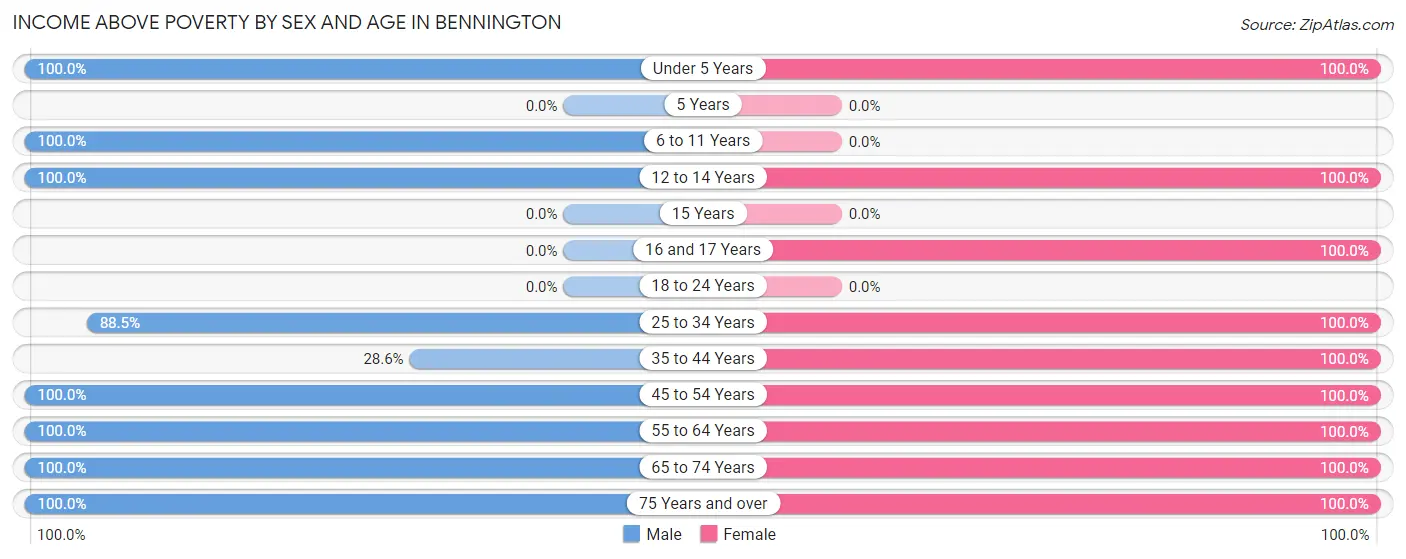
| Age Bracket | Male | Female |
| Under 5 Years | 20 (100.0%) | 9 (100.0%) |
| 5 Years | 0 (0.0%) | 0 (0.0%) |
| 6 to 11 Years | 7 (100.0%) | 0 (0.0%) |
| 12 to 14 Years | 4 (100.0%) | 13 (100.0%) |
| 15 Years | 0 (0.0%) | 0 (0.0%) |
| 16 and 17 Years | 0 (0.0%) | 4 (100.0%) |
| 18 to 24 Years | 0 (0.0%) | 0 (0.0%) |
| 25 to 34 Years | 23 (88.5%) | 25 (100.0%) |
| 35 to 44 Years | 4 (28.6%) | 5 (100.0%) |
| 45 to 54 Years | 15 (100.0%) | 9 (100.0%) |
| 55 to 64 Years | 16 (100.0%) | 20 (100.0%) |
| 65 to 74 Years | 26 (100.0%) | 12 (100.0%) |
| 75 Years and over | 15 (100.0%) | 8 (100.0%) |
| Total | 130 (90.9%) | 105 (95.5%) |
Income Below Poverty Among Married-Couple Families in Bennington
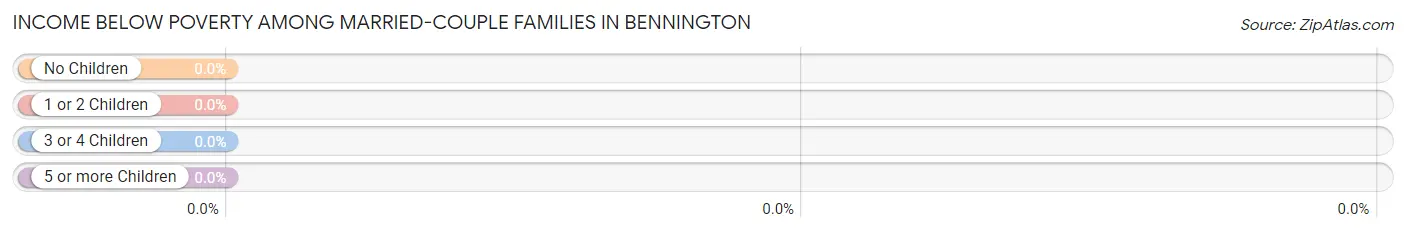
| Children | Above Poverty | Below Poverty |
| No Children | 40 (100.0%) | 0 (0.0%) |
| 1 or 2 Children | 3 (100.0%) | 0 (0.0%) |
| 3 or 4 Children | 12 (100.0%) | 0 (0.0%) |
| 5 or more Children | 0 (0.0%) | 0 (0.0%) |
| Total | 55 (100.0%) | 0 (0.0%) |
Income Below Poverty Among Single-Parent Households in Bennington
| Children | Single Father | Single Mother |
| No Children | 0 (0.0%) | 0 (0.0%) |
| 1 or 2 Children | 0 (0.0%) | 0 (0.0%) |
| 3 or 4 Children | 0 (0.0%) | 0 (0.0%) |
| 5 or more Children | 0 (0.0%) | 0 (0.0%) |
| Total | 0 (0.0%) | 0 (0.0%) |
Income Below Poverty Among Married-Couple vs Single-Parent Households in Bennington
| Children | Married-Couple Families | Single-Parent Households |
| No Children | 0 (0.0%) | 0 (0.0%) |
| 1 or 2 Children | 0 (0.0%) | 0 (0.0%) |
| 3 or 4 Children | 0 (0.0%) | 0 (0.0%) |
| 5 or more Children | 0 (0.0%) | 0 (0.0%) |
| Total | 0 (0.0%) | 0 (0.0%) |
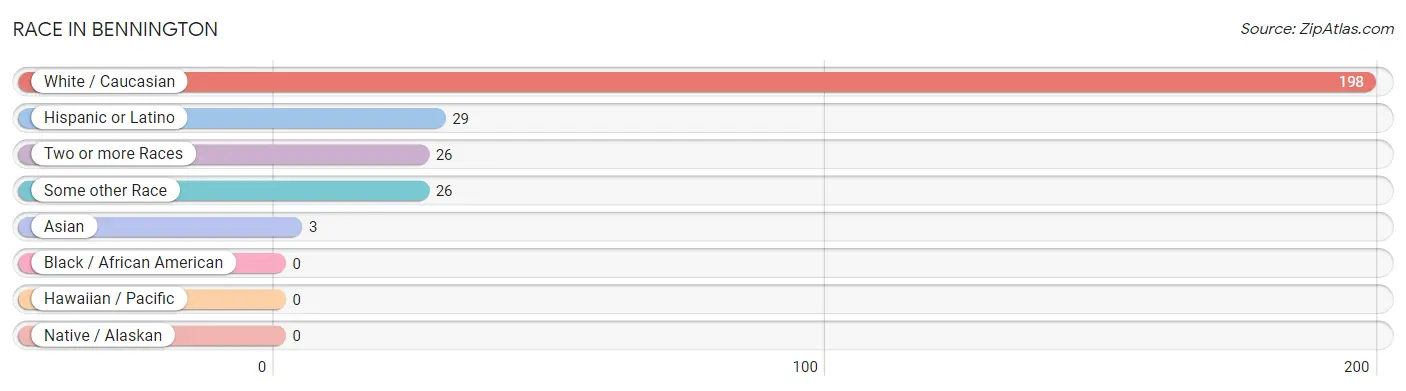
Race in Bennington
The most populous races in Bennington are White / Caucasian (198 | 78.3%), Hispanic or Latino (29 | 11.5%), and Two or more Races (26 | 10.3%).
| Race | # Population | % Population |
| Asian | 3 | 1.2% |
| Black / African American | 0 | 0.0% |
| Hawaiian / Pacific | 0 | 0.0% |
| Hispanic or Latino | 29 | 11.5% |
| Native / Alaskan | 0 | 0.0% |
| White / Caucasian | 198 | 78.3% |
| Two or more Races | 26 | 10.3% |
| Some other Race | 26 | 10.3% |
| Total | 253 | 100.0% |
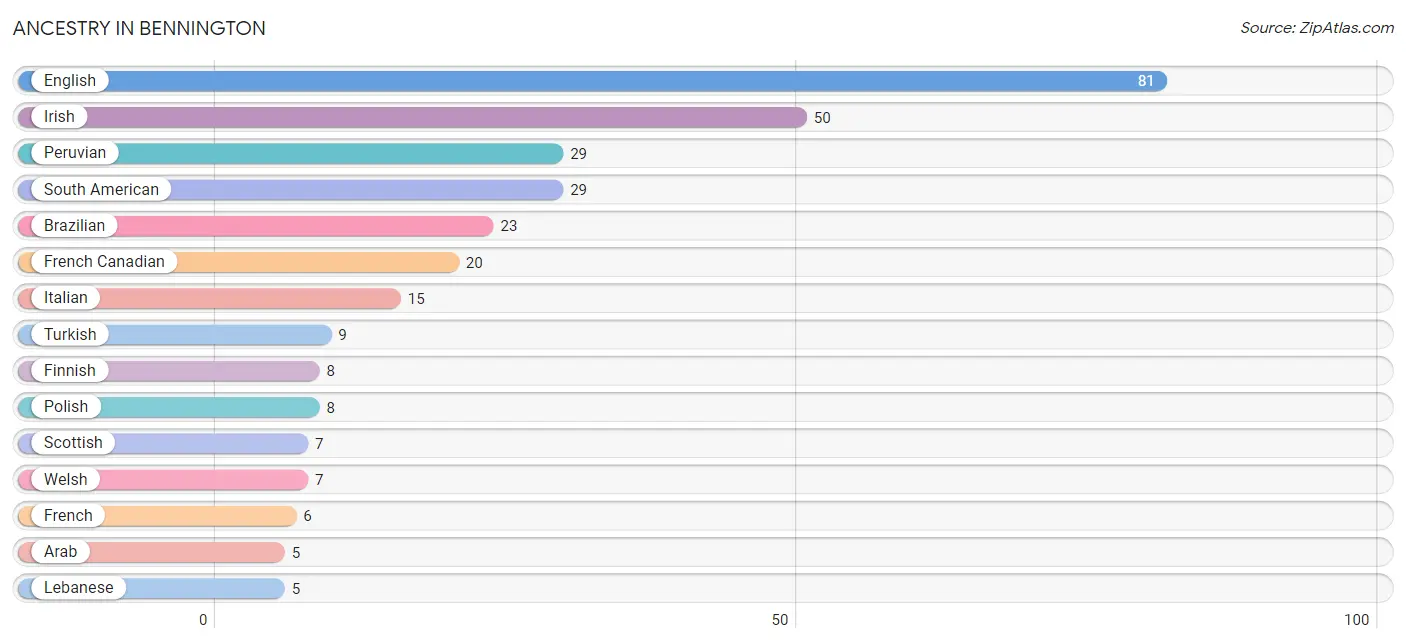
Ancestry in Bennington
The most populous ancestries reported in Bennington are English (81 | 32.0%), Irish (50 | 19.8%), Peruvian (29 | 11.5%), South American (29 | 11.5%), and Brazilian (23 | 9.1%), together accounting for 83.8% of all Bennington residents.
| Ancestry | # Population | % Population |
| American | 3 | 1.2% |
| Arab | 5 | 2.0% |
| Brazilian | 23 | 9.1% |
| English | 81 | 32.0% |
| European | 2 | 0.8% |
| Finnish | 8 | 3.2% |
| French | 6 | 2.4% |
| French Canadian | 20 | 7.9% |
| German | 3 | 1.2% |
| Irish | 50 | 19.8% |
| Italian | 15 | 5.9% |
| Korean | 3 | 1.2% |
| Lebanese | 5 | 2.0% |
| Peruvian | 29 | 11.5% |
| Polish | 8 | 3.2% |
| Scottish | 7 | 2.8% |
| South American | 29 | 11.5% |
| Turkish | 9 | 3.6% |
| Welsh | 7 | 2.8% | View All 19 Rows |
Immigrants in Bennington
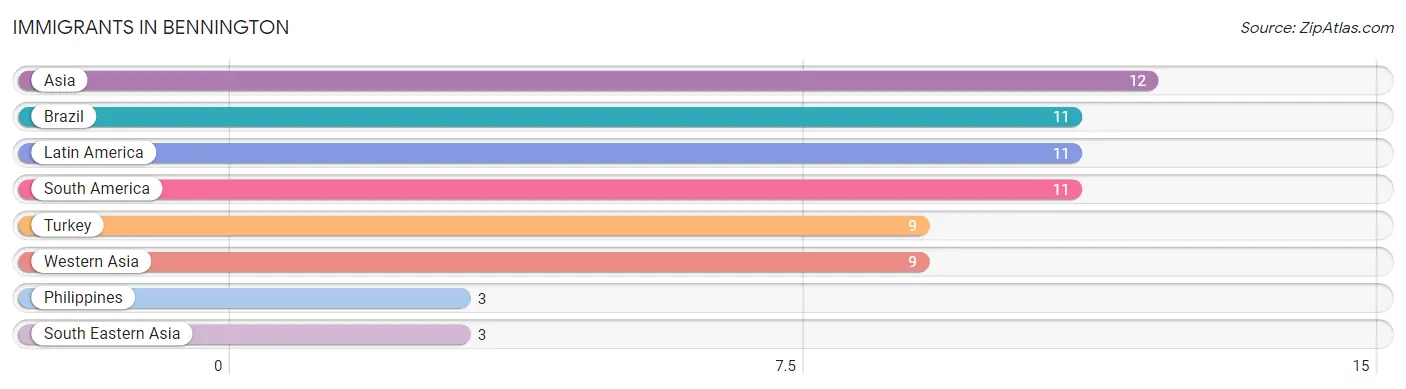
The most numerous immigrant groups reported in Bennington came from Asia (12 | 4.7%), Brazil (11 | 4.3%), Latin America (11 | 4.3%), South America (11 | 4.3%), and Turkey (9 | 3.6%), together accounting for 21.3% of all Bennington residents.
| Immigration Origin | # Population | % Population |
| Asia | 12 | 4.7% |
| Brazil | 11 | 4.3% |
| Latin America | 11 | 4.3% |
| Philippines | 3 | 1.2% |
| South America | 11 | 4.3% |
| South Eastern Asia | 3 | 1.2% |
| Turkey | 9 | 3.6% |
| Western Asia | 9 | 3.6% | View All 8 Rows |
Sex and Age in Bennington
Sex and Age in Bennington
The most populous age groups in Bennington are Under 5 Years (20 | 14.0%) for men and 25 to 29 Years (17 | 15.4%) for women.

| Age Bracket | Male | Female |
| Under 5 Years | 20 (14.0%) | 9 (8.2%) |
| 5 to 9 Years | 7 (4.9%) | 0 (0.0%) |
| 10 to 14 Years | 4 (2.8%) | 13 (11.8%) |
| 15 to 19 Years | 0 (0.0%) | 4 (3.6%) |
| 20 to 24 Years | 0 (0.0%) | 5 (4.5%) |
| 25 to 29 Years | 9 (6.3%) | 17 (15.4%) |
| 30 to 34 Years | 17 (11.9%) | 8 (7.3%) |
| 35 to 39 Years | 0 (0.0%) | 2 (1.8%) |
| 40 to 44 Years | 14 (9.8%) | 3 (2.7%) |
| 45 to 49 Years | 7 (4.9%) | 6 (5.4%) |
| 50 to 54 Years | 8 (5.6%) | 3 (2.7%) |
| 55 to 59 Years | 10 (7.0%) | 8 (7.3%) |
| 60 to 64 Years | 6 (4.2%) | 12 (10.9%) |
| 65 to 69 Years | 9 (6.3%) | 5 (4.5%) |
| 70 to 74 Years | 17 (11.9%) | 7 (6.4%) |
| 75 to 79 Years | 3 (2.1%) | 2 (1.8%) |
| 80 to 84 Years | 9 (6.3%) | 6 (5.4%) |
| 85 Years and over | 3 (2.1%) | 0 (0.0%) |
| Total | 143 (100.0%) | 110 (100.0%) |
Families and Households in Bennington
Median Family Size in Bennington

| Family Type | # Families | Family Size |
| Married-Couple | 55 (87.3%) | 2.75 |
| Single Male/Father | 0 (0.0%) | - |
| Single Female/Mother | 8 (12.7%) | 3.63 |
| Total Families | 63 (100.0%) | 2.86 |
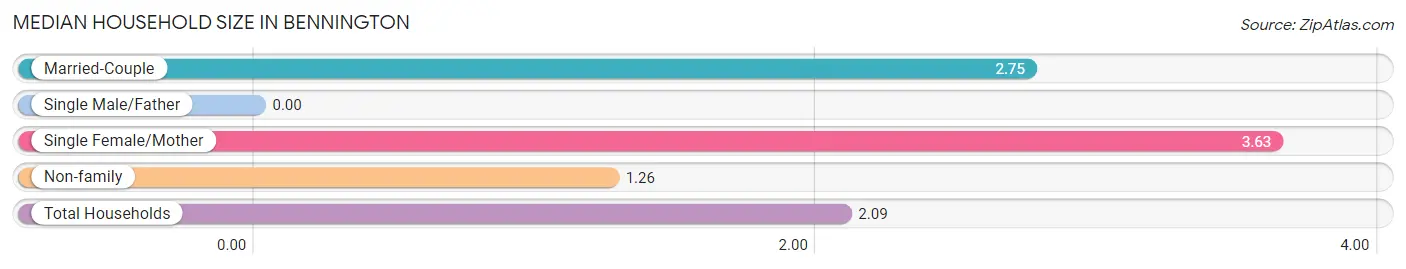
Median Household Size in Bennington
| Household Type | # Households | Household Size |
| Married-Couple | 55 (45.5%) | 2.75 |
| Single Male/Father | 0 (0.0%) | - |
| Single Female/Mother | 8 (6.6%) | 3.63 |
| Non-family | 58 (47.9%) | 1.26 |
| Total Households | 121 (100.0%) | 2.09 |
Household Size by Marriage Status in Bennington
Out of a total of 121 households in Bennington, 63 (52.1%) are family households, while 58 (47.9%) are nonfamily households. The most numerous type of family households are 2-person households, comprising 40, and the most common type of nonfamily households are 1-person households, comprising 48.
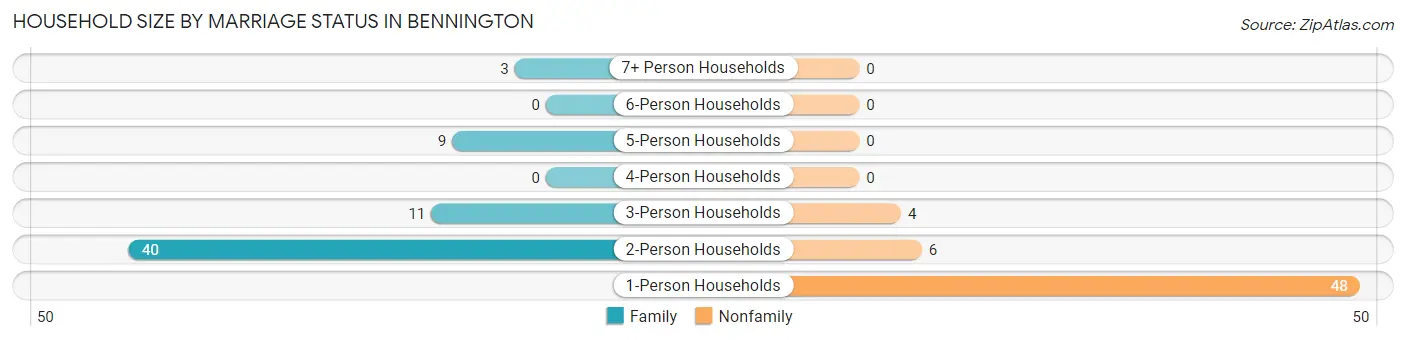
| Household Size | Family Households | Nonfamily Households |
| 1-Person Households | - | 48 (39.7%) |
| 2-Person Households | 40 (33.1%) | 6 (5.0%) |
| 3-Person Households | 11 (9.1%) | 4 (3.3%) |
| 4-Person Households | 0 (0.0%) | 0 (0.0%) |
| 5-Person Households | 9 (7.4%) | 0 (0.0%) |
| 6-Person Households | 0 (0.0%) | 0 (0.0%) |
| 7+ Person Households | 3 (2.5%) | 0 (0.0%) |
| Total | 63 (52.1%) | 58 (47.9%) |
Female Fertility in Bennington
Fertility by Age in Bennington
Average fertility rate in Bennington is 111.0 births per 1,000 women. Women in the age bracket of 20 to 34 years have the highest fertility rate with 167.0 births per 1,000 women. Women in the age bracket of 20 to 34 years acount for 100.0% of all women with births.
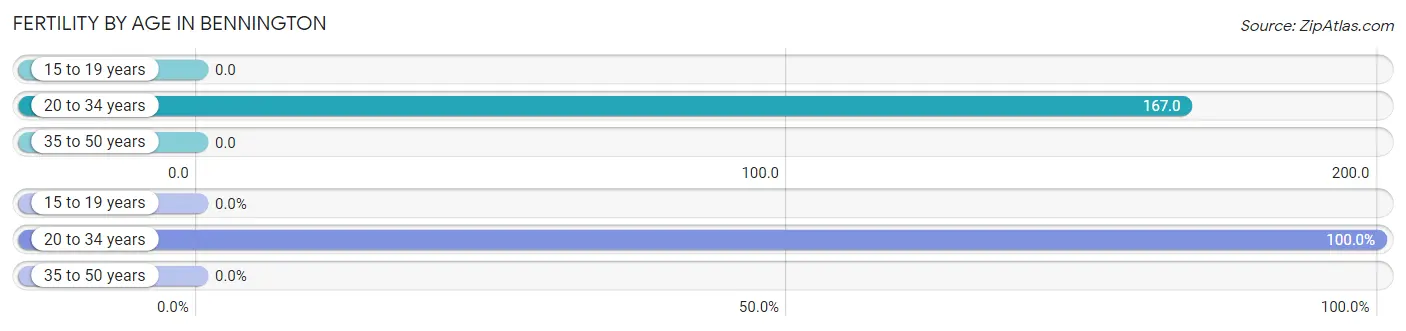
| Age Bracket | Women with Births | Births / 1,000 Women |
| 15 to 19 years | 0 (0.0%) | 0.0 |
| 20 to 34 years | 5 (100.0%) | 167.0 |
| 35 to 50 years | 0 (0.0%) | 0.0 |
| Total | 5 (100.0%) | 111.0 |
Fertility by Age by Marriage Status in Bennington
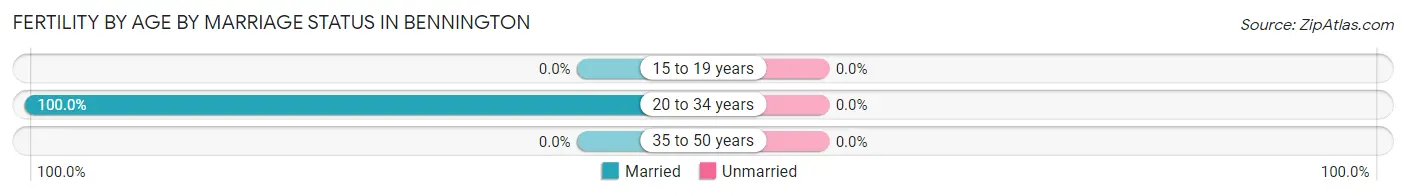
| Age Bracket | Married | Unmarried |
| 15 to 19 years | 0 (0.0%) | 0 (0.0%) |
| 20 to 34 years | 5 (100.0%) | 0 (0.0%) |
| 35 to 50 years | 0 (0.0%) | 0 (0.0%) |
| Total | 5 (100.0%) | 0 (0.0%) |
Fertility by Education in Bennington
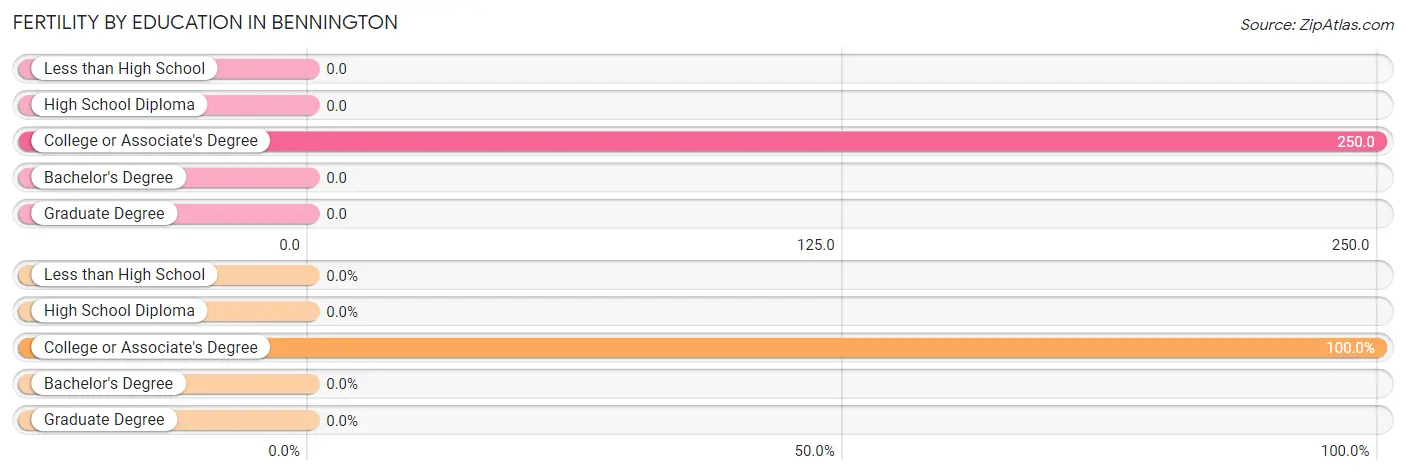
| Educational Attainment | Women with Births | Births / 1,000 Women |
| Less than High School | 0 (0.0%) | 0.0 |
| High School Diploma | 0 (0.0%) | 0.0 |
| College or Associate's Degree | 5 (100.0%) | 250.0 |
| Bachelor's Degree | 0 (0.0%) | 0.0 |
| Graduate Degree | 0 (0.0%) | 0.0 |
| Total | 5 (100.0%) | 111.0 |
Fertility by Education by Marriage Status in Bennington
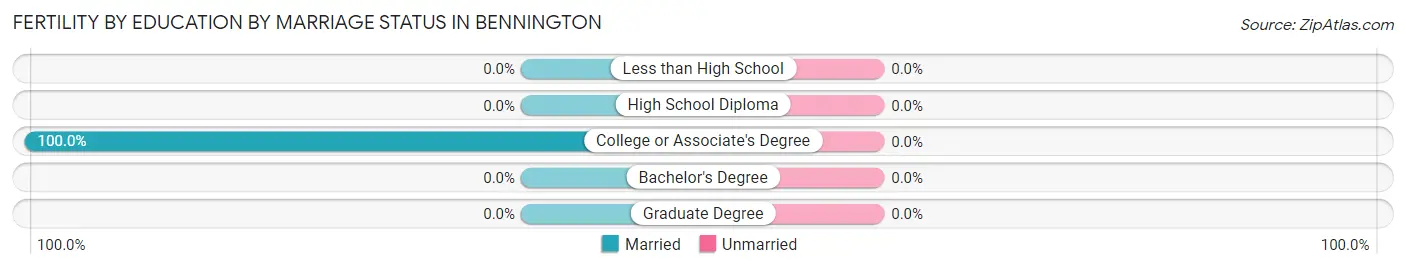
| Educational Attainment | Married | Unmarried |
| Less than High School | 0 (0.0%) | 0 (0.0%) |
| High School Diploma | 0 (0.0%) | 0 (0.0%) |
| College or Associate's Degree | 5 (100.0%) | 0 (0.0%) |
| Bachelor's Degree | 0 (0.0%) | 0 (0.0%) |
| Graduate Degree | 0 (0.0%) | 0 (0.0%) |
| Total | 5 (100.0%) | 0 (0.0%) |
Employment Characteristics in Bennington
Employment by Class of Employer in Bennington
Among the 115 employed individuals in Bennington, private company employees (85 | 73.9%), not-for-profit organizations (10 | 8.7%), and self-employed (not incorporated) (7 | 6.1%) make up the most common classes of employment.
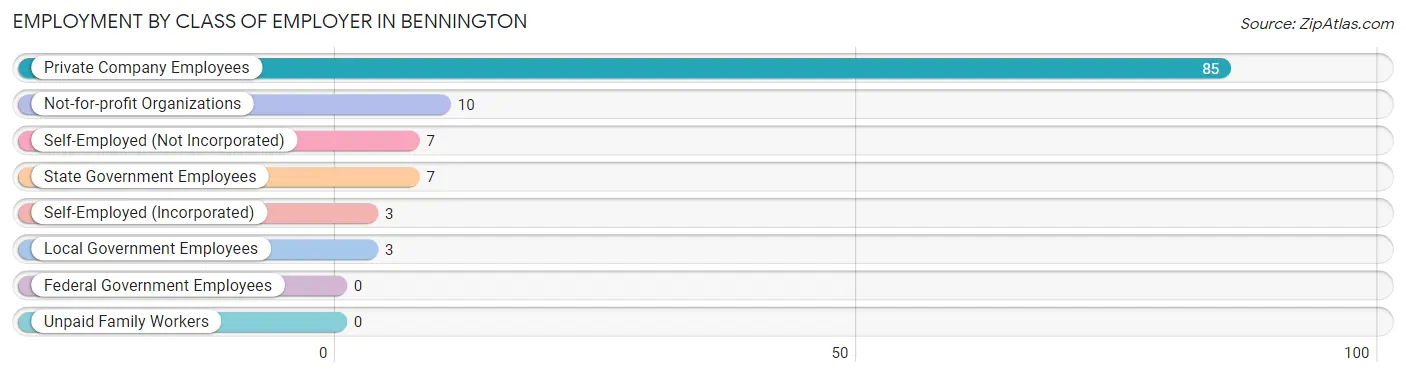
| Employer Class | # Employees | % Employees |
| Private Company Employees | 85 | 73.9% |
| Self-Employed (Incorporated) | 3 | 2.6% |
| Self-Employed (Not Incorporated) | 7 | 6.1% |
| Not-for-profit Organizations | 10 | 8.7% |
| Local Government Employees | 3 | 2.6% |
| State Government Employees | 7 | 6.1% |
| Federal Government Employees | 0 | 0.0% |
| Unpaid Family Workers | 0 | 0.0% |
| Total | 115 | 100.0% |
Employment Status by Age in Bennington
According to the labor force statistics for Bennington, out of the total population over 16 years of age (200), 65.0% or 130 individuals are in the labor force, with 6.2% or 8 of them unemployed. The age group with the highest labor force participation rate is 20 to 24 years, with 100.0% or 5 individuals in the labor force. Within the labor force, the 30 to 34 years age range has the highest percentage of unemployed individuals, with 32.0% or 8 of them being unemployed.
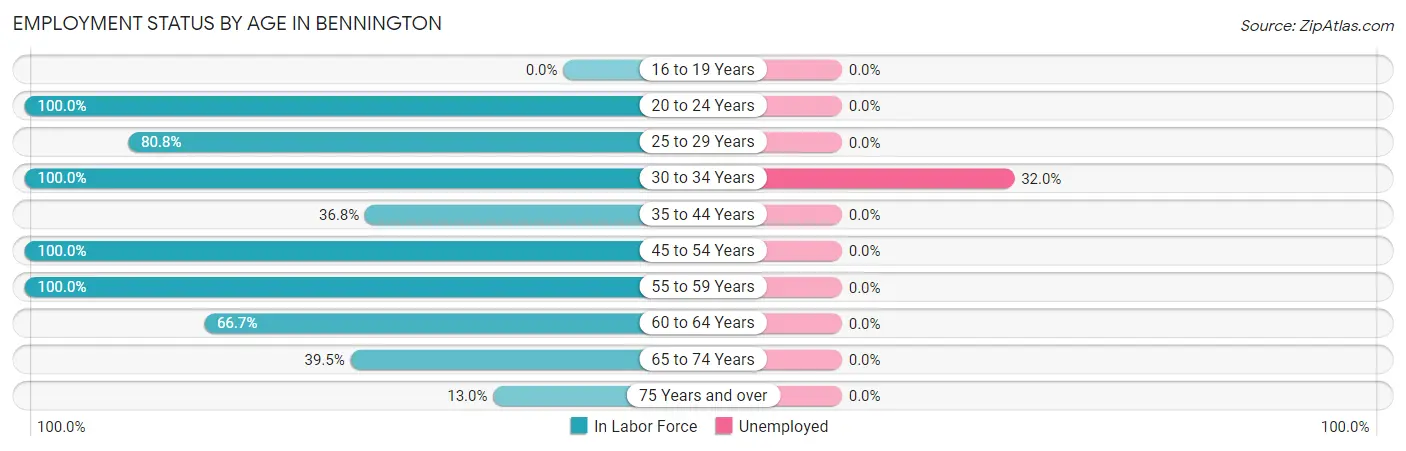
| Age Bracket | In Labor Force | Unemployed |
| 16 to 19 Years | 0 (0.0%) | 0 (0.0%) |
| 20 to 24 Years | 5 (100.0%) | 0 (0.0%) |
| 25 to 29 Years | 21 (80.8%) | 0 (0.0%) |
| 30 to 34 Years | 25 (100.0%) | 8 (32.0%) |
| 35 to 44 Years | 7 (36.8%) | 0 (0.0%) |
| 45 to 54 Years | 24 (100.0%) | 0 (0.0%) |
| 55 to 59 Years | 18 (100.0%) | 0 (0.0%) |
| 60 to 64 Years | 12 (66.7%) | 0 (0.0%) |
| 65 to 74 Years | 15 (39.5%) | 0 (0.0%) |
| 75 Years and over | 3 (13.0%) | 0 (0.0%) |
| Total | 130 (65.0%) | 8 (6.2%) |
Employment Status by Educational Attainment in Bennington
According to labor force statistics for Bennington, 82.3% of individuals (107) out of the total population between 25 and 64 years of age (130) are in the labor force, with 7.5% or 8 of them being unemployed. The group with the highest labor force participation rate are those with the educational attainment of less than high school, with 100.0% or 3 individuals in the labor force. Within the labor force, individuals with high school diploma education have the highest percentage of unemployment, with 21.6% or 8 of them being unemployed.
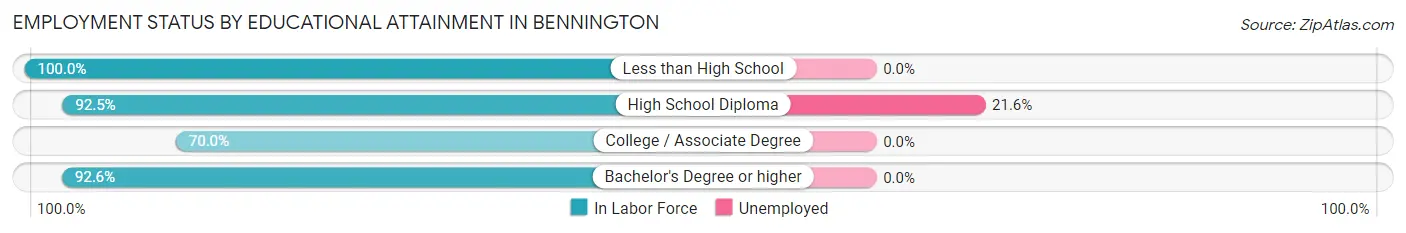
| Educational Attainment | In Labor Force | Unemployed |
| Less than High School | 3 (100.0%) | 0 (0.0%) |
| High School Diploma | 37 (92.5%) | 9 (21.6%) |
| College / Associate Degree | 42 (70.0%) | 0 (0.0%) |
| Bachelor's Degree or higher | 25 (92.6%) | 0 (0.0%) |
| Total | 107 (82.3%) | 10 (7.5%) |
Employment Occupations by Sex in Bennington
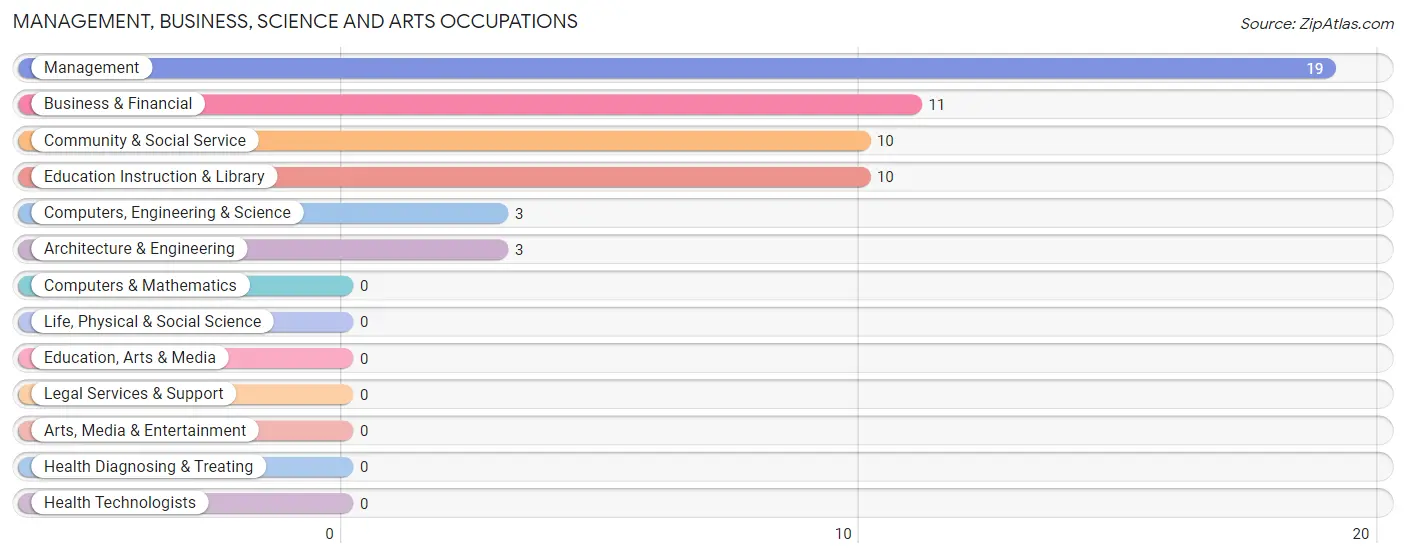
Management, Business, Science and Arts Occupations
The most common Management, Business, Science and Arts occupations in Bennington are Management (19 | 15.6%), Business & Financial (11 | 9.0%), Community & Social Service (10 | 8.2%), Education Instruction & Library (10 | 8.2%), and Computers, Engineering & Science (3 | 2.5%).
Management, Business, Science and Arts Occupations by Sex
Within the Management, Business, Science and Arts occupations in Bennington, the most male-oriented occupations are Computers, Engineering & Science (100.0%), Architecture & Engineering (100.0%), and Management (47.4%), while the most female-oriented occupations are Business & Financial (100.0%), Community & Social Service (100.0%), and Education Instruction & Library (100.0%).
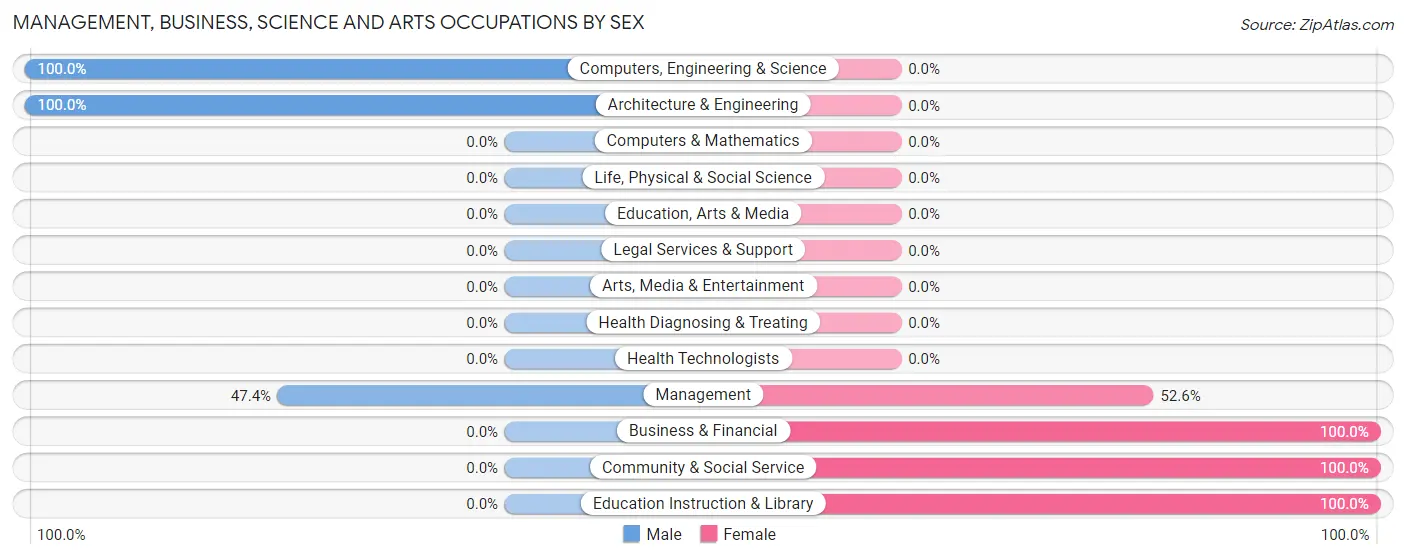
| Occupation | Male | Female |
| Management | 9 (47.4%) | 10 (52.6%) |
| Business & Financial | 0 (0.0%) | 11 (100.0%) |
| Computers, Engineering & Science | 3 (100.0%) | 0 (0.0%) |
| Computers & Mathematics | 0 (0.0%) | 0 (0.0%) |
| Architecture & Engineering | 3 (100.0%) | 0 (0.0%) |
| Life, Physical & Social Science | 0 (0.0%) | 0 (0.0%) |
| Community & Social Service | 0 (0.0%) | 10 (100.0%) |
| Education, Arts & Media | 0 (0.0%) | 0 (0.0%) |
| Legal Services & Support | 0 (0.0%) | 0 (0.0%) |
| Education Instruction & Library | 0 (0.0%) | 10 (100.0%) |
| Arts, Media & Entertainment | 0 (0.0%) | 0 (0.0%) |
| Health Diagnosing & Treating | 0 (0.0%) | 0 (0.0%) |
| Health Technologists | 0 (0.0%) | 0 (0.0%) |
| Total (Category) | 12 (27.9%) | 31 (72.1%) |
| Total (Overall) | 69 (56.6%) | 53 (43.4%) |
Services Occupations
The most common Services occupations in Bennington are Food Preparation & Serving (9 | 7.4%), and Healthcare Support (8 | 6.6%).
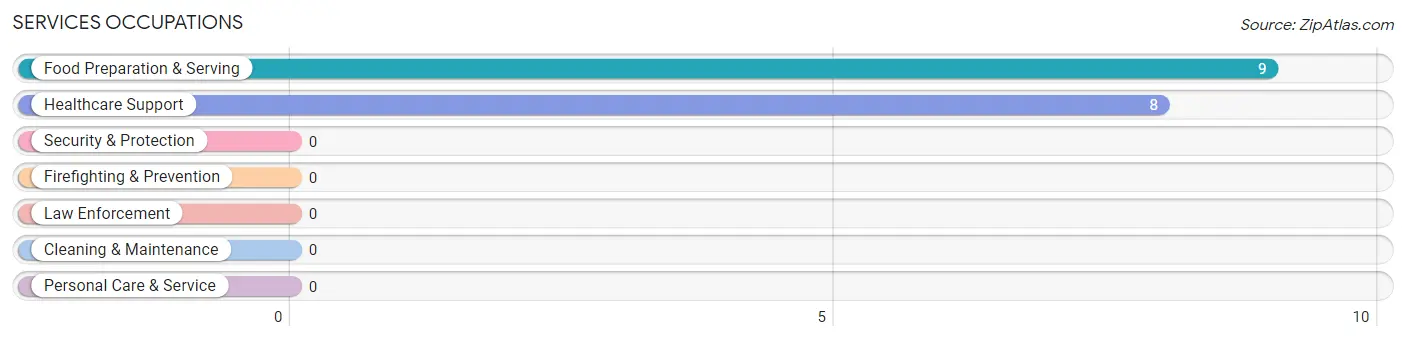
Services Occupations by Sex
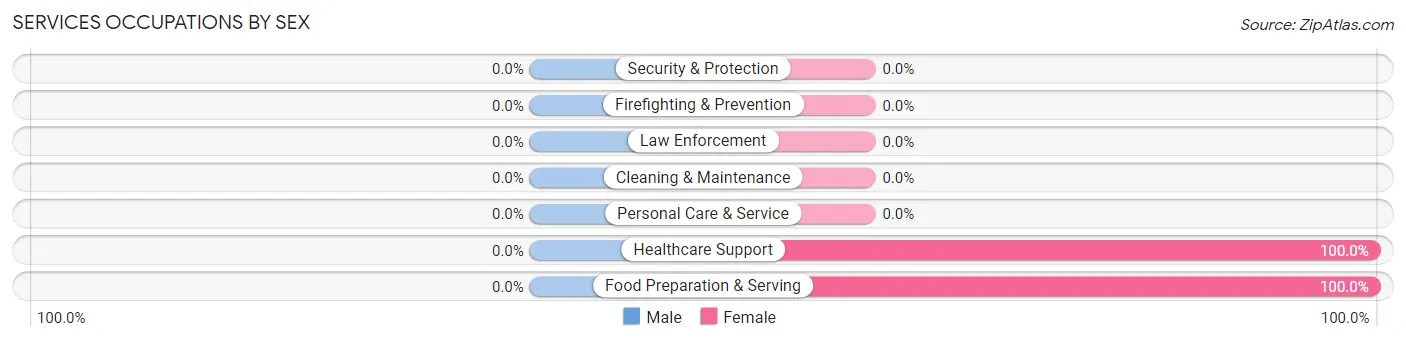
| Occupation | Male | Female |
| Healthcare Support | 0 (0.0%) | 8 (100.0%) |
| Security & Protection | 0 (0.0%) | 0 (0.0%) |
| Firefighting & Prevention | 0 (0.0%) | 0 (0.0%) |
| Law Enforcement | 0 (0.0%) | 0 (0.0%) |
| Food Preparation & Serving | 0 (0.0%) | 9 (100.0%) |
| Cleaning & Maintenance | 0 (0.0%) | 0 (0.0%) |
| Personal Care & Service | 0 (0.0%) | 0 (0.0%) |
| Total (Category) | 0 (0.0%) | 17 (100.0%) |
| Total (Overall) | 69 (56.6%) | 53 (43.4%) |
Sales and Office Occupations
The most common Sales and Office occupations in Bennington are , and Office & Administration (6 | 4.9%).
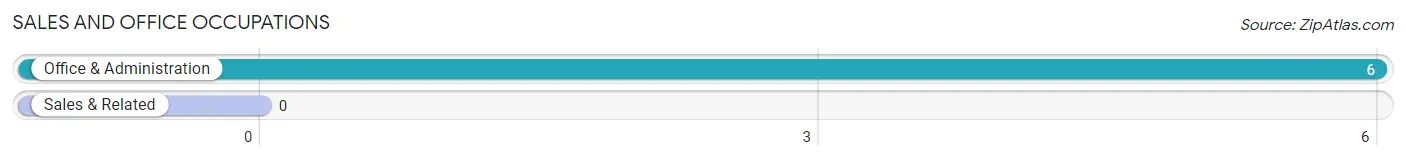
Sales and Office Occupations by Sex
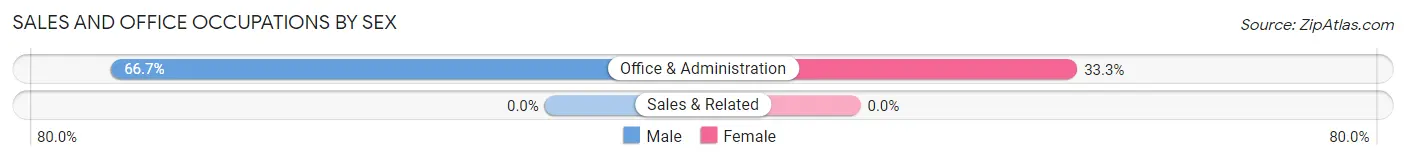
| Occupation | Male | Female |
| Sales & Related | 0 (0.0%) | 0 (0.0%) |
| Office & Administration | 4 (66.7%) | 2 (33.3%) |
| Total (Category) | 4 (66.7%) | 2 (33.3%) |
| Total (Overall) | 69 (56.6%) | 53 (43.4%) |
Natural Resources, Construction and Maintenance Occupations
The most common Natural Resources, Construction and Maintenance occupations in Bennington are , and Construction & Extraction (21 | 17.2%).
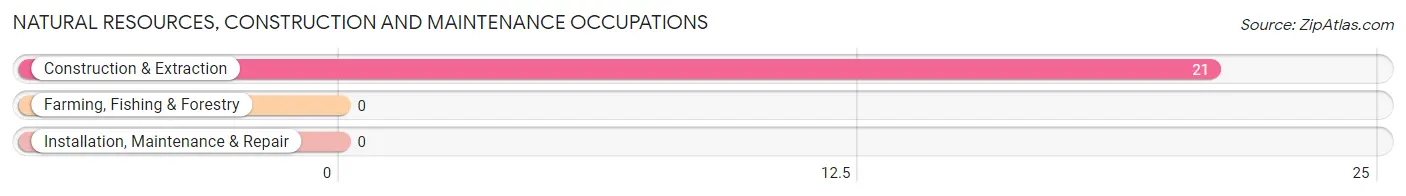
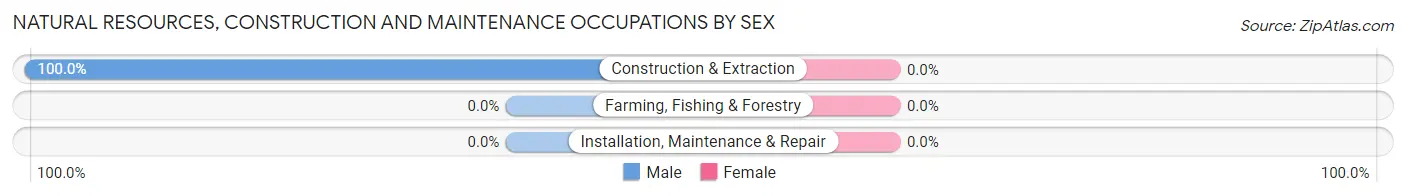
Natural Resources, Construction and Maintenance Occupations by Sex
| Occupation | Male | Female |
| Farming, Fishing & Forestry | 0 (0.0%) | 0 (0.0%) |
| Construction & Extraction | 21 (100.0%) | 0 (0.0%) |
| Installation, Maintenance & Repair | 0 (0.0%) | 0 (0.0%) |
| Total (Category) | 21 (100.0%) | 0 (0.0%) |
| Total (Overall) | 69 (56.6%) | 53 (43.4%) |
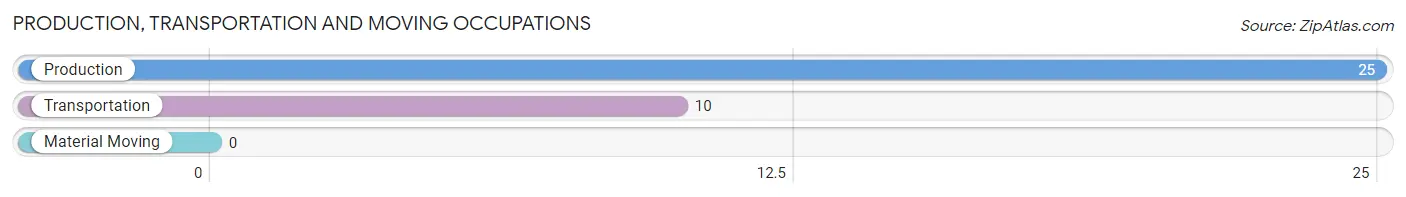
Production, Transportation and Moving Occupations
The most common Production, Transportation and Moving occupations in Bennington are Production (25 | 20.5%), and Transportation (10 | 8.2%).
Production, Transportation and Moving Occupations by Sex
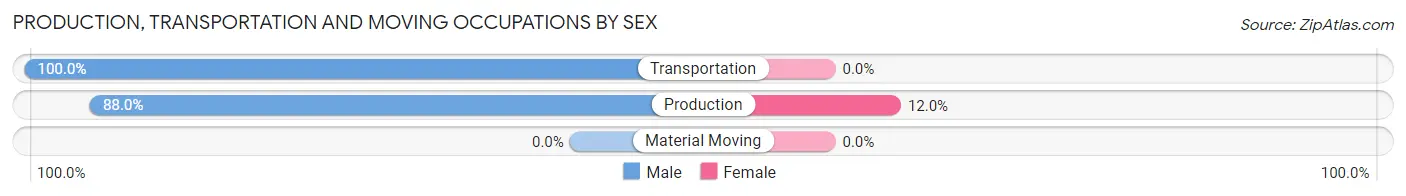
| Occupation | Male | Female |
| Production | 22 (88.0%) | 3 (12.0%) |
| Transportation | 10 (100.0%) | 0 (0.0%) |
| Material Moving | 0 (0.0%) | 0 (0.0%) |
| Total (Category) | 32 (91.4%) | 3 (8.6%) |
| Total (Overall) | 69 (56.6%) | 53 (43.4%) |
Employment Industries by Sex in Bennington
Employment Industries in Bennington
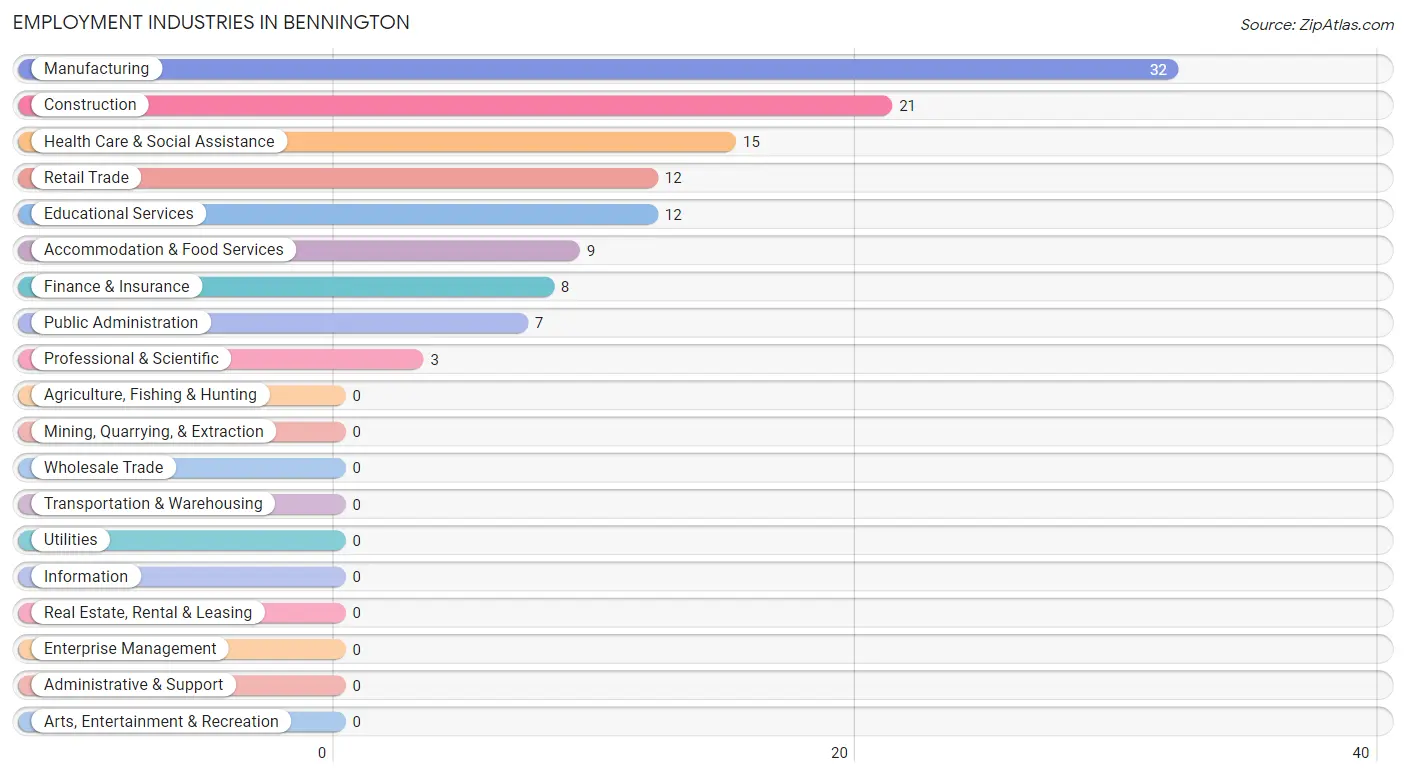
The major employment industries in Bennington include Manufacturing (32 | 26.2%), Construction (21 | 17.2%), Health Care & Social Assistance (15 | 12.3%), Retail Trade (12 | 9.8%), and Educational Services (12 | 9.8%).
Employment Industries by Sex in Bennington
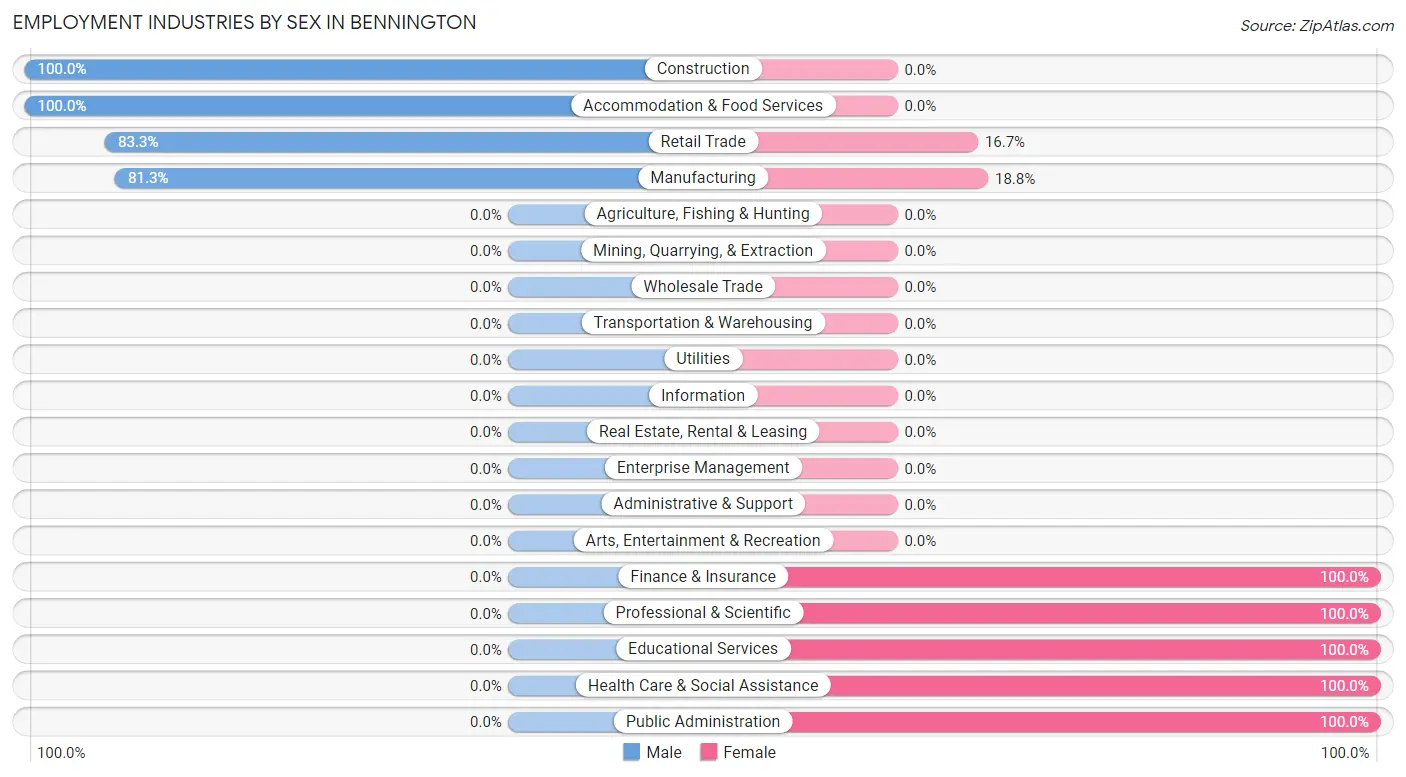
The Bennington industries that see more men than women are Construction (100.0%), Accommodation & Food Services (100.0%), and Retail Trade (83.3%), whereas the industries that tend to have a higher number of women are Finance & Insurance (100.0%), Professional & Scientific (100.0%), and Educational Services (100.0%).
| Industry | Male | Female |
| Agriculture, Fishing & Hunting | 0 (0.0%) | 0 (0.0%) |
| Mining, Quarrying, & Extraction | 0 (0.0%) | 0 (0.0%) |
| Construction | 21 (100.0%) | 0 (0.0%) |
| Manufacturing | 26 (81.2%) | 6 (18.8%) |
| Wholesale Trade | 0 (0.0%) | 0 (0.0%) |
| Retail Trade | 10 (83.3%) | 2 (16.7%) |
| Transportation & Warehousing | 0 (0.0%) | 0 (0.0%) |
| Utilities | 0 (0.0%) | 0 (0.0%) |
| Information | 0 (0.0%) | 0 (0.0%) |
| Finance & Insurance | 0 (0.0%) | 8 (100.0%) |
| Real Estate, Rental & Leasing | 0 (0.0%) | 0 (0.0%) |
| Professional & Scientific | 0 (0.0%) | 3 (100.0%) |
| Enterprise Management | 0 (0.0%) | 0 (0.0%) |
| Administrative & Support | 0 (0.0%) | 0 (0.0%) |
| Educational Services | 0 (0.0%) | 12 (100.0%) |
| Health Care & Social Assistance | 0 (0.0%) | 15 (100.0%) |
| Arts, Entertainment & Recreation | 0 (0.0%) | 0 (0.0%) |
| Accommodation & Food Services | 9 (100.0%) | 0 (0.0%) |
| Public Administration | 0 (0.0%) | 7 (100.0%) |
| Total | 69 (56.6%) | 53 (43.4%) |
Education in Bennington
School Enrollment in Bennington
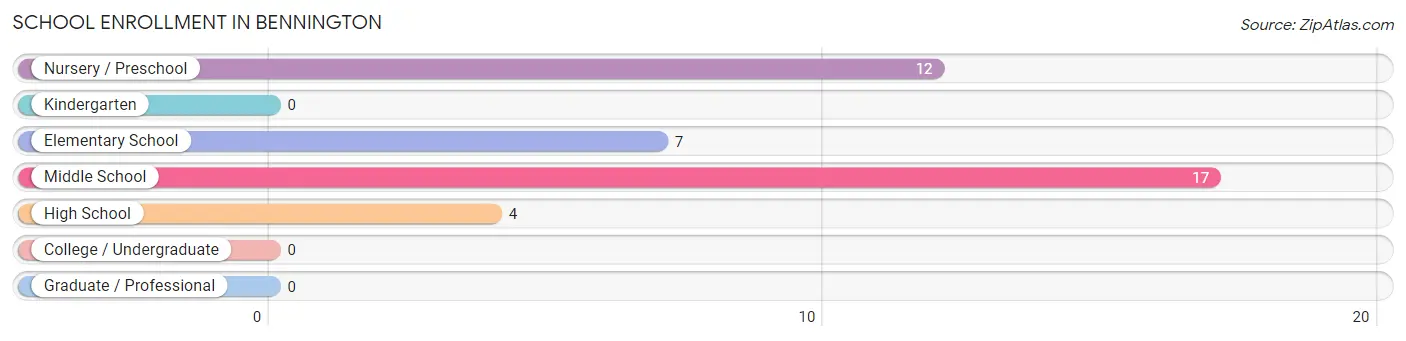
The most common levels of schooling among the 40 students in Bennington are middle school (17 | 42.5%), nursery / preschool (12 | 30.0%), and elementary school (7 | 17.5%).
| School Level | # Students | % Students |
| Nursery / Preschool | 12 | 30.0% |
| Kindergarten | 0 | 0.0% |
| Elementary School | 7 | 17.5% |
| Middle School | 17 | 42.5% |
| High School | 4 | 10.0% |
| College / Undergraduate | 0 | 0.0% |
| Graduate / Professional | 0 | 0.0% |
| Total | 40 | 100.0% |
School Enrollment by Age by Funding Source in Bennington
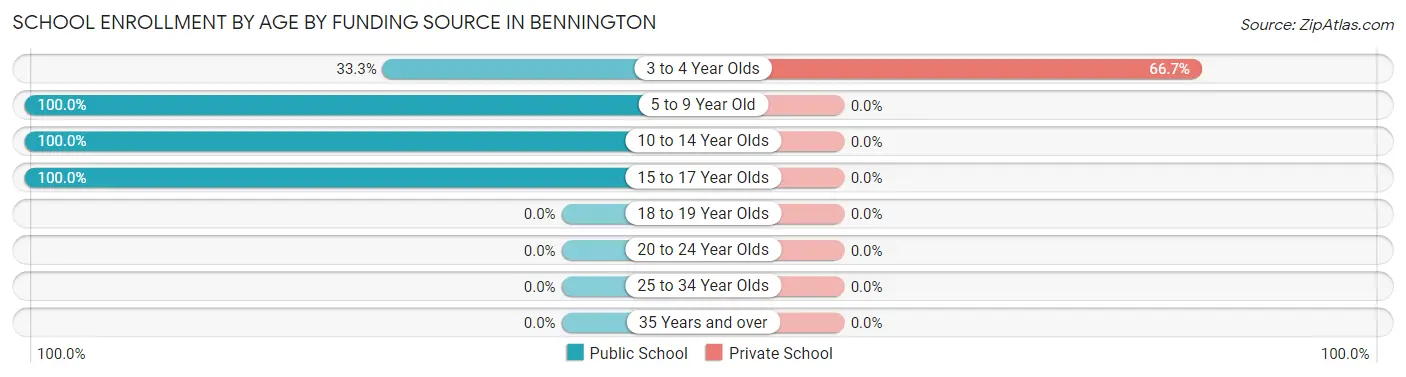
Out of a total of 40 students who are enrolled in schools in Bennington, 8 (20.0%) attend a private institution, while the remaining 32 (80.0%) are enrolled in public schools. The age group of 3 to 4 year olds has the highest likelihood of being enrolled in private schools, with 8 (66.7% in the age bracket) enrolled. Conversely, the age group of 5 to 9 year old has the lowest likelihood of being enrolled in a private school, with 7 (100.0% in the age bracket) attending a public institution.
| Age Bracket | Public School | Private School |
| 3 to 4 Year Olds | 4 (33.3%) | 8 (66.7%) |
| 5 to 9 Year Old | 7 (100.0%) | 0 (0.0%) |
| 10 to 14 Year Olds | 17 (100.0%) | 0 (0.0%) |
| 15 to 17 Year Olds | 4 (100.0%) | 0 (0.0%) |
| 18 to 19 Year Olds | 0 (0.0%) | 0 (0.0%) |
| 20 to 24 Year Olds | 0 (0.0%) | 0 (0.0%) |
| 25 to 34 Year Olds | 0 (0.0%) | 0 (0.0%) |
| 35 Years and over | 0 (0.0%) | 0 (0.0%) |
| Total | 32 (80.0%) | 8 (20.0%) |
Educational Attainment by Field of Study in Bennington
Business (15 | 27.3%), social sciences (9 | 16.4%), engineering (9 | 16.4%), computers & mathematics (7 | 12.7%), and education (6 | 10.9%) are the most common fields of study among 55 individuals in Bennington who have obtained a bachelor's degree or higher.
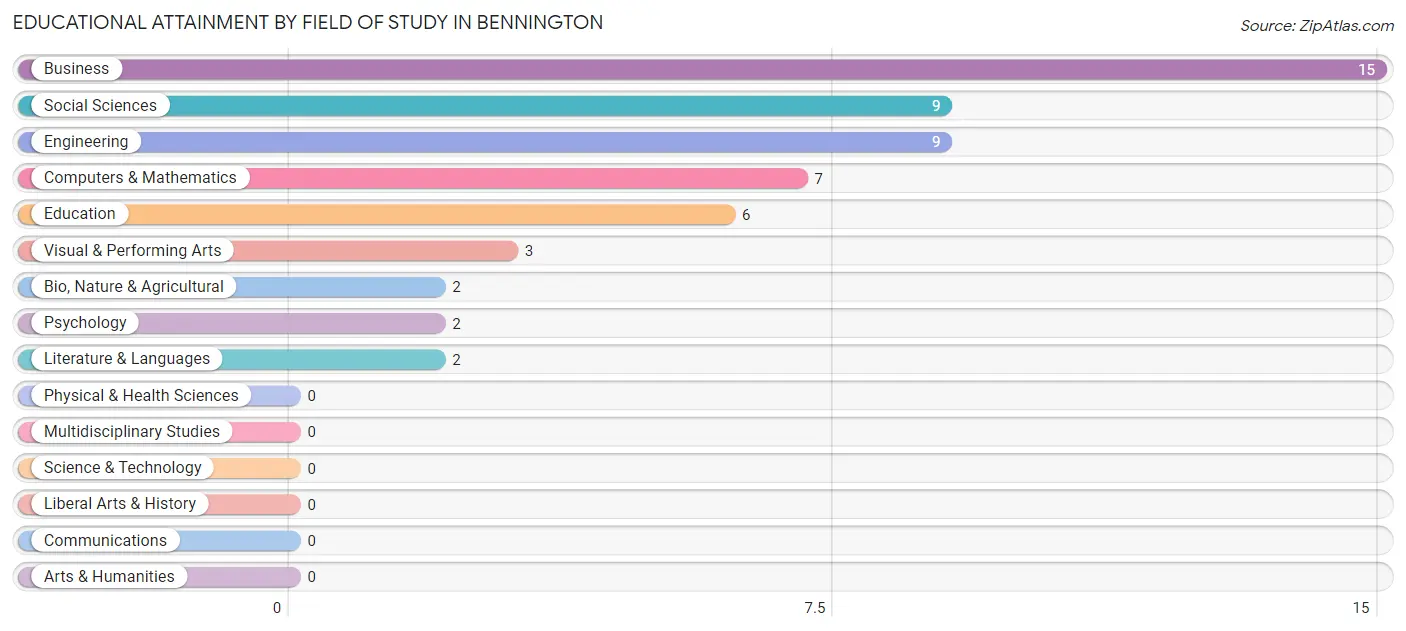
| Field of Study | # Graduates | % Graduates |
| Computers & Mathematics | 7 | 12.7% |
| Bio, Nature & Agricultural | 2 | 3.6% |
| Physical & Health Sciences | 0 | 0.0% |
| Psychology | 2 | 3.6% |
| Social Sciences | 9 | 16.4% |
| Engineering | 9 | 16.4% |
| Multidisciplinary Studies | 0 | 0.0% |
| Science & Technology | 0 | 0.0% |
| Business | 15 | 27.3% |
| Education | 6 | 10.9% |
| Literature & Languages | 2 | 3.6% |
| Liberal Arts & History | 0 | 0.0% |
| Visual & Performing Arts | 3 | 5.4% |
| Communications | 0 | 0.0% |
| Arts & Humanities | 0 | 0.0% |
| Total | 55 | 100.0% |
Transportation & Commute in Bennington
Vehicle Availability by Sex in Bennington
The most prevalent vehicle ownership categories in Bennington are males with 2 vehicles (33, accounting for 50.8%) and females with 2 vehicles (24, making up 66.0%).
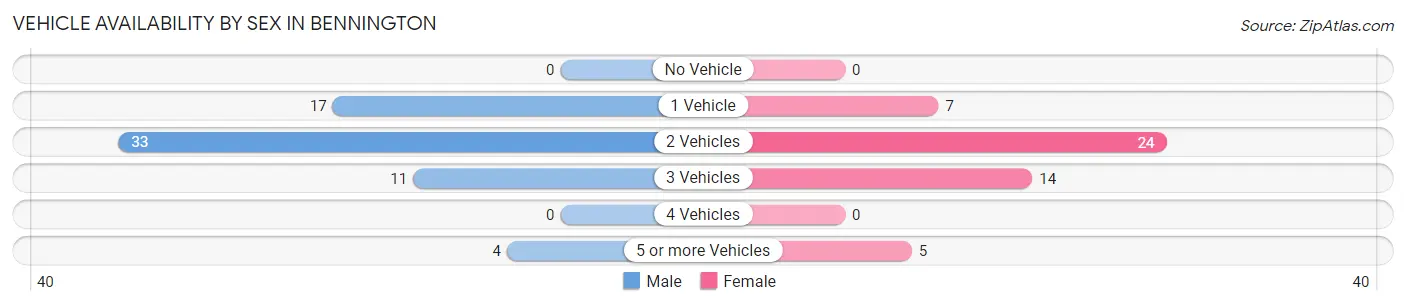
| Vehicles Available | Male | Female |
| No Vehicle | 0 (0.0%) | 0 (0.0%) |
| 1 Vehicle | 17 (26.2%) | 7 (14.0%) |
| 2 Vehicles | 33 (50.8%) | 24 (48.0%) |
| 3 Vehicles | 11 (16.9%) | 14 (28.0%) |
| 4 Vehicles | 0 (0.0%) | 0 (0.0%) |
| 5 or more Vehicles | 4 (6.1%) | 5 (10.0%) |
| Total | 65 (100.0%) | 50 (100.0%) |
Commute Time in Bennington
The most frequently occuring commute durations in Bennington are 15 to 19 minutes (22 commuters, 22.7%), 45 to 59 minutes (17 commuters, 17.5%), and 90 or more minutes (17 commuters, 17.5%).
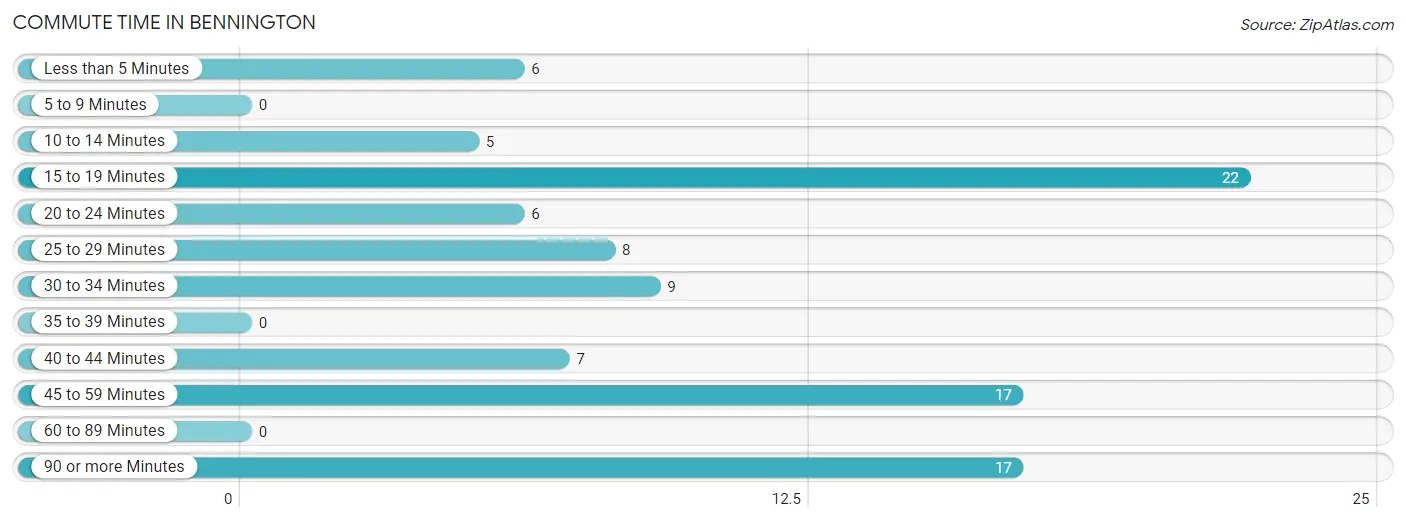
| Commute Time | # Commuters | % Commuters |
| Less than 5 Minutes | 6 | 6.2% |
| 5 to 9 Minutes | 0 | 0.0% |
| 10 to 14 Minutes | 5 | 5.1% |
| 15 to 19 Minutes | 22 | 22.7% |
| 20 to 24 Minutes | 6 | 6.2% |
| 25 to 29 Minutes | 8 | 8.3% |
| 30 to 34 Minutes | 9 | 9.3% |
| 35 to 39 Minutes | 0 | 0.0% |
| 40 to 44 Minutes | 7 | 7.2% |
| 45 to 59 Minutes | 17 | 17.5% |
| 60 to 89 Minutes | 0 | 0.0% |
| 90 or more Minutes | 17 | 17.5% |
Commute Time by Sex in Bennington
The most common commute times in Bennington are 15 to 19 minutes (19 commuters, 29.2%) for males and 30 to 34 minutes (9 commuters, 28.1%) for females.
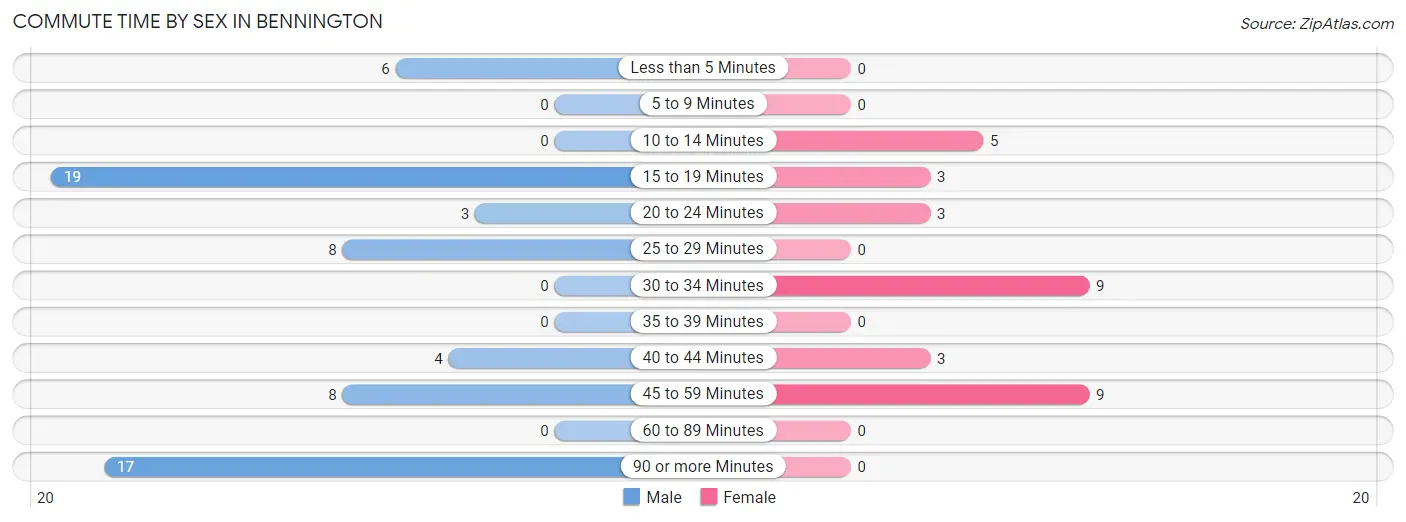
| Commute Time | Male | Female |
| Less than 5 Minutes | 6 (9.2%) | 0 (0.0%) |
| 5 to 9 Minutes | 0 (0.0%) | 0 (0.0%) |
| 10 to 14 Minutes | 0 (0.0%) | 5 (15.6%) |
| 15 to 19 Minutes | 19 (29.2%) | 3 (9.4%) |
| 20 to 24 Minutes | 3 (4.6%) | 3 (9.4%) |
| 25 to 29 Minutes | 8 (12.3%) | 0 (0.0%) |
| 30 to 34 Minutes | 0 (0.0%) | 9 (28.1%) |
| 35 to 39 Minutes | 0 (0.0%) | 0 (0.0%) |
| 40 to 44 Minutes | 4 (6.1%) | 3 (9.4%) |
| 45 to 59 Minutes | 8 (12.3%) | 9 (28.1%) |
| 60 to 89 Minutes | 0 (0.0%) | 0 (0.0%) |
| 90 or more Minutes | 17 (26.2%) | 0 (0.0%) |
Time of Departure to Work by Sex in Bennington
The most frequent times of departure to work in Bennington are 5:00 AM to 5:29 AM (14, 21.5%) for males and 9:00 AM to 9:59 AM (9, 28.1%) for females.
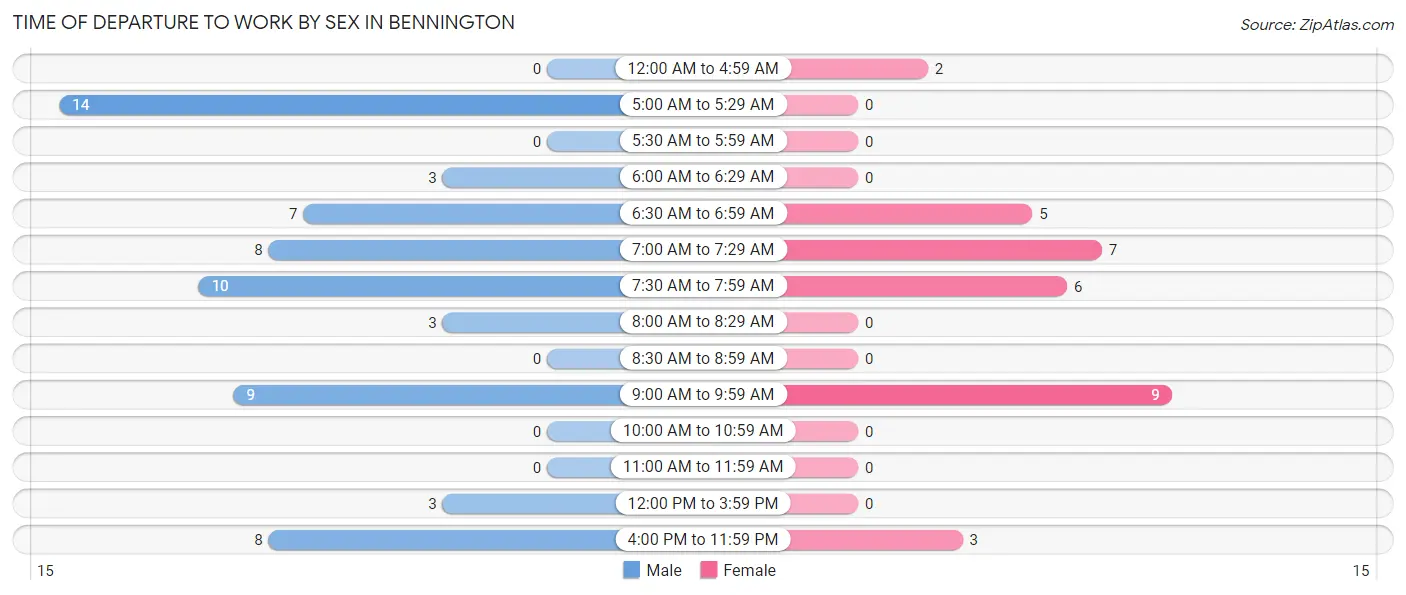
| Time of Departure | Male | Female |
| 12:00 AM to 4:59 AM | 0 (0.0%) | 2 (6.2%) |
| 5:00 AM to 5:29 AM | 14 (21.5%) | 0 (0.0%) |
| 5:30 AM to 5:59 AM | 0 (0.0%) | 0 (0.0%) |
| 6:00 AM to 6:29 AM | 3 (4.6%) | 0 (0.0%) |
| 6:30 AM to 6:59 AM | 7 (10.8%) | 5 (15.6%) |
| 7:00 AM to 7:29 AM | 8 (12.3%) | 7 (21.9%) |
| 7:30 AM to 7:59 AM | 10 (15.4%) | 6 (18.8%) |
| 8:00 AM to 8:29 AM | 3 (4.6%) | 0 (0.0%) |
| 8:30 AM to 8:59 AM | 0 (0.0%) | 0 (0.0%) |
| 9:00 AM to 9:59 AM | 9 (13.9%) | 9 (28.1%) |
| 10:00 AM to 10:59 AM | 0 (0.0%) | 0 (0.0%) |
| 11:00 AM to 11:59 AM | 0 (0.0%) | 0 (0.0%) |
| 12:00 PM to 3:59 PM | 3 (4.6%) | 0 (0.0%) |
| 4:00 PM to 11:59 PM | 8 (12.3%) | 3 (9.4%) |
| Total | 65 (100.0%) | 32 (100.0%) |
Housing Occupancy in Bennington
Occupancy by Ownership in Bennington
Of the total 121 dwellings in Bennington, owner-occupied units account for 81 (66.9%), while renter-occupied units make up 40 (33.1%).
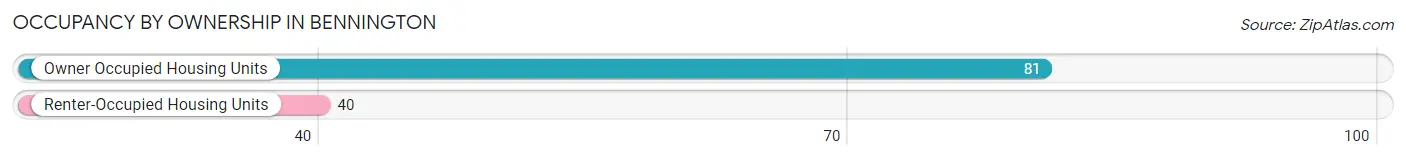
| Occupancy | # Housing Units | % Housing Units |
| Owner Occupied Housing Units | 81 | 66.9% |
| Renter-Occupied Housing Units | 40 | 33.1% |
| Total Occupied Housing Units | 121 | 100.0% |
Occupancy by Household Size in Bennington
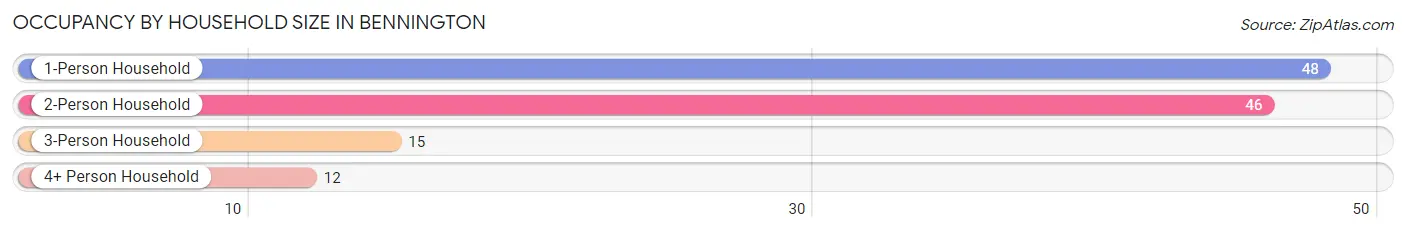
| Household Size | # Housing Units | % Housing Units |
| 1-Person Household | 48 | 39.7% |
| 2-Person Household | 46 | 38.0% |
| 3-Person Household | 15 | 12.4% |
| 4+ Person Household | 12 | 9.9% |
| Total Housing Units | 121 | 100.0% |
Occupancy by Ownership by Household Size in Bennington
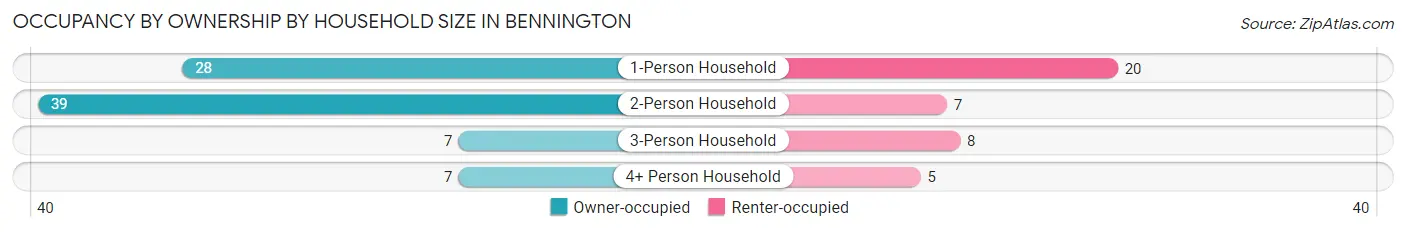
| Household Size | Owner-occupied | Renter-occupied |
| 1-Person Household | 28 (58.3%) | 20 (41.7%) |
| 2-Person Household | 39 (84.8%) | 7 (15.2%) |
| 3-Person Household | 7 (46.7%) | 8 (53.3%) |
| 4+ Person Household | 7 (58.3%) | 5 (41.7%) |
| Total Housing Units | 81 (66.9%) | 40 (33.1%) |
Occupancy by Educational Attainment in Bennington
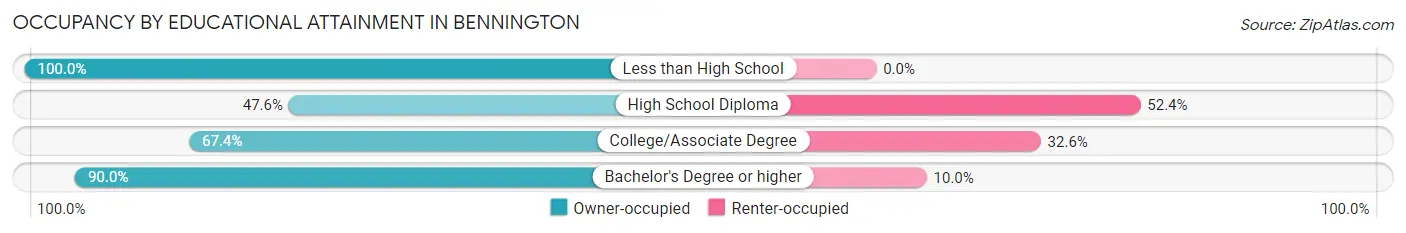
| Household Size | Owner-occupied | Renter-occupied |
| Less than High School | 3 (100.0%) | 0 (0.0%) |
| High School Diploma | 20 (47.6%) | 22 (52.4%) |
| College/Associate Degree | 31 (67.4%) | 15 (32.6%) |
| Bachelor's Degree or higher | 27 (90.0%) | 3 (10.0%) |
Occupancy by Age of Householder in Bennington
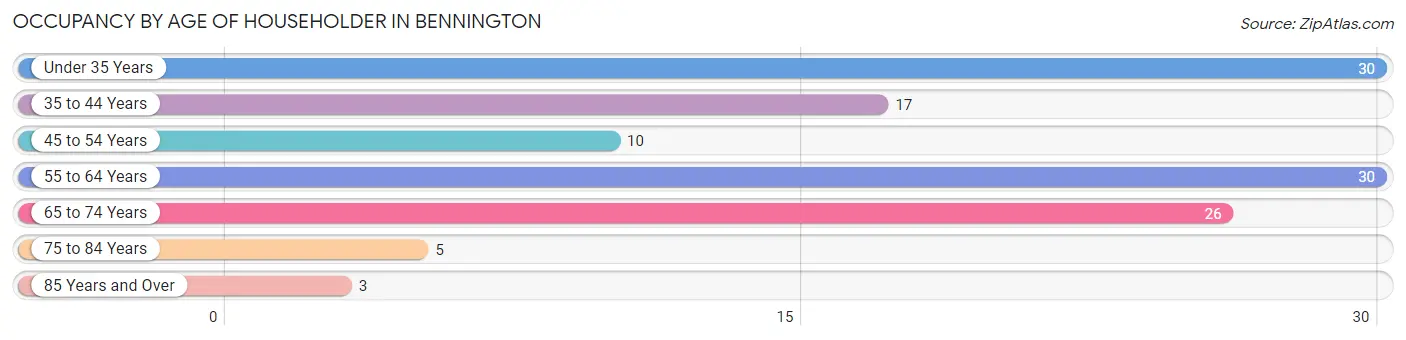
| Age Bracket | # Households | % Households |
| Under 35 Years | 30 | 24.8% |
| 35 to 44 Years | 17 | 14.1% |
| 45 to 54 Years | 10 | 8.3% |
| 55 to 64 Years | 30 | 24.8% |
| 65 to 74 Years | 26 | 21.5% |
| 75 to 84 Years | 5 | 4.1% |
| 85 Years and Over | 3 | 2.5% |
| Total | 121 | 100.0% |
Housing Finances in Bennington
Median Income by Occupancy in Bennington
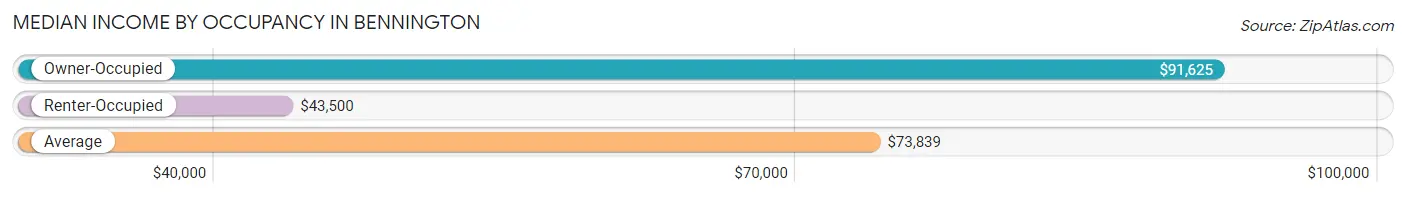
| Occupancy Type | # Households | Median Income |
| Owner-Occupied | 81 (66.9%) | $91,625 |
| Renter-Occupied | 40 (33.1%) | $43,500 |
| Average | 121 (100.0%) | $73,839 |
Occupancy by Householder Income Bracket in Bennington
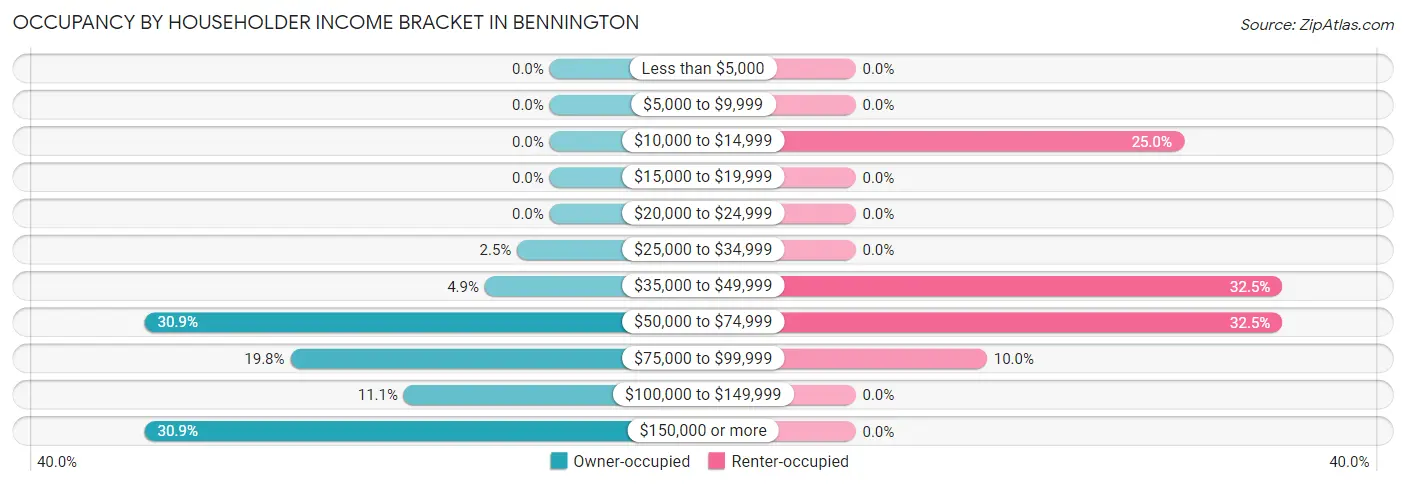
| Income Bracket | Owner-occupied | Renter-occupied |
| Less than $5,000 | 0 (0.0%) | 0 (0.0%) |
| $5,000 to $9,999 | 0 (0.0%) | 0 (0.0%) |
| $10,000 to $14,999 | 0 (0.0%) | 10 (25.0%) |
| $15,000 to $19,999 | 0 (0.0%) | 0 (0.0%) |
| $20,000 to $24,999 | 0 (0.0%) | 0 (0.0%) |
| $25,000 to $34,999 | 2 (2.5%) | 0 (0.0%) |
| $35,000 to $49,999 | 4 (4.9%) | 13 (32.5%) |
| $50,000 to $74,999 | 25 (30.9%) | 13 (32.5%) |
| $75,000 to $99,999 | 16 (19.8%) | 4 (10.0%) |
| $100,000 to $149,999 | 9 (11.1%) | 0 (0.0%) |
| $150,000 or more | 25 (30.9%) | 0 (0.0%) |
| Total | 81 (100.0%) | 40 (100.0%) |
Monthly Housing Cost Tiers in Bennington
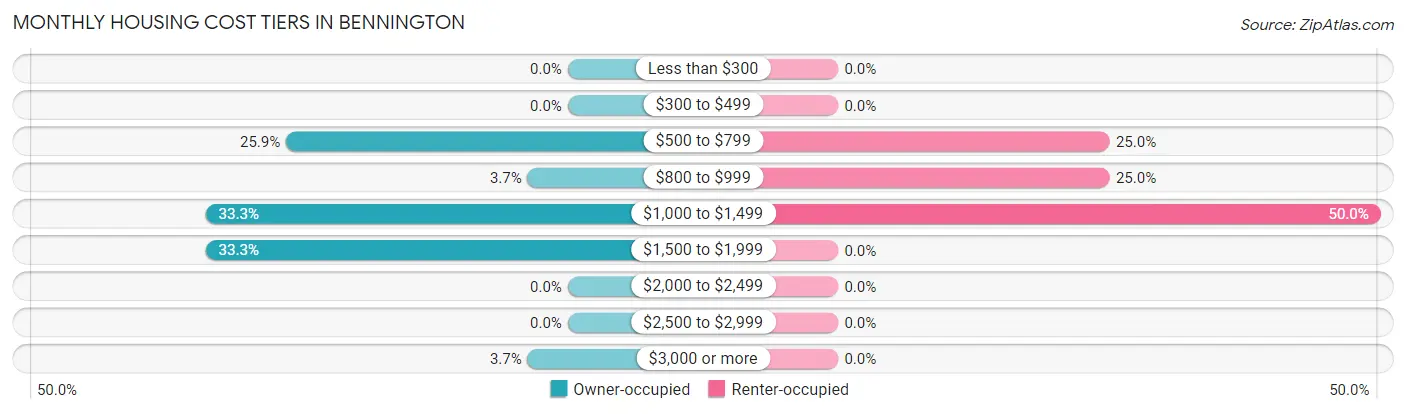
| Monthly Cost | Owner-occupied | Renter-occupied |
| Less than $300 | 0 (0.0%) | 0 (0.0%) |
| $300 to $499 | 0 (0.0%) | 0 (0.0%) |
| $500 to $799 | 21 (25.9%) | 10 (25.0%) |
| $800 to $999 | 3 (3.7%) | 10 (25.0%) |
| $1,000 to $1,499 | 27 (33.3%) | 20 (50.0%) |
| $1,500 to $1,999 | 27 (33.3%) | 0 (0.0%) |
| $2,000 to $2,499 | 0 (0.0%) | 0 (0.0%) |
| $2,500 to $2,999 | 0 (0.0%) | 0 (0.0%) |
| $3,000 or more | 3 (3.7%) | 0 (0.0%) |
| Total | 81 (100.0%) | 40 (100.0%) |
Physical Housing Characteristics in Bennington
Housing Structures in Bennington
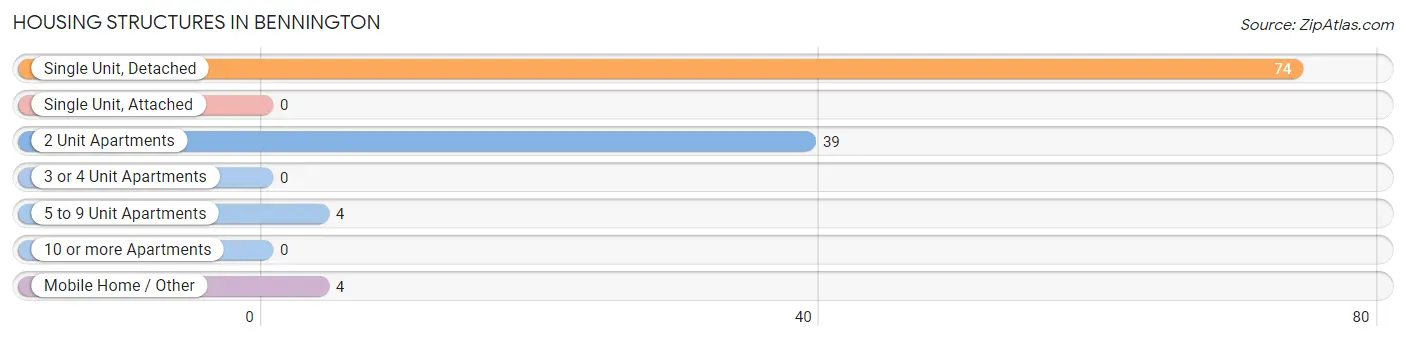
| Structure Type | # Housing Units | % Housing Units |
| Single Unit, Detached | 74 | 61.2% |
| Single Unit, Attached | 0 | 0.0% |
| 2 Unit Apartments | 39 | 32.2% |
| 3 or 4 Unit Apartments | 0 | 0.0% |
| 5 to 9 Unit Apartments | 4 | 3.3% |
| 10 or more Apartments | 0 | 0.0% |
| Mobile Home / Other | 4 | 3.3% |
| Total | 121 | 100.0% |
Housing Structures by Occupancy in Bennington
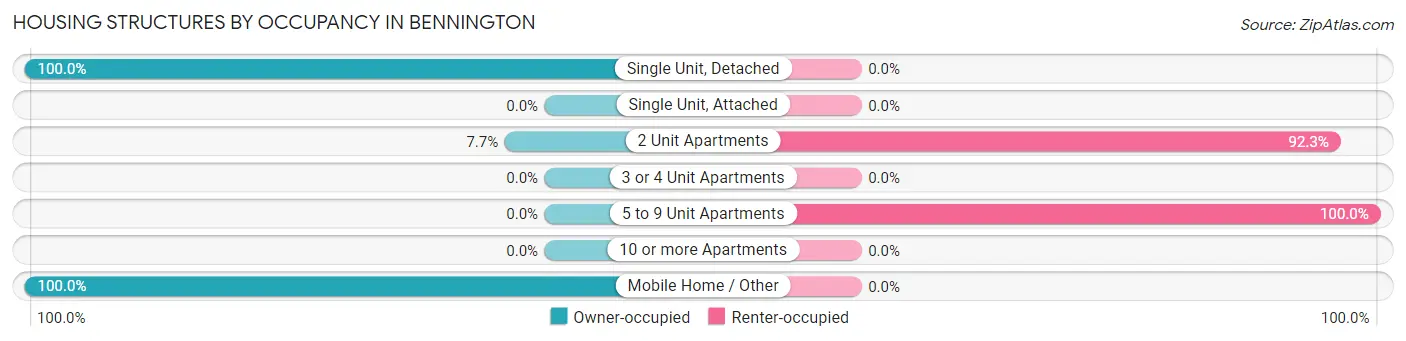
| Structure Type | Owner-occupied | Renter-occupied |
| Single Unit, Detached | 74 (100.0%) | 0 (0.0%) |
| Single Unit, Attached | 0 (0.0%) | 0 (0.0%) |
| 2 Unit Apartments | 3 (7.7%) | 36 (92.3%) |
| 3 or 4 Unit Apartments | 0 (0.0%) | 0 (0.0%) |
| 5 to 9 Unit Apartments | 0 (0.0%) | 4 (100.0%) |
| 10 or more Apartments | 0 (0.0%) | 0 (0.0%) |
| Mobile Home / Other | 4 (100.0%) | 0 (0.0%) |
| Total | 81 (66.9%) | 40 (33.1%) |
Housing Structures by Number of Rooms in Bennington
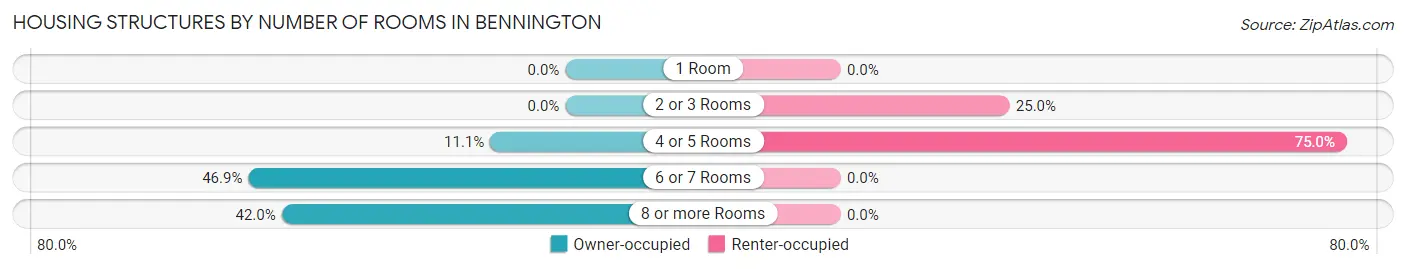
| Number of Rooms | Owner-occupied | Renter-occupied |
| 1 Room | 0 (0.0%) | 0 (0.0%) |
| 2 or 3 Rooms | 0 (0.0%) | 10 (25.0%) |
| 4 or 5 Rooms | 9 (11.1%) | 30 (75.0%) |
| 6 or 7 Rooms | 38 (46.9%) | 0 (0.0%) |
| 8 or more Rooms | 34 (42.0%) | 0 (0.0%) |
| Total | 81 (100.0%) | 40 (100.0%) |
Housing Structure by Heating Type in Bennington
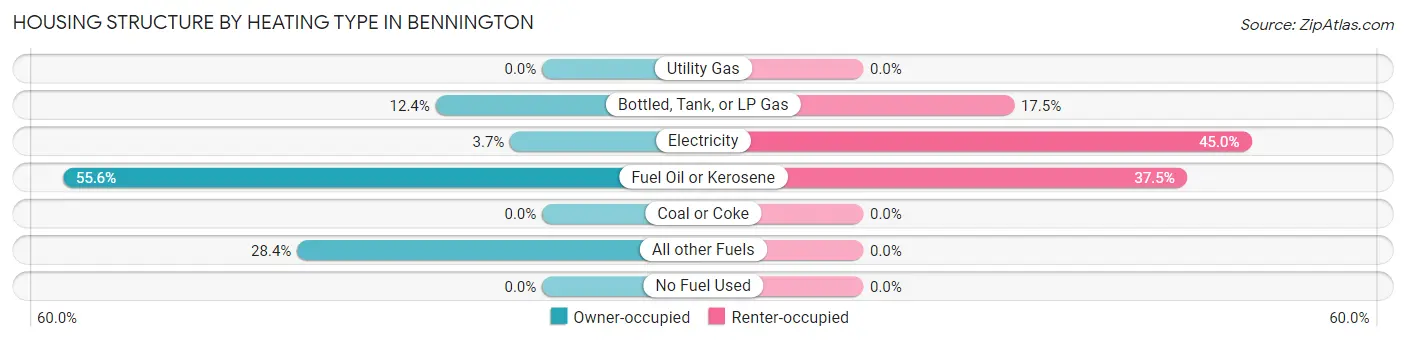
| Heating Type | Owner-occupied | Renter-occupied |
| Utility Gas | 0 (0.0%) | 0 (0.0%) |
| Bottled, Tank, or LP Gas | 10 (12.3%) | 7 (17.5%) |
| Electricity | 3 (3.7%) | 18 (45.0%) |
| Fuel Oil or Kerosene | 45 (55.6%) | 15 (37.5%) |
| Coal or Coke | 0 (0.0%) | 0 (0.0%) |
| All other Fuels | 23 (28.4%) | 0 (0.0%) |
| No Fuel Used | 0 (0.0%) | 0 (0.0%) |
| Total | 81 (100.0%) | 40 (100.0%) |
Household Vehicle Usage in Bennington
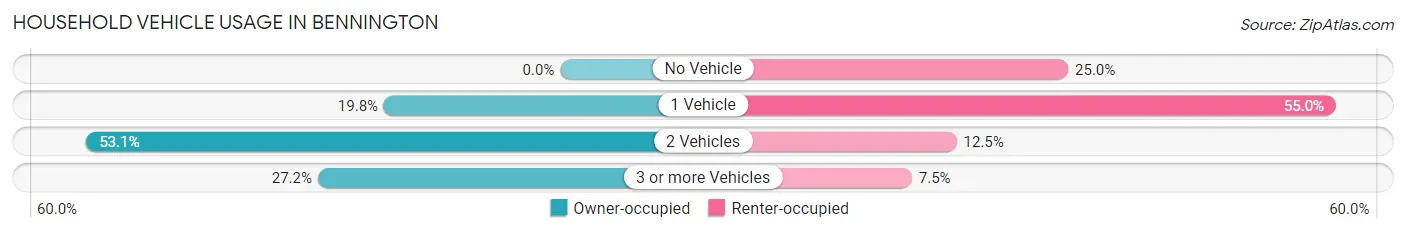
| Vehicles per Household | Owner-occupied | Renter-occupied |
| No Vehicle | 0 (0.0%) | 10 (25.0%) |
| 1 Vehicle | 16 (19.8%) | 22 (55.0%) |
| 2 Vehicles | 43 (53.1%) | 5 (12.5%) |
| 3 or more Vehicles | 22 (27.2%) | 3 (7.5%) |
| Total | 81 (100.0%) | 40 (100.0%) |
Real Estate & Mortgages in Bennington
Real Estate and Mortgage Overview in Bennington
| Characteristic | Without Mortgage | With Mortgage |
| Housing Units | 36 | 45 |
| Median Property Value | $160,000 | $215,700 |
| Median Household Income | $74,167 | $14 |
| Monthly Housing Costs | $700 | $3 |
| Real Estate Taxes | $4,364 | $0 |
Property Value by Mortgage Status in Bennington
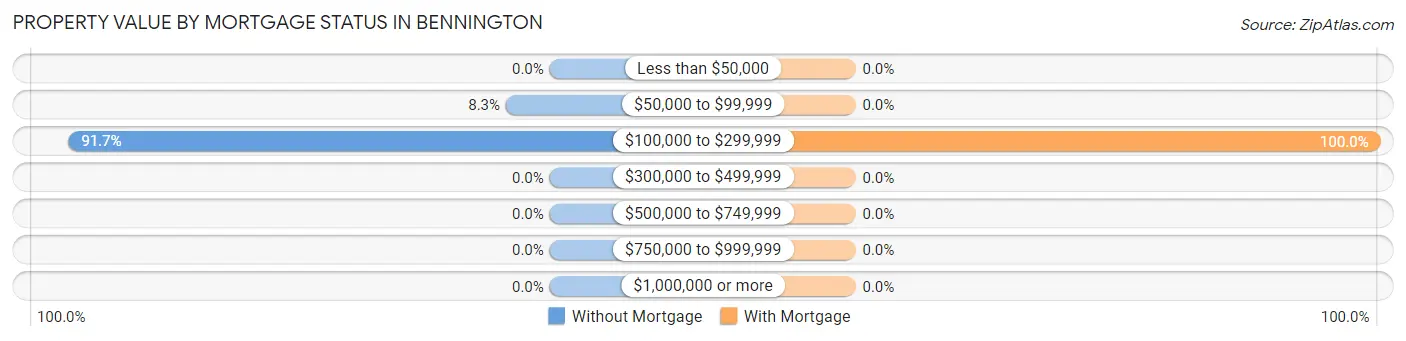
| Property Value | Without Mortgage | With Mortgage |
| Less than $50,000 | 0 (0.0%) | 0 (0.0%) |
| $50,000 to $99,999 | 3 (8.3%) | 0 (0.0%) |
| $100,000 to $299,999 | 33 (91.7%) | 45 (100.0%) |
| $300,000 to $499,999 | 0 (0.0%) | 0 (0.0%) |
| $500,000 to $749,999 | 0 (0.0%) | 0 (0.0%) |
| $750,000 to $999,999 | 0 (0.0%) | 0 (0.0%) |
| $1,000,000 or more | 0 (0.0%) | 0 (0.0%) |
| Total | 36 (100.0%) | 45 (100.0%) |
Household Income by Mortgage Status in Bennington
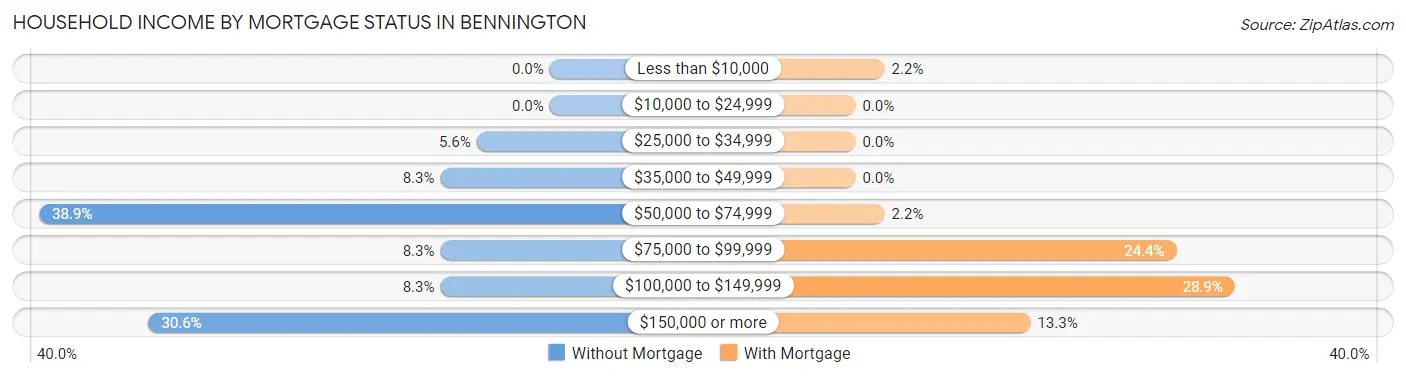
| Household Income | Without Mortgage | With Mortgage |
| Less than $10,000 | 0 (0.0%) | 1 (2.2%) |
| $10,000 to $24,999 | 0 (0.0%) | 0 (0.0%) |
| $25,000 to $34,999 | 2 (5.6%) | 0 (0.0%) |
| $35,000 to $49,999 | 3 (8.3%) | 0 (0.0%) |
| $50,000 to $74,999 | 14 (38.9%) | 1 (2.2%) |
| $75,000 to $99,999 | 3 (8.3%) | 11 (24.4%) |
| $100,000 to $149,999 | 3 (8.3%) | 13 (28.9%) |
| $150,000 or more | 11 (30.6%) | 6 (13.3%) |
| Total | 36 (100.0%) | 45 (100.0%) |
Property Value to Household Income Ratio in Bennington
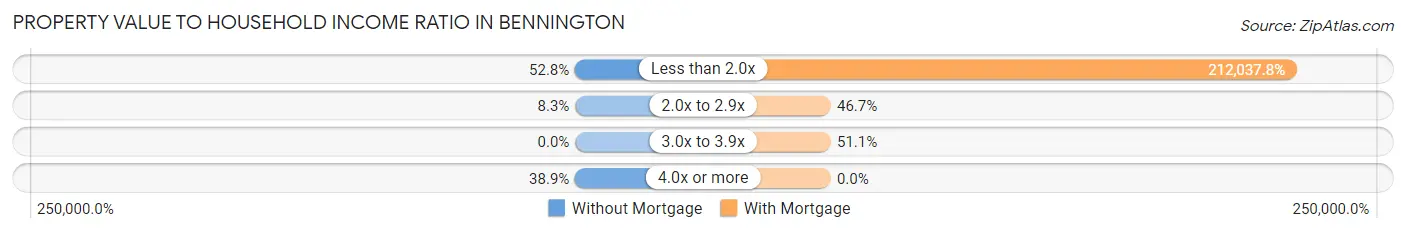
| Value-to-Income Ratio | Without Mortgage | With Mortgage |
| Less than 2.0x | 19 (52.8%) | 95,417 (212,037.8%) |
| 2.0x to 2.9x | 3 (8.3%) | 21 (46.7%) |
| 3.0x to 3.9x | 0 (0.0%) | 23 (51.1%) |
| 4.0x or more | 14 (38.9%) | 0 (0.0%) |
| Total | 36 (100.0%) | 45 (100.0%) |
Real Estate Taxes by Mortgage Status in Bennington
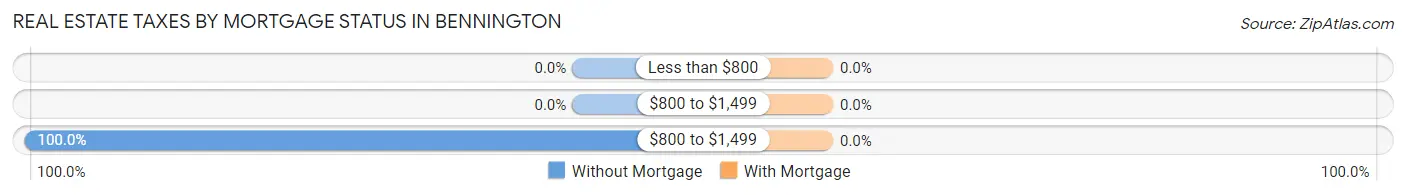
| Property Taxes | Without Mortgage | With Mortgage |
| Less than $800 | 0 (0.0%) | 0 (0.0%) |
| $800 to $1,499 | 0 (0.0%) | 0 (0.0%) |
| $800 to $1,499 | 36 (100.0%) | 0 (0.0%) |
| Total | 36 (100.0%) | 45 (100.0%) |
Health & Disability in Bennington
Health Insurance Coverage by Age in Bennington
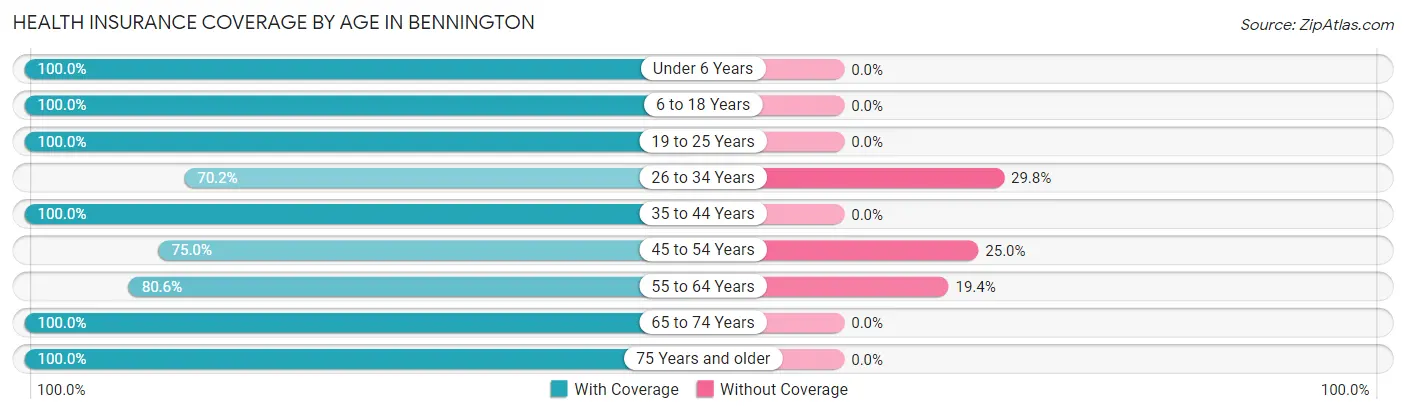
| Age Bracket | With Coverage | Without Coverage |
| Under 6 Years | 29 (100.0%) | 0 (0.0%) |
| 6 to 18 Years | 28 (100.0%) | 0 (0.0%) |
| 19 to 25 Years | 9 (100.0%) | 0 (0.0%) |
| 26 to 34 Years | 33 (70.2%) | 14 (29.8%) |
| 35 to 44 Years | 19 (100.0%) | 0 (0.0%) |
| 45 to 54 Years | 18 (75.0%) | 6 (25.0%) |
| 55 to 64 Years | 29 (80.6%) | 7 (19.4%) |
| 65 to 74 Years | 38 (100.0%) | 0 (0.0%) |
| 75 Years and older | 23 (100.0%) | 0 (0.0%) |
| Total | 226 (89.3%) | 27 (10.7%) |
Health Insurance Coverage by Citizenship Status in Bennington
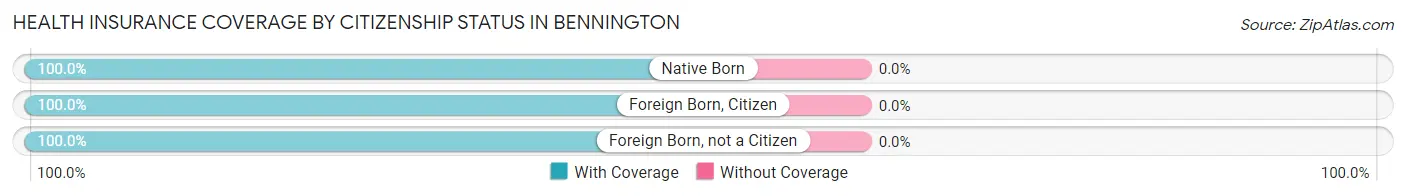
| Citizenship Status | With Coverage | Without Coverage |
| Native Born | 29 (100.0%) | 0 (0.0%) |
| Foreign Born, Citizen | 28 (100.0%) | 0 (0.0%) |
| Foreign Born, not a Citizen | 9 (100.0%) | 0 (0.0%) |
Health Insurance Coverage by Household Income in Bennington
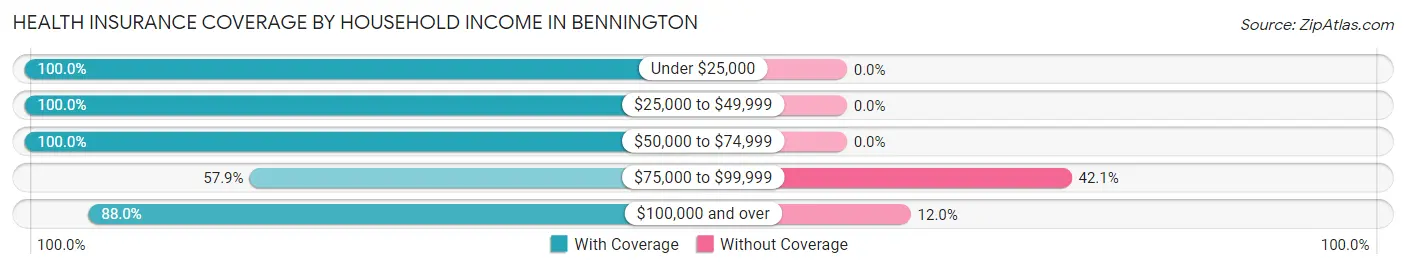
| Household Income | With Coverage | Without Coverage |
| Under $25,000 | 10 (100.0%) | 0 (0.0%) |
| $25,000 to $49,999 | 60 (100.0%) | 0 (0.0%) |
| $50,000 to $74,999 | 53 (100.0%) | 0 (0.0%) |
| $75,000 to $99,999 | 22 (57.9%) | 16 (42.1%) |
| $100,000 and over | 81 (88.0%) | 11 (12.0%) |
Public vs Private Health Insurance Coverage by Age in Bennington
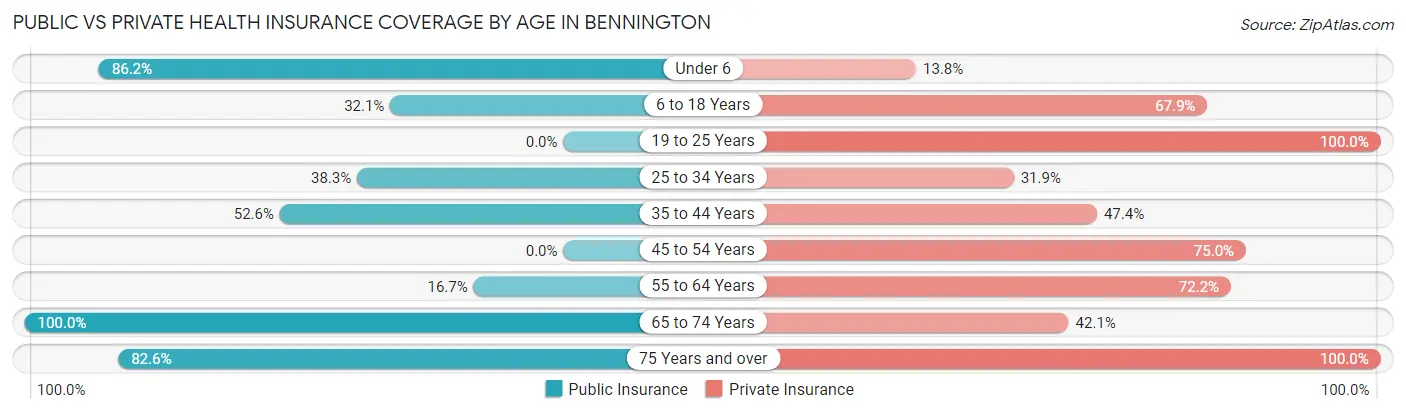
| Age Bracket | Public Insurance | Private Insurance |
| Under 6 | 25 (86.2%) | 4 (13.8%) |
| 6 to 18 Years | 9 (32.1%) | 19 (67.9%) |
| 19 to 25 Years | 0 (0.0%) | 9 (100.0%) |
| 25 to 34 Years | 18 (38.3%) | 15 (31.9%) |
| 35 to 44 Years | 10 (52.6%) | 9 (47.4%) |
| 45 to 54 Years | 0 (0.0%) | 18 (75.0%) |
| 55 to 64 Years | 6 (16.7%) | 26 (72.2%) |
| 65 to 74 Years | 38 (100.0%) | 16 (42.1%) |
| 75 Years and over | 19 (82.6%) | 23 (100.0%) |
| Total | 125 (49.4%) | 139 (54.9%) |
Disability Status by Sex by Age in Bennington
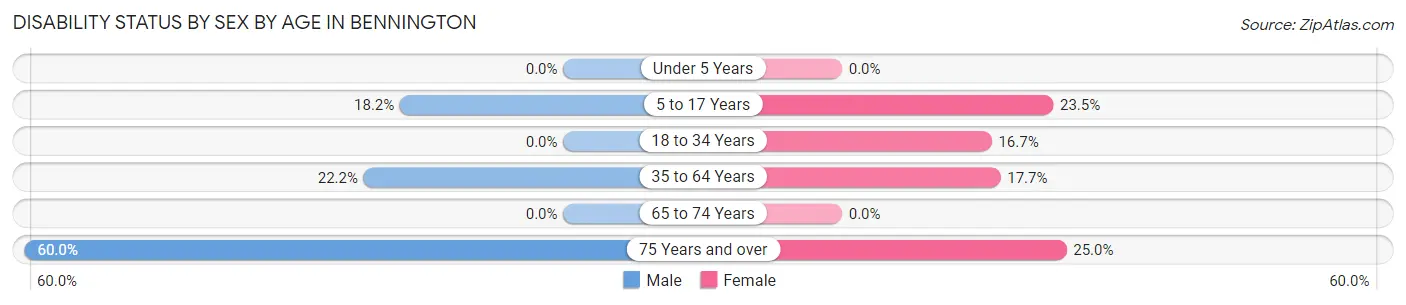
| Age Bracket | Male | Female |
| Under 5 Years | 0 (0.0%) | 0 (0.0%) |
| 5 to 17 Years | 2 (18.2%) | 4 (23.5%) |
| 18 to 34 Years | 0 (0.0%) | 5 (16.7%) |
| 35 to 64 Years | 10 (22.2%) | 6 (17.6%) |
| 65 to 74 Years | 0 (0.0%) | 0 (0.0%) |
| 75 Years and over | 9 (60.0%) | 2 (25.0%) |
Disability Class by Sex by Age in Bennington
Disability Class: Hearing Difficulty
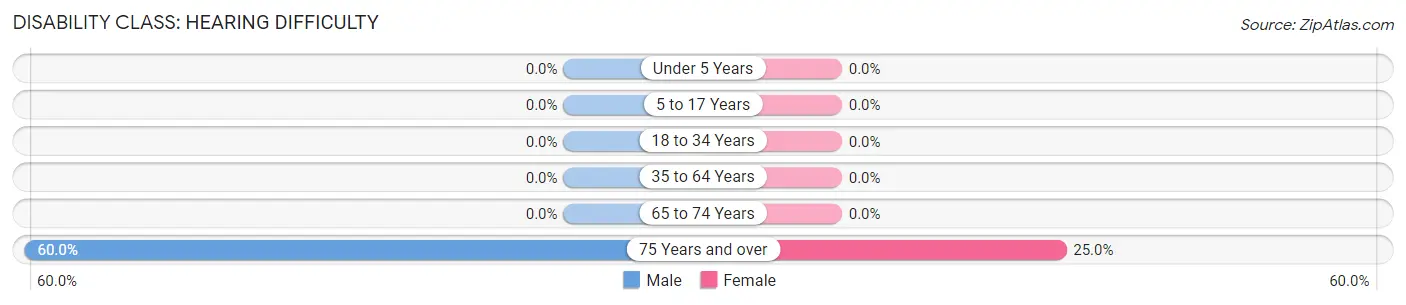
| Age Bracket | Male | Female |
| Under 5 Years | 0 (0.0%) | 0 (0.0%) |
| 5 to 17 Years | 0 (0.0%) | 0 (0.0%) |
| 18 to 34 Years | 0 (0.0%) | 0 (0.0%) |
| 35 to 64 Years | 0 (0.0%) | 0 (0.0%) |
| 65 to 74 Years | 0 (0.0%) | 0 (0.0%) |
| 75 Years and over | 9 (60.0%) | 2 (25.0%) |
Disability Class: Vision Difficulty
| Age Bracket | Male | Female |
| Under 5 Years | 0 (0.0%) | 0 (0.0%) |
| 5 to 17 Years | 0 (0.0%) | 0 (0.0%) |
| 18 to 34 Years | 0 (0.0%) | 0 (0.0%) |
| 35 to 64 Years | 0 (0.0%) | 0 (0.0%) |
| 65 to 74 Years | 0 (0.0%) | 0 (0.0%) |
| 75 Years and over | 0 (0.0%) | 0 (0.0%) |
Disability Class: Cognitive Difficulty
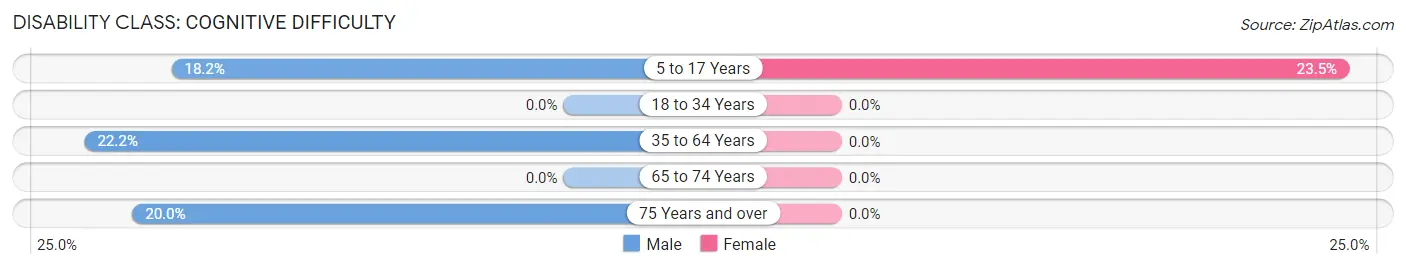
| Age Bracket | Male | Female |
| 5 to 17 Years | 2 (18.2%) | 4 (23.5%) |
| 18 to 34 Years | 0 (0.0%) | 0 (0.0%) |
| 35 to 64 Years | 10 (22.2%) | 0 (0.0%) |
| 65 to 74 Years | 0 (0.0%) | 0 (0.0%) |
| 75 Years and over | 3 (20.0%) | 0 (0.0%) |
Disability Class: Ambulatory Difficulty
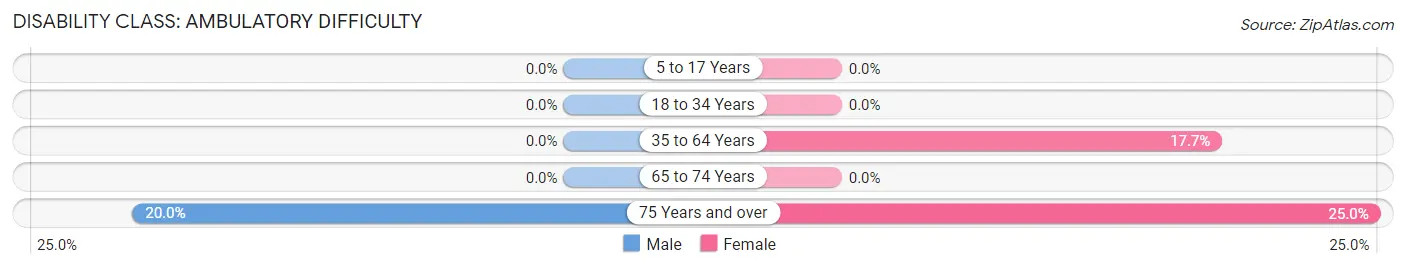
| Age Bracket | Male | Female |
| 5 to 17 Years | 0 (0.0%) | 0 (0.0%) |
| 18 to 34 Years | 0 (0.0%) | 0 (0.0%) |
| 35 to 64 Years | 0 (0.0%) | 6 (17.6%) |
| 65 to 74 Years | 0 (0.0%) | 0 (0.0%) |
| 75 Years and over | 3 (20.0%) | 2 (25.0%) |
Disability Class: Self-Care Difficulty
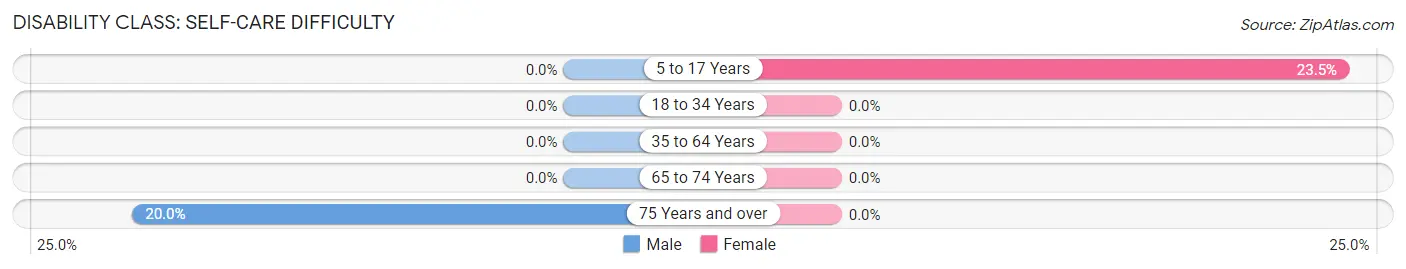
| Age Bracket | Male | Female |
| 5 to 17 Years | 0 (0.0%) | 4 (23.5%) |
| 18 to 34 Years | 0 (0.0%) | 0 (0.0%) |
| 35 to 64 Years | 0 (0.0%) | 0 (0.0%) |
| 65 to 74 Years | 0 (0.0%) | 0 (0.0%) |
| 75 Years and over | 3 (20.0%) | 0 (0.0%) |
Technology Access in Bennington
Computing Device Access in Bennington
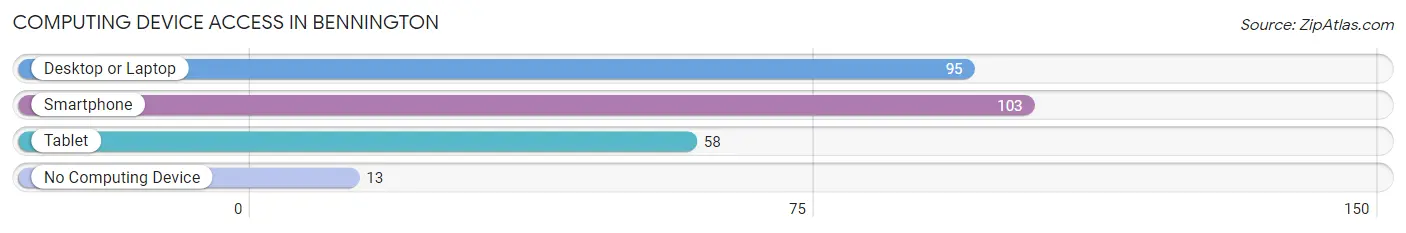
| Device Type | # Households | % Households |
| Desktop or Laptop | 95 | 78.5% |
| Smartphone | 103 | 85.1% |
| Tablet | 58 | 47.9% |
| No Computing Device | 13 | 10.7% |
| Total | 121 | 100.0% |
Internet Access in Bennington
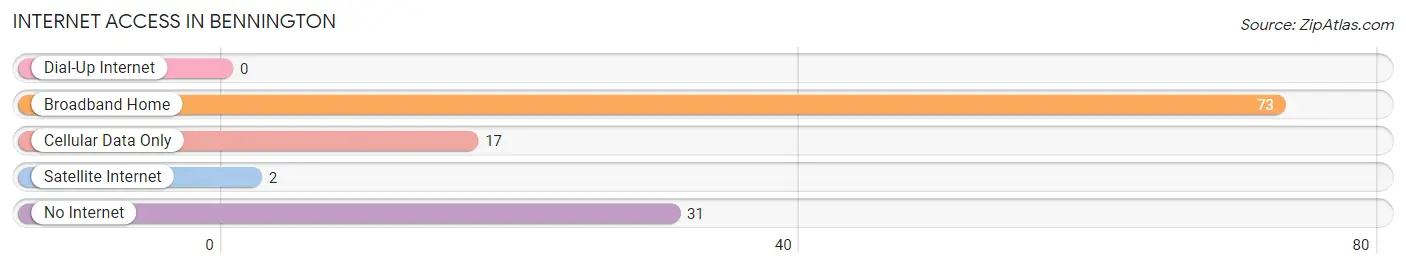
| Internet Type | # Households | % Households |
| Dial-Up Internet | 0 | 0.0% |
| Broadband Home | 73 | 60.3% |
| Cellular Data Only | 17 | 14.1% |
| Satellite Internet | 2 | 1.7% |
| No Internet | 31 | 25.6% |
| Total | 121 | 100.0% |
Bennington Summary
Bennington, NH is a small town located in the southwestern corner of New Hampshire, near the Massachusetts border. It is part of the Monadnock Region, which is known for its rural beauty and small-town charm. The town has a population of approximately 1,400 people, and is home to a variety of businesses, including a few small manufacturing companies.
History
Bennington was first settled in 1764 by a group of settlers from Massachusetts. The town was named after Benning Wentworth, the first Royal Governor of New Hampshire. The town was originally part of the town of Hancock, but was incorporated as its own town in 1790.
In the 19th century, Bennington was an agricultural community, with many of its residents working in the lumber and dairy industries. The town also had a few small manufacturing companies, including a woolen mill and a paper mill.
Geography
Bennington is located in the southwestern corner of New Hampshire, near the Massachusetts border. It is part of the Monadnock Region, which is known for its rural beauty and small-town charm. The town is situated on the banks of the Contoocook River, and is surrounded by rolling hills and forests.
The town covers an area of approximately 10 square miles, and is home to a variety of wildlife, including deer, foxes, and wild turkeys. The town is also home to several small lakes, including Lake Bennington and Lake Hancock.
Economy
Bennington’s economy is largely based on small businesses and manufacturing. The town is home to a few small manufacturing companies, including a woolen mill and a paper mill. The town also has a few small retail stores, including a grocery store and a hardware store.
The town is also home to a few small farms, which produce a variety of fruits and vegetables. The town also has a few small restaurants, which serve a variety of local dishes.
Demographics
As of the 2010 census, Bennington had a population of 1,400 people. The town is predominantly white, with approximately 95% of the population being of European descent. The town also has a small Hispanic population, with approximately 4% of the population being of Hispanic or Latino origin.
The median household income in Bennington is approximately $50,000, and the median home value is approximately $200,000. The town has a low unemployment rate, with only 3.5% of the population being unemployed.
Conclusion
Bennington, NH is a small town located in the southwestern corner of New Hampshire, near the Massachusetts border. It is part of the Monadnock Region, which is known for its rural beauty and small-town charm. The town has a population of approximately 1,400 people, and is home to a variety of businesses, including a few small manufacturing companies. The town’s economy is largely based on small businesses and manufacturing, and the town has a low unemployment rate. Bennington is predominantly white, with approximately 95% of the population being of European descent. The median household income in Bennington is approximately $50,000, and the median home value is approximately $200,000.
Common Questions
What is Per Capita Income in Bennington?
Per Capita income in Bennington is $44,127.
What is the Median Family Income in Bennington?
Median Family Income in Bennington is $91,125.
What is the Median Household income in Bennington?
Median Household Income in Bennington is $73,839.
What is Income or Wage Gap in Bennington?
Income or Wage Gap in Bennington is 39.0%.
Women in Bennington earn 61.0 cents for every dollar earned by a man.
What is Inequality or Gini Index in Bennington?
Inequality or Gini Index in Bennington is 0.35.
What is the Total Population of Bennington?
Total Population of Bennington is 253.
What is the Total Male Population of Bennington?
Total Male Population of Bennington is 143.
What is the Total Female Population of Bennington?
Total Female Population of Bennington is 110.
What is the Ratio of Males per 100 Females in Bennington?
There are 130.00 Males per 100 Females in Bennington.
What is the Ratio of Females per 100 Males in Bennington?
There are 76.92 Females per 100 Males in Bennington.
What is the Median Population Age in Bennington?
Median Population Age in Bennington is 44.6 Years.
What is the Average Family Size in Bennington
Average Family Size in Bennington is 2.9 People.
What is the Average Household Size in Bennington
Average Household Size in Bennington is 2.1 People.
How Large is the Labor Force in Bennington?
There are 130 People in the Labor Forcein in Bennington.
What is the Percentage of People in the Labor Force in Bennington?
65.0% of People are in the Labor Force in Bennington.
What is the Unemployment Rate in Bennington?
Unemployment Rate in Bennington is 6.2%.