Cities with the Highest Percentage of Immigrants from Brazil in Oregon

RELATED REPORTS & OPTIONS

Brazil
Population
Families and Households
Female Fertility
Female Fertility (Unmarried)
Race (Community Size)
Race (Percentage)
Ancestry (Community Size)
AfghanAfricanAlaska NativeAlaskan AthabascanAlbanianAleutAlsatianAmericanApacheArabArapahoArgentineanArmenianAssyrian / Chaldean / SyriacAustralianAustrianBahamianBangladeshiBarbadianBasqueBelgianBelizeanBermudanBhutaneseBlackfeetBolivianBrazilianBritishBritish West IndianBulgarianBurmeseCajunCambodianCanadianCape VerdeanCarpatho RusynCelticCentral AmericanCentral American IndianCherokeeCheyenneChickasawChileanChineseChippewaChoctawColombianColvilleComancheCosta RicanCreeCreekCroatianCrowCubanCypriotCzechCzechoslovakianDanishDelawareDominicanDutchDutch West IndianEastern EuropeanEcuadorianEgyptianEnglishEstonianEthiopianEuropeanFijianFilipinoFinnishFrenchFrench American IndianFrench CanadianGermanGerman RussianGhanaianGreekGuamanian / ChamorroGuatemalanGuyaneseHaitianHmongHonduranHopiHoumaHungarianIcelanderIndian (Asian)IndonesianInupiatIranianIraqiIrishIroquoisIsraeliItalianJamaicanJapaneseJordanianKenyanKiowaKoreanLaotianLatvianLebaneseLiberianLithuanianLumbeeLuxembourgerMacedonianMalaysianMalteseMarshalleseMenomineeMexicanMexican American IndianMongolianMoroccanNative HawaiianNavajoNepaleseNew ZealanderNicaraguanNigerianNorthern EuropeanNorwegianOkinawanOsageOttawaPaiutePakistaniPalestinianPanamanianParaguayanPennsylvania GermanPeruvianPimaPolishPortuguesePotawatomiPuebloPuerto RicanPuget Sound SalishRomanianRussianSalvadoranSamoanScandinavianScotch-IrishScottishSeminoleSenegaleseSerbianShoshoneSierra LeoneanSiouxSlavicSlovakSloveneSomaliSouth AfricanSouth AmericanSouth American IndianSoviet UnionSpaniardSpanishSpanish AmericanSpanish American IndianSri LankanSubsaharan AfricanSudaneseSwedishSwissSyrianTaiwaneseThaiTlingit-HaidaTohono O'OdhamTonganTrinidadian and TobagonianTsimshianTurkishU.S. Virgin IslanderUgandanUkrainianUruguayanUteVenezuelanVietnameseWelshWest IndianYakamaYaquiYugoslavianYumanYup'ikZimbabwean
Ancestry (Percentage)
AfghanAfricanAlaska NativeAlaskan AthabascanAlbanianAleutAlsatianAmericanApacheArabArapahoArgentineanArmenianAssyrian / Chaldean / SyriacAustralianAustrianBahamianBangladeshiBarbadianBasqueBelgianBelizeanBermudanBhutaneseBlackfeetBolivianBrazilianBritishBritish West IndianBulgarianBurmeseCajunCambodianCanadianCape VerdeanCarpatho RusynCelticCentral AmericanCentral American IndianCherokeeCheyenneChickasawChileanChineseChippewaChoctawColombianColvilleComancheCosta RicanCreeCreekCroatianCrowCubanCypriotCzechCzechoslovakianDanishDelawareDominicanDutchDutch West IndianEastern EuropeanEcuadorianEgyptianEnglishEstonianEthiopianEuropeanFijianFilipinoFinnishFrenchFrench American IndianFrench CanadianGermanGerman RussianGhanaianGreekGuamanian / ChamorroGuatemalanGuyaneseHaitianHmongHonduranHopiHoumaHungarianIcelanderIndian (Asian)IndonesianInupiatIranianIraqiIrishIroquoisIsraeliItalianJamaicanJapaneseJordanianKenyanKiowaKoreanLaotianLatvianLebaneseLiberianLithuanianLumbeeLuxembourgerMacedonianMalaysianMalteseMarshalleseMenomineeMexicanMexican American IndianMongolianMoroccanNative HawaiianNavajoNepaleseNew ZealanderNicaraguanNigerianNorthern EuropeanNorwegianOkinawanOsageOttawaPaiutePakistaniPalestinianPanamanianParaguayanPennsylvania GermanPeruvianPimaPolishPortuguesePotawatomiPuebloPuerto RicanPuget Sound SalishRomanianRussianSalvadoranSamoanScandinavianScotch-IrishScottishSeminoleSenegaleseSerbianShoshoneSierra LeoneanSiouxSlavicSlovakSloveneSomaliSouth AfricanSouth AmericanSouth American IndianSoviet UnionSpaniardSpanishSpanish AmericanSpanish American IndianSri LankanSubsaharan AfricanSudaneseSwedishSwissSyrianTaiwaneseThaiTlingit-HaidaTohono O'OdhamTonganTrinidadian and TobagonianTsimshianTurkishU.S. Virgin IslanderUgandanUkrainianUruguayanUteVenezuelanVietnameseWelshWest IndianYakamaYaquiYugoslavianYumanYup'ikZimbabwean
Immigrant Origin (Total)
AfghanistanAfricaAlbaniaArgentinaArmeniaAsiaAustraliaAustriaAzoresBahamasBangladeshBarbadosBelarusBelgiumBelizeBoliviaBosnia and HerzegovinaBrazilBulgariaBurma / MyanmarCabo VerdeCambodiaCameroonCanadaCaribbeanCentral AmericaChileChinaColombiaCongoCosta RicaCroatiaCubaCzechoslovakiaDenmarkDominicaDominican RepublicEastern AfricaEastern AsiaEastern EuropeEcuadorEgyptEl SalvadorEnglandEritreaEthiopiaEuropeFijiFranceGermanyGhanaGreeceGrenadaGuatemalaGuyanaHaitiHondurasHong KongHungaryIndiaIndonesiaIranIraqIrelandIsraelItalyJamaicaJapanJordanKazakhstanKenyaKoreaKuwaitLaosLatin AmericaLatviaLebanonLiberiaLithuaniaMalaysiaMexicoMicronesiaMiddle AfricaMoldovaMoroccoNepalNetherlandsNicaraguaNigeriaNorth MacedoniaNorthern AfricaNorthern EuropeNorwayOceaniaPakistanPanamaPeruPhilippinesPolandPortugalRomaniaRussiaSaudi ArabiaScotlandSenegalSerbiaSierra LeoneSingaporeSomaliaSouth AfricaSouth AmericaSouth Central AsiaSouth Eastern AsiaSouthern EuropeSpainSri LankaSt. Vincent and the GrenadinesSudanSwedenSwitzerlandSyriaTaiwanThailandTrinidad and TobagoTurkeyUgandaUkraineUruguayUzbekistanVenezuelaVietnamWest IndiesWestern AfricaWestern AsiaWestern EuropeYemenZaireZimbabwe
Immigrant Origin (Percentage)
AfghanistanAfricaAlbaniaArgentinaArmeniaAsiaAustraliaAustriaAzoresBahamasBangladeshBarbadosBelarusBelgiumBelizeBoliviaBosnia and HerzegovinaBrazilBulgariaBurma / MyanmarCabo VerdeCambodiaCameroonCanadaCaribbeanCentral AmericaChileChinaColombiaCongoCosta RicaCroatiaCubaCzechoslovakiaDenmarkDominicaDominican RepublicEastern AfricaEastern AsiaEastern EuropeEcuadorEgyptEl SalvadorEnglandEritreaEthiopiaEuropeFijiFranceGermanyGhanaGreeceGrenadaGuatemalaGuyanaHaitiHondurasHong KongHungaryIndiaIndonesiaIranIraqIrelandIsraelItalyJamaicaJapanJordanKazakhstanKenyaKoreaKuwaitLaosLatin AmericaLatviaLebanonLiberiaLithuaniaMalaysiaMexicoMicronesiaMiddle AfricaMoldovaMoroccoNepalNetherlandsNicaraguaNigeriaNorth MacedoniaNorthern AfricaNorthern EuropeNorwayOceaniaPakistanPanamaPeruPhilippinesPolandPortugalRomaniaRussiaSaudi ArabiaScotlandSenegalSerbiaSierra LeoneSingaporeSomaliaSouth AfricaSouth AmericaSouth Central AsiaSouth Eastern AsiaSouthern EuropeSpainSri LankaSt. Vincent and the GrenadinesSudanSwedenSwitzerlandSyriaTaiwanThailandTrinidad and TobagoTurkeyUgandaUkraineUruguayUzbekistanVenezuelaVietnamWest IndiesWestern AfricaWestern AsiaWestern EuropeYemenZaireZimbabwe
Income
Income (Families)
Income (Households)
Poverty
Poverty (Families)
Unemployment
Employment Occupations
Employment Industries
Employer Class
Commute Time
Commute Means
School Enrollment
Education by Degree Field
Occupancy
Finances
Physical Characteristics
Oregon
Compare Cities
Comparison Subject

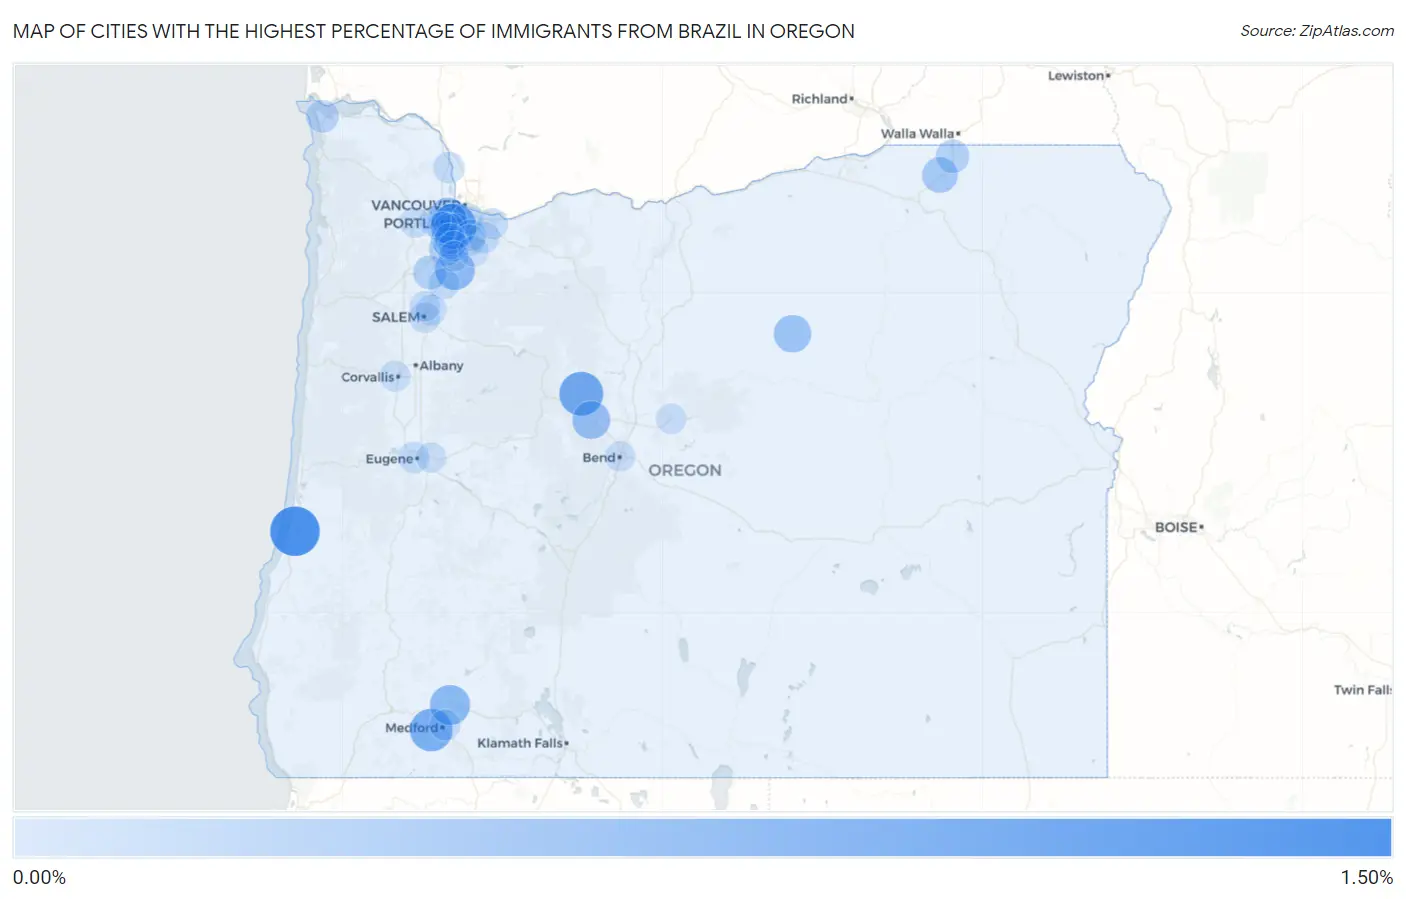
Map of Cities with the Highest Percentage of Immigrants from Brazil in Oregon

0.00%
1.50%
Cities with the Highest Percentage of Immigrants from Brazil in Oregon Map

Cities with the Highest Percentage of Immigrants from Brazil in Oregon

City Brazil vs State vs National
1.Lakeside1.36%0.051%(+1.31)#-10.17%(+1.19)#0
2.West Slope1.05%0.051%(+1.000)#00.17%(+0.884)#1
3.Camp Sherman0.96%0.051%(+0.907)#10.17%(+0.792)#2
4.Jacksonville0.86%0.051%(+0.813)#20.17%(+0.698)#3
5.Eagle Point0.69%0.051%(+0.637)#30.17%(+0.521)#4
6.Aurora0.66%0.051%(+0.613)#40.17%(+0.497)#5
7.Sisters0.53%0.051%(+0.484)#50.17%(+0.368)#6
8.River Road0.53%0.051%(+0.479)#60.17%(+0.363)#7
9.Spray0.50%0.051%(+0.452)#70.17%(+0.336)#8
10.Bethany0.48%0.051%(+0.427)#80.17%(+0.311)#9
11.Athena0.38%0.051%(+0.324)#90.17%(+0.208)#10
12.Garden Home Whitford0.37%0.051%(+0.316)#160.17%(+0.200)#2,166
13.Dunthorpe0.34%0.051%(+0.289)#170.17%(+0.173)#2,167
14.Sherwood0.28%0.051%(+0.230)#180.17%(+0.114)#2,168
15.St Paul0.25%0.051%(+0.198)#190.17%(+0.083)#2,169
16.Milton Freewater0.24%0.051%(+0.187)#200.17%(+0.071)#2,170
17.Bull Mountain0.23%0.051%(+0.174)#210.17%(+0.059)#2,171
18.King City0.22%0.051%(+0.166)#220.17%(+0.050)#2,172
19.Warrenton0.18%0.051%(+0.125)#230.17%(+0.009)#2,173
20.Cedar Mill0.13%0.051%(+0.080)#240.17%(-0.036)#2,174
21.St Helens0.086%0.051%(+0.035)#250.17%(-0.081)#2,175
22.Eugene0.084%0.051%(+0.033)#360.17%(-0.083)#3,392
23.Portland0.084%0.051%(+0.033)#370.17%(-0.083)#3,393
24.Happy Valley0.082%0.051%(+0.031)#380.17%(-0.085)#3,395
25.Woodburn0.080%0.051%(+0.029)#410.17%(-0.087)#3,579
26.Beaverton0.079%0.051%(+0.028)#420.17%(-0.088)#3,580
27.Milwaukie0.071%0.051%(+0.020)#430.17%(-0.096)#3,581
28.Hillsboro0.067%0.051%(+0.016)#440.17%(-0.100)#3,582
29.Aloha0.064%0.051%(+0.013)#450.17%(-0.103)#3,583
30.Gresham0.060%0.051%(+0.009)#460.17%(-0.107)#3,584
31.Hayesville0.060%0.051%(+0.009)#470.17%(-0.107)#3,585
32.Medford0.058%0.051%(+0.007)#480.17%(-0.108)#3,586
33.Corvallis0.053%0.051%(+0.002)#490.17%(-0.114)#3,587
34.Oak Grove0.051%0.051%(+0.000)#500.17%(-0.116)#3,588
35.Tigard0.051%0.051%(-0.000)#510.17%(-0.116)#3,589
36.Salem0.047%0.051%(-0.004)#520.17%(-0.120)#3,590
37.Forest Grove0.038%0.051%(-0.013)#530.17%(-0.129)#3,591
38.Prineville0.037%0.051%(-0.014)#540.17%(-0.130)#3,592
39.Keizer0.036%0.051%(-0.015)#550.17%(-0.131)#3,593
40.Tualatin0.029%0.051%(-0.022)#560.17%(-0.138)#3,594
41.Wilsonville0.023%0.051%(-0.028)#570.17%(-0.144)#3,595
42.Oregon City0.021%0.051%(-0.030)#580.17%(-0.145)#3,596
43.Bend0.020%0.051%(-0.031)#590.17%(-0.147)#3,597
44.Springfield0.0097%0.051%(-0.041)#600.17%(-0.157)#3,598

Common Questions

What are the Top 10 Cities with the Highest Percentage of Immigrants from Brazil in Oregon?
Top 10 Cities with the Highest Percentage of Immigrants from Brazil in Oregon are:
#1
1.36%
#2
1.05%
#3
0.96%
#4
0.86%
#5
0.69%
#6
0.66%
#7
0.53%
#8
0.50%
#9
0.48%
#10
0.38%
What city has the Highest Percentage of Immigrants from Brazil in Oregon?
Lakeside has the Highest Percentage of Immigrants from Brazil in Oregon with 1.36%.
What is the Percentage of Immigrants from Brazil in the State of Oregon?
Percentage of Immigrants from Brazil in Oregon is 0.051%.
What is the Percentage of Immigrants from Brazil in the United States?
Percentage of Immigrants from Brazil in the United States is 0.17%.