Lake City, MI Map & Demographics
Lake City Map
Lake City Overview
$28,911
PER CAPITA INCOME
$86,250
AVG FAMILY INCOME
$57,868
AVG HOUSEHOLD INCOME
15.5%
WAGE / INCOME GAP [ % ]
84.5¢/ $1
WAGE / INCOME GAP [ $ ]
0.37
INEQUALITY / GINI INDEX
702
TOTAL POPULATION
402
MALE POPULATION
300
FEMALE POPULATION
134.00
MALES / 100 FEMALES
74.63
FEMALES / 100 MALES
36.8
MEDIAN AGE
3.0
AVG FAMILY SIZE
2.6
AVG HOUSEHOLD SIZE
338
LABOR FORCE [ PEOPLE ]
56.7%
PERCENT IN LABOR FORCE
6.8%
UNEMPLOYMENT RATE
Lake City Zip Codes
Lake City Area Codes
Income in Lake City
Income Overview in Lake City
Per Capita Income in Lake City is $28,911, while median incomes of families and households are $86,250 and $57,868 respectively.
| Characteristic | Number | Measure |
| Per Capita Income | 702 | $28,911 |
| Median Family Income | 162 | $86,250 |
| Mean Family Income | 162 | $92,628 |
| Median Household Income | 265 | $57,868 |
| Mean Household Income | 265 | $74,517 |
| Income Deficit | 162 | $0 |
| Wage / Income Gap (%) | 702 | 15.53% |
| Wage / Income Gap ($) | 702 | 84.47¢ per $1 |
| Gini / Inequality Index | 702 | 0.37 |
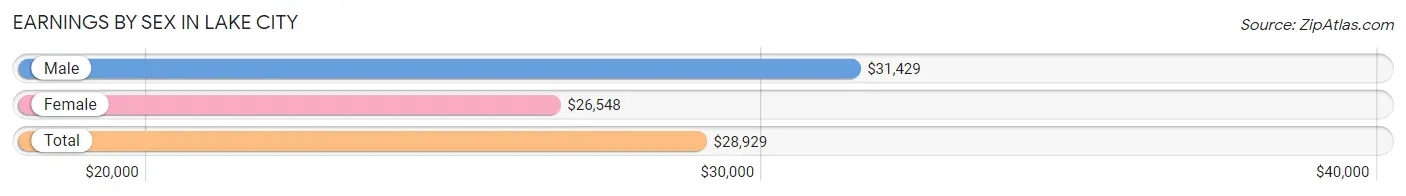
Earnings by Sex in Lake City
Average Earnings in Lake City are $28,929, $31,429 for men and $26,548 for women, a difference of 15.5%.
| Sex | Number | Average Earnings |
| Male | 206 (56.9%) | $31,429 |
| Female | 156 (43.1%) | $26,548 |
| Total | 362 (100.0%) | $28,929 |
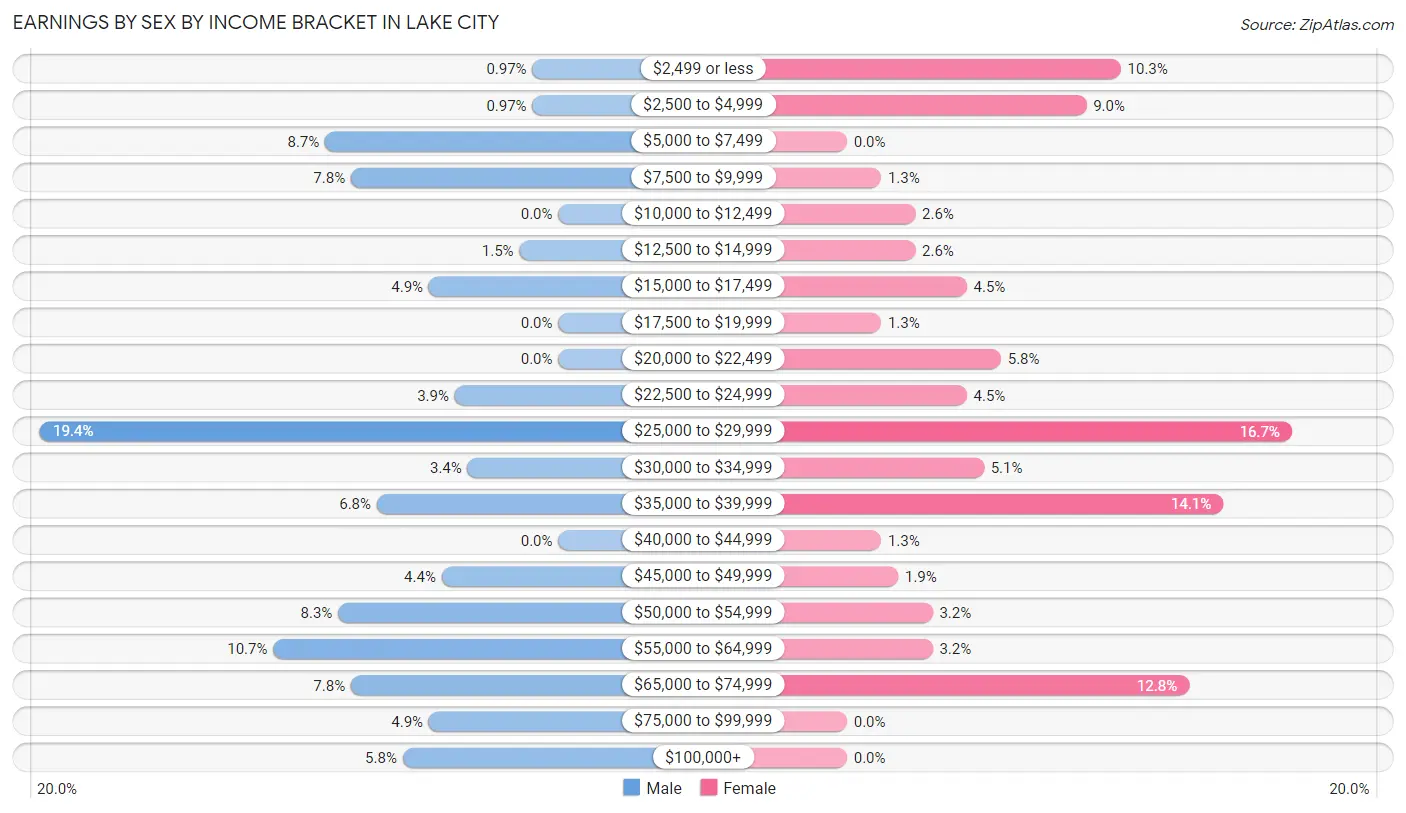
Earnings by Sex by Income Bracket in Lake City
The most common earnings brackets in Lake City are $25,000 to $29,999 for men (40 | 19.4%) and $25,000 to $29,999 for women (26 | 16.7%).
| Income | Male | Female |
| $2,499 or less | 2 (1.0%) | 16 (10.3%) |
| $2,500 to $4,999 | 2 (1.0%) | 14 (9.0%) |
| $5,000 to $7,499 | 18 (8.7%) | 0 (0.0%) |
| $7,500 to $9,999 | 16 (7.8%) | 2 (1.3%) |
| $10,000 to $12,499 | 0 (0.0%) | 4 (2.6%) |
| $12,500 to $14,999 | 3 (1.5%) | 4 (2.6%) |
| $15,000 to $17,499 | 10 (4.9%) | 7 (4.5%) |
| $17,500 to $19,999 | 0 (0.0%) | 2 (1.3%) |
| $20,000 to $22,499 | 0 (0.0%) | 9 (5.8%) |
| $22,500 to $24,999 | 8 (3.9%) | 7 (4.5%) |
| $25,000 to $29,999 | 40 (19.4%) | 26 (16.7%) |
| $30,000 to $34,999 | 7 (3.4%) | 8 (5.1%) |
| $35,000 to $39,999 | 14 (6.8%) | 22 (14.1%) |
| $40,000 to $44,999 | 0 (0.0%) | 2 (1.3%) |
| $45,000 to $49,999 | 9 (4.4%) | 3 (1.9%) |
| $50,000 to $54,999 | 17 (8.3%) | 5 (3.2%) |
| $55,000 to $64,999 | 22 (10.7%) | 5 (3.2%) |
| $65,000 to $74,999 | 16 (7.8%) | 20 (12.8%) |
| $75,000 to $99,999 | 10 (4.9%) | 0 (0.0%) |
| $100,000+ | 12 (5.8%) | 0 (0.0%) |
| Total | 206 (100.0%) | 156 (100.0%) |
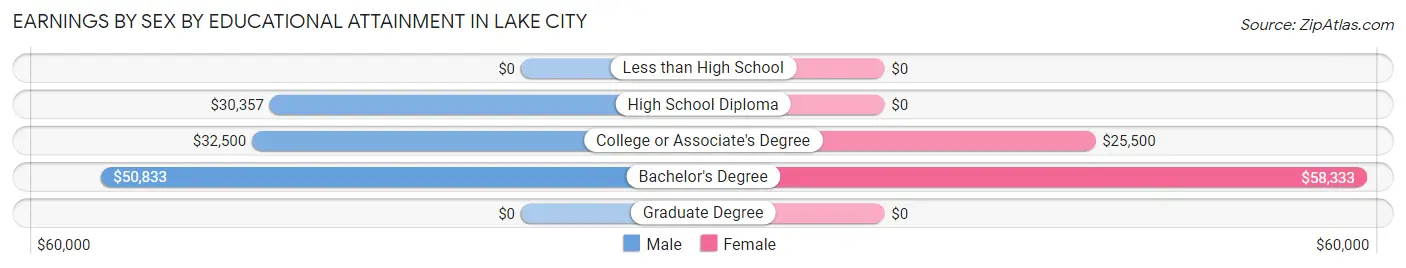
Earnings by Sex by Educational Attainment in Lake City
Average earnings in Lake City are $36,042 for men and $27,262 for women, a difference of 24.4%. Men with an educational attainment of bachelor's degree enjoy the highest average annual earnings of $50,833, while those with high school diploma education earn the least with $30,357. Women with an educational attainment of bachelor's degree earn the most with the average annual earnings of $58,333, while those with college or associate's degree education have the smallest earnings of $25,500.
| Educational Attainment | Male Income | Female Income |
| Less than High School | - | - |
| High School Diploma | $30,357 | $0 |
| College or Associate's Degree | $32,500 | $25,500 |
| Bachelor's Degree | $50,833 | $58,333 |
| Graduate Degree | - | - |
| Total | $36,042 | $27,262 |
Family Income in Lake City
Family Income Brackets in Lake City
According to the Lake City family income data, there are 47 families falling into the $100,000 to $149,999 income range, which is the most common income bracket and makes up 29.0% of all families.
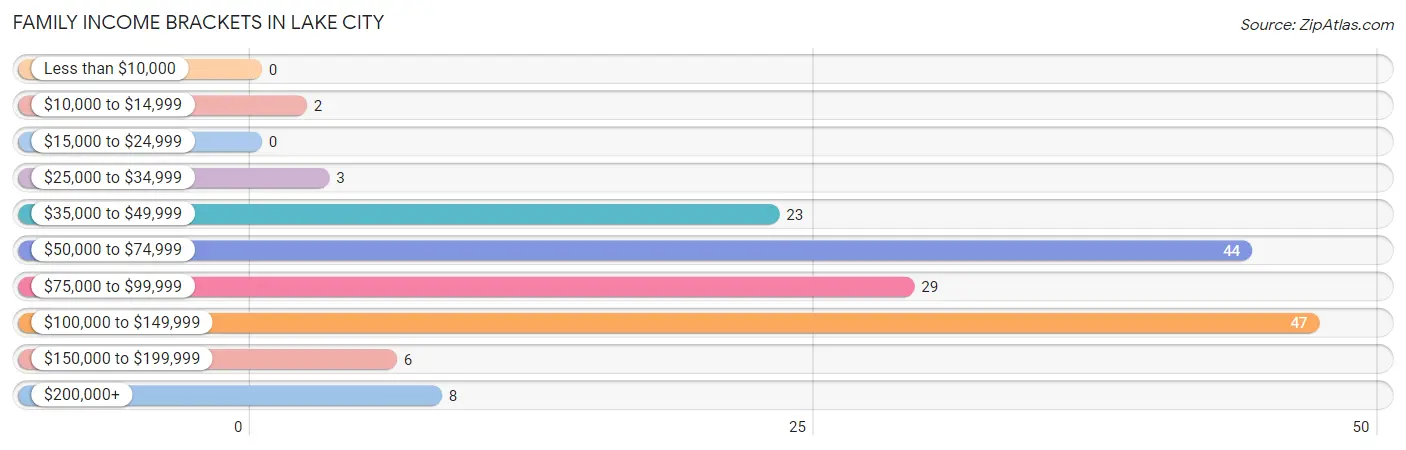
| Income Bracket | # Families | % Families |
| Less than $10,000 | 0 | 0.0% |
| $10,000 to $14,999 | 2 | 1.2% |
| $15,000 to $24,999 | 0 | 0.0% |
| $25,000 to $34,999 | 3 | 1.9% |
| $35,000 to $49,999 | 23 | 14.2% |
| $50,000 to $74,999 | 44 | 27.2% |
| $75,000 to $99,999 | 29 | 17.9% |
| $100,000 to $149,999 | 47 | 29.0% |
| $150,000 to $199,999 | 6 | 3.7% |
| $200,000+ | 8 | 4.9% |
Family Income by Famaliy Size in Lake City
4-person families (20 | 12.3%) account for the highest median family income in Lake City with $111,250 per family, while 4-person families (20 | 12.3%) have the highest median income of $27,812 per family member.
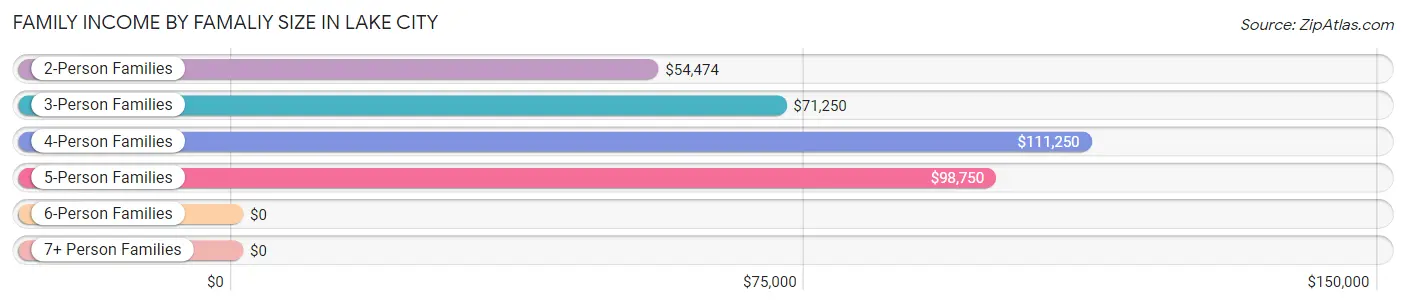
| Income Bracket | # Families | Median Income |
| 2-Person Families | 86 (53.1%) | $54,474 |
| 3-Person Families | 32 (19.8%) | $71,250 |
| 4-Person Families | 20 (12.3%) | $111,250 |
| 5-Person Families | 17 (10.5%) | $98,750 |
| 6-Person Families | 0 (0.0%) | $0 |
| 7+ Person Families | 7 (4.3%) | $0 |
| Total | 162 (100.0%) | $86,250 |
Family Income by Number of Earners in Lake City
The median family income in Lake City is $86,250, with families comprising 2 earners (63) having the highest median family income of $102,250, while families with no earners (29) have the lowest median family income of $47,292, accounting for 38.9% and 17.9% of families, respectively.
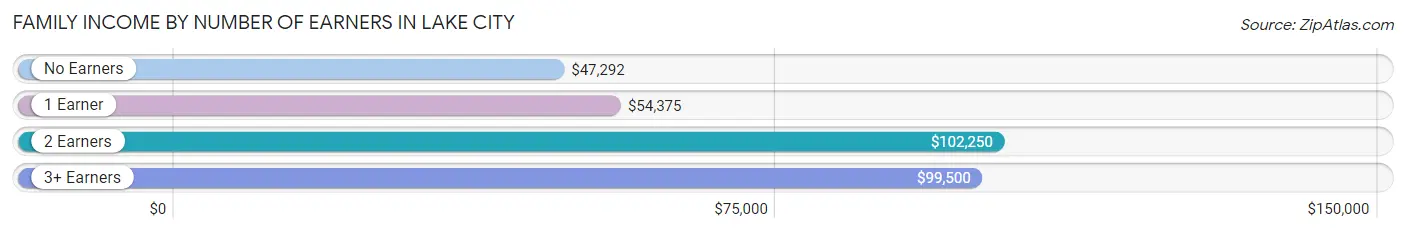
| Number of Earners | # Families | Median Income |
| No Earners | 29 (17.9%) | $47,292 |
| 1 Earner | 44 (27.2%) | $54,375 |
| 2 Earners | 63 (38.9%) | $102,250 |
| 3+ Earners | 26 (16.1%) | $99,500 |
| Total | 162 (100.0%) | $86,250 |
Household Income in Lake City
Household Income Brackets in Lake City
With 78 households falling in the category, the $50,000 to $74,999 income range is the most frequent in Lake City, accounting for 29.4% of all households. In contrast, only 8 households (3.0%) fall into the $200,000+ income bracket, making it the least populous group.
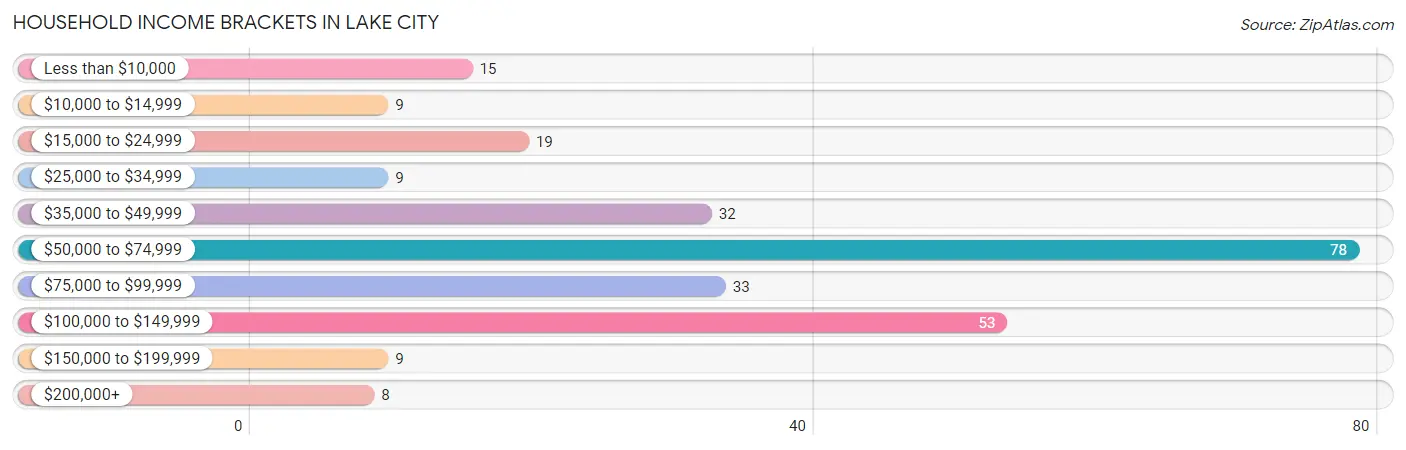
| Income Bracket | # Households | % Households |
| Less than $10,000 | 15 | 5.7% |
| $10,000 to $14,999 | 9 | 3.4% |
| $15,000 to $24,999 | 19 | 7.2% |
| $25,000 to $34,999 | 9 | 3.4% |
| $35,000 to $49,999 | 32 | 12.1% |
| $50,000 to $74,999 | 78 | 29.4% |
| $75,000 to $99,999 | 33 | 12.5% |
| $100,000 to $149,999 | 53 | 20.0% |
| $150,000 to $199,999 | 9 | 3.4% |
| $200,000+ | 8 | 3.0% |
Household Income by Householder Age in Lake City
The median household income in Lake City is $57,868, with the highest median household income of $101,667 found in the 25 to 44 years age bracket for the primary householder. A total of 84 households (31.7%) fall into this category. Meanwhile, the 15 to 24 years age bracket for the primary householder has the lowest median household income of $0, with 11 households (4.2%) in this group.
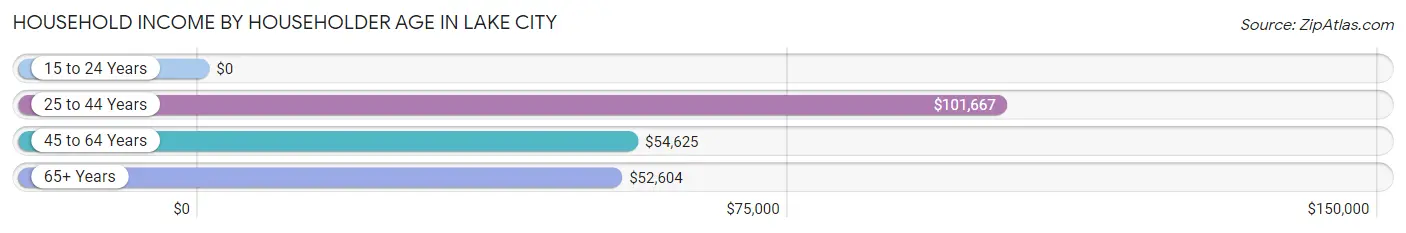
| Income Bracket | # Households | Median Income |
| 15 to 24 Years | 11 (4.2%) | $0 |
| 25 to 44 Years | 84 (31.7%) | $101,667 |
| 45 to 64 Years | 67 (25.3%) | $54,625 |
| 65+ Years | 103 (38.9%) | $52,604 |
| Total | 265 (100.0%) | $57,868 |
Poverty in Lake City
Income Below Poverty by Sex and Age in Lake City
With 11.3% poverty level for males and 9.8% for females among the residents of Lake City, 16 and 17 year old males and 18 to 24 year old females are the most vulnerable to poverty, with 22 males (68.8%) and 9 females (39.1%) in their respective age groups living below the poverty level.
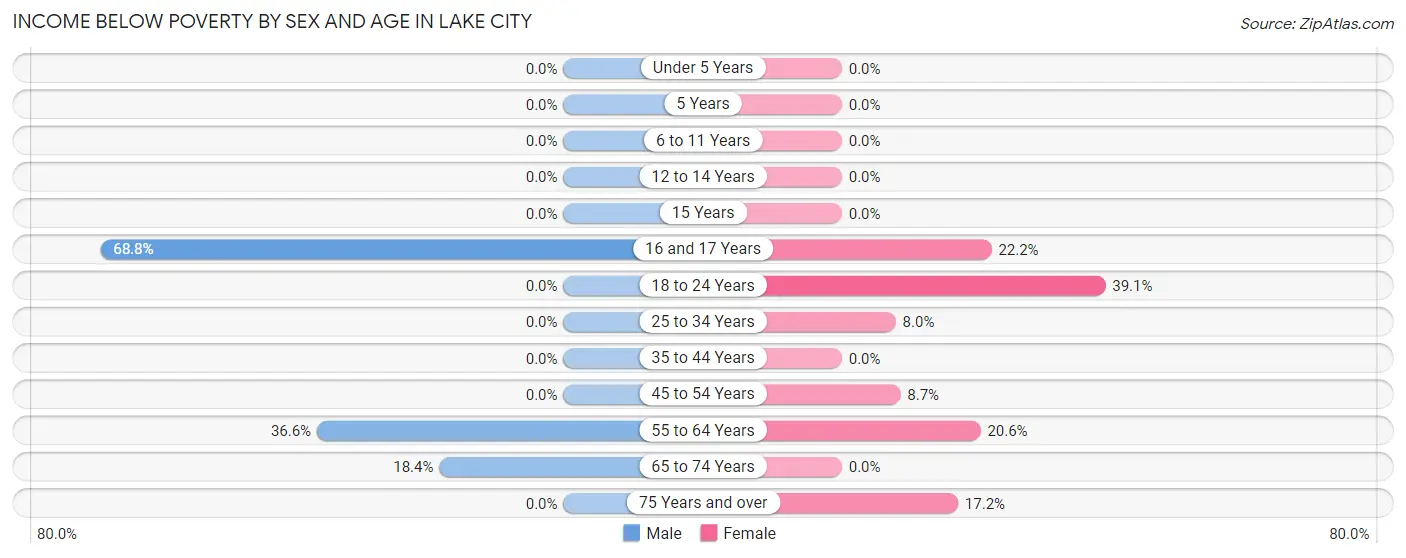
| Age Bracket | Male | Female |
| Under 5 Years | 0 (0.0%) | 0 (0.0%) |
| 5 Years | 0 (0.0%) | 0 (0.0%) |
| 6 to 11 Years | 0 (0.0%) | 0 (0.0%) |
| 12 to 14 Years | 0 (0.0%) | 0 (0.0%) |
| 15 Years | 0 (0.0%) | 0 (0.0%) |
| 16 and 17 Years | 22 (68.8%) | 2 (22.2%) |
| 18 to 24 Years | 0 (0.0%) | 9 (39.1%) |
| 25 to 34 Years | 0 (0.0%) | 4 (8.0%) |
| 35 to 44 Years | 0 (0.0%) | 0 (0.0%) |
| 45 to 54 Years | 0 (0.0%) | 2 (8.7%) |
| 55 to 64 Years | 15 (36.6%) | 7 (20.6%) |
| 65 to 74 Years | 7 (18.4%) | 0 (0.0%) |
| 75 Years and over | 0 (0.0%) | 5 (17.2%) |
| Total | 44 (11.3%) | 29 (9.8%) |
Income Above Poverty by Sex and Age in Lake City
According to the poverty statistics in Lake City, males aged under 5 years and females aged 6 to 11 years are the age groups that are most secure financially, with 100.0% of males and 100.0% of females in these age groups living above the poverty line.
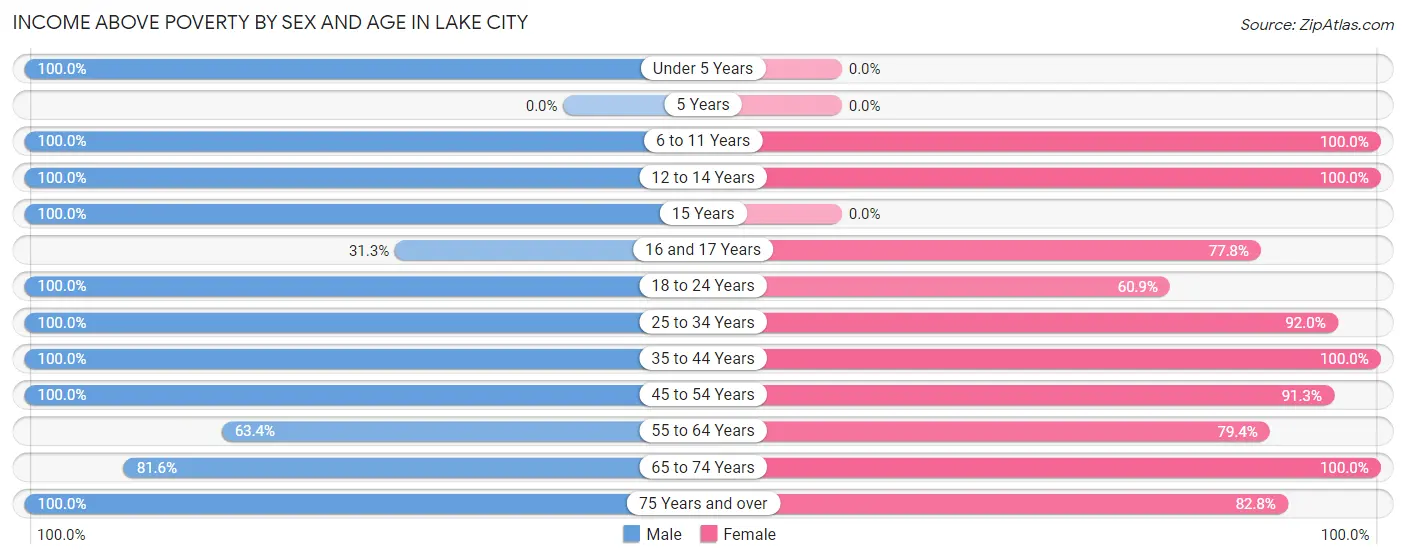
| Age Bracket | Male | Female |
| Under 5 Years | 33 (100.0%) | 0 (0.0%) |
| 5 Years | 0 (0.0%) | 0 (0.0%) |
| 6 to 11 Years | 22 (100.0%) | 25 (100.0%) |
| 12 to 14 Years | 8 (100.0%) | 7 (100.0%) |
| 15 Years | 7 (100.0%) | 0 (0.0%) |
| 16 and 17 Years | 10 (31.2%) | 7 (77.8%) |
| 18 to 24 Years | 33 (100.0%) | 14 (60.9%) |
| 25 to 34 Years | 77 (100.0%) | 46 (92.0%) |
| 35 to 44 Years | 36 (100.0%) | 38 (100.0%) |
| 45 to 54 Years | 21 (100.0%) | 21 (91.3%) |
| 55 to 64 Years | 26 (63.4%) | 27 (79.4%) |
| 65 to 74 Years | 31 (81.6%) | 58 (100.0%) |
| 75 Years and over | 40 (100.0%) | 24 (82.8%) |
| Total | 344 (88.7%) | 267 (90.2%) |
Income Below Poverty Among Married-Couple Families in Lake City
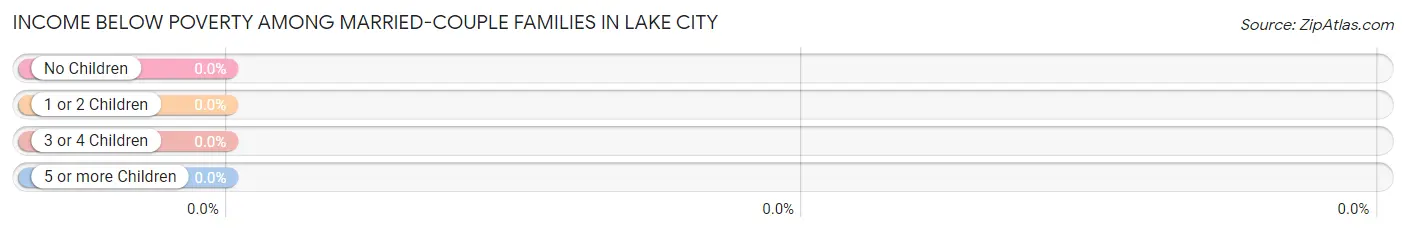
| Children | Above Poverty | Below Poverty |
| No Children | 78 (100.0%) | 0 (0.0%) |
| 1 or 2 Children | 35 (100.0%) | 0 (0.0%) |
| 3 or 4 Children | 13 (100.0%) | 0 (0.0%) |
| 5 or more Children | 0 (0.0%) | 0 (0.0%) |
| Total | 126 (100.0%) | 0 (0.0%) |
Income Below Poverty Among Single-Parent Households in Lake City
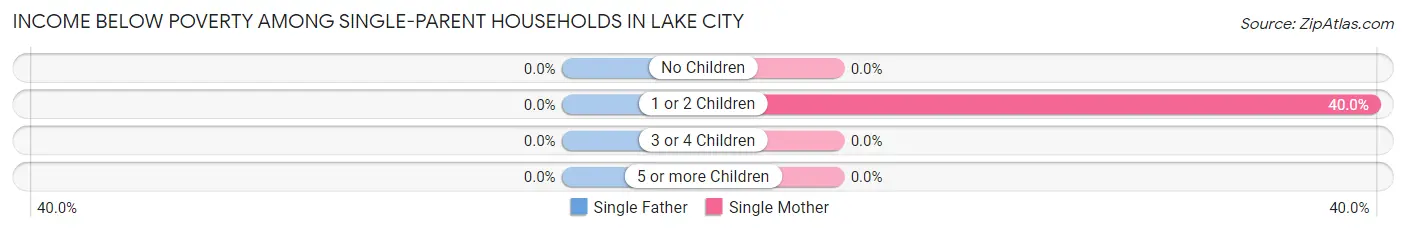
| Children | Single Father | Single Mother |
| No Children | 0 (0.0%) | 0 (0.0%) |
| 1 or 2 Children | 0 (0.0%) | 2 (40.0%) |
| 3 or 4 Children | 0 (0.0%) | 0 (0.0%) |
| 5 or more Children | 0 (0.0%) | 0 (0.0%) |
| Total | 0 (0.0%) | 2 (8.3%) |
Income Below Poverty Among Married-Couple vs Single-Parent Households in Lake City
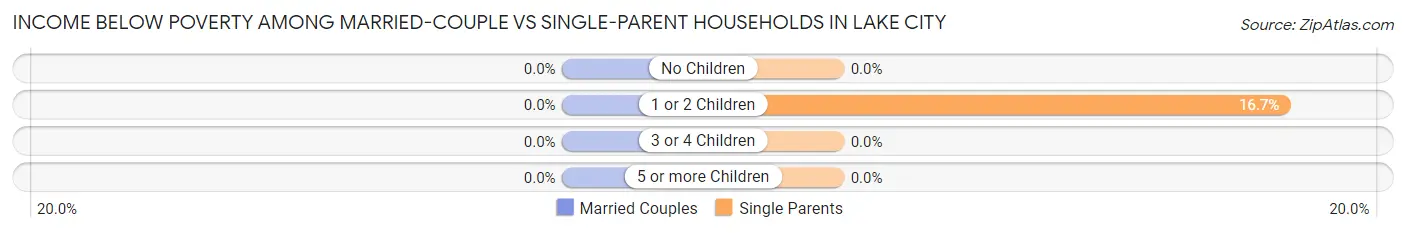
| Children | Married-Couple Families | Single-Parent Households |
| No Children | 0 (0.0%) | 0 (0.0%) |
| 1 or 2 Children | 0 (0.0%) | 2 (16.7%) |
| 3 or 4 Children | 0 (0.0%) | 0 (0.0%) |
| 5 or more Children | 0 (0.0%) | 0 (0.0%) |
| Total | 0 (0.0%) | 2 (5.6%) |
Race in Lake City
The most populous races in Lake City are White / Caucasian (642 | 91.4%), Some other Race (22 | 3.1%), and Two or more Races (17 | 2.4%).
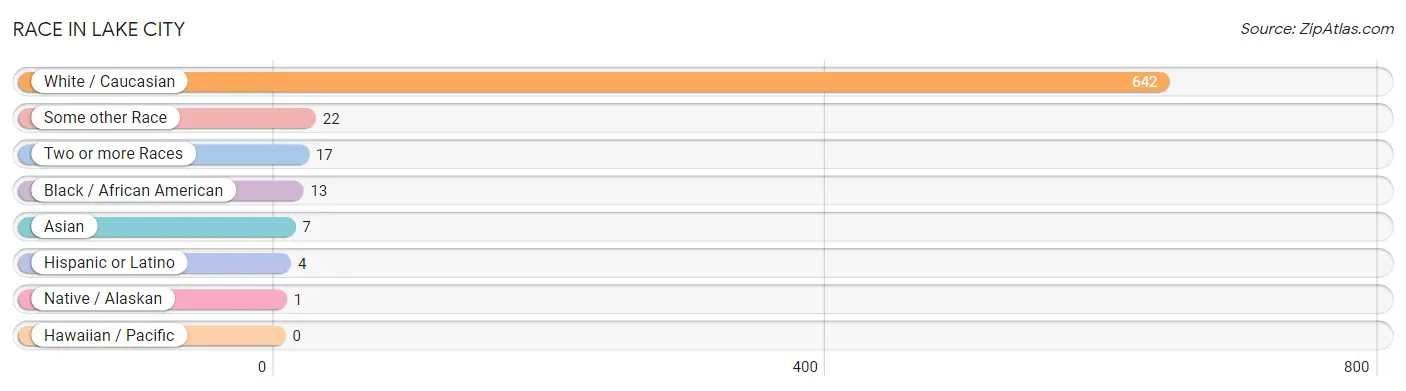
| Race | # Population | % Population |
| Asian | 7 | 1.0% |
| Black / African American | 13 | 1.8% |
| Hawaiian / Pacific | 0 | 0.0% |
| Hispanic or Latino | 4 | 0.6% |
| Native / Alaskan | 1 | 0.1% |
| White / Caucasian | 642 | 91.4% |
| Two or more Races | 17 | 2.4% |
| Some other Race | 22 | 3.1% |
| Total | 702 | 100.0% |
Ancestry in Lake City
The most populous ancestries reported in Lake City are German (152 | 21.6%), Dutch (66 | 9.4%), Polish (57 | 8.1%), English (53 | 7.5%), and Irish (34 | 4.8%), together accounting for 51.6% of all Lake City residents.
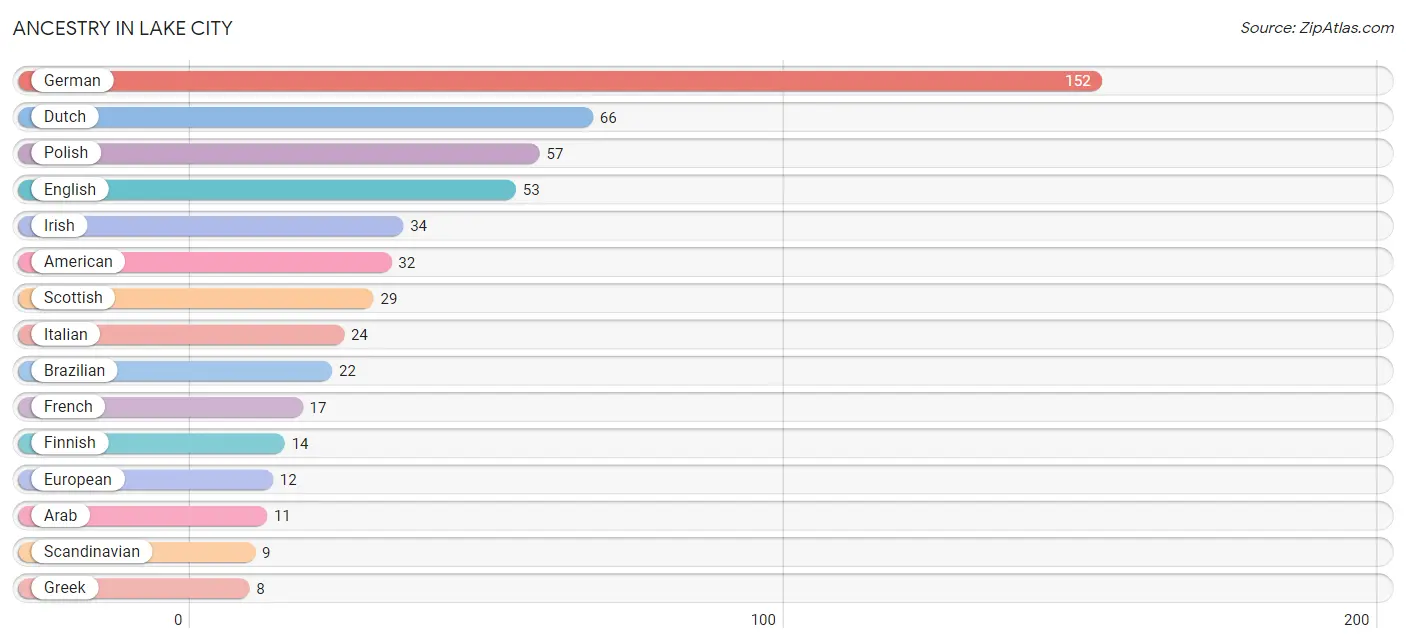
| Ancestry | # Population | % Population |
| American | 32 | 4.6% |
| Arab | 11 | 1.6% |
| Armenian | 2 | 0.3% |
| Brazilian | 22 | 3.1% |
| Cherokee | 1 | 0.1% |
| Czechoslovakian | 6 | 0.9% |
| Dutch | 66 | 9.4% |
| English | 53 | 7.5% |
| European | 12 | 1.7% |
| Finnish | 14 | 2.0% |
| French | 17 | 2.4% |
| French Canadian | 7 | 1.0% |
| German | 152 | 21.6% |
| Greek | 8 | 1.1% |
| Hungarian | 4 | 0.6% |
| Indian (Asian) | 7 | 1.0% |
| Irish | 34 | 4.8% |
| Italian | 24 | 3.4% |
| Lebanese | 7 | 1.0% |
| Mexican | 4 | 0.6% |
| Northern European | 3 | 0.4% |
| Norwegian | 2 | 0.3% |
| Polish | 57 | 8.1% |
| Romanian | 7 | 1.0% |
| Scandinavian | 9 | 1.3% |
| Scotch-Irish | 3 | 0.4% |
| Scottish | 29 | 4.1% |
| Swedish | 5 | 0.7% |
| Yugoslavian | 7 | 1.0% | View All 29 Rows |
Immigrants in Lake City
The most numerous immigrant groups reported in Lake City came from Brazil (22 | 3.1%), Latin America (22 | 3.1%), South America (22 | 3.1%), Asia (16 | 2.3%), and Western Asia (9 | 1.3%), together accounting for 13.0% of all Lake City residents.
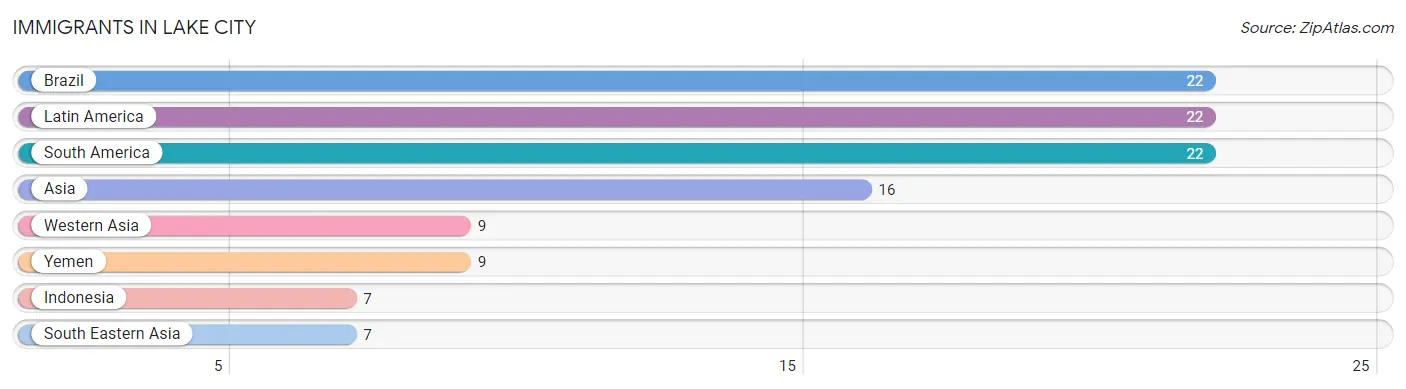
| Immigration Origin | # Population | % Population |
| Asia | 16 | 2.3% |
| Brazil | 22 | 3.1% |
| Indonesia | 7 | 1.0% |
| Latin America | 22 | 3.1% |
| South America | 22 | 3.1% |
| South Eastern Asia | 7 | 1.0% |
| Western Asia | 9 | 1.3% |
| Yemen | 9 | 1.3% | View All 8 Rows |
Sex and Age in Lake City
Sex and Age in Lake City
The most populous age groups in Lake City are 15 to 19 Years (53 | 13.2%) for men and 70 to 74 Years (42 | 14.0%) for women.
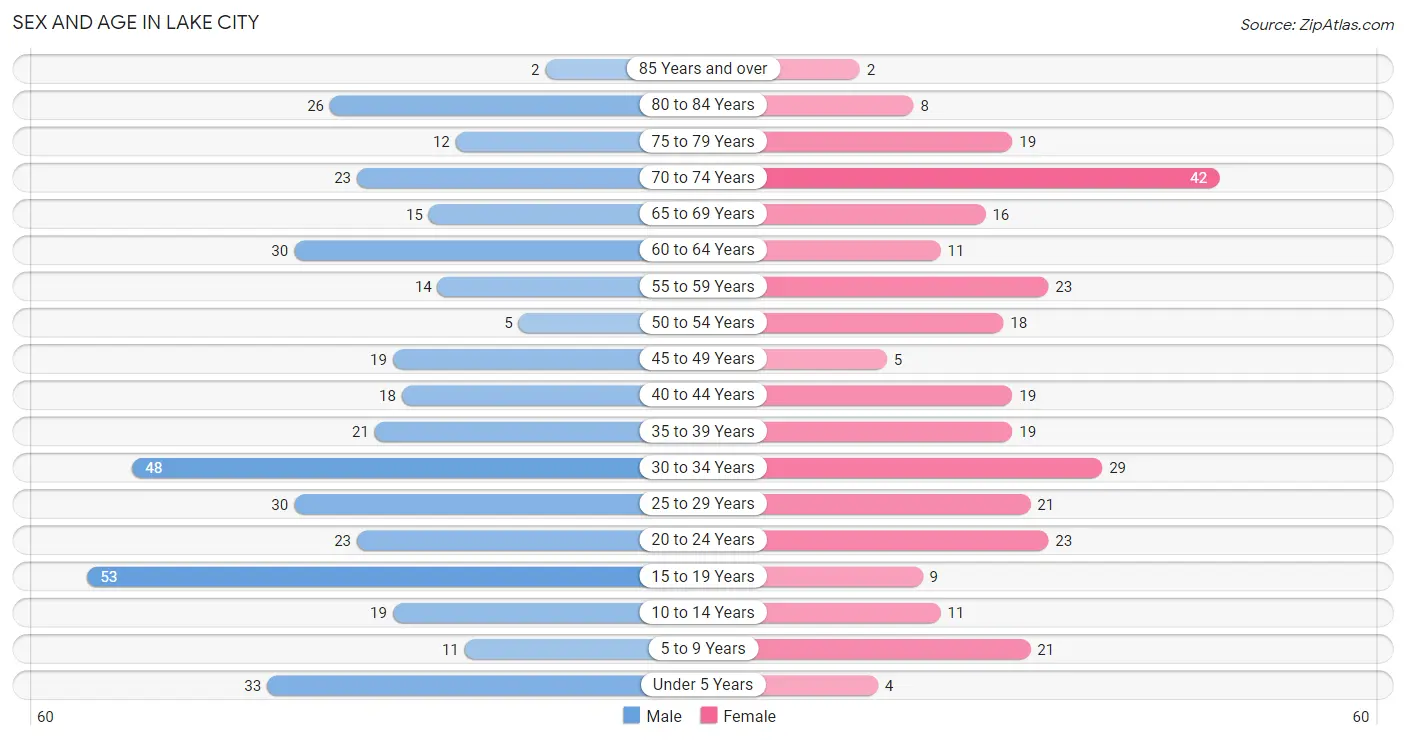
| Age Bracket | Male | Female |
| Under 5 Years | 33 (8.2%) | 4 (1.3%) |
| 5 to 9 Years | 11 (2.7%) | 21 (7.0%) |
| 10 to 14 Years | 19 (4.7%) | 11 (3.7%) |
| 15 to 19 Years | 53 (13.2%) | 9 (3.0%) |
| 20 to 24 Years | 23 (5.7%) | 23 (7.7%) |
| 25 to 29 Years | 30 (7.5%) | 21 (7.0%) |
| 30 to 34 Years | 48 (11.9%) | 29 (9.7%) |
| 35 to 39 Years | 21 (5.2%) | 19 (6.3%) |
| 40 to 44 Years | 18 (4.5%) | 19 (6.3%) |
| 45 to 49 Years | 19 (4.7%) | 5 (1.7%) |
| 50 to 54 Years | 5 (1.2%) | 18 (6.0%) |
| 55 to 59 Years | 14 (3.5%) | 23 (7.7%) |
| 60 to 64 Years | 30 (7.5%) | 11 (3.7%) |
| 65 to 69 Years | 15 (3.7%) | 16 (5.3%) |
| 70 to 74 Years | 23 (5.7%) | 42 (14.0%) |
| 75 to 79 Years | 12 (3.0%) | 19 (6.3%) |
| 80 to 84 Years | 26 (6.5%) | 8 (2.7%) |
| 85 Years and over | 2 (0.5%) | 2 (0.7%) |
| Total | 402 (100.0%) | 300 (100.0%) |
Families and Households in Lake City
Median Family Size in Lake City
The median family size in Lake City is 3.05 persons per family, with married-couple families (126 | 77.8%) accounting for the largest median family size of 3.22 persons per family. On the other hand, single female/mother families (24 | 14.8%) represent the smallest median family size with 2.17 persons per family.
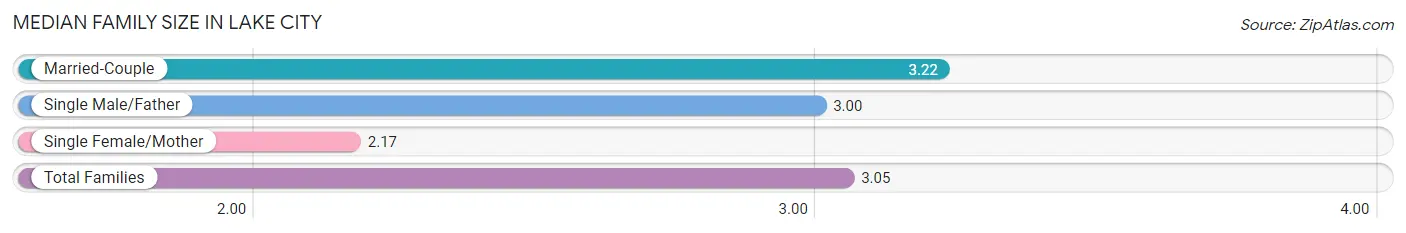
| Family Type | # Families | Family Size |
| Married-Couple | 126 (77.8%) | 3.22 |
| Single Male/Father | 12 (7.4%) | 3.00 |
| Single Female/Mother | 24 (14.8%) | 2.17 |
| Total Families | 162 (100.0%) | 3.05 |
Median Household Size in Lake City
The median household size in Lake City is 2.57 persons per household, with single male/father households (12 | 4.5%) accounting for the largest median household size of 3.92 persons per household. non-family households (103 | 38.9%) represent the smallest median household size with 1.21 persons per household.
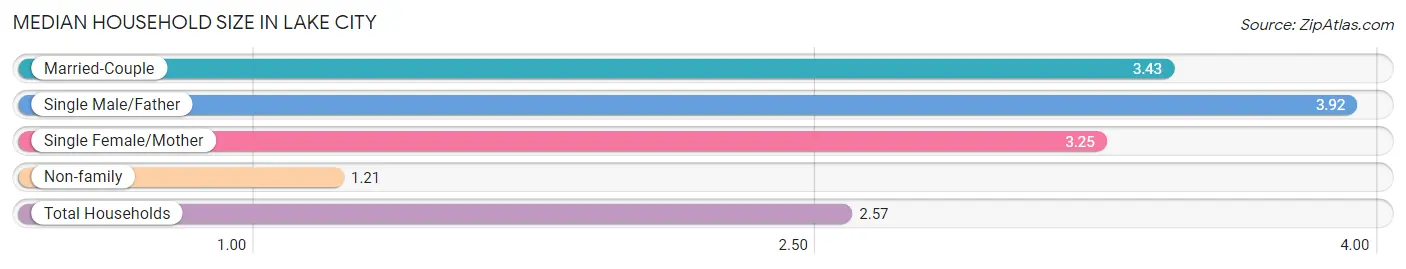
| Household Type | # Households | Household Size |
| Married-Couple | 126 (47.5%) | 3.43 |
| Single Male/Father | 12 (4.5%) | 3.92 |
| Single Female/Mother | 24 (9.1%) | 3.25 |
| Non-family | 103 (38.9%) | 1.21 |
| Total Households | 265 (100.0%) | 2.57 |
Household Size by Marriage Status in Lake City
Out of a total of 265 households in Lake City, 162 (61.1%) are family households, while 103 (38.9%) are nonfamily households. The most numerous type of family households are 2-person households, comprising 60, and the most common type of nonfamily households are 1-person households, comprising 84.
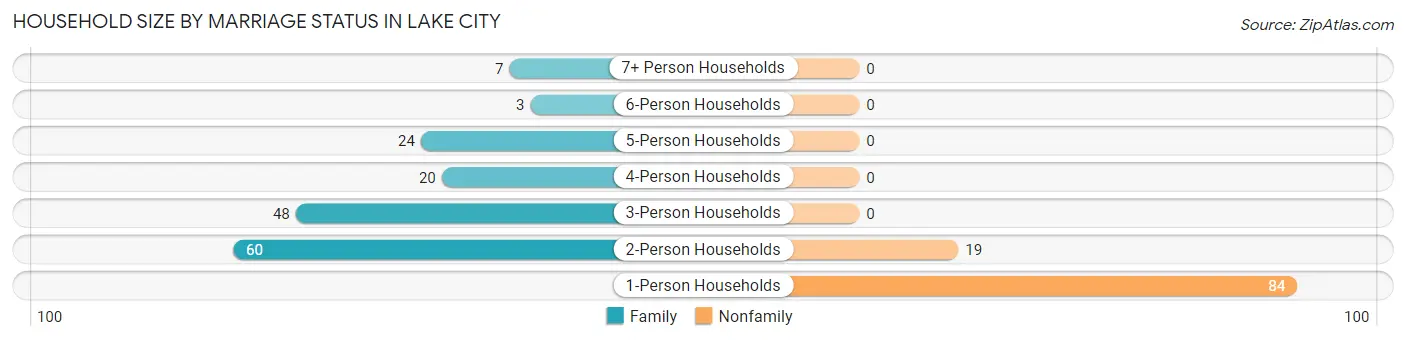
| Household Size | Family Households | Nonfamily Households |
| 1-Person Households | - | 84 (31.7%) |
| 2-Person Households | 60 (22.6%) | 19 (7.2%) |
| 3-Person Households | 48 (18.1%) | 0 (0.0%) |
| 4-Person Households | 20 (7.5%) | 0 (0.0%) |
| 5-Person Households | 24 (9.1%) | 0 (0.0%) |
| 6-Person Households | 3 (1.1%) | 0 (0.0%) |
| 7+ Person Households | 7 (2.6%) | 0 (0.0%) |
| Total | 162 (61.1%) | 103 (38.9%) |
Female Fertility in Lake City
Fertility by Age in Lake City
Average fertility rate in Lake City is 40.0 births per 1,000 women. Women in the age bracket of 20 to 34 years have the highest fertility rate with 68.0 births per 1,000 women. Women in the age bracket of 20 to 34 years acount for 100.0% of all women with births.
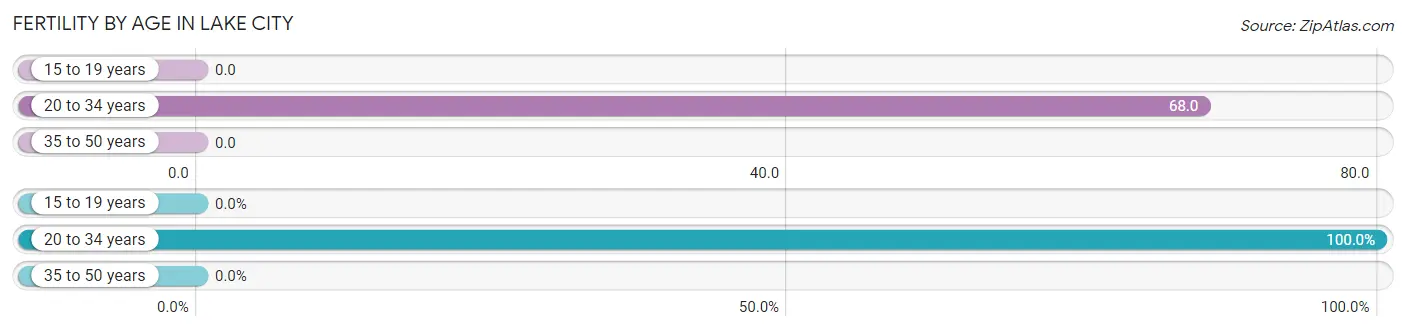
| Age Bracket | Women with Births | Births / 1,000 Women |
| 15 to 19 years | 0 (0.0%) | 0.0 |
| 20 to 34 years | 5 (100.0%) | 68.0 |
| 35 to 50 years | 0 (0.0%) | 0.0 |
| Total | 5 (100.0%) | 40.0 |
Fertility by Age by Marriage Status in Lake City
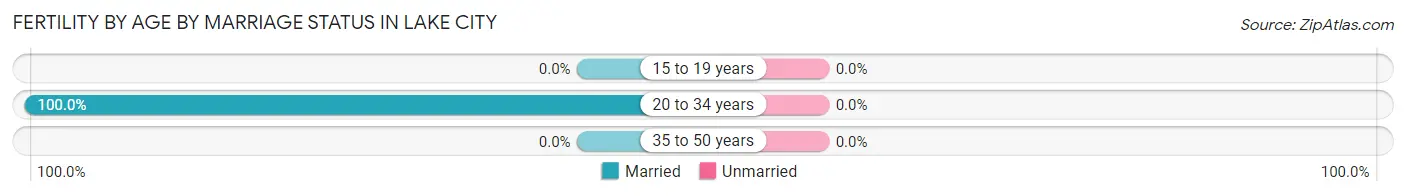
| Age Bracket | Married | Unmarried |
| 15 to 19 years | 0 (0.0%) | 0 (0.0%) |
| 20 to 34 years | 5 (100.0%) | 0 (0.0%) |
| 35 to 50 years | 0 (0.0%) | 0 (0.0%) |
| Total | 5 (100.0%) | 0 (0.0%) |
Fertility by Education in Lake City
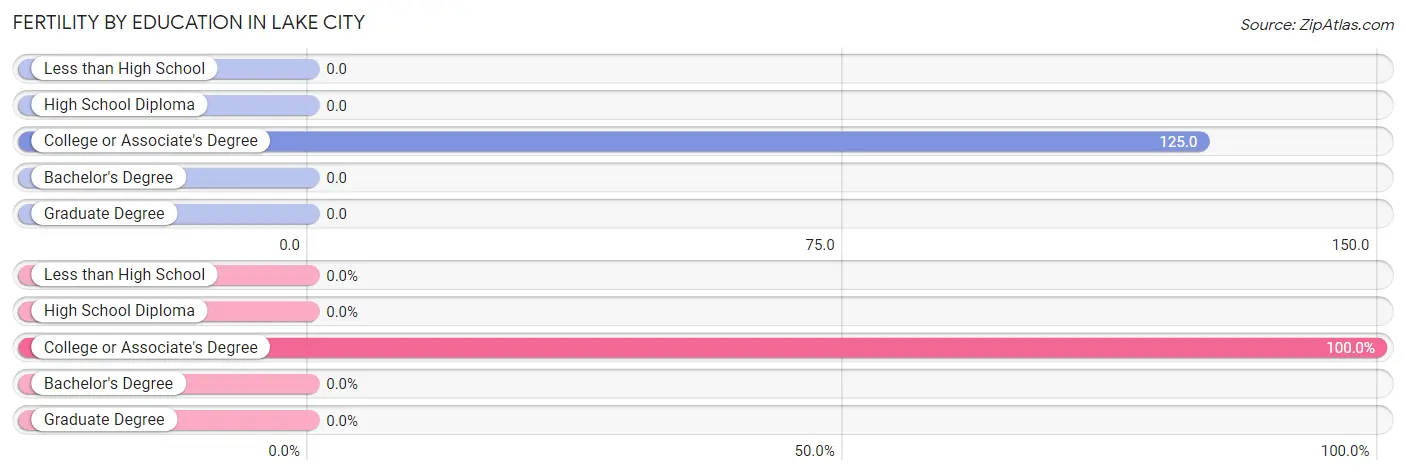
| Educational Attainment | Women with Births | Births / 1,000 Women |
| Less than High School | 0 (0.0%) | 0.0 |
| High School Diploma | 0 (0.0%) | 0.0 |
| College or Associate's Degree | 5 (100.0%) | 125.0 |
| Bachelor's Degree | 0 (0.0%) | 0.0 |
| Graduate Degree | 0 (0.0%) | 0.0 |
| Total | 5 (100.0%) | 40.0 |
Fertility by Education by Marriage Status in Lake City
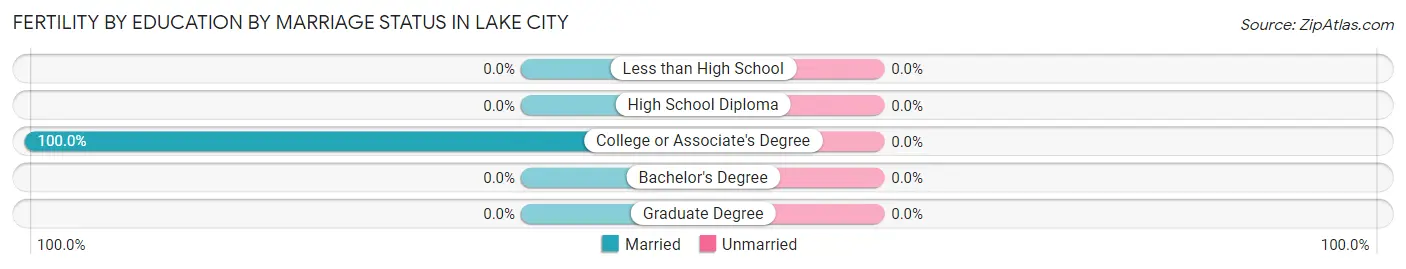
| Educational Attainment | Married | Unmarried |
| Less than High School | 0 (0.0%) | 0 (0.0%) |
| High School Diploma | 0 (0.0%) | 0 (0.0%) |
| College or Associate's Degree | 5 (100.0%) | 0 (0.0%) |
| Bachelor's Degree | 0 (0.0%) | 0 (0.0%) |
| Graduate Degree | 0 (0.0%) | 0 (0.0%) |
| Total | 5 (100.0%) | 0 (0.0%) |
Employment Characteristics in Lake City
Employment by Class of Employer in Lake City
Among the 312 employed individuals in Lake City, private company employees (226 | 72.4%), not-for-profit organizations (27 | 8.6%), and local government employees (22 | 7.0%) make up the most common classes of employment.
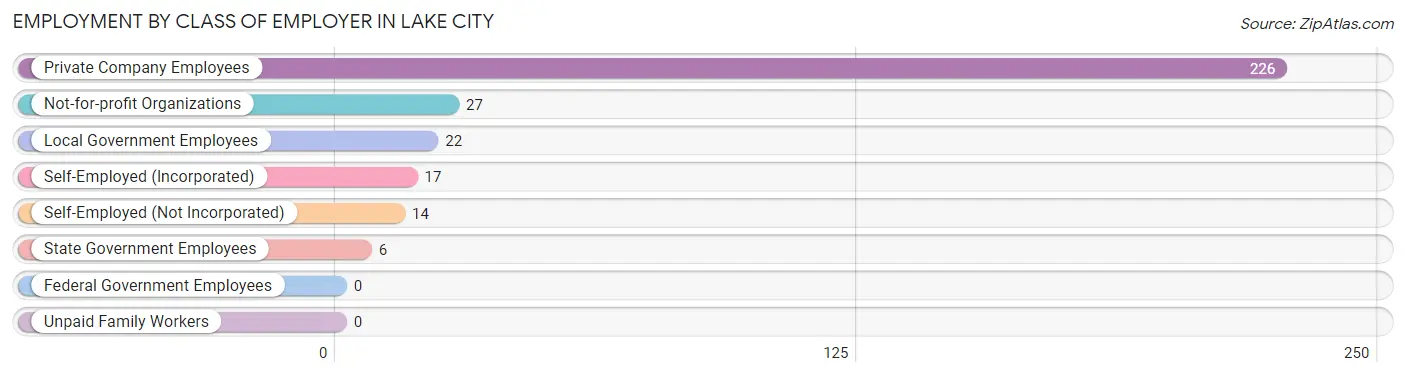
| Employer Class | # Employees | % Employees |
| Private Company Employees | 226 | 72.4% |
| Self-Employed (Incorporated) | 17 | 5.4% |
| Self-Employed (Not Incorporated) | 14 | 4.5% |
| Not-for-profit Organizations | 27 | 8.6% |
| Local Government Employees | 22 | 7.0% |
| State Government Employees | 6 | 1.9% |
| Federal Government Employees | 0 | 0.0% |
| Unpaid Family Workers | 0 | 0.0% |
| Total | 312 | 100.0% |
Employment Status by Age in Lake City
According to the labor force statistics for Lake City, out of the total population over 16 years of age (596), 56.7% or 338 individuals are in the labor force, with 6.8% or 23 of them unemployed. The age group with the highest labor force participation rate is 25 to 29 years, with 98.0% or 50 individuals in the labor force. Within the labor force, the 60 to 64 years age range has the highest percentage of unemployed individuals, with 50.0% or 11 of them being unemployed.
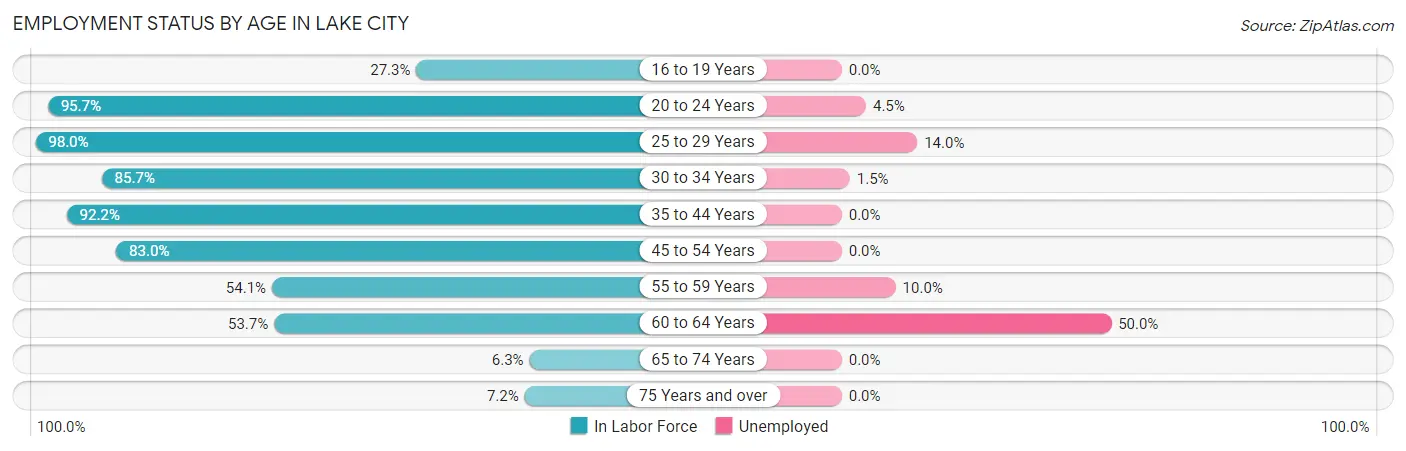
| Age Bracket | In Labor Force | Unemployed |
| 16 to 19 Years | 15 (27.3%) | 0 (0.0%) |
| 20 to 24 Years | 44 (95.7%) | 2 (4.5%) |
| 25 to 29 Years | 50 (98.0%) | 7 (14.0%) |
| 30 to 34 Years | 66 (85.7%) | 1 (1.5%) |
| 35 to 44 Years | 71 (92.2%) | 0 (0.0%) |
| 45 to 54 Years | 39 (83.0%) | 0 (0.0%) |
| 55 to 59 Years | 20 (54.1%) | 2 (10.0%) |
| 60 to 64 Years | 22 (53.7%) | 11 (50.0%) |
| 65 to 74 Years | 6 (6.3%) | 0 (0.0%) |
| 75 Years and over | 5 (7.2%) | 0 (0.0%) |
| Total | 338 (56.7%) | 23 (6.8%) |
Employment Status by Educational Attainment in Lake City
According to labor force statistics for Lake City, 81.2% of individuals (268) out of the total population between 25 and 64 years of age (330) are in the labor force, with 7.8% or 21 of them being unemployed. The group with the highest labor force participation rate are those with the educational attainment of bachelor's degree or higher, with 94.1% or 80 individuals in the labor force. Within the labor force, individuals with less than high school education have the highest percentage of unemployment, with 40.0% or 4 of them being unemployed.
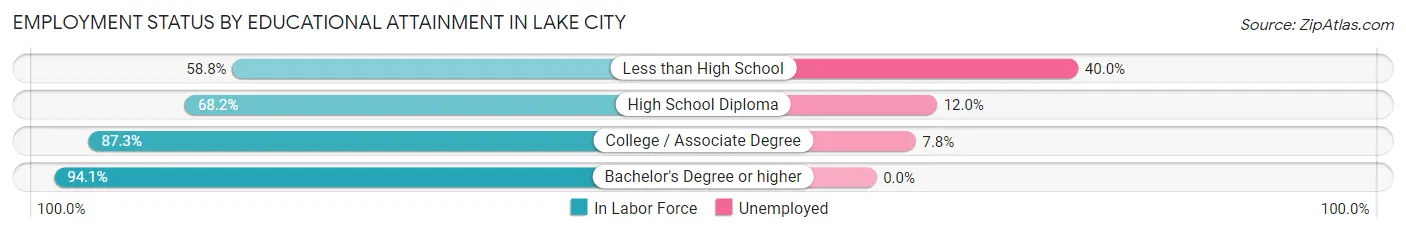
| Educational Attainment | In Labor Force | Unemployed |
| Less than High School | 10 (58.8%) | 7 (40.0%) |
| High School Diploma | 75 (68.2%) | 13 (12.0%) |
| College / Associate Degree | 103 (87.3%) | 9 (7.8%) |
| Bachelor's Degree or higher | 80 (94.1%) | 0 (0.0%) |
| Total | 268 (81.2%) | 26 (7.8%) |
Employment Occupations by Sex in Lake City
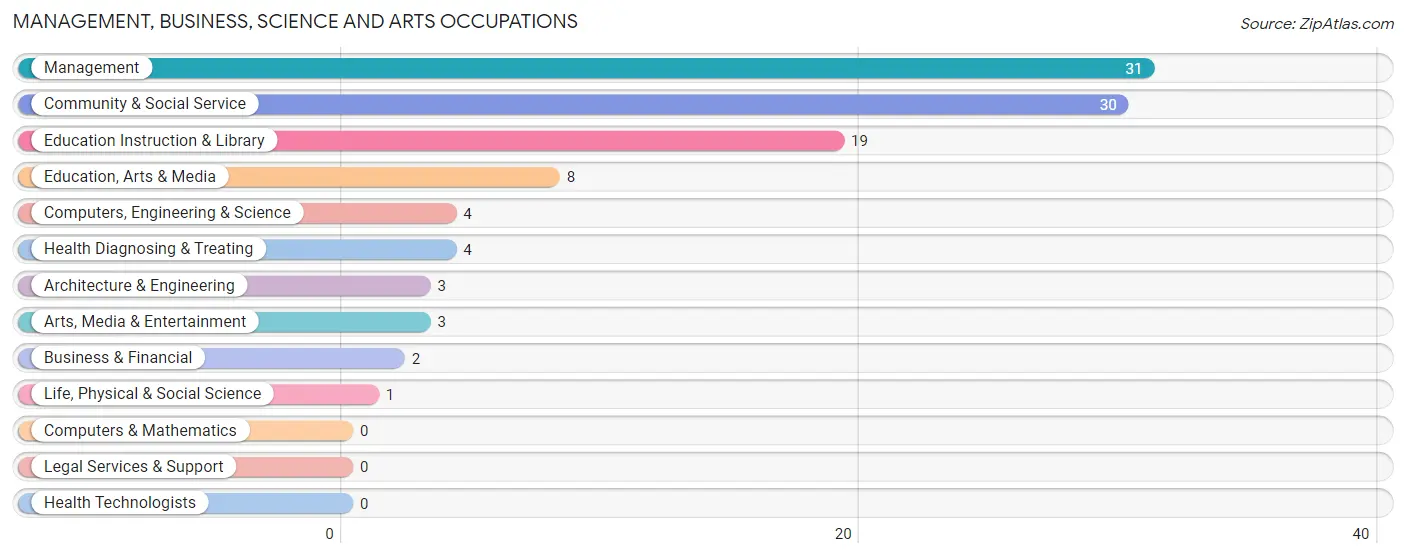
Management, Business, Science and Arts Occupations
The most common Management, Business, Science and Arts occupations in Lake City are Management (31 | 9.8%), Community & Social Service (30 | 9.5%), Education Instruction & Library (19 | 6.0%), Education, Arts & Media (8 | 2.5%), and Computers, Engineering & Science (4 | 1.3%).
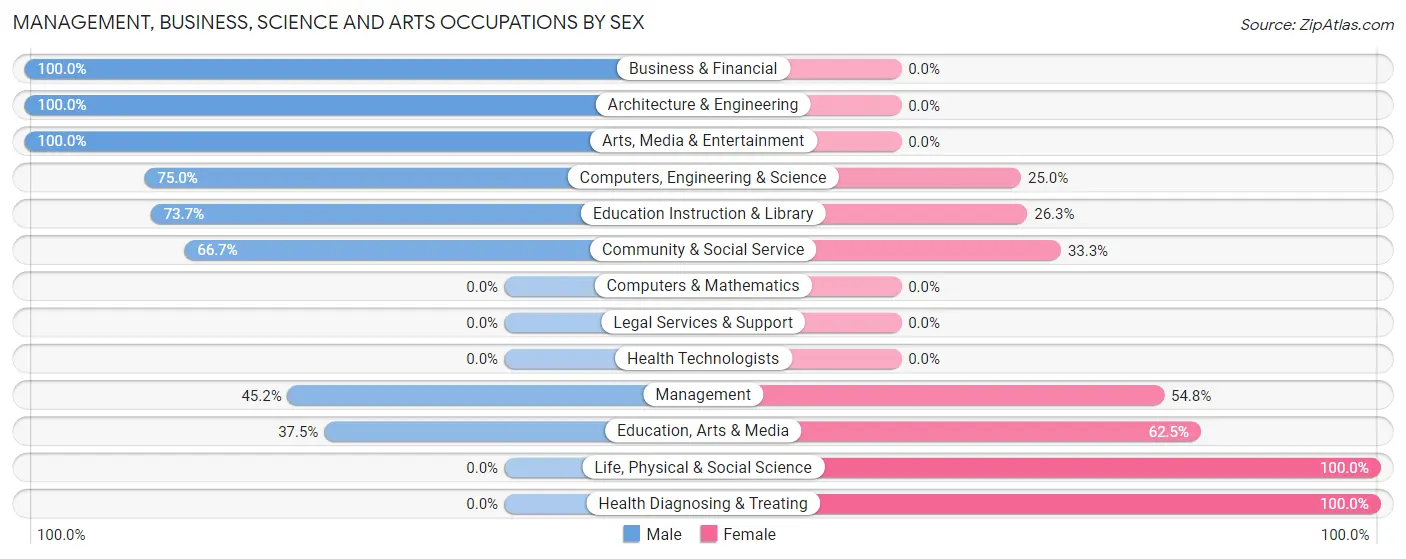
Management, Business, Science and Arts Occupations by Sex
Within the Management, Business, Science and Arts occupations in Lake City, the most male-oriented occupations are Business & Financial (100.0%), Architecture & Engineering (100.0%), and Arts, Media & Entertainment (100.0%), while the most female-oriented occupations are Life, Physical & Social Science (100.0%), Health Diagnosing & Treating (100.0%), and Education, Arts & Media (62.5%).
| Occupation | Male | Female |
| Management | 14 (45.2%) | 17 (54.8%) |
| Business & Financial | 2 (100.0%) | 0 (0.0%) |
| Computers, Engineering & Science | 3 (75.0%) | 1 (25.0%) |
| Computers & Mathematics | 0 (0.0%) | 0 (0.0%) |
| Architecture & Engineering | 3 (100.0%) | 0 (0.0%) |
| Life, Physical & Social Science | 0 (0.0%) | 1 (100.0%) |
| Community & Social Service | 20 (66.7%) | 10 (33.3%) |
| Education, Arts & Media | 3 (37.5%) | 5 (62.5%) |
| Legal Services & Support | 0 (0.0%) | 0 (0.0%) |
| Education Instruction & Library | 14 (73.7%) | 5 (26.3%) |
| Arts, Media & Entertainment | 3 (100.0%) | 0 (0.0%) |
| Health Diagnosing & Treating | 0 (0.0%) | 4 (100.0%) |
| Health Technologists | 0 (0.0%) | 0 (0.0%) |
| Total (Category) | 39 (54.9%) | 32 (45.1%) |
| Total (Overall) | 184 (58.4%) | 131 (41.6%) |
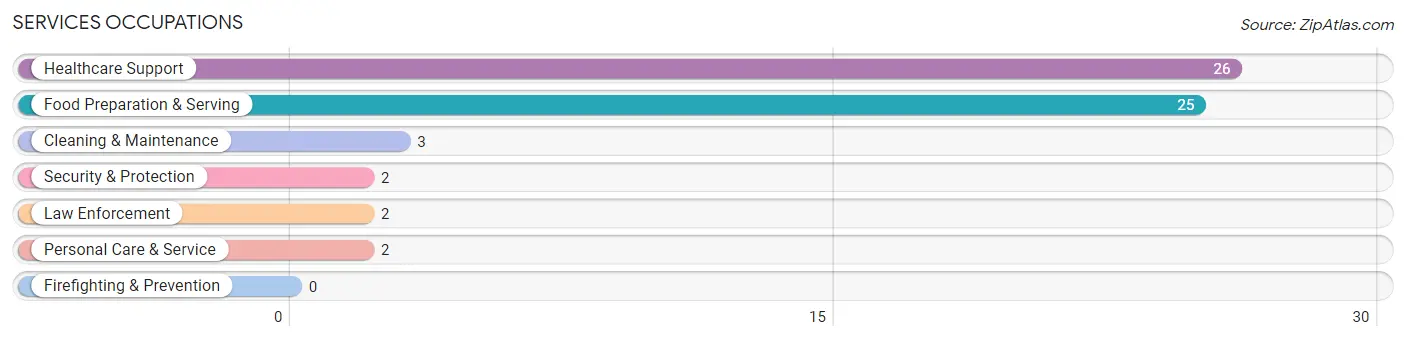
Services Occupations
The most common Services occupations in Lake City are Healthcare Support (26 | 8.3%), Food Preparation & Serving (25 | 7.9%), Cleaning & Maintenance (3 | 0.9%), Security & Protection (2 | 0.6%), and Law Enforcement (2 | 0.6%).
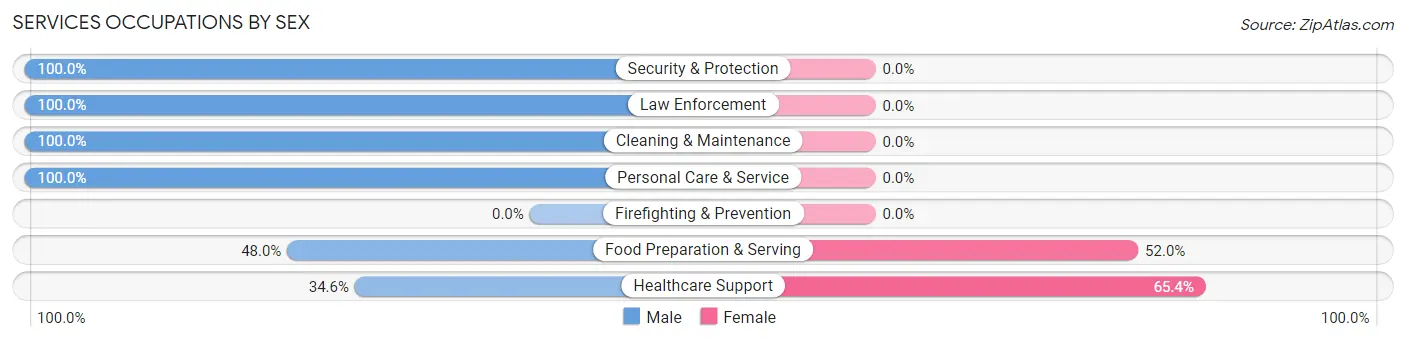
Services Occupations by Sex
Within the Services occupations in Lake City, the most male-oriented occupations are Security & Protection (100.0%), Law Enforcement (100.0%), and Cleaning & Maintenance (100.0%), while the most female-oriented occupations are Healthcare Support (65.4%), and Food Preparation & Serving (52.0%).
| Occupation | Male | Female |
| Healthcare Support | 9 (34.6%) | 17 (65.4%) |
| Security & Protection | 2 (100.0%) | 0 (0.0%) |
| Firefighting & Prevention | 0 (0.0%) | 0 (0.0%) |
| Law Enforcement | 2 (100.0%) | 0 (0.0%) |
| Food Preparation & Serving | 12 (48.0%) | 13 (52.0%) |
| Cleaning & Maintenance | 3 (100.0%) | 0 (0.0%) |
| Personal Care & Service | 2 (100.0%) | 0 (0.0%) |
| Total (Category) | 28 (48.3%) | 30 (51.7%) |
| Total (Overall) | 184 (58.4%) | 131 (41.6%) |
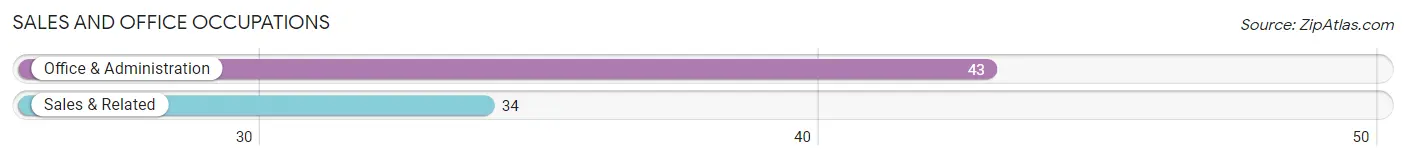
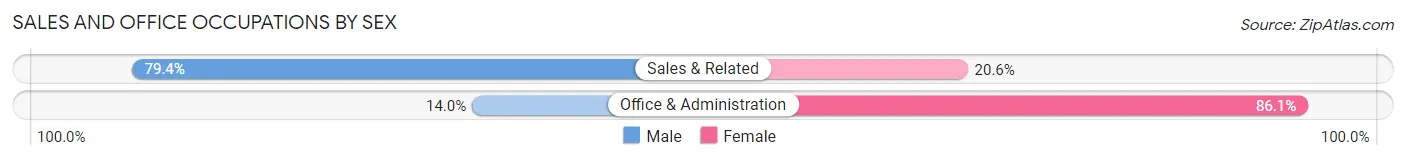
Sales and Office Occupations
The most common Sales and Office occupations in Lake City are Office & Administration (43 | 13.7%), and Sales & Related (34 | 10.8%).
Sales and Office Occupations by Sex
| Occupation | Male | Female |
| Sales & Related | 27 (79.4%) | 7 (20.6%) |
| Office & Administration | 6 (14.0%) | 37 (86.1%) |
| Total (Category) | 33 (42.9%) | 44 (57.1%) |
| Total (Overall) | 184 (58.4%) | 131 (41.6%) |
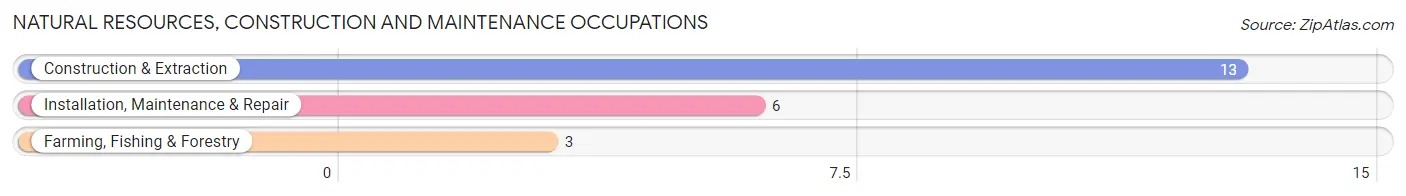
Natural Resources, Construction and Maintenance Occupations
The most common Natural Resources, Construction and Maintenance occupations in Lake City are Construction & Extraction (13 | 4.1%), Installation, Maintenance & Repair (6 | 1.9%), and Farming, Fishing & Forestry (3 | 0.9%).
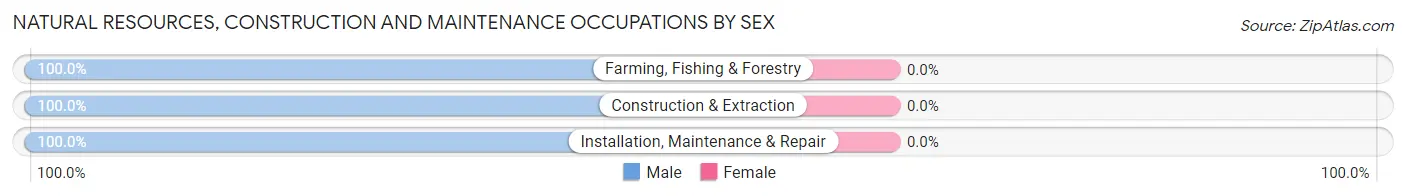
Natural Resources, Construction and Maintenance Occupations by Sex
| Occupation | Male | Female |
| Farming, Fishing & Forestry | 3 (100.0%) | 0 (0.0%) |
| Construction & Extraction | 13 (100.0%) | 0 (0.0%) |
| Installation, Maintenance & Repair | 6 (100.0%) | 0 (0.0%) |
| Total (Category) | 22 (100.0%) | 0 (0.0%) |
| Total (Overall) | 184 (58.4%) | 131 (41.6%) |
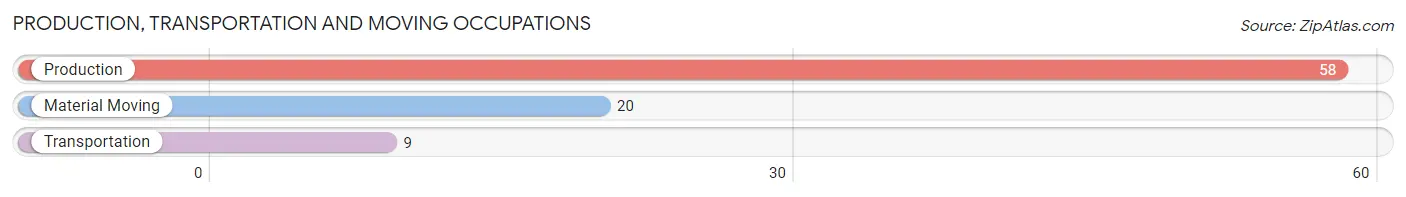
Production, Transportation and Moving Occupations
The most common Production, Transportation and Moving occupations in Lake City are Production (58 | 18.4%), Material Moving (20 | 6.4%), and Transportation (9 | 2.9%).
Production, Transportation and Moving Occupations by Sex
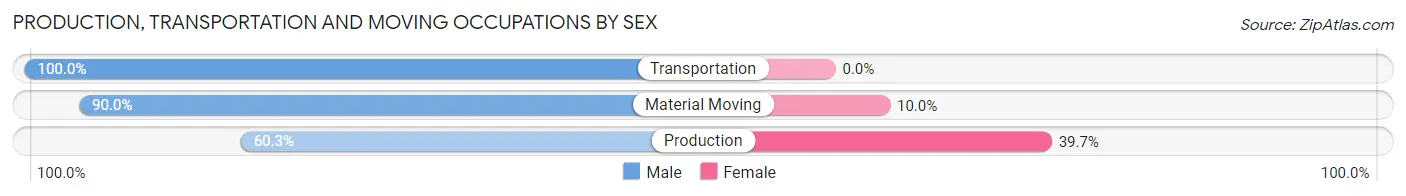
| Occupation | Male | Female |
| Production | 35 (60.3%) | 23 (39.7%) |
| Transportation | 9 (100.0%) | 0 (0.0%) |
| Material Moving | 18 (90.0%) | 2 (10.0%) |
| Total (Category) | 62 (71.3%) | 25 (28.7%) |
| Total (Overall) | 184 (58.4%) | 131 (41.6%) |
Employment Industries by Sex in Lake City
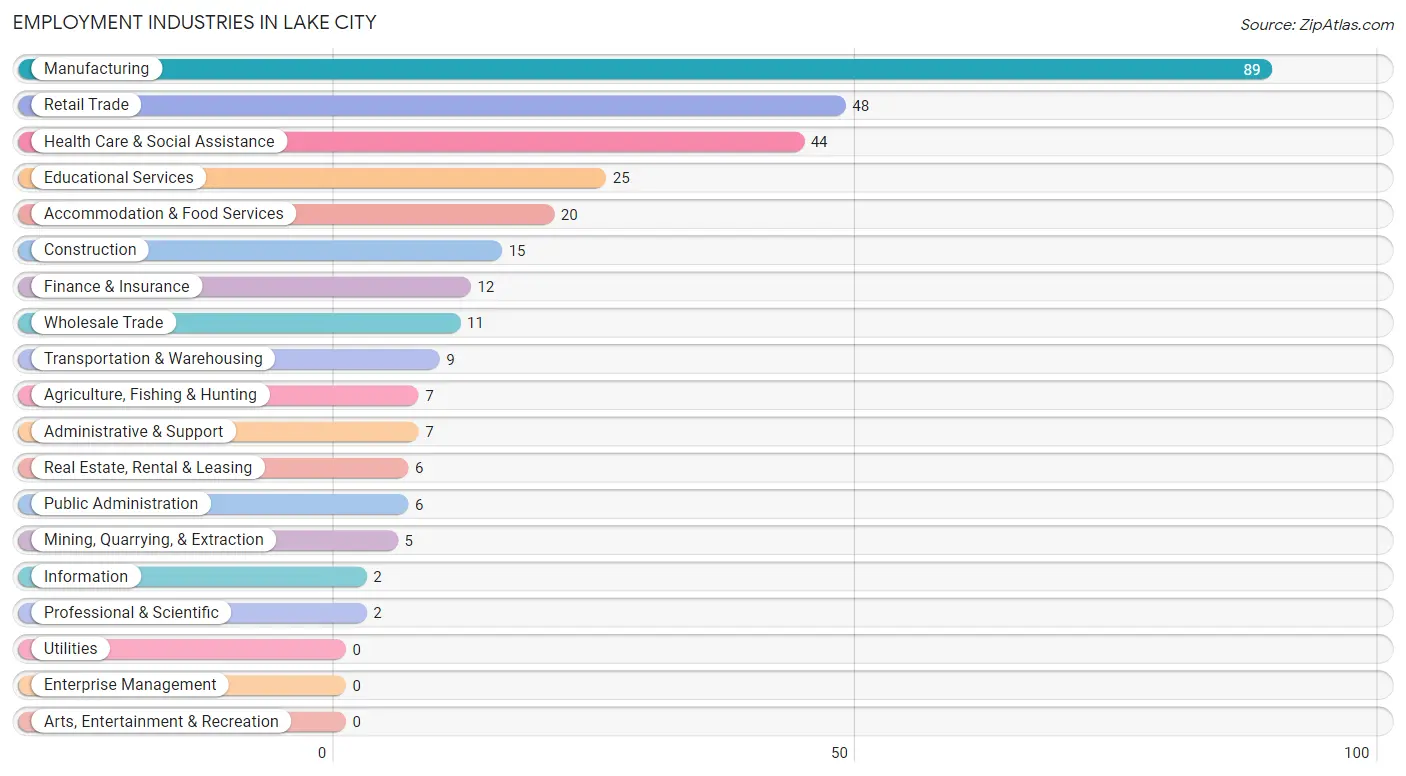
Employment Industries in Lake City
The major employment industries in Lake City include Manufacturing (89 | 28.2%), Retail Trade (48 | 15.2%), Health Care & Social Assistance (44 | 14.0%), Educational Services (25 | 7.9%), and Accommodation & Food Services (20 | 6.4%).
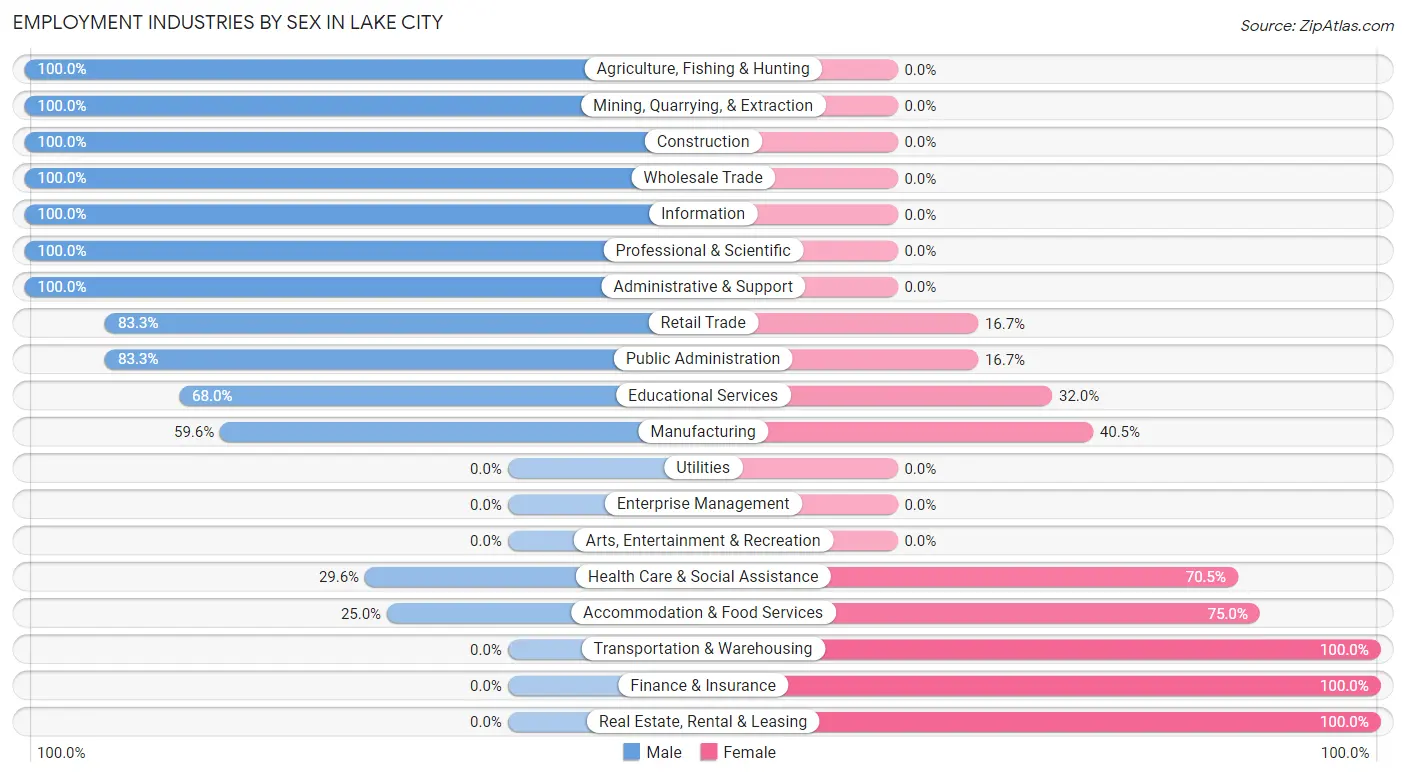
Employment Industries by Sex in Lake City
The Lake City industries that see more men than women are Agriculture, Fishing & Hunting (100.0%), Mining, Quarrying, & Extraction (100.0%), and Construction (100.0%), whereas the industries that tend to have a higher number of women are Transportation & Warehousing (100.0%), Finance & Insurance (100.0%), and Real Estate, Rental & Leasing (100.0%).
| Industry | Male | Female |
| Agriculture, Fishing & Hunting | 7 (100.0%) | 0 (0.0%) |
| Mining, Quarrying, & Extraction | 5 (100.0%) | 0 (0.0%) |
| Construction | 15 (100.0%) | 0 (0.0%) |
| Manufacturing | 53 (59.6%) | 36 (40.5%) |
| Wholesale Trade | 11 (100.0%) | 0 (0.0%) |
| Retail Trade | 40 (83.3%) | 8 (16.7%) |
| Transportation & Warehousing | 0 (0.0%) | 9 (100.0%) |
| Utilities | 0 (0.0%) | 0 (0.0%) |
| Information | 2 (100.0%) | 0 (0.0%) |
| Finance & Insurance | 0 (0.0%) | 12 (100.0%) |
| Real Estate, Rental & Leasing | 0 (0.0%) | 6 (100.0%) |
| Professional & Scientific | 2 (100.0%) | 0 (0.0%) |
| Enterprise Management | 0 (0.0%) | 0 (0.0%) |
| Administrative & Support | 7 (100.0%) | 0 (0.0%) |
| Educational Services | 17 (68.0%) | 8 (32.0%) |
| Health Care & Social Assistance | 13 (29.5%) | 31 (70.5%) |
| Arts, Entertainment & Recreation | 0 (0.0%) | 0 (0.0%) |
| Accommodation & Food Services | 5 (25.0%) | 15 (75.0%) |
| Public Administration | 5 (83.3%) | 1 (16.7%) |
| Total | 184 (58.4%) | 131 (41.6%) |
Education in Lake City
School Enrollment in Lake City
The most common levels of schooling among the 146 students in Lake City are high school (55 | 37.7%), elementary school (32 | 21.9%), and middle school (26 | 17.8%).
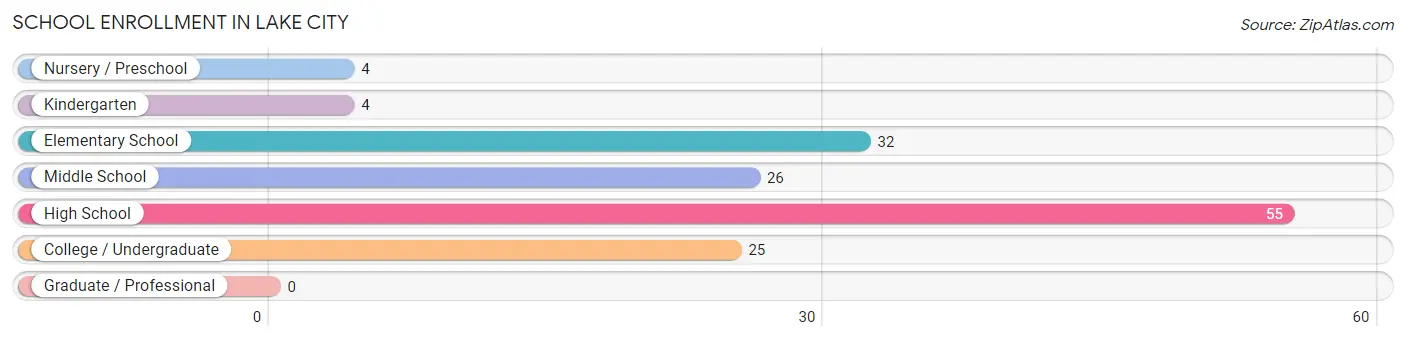
| School Level | # Students | % Students |
| Nursery / Preschool | 4 | 2.7% |
| Kindergarten | 4 | 2.7% |
| Elementary School | 32 | 21.9% |
| Middle School | 26 | 17.8% |
| High School | 55 | 37.7% |
| College / Undergraduate | 25 | 17.1% |
| Graduate / Professional | 0 | 0.0% |
| Total | 146 | 100.0% |
School Enrollment by Age by Funding Source in Lake City
Out of a total of 146 students who are enrolled in schools in Lake City, 10 (6.8%) attend a private institution, while the remaining 136 (93.2%) are enrolled in public schools. The age group of 25 to 34 year olds has the highest likelihood of being enrolled in private schools, with 6 (46.2% in the age bracket) enrolled. Conversely, the age group of 3 to 4 year olds has the lowest likelihood of being enrolled in a private school, with 4 (100.0% in the age bracket) attending a public institution.
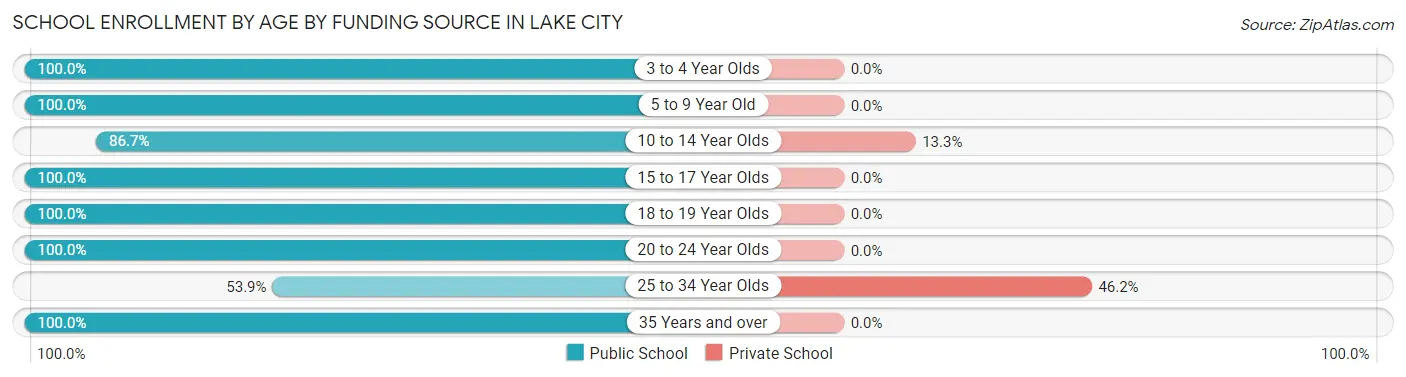
| Age Bracket | Public School | Private School |
| 3 to 4 Year Olds | 4 (100.0%) | 0 (0.0%) |
| 5 to 9 Year Old | 32 (100.0%) | 0 (0.0%) |
| 10 to 14 Year Olds | 26 (86.7%) | 4 (13.3%) |
| 15 to 17 Year Olds | 48 (100.0%) | 0 (0.0%) |
| 18 to 19 Year Olds | 9 (100.0%) | 0 (0.0%) |
| 20 to 24 Year Olds | 4 (100.0%) | 0 (0.0%) |
| 25 to 34 Year Olds | 7 (53.8%) | 6 (46.2%) |
| 35 Years and over | 6 (100.0%) | 0 (0.0%) |
| Total | 136 (93.2%) | 10 (6.8%) |
Educational Attainment by Field of Study in Lake City
Education (45 | 33.1%), arts & humanities (22 | 16.2%), business (19 | 14.0%), social sciences (11 | 8.1%), and science & technology (10 | 7.3%) are the most common fields of study among 136 individuals in Lake City who have obtained a bachelor's degree or higher.
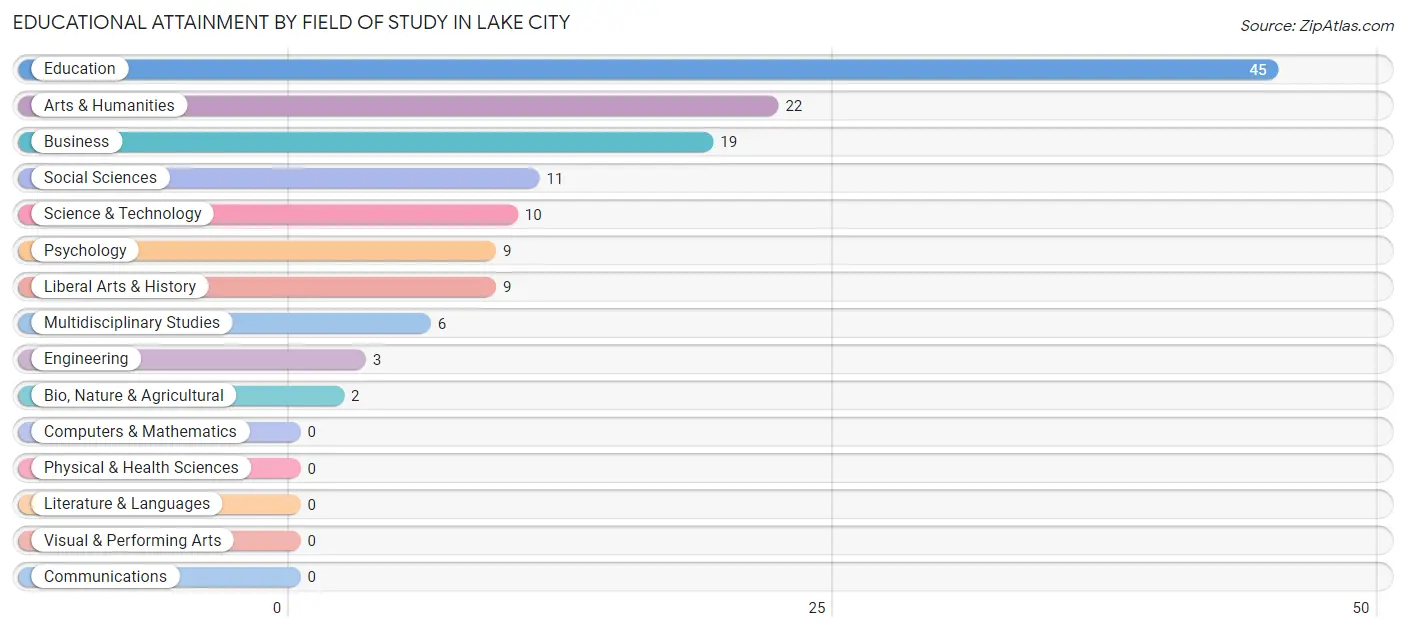
| Field of Study | # Graduates | % Graduates |
| Computers & Mathematics | 0 | 0.0% |
| Bio, Nature & Agricultural | 2 | 1.5% |
| Physical & Health Sciences | 0 | 0.0% |
| Psychology | 9 | 6.6% |
| Social Sciences | 11 | 8.1% |
| Engineering | 3 | 2.2% |
| Multidisciplinary Studies | 6 | 4.4% |
| Science & Technology | 10 | 7.3% |
| Business | 19 | 14.0% |
| Education | 45 | 33.1% |
| Literature & Languages | 0 | 0.0% |
| Liberal Arts & History | 9 | 6.6% |
| Visual & Performing Arts | 0 | 0.0% |
| Communications | 0 | 0.0% |
| Arts & Humanities | 22 | 16.2% |
| Total | 136 | 100.0% |
Transportation & Commute in Lake City
Vehicle Availability by Sex in Lake City
The most prevalent vehicle ownership categories in Lake City are males with 2 vehicles (72, accounting for 39.1%) and females with 2 vehicles (69, making up 56.2%).
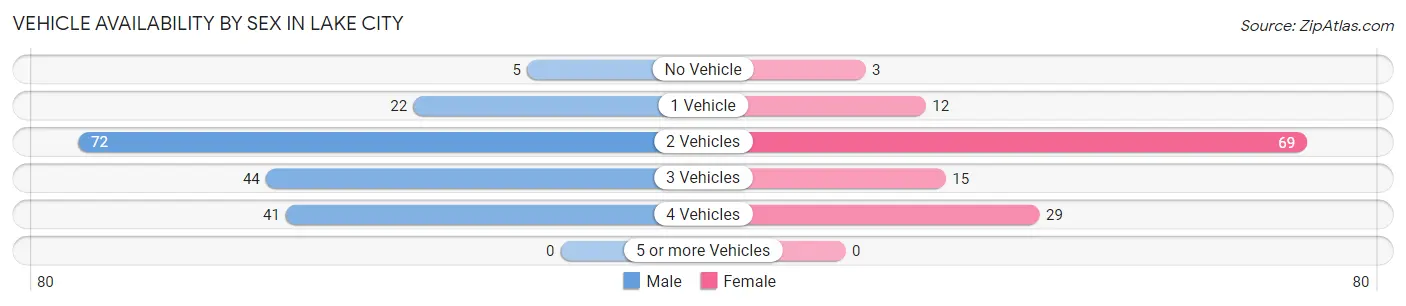
| Vehicles Available | Male | Female |
| No Vehicle | 5 (2.7%) | 3 (2.3%) |
| 1 Vehicle | 22 (12.0%) | 12 (9.4%) |
| 2 Vehicles | 72 (39.1%) | 69 (53.9%) |
| 3 Vehicles | 44 (23.9%) | 15 (11.7%) |
| 4 Vehicles | 41 (22.3%) | 29 (22.7%) |
| 5 or more Vehicles | 0 (0.0%) | 0 (0.0%) |
| Total | 184 (100.0%) | 128 (100.0%) |
Commute Time in Lake City
The most frequently occuring commute durations in Lake City are 20 to 24 minutes (80 commuters, 25.9%), less than 5 minutes (55 commuters, 17.8%), and 15 to 19 minutes (51 commuters, 16.5%).
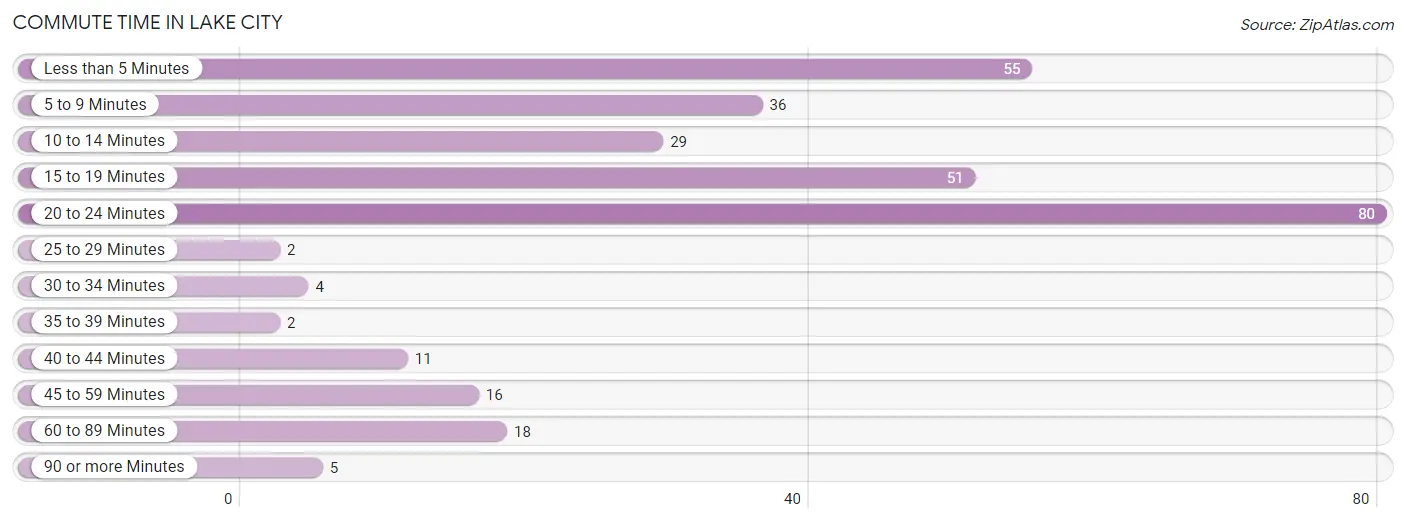
| Commute Time | # Commuters | % Commuters |
| Less than 5 Minutes | 55 | 17.8% |
| 5 to 9 Minutes | 36 | 11.7% |
| 10 to 14 Minutes | 29 | 9.4% |
| 15 to 19 Minutes | 51 | 16.5% |
| 20 to 24 Minutes | 80 | 25.9% |
| 25 to 29 Minutes | 2 | 0.6% |
| 30 to 34 Minutes | 4 | 1.3% |
| 35 to 39 Minutes | 2 | 0.6% |
| 40 to 44 Minutes | 11 | 3.6% |
| 45 to 59 Minutes | 16 | 5.2% |
| 60 to 89 Minutes | 18 | 5.8% |
| 90 or more Minutes | 5 | 1.6% |
Commute Time by Sex in Lake City
The most common commute times in Lake City are 20 to 24 minutes (42 commuters, 23.2%) for males and 20 to 24 minutes (38 commuters, 29.7%) for females.
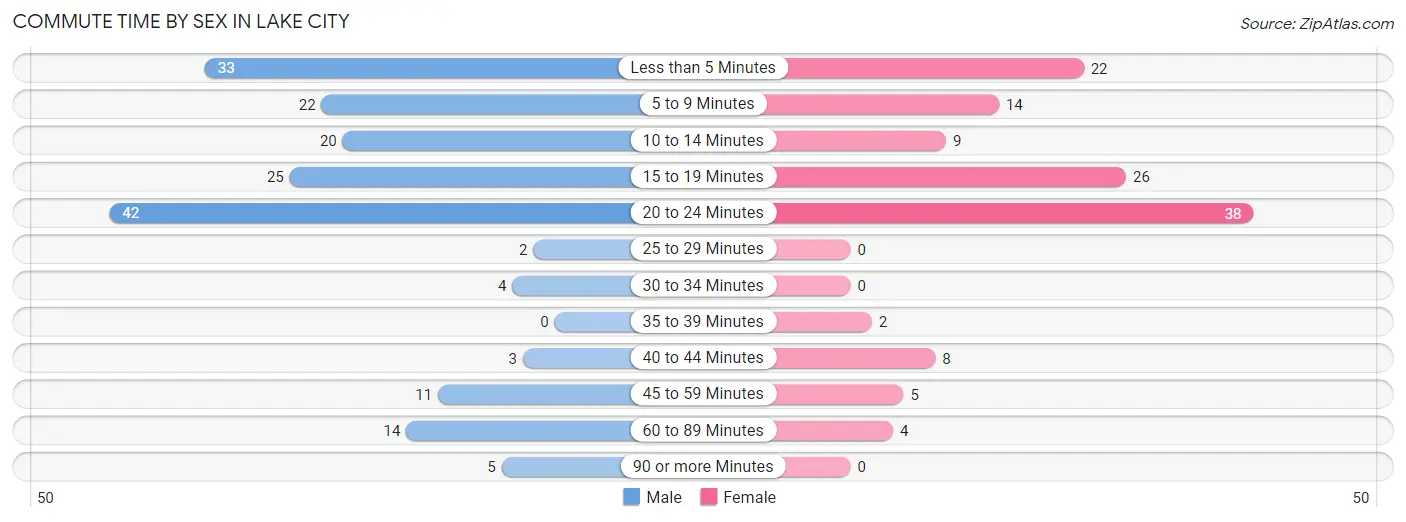
| Commute Time | Male | Female |
| Less than 5 Minutes | 33 (18.2%) | 22 (17.2%) |
| 5 to 9 Minutes | 22 (12.1%) | 14 (10.9%) |
| 10 to 14 Minutes | 20 (11.1%) | 9 (7.0%) |
| 15 to 19 Minutes | 25 (13.8%) | 26 (20.3%) |
| 20 to 24 Minutes | 42 (23.2%) | 38 (29.7%) |
| 25 to 29 Minutes | 2 (1.1%) | 0 (0.0%) |
| 30 to 34 Minutes | 4 (2.2%) | 0 (0.0%) |
| 35 to 39 Minutes | 0 (0.0%) | 2 (1.6%) |
| 40 to 44 Minutes | 3 (1.7%) | 8 (6.2%) |
| 45 to 59 Minutes | 11 (6.1%) | 5 (3.9%) |
| 60 to 89 Minutes | 14 (7.7%) | 4 (3.1%) |
| 90 or more Minutes | 5 (2.8%) | 0 (0.0%) |
Time of Departure to Work by Sex in Lake City
The most frequent times of departure to work in Lake City are 7:00 AM to 7:29 AM (31, 17.1%) for males and 8:00 AM to 8:29 AM (29, 22.7%) for females.
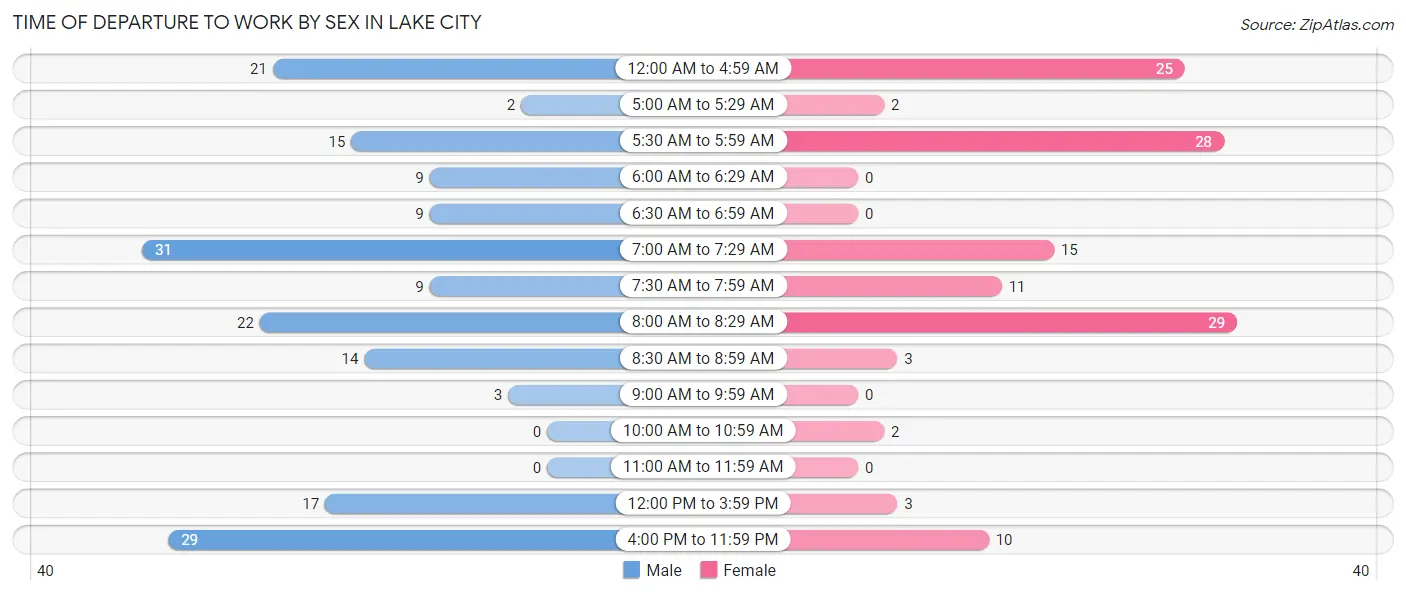
| Time of Departure | Male | Female |
| 12:00 AM to 4:59 AM | 21 (11.6%) | 25 (19.5%) |
| 5:00 AM to 5:29 AM | 2 (1.1%) | 2 (1.6%) |
| 5:30 AM to 5:59 AM | 15 (8.3%) | 28 (21.9%) |
| 6:00 AM to 6:29 AM | 9 (5.0%) | 0 (0.0%) |
| 6:30 AM to 6:59 AM | 9 (5.0%) | 0 (0.0%) |
| 7:00 AM to 7:29 AM | 31 (17.1%) | 15 (11.7%) |
| 7:30 AM to 7:59 AM | 9 (5.0%) | 11 (8.6%) |
| 8:00 AM to 8:29 AM | 22 (12.1%) | 29 (22.7%) |
| 8:30 AM to 8:59 AM | 14 (7.7%) | 3 (2.3%) |
| 9:00 AM to 9:59 AM | 3 (1.7%) | 0 (0.0%) |
| 10:00 AM to 10:59 AM | 0 (0.0%) | 2 (1.6%) |
| 11:00 AM to 11:59 AM | 0 (0.0%) | 0 (0.0%) |
| 12:00 PM to 3:59 PM | 17 (9.4%) | 3 (2.3%) |
| 4:00 PM to 11:59 PM | 29 (16.0%) | 10 (7.8%) |
| Total | 181 (100.0%) | 128 (100.0%) |
Housing Occupancy in Lake City
Occupancy by Ownership in Lake City
Of the total 265 dwellings in Lake City, owner-occupied units account for 201 (75.8%), while renter-occupied units make up 64 (24.1%).
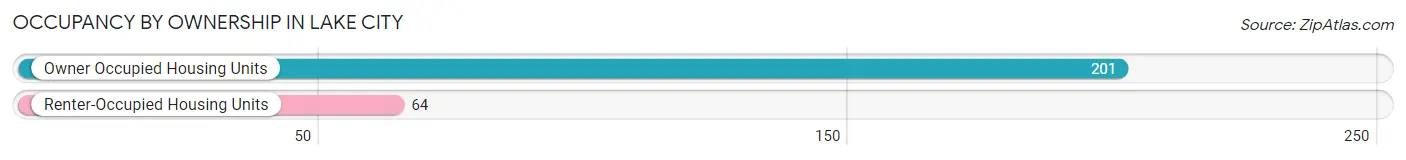
| Occupancy | # Housing Units | % Housing Units |
| Owner Occupied Housing Units | 201 | 75.8% |
| Renter-Occupied Housing Units | 64 | 24.1% |
| Total Occupied Housing Units | 265 | 100.0% |
Occupancy by Household Size in Lake City
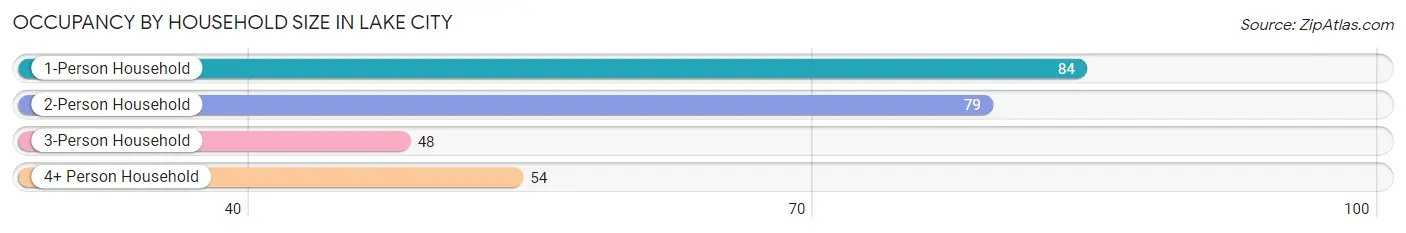
| Household Size | # Housing Units | % Housing Units |
| 1-Person Household | 84 | 31.7% |
| 2-Person Household | 79 | 29.8% |
| 3-Person Household | 48 | 18.1% |
| 4+ Person Household | 54 | 20.4% |
| Total Housing Units | 265 | 100.0% |
Occupancy by Ownership by Household Size in Lake City
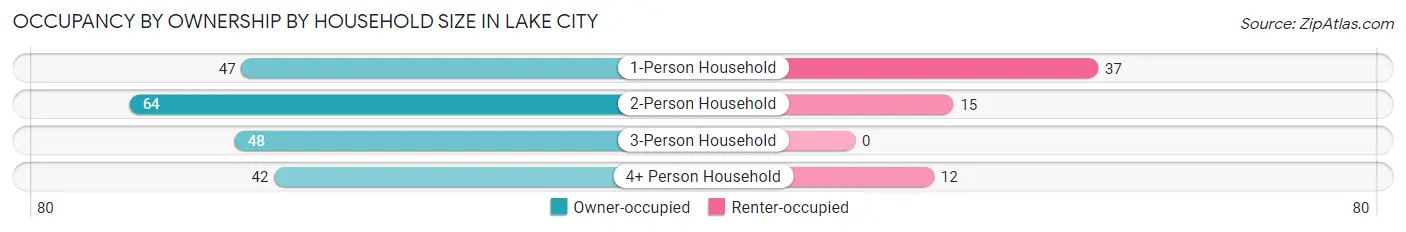
| Household Size | Owner-occupied | Renter-occupied |
| 1-Person Household | 47 (55.9%) | 37 (44.1%) |
| 2-Person Household | 64 (81.0%) | 15 (19.0%) |
| 3-Person Household | 48 (100.0%) | 0 (0.0%) |
| 4+ Person Household | 42 (77.8%) | 12 (22.2%) |
| Total Housing Units | 201 (75.8%) | 64 (24.1%) |
Occupancy by Educational Attainment in Lake City
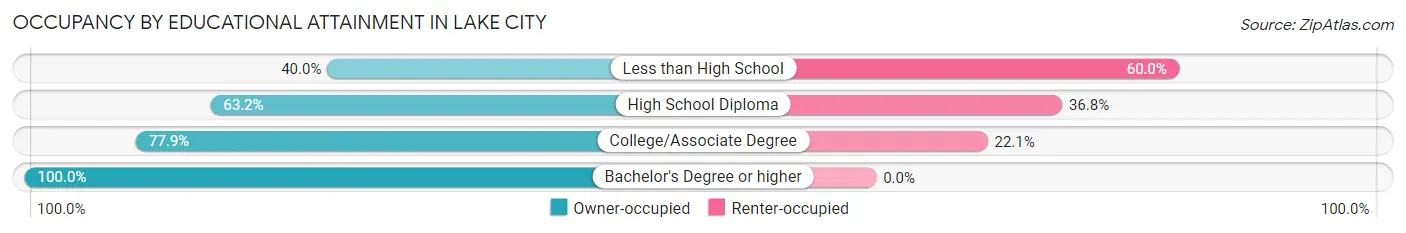
| Household Size | Owner-occupied | Renter-occupied |
| Less than High School | 8 (40.0%) | 12 (60.0%) |
| High School Diploma | 60 (63.2%) | 35 (36.8%) |
| College/Associate Degree | 60 (77.9%) | 17 (22.1%) |
| Bachelor's Degree or higher | 73 (100.0%) | 0 (0.0%) |
Occupancy by Age of Householder in Lake City
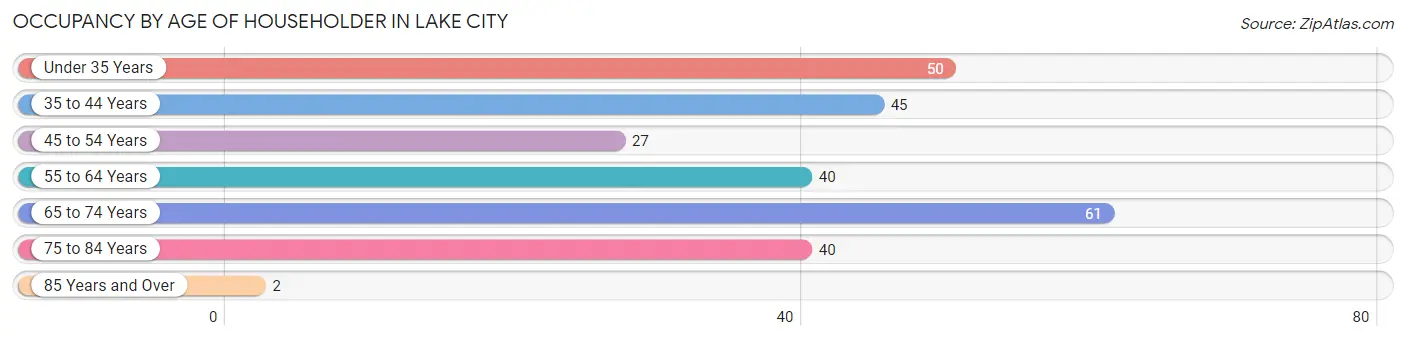
| Age Bracket | # Households | % Households |
| Under 35 Years | 50 | 18.9% |
| 35 to 44 Years | 45 | 17.0% |
| 45 to 54 Years | 27 | 10.2% |
| 55 to 64 Years | 40 | 15.1% |
| 65 to 74 Years | 61 | 23.0% |
| 75 to 84 Years | 40 | 15.1% |
| 85 Years and Over | 2 | 0.7% |
| Total | 265 | 100.0% |
Housing Finances in Lake City
Median Income by Occupancy in Lake City
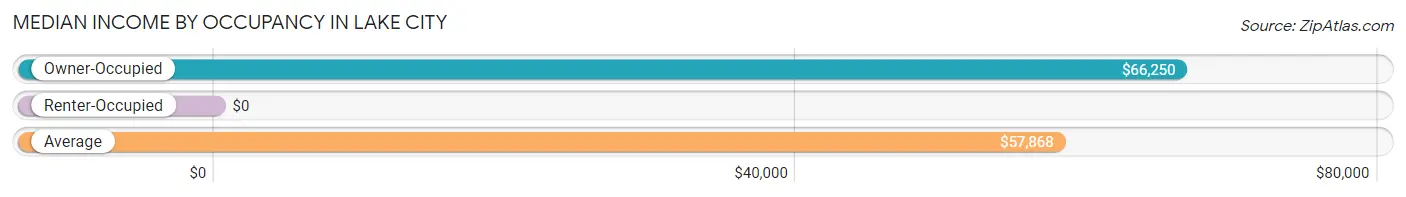
| Occupancy Type | # Households | Median Income |
| Owner-Occupied | 201 (75.8%) | $66,250 |
| Renter-Occupied | 64 (24.1%) | $0 |
| Average | 265 (100.0%) | $57,868 |
Occupancy by Householder Income Bracket in Lake City
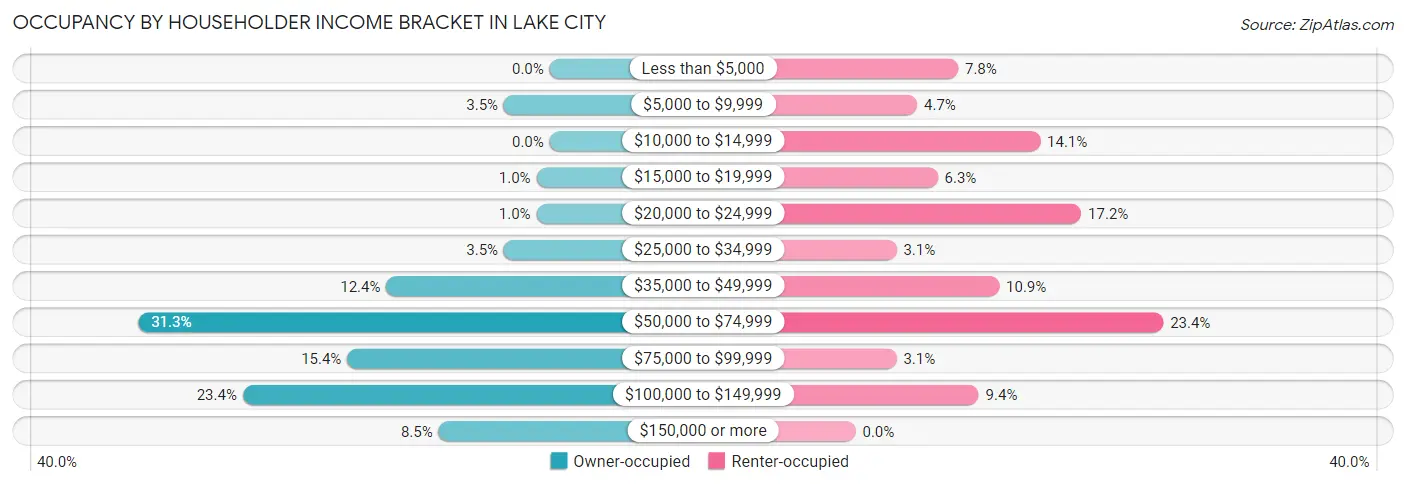
| Income Bracket | Owner-occupied | Renter-occupied |
| Less than $5,000 | 0 (0.0%) | 5 (7.8%) |
| $5,000 to $9,999 | 7 (3.5%) | 3 (4.7%) |
| $10,000 to $14,999 | 0 (0.0%) | 9 (14.1%) |
| $15,000 to $19,999 | 2 (1.0%) | 4 (6.2%) |
| $20,000 to $24,999 | 2 (1.0%) | 11 (17.2%) |
| $25,000 to $34,999 | 7 (3.5%) | 2 (3.1%) |
| $35,000 to $49,999 | 25 (12.4%) | 7 (10.9%) |
| $50,000 to $74,999 | 63 (31.3%) | 15 (23.4%) |
| $75,000 to $99,999 | 31 (15.4%) | 2 (3.1%) |
| $100,000 to $149,999 | 47 (23.4%) | 6 (9.4%) |
| $150,000 or more | 17 (8.5%) | 0 (0.0%) |
| Total | 201 (100.0%) | 64 (100.0%) |
Monthly Housing Cost Tiers in Lake City
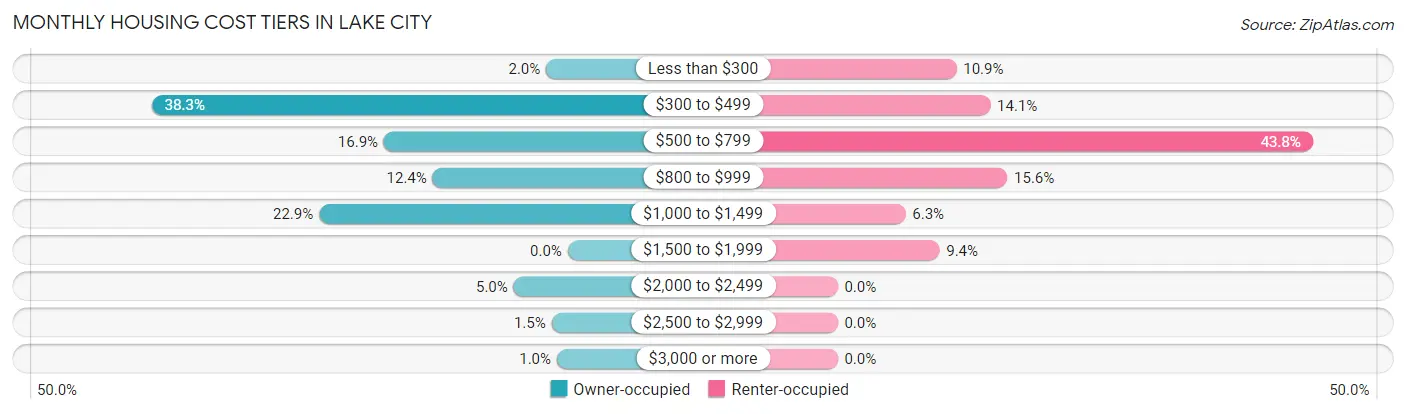
| Monthly Cost | Owner-occupied | Renter-occupied |
| Less than $300 | 4 (2.0%) | 7 (10.9%) |
| $300 to $499 | 77 (38.3%) | 9 (14.1%) |
| $500 to $799 | 34 (16.9%) | 28 (43.8%) |
| $800 to $999 | 25 (12.4%) | 10 (15.6%) |
| $1,000 to $1,499 | 46 (22.9%) | 4 (6.2%) |
| $1,500 to $1,999 | 0 (0.0%) | 6 (9.4%) |
| $2,000 to $2,499 | 10 (5.0%) | 0 (0.0%) |
| $2,500 to $2,999 | 3 (1.5%) | 0 (0.0%) |
| $3,000 or more | 2 (1.0%) | 0 (0.0%) |
| Total | 201 (100.0%) | 64 (100.0%) |
Physical Housing Characteristics in Lake City
Housing Structures in Lake City
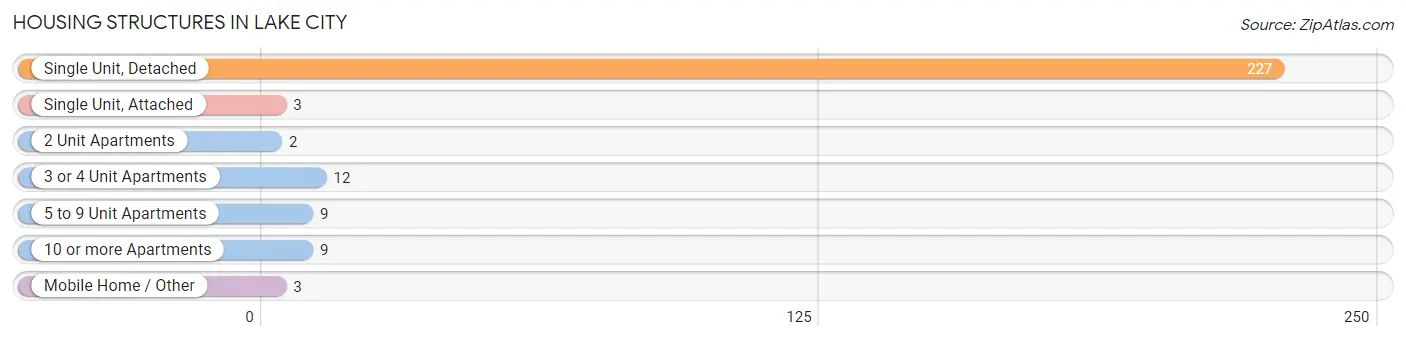
| Structure Type | # Housing Units | % Housing Units |
| Single Unit, Detached | 227 | 85.7% |
| Single Unit, Attached | 3 | 1.1% |
| 2 Unit Apartments | 2 | 0.7% |
| 3 or 4 Unit Apartments | 12 | 4.5% |
| 5 to 9 Unit Apartments | 9 | 3.4% |
| 10 or more Apartments | 9 | 3.4% |
| Mobile Home / Other | 3 | 1.1% |
| Total | 265 | 100.0% |
Housing Structures by Occupancy in Lake City

| Structure Type | Owner-occupied | Renter-occupied |
| Single Unit, Detached | 195 (85.9%) | 32 (14.1%) |
| Single Unit, Attached | 3 (100.0%) | 0 (0.0%) |
| 2 Unit Apartments | 0 (0.0%) | 2 (100.0%) |
| 3 or 4 Unit Apartments | 0 (0.0%) | 12 (100.0%) |
| 5 to 9 Unit Apartments | 0 (0.0%) | 9 (100.0%) |
| 10 or more Apartments | 0 (0.0%) | 9 (100.0%) |
| Mobile Home / Other | 3 (100.0%) | 0 (0.0%) |
| Total | 201 (75.8%) | 64 (24.1%) |
Housing Structures by Number of Rooms in Lake City
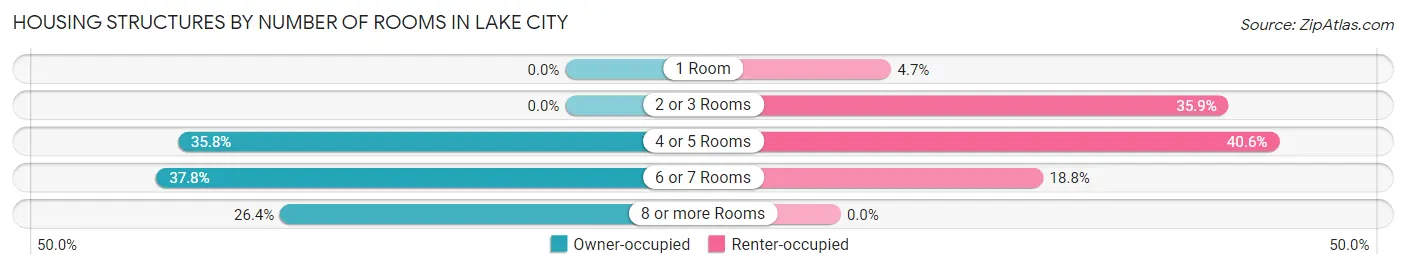
| Number of Rooms | Owner-occupied | Renter-occupied |
| 1 Room | 0 (0.0%) | 3 (4.7%) |
| 2 or 3 Rooms | 0 (0.0%) | 23 (35.9%) |
| 4 or 5 Rooms | 72 (35.8%) | 26 (40.6%) |
| 6 or 7 Rooms | 76 (37.8%) | 12 (18.8%) |
| 8 or more Rooms | 53 (26.4%) | 0 (0.0%) |
| Total | 201 (100.0%) | 64 (100.0%) |
Housing Structure by Heating Type in Lake City
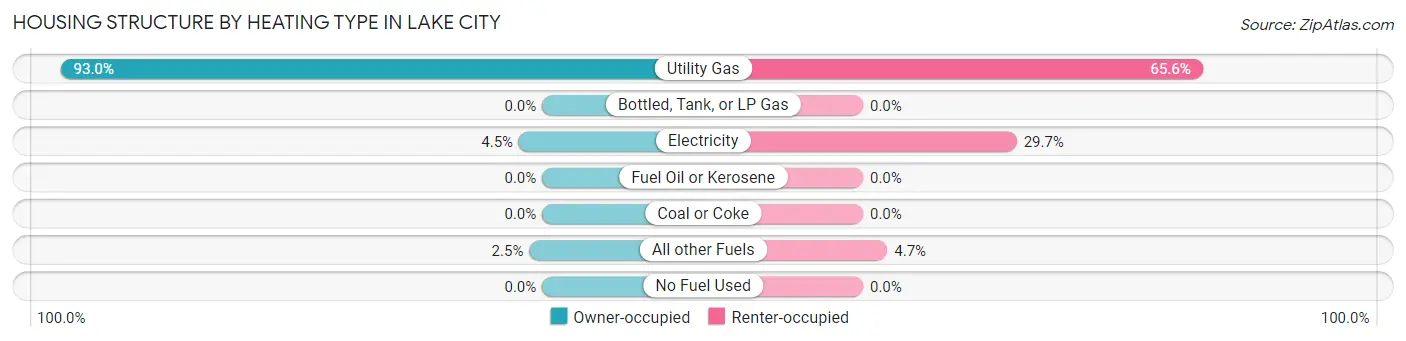
| Heating Type | Owner-occupied | Renter-occupied |
| Utility Gas | 187 (93.0%) | 42 (65.6%) |
| Bottled, Tank, or LP Gas | 0 (0.0%) | 0 (0.0%) |
| Electricity | 9 (4.5%) | 19 (29.7%) |
| Fuel Oil or Kerosene | 0 (0.0%) | 0 (0.0%) |
| Coal or Coke | 0 (0.0%) | 0 (0.0%) |
| All other Fuels | 5 (2.5%) | 3 (4.7%) |
| No Fuel Used | 0 (0.0%) | 0 (0.0%) |
| Total | 201 (100.0%) | 64 (100.0%) |
Household Vehicle Usage in Lake City
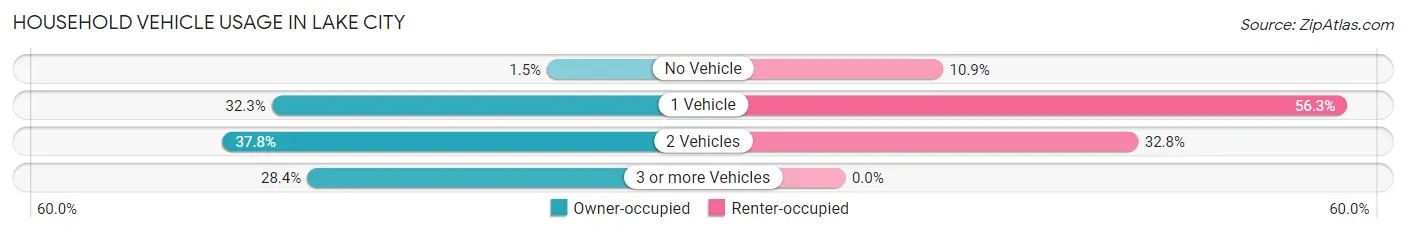
| Vehicles per Household | Owner-occupied | Renter-occupied |
| No Vehicle | 3 (1.5%) | 7 (10.9%) |
| 1 Vehicle | 65 (32.3%) | 36 (56.2%) |
| 2 Vehicles | 76 (37.8%) | 21 (32.8%) |
| 3 or more Vehicles | 57 (28.4%) | 0 (0.0%) |
| Total | 201 (100.0%) | 64 (100.0%) |
Real Estate & Mortgages in Lake City
Real Estate and Mortgage Overview in Lake City
| Characteristic | Without Mortgage | With Mortgage |
| Housing Units | 107 | 94 |
| Median Property Value | $124,000 | $144,700 |
| Median Household Income | $54,896 | $8 |
| Monthly Housing Costs | $456 | $2 |
| Real Estate Taxes | $1,583 | $12 |
Property Value by Mortgage Status in Lake City
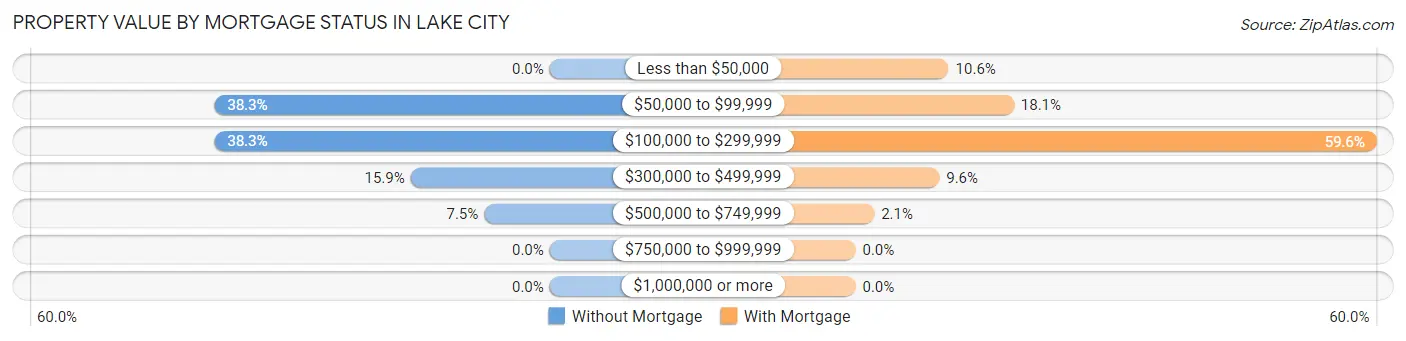
| Property Value | Without Mortgage | With Mortgage |
| Less than $50,000 | 0 (0.0%) | 10 (10.6%) |
| $50,000 to $99,999 | 41 (38.3%) | 17 (18.1%) |
| $100,000 to $299,999 | 41 (38.3%) | 56 (59.6%) |
| $300,000 to $499,999 | 17 (15.9%) | 9 (9.6%) |
| $500,000 to $749,999 | 8 (7.5%) | 2 (2.1%) |
| $750,000 to $999,999 | 0 (0.0%) | 0 (0.0%) |
| $1,000,000 or more | 0 (0.0%) | 0 (0.0%) |
| Total | 107 (100.0%) | 94 (100.0%) |
Household Income by Mortgage Status in Lake City
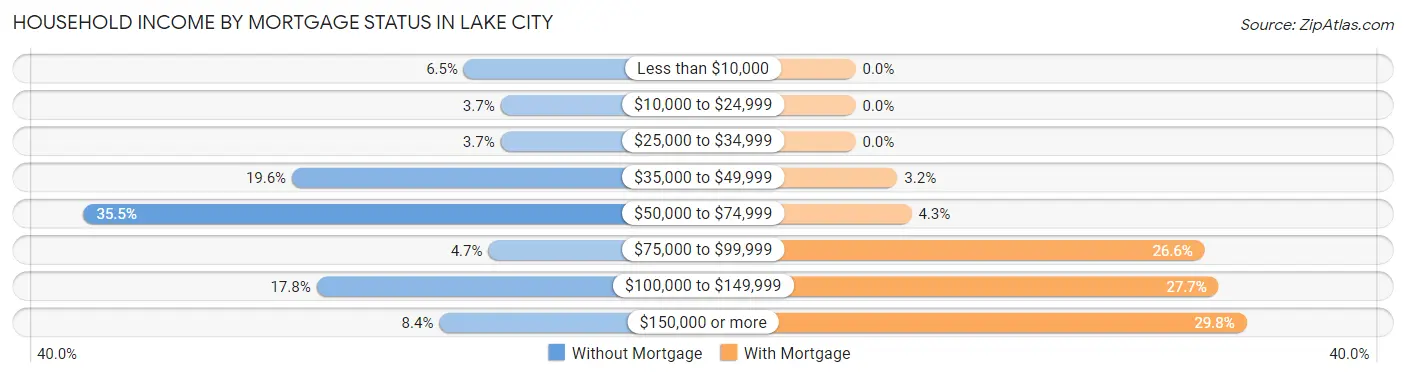
| Household Income | Without Mortgage | With Mortgage |
| Less than $10,000 | 7 (6.5%) | 0 (0.0%) |
| $10,000 to $24,999 | 4 (3.7%) | 0 (0.0%) |
| $25,000 to $34,999 | 4 (3.7%) | 0 (0.0%) |
| $35,000 to $49,999 | 21 (19.6%) | 3 (3.2%) |
| $50,000 to $74,999 | 38 (35.5%) | 4 (4.3%) |
| $75,000 to $99,999 | 5 (4.7%) | 25 (26.6%) |
| $100,000 to $149,999 | 19 (17.8%) | 26 (27.7%) |
| $150,000 or more | 9 (8.4%) | 28 (29.8%) |
| Total | 107 (100.0%) | 94 (100.0%) |
Property Value to Household Income Ratio in Lake City
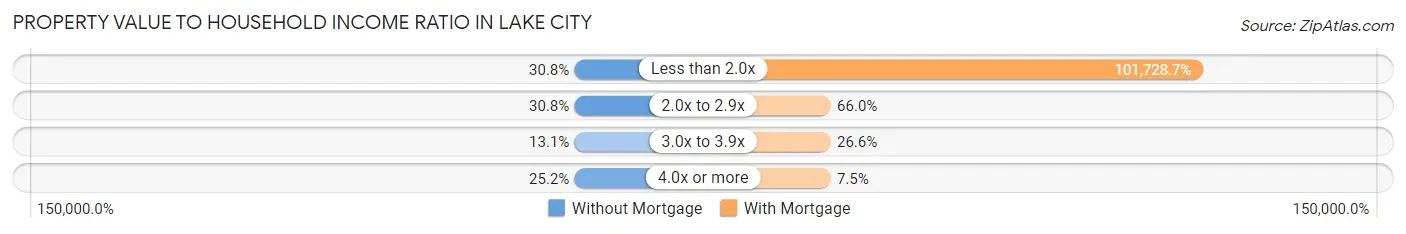
| Value-to-Income Ratio | Without Mortgage | With Mortgage |
| Less than 2.0x | 33 (30.8%) | 95,625 (101,728.7%) |
| 2.0x to 2.9x | 33 (30.8%) | 62 (66.0%) |
| 3.0x to 3.9x | 14 (13.1%) | 25 (26.6%) |
| 4.0x or more | 27 (25.2%) | 7 (7.4%) |
| Total | 107 (100.0%) | 94 (100.0%) |
Real Estate Taxes by Mortgage Status in Lake City
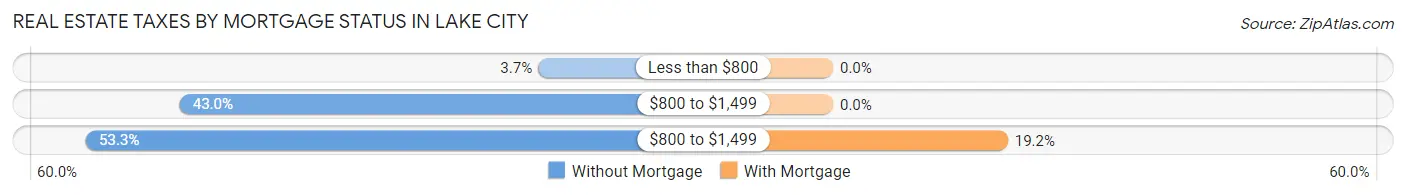
| Property Taxes | Without Mortgage | With Mortgage |
| Less than $800 | 4 (3.7%) | 0 (0.0%) |
| $800 to $1,499 | 46 (43.0%) | 0 (0.0%) |
| $800 to $1,499 | 57 (53.3%) | 18 (19.2%) |
| Total | 107 (100.0%) | 94 (100.0%) |
Health & Disability in Lake City
Health Insurance Coverage by Age in Lake City
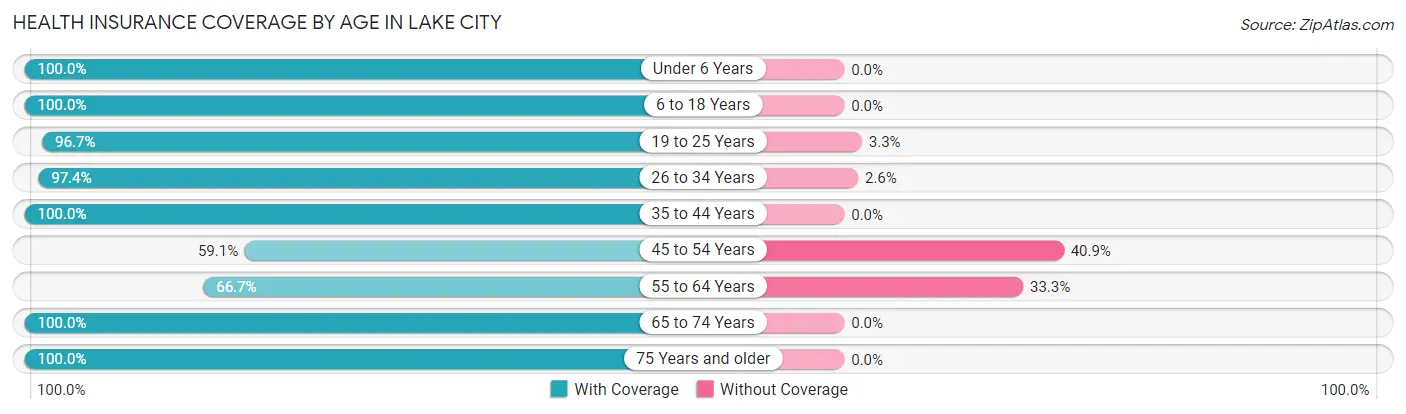
| Age Bracket | With Coverage | Without Coverage |
| Under 6 Years | 37 (100.0%) | 0 (0.0%) |
| 6 to 18 Years | 115 (100.0%) | 0 (0.0%) |
| 19 to 25 Years | 59 (96.7%) | 2 (3.3%) |
| 26 to 34 Years | 114 (97.4%) | 3 (2.6%) |
| 35 to 44 Years | 74 (100.0%) | 0 (0.0%) |
| 45 to 54 Years | 26 (59.1%) | 18 (40.9%) |
| 55 to 64 Years | 50 (66.7%) | 25 (33.3%) |
| 65 to 74 Years | 96 (100.0%) | 0 (0.0%) |
| 75 Years and older | 69 (100.0%) | 0 (0.0%) |
| Total | 640 (93.0%) | 48 (7.0%) |
Health Insurance Coverage by Citizenship Status in Lake City
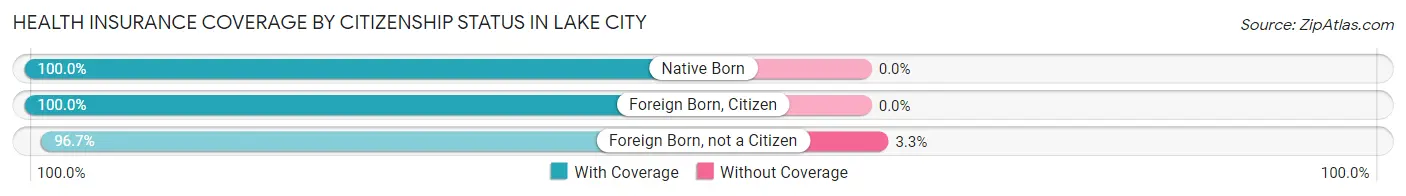
| Citizenship Status | With Coverage | Without Coverage |
| Native Born | 37 (100.0%) | 0 (0.0%) |
| Foreign Born, Citizen | 115 (100.0%) | 0 (0.0%) |
| Foreign Born, not a Citizen | 59 (96.7%) | 2 (3.3%) |
Health Insurance Coverage by Household Income in Lake City
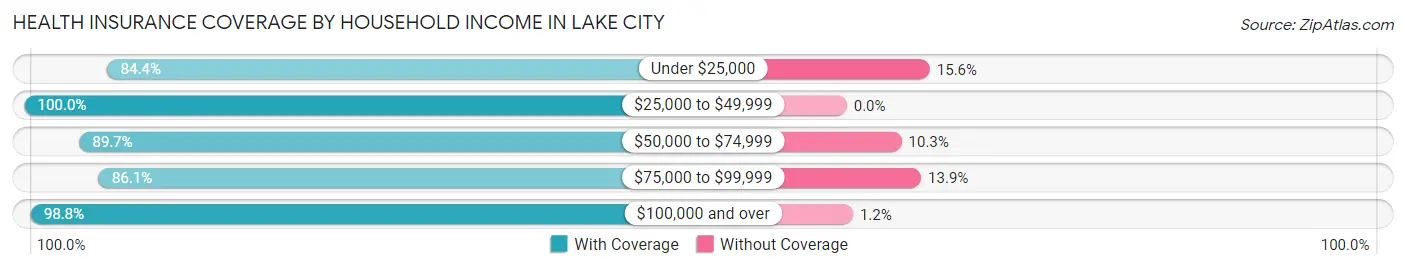
| Household Income | With Coverage | Without Coverage |
| Under $25,000 | 38 (84.4%) | 7 (15.6%) |
| $25,000 to $49,999 | 72 (100.0%) | 0 (0.0%) |
| $50,000 to $74,999 | 166 (89.7%) | 19 (10.3%) |
| $75,000 to $99,999 | 105 (86.1%) | 17 (13.9%) |
| $100,000 and over | 255 (98.8%) | 3 (1.2%) |
Public vs Private Health Insurance Coverage by Age in Lake City
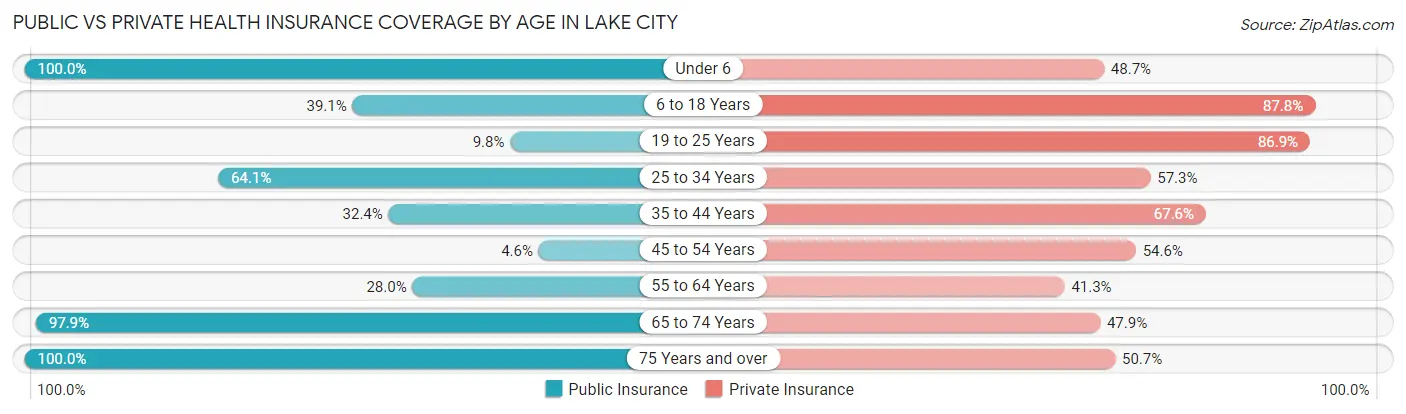
| Age Bracket | Public Insurance | Private Insurance |
| Under 6 | 37 (100.0%) | 18 (48.6%) |
| 6 to 18 Years | 45 (39.1%) | 101 (87.8%) |
| 19 to 25 Years | 6 (9.8%) | 53 (86.9%) |
| 25 to 34 Years | 75 (64.1%) | 67 (57.3%) |
| 35 to 44 Years | 24 (32.4%) | 50 (67.6%) |
| 45 to 54 Years | 2 (4.5%) | 24 (54.5%) |
| 55 to 64 Years | 21 (28.0%) | 31 (41.3%) |
| 65 to 74 Years | 94 (97.9%) | 46 (47.9%) |
| 75 Years and over | 69 (100.0%) | 35 (50.7%) |
| Total | 373 (54.2%) | 425 (61.8%) |
Disability Status by Sex by Age in Lake City
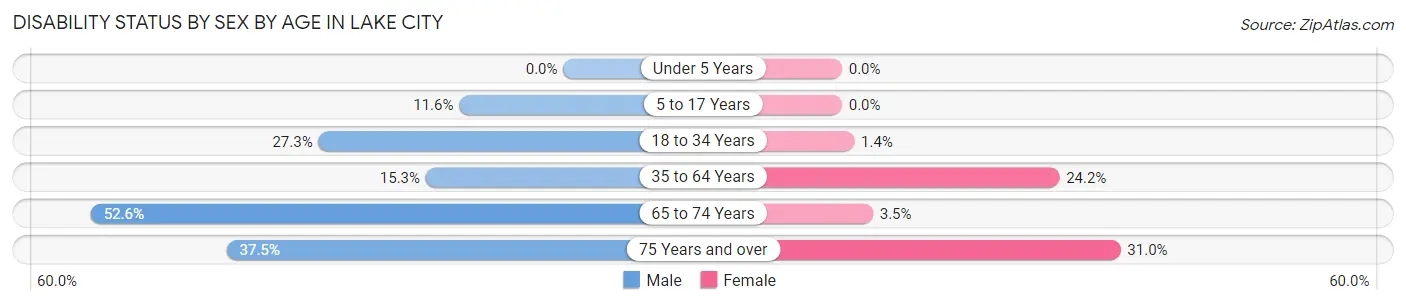
| Age Bracket | Male | Female |
| Under 5 Years | 0 (0.0%) | 0 (0.0%) |
| 5 to 17 Years | 8 (11.6%) | 0 (0.0%) |
| 18 to 34 Years | 30 (27.3%) | 1 (1.4%) |
| 35 to 64 Years | 15 (15.3%) | 23 (24.2%) |
| 65 to 74 Years | 20 (52.6%) | 2 (3.5%) |
| 75 Years and over | 15 (37.5%) | 9 (31.0%) |
Disability Class by Sex by Age in Lake City
Disability Class: Hearing Difficulty
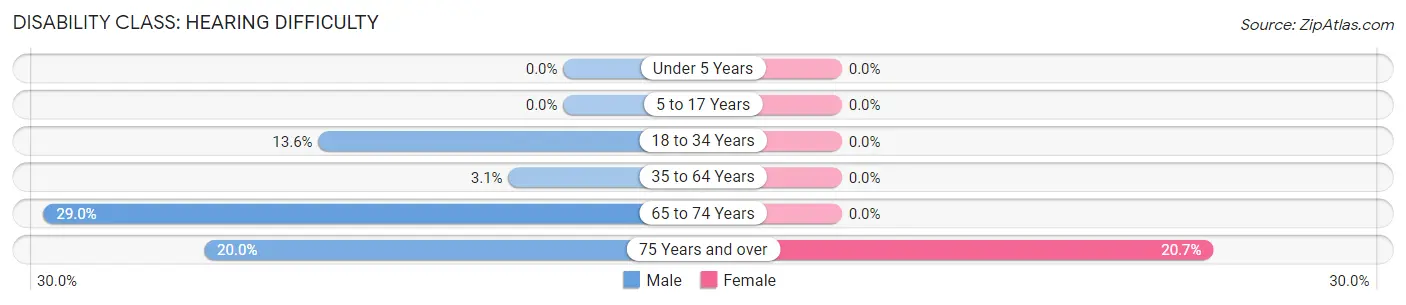
| Age Bracket | Male | Female |
| Under 5 Years | 0 (0.0%) | 0 (0.0%) |
| 5 to 17 Years | 0 (0.0%) | 0 (0.0%) |
| 18 to 34 Years | 15 (13.6%) | 0 (0.0%) |
| 35 to 64 Years | 3 (3.1%) | 0 (0.0%) |
| 65 to 74 Years | 11 (28.9%) | 0 (0.0%) |
| 75 Years and over | 8 (20.0%) | 6 (20.7%) |
Disability Class: Vision Difficulty
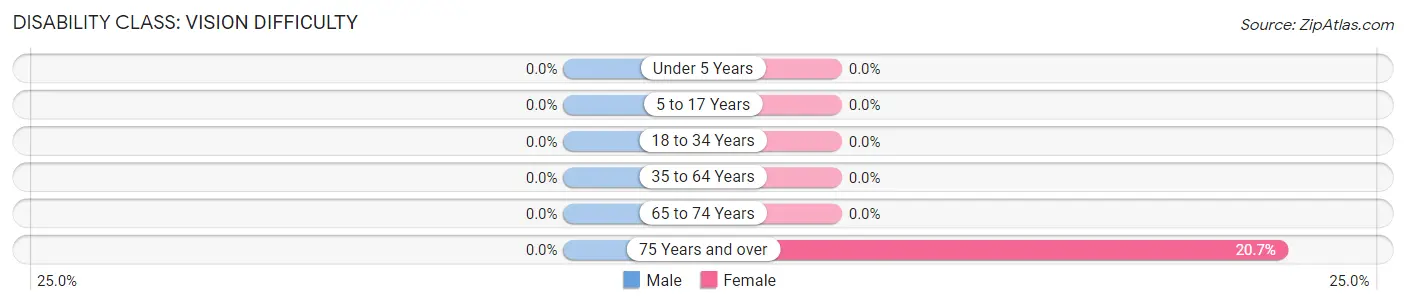
| Age Bracket | Male | Female |
| Under 5 Years | 0 (0.0%) | 0 (0.0%) |
| 5 to 17 Years | 0 (0.0%) | 0 (0.0%) |
| 18 to 34 Years | 0 (0.0%) | 0 (0.0%) |
| 35 to 64 Years | 0 (0.0%) | 0 (0.0%) |
| 65 to 74 Years | 0 (0.0%) | 0 (0.0%) |
| 75 Years and over | 0 (0.0%) | 6 (20.7%) |
Disability Class: Cognitive Difficulty
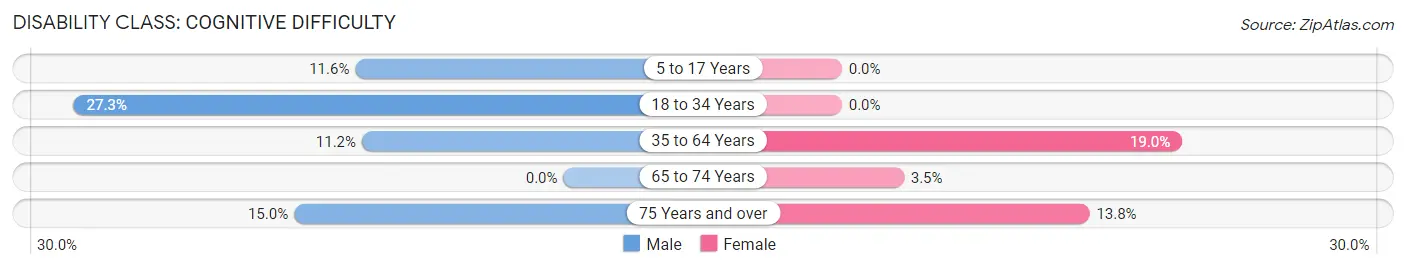
| Age Bracket | Male | Female |
| 5 to 17 Years | 8 (11.6%) | 0 (0.0%) |
| 18 to 34 Years | 30 (27.3%) | 0 (0.0%) |
| 35 to 64 Years | 11 (11.2%) | 18 (19.0%) |
| 65 to 74 Years | 0 (0.0%) | 2 (3.5%) |
| 75 Years and over | 6 (15.0%) | 4 (13.8%) |
Disability Class: Ambulatory Difficulty
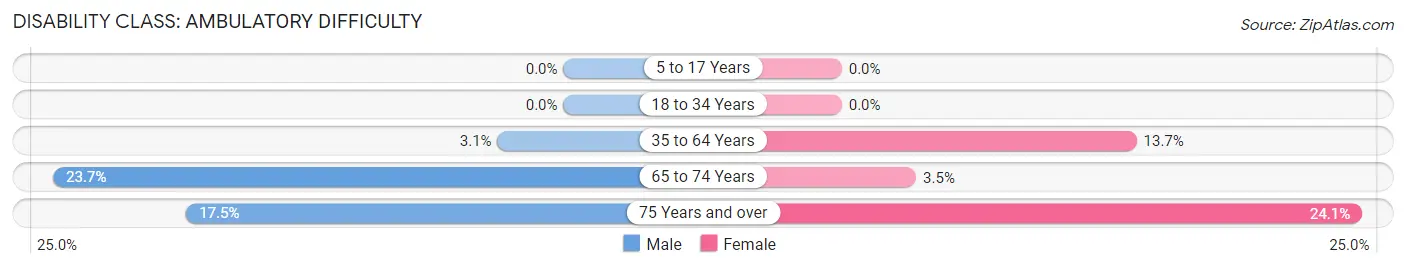
| Age Bracket | Male | Female |
| 5 to 17 Years | 0 (0.0%) | 0 (0.0%) |
| 18 to 34 Years | 0 (0.0%) | 0 (0.0%) |
| 35 to 64 Years | 3 (3.1%) | 13 (13.7%) |
| 65 to 74 Years | 9 (23.7%) | 2 (3.5%) |
| 75 Years and over | 7 (17.5%) | 7 (24.1%) |
Disability Class: Self-Care Difficulty
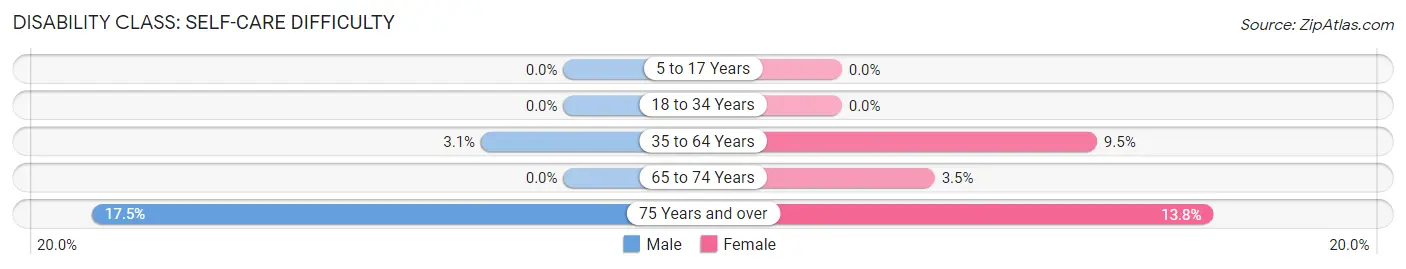
| Age Bracket | Male | Female |
| 5 to 17 Years | 0 (0.0%) | 0 (0.0%) |
| 18 to 34 Years | 0 (0.0%) | 0 (0.0%) |
| 35 to 64 Years | 3 (3.1%) | 9 (9.5%) |
| 65 to 74 Years | 0 (0.0%) | 2 (3.5%) |
| 75 Years and over | 7 (17.5%) | 4 (13.8%) |
Technology Access in Lake City
Computing Device Access in Lake City
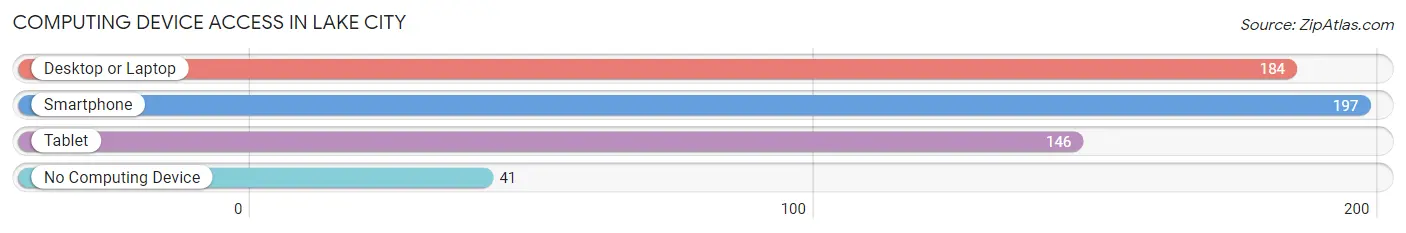
| Device Type | # Households | % Households |
| Desktop or Laptop | 184 | 69.4% |
| Smartphone | 197 | 74.3% |
| Tablet | 146 | 55.1% |
| No Computing Device | 41 | 15.5% |
| Total | 265 | 100.0% |
Internet Access in Lake City
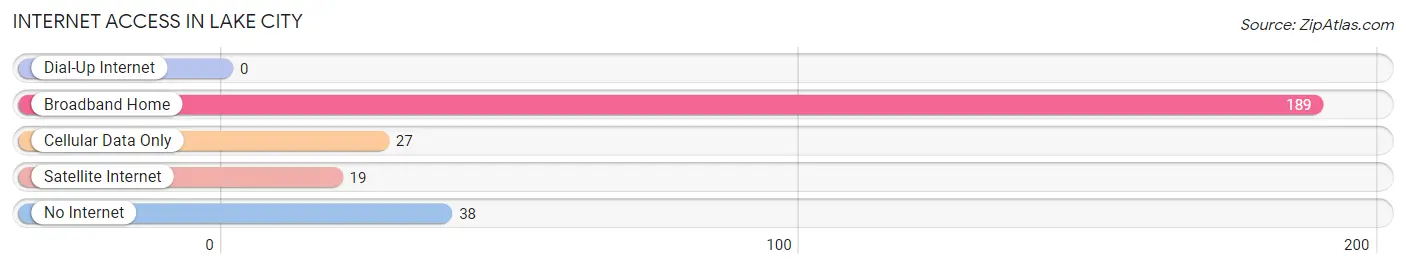
| Internet Type | # Households | % Households |
| Dial-Up Internet | 0 | 0.0% |
| Broadband Home | 189 | 71.3% |
| Cellular Data Only | 27 | 10.2% |
| Satellite Internet | 19 | 7.2% |
| No Internet | 38 | 14.3% |
| Total | 265 | 100.0% |
Lake City Summary
City of Lake City Michigan
Lake City is a city located in the northern part of Michigan’s Lower Peninsula. It is the county seat of Missaukee County and is situated on the shores of Lake Missaukee. The city has a population of 1,845 as of the 2010 census.
History
The area that is now Lake City was first settled in 1871 by a group of settlers from Canada. The settlement was originally known as “Canada Corners” and was located near the present-day intersection of M-55 and M-66. In 1873, the settlement was renamed “Lake City” after the nearby lake.
The city was officially incorporated in 1887 and was designated as the county seat of Missaukee County in 1889. The city grew rapidly in the late 19th and early 20th centuries, becoming a popular tourist destination due to its proximity to Lake Missaukee.
Geography
Lake City is located in the northern part of Michigan’s Lower Peninsula, approximately 40 miles northwest of Traverse City. The city is situated on the shores of Lake Missaukee, which is the largest lake in the county. The city is surrounded by rolling hills and forests, and is located near the Manistee National Forest.
The city has a total area of 2.2 square miles, all of which is land. The city is located at an elevation of 1,072 feet above sea level.
Economy
The economy of Lake City is largely based on tourism and agriculture. The city is home to several tourist attractions, including the Lake Missaukee State Park, the Missaukee County Historical Museum, and the Missaukee County Fairgrounds.
Agriculture is also an important part of the local economy. The area is home to several farms, which produce a variety of crops, including corn, soybeans, wheat, and hay.
Demographics
As of the 2010 census, the city had a population of 1,845. The racial makeup of the city was 95.3% White, 0.7% African American, 0.4% Native American, 0.3% Asian, 0.1% Pacific Islander, 1.2% from other races, and 2.1% from two or more races. Hispanic or Latino of any race were 3.2% of the population.
The median income for a household in the city was $35,938, and the median income for a family was $41,250. The per capita income for the city was $17,845. About 11.2% of families and 14.2% of the population were below the poverty line, including 19.2% of those under age 18 and 8.3% of those age 65 or over.
Conclusion
Lake City is a small city located in the northern part of Michigan’s Lower Peninsula. The city has a population of 1,845 as of the 2010 census and is the county seat of Missaukee County. The city’s economy is largely based on tourism and agriculture, and the area is home to several tourist attractions and farms. The city has a diverse population, with a median income of $35,938 for a household and $41,250 for a family.
Common Questions
What is Per Capita Income in Lake City?
Per Capita income in Lake City is $28,911.
What is the Median Family Income in Lake City?
Median Family Income in Lake City is $86,250.
What is the Median Household income in Lake City?
Median Household Income in Lake City is $57,868.
What is Income or Wage Gap in Lake City?
Income or Wage Gap in Lake City is 15.5%.
Women in Lake City earn 84.5 cents for every dollar earned by a man.
What is Inequality or Gini Index in Lake City?
Inequality or Gini Index in Lake City is 0.37.
What is the Total Population of Lake City?
Total Population of Lake City is 702.
What is the Total Male Population of Lake City?
Total Male Population of Lake City is 402.
What is the Total Female Population of Lake City?
Total Female Population of Lake City is 300.
What is the Ratio of Males per 100 Females in Lake City?
There are 134.00 Males per 100 Females in Lake City.
What is the Ratio of Females per 100 Males in Lake City?
There are 74.63 Females per 100 Males in Lake City.
What is the Median Population Age in Lake City?
Median Population Age in Lake City is 36.8 Years.
What is the Average Family Size in Lake City
Average Family Size in Lake City is 3.0 People.
What is the Average Household Size in Lake City
Average Household Size in Lake City is 2.6 People.
How Large is the Labor Force in Lake City?
There are 338 People in the Labor Forcein in Lake City.
What is the Percentage of People in the Labor Force in Lake City?
56.7% of People are in the Labor Force in Lake City.
What is the Unemployment Rate in Lake City?
Unemployment Rate in Lake City is 6.8%.