Turtle Lake, ND Map & Demographics
Turtle Lake Map
Turtle Lake Overview
$30,043
PER CAPITA INCOME
$64,625
AVG FAMILY INCOME
$58,125
AVG HOUSEHOLD INCOME
67.0%
WAGE / INCOME GAP [ % ]
33.0¢/ $1
WAGE / INCOME GAP [ $ ]
0.38
INEQUALITY / GINI INDEX
503
TOTAL POPULATION
240
MALE POPULATION
263
FEMALE POPULATION
91.25
MALES / 100 FEMALES
109.58
FEMALES / 100 MALES
42.8
MEDIAN AGE
2.5
AVG FAMILY SIZE
2.1
AVG HOUSEHOLD SIZE
228
LABOR FORCE [ PEOPLE ]
55.9%
PERCENT IN LABOR FORCE
Turtle Lake Zip Codes
Turtle Lake Area Codes
Income in Turtle Lake
Income Overview in Turtle Lake
Per Capita Income in Turtle Lake is $30,043, while median incomes of families and households are $64,625 and $58,125 respectively.
| Characteristic | Number | Measure |
| Per Capita Income | 503 | $30,043 |
| Median Family Income | 159 | $64,625 |
| Mean Family Income | 159 | $75,615 |
| Median Household Income | 235 | $58,125 |
| Mean Household Income | 235 | $65,731 |
| Income Deficit | 159 | $0 |
| Wage / Income Gap (%) | 503 | 66.99% |
| Wage / Income Gap ($) | 503 | 33.01¢ per $1 |
| Gini / Inequality Index | 503 | 0.38 |
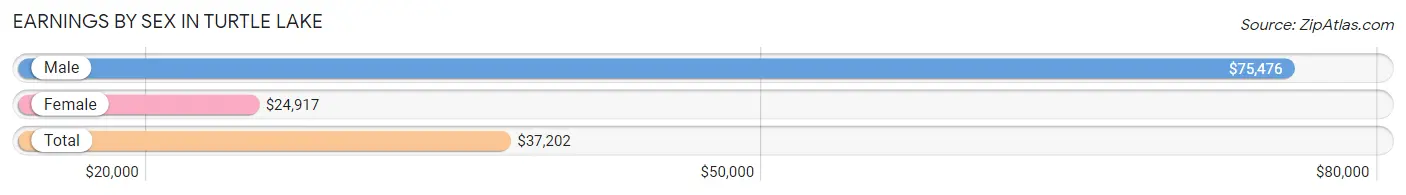
Earnings by Sex in Turtle Lake
Average Earnings in Turtle Lake are $37,202, $75,476 for men and $24,917 for women, a difference of 67.0%.
| Sex | Number | Average Earnings |
| Male | 114 (45.8%) | $75,476 |
| Female | 135 (54.2%) | $24,917 |
| Total | 249 (100.0%) | $37,202 |
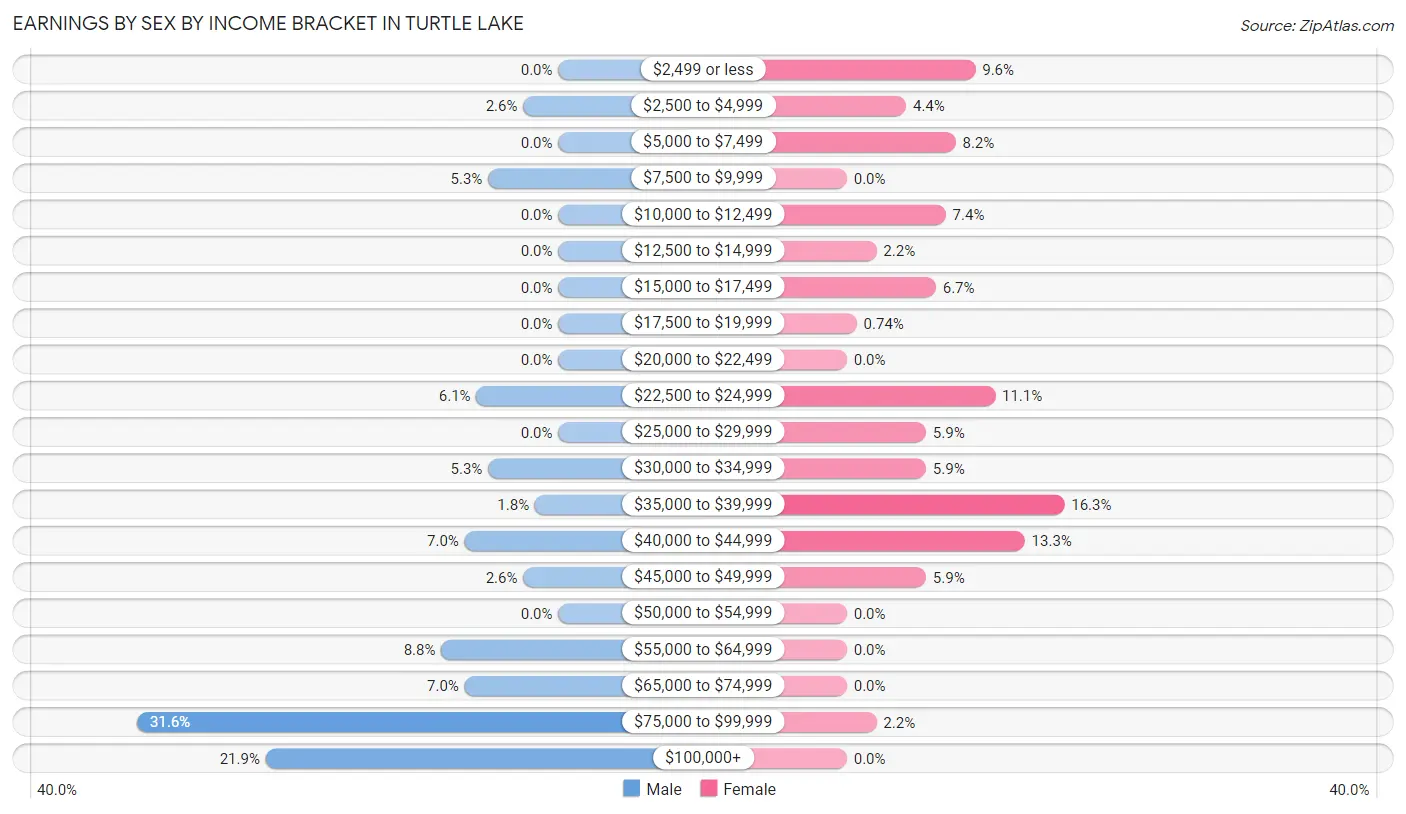
Earnings by Sex by Income Bracket in Turtle Lake
The most common earnings brackets in Turtle Lake are $75,000 to $99,999 for men (36 | 31.6%) and $35,000 to $39,999 for women (22 | 16.3%).
| Income | Male | Female |
| $2,499 or less | 0 (0.0%) | 13 (9.6%) |
| $2,500 to $4,999 | 3 (2.6%) | 6 (4.4%) |
| $5,000 to $7,499 | 0 (0.0%) | 11 (8.2%) |
| $7,500 to $9,999 | 6 (5.3%) | 0 (0.0%) |
| $10,000 to $12,499 | 0 (0.0%) | 10 (7.4%) |
| $12,500 to $14,999 | 0 (0.0%) | 3 (2.2%) |
| $15,000 to $17,499 | 0 (0.0%) | 9 (6.7%) |
| $17,500 to $19,999 | 0 (0.0%) | 1 (0.7%) |
| $20,000 to $22,499 | 0 (0.0%) | 0 (0.0%) |
| $22,500 to $24,999 | 7 (6.1%) | 15 (11.1%) |
| $25,000 to $29,999 | 0 (0.0%) | 8 (5.9%) |
| $30,000 to $34,999 | 6 (5.3%) | 8 (5.9%) |
| $35,000 to $39,999 | 2 (1.8%) | 22 (16.3%) |
| $40,000 to $44,999 | 8 (7.0%) | 18 (13.3%) |
| $45,000 to $49,999 | 3 (2.6%) | 8 (5.9%) |
| $50,000 to $54,999 | 0 (0.0%) | 0 (0.0%) |
| $55,000 to $64,999 | 10 (8.8%) | 0 (0.0%) |
| $65,000 to $74,999 | 8 (7.0%) | 0 (0.0%) |
| $75,000 to $99,999 | 36 (31.6%) | 3 (2.2%) |
| $100,000+ | 25 (21.9%) | 0 (0.0%) |
| Total | 114 (100.0%) | 135 (100.0%) |
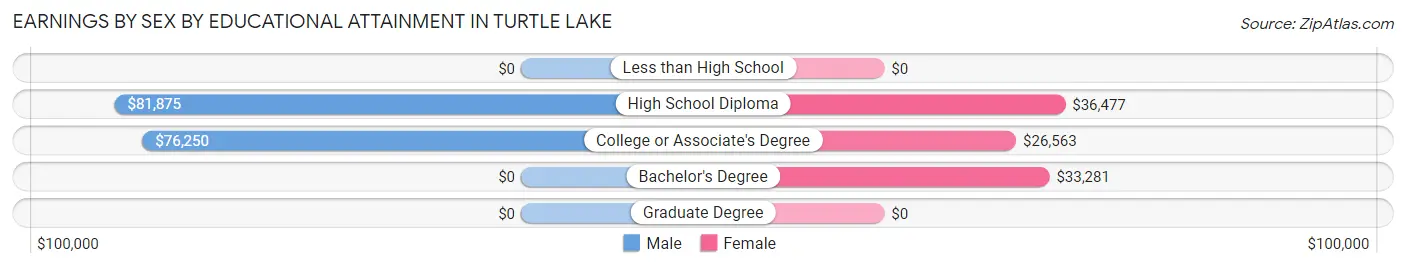
Earnings by Sex by Educational Attainment in Turtle Lake
Average earnings in Turtle Lake are $75,952 for men and $32,969 for women, a difference of 56.6%. Men with an educational attainment of high school diploma enjoy the highest average annual earnings of $81,875, while those with college or associate's degree education earn the least with $76,250. Women with an educational attainment of high school diploma earn the most with the average annual earnings of $36,477, while those with college or associate's degree education have the smallest earnings of $26,563.
| Educational Attainment | Male Income | Female Income |
| Less than High School | - | - |
| High School Diploma | $81,875 | $36,477 |
| College or Associate's Degree | $76,250 | $26,563 |
| Bachelor's Degree | - | - |
| Graduate Degree | - | - |
| Total | $75,952 | $32,969 |
Family Income in Turtle Lake
Family Income Brackets in Turtle Lake
According to the Turtle Lake family income data, there are 37 families falling into the $35,000 to $49,999 income range, which is the most common income bracket and makes up 23.3% of all families.
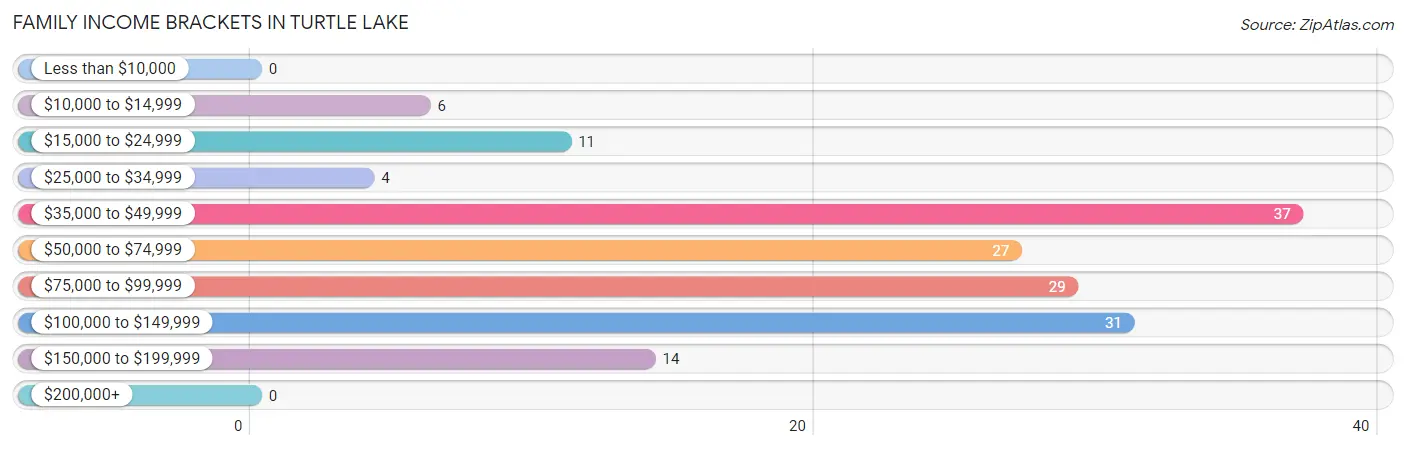
| Income Bracket | # Families | % Families |
| Less than $10,000 | 0 | 0.0% |
| $10,000 to $14,999 | 6 | 3.8% |
| $15,000 to $24,999 | 11 | 6.9% |
| $25,000 to $34,999 | 4 | 2.5% |
| $35,000 to $49,999 | 37 | 23.3% |
| $50,000 to $74,999 | 27 | 17.0% |
| $75,000 to $99,999 | 29 | 18.2% |
| $100,000 to $149,999 | 31 | 19.5% |
| $150,000 to $199,999 | 14 | 8.8% |
| $200,000+ | 0 | 0.0% |
Family Income by Famaliy Size in Turtle Lake
4-person families (16 | 10.1%) account for the highest median family income in Turtle Lake with $122,857 per family, while 2-person families (82 | 51.6%) have the highest median income of $33,125 per family member.
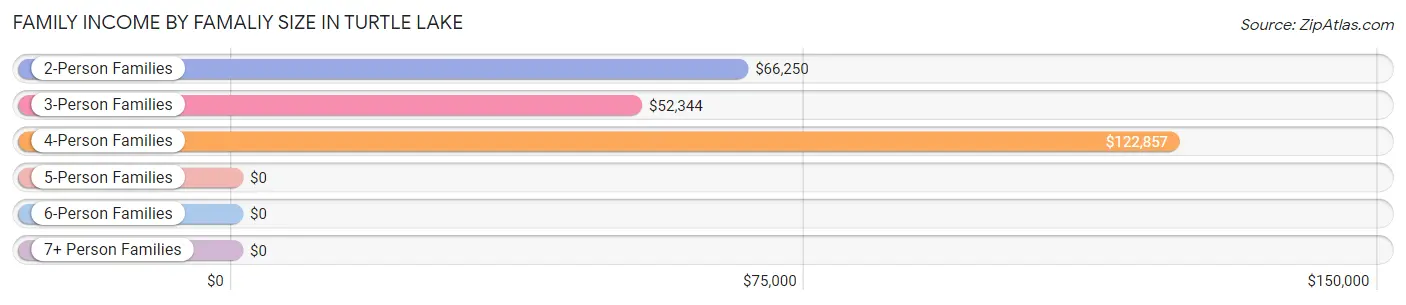
| Income Bracket | # Families | Median Income |
| 2-Person Families | 82 (51.6%) | $66,250 |
| 3-Person Families | 49 (30.8%) | $52,344 |
| 4-Person Families | 16 (10.1%) | $122,857 |
| 5-Person Families | 9 (5.7%) | $0 |
| 6-Person Families | 3 (1.9%) | $0 |
| 7+ Person Families | 0 (0.0%) | $0 |
| Total | 159 (100.0%) | $64,625 |
Family Income by Number of Earners in Turtle Lake
The median family income in Turtle Lake is $64,625, with families comprising 2 earners (56) having the highest median family income of $107,857, while families with no earners (33) have the lowest median family income of $45,179, accounting for 35.2% and 20.7% of families, respectively.
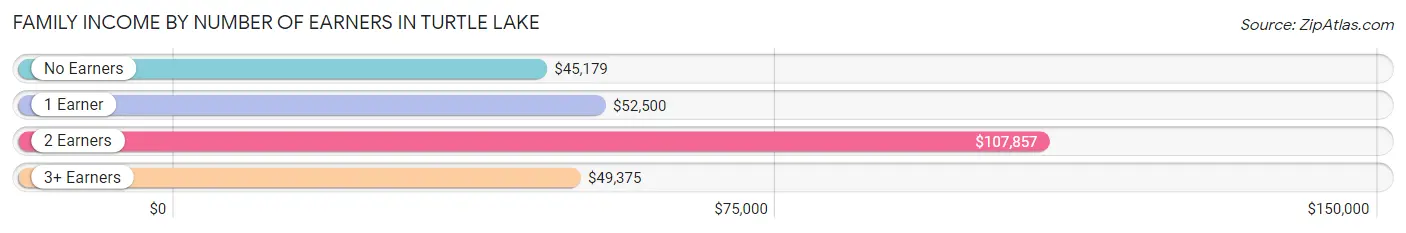
| Number of Earners | # Families | Median Income |
| No Earners | 33 (20.7%) | $45,179 |
| 1 Earner | 58 (36.5%) | $52,500 |
| 2 Earners | 56 (35.2%) | $107,857 |
| 3+ Earners | 12 (7.5%) | $49,375 |
| Total | 159 (100.0%) | $64,625 |
Household Income in Turtle Lake
Household Income Brackets in Turtle Lake
With 42 households falling in the category, the $50,000 to $74,999 income range is the most frequent in Turtle Lake, accounting for 17.9% of all households. In contrast, only 5 households (2.1%) fall into the $200,000+ income bracket, making it the least populous group.
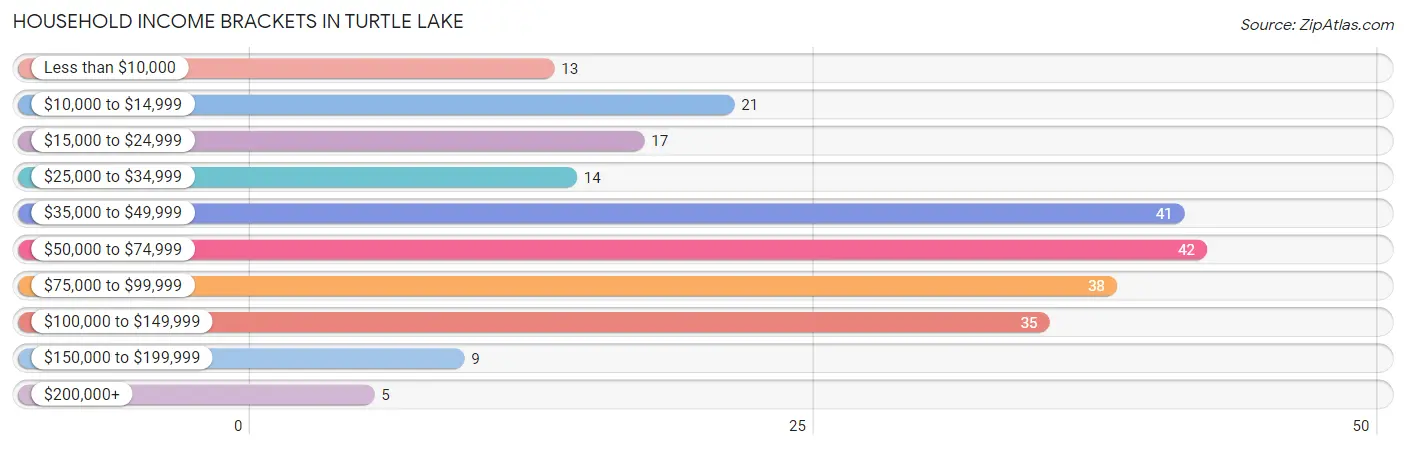
| Income Bracket | # Households | % Households |
| Less than $10,000 | 13 | 5.5% |
| $10,000 to $14,999 | 21 | 8.9% |
| $15,000 to $24,999 | 17 | 7.2% |
| $25,000 to $34,999 | 14 | 6.0% |
| $35,000 to $49,999 | 41 | 17.4% |
| $50,000 to $74,999 | 42 | 17.9% |
| $75,000 to $99,999 | 38 | 16.2% |
| $100,000 to $149,999 | 35 | 14.9% |
| $150,000 to $199,999 | 9 | 3.8% |
| $200,000+ | 5 | 2.1% |
Household Income by Householder Age in Turtle Lake
The median household income in Turtle Lake is $58,125, with the highest median household income of $76,563 found in the 25 to 44 years age bracket for the primary householder. A total of 81 households (34.5%) fall into this category. Meanwhile, the 15 to 24 years age bracket for the primary householder has the lowest median household income of $0, with 8 households (3.4%) in this group.
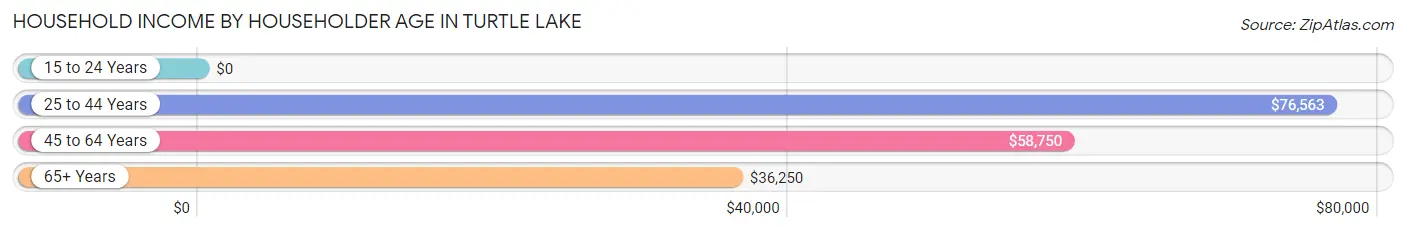
| Income Bracket | # Households | Median Income |
| 15 to 24 Years | 8 (3.4%) | $0 |
| 25 to 44 Years | 81 (34.5%) | $76,563 |
| 45 to 64 Years | 80 (34.0%) | $58,750 |
| 65+ Years | 66 (28.1%) | $36,250 |
| Total | 235 (100.0%) | $58,125 |
Poverty in Turtle Lake
Income Below Poverty by Sex and Age in Turtle Lake
With 4.7% poverty level for males and 23.6% for females among the residents of Turtle Lake, 18 to 24 year old males and 12 to 14 year old females are the most vulnerable to poverty, with 8 males (38.1%) and 3 females (100.0%) in their respective age groups living below the poverty level.
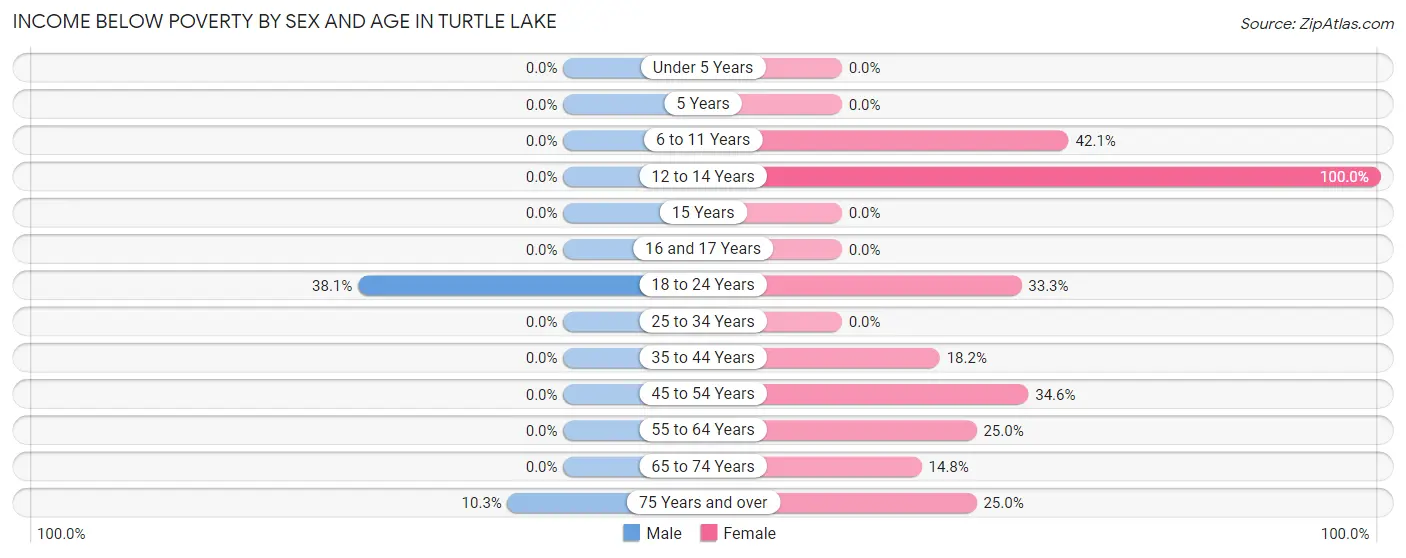
| Age Bracket | Male | Female |
| Under 5 Years | 0 (0.0%) | 0 (0.0%) |
| 5 Years | 0 (0.0%) | 0 (0.0%) |
| 6 to 11 Years | 0 (0.0%) | 8 (42.1%) |
| 12 to 14 Years | 0 (0.0%) | 3 (100.0%) |
| 15 Years | 0 (0.0%) | 0 (0.0%) |
| 16 and 17 Years | 0 (0.0%) | 0 (0.0%) |
| 18 to 24 Years | 8 (38.1%) | 6 (33.3%) |
| 25 to 34 Years | 0 (0.0%) | 0 (0.0%) |
| 35 to 44 Years | 0 (0.0%) | 10 (18.2%) |
| 45 to 54 Years | 0 (0.0%) | 9 (34.6%) |
| 55 to 64 Years | 0 (0.0%) | 11 (25.0%) |
| 65 to 74 Years | 0 (0.0%) | 4 (14.8%) |
| 75 Years and over | 3 (10.3%) | 8 (25.0%) |
| Total | 11 (4.7%) | 59 (23.6%) |
Income Above Poverty by Sex and Age in Turtle Lake
According to the poverty statistics in Turtle Lake, males aged under 5 years and females aged under 5 years are the age groups that are most secure financially, with 100.0% of males and 100.0% of females in these age groups living above the poverty line.
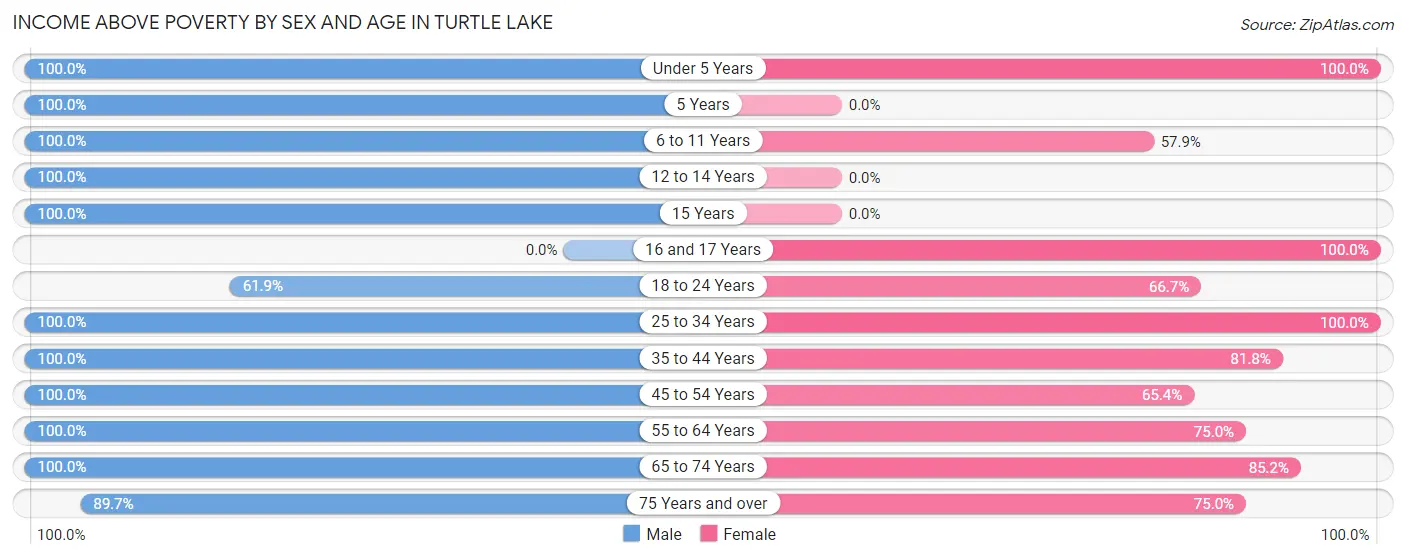
| Age Bracket | Male | Female |
| Under 5 Years | 11 (100.0%) | 10 (100.0%) |
| 5 Years | 15 (100.0%) | 0 (0.0%) |
| 6 to 11 Years | 22 (100.0%) | 11 (57.9%) |
| 12 to 14 Years | 11 (100.0%) | 0 (0.0%) |
| 15 Years | 4 (100.0%) | 0 (0.0%) |
| 16 and 17 Years | 0 (0.0%) | 8 (100.0%) |
| 18 to 24 Years | 13 (61.9%) | 12 (66.7%) |
| 25 to 34 Years | 47 (100.0%) | 8 (100.0%) |
| 35 to 44 Years | 13 (100.0%) | 45 (81.8%) |
| 45 to 54 Years | 15 (100.0%) | 17 (65.4%) |
| 55 to 64 Years | 23 (100.0%) | 33 (75.0%) |
| 65 to 74 Years | 25 (100.0%) | 23 (85.2%) |
| 75 Years and over | 26 (89.7%) | 24 (75.0%) |
| Total | 225 (95.3%) | 191 (76.4%) |
Income Below Poverty Among Married-Couple Families in Turtle Lake
The poverty statistics for married-couple families in Turtle Lake show that 3.0% or 3 of the total 100 families live below the poverty line. Families with no children have the highest poverty rate of 4.7%, comprising of 3 families. On the other hand, families with 1 or 2 children have the lowest poverty rate of 0.0%, which includes 0 families.
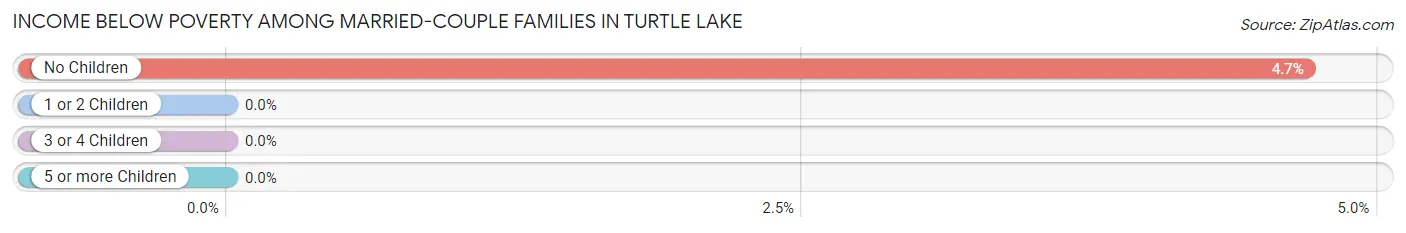
| Children | Above Poverty | Below Poverty |
| No Children | 61 (95.3%) | 3 (4.7%) |
| 1 or 2 Children | 30 (100.0%) | 0 (0.0%) |
| 3 or 4 Children | 6 (100.0%) | 0 (0.0%) |
| 5 or more Children | 0 (0.0%) | 0 (0.0%) |
| Total | 97 (97.0%) | 3 (3.0%) |
Income Below Poverty Among Single-Parent Households in Turtle Lake
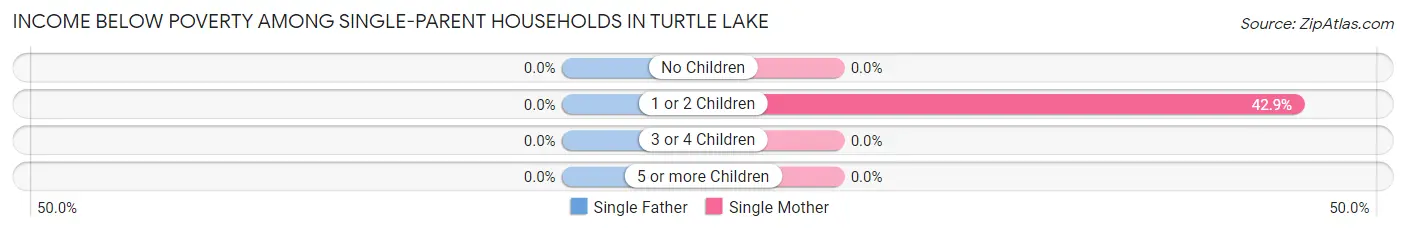
| Children | Single Father | Single Mother |
| No Children | 0 (0.0%) | 0 (0.0%) |
| 1 or 2 Children | 0 (0.0%) | 12 (42.9%) |
| 3 or 4 Children | 0 (0.0%) | 0 (0.0%) |
| 5 or more Children | 0 (0.0%) | 0 (0.0%) |
| Total | 0 (0.0%) | 12 (26.1%) |
Income Below Poverty Among Married-Couple vs Single-Parent Households in Turtle Lake
The poverty data for Turtle Lake shows that 3 of the married-couple family households (3.0%) and 12 of the single-parent households (20.3%) are living below the poverty level. Within the married-couple family households, those with no children have the highest poverty rate, with 3 households (4.7%) falling below the poverty line. Among the single-parent households, those with 1 or 2 children have the highest poverty rate, with 12 household (29.3%) living below poverty.
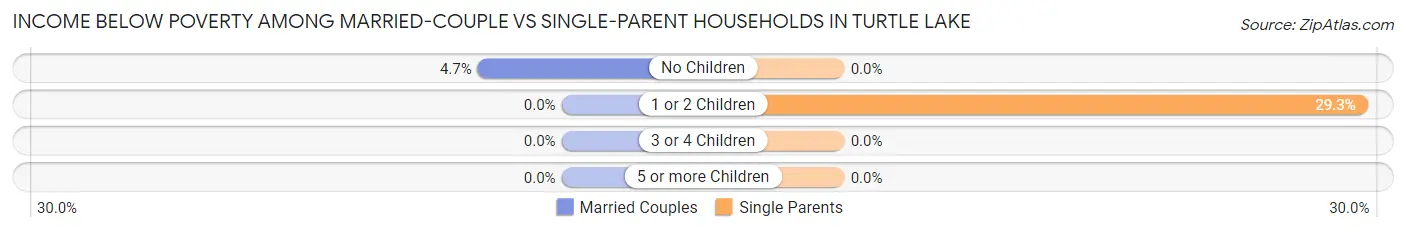
| Children | Married-Couple Families | Single-Parent Households |
| No Children | 3 (4.7%) | 0 (0.0%) |
| 1 or 2 Children | 0 (0.0%) | 12 (29.3%) |
| 3 or 4 Children | 0 (0.0%) | 0 (0.0%) |
| 5 or more Children | 0 (0.0%) | 0 (0.0%) |
| Total | 3 (3.0%) | 12 (20.3%) |
Race in Turtle Lake
The most populous races in Turtle Lake are White / Caucasian (472 | 93.8%), Two or more Races (12 | 2.4%), and Hispanic or Latino (10 | 2.0%).
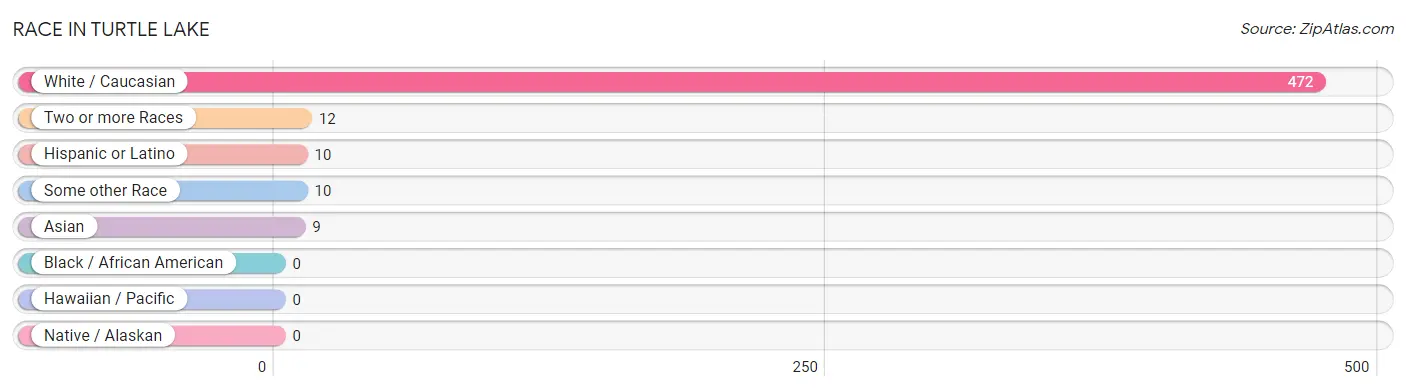
| Race | # Population | % Population |
| Asian | 9 | 1.8% |
| Black / African American | 0 | 0.0% |
| Hawaiian / Pacific | 0 | 0.0% |
| Hispanic or Latino | 10 | 2.0% |
| Native / Alaskan | 0 | 0.0% |
| White / Caucasian | 472 | 93.8% |
| Two or more Races | 12 | 2.4% |
| Some other Race | 10 | 2.0% |
| Total | 503 | 100.0% |
Ancestry in Turtle Lake
The most populous ancestries reported in Turtle Lake are German (127 | 25.3%), Norwegian (87 | 17.3%), Irish (39 | 7.7%), English (27 | 5.4%), and Brazilian (23 | 4.6%), together accounting for 60.2% of all Turtle Lake residents.
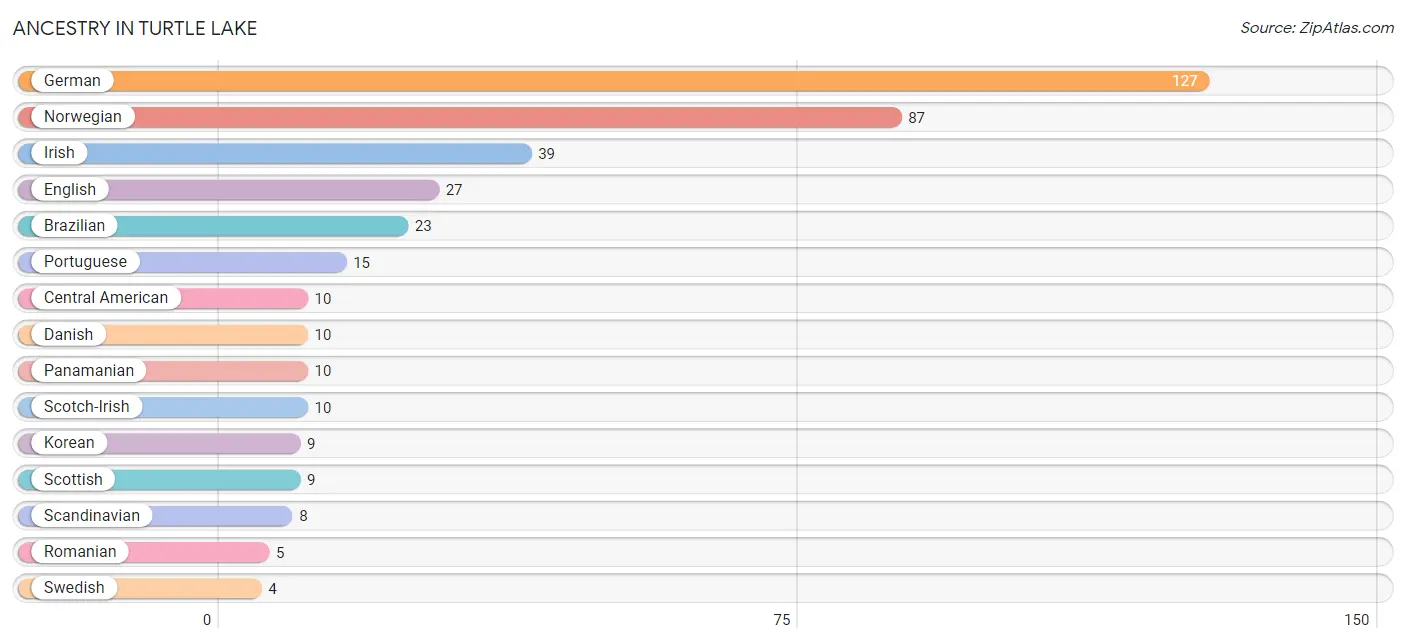
| Ancestry | # Population | % Population |
| Belgian | 2 | 0.4% |
| Brazilian | 23 | 4.6% |
| Central American | 10 | 2.0% |
| Danish | 10 | 2.0% |
| English | 27 | 5.4% |
| French | 2 | 0.4% |
| French Canadian | 2 | 0.4% |
| German | 127 | 25.3% |
| Greek | 1 | 0.2% |
| Irish | 39 | 7.7% |
| Korean | 9 | 1.8% |
| Norwegian | 87 | 17.3% |
| Panamanian | 10 | 2.0% |
| Portuguese | 15 | 3.0% |
| Romanian | 5 | 1.0% |
| Russian | 2 | 0.4% |
| Scandinavian | 8 | 1.6% |
| Scotch-Irish | 10 | 2.0% |
| Scottish | 9 | 1.8% |
| Swedish | 4 | 0.8% | View All 20 Rows |
Immigrants in Turtle Lake
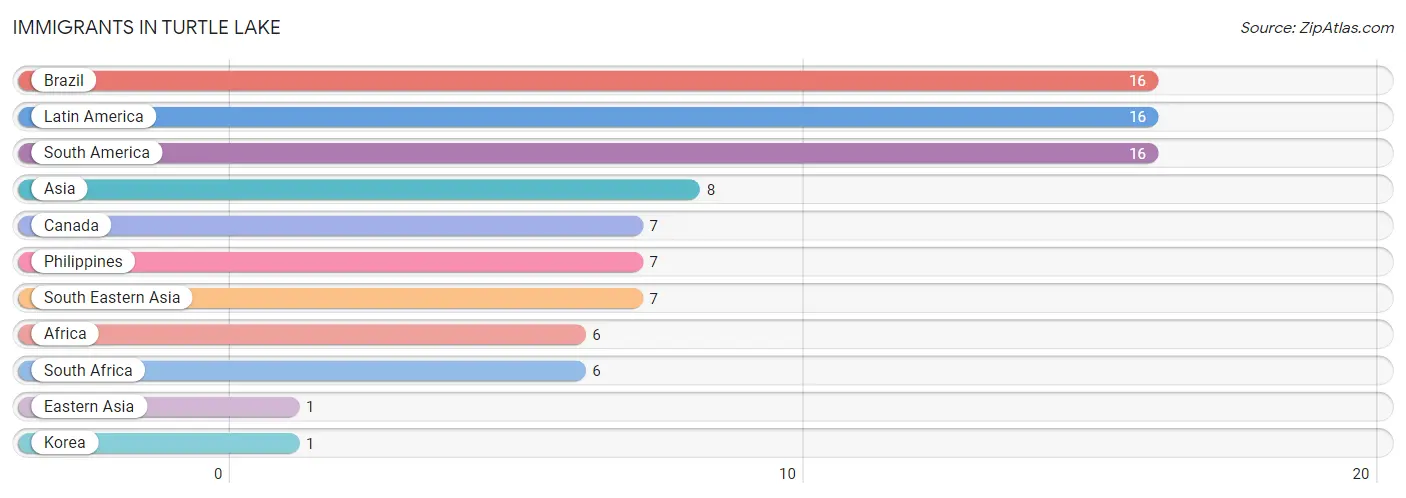
The most numerous immigrant groups reported in Turtle Lake came from Brazil (16 | 3.2%), Latin America (16 | 3.2%), South America (16 | 3.2%), Asia (8 | 1.6%), and Canada (7 | 1.4%), together accounting for 12.5% of all Turtle Lake residents.
| Immigration Origin | # Population | % Population |
| Africa | 6 | 1.2% |
| Asia | 8 | 1.6% |
| Brazil | 16 | 3.2% |
| Canada | 7 | 1.4% |
| Eastern Asia | 1 | 0.2% |
| Korea | 1 | 0.2% |
| Latin America | 16 | 3.2% |
| Philippines | 7 | 1.4% |
| South Africa | 6 | 1.2% |
| South America | 16 | 3.2% |
| South Eastern Asia | 7 | 1.4% | View All 11 Rows |
Sex and Age in Turtle Lake
Sex and Age in Turtle Lake
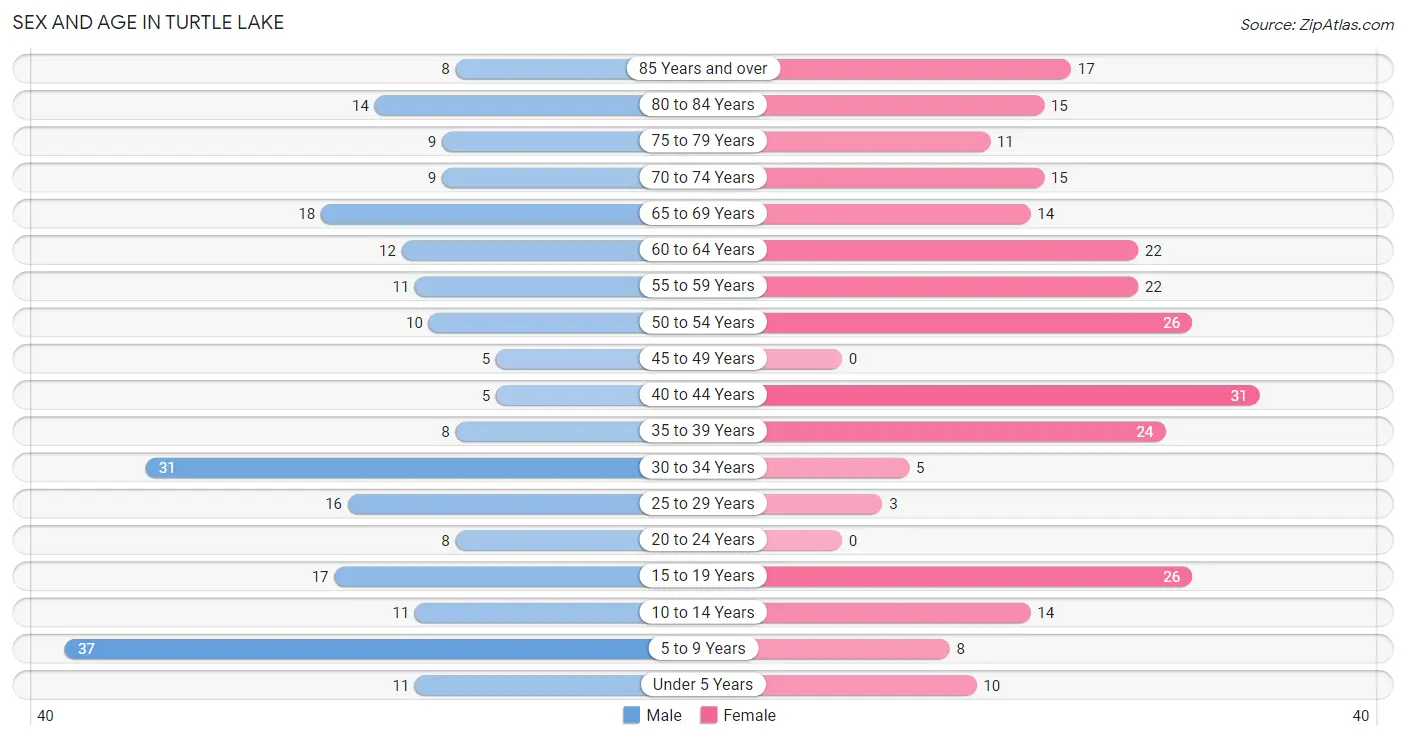
The most populous age groups in Turtle Lake are 5 to 9 Years (37 | 15.4%) for men and 40 to 44 Years (31 | 11.8%) for women.
| Age Bracket | Male | Female |
| Under 5 Years | 11 (4.6%) | 10 (3.8%) |
| 5 to 9 Years | 37 (15.4%) | 8 (3.0%) |
| 10 to 14 Years | 11 (4.6%) | 14 (5.3%) |
| 15 to 19 Years | 17 (7.1%) | 26 (9.9%) |
| 20 to 24 Years | 8 (3.3%) | 0 (0.0%) |
| 25 to 29 Years | 16 (6.7%) | 3 (1.1%) |
| 30 to 34 Years | 31 (12.9%) | 5 (1.9%) |
| 35 to 39 Years | 8 (3.3%) | 24 (9.1%) |
| 40 to 44 Years | 5 (2.1%) | 31 (11.8%) |
| 45 to 49 Years | 5 (2.1%) | 0 (0.0%) |
| 50 to 54 Years | 10 (4.2%) | 26 (9.9%) |
| 55 to 59 Years | 11 (4.6%) | 22 (8.4%) |
| 60 to 64 Years | 12 (5.0%) | 22 (8.4%) |
| 65 to 69 Years | 18 (7.5%) | 14 (5.3%) |
| 70 to 74 Years | 9 (3.7%) | 15 (5.7%) |
| 75 to 79 Years | 9 (3.7%) | 11 (4.2%) |
| 80 to 84 Years | 14 (5.8%) | 15 (5.7%) |
| 85 Years and over | 8 (3.3%) | 17 (6.5%) |
| Total | 240 (100.0%) | 263 (100.0%) |
Families and Households in Turtle Lake
Median Family Size in Turtle Lake
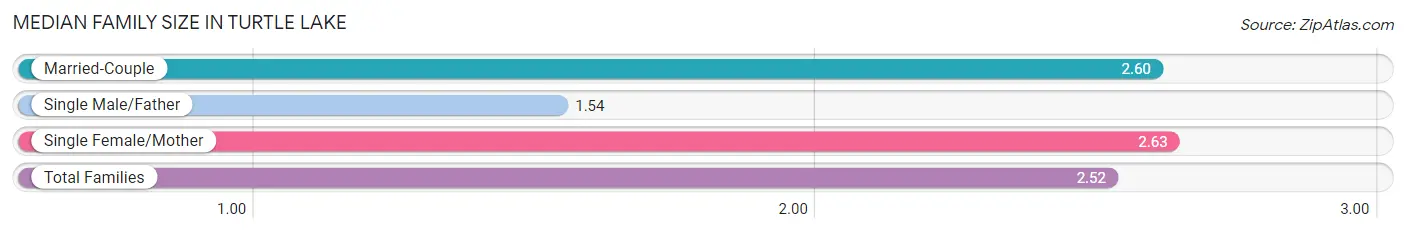
The median family size in Turtle Lake is 2.52 persons per family, with single female/mother families (46 | 28.9%) accounting for the largest median family size of 2.63 persons per family. On the other hand, single male/father families (13 | 8.2%) represent the smallest median family size with 1.54 persons per family.
| Family Type | # Families | Family Size |
| Married-Couple | 100 (62.9%) | 2.60 |
| Single Male/Father | 13 (8.2%) | 1.54 |
| Single Female/Mother | 46 (28.9%) | 2.63 |
| Total Families | 159 (100.0%) | 2.52 |
Median Household Size in Turtle Lake
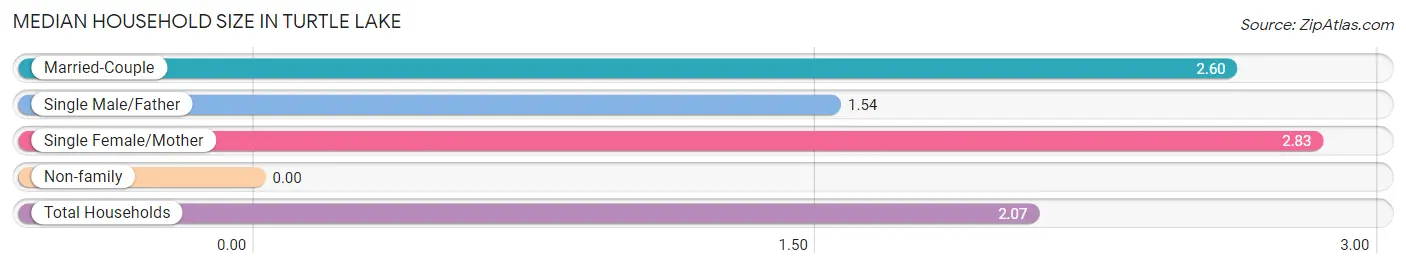
| Household Type | # Households | Household Size |
| Married-Couple | 100 (42.5%) | 2.60 |
| Single Male/Father | 13 (5.5%) | 1.54 |
| Single Female/Mother | 46 (19.6%) | 2.83 |
| Non-family | 76 (32.3%) | - |
| Total Households | 235 (100.0%) | 2.07 |
Household Size by Marriage Status in Turtle Lake
Out of a total of 235 households in Turtle Lake, 159 (67.7%) are family households, while 76 (32.3%) are nonfamily households. The most numerous type of family households are 2-person households, comprising 77, and the most common type of nonfamily households are 1-person households, comprising 76.
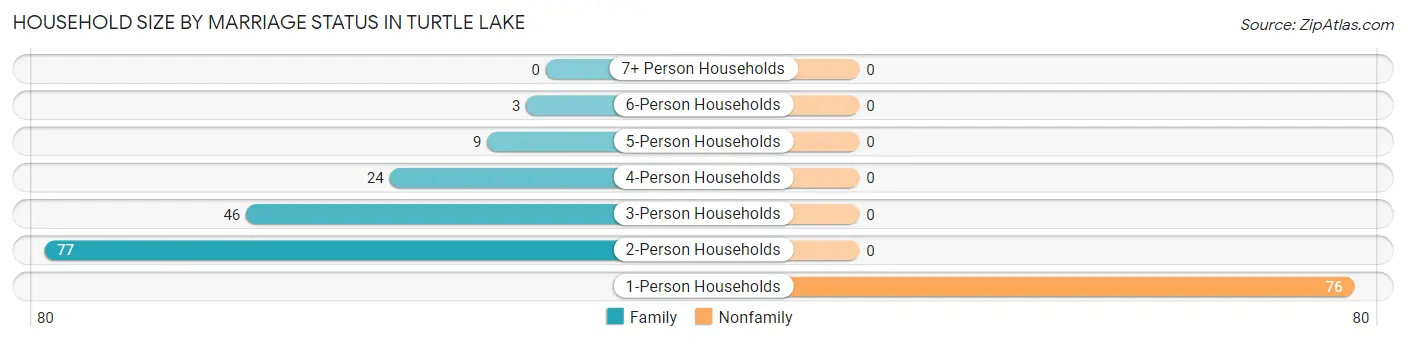
| Household Size | Family Households | Nonfamily Households |
| 1-Person Households | - | 76 (32.3%) |
| 2-Person Households | 77 (32.8%) | 0 (0.0%) |
| 3-Person Households | 46 (19.6%) | 0 (0.0%) |
| 4-Person Households | 24 (10.2%) | 0 (0.0%) |
| 5-Person Households | 9 (3.8%) | 0 (0.0%) |
| 6-Person Households | 3 (1.3%) | 0 (0.0%) |
| 7+ Person Households | 0 (0.0%) | 0 (0.0%) |
| Total | 159 (67.7%) | 76 (32.3%) |
Female Fertility in Turtle Lake
Fertility by Age in Turtle Lake
Average fertility rate in Turtle Lake is 92.0 births per 1,000 women. Women in the age bracket of 20 to 34 years have the highest fertility rate with 250.0 births per 1,000 women. Women in the age bracket of 35 to 50 years acount for 80.0% of all women with births.
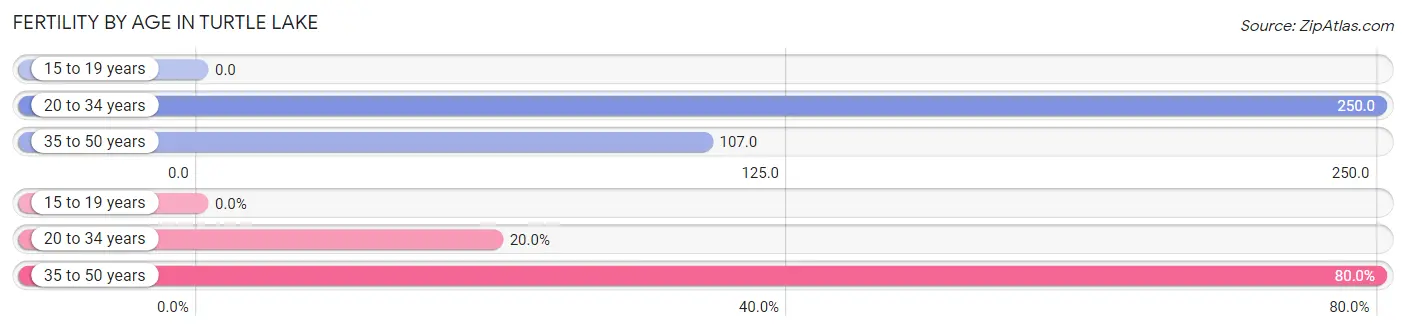
| Age Bracket | Women with Births | Births / 1,000 Women |
| 15 to 19 years | 0 (0.0%) | 0.0 |
| 20 to 34 years | 2 (20.0%) | 250.0 |
| 35 to 50 years | 8 (80.0%) | 107.0 |
| Total | 10 (100.0%) | 92.0 |
Fertility by Age by Marriage Status in Turtle Lake
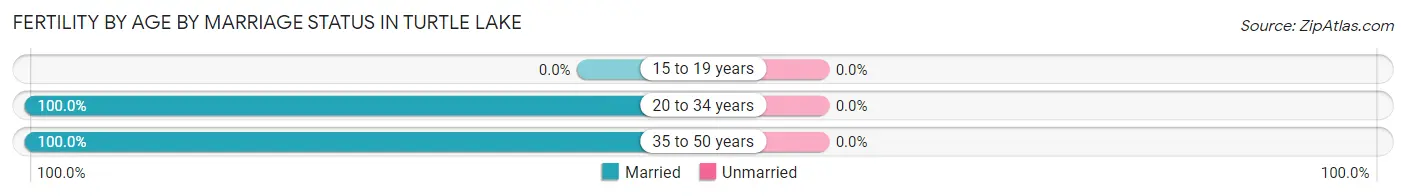
| Age Bracket | Married | Unmarried |
| 15 to 19 years | 0 (0.0%) | 0 (0.0%) |
| 20 to 34 years | 2 (100.0%) | 0 (0.0%) |
| 35 to 50 years | 8 (100.0%) | 0 (0.0%) |
| Total | 10 (100.0%) | 0 (0.0%) |
Fertility by Education in Turtle Lake
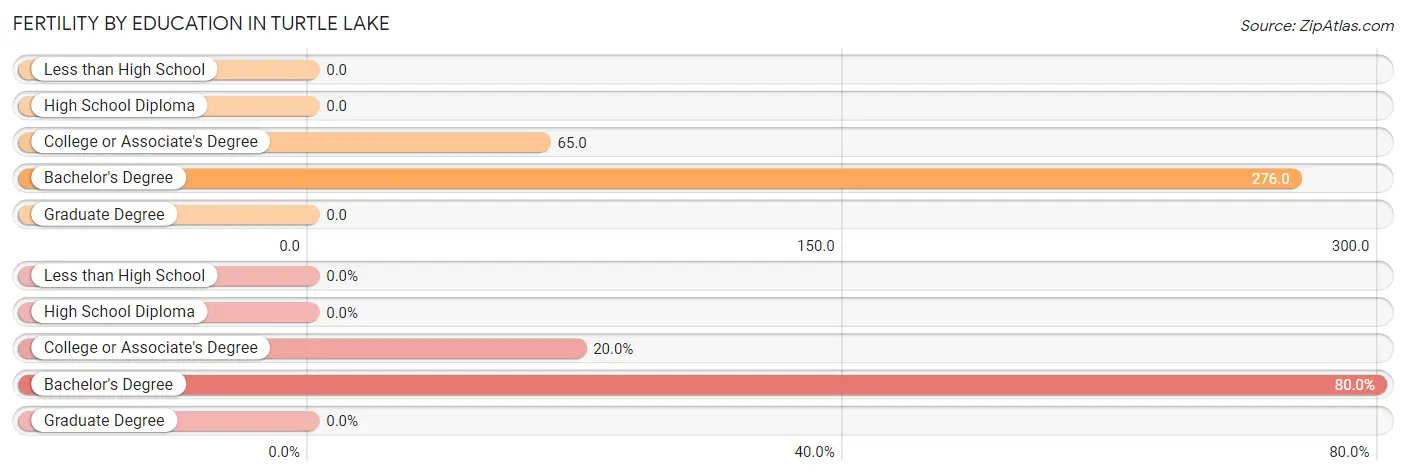
| Educational Attainment | Women with Births | Births / 1,000 Women |
| Less than High School | 0 (0.0%) | 0.0 |
| High School Diploma | 0 (0.0%) | 0.0 |
| College or Associate's Degree | 2 (20.0%) | 65.0 |
| Bachelor's Degree | 8 (80.0%) | 276.0 |
| Graduate Degree | 0 (0.0%) | 0.0 |
| Total | 10 (100.0%) | 92.0 |
Fertility by Education by Marriage Status in Turtle Lake
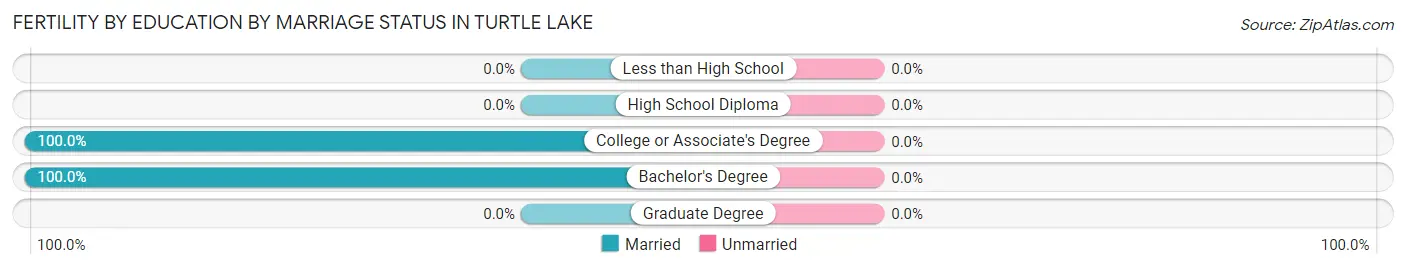
| Educational Attainment | Married | Unmarried |
| Less than High School | 0 (0.0%) | 0 (0.0%) |
| High School Diploma | 0 (0.0%) | 0 (0.0%) |
| College or Associate's Degree | 2 (100.0%) | 0 (0.0%) |
| Bachelor's Degree | 8 (100.0%) | 0 (0.0%) |
| Graduate Degree | 0 (0.0%) | 0 (0.0%) |
| Total | 10 (100.0%) | 0 (0.0%) |
Employment Characteristics in Turtle Lake
Employment by Class of Employer in Turtle Lake
Among the 219 employed individuals in Turtle Lake, private company employees (138 | 63.0%), not-for-profit organizations (33 | 15.1%), and local government employees (16 | 7.3%) make up the most common classes of employment.
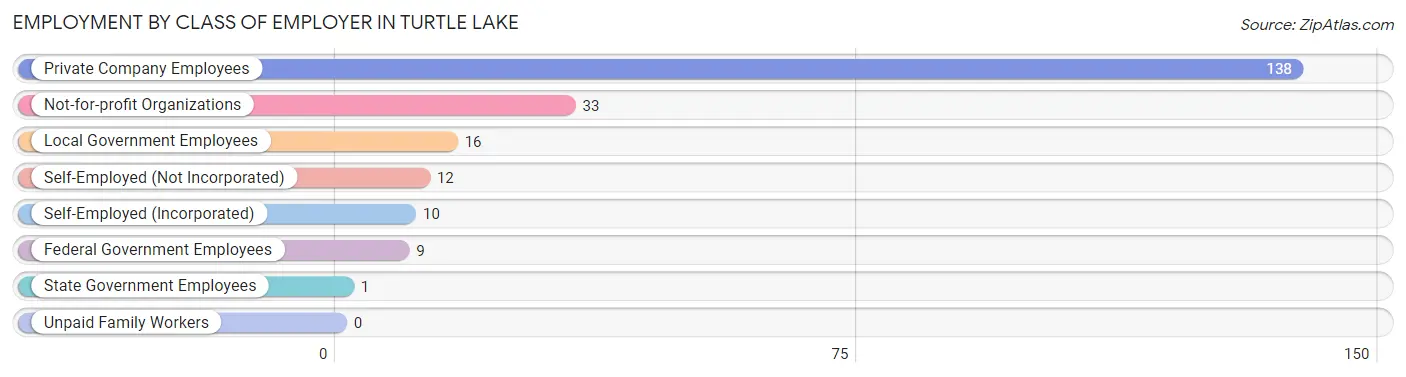
| Employer Class | # Employees | % Employees |
| Private Company Employees | 138 | 63.0% |
| Self-Employed (Incorporated) | 10 | 4.6% |
| Self-Employed (Not Incorporated) | 12 | 5.5% |
| Not-for-profit Organizations | 33 | 15.1% |
| Local Government Employees | 16 | 7.3% |
| State Government Employees | 1 | 0.5% |
| Federal Government Employees | 9 | 4.1% |
| Unpaid Family Workers | 0 | 0.0% |
| Total | 219 | 100.0% |
Employment Status by Age in Turtle Lake
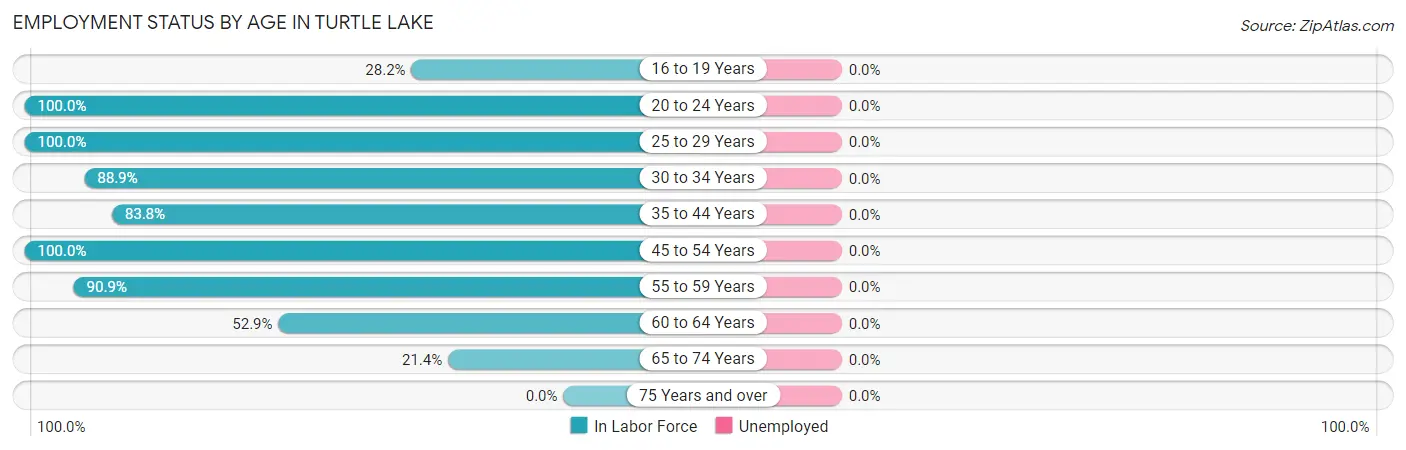
| Age Bracket | In Labor Force | Unemployed |
| 16 to 19 Years | 11 (28.2%) | 0 (0.0%) |
| 20 to 24 Years | 8 (100.0%) | 0 (0.0%) |
| 25 to 29 Years | 19 (100.0%) | 0 (0.0%) |
| 30 to 34 Years | 32 (88.9%) | 0 (0.0%) |
| 35 to 44 Years | 57 (83.8%) | 0 (0.0%) |
| 45 to 54 Years | 41 (100.0%) | 0 (0.0%) |
| 55 to 59 Years | 30 (90.9%) | 0 (0.0%) |
| 60 to 64 Years | 18 (52.9%) | 0 (0.0%) |
| 65 to 74 Years | 12 (21.4%) | 0 (0.0%) |
| 75 Years and over | 0 (0.0%) | 0 (0.0%) |
| Total | 228 (55.9%) | 0 (0.0%) |
Employment Status by Educational Attainment in Turtle Lake
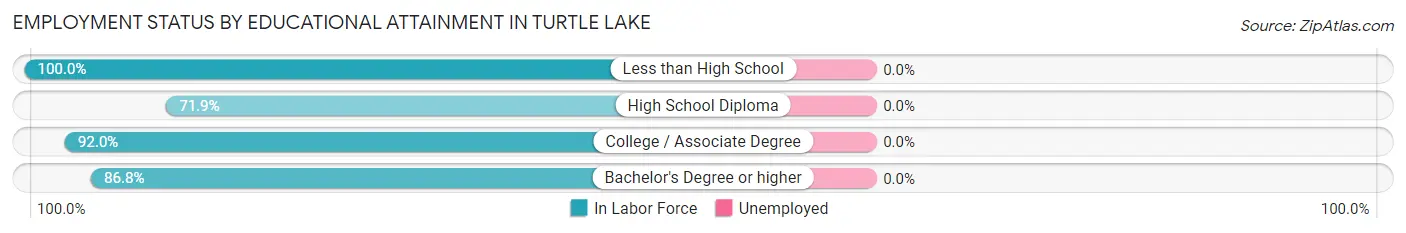
| Educational Attainment | In Labor Force | Unemployed |
| Less than High School | 1 (100.0%) | 0 (0.0%) |
| High School Diploma | 46 (71.9%) | 0 (0.0%) |
| College / Associate Degree | 104 (92.0%) | 0 (0.0%) |
| Bachelor's Degree or higher | 46 (86.8%) | 0 (0.0%) |
| Total | 197 (85.3%) | 0 (0.0%) |
Employment Occupations by Sex in Turtle Lake
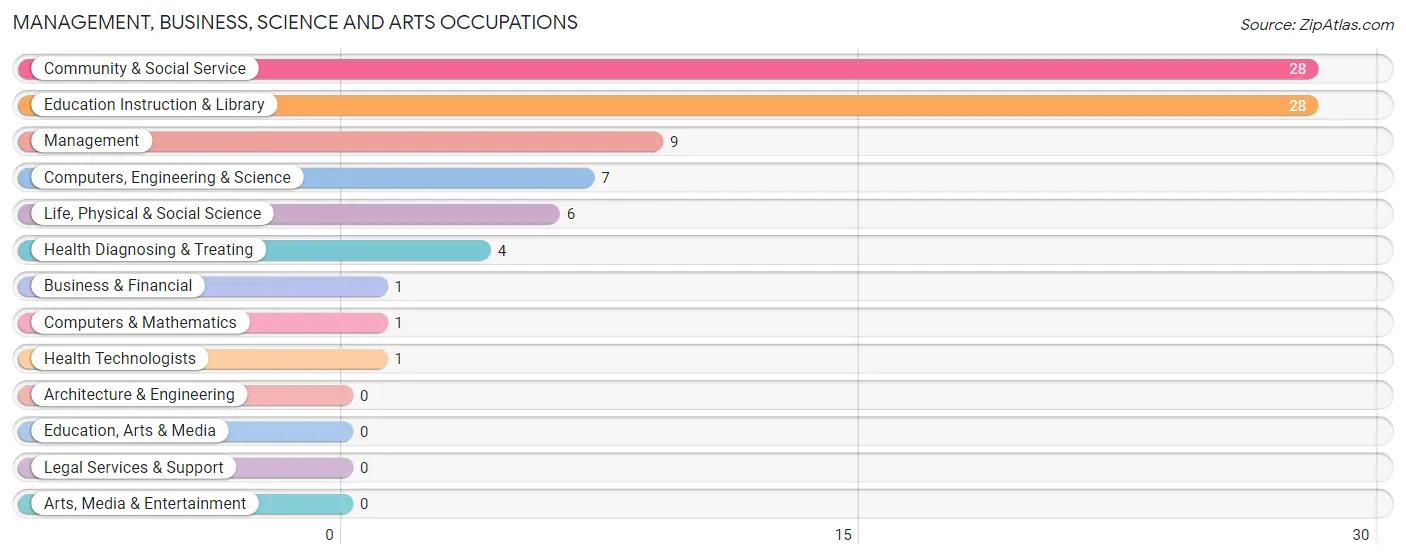
Management, Business, Science and Arts Occupations
The most common Management, Business, Science and Arts occupations in Turtle Lake are Community & Social Service (28 | 12.3%), Education Instruction & Library (28 | 12.3%), Management (9 | 4.0%), Computers, Engineering & Science (7 | 3.1%), and Life, Physical & Social Science (6 | 2.6%).
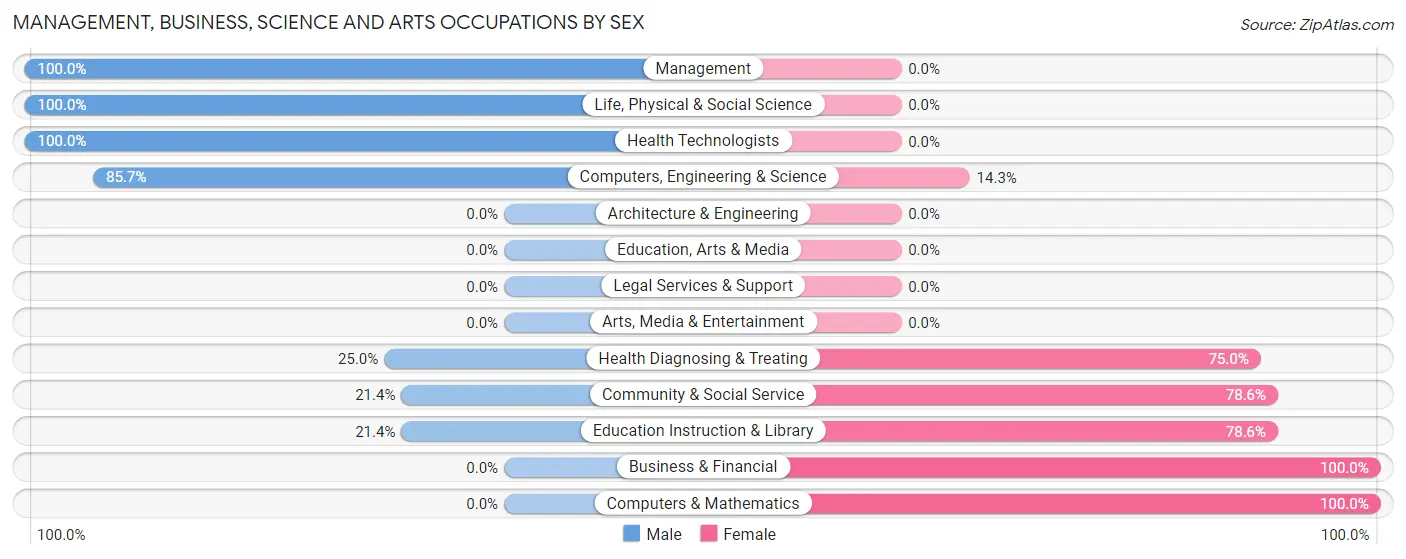
Management, Business, Science and Arts Occupations by Sex
Within the Management, Business, Science and Arts occupations in Turtle Lake, the most male-oriented occupations are Management (100.0%), Life, Physical & Social Science (100.0%), and Health Technologists (100.0%), while the most female-oriented occupations are Business & Financial (100.0%), Computers & Mathematics (100.0%), and Community & Social Service (78.6%).
| Occupation | Male | Female |
| Management | 9 (100.0%) | 0 (0.0%) |
| Business & Financial | 0 (0.0%) | 1 (100.0%) |
| Computers, Engineering & Science | 6 (85.7%) | 1 (14.3%) |
| Computers & Mathematics | 0 (0.0%) | 1 (100.0%) |
| Architecture & Engineering | 0 (0.0%) | 0 (0.0%) |
| Life, Physical & Social Science | 6 (100.0%) | 0 (0.0%) |
| Community & Social Service | 6 (21.4%) | 22 (78.6%) |
| Education, Arts & Media | 0 (0.0%) | 0 (0.0%) |
| Legal Services & Support | 0 (0.0%) | 0 (0.0%) |
| Education Instruction & Library | 6 (21.4%) | 22 (78.6%) |
| Arts, Media & Entertainment | 0 (0.0%) | 0 (0.0%) |
| Health Diagnosing & Treating | 1 (25.0%) | 3 (75.0%) |
| Health Technologists | 1 (100.0%) | 0 (0.0%) |
| Total (Category) | 22 (44.9%) | 27 (55.1%) |
| Total (Overall) | 106 (46.5%) | 122 (53.5%) |
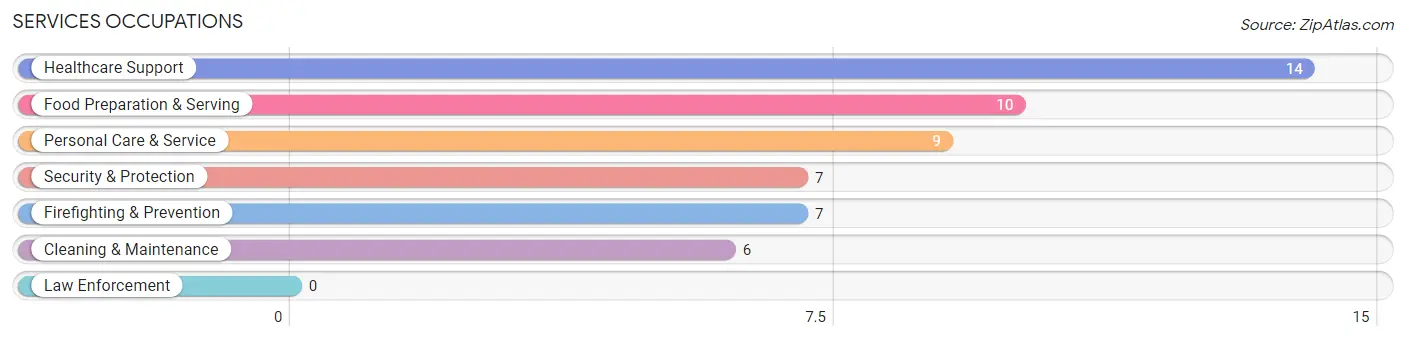
Services Occupations
The most common Services occupations in Turtle Lake are Healthcare Support (14 | 6.1%), Food Preparation & Serving (10 | 4.4%), Personal Care & Service (9 | 4.0%), Security & Protection (7 | 3.1%), and Firefighting & Prevention (7 | 3.1%).
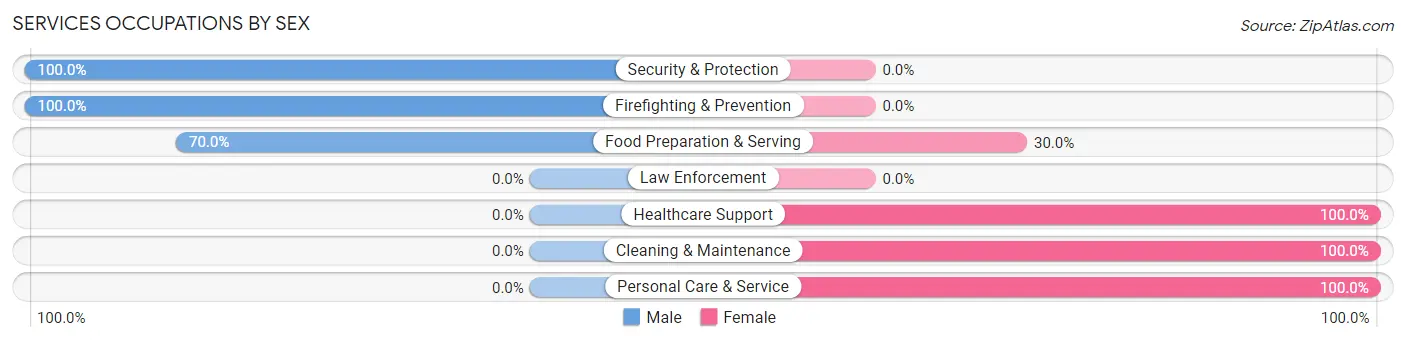
Services Occupations by Sex
Within the Services occupations in Turtle Lake, the most male-oriented occupations are Security & Protection (100.0%), Firefighting & Prevention (100.0%), and Food Preparation & Serving (70.0%), while the most female-oriented occupations are Healthcare Support (100.0%), Cleaning & Maintenance (100.0%), and Personal Care & Service (100.0%).
| Occupation | Male | Female |
| Healthcare Support | 0 (0.0%) | 14 (100.0%) |
| Security & Protection | 7 (100.0%) | 0 (0.0%) |
| Firefighting & Prevention | 7 (100.0%) | 0 (0.0%) |
| Law Enforcement | 0 (0.0%) | 0 (0.0%) |
| Food Preparation & Serving | 7 (70.0%) | 3 (30.0%) |
| Cleaning & Maintenance | 0 (0.0%) | 6 (100.0%) |
| Personal Care & Service | 0 (0.0%) | 9 (100.0%) |
| Total (Category) | 14 (30.4%) | 32 (69.6%) |
| Total (Overall) | 106 (46.5%) | 122 (53.5%) |
Sales and Office Occupations
The most common Sales and Office occupations in Turtle Lake are Office & Administration (35 | 15.3%), and Sales & Related (12 | 5.3%).
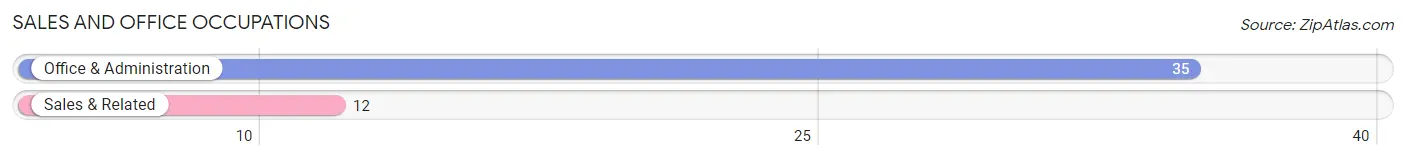
Sales and Office Occupations by Sex
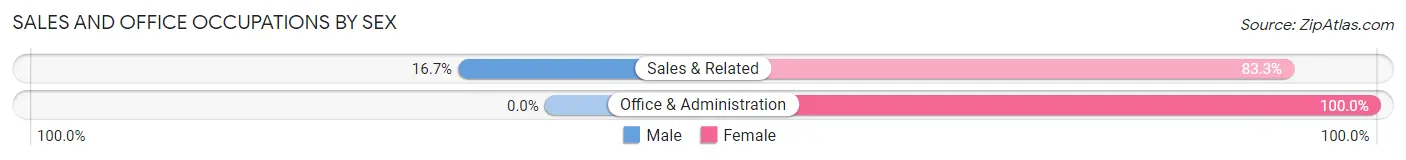
| Occupation | Male | Female |
| Sales & Related | 2 (16.7%) | 10 (83.3%) |
| Office & Administration | 0 (0.0%) | 35 (100.0%) |
| Total (Category) | 2 (4.3%) | 45 (95.7%) |
| Total (Overall) | 106 (46.5%) | 122 (53.5%) |
Natural Resources, Construction and Maintenance Occupations
The most common Natural Resources, Construction and Maintenance occupations in Turtle Lake are Construction & Extraction (20 | 8.8%), Installation, Maintenance & Repair (14 | 6.1%), and Farming, Fishing & Forestry (5 | 2.2%).
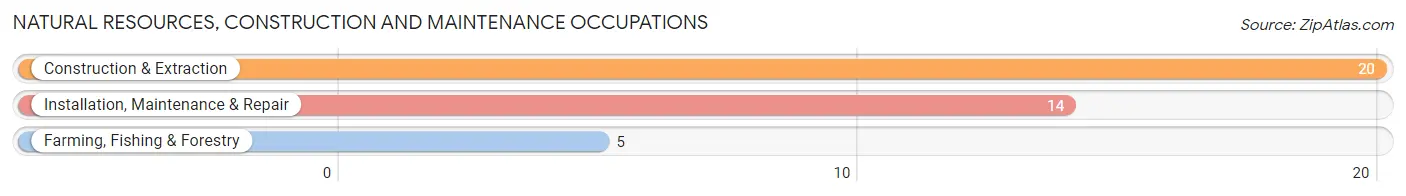
Natural Resources, Construction and Maintenance Occupations by Sex
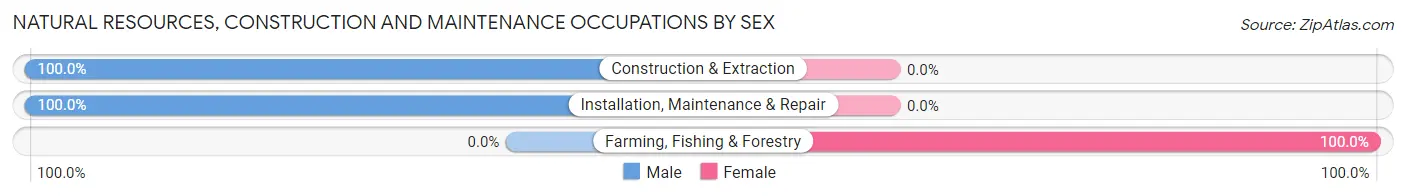
| Occupation | Male | Female |
| Farming, Fishing & Forestry | 0 (0.0%) | 5 (100.0%) |
| Construction & Extraction | 20 (100.0%) | 0 (0.0%) |
| Installation, Maintenance & Repair | 14 (100.0%) | 0 (0.0%) |
| Total (Category) | 34 (87.2%) | 5 (12.8%) |
| Total (Overall) | 106 (46.5%) | 122 (53.5%) |
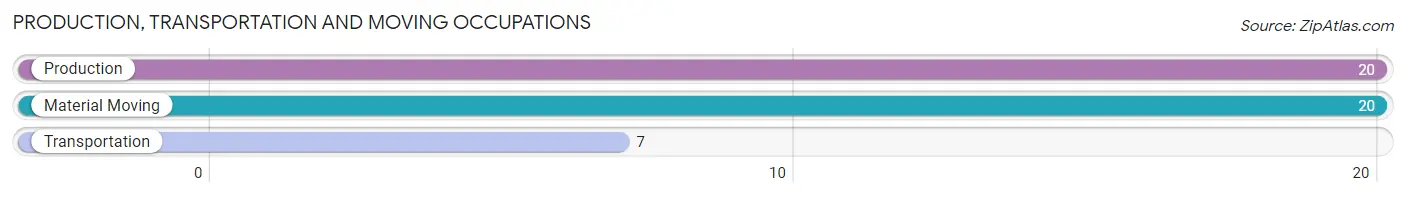
Production, Transportation and Moving Occupations
The most common Production, Transportation and Moving occupations in Turtle Lake are Production (20 | 8.8%), Material Moving (20 | 8.8%), and Transportation (7 | 3.1%).
Production, Transportation and Moving Occupations by Sex
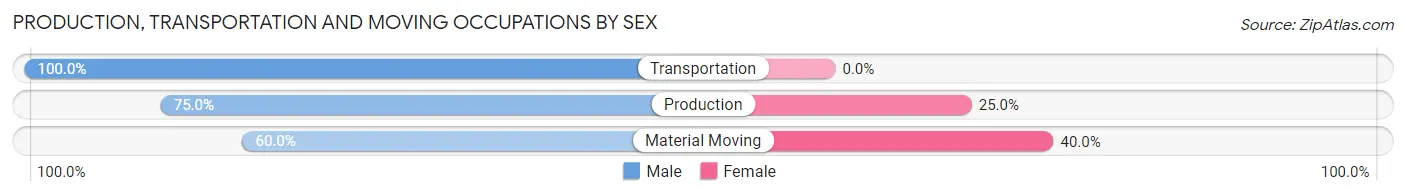
| Occupation | Male | Female |
| Production | 15 (75.0%) | 5 (25.0%) |
| Transportation | 7 (100.0%) | 0 (0.0%) |
| Material Moving | 12 (60.0%) | 8 (40.0%) |
| Total (Category) | 34 (72.3%) | 13 (27.7%) |
| Total (Overall) | 106 (46.5%) | 122 (53.5%) |
Employment Industries by Sex in Turtle Lake
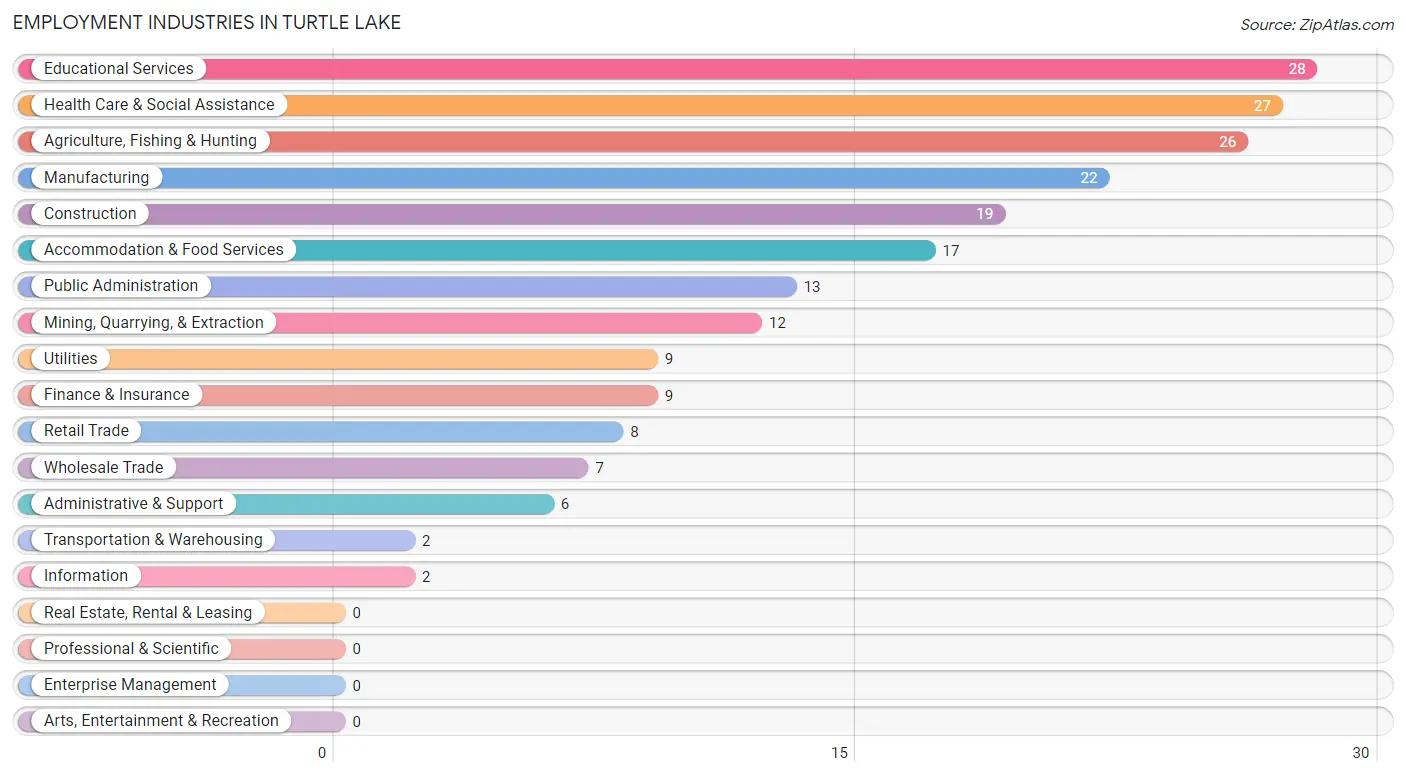
Employment Industries in Turtle Lake
The major employment industries in Turtle Lake include Educational Services (28 | 12.3%), Health Care & Social Assistance (27 | 11.8%), Agriculture, Fishing & Hunting (26 | 11.4%), Manufacturing (22 | 9.7%), and Construction (19 | 8.3%).
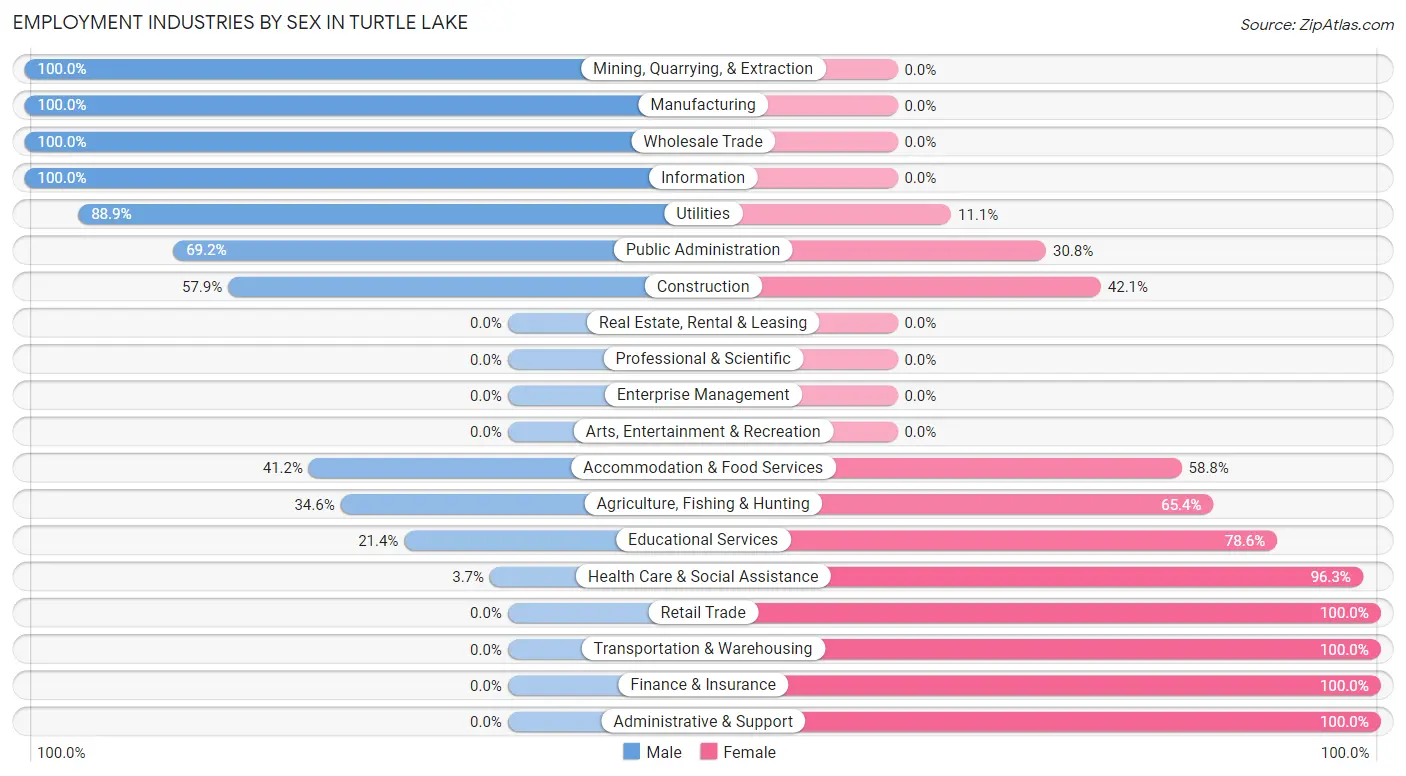
Employment Industries by Sex in Turtle Lake
The Turtle Lake industries that see more men than women are Mining, Quarrying, & Extraction (100.0%), Manufacturing (100.0%), and Wholesale Trade (100.0%), whereas the industries that tend to have a higher number of women are Retail Trade (100.0%), Transportation & Warehousing (100.0%), and Finance & Insurance (100.0%).
| Industry | Male | Female |
| Agriculture, Fishing & Hunting | 9 (34.6%) | 17 (65.4%) |
| Mining, Quarrying, & Extraction | 12 (100.0%) | 0 (0.0%) |
| Construction | 11 (57.9%) | 8 (42.1%) |
| Manufacturing | 22 (100.0%) | 0 (0.0%) |
| Wholesale Trade | 7 (100.0%) | 0 (0.0%) |
| Retail Trade | 0 (0.0%) | 8 (100.0%) |
| Transportation & Warehousing | 0 (0.0%) | 2 (100.0%) |
| Utilities | 8 (88.9%) | 1 (11.1%) |
| Information | 2 (100.0%) | 0 (0.0%) |
| Finance & Insurance | 0 (0.0%) | 9 (100.0%) |
| Real Estate, Rental & Leasing | 0 (0.0%) | 0 (0.0%) |
| Professional & Scientific | 0 (0.0%) | 0 (0.0%) |
| Enterprise Management | 0 (0.0%) | 0 (0.0%) |
| Administrative & Support | 0 (0.0%) | 6 (100.0%) |
| Educational Services | 6 (21.4%) | 22 (78.6%) |
| Health Care & Social Assistance | 1 (3.7%) | 26 (96.3%) |
| Arts, Entertainment & Recreation | 0 (0.0%) | 0 (0.0%) |
| Accommodation & Food Services | 7 (41.2%) | 10 (58.8%) |
| Public Administration | 9 (69.2%) | 4 (30.8%) |
| Total | 106 (46.5%) | 122 (53.5%) |
Education in Turtle Lake
School Enrollment in Turtle Lake
The most common levels of schooling among the 113 students in Turtle Lake are high school (45 | 39.8%), elementary school (30 | 26.6%), and middle school (17 | 15.0%).
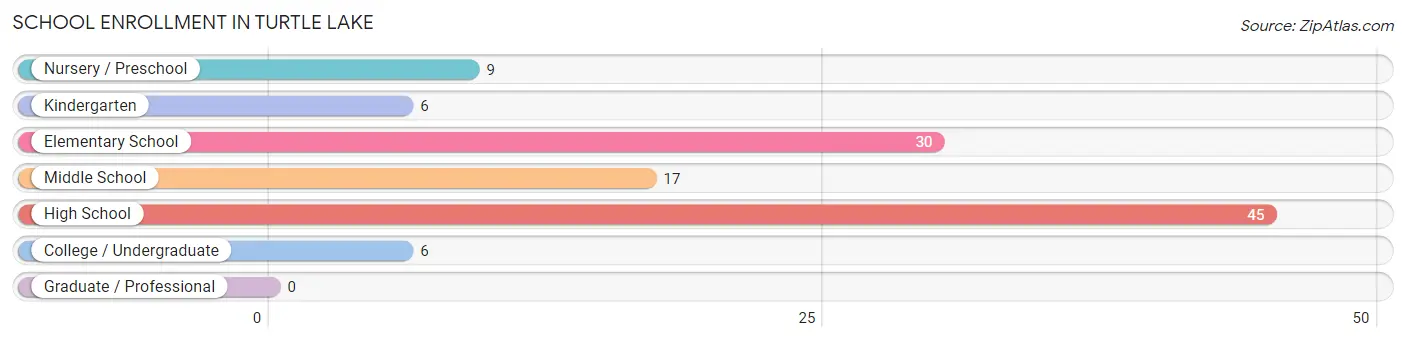
| School Level | # Students | % Students |
| Nursery / Preschool | 9 | 8.0% |
| Kindergarten | 6 | 5.3% |
| Elementary School | 30 | 26.6% |
| Middle School | 17 | 15.0% |
| High School | 45 | 39.8% |
| College / Undergraduate | 6 | 5.3% |
| Graduate / Professional | 0 | 0.0% |
| Total | 113 | 100.0% |
School Enrollment by Age by Funding Source in Turtle Lake
Out of a total of 113 students who are enrolled in schools in Turtle Lake, 10 (8.8%) attend a private institution, while the remaining 103 (91.2%) are enrolled in public schools. The age group of 5 to 9 year old has the highest likelihood of being enrolled in private schools, with 10 (22.2% in the age bracket) enrolled. Conversely, the age group of 10 to 14 year olds has the lowest likelihood of being enrolled in a private school, with 25 (100.0% in the age bracket) attending a public institution.
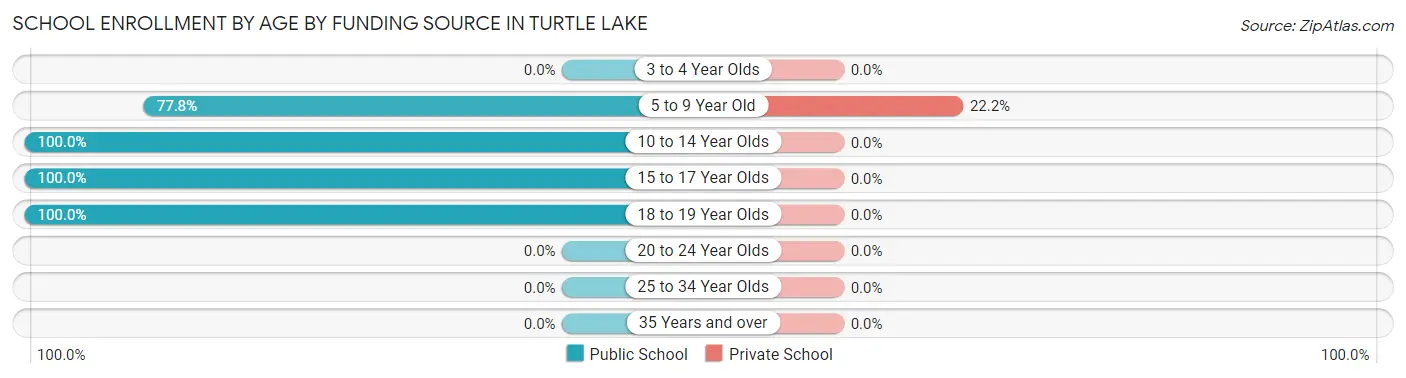
| Age Bracket | Public School | Private School |
| 3 to 4 Year Olds | 0 (0.0%) | 0 (0.0%) |
| 5 to 9 Year Old | 35 (77.8%) | 10 (22.2%) |
| 10 to 14 Year Olds | 25 (100.0%) | 0 (0.0%) |
| 15 to 17 Year Olds | 12 (100.0%) | 0 (0.0%) |
| 18 to 19 Year Olds | 31 (100.0%) | 0 (0.0%) |
| 20 to 24 Year Olds | 0 (0.0%) | 0 (0.0%) |
| 25 to 34 Year Olds | 0 (0.0%) | 0 (0.0%) |
| 35 Years and over | 0 (0.0%) | 0 (0.0%) |
| Total | 103 (91.2%) | 10 (8.8%) |
Educational Attainment by Field of Study in Turtle Lake
Education (48 | 57.1%), bio, nature & agricultural (11 | 13.1%), business (8 | 9.5%), liberal arts & history (8 | 9.5%), and science & technology (7 | 8.3%) are the most common fields of study among 84 individuals in Turtle Lake who have obtained a bachelor's degree or higher.
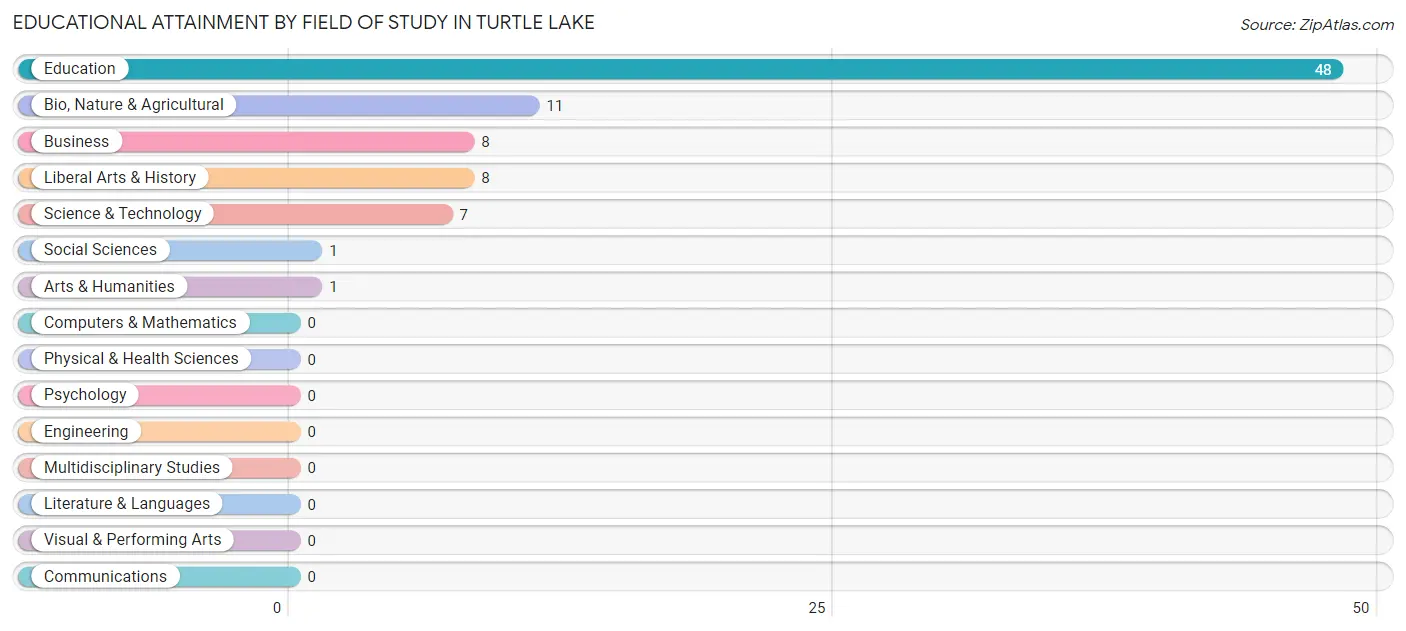
| Field of Study | # Graduates | % Graduates |
| Computers & Mathematics | 0 | 0.0% |
| Bio, Nature & Agricultural | 11 | 13.1% |
| Physical & Health Sciences | 0 | 0.0% |
| Psychology | 0 | 0.0% |
| Social Sciences | 1 | 1.2% |
| Engineering | 0 | 0.0% |
| Multidisciplinary Studies | 0 | 0.0% |
| Science & Technology | 7 | 8.3% |
| Business | 8 | 9.5% |
| Education | 48 | 57.1% |
| Literature & Languages | 0 | 0.0% |
| Liberal Arts & History | 8 | 9.5% |
| Visual & Performing Arts | 0 | 0.0% |
| Communications | 0 | 0.0% |
| Arts & Humanities | 1 | 1.2% |
| Total | 84 | 100.0% |
Transportation & Commute in Turtle Lake
Vehicle Availability by Sex in Turtle Lake
The most prevalent vehicle ownership categories in Turtle Lake are males with 3 vehicles (34, accounting for 32.1%) and females with 3 vehicles (37, making up 30.1%).
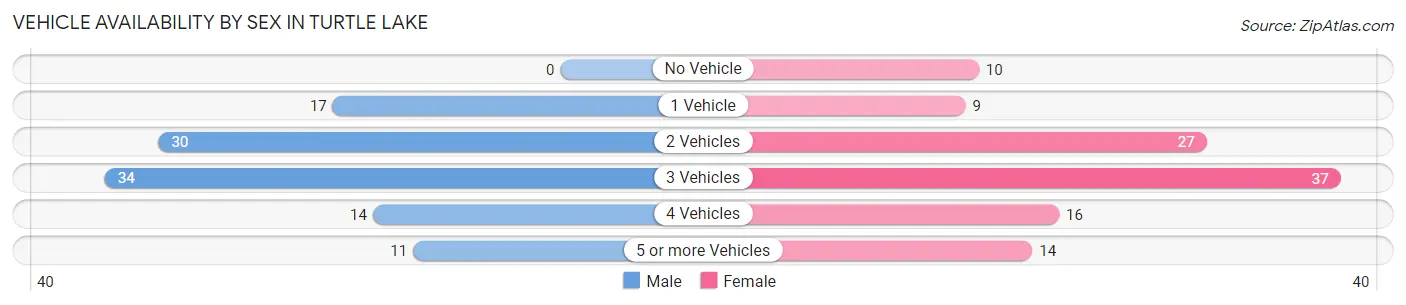
| Vehicles Available | Male | Female |
| No Vehicle | 0 (0.0%) | 10 (8.8%) |
| 1 Vehicle | 17 (16.0%) | 9 (8.0%) |
| 2 Vehicles | 30 (28.3%) | 27 (23.9%) |
| 3 Vehicles | 34 (32.1%) | 37 (32.7%) |
| 4 Vehicles | 14 (13.2%) | 16 (14.2%) |
| 5 or more Vehicles | 11 (10.4%) | 14 (12.4%) |
| Total | 106 (100.0%) | 113 (100.0%) |
Commute Time in Turtle Lake
The most frequently occuring commute durations in Turtle Lake are 5 to 9 minutes (54 commuters, 27.4%), less than 5 minutes (39 commuters, 19.8%), and 20 to 24 minutes (34 commuters, 17.3%).
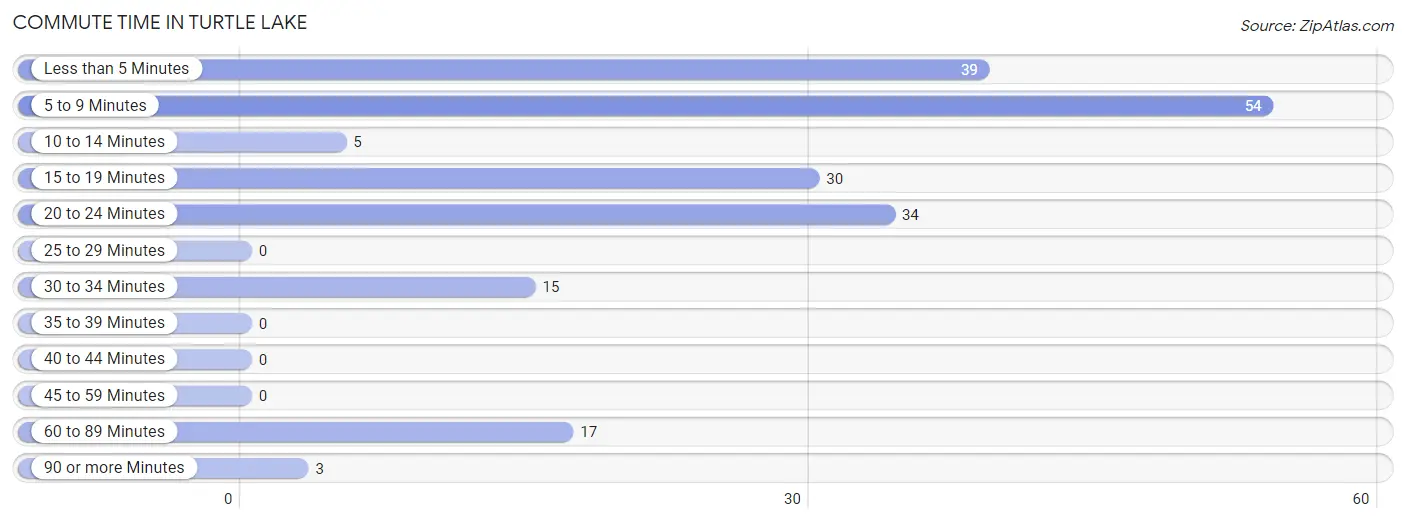
| Commute Time | # Commuters | % Commuters |
| Less than 5 Minutes | 39 | 19.8% |
| 5 to 9 Minutes | 54 | 27.4% |
| 10 to 14 Minutes | 5 | 2.5% |
| 15 to 19 Minutes | 30 | 15.2% |
| 20 to 24 Minutes | 34 | 17.3% |
| 25 to 29 Minutes | 0 | 0.0% |
| 30 to 34 Minutes | 15 | 7.6% |
| 35 to 39 Minutes | 0 | 0.0% |
| 40 to 44 Minutes | 0 | 0.0% |
| 45 to 59 Minutes | 0 | 0.0% |
| 60 to 89 Minutes | 17 | 8.6% |
| 90 or more Minutes | 3 | 1.5% |
Commute Time by Sex in Turtle Lake
The most common commute times in Turtle Lake are less than 5 minutes (18 commuters, 19.6%) for males and 5 to 9 minutes (37 commuters, 35.2%) for females.
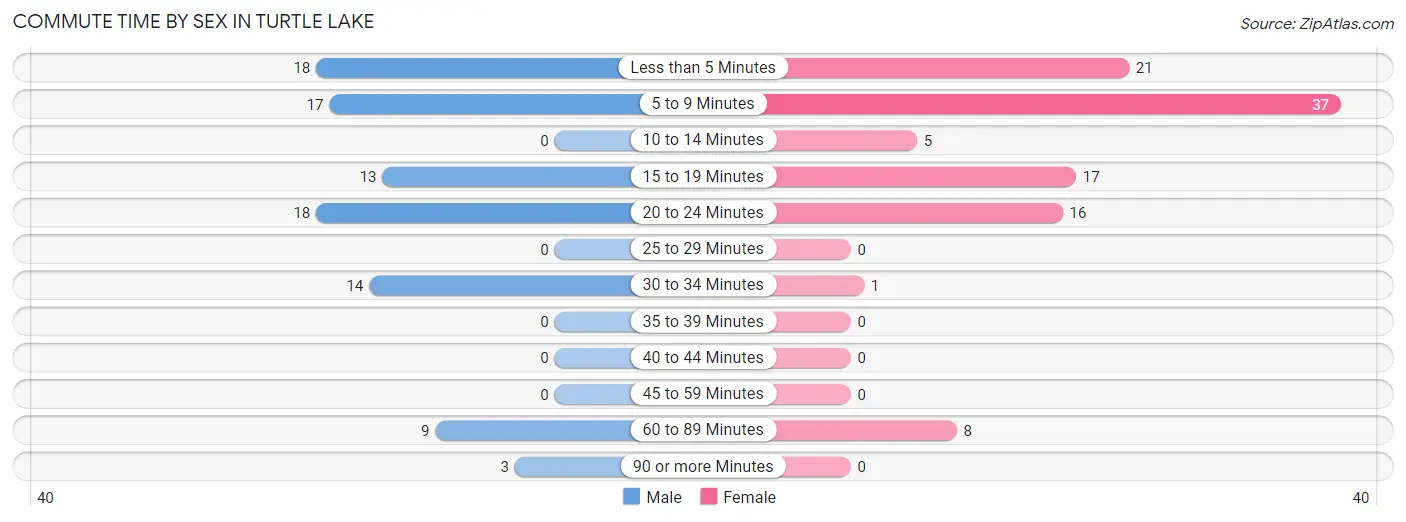
| Commute Time | Male | Female |
| Less than 5 Minutes | 18 (19.6%) | 21 (20.0%) |
| 5 to 9 Minutes | 17 (18.5%) | 37 (35.2%) |
| 10 to 14 Minutes | 0 (0.0%) | 5 (4.8%) |
| 15 to 19 Minutes | 13 (14.1%) | 17 (16.2%) |
| 20 to 24 Minutes | 18 (19.6%) | 16 (15.2%) |
| 25 to 29 Minutes | 0 (0.0%) | 0 (0.0%) |
| 30 to 34 Minutes | 14 (15.2%) | 1 (0.9%) |
| 35 to 39 Minutes | 0 (0.0%) | 0 (0.0%) |
| 40 to 44 Minutes | 0 (0.0%) | 0 (0.0%) |
| 45 to 59 Minutes | 0 (0.0%) | 0 (0.0%) |
| 60 to 89 Minutes | 9 (9.8%) | 8 (7.6%) |
| 90 or more Minutes | 3 (3.3%) | 0 (0.0%) |
Time of Departure to Work by Sex in Turtle Lake
The most frequent times of departure to work in Turtle Lake are 8:00 AM to 8:29 AM (30, 32.6%) for males and 7:30 AM to 7:59 AM (29, 27.6%) for females.
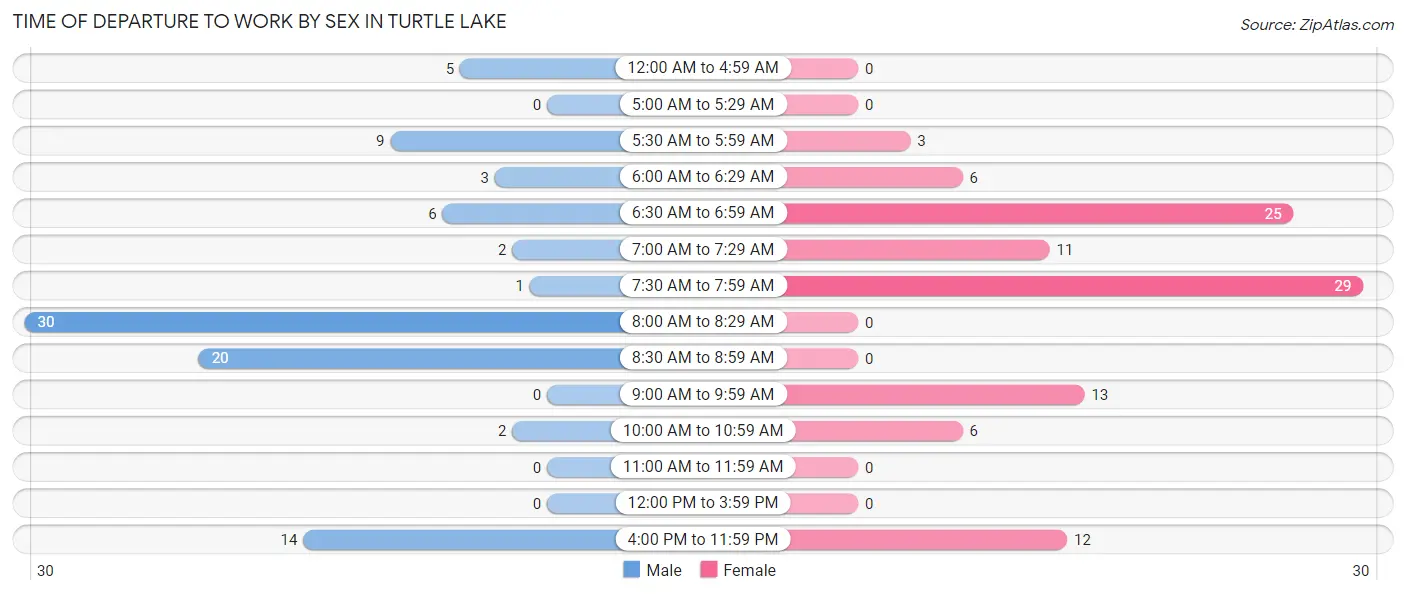
| Time of Departure | Male | Female |
| 12:00 AM to 4:59 AM | 5 (5.4%) | 0 (0.0%) |
| 5:00 AM to 5:29 AM | 0 (0.0%) | 0 (0.0%) |
| 5:30 AM to 5:59 AM | 9 (9.8%) | 3 (2.9%) |
| 6:00 AM to 6:29 AM | 3 (3.3%) | 6 (5.7%) |
| 6:30 AM to 6:59 AM | 6 (6.5%) | 25 (23.8%) |
| 7:00 AM to 7:29 AM | 2 (2.2%) | 11 (10.5%) |
| 7:30 AM to 7:59 AM | 1 (1.1%) | 29 (27.6%) |
| 8:00 AM to 8:29 AM | 30 (32.6%) | 0 (0.0%) |
| 8:30 AM to 8:59 AM | 20 (21.7%) | 0 (0.0%) |
| 9:00 AM to 9:59 AM | 0 (0.0%) | 13 (12.4%) |
| 10:00 AM to 10:59 AM | 2 (2.2%) | 6 (5.7%) |
| 11:00 AM to 11:59 AM | 0 (0.0%) | 0 (0.0%) |
| 12:00 PM to 3:59 PM | 0 (0.0%) | 0 (0.0%) |
| 4:00 PM to 11:59 PM | 14 (15.2%) | 12 (11.4%) |
| Total | 92 (100.0%) | 105 (100.0%) |
Housing Occupancy in Turtle Lake
Occupancy by Ownership in Turtle Lake
Of the total 235 dwellings in Turtle Lake, owner-occupied units account for 176 (74.9%), while renter-occupied units make up 59 (25.1%).
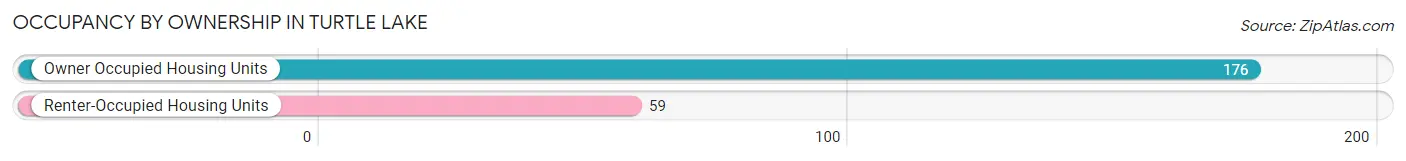
| Occupancy | # Housing Units | % Housing Units |
| Owner Occupied Housing Units | 176 | 74.9% |
| Renter-Occupied Housing Units | 59 | 25.1% |
| Total Occupied Housing Units | 235 | 100.0% |
Occupancy by Household Size in Turtle Lake
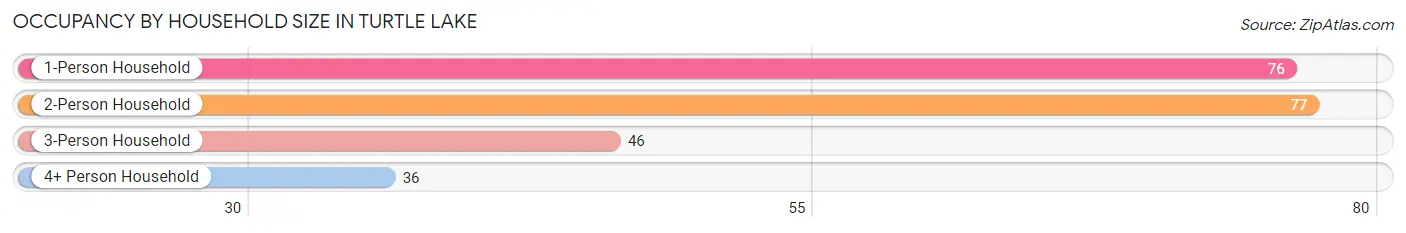
| Household Size | # Housing Units | % Housing Units |
| 1-Person Household | 76 | 32.3% |
| 2-Person Household | 77 | 32.8% |
| 3-Person Household | 46 | 19.6% |
| 4+ Person Household | 36 | 15.3% |
| Total Housing Units | 235 | 100.0% |
Occupancy by Ownership by Household Size in Turtle Lake
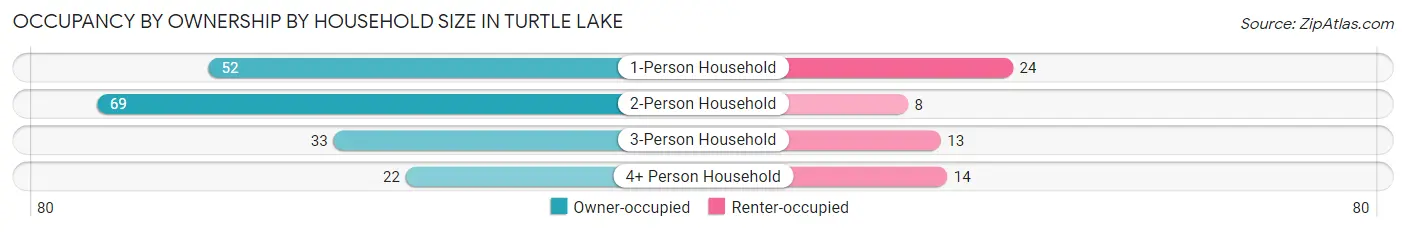
| Household Size | Owner-occupied | Renter-occupied |
| 1-Person Household | 52 (68.4%) | 24 (31.6%) |
| 2-Person Household | 69 (89.6%) | 8 (10.4%) |
| 3-Person Household | 33 (71.7%) | 13 (28.3%) |
| 4+ Person Household | 22 (61.1%) | 14 (38.9%) |
| Total Housing Units | 176 (74.9%) | 59 (25.1%) |
Occupancy by Educational Attainment in Turtle Lake
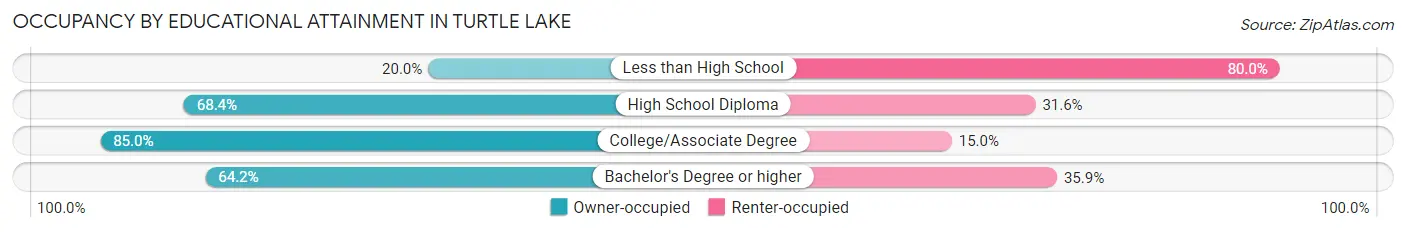
| Household Size | Owner-occupied | Renter-occupied |
| Less than High School | 1 (20.0%) | 4 (80.0%) |
| High School Diploma | 39 (68.4%) | 18 (31.6%) |
| College/Associate Degree | 102 (85.0%) | 18 (15.0%) |
| Bachelor's Degree or higher | 34 (64.1%) | 19 (35.8%) |
Occupancy by Age of Householder in Turtle Lake
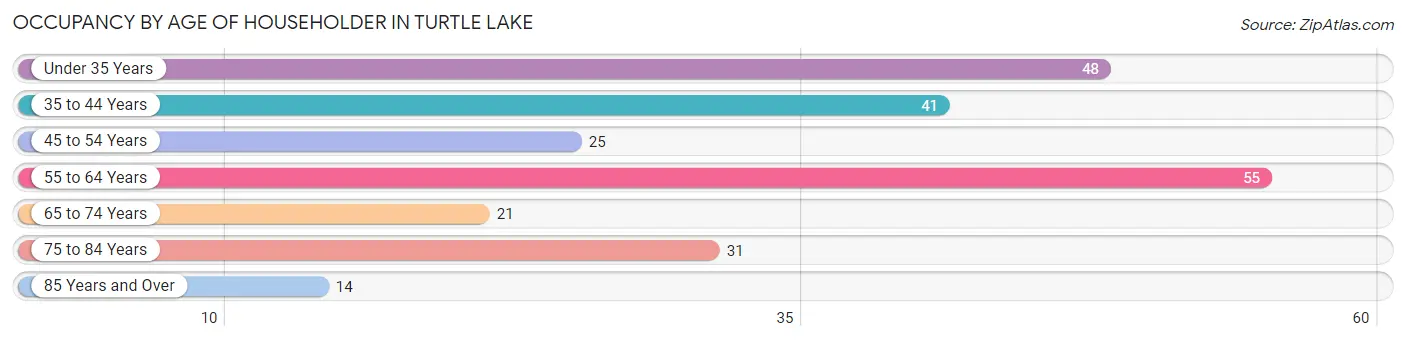
| Age Bracket | # Households | % Households |
| Under 35 Years | 48 | 20.4% |
| 35 to 44 Years | 41 | 17.4% |
| 45 to 54 Years | 25 | 10.6% |
| 55 to 64 Years | 55 | 23.4% |
| 65 to 74 Years | 21 | 8.9% |
| 75 to 84 Years | 31 | 13.2% |
| 85 Years and Over | 14 | 6.0% |
| Total | 235 | 100.0% |
Housing Finances in Turtle Lake
Median Income by Occupancy in Turtle Lake
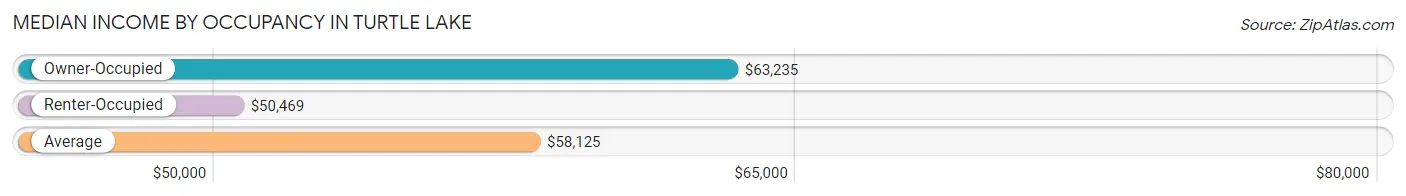
| Occupancy Type | # Households | Median Income |
| Owner-Occupied | 176 (74.9%) | $63,235 |
| Renter-Occupied | 59 (25.1%) | $50,469 |
| Average | 235 (100.0%) | $58,125 |
Occupancy by Householder Income Bracket in Turtle Lake
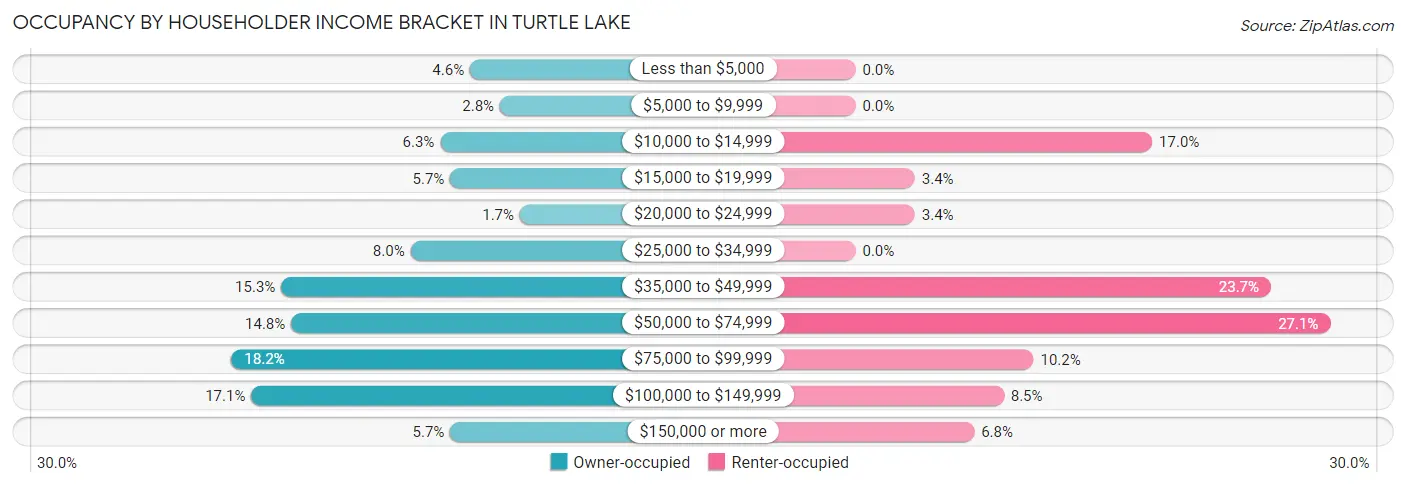
| Income Bracket | Owner-occupied | Renter-occupied |
| Less than $5,000 | 8 (4.5%) | 0 (0.0%) |
| $5,000 to $9,999 | 5 (2.8%) | 0 (0.0%) |
| $10,000 to $14,999 | 11 (6.2%) | 10 (17.0%) |
| $15,000 to $19,999 | 10 (5.7%) | 2 (3.4%) |
| $20,000 to $24,999 | 3 (1.7%) | 2 (3.4%) |
| $25,000 to $34,999 | 14 (8.0%) | 0 (0.0%) |
| $35,000 to $49,999 | 27 (15.3%) | 14 (23.7%) |
| $50,000 to $74,999 | 26 (14.8%) | 16 (27.1%) |
| $75,000 to $99,999 | 32 (18.2%) | 6 (10.2%) |
| $100,000 to $149,999 | 30 (17.1%) | 5 (8.5%) |
| $150,000 or more | 10 (5.7%) | 4 (6.8%) |
| Total | 176 (100.0%) | 59 (100.0%) |
Monthly Housing Cost Tiers in Turtle Lake
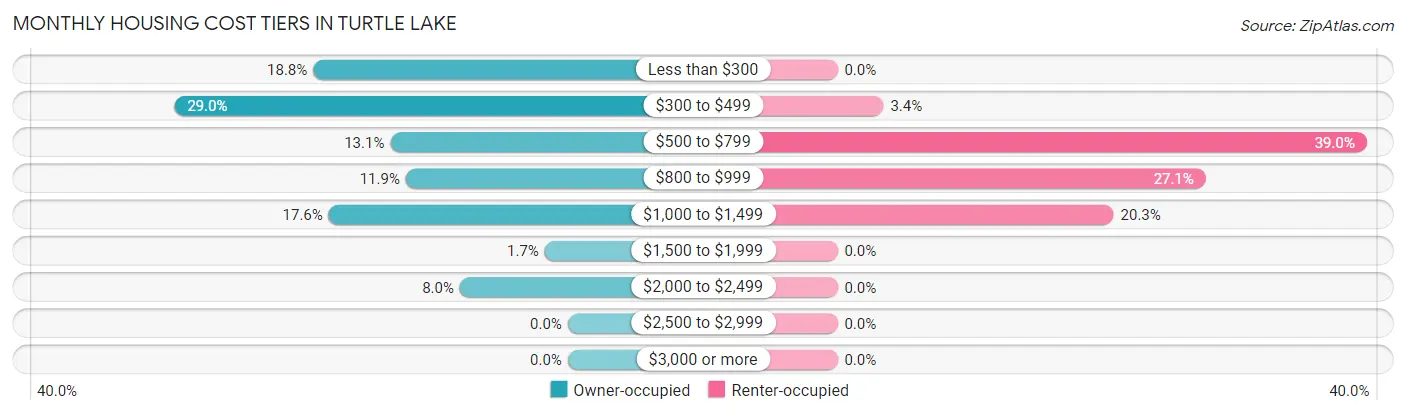
| Monthly Cost | Owner-occupied | Renter-occupied |
| Less than $300 | 33 (18.8%) | 0 (0.0%) |
| $300 to $499 | 51 (29.0%) | 2 (3.4%) |
| $500 to $799 | 23 (13.1%) | 23 (39.0%) |
| $800 to $999 | 21 (11.9%) | 16 (27.1%) |
| $1,000 to $1,499 | 31 (17.6%) | 12 (20.3%) |
| $1,500 to $1,999 | 3 (1.7%) | 0 (0.0%) |
| $2,000 to $2,499 | 14 (8.0%) | 0 (0.0%) |
| $2,500 to $2,999 | 0 (0.0%) | 0 (0.0%) |
| $3,000 or more | 0 (0.0%) | 0 (0.0%) |
| Total | 176 (100.0%) | 59 (100.0%) |
Physical Housing Characteristics in Turtle Lake
Housing Structures in Turtle Lake
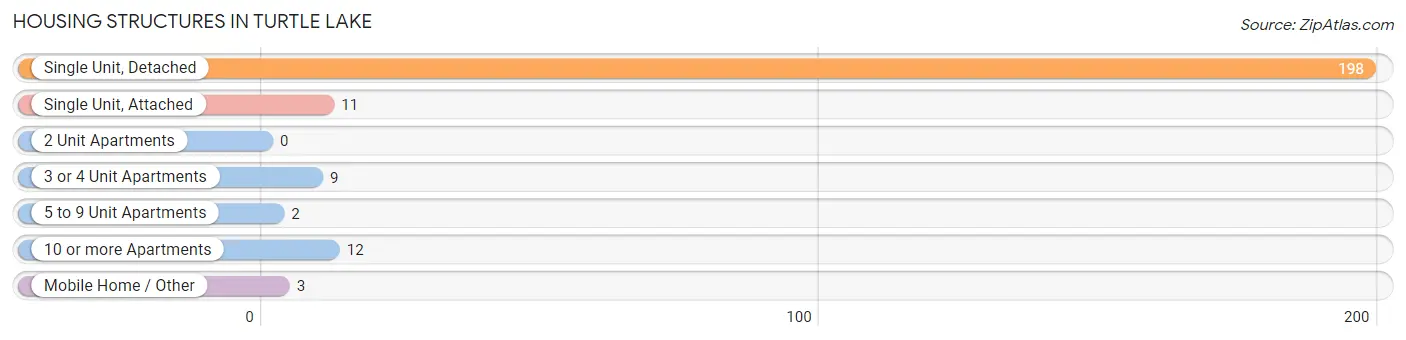
| Structure Type | # Housing Units | % Housing Units |
| Single Unit, Detached | 198 | 84.3% |
| Single Unit, Attached | 11 | 4.7% |
| 2 Unit Apartments | 0 | 0.0% |
| 3 or 4 Unit Apartments | 9 | 3.8% |
| 5 to 9 Unit Apartments | 2 | 0.9% |
| 10 or more Apartments | 12 | 5.1% |
| Mobile Home / Other | 3 | 1.3% |
| Total | 235 | 100.0% |
Housing Structures by Occupancy in Turtle Lake
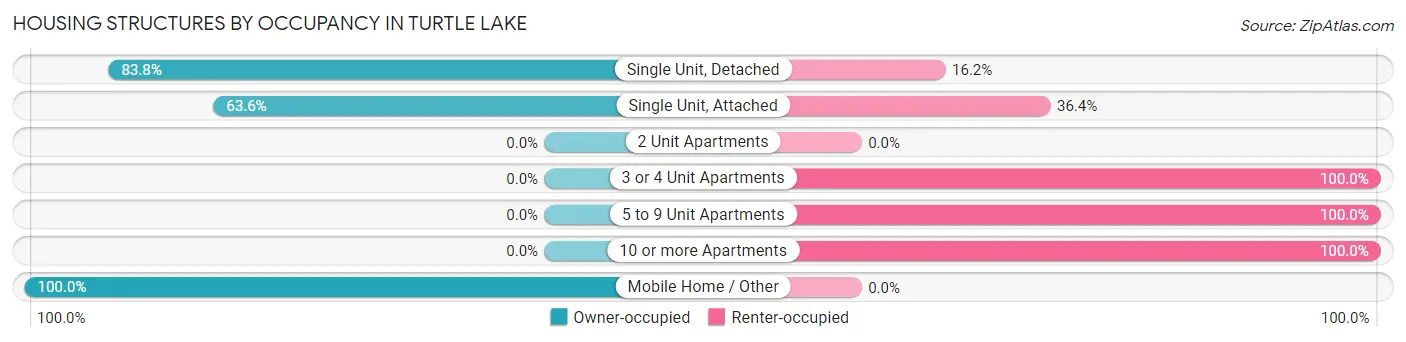
| Structure Type | Owner-occupied | Renter-occupied |
| Single Unit, Detached | 166 (83.8%) | 32 (16.2%) |
| Single Unit, Attached | 7 (63.6%) | 4 (36.4%) |
| 2 Unit Apartments | 0 (0.0%) | 0 (0.0%) |
| 3 or 4 Unit Apartments | 0 (0.0%) | 9 (100.0%) |
| 5 to 9 Unit Apartments | 0 (0.0%) | 2 (100.0%) |
| 10 or more Apartments | 0 (0.0%) | 12 (100.0%) |
| Mobile Home / Other | 3 (100.0%) | 0 (0.0%) |
| Total | 176 (74.9%) | 59 (25.1%) |
Housing Structures by Number of Rooms in Turtle Lake
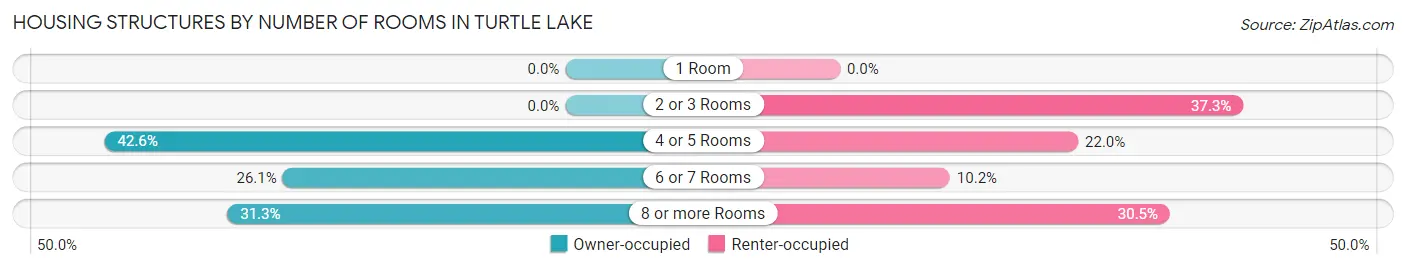
| Number of Rooms | Owner-occupied | Renter-occupied |
| 1 Room | 0 (0.0%) | 0 (0.0%) |
| 2 or 3 Rooms | 0 (0.0%) | 22 (37.3%) |
| 4 or 5 Rooms | 75 (42.6%) | 13 (22.0%) |
| 6 or 7 Rooms | 46 (26.1%) | 6 (10.2%) |
| 8 or more Rooms | 55 (31.2%) | 18 (30.5%) |
| Total | 176 (100.0%) | 59 (100.0%) |
Housing Structure by Heating Type in Turtle Lake
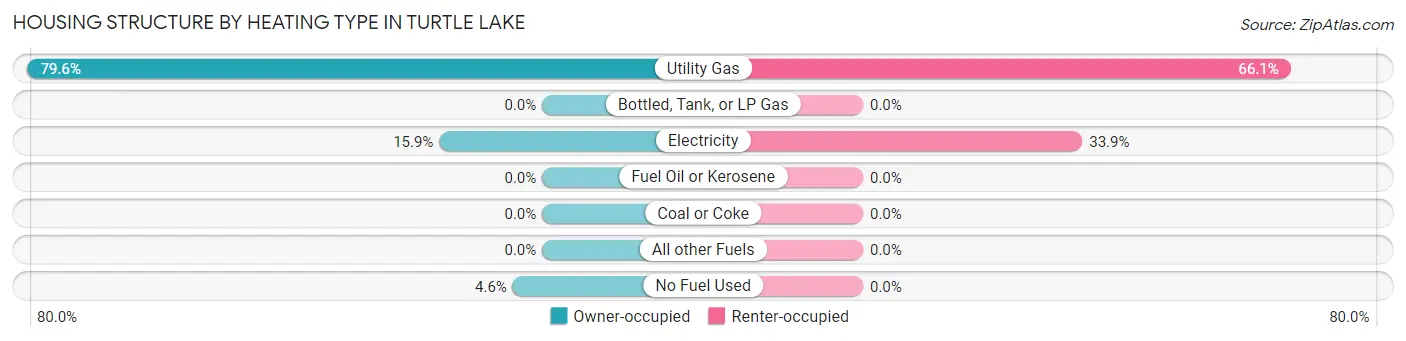
| Heating Type | Owner-occupied | Renter-occupied |
| Utility Gas | 140 (79.5%) | 39 (66.1%) |
| Bottled, Tank, or LP Gas | 0 (0.0%) | 0 (0.0%) |
| Electricity | 28 (15.9%) | 20 (33.9%) |
| Fuel Oil or Kerosene | 0 (0.0%) | 0 (0.0%) |
| Coal or Coke | 0 (0.0%) | 0 (0.0%) |
| All other Fuels | 0 (0.0%) | 0 (0.0%) |
| No Fuel Used | 8 (4.5%) | 0 (0.0%) |
| Total | 176 (100.0%) | 59 (100.0%) |
Household Vehicle Usage in Turtle Lake
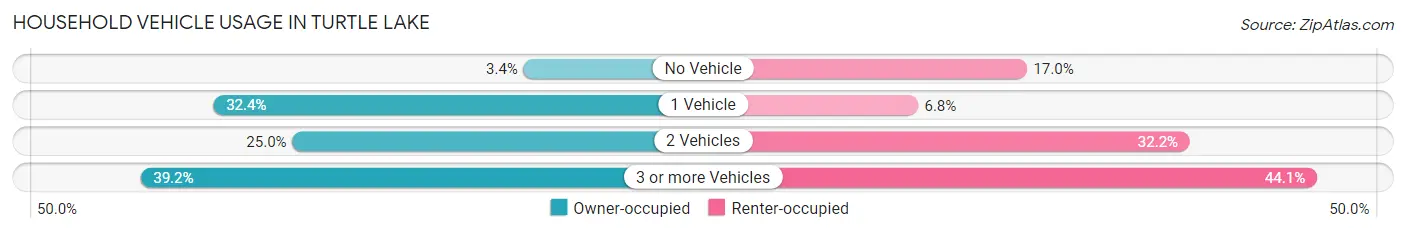
| Vehicles per Household | Owner-occupied | Renter-occupied |
| No Vehicle | 6 (3.4%) | 10 (17.0%) |
| 1 Vehicle | 57 (32.4%) | 4 (6.8%) |
| 2 Vehicles | 44 (25.0%) | 19 (32.2%) |
| 3 or more Vehicles | 69 (39.2%) | 26 (44.1%) |
| Total | 176 (100.0%) | 59 (100.0%) |
Real Estate & Mortgages in Turtle Lake
Real Estate and Mortgage Overview in Turtle Lake
| Characteristic | Without Mortgage | With Mortgage |
| Housing Units | 94 | 82 |
| Median Property Value | $103,400 | $168,800 |
| Median Household Income | $40,000 | $5 |
| Monthly Housing Costs | $341 | $0 |
| Real Estate Taxes | $883 | $0 |
Property Value by Mortgage Status in Turtle Lake
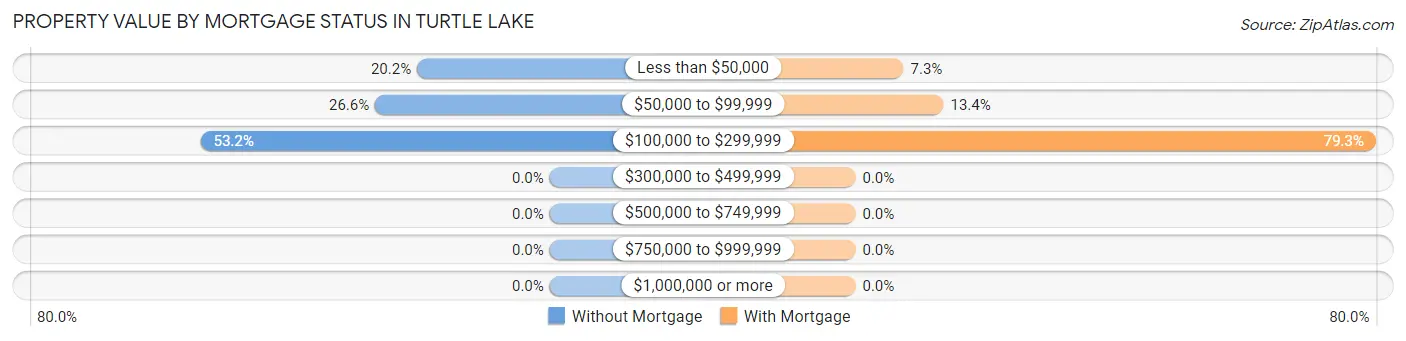
| Property Value | Without Mortgage | With Mortgage |
| Less than $50,000 | 19 (20.2%) | 6 (7.3%) |
| $50,000 to $99,999 | 25 (26.6%) | 11 (13.4%) |
| $100,000 to $299,999 | 50 (53.2%) | 65 (79.3%) |
| $300,000 to $499,999 | 0 (0.0%) | 0 (0.0%) |
| $500,000 to $749,999 | 0 (0.0%) | 0 (0.0%) |
| $750,000 to $999,999 | 0 (0.0%) | 0 (0.0%) |
| $1,000,000 or more | 0 (0.0%) | 0 (0.0%) |
| Total | 94 (100.0%) | 82 (100.0%) |
Household Income by Mortgage Status in Turtle Lake
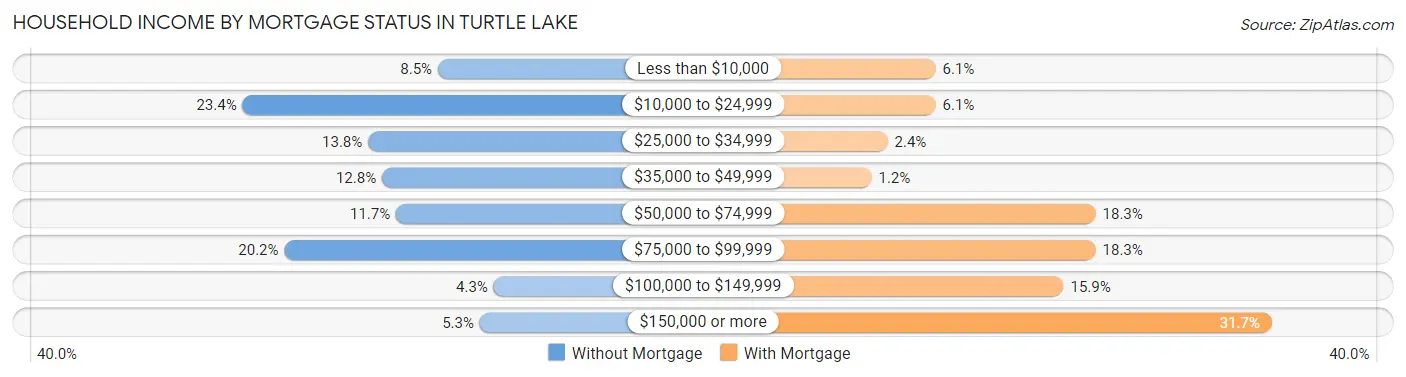
| Household Income | Without Mortgage | With Mortgage |
| Less than $10,000 | 8 (8.5%) | 5 (6.1%) |
| $10,000 to $24,999 | 22 (23.4%) | 5 (6.1%) |
| $25,000 to $34,999 | 13 (13.8%) | 2 (2.4%) |
| $35,000 to $49,999 | 12 (12.8%) | 1 (1.2%) |
| $50,000 to $74,999 | 11 (11.7%) | 15 (18.3%) |
| $75,000 to $99,999 | 19 (20.2%) | 15 (18.3%) |
| $100,000 to $149,999 | 4 (4.3%) | 13 (15.9%) |
| $150,000 or more | 5 (5.3%) | 26 (31.7%) |
| Total | 94 (100.0%) | 82 (100.0%) |
Property Value to Household Income Ratio in Turtle Lake
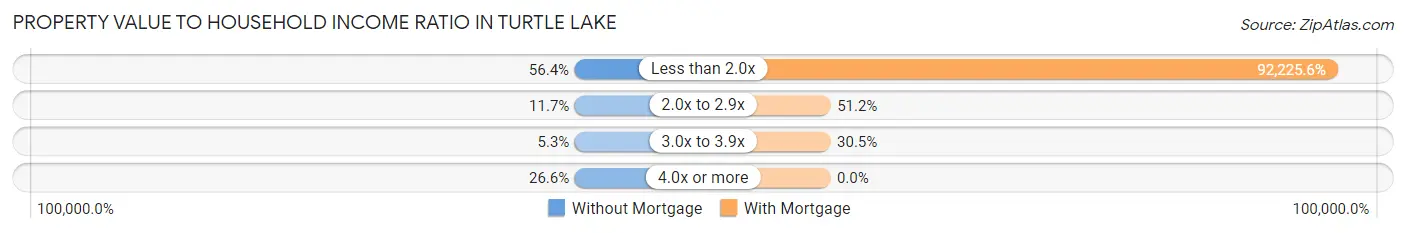
| Value-to-Income Ratio | Without Mortgage | With Mortgage |
| Less than 2.0x | 53 (56.4%) | 75,625 (92,225.6%) |
| 2.0x to 2.9x | 11 (11.7%) | 42 (51.2%) |
| 3.0x to 3.9x | 5 (5.3%) | 25 (30.5%) |
| 4.0x or more | 25 (26.6%) | 0 (0.0%) |
| Total | 94 (100.0%) | 82 (100.0%) |
Real Estate Taxes by Mortgage Status in Turtle Lake
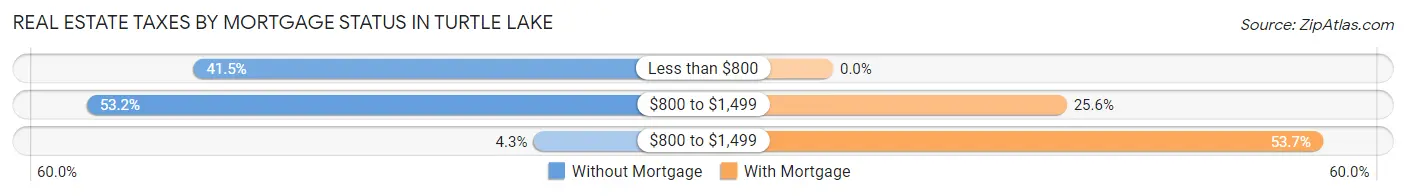
| Property Taxes | Without Mortgage | With Mortgage |
| Less than $800 | 39 (41.5%) | 0 (0.0%) |
| $800 to $1,499 | 50 (53.2%) | 21 (25.6%) |
| $800 to $1,499 | 4 (4.3%) | 44 (53.7%) |
| Total | 94 (100.0%) | 82 (100.0%) |
Health & Disability in Turtle Lake
Health Insurance Coverage by Age in Turtle Lake
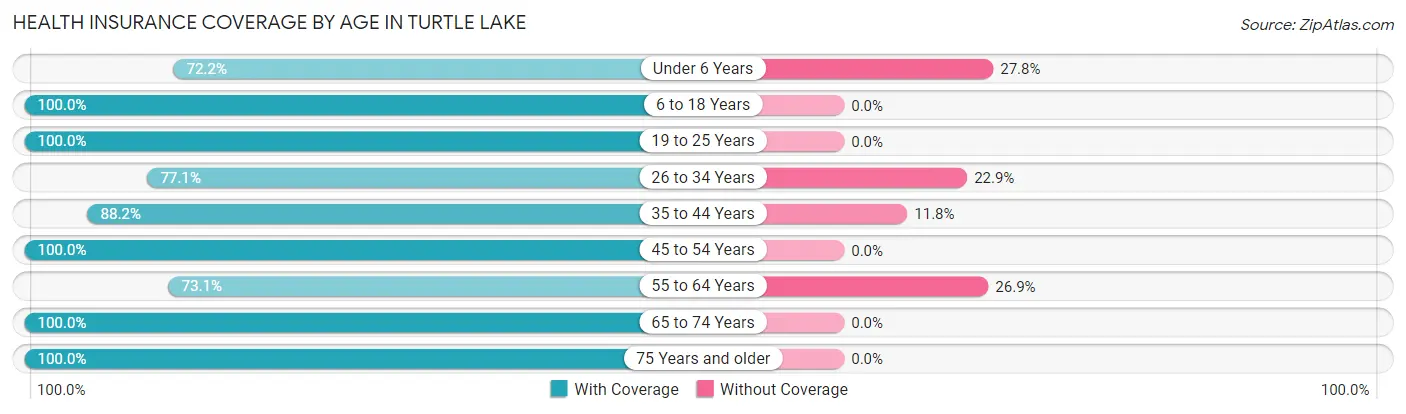
| Age Bracket | With Coverage | Without Coverage |
| Under 6 Years | 26 (72.2%) | 10 (27.8%) |
| 6 to 18 Years | 92 (100.0%) | 0 (0.0%) |
| 19 to 25 Years | 21 (100.0%) | 0 (0.0%) |
| 26 to 34 Years | 37 (77.1%) | 11 (22.9%) |
| 35 to 44 Years | 60 (88.2%) | 8 (11.8%) |
| 45 to 54 Years | 41 (100.0%) | 0 (0.0%) |
| 55 to 64 Years | 49 (73.1%) | 18 (26.9%) |
| 65 to 74 Years | 52 (100.0%) | 0 (0.0%) |
| 75 Years and older | 61 (100.0%) | 0 (0.0%) |
| Total | 439 (90.3%) | 47 (9.7%) |
Health Insurance Coverage by Citizenship Status in Turtle Lake
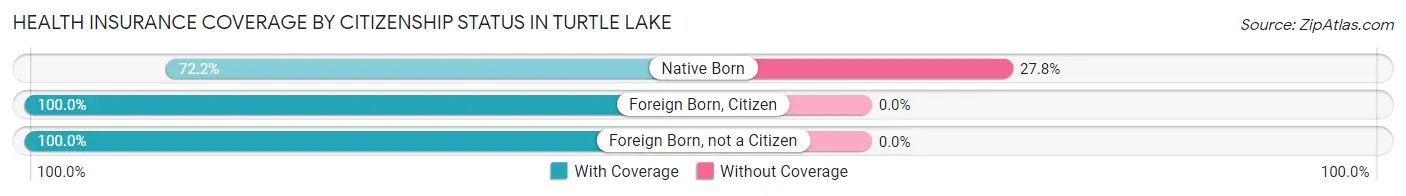
| Citizenship Status | With Coverage | Without Coverage |
| Native Born | 26 (72.2%) | 10 (27.8%) |
| Foreign Born, Citizen | 92 (100.0%) | 0 (0.0%) |
| Foreign Born, not a Citizen | 21 (100.0%) | 0 (0.0%) |
Health Insurance Coverage by Household Income in Turtle Lake
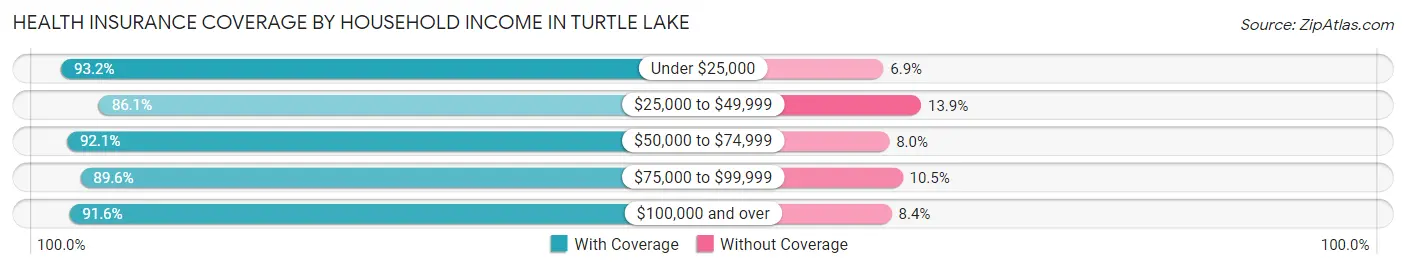
| Household Income | With Coverage | Without Coverage |
| Under $25,000 | 68 (93.1%) | 5 (6.9%) |
| $25,000 to $49,999 | 99 (86.1%) | 16 (13.9%) |
| $50,000 to $74,999 | 81 (92.0%) | 7 (8.0%) |
| $75,000 to $99,999 | 60 (89.5%) | 7 (10.4%) |
| $100,000 and over | 131 (91.6%) | 12 (8.4%) |
Public vs Private Health Insurance Coverage by Age in Turtle Lake
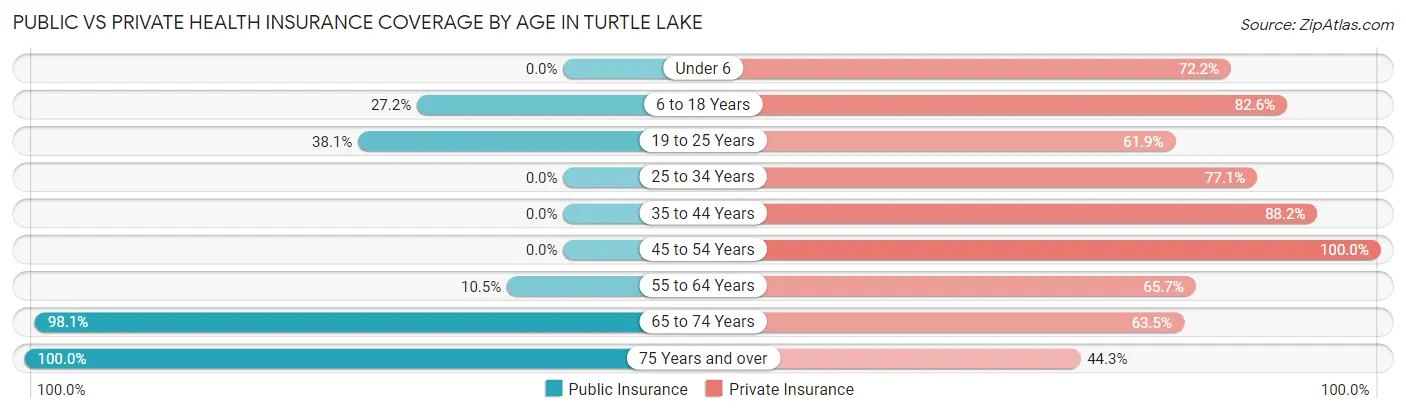
| Age Bracket | Public Insurance | Private Insurance |
| Under 6 | 0 (0.0%) | 26 (72.2%) |
| 6 to 18 Years | 25 (27.2%) | 76 (82.6%) |
| 19 to 25 Years | 8 (38.1%) | 13 (61.9%) |
| 25 to 34 Years | 0 (0.0%) | 37 (77.1%) |
| 35 to 44 Years | 0 (0.0%) | 60 (88.2%) |
| 45 to 54 Years | 0 (0.0%) | 41 (100.0%) |
| 55 to 64 Years | 7 (10.4%) | 44 (65.7%) |
| 65 to 74 Years | 51 (98.1%) | 33 (63.5%) |
| 75 Years and over | 61 (100.0%) | 27 (44.3%) |
| Total | 152 (31.3%) | 357 (73.5%) |
Disability Status by Sex by Age in Turtle Lake
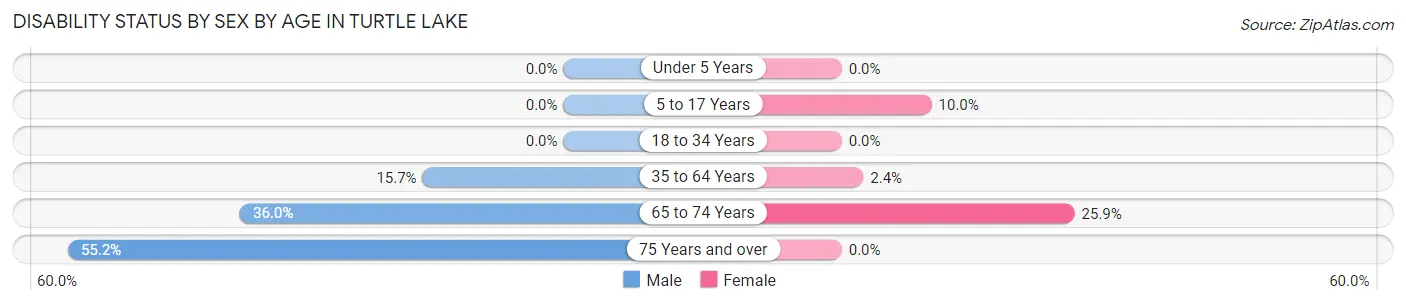
| Age Bracket | Male | Female |
| Under 5 Years | 0 (0.0%) | 0 (0.0%) |
| 5 to 17 Years | 0 (0.0%) | 3 (10.0%) |
| 18 to 34 Years | 0 (0.0%) | 0 (0.0%) |
| 35 to 64 Years | 8 (15.7%) | 3 (2.4%) |
| 65 to 74 Years | 9 (36.0%) | 7 (25.9%) |
| 75 Years and over | 16 (55.2%) | 0 (0.0%) |
Disability Class by Sex by Age in Turtle Lake
Disability Class: Hearing Difficulty
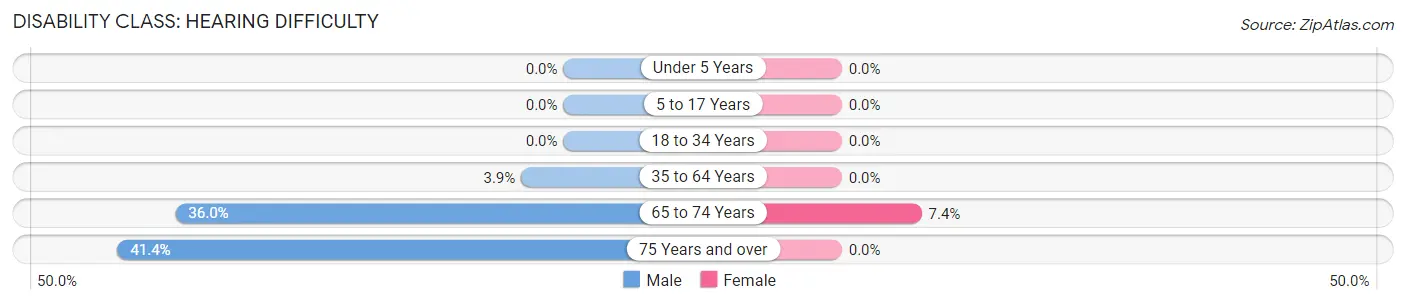
| Age Bracket | Male | Female |
| Under 5 Years | 0 (0.0%) | 0 (0.0%) |
| 5 to 17 Years | 0 (0.0%) | 0 (0.0%) |
| 18 to 34 Years | 0 (0.0%) | 0 (0.0%) |
| 35 to 64 Years | 2 (3.9%) | 0 (0.0%) |
| 65 to 74 Years | 9 (36.0%) | 2 (7.4%) |
| 75 Years and over | 12 (41.4%) | 0 (0.0%) |
Disability Class: Vision Difficulty
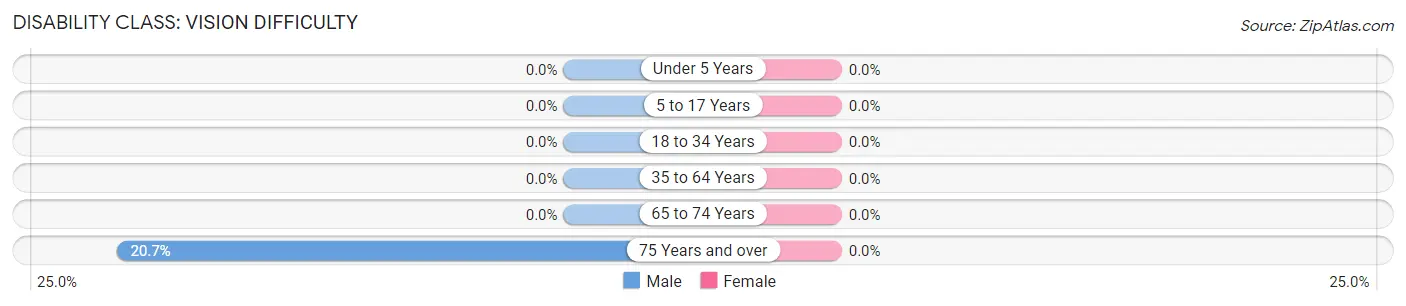
| Age Bracket | Male | Female |
| Under 5 Years | 0 (0.0%) | 0 (0.0%) |
| 5 to 17 Years | 0 (0.0%) | 0 (0.0%) |
| 18 to 34 Years | 0 (0.0%) | 0 (0.0%) |
| 35 to 64 Years | 0 (0.0%) | 0 (0.0%) |
| 65 to 74 Years | 0 (0.0%) | 0 (0.0%) |
| 75 Years and over | 6 (20.7%) | 0 (0.0%) |
Disability Class: Cognitive Difficulty
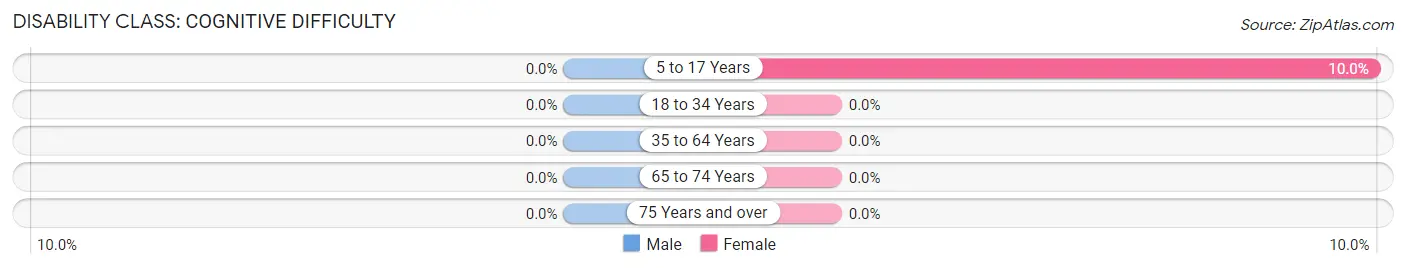
| Age Bracket | Male | Female |
| 5 to 17 Years | 0 (0.0%) | 3 (10.0%) |
| 18 to 34 Years | 0 (0.0%) | 0 (0.0%) |
| 35 to 64 Years | 0 (0.0%) | 0 (0.0%) |
| 65 to 74 Years | 0 (0.0%) | 0 (0.0%) |
| 75 Years and over | 0 (0.0%) | 0 (0.0%) |
Disability Class: Ambulatory Difficulty
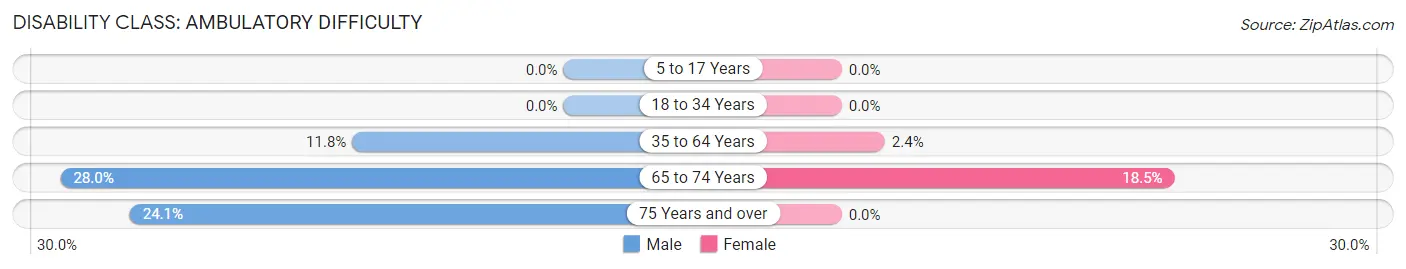
| Age Bracket | Male | Female |
| 5 to 17 Years | 0 (0.0%) | 0 (0.0%) |
| 18 to 34 Years | 0 (0.0%) | 0 (0.0%) |
| 35 to 64 Years | 6 (11.8%) | 3 (2.4%) |
| 65 to 74 Years | 7 (28.0%) | 5 (18.5%) |
| 75 Years and over | 7 (24.1%) | 0 (0.0%) |
Disability Class: Self-Care Difficulty
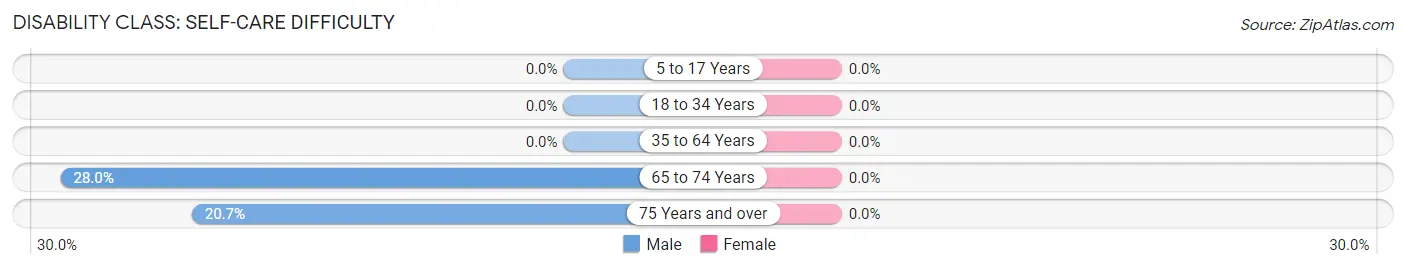
| Age Bracket | Male | Female |
| 5 to 17 Years | 0 (0.0%) | 0 (0.0%) |
| 18 to 34 Years | 0 (0.0%) | 0 (0.0%) |
| 35 to 64 Years | 0 (0.0%) | 0 (0.0%) |
| 65 to 74 Years | 7 (28.0%) | 0 (0.0%) |
| 75 Years and over | 6 (20.7%) | 0 (0.0%) |
Technology Access in Turtle Lake
Computing Device Access in Turtle Lake
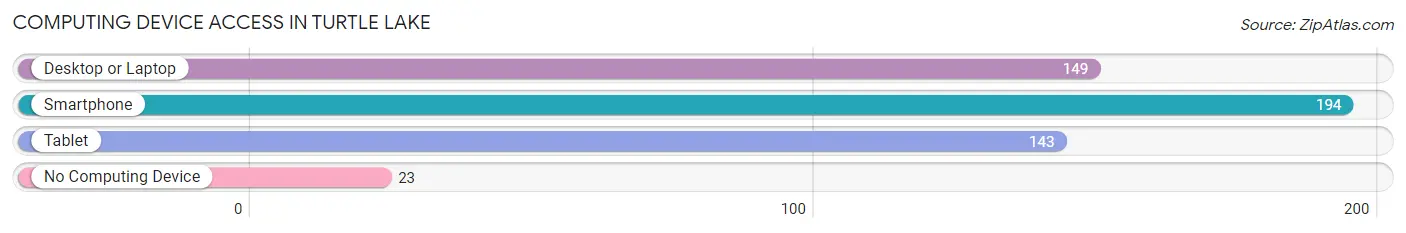
| Device Type | # Households | % Households |
| Desktop or Laptop | 149 | 63.4% |
| Smartphone | 194 | 82.6% |
| Tablet | 143 | 60.9% |
| No Computing Device | 23 | 9.8% |
| Total | 235 | 100.0% |
Internet Access in Turtle Lake
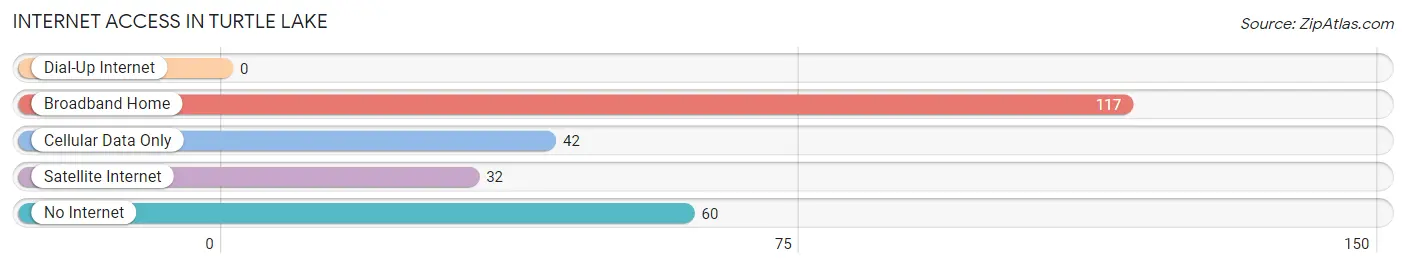
| Internet Type | # Households | % Households |
| Dial-Up Internet | 0 | 0.0% |
| Broadband Home | 117 | 49.8% |
| Cellular Data Only | 42 | 17.9% |
| Satellite Internet | 32 | 13.6% |
| No Internet | 60 | 25.5% |
| Total | 235 | 100.0% |
Turtle Lake Summary
Turtle Lake is a small city located in the state of North Dakota, United States. It is situated in the southwestern part of the state, in the county of McLean. The city has a population of approximately 1,000 people, and is located about 25 miles south of the state capital, Bismarck.
History
Turtle Lake was first settled in the late 1800s by a group of German immigrants. The city was originally named “Turtle Lake” after the nearby lake of the same name. The lake was named for the abundance of turtles that lived in it. The city was officially incorporated in 1902.
In the early 1900s, Turtle Lake was a thriving agricultural community. The city was home to several grain elevators, a creamery, and a flour mill. The city also had a number of businesses, including a hotel, a bank, a hardware store, and a lumberyard.
In the 1950s, Turtle Lake began to experience a decline in population as many of its residents moved away in search of better economic opportunities. The city’s population has remained relatively stable since then, and is now home to about 1,000 people.
Geography
Turtle Lake is located in the southwestern part of North Dakota, in the county of McLean. The city is situated on the Turtle River, which flows through the city and empties into Turtle Lake. The city is surrounded by rolling hills and prairies, and is located about 25 miles south of the state capital, Bismarck.
The climate in Turtle Lake is generally mild, with cold winters and warm summers. The average temperature in the winter is around 20 degrees Fahrenheit, and in the summer it is around 70 degrees Fahrenheit. The city receives an average of about 20 inches of precipitation each year.
Economy
Turtle Lake’s economy is largely based on agriculture. The city is home to several grain elevators, a creamery, and a flour mill. The city also has a number of businesses, including a hotel, a bank, a hardware store, and a lumberyard.
In recent years, Turtle Lake has seen an increase in tourism. The city is home to several parks and recreational areas, including Turtle Lake State Park, which offers camping, fishing, and hiking opportunities. The city also hosts a number of festivals and events throughout the year, including the Turtle Lake Summer Festival and the Turtle Lake Fall Festival.
Demographics
As of the 2010 census, the population of Turtle Lake was 1,000 people. The racial makeup of the city was 97.2% White, 0.7% Native American, 0.3% Asian, 0.2% from other races, and 1.6% from two or more races. The median household income in Turtle Lake was $41,250, and the median family income was $50,000.
Turtle Lake is a small city with a close-knit community. The city is home to a number of churches, and is served by the Turtle Lake Public School District. The city also has a number of parks and recreational areas, including Turtle Lake State Park.
Common Questions
What is Per Capita Income in Turtle Lake?
Per Capita income in Turtle Lake is $30,043.
What is the Median Family Income in Turtle Lake?
Median Family Income in Turtle Lake is $64,625.
What is the Median Household income in Turtle Lake?
Median Household Income in Turtle Lake is $58,125.
What is Income or Wage Gap in Turtle Lake?
Income or Wage Gap in Turtle Lake is 67.0%.
Women in Turtle Lake earn 33.0 cents for every dollar earned by a man.
What is Inequality or Gini Index in Turtle Lake?
Inequality or Gini Index in Turtle Lake is 0.38.
What is the Total Population of Turtle Lake?
Total Population of Turtle Lake is 503.
What is the Total Male Population of Turtle Lake?
Total Male Population of Turtle Lake is 240.
What is the Total Female Population of Turtle Lake?
Total Female Population of Turtle Lake is 263.
What is the Ratio of Males per 100 Females in Turtle Lake?
There are 91.25 Males per 100 Females in Turtle Lake.
What is the Ratio of Females per 100 Males in Turtle Lake?
There are 109.58 Females per 100 Males in Turtle Lake.
What is the Median Population Age in Turtle Lake?
Median Population Age in Turtle Lake is 42.8 Years.
What is the Average Family Size in Turtle Lake
Average Family Size in Turtle Lake is 2.5 People.
What is the Average Household Size in Turtle Lake
Average Household Size in Turtle Lake is 2.1 People.
How Large is the Labor Force in Turtle Lake?
There are 228 People in the Labor Forcein in Turtle Lake.
What is the Percentage of People in the Labor Force in Turtle Lake?
55.9% of People are in the Labor Force in Turtle Lake.