Wilder, VT Map & Demographics
Wilder Map
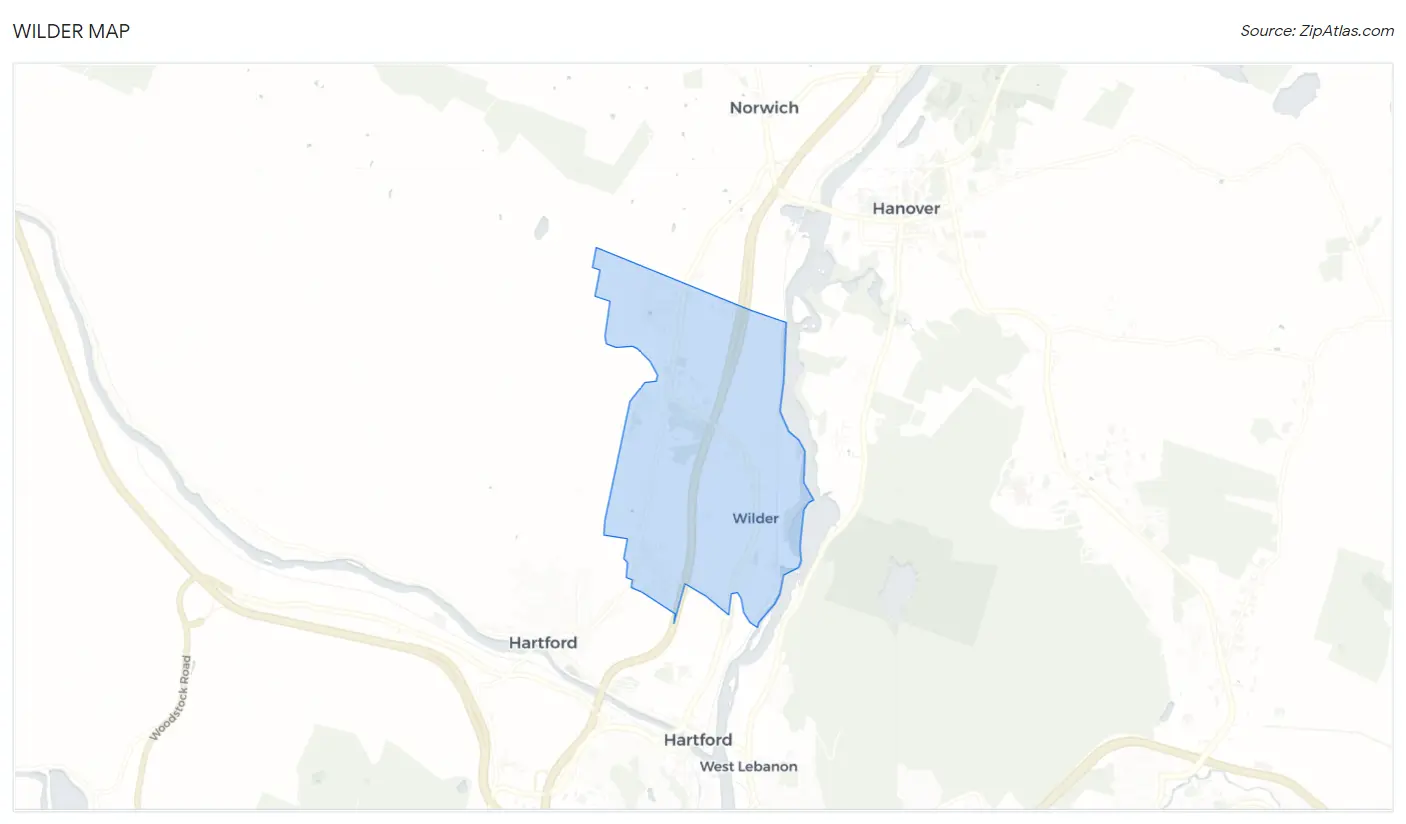
Wilder Overview
$40,938
PER CAPITA INCOME
$100,677
AVG FAMILY INCOME
$70,758
AVG HOUSEHOLD INCOME
19.0%
WAGE / INCOME GAP [ % ]
81.0¢/ $1
WAGE / INCOME GAP [ $ ]
0.39
INEQUALITY / GINI INDEX
3,634
TOTAL POPULATION
1,637
MALE POPULATION
1,997
FEMALE POPULATION
81.97
MALES / 100 FEMALES
121.99
FEMALES / 100 MALES
40.8
MEDIAN AGE
2.9
AVG FAMILY SIZE
2.2
AVG HOUSEHOLD SIZE
2,132
LABOR FORCE [ PEOPLE ]
69.8%
PERCENT IN LABOR FORCE
5.8%
UNEMPLOYMENT RATE
Wilder Zip Codes
Wilder Area Codes
Income in Wilder
Income Overview in Wilder
Per Capita Income in Wilder is $40,938, while median incomes of families and households are $100,677 and $70,758 respectively.
| Characteristic | Number | Measure |
| Per Capita Income | 3,634 | $40,938 |
| Median Family Income | 901 | $100,677 |
| Mean Family Income | 901 | $107,670 |
| Median Household Income | 1,649 | $70,758 |
| Mean Household Income | 1,649 | $84,405 |
| Income Deficit | 901 | $0 |
| Wage / Income Gap (%) | 3,634 | 19.03% |
| Wage / Income Gap ($) | 3,634 | 80.97¢ per $1 |
| Gini / Inequality Index | 3,634 | 0.39 |
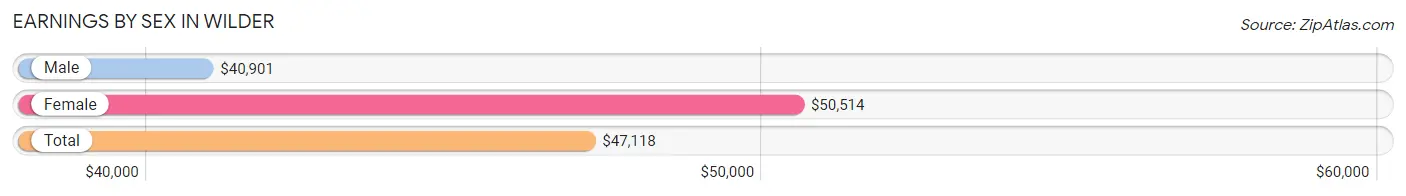
Earnings by Sex in Wilder
Average Earnings in Wilder are $47,118, $40,901 for men and $50,514 for women, a difference of 19.0%.
| Sex | Number | Average Earnings |
| Male | 1,027 (46.3%) | $40,901 |
| Female | 1,190 (53.7%) | $50,514 |
| Total | 2,217 (100.0%) | $47,118 |
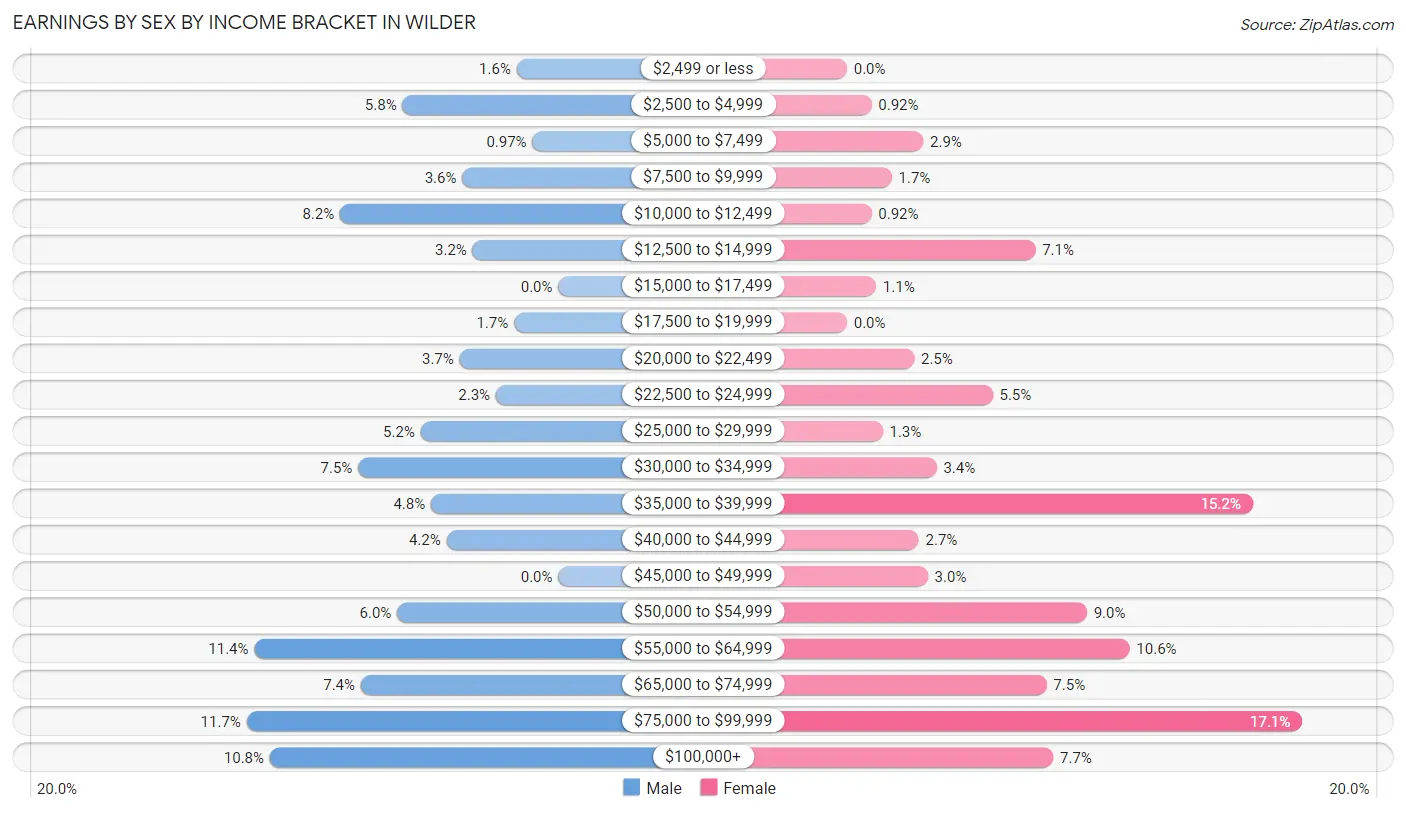
Earnings by Sex by Income Bracket in Wilder
The most common earnings brackets in Wilder are $75,000 to $99,999 for men (120 | 11.7%) and $75,000 to $99,999 for women (203 | 17.1%).
| Income | Male | Female |
| $2,499 or less | 16 (1.6%) | 0 (0.0%) |
| $2,500 to $4,999 | 60 (5.8%) | 11 (0.9%) |
| $5,000 to $7,499 | 10 (1.0%) | 34 (2.9%) |
| $7,500 to $9,999 | 37 (3.6%) | 20 (1.7%) |
| $10,000 to $12,499 | 84 (8.2%) | 11 (0.9%) |
| $12,500 to $14,999 | 33 (3.2%) | 84 (7.1%) |
| $15,000 to $17,499 | 0 (0.0%) | 13 (1.1%) |
| $17,500 to $19,999 | 17 (1.7%) | 0 (0.0%) |
| $20,000 to $22,499 | 38 (3.7%) | 30 (2.5%) |
| $22,500 to $24,999 | 24 (2.3%) | 65 (5.5%) |
| $25,000 to $29,999 | 53 (5.2%) | 16 (1.3%) |
| $30,000 to $34,999 | 77 (7.5%) | 40 (3.4%) |
| $35,000 to $39,999 | 49 (4.8%) | 181 (15.2%) |
| $40,000 to $44,999 | 43 (4.2%) | 32 (2.7%) |
| $45,000 to $49,999 | 0 (0.0%) | 36 (3.0%) |
| $50,000 to $54,999 | 62 (6.0%) | 107 (9.0%) |
| $55,000 to $64,999 | 117 (11.4%) | 126 (10.6%) |
| $65,000 to $74,999 | 76 (7.4%) | 89 (7.5%) |
| $75,000 to $99,999 | 120 (11.7%) | 203 (17.1%) |
| $100,000+ | 111 (10.8%) | 92 (7.7%) |
| Total | 1,027 (100.0%) | 1,190 (100.0%) |
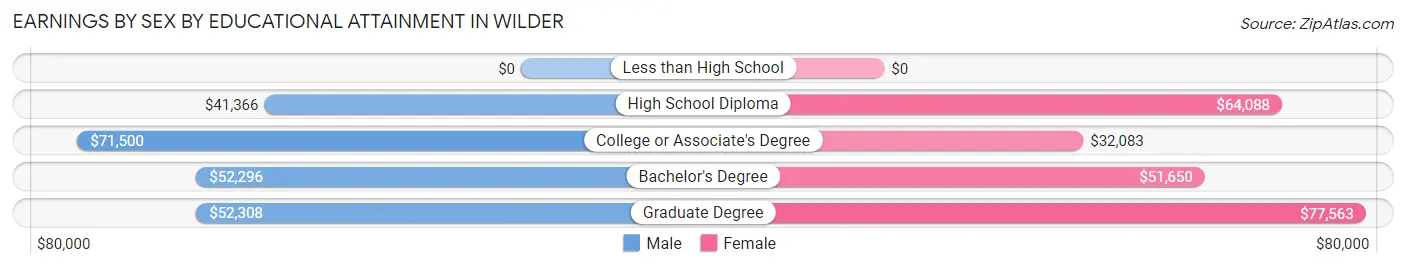
Earnings by Sex by Educational Attainment in Wilder
Average earnings in Wilder are $51,976 for men and $55,278 for women, a difference of 6.0%. Men with an educational attainment of college or associate's degree enjoy the highest average annual earnings of $71,500, while those with high school diploma education earn the least with $41,366. Women with an educational attainment of graduate degree earn the most with the average annual earnings of $77,563, while those with college or associate's degree education have the smallest earnings of $32,083.
| Educational Attainment | Male Income | Female Income |
| Less than High School | - | - |
| High School Diploma | $41,366 | $64,088 |
| College or Associate's Degree | $71,500 | $32,083 |
| Bachelor's Degree | $52,296 | $51,650 |
| Graduate Degree | $52,308 | $77,563 |
| Total | $51,976 | $55,278 |
Family Income in Wilder
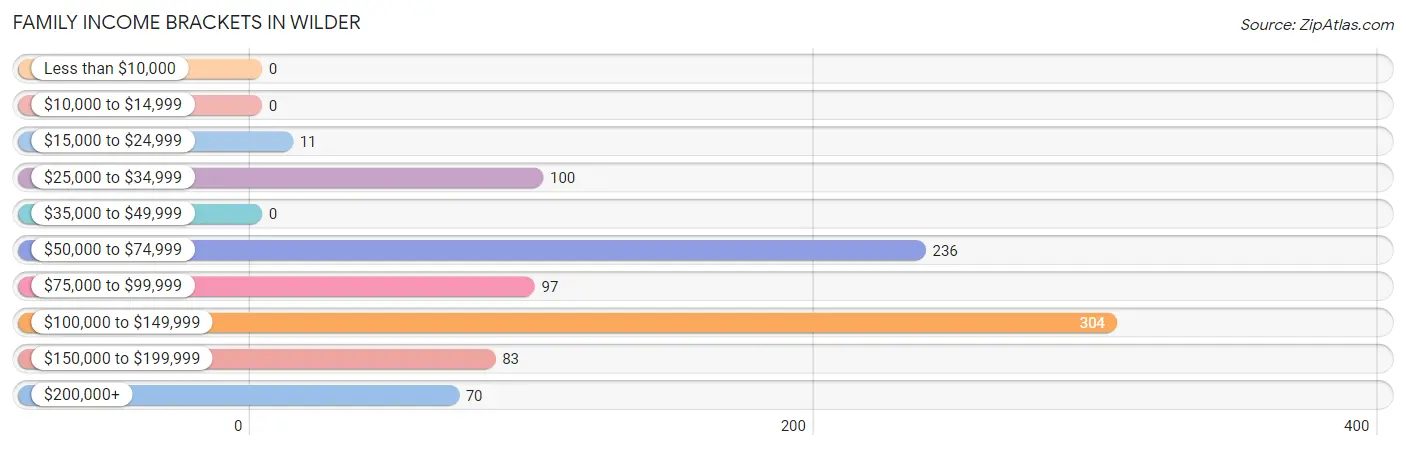
Family Income Brackets in Wilder
According to the Wilder family income data, there are 304 families falling into the $100,000 to $149,999 income range, which is the most common income bracket and makes up 33.7% of all families.
| Income Bracket | # Families | % Families |
| Less than $10,000 | 0 | 0.0% |
| $10,000 to $14,999 | 0 | 0.0% |
| $15,000 to $24,999 | 11 | 1.2% |
| $25,000 to $34,999 | 100 | 11.1% |
| $35,000 to $49,999 | 0 | 0.0% |
| $50,000 to $74,999 | 236 | 26.2% |
| $75,000 to $99,999 | 97 | 10.8% |
| $100,000 to $149,999 | 304 | 33.7% |
| $150,000 to $199,999 | 83 | 9.2% |
| $200,000+ | 70 | 7.8% |
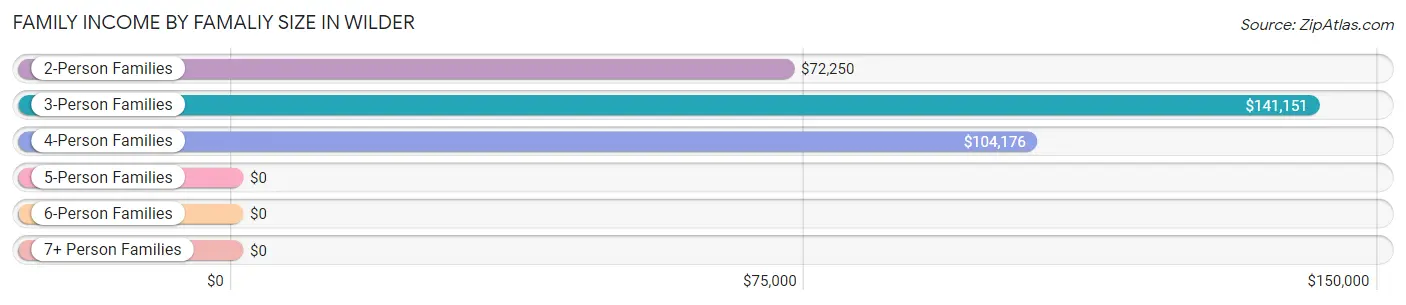
Family Income by Famaliy Size in Wilder
3-person families (166 | 18.4%) account for the highest median family income in Wilder with $141,151 per family, while 3-person families (166 | 18.4%) have the highest median income of $47,050 per family member.
| Income Bracket | # Families | Median Income |
| 2-Person Families | 548 (60.8%) | $72,250 |
| 3-Person Families | 166 (18.4%) | $141,151 |
| 4-Person Families | 181 (20.1%) | $104,176 |
| 5-Person Families | 6 (0.7%) | $0 |
| 6-Person Families | 0 (0.0%) | $0 |
| 7+ Person Families | 0 (0.0%) | $0 |
| Total | 901 (100.0%) | $100,677 |
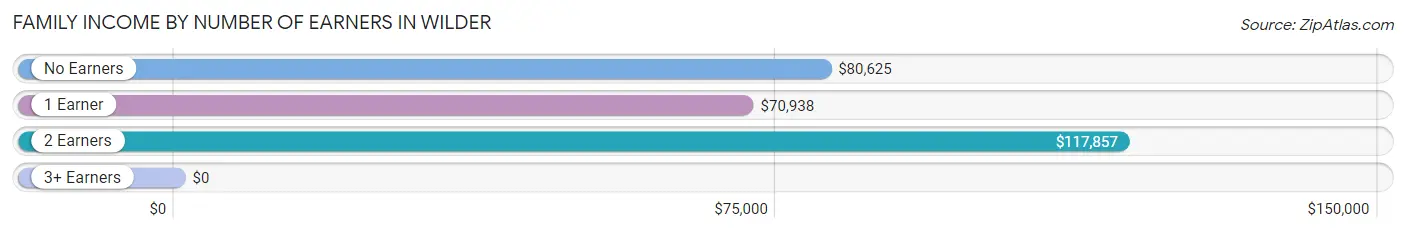
Family Income by Number of Earners in Wilder
| Number of Earners | # Families | Median Income |
| No Earners | 87 (9.7%) | $80,625 |
| 1 Earner | 234 (26.0%) | $70,938 |
| 2 Earners | 548 (60.8%) | $117,857 |
| 3+ Earners | 32 (3.5%) | $0 |
| Total | 901 (100.0%) | $100,677 |
Household Income in Wilder
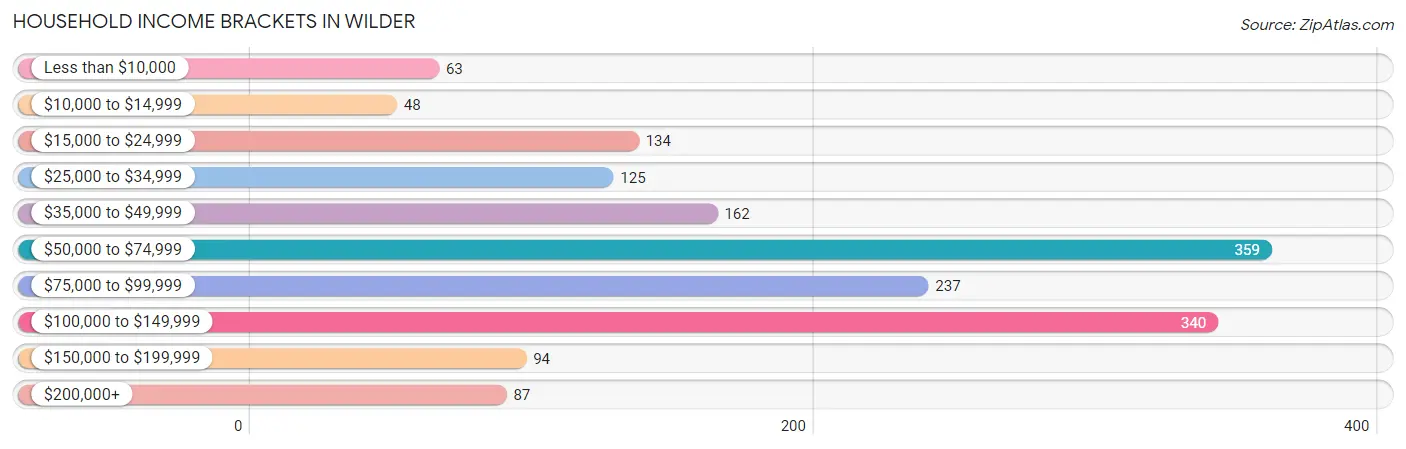
Household Income Brackets in Wilder
With 359 households falling in the category, the $50,000 to $74,999 income range is the most frequent in Wilder, accounting for 21.8% of all households. In contrast, only 48 households (2.9%) fall into the $10,000 to $14,999 income bracket, making it the least populous group.
| Income Bracket | # Households | % Households |
| Less than $10,000 | 63 | 3.8% |
| $10,000 to $14,999 | 48 | 2.9% |
| $15,000 to $24,999 | 134 | 8.1% |
| $25,000 to $34,999 | 125 | 7.6% |
| $35,000 to $49,999 | 162 | 9.8% |
| $50,000 to $74,999 | 359 | 21.8% |
| $75,000 to $99,999 | 237 | 14.4% |
| $100,000 to $149,999 | 340 | 20.6% |
| $150,000 to $199,999 | 94 | 5.7% |
| $200,000+ | 87 | 5.3% |
Household Income by Householder Age in Wilder
The median household income in Wilder is $70,758, with the highest median household income of $95,882 found in the 25 to 44 years age bracket for the primary householder. A total of 474 households (28.7%) fall into this category. Meanwhile, the 15 to 24 years age bracket for the primary householder has the lowest median household income of $0, with 65 households (3.9%) in this group.
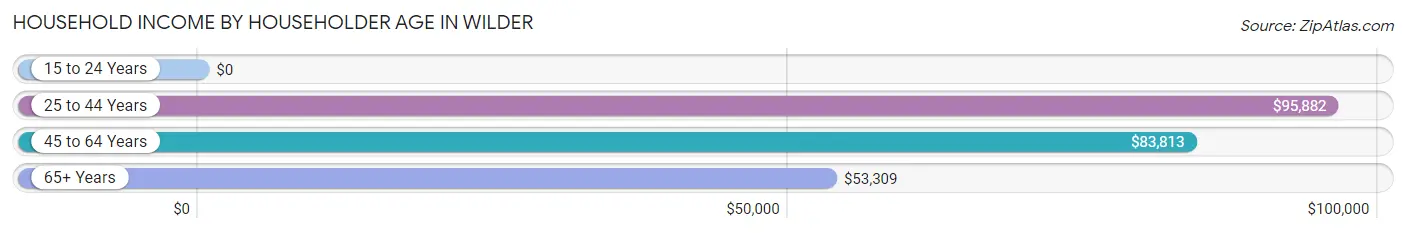
| Income Bracket | # Households | Median Income |
| 15 to 24 Years | 65 (3.9%) | $0 |
| 25 to 44 Years | 474 (28.7%) | $95,882 |
| 45 to 64 Years | 513 (31.1%) | $83,813 |
| 65+ Years | 597 (36.2%) | $53,309 |
| Total | 1,649 (100.0%) | $70,758 |
Poverty in Wilder
Income Below Poverty by Sex and Age in Wilder
With 5.4% poverty level for males and 5.3% for females among the residents of Wilder, 5 year old males and 18 to 24 year old females are the most vulnerable to poverty, with 13 males (36.1%) and 45 females (26.2%) in their respective age groups living below the poverty level.
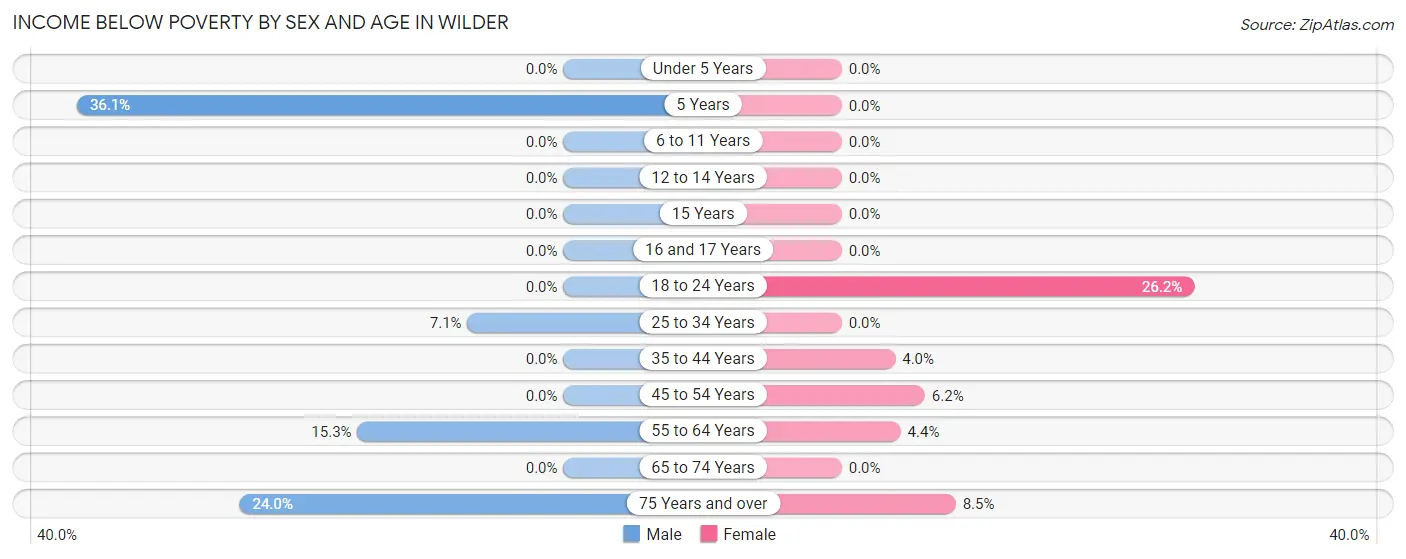
| Age Bracket | Male | Female |
| Under 5 Years | 0 (0.0%) | 0 (0.0%) |
| 5 Years | 13 (36.1%) | 0 (0.0%) |
| 6 to 11 Years | 0 (0.0%) | 0 (0.0%) |
| 12 to 14 Years | 0 (0.0%) | 0 (0.0%) |
| 15 Years | 0 (0.0%) | 0 (0.0%) |
| 16 and 17 Years | 0 (0.0%) | 0 (0.0%) |
| 18 to 24 Years | 0 (0.0%) | 45 (26.2%) |
| 25 to 34 Years | 24 (7.1%) | 0 (0.0%) |
| 35 to 44 Years | 0 (0.0%) | 10 (4.0%) |
| 45 to 54 Years | 0 (0.0%) | 15 (6.2%) |
| 55 to 64 Years | 24 (15.3%) | 11 (4.4%) |
| 65 to 74 Years | 0 (0.0%) | 0 (0.0%) |
| 75 Years and over | 25 (24.0%) | 22 (8.5%) |
| Total | 86 (5.4%) | 103 (5.3%) |
Income Above Poverty by Sex and Age in Wilder
According to the poverty statistics in Wilder, males aged under 5 years and females aged under 5 years are the age groups that are most secure financially, with 100.0% of males and 100.0% of females in these age groups living above the poverty line.
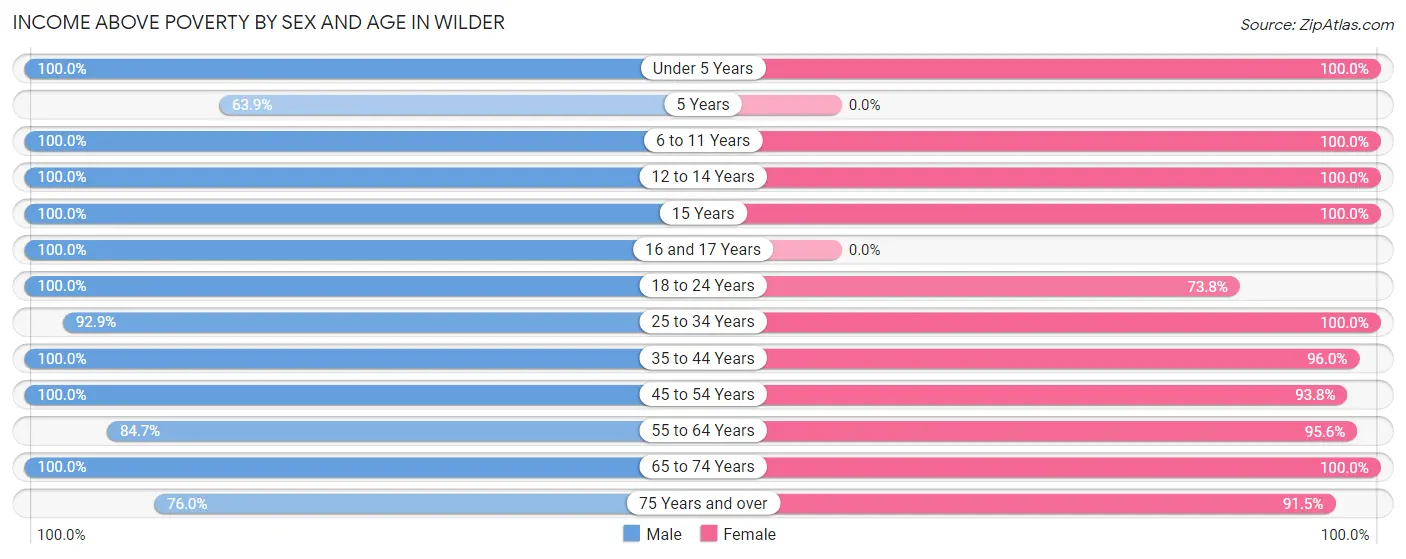
| Age Bracket | Male | Female |
| Under 5 Years | 159 (100.0%) | 134 (100.0%) |
| 5 Years | 23 (63.9%) | 0 (0.0%) |
| 6 to 11 Years | 77 (100.0%) | 7 (100.0%) |
| 12 to 14 Years | 96 (100.0%) | 20 (100.0%) |
| 15 Years | 21 (100.0%) | 30 (100.0%) |
| 16 and 17 Years | 12 (100.0%) | 0 (0.0%) |
| 18 to 24 Years | 153 (100.0%) | 127 (73.8%) |
| 25 to 34 Years | 313 (92.9%) | 299 (100.0%) |
| 35 to 44 Years | 144 (100.0%) | 242 (96.0%) |
| 45 to 54 Years | 179 (100.0%) | 228 (93.8%) |
| 55 to 64 Years | 133 (84.7%) | 241 (95.6%) |
| 65 to 74 Years | 127 (100.0%) | 287 (100.0%) |
| 75 Years and over | 79 (76.0%) | 238 (91.5%) |
| Total | 1,516 (94.6%) | 1,853 (94.7%) |
Income Below Poverty Among Married-Couple Families in Wilder
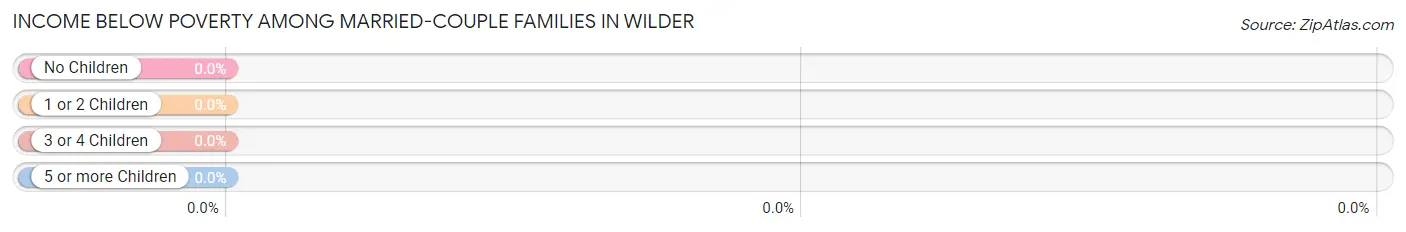
| Children | Above Poverty | Below Poverty |
| No Children | 366 (100.0%) | 0 (0.0%) |
| 1 or 2 Children | 297 (100.0%) | 0 (0.0%) |
| 3 or 4 Children | 6 (100.0%) | 0 (0.0%) |
| 5 or more Children | 0 (0.0%) | 0 (0.0%) |
| Total | 669 (100.0%) | 0 (0.0%) |
Income Below Poverty Among Single-Parent Households in Wilder
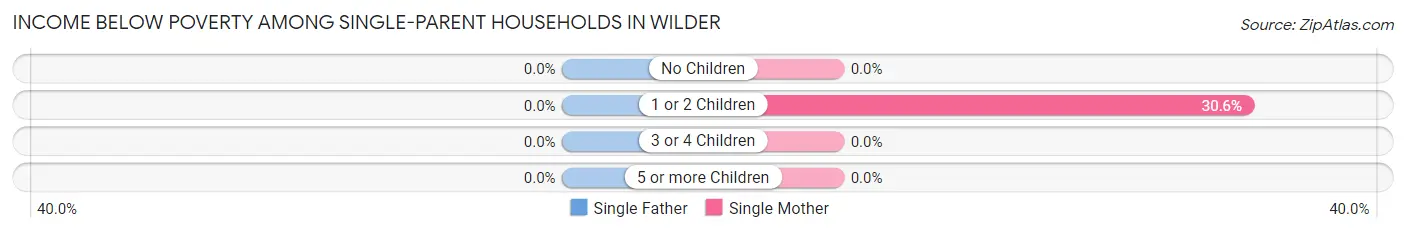
| Children | Single Father | Single Mother |
| No Children | 0 (0.0%) | 0 (0.0%) |
| 1 or 2 Children | 0 (0.0%) | 11 (30.6%) |
| 3 or 4 Children | 0 (0.0%) | 0 (0.0%) |
| 5 or more Children | 0 (0.0%) | 0 (0.0%) |
| Total | 0 (0.0%) | 11 (5.1%) |
Income Below Poverty Among Married-Couple vs Single-Parent Households in Wilder
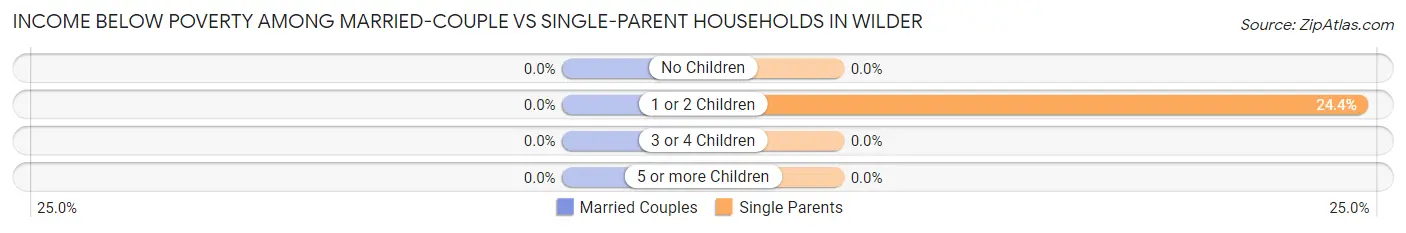
| Children | Married-Couple Families | Single-Parent Households |
| No Children | 0 (0.0%) | 0 (0.0%) |
| 1 or 2 Children | 0 (0.0%) | 11 (24.4%) |
| 3 or 4 Children | 0 (0.0%) | 0 (0.0%) |
| 5 or more Children | 0 (0.0%) | 0 (0.0%) |
| Total | 0 (0.0%) | 11 (4.7%) |
Race in Wilder
The most populous races in Wilder are White / Caucasian (3,286 | 90.4%), Black / African American (130 | 3.6%), and Two or more Races (123 | 3.4%).
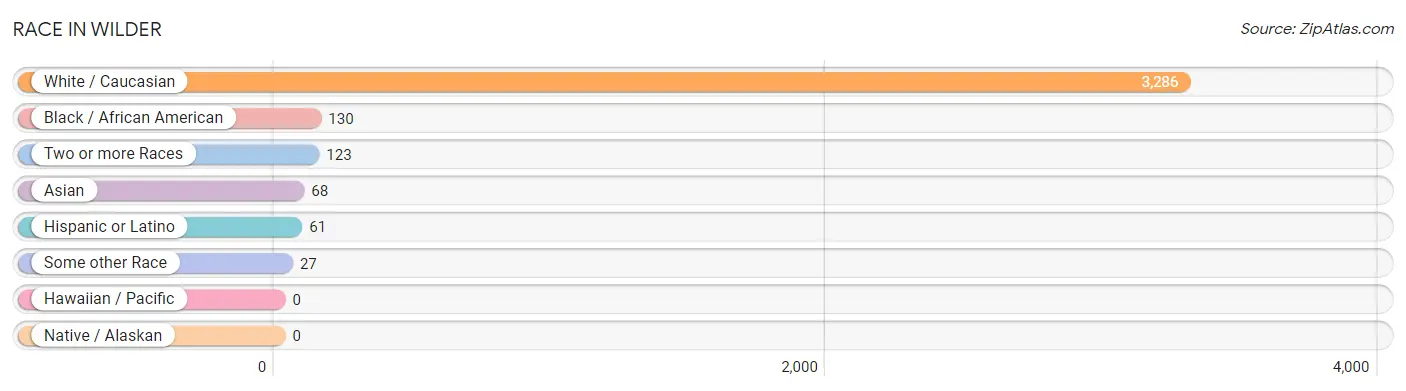
| Race | # Population | % Population |
| Asian | 68 | 1.9% |
| Black / African American | 130 | 3.6% |
| Hawaiian / Pacific | 0 | 0.0% |
| Hispanic or Latino | 61 | 1.7% |
| Native / Alaskan | 0 | 0.0% |
| White / Caucasian | 3,286 | 90.4% |
| Two or more Races | 123 | 3.4% |
| Some other Race | 27 | 0.7% |
| Total | 3,634 | 100.0% |
Ancestry in Wilder
The most populous ancestries reported in Wilder are English (838 | 23.1%), Irish (810 | 22.3%), German (474 | 13.0%), American (373 | 10.3%), and French (267 | 7.3%), together accounting for 76.0% of all Wilder residents.
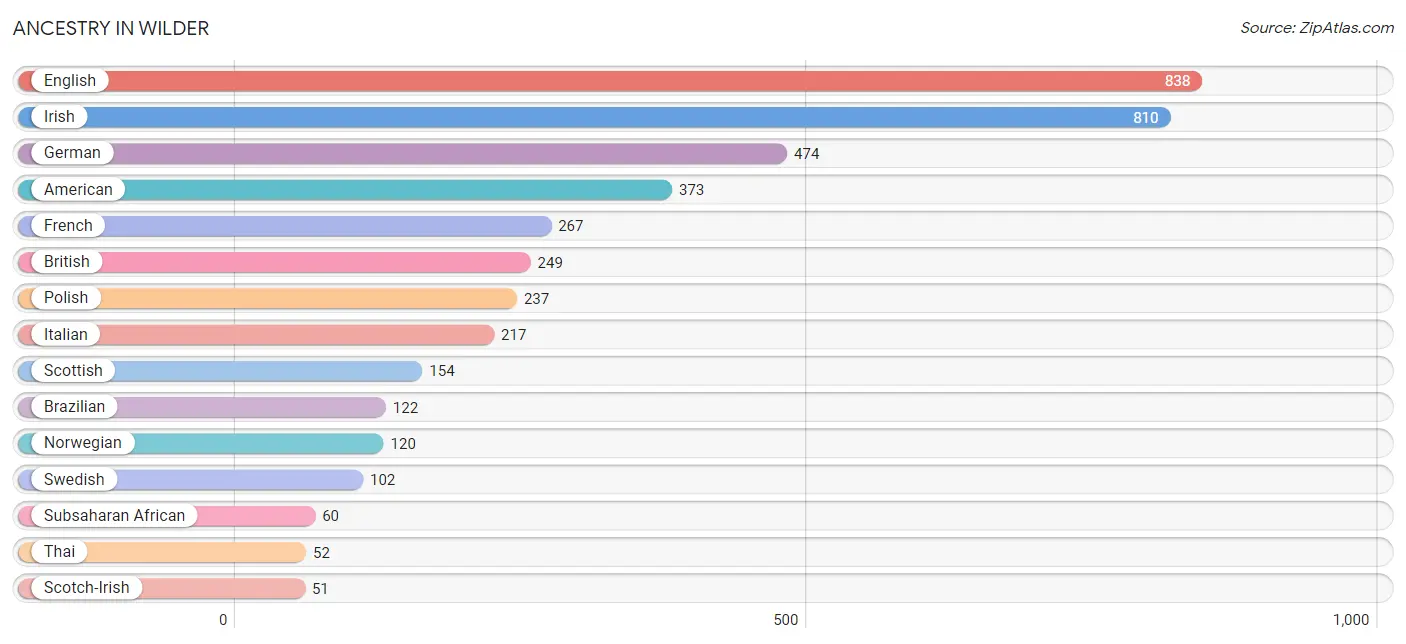
| Ancestry | # Population | % Population |
| African | 50 | 1.4% |
| American | 373 | 10.3% |
| Brazilian | 122 | 3.4% |
| British | 249 | 6.9% |
| Burmese | 10 | 0.3% |
| Dutch | 35 | 1.0% |
| English | 838 | 23.1% |
| European | 34 | 0.9% |
| French | 267 | 7.3% |
| French Canadian | 47 | 1.3% |
| German | 474 | 13.0% |
| Iranian | 13 | 0.4% |
| Irish | 810 | 22.3% |
| Italian | 217 | 6.0% |
| Jamaican | 4 | 0.1% |
| Kenyan | 10 | 0.3% |
| Norwegian | 120 | 3.3% |
| Polish | 237 | 6.5% |
| Portuguese | 47 | 1.3% |
| Russian | 38 | 1.1% |
| Scotch-Irish | 51 | 1.4% |
| Scottish | 154 | 4.2% |
| Slavic | 7 | 0.2% |
| Slovak | 7 | 0.2% |
| Spanish | 31 | 0.9% |
| Subsaharan African | 60 | 1.7% |
| Swedish | 102 | 2.8% |
| Swiss | 10 | 0.3% |
| Thai | 52 | 1.4% |
| Yugoslavian | 29 | 0.8% | View All 30 Rows |
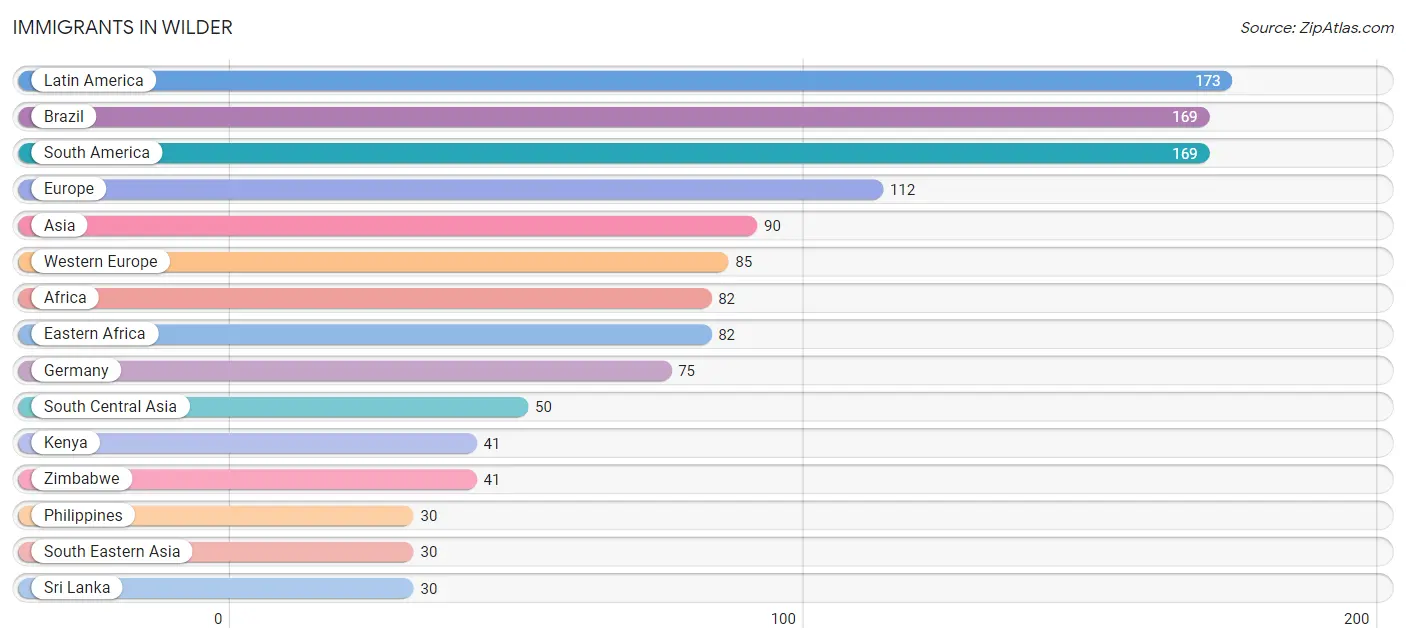
Immigrants in Wilder
The most numerous immigrant groups reported in Wilder came from Latin America (173 | 4.8%), Brazil (169 | 4.6%), South America (169 | 4.6%), Europe (112 | 3.1%), and Asia (90 | 2.5%), together accounting for 19.6% of all Wilder residents.
| Immigration Origin | # Population | % Population |
| Africa | 82 | 2.3% |
| Asia | 90 | 2.5% |
| Brazil | 169 | 4.6% |
| Caribbean | 4 | 0.1% |
| Eastern Africa | 82 | 2.3% |
| Eastern Asia | 10 | 0.3% |
| Eastern Europe | 19 | 0.5% |
| England | 8 | 0.2% |
| Europe | 112 | 3.1% |
| Germany | 75 | 2.1% |
| Jamaica | 4 | 0.1% |
| Kenya | 41 | 1.1% |
| Korea | 10 | 0.3% |
| Latin America | 173 | 4.8% |
| Netherlands | 10 | 0.3% |
| Northern Europe | 8 | 0.2% |
| Pakistan | 20 | 0.5% |
| Philippines | 30 | 0.8% |
| Russia | 19 | 0.5% |
| South America | 169 | 4.6% |
| South Central Asia | 50 | 1.4% |
| South Eastern Asia | 30 | 0.8% |
| Sri Lanka | 30 | 0.8% |
| Western Europe | 85 | 2.3% |
| Zimbabwe | 41 | 1.1% | View All 25 Rows |
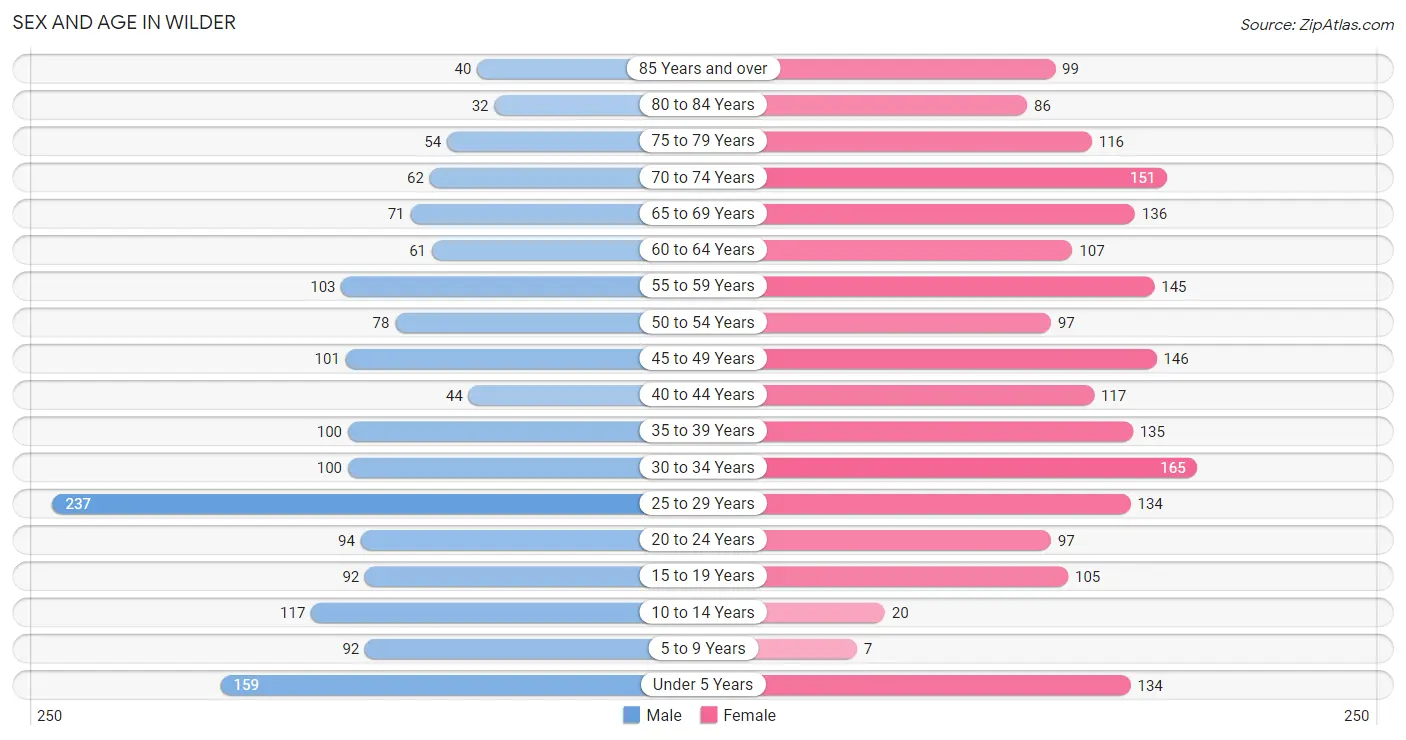
Sex and Age in Wilder
Sex and Age in Wilder
The most populous age groups in Wilder are 25 to 29 Years (237 | 14.5%) for men and 30 to 34 Years (165 | 8.3%) for women.
| Age Bracket | Male | Female |
| Under 5 Years | 159 (9.7%) | 134 (6.7%) |
| 5 to 9 Years | 92 (5.6%) | 7 (0.4%) |
| 10 to 14 Years | 117 (7.1%) | 20 (1.0%) |
| 15 to 19 Years | 92 (5.6%) | 105 (5.3%) |
| 20 to 24 Years | 94 (5.7%) | 97 (4.9%) |
| 25 to 29 Years | 237 (14.5%) | 134 (6.7%) |
| 30 to 34 Years | 100 (6.1%) | 165 (8.3%) |
| 35 to 39 Years | 100 (6.1%) | 135 (6.8%) |
| 40 to 44 Years | 44 (2.7%) | 117 (5.9%) |
| 45 to 49 Years | 101 (6.2%) | 146 (7.3%) |
| 50 to 54 Years | 78 (4.8%) | 97 (4.9%) |
| 55 to 59 Years | 103 (6.3%) | 145 (7.3%) |
| 60 to 64 Years | 61 (3.7%) | 107 (5.4%) |
| 65 to 69 Years | 71 (4.3%) | 136 (6.8%) |
| 70 to 74 Years | 62 (3.8%) | 151 (7.6%) |
| 75 to 79 Years | 54 (3.3%) | 116 (5.8%) |
| 80 to 84 Years | 32 (1.9%) | 86 (4.3%) |
| 85 Years and over | 40 (2.4%) | 99 (5.0%) |
| Total | 1,637 (100.0%) | 1,997 (100.0%) |
Families and Households in Wilder
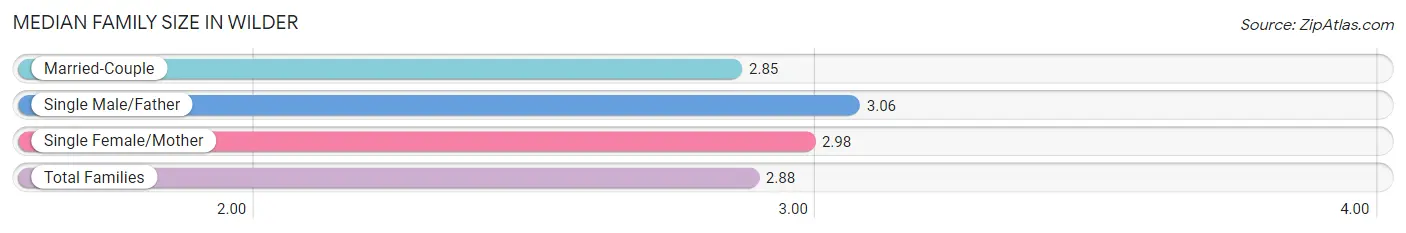
Median Family Size in Wilder
The median family size in Wilder is 2.88 persons per family, with single male/father families (18 | 2.0%) accounting for the largest median family size of 3.06 persons per family. On the other hand, married-couple families (669 | 74.3%) represent the smallest median family size with 2.85 persons per family.
| Family Type | # Families | Family Size |
| Married-Couple | 669 (74.3%) | 2.85 |
| Single Male/Father | 18 (2.0%) | 3.06 |
| Single Female/Mother | 214 (23.7%) | 2.98 |
| Total Families | 901 (100.0%) | 2.88 |
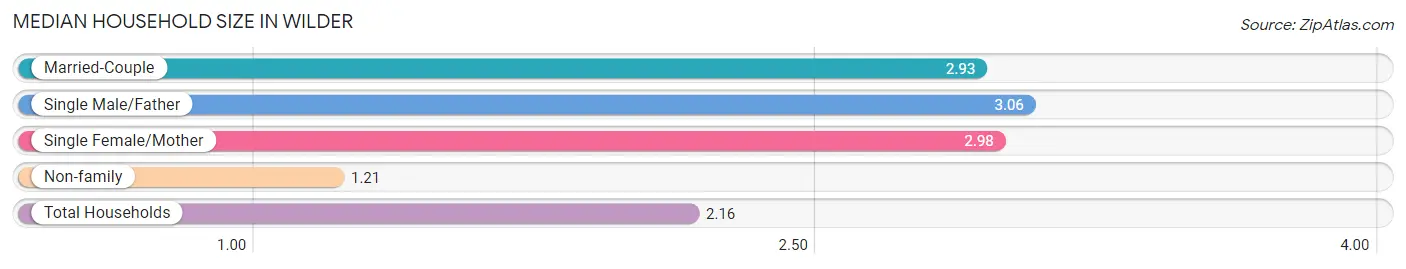
Median Household Size in Wilder
The median household size in Wilder is 2.16 persons per household, with single male/father households (18 | 1.1%) accounting for the largest median household size of 3.06 persons per household. non-family households (748 | 45.4%) represent the smallest median household size with 1.21 persons per household.
| Household Type | # Households | Household Size |
| Married-Couple | 669 (40.6%) | 2.93 |
| Single Male/Father | 18 (1.1%) | 3.06 |
| Single Female/Mother | 214 (13.0%) | 2.98 |
| Non-family | 748 (45.4%) | 1.21 |
| Total Households | 1,649 (100.0%) | 2.16 |
Household Size by Marriage Status in Wilder
Out of a total of 1,649 households in Wilder, 901 (54.6%) are family households, while 748 (45.4%) are nonfamily households. The most numerous type of family households are 2-person households, comprising 547, and the most common type of nonfamily households are 1-person households, comprising 658.
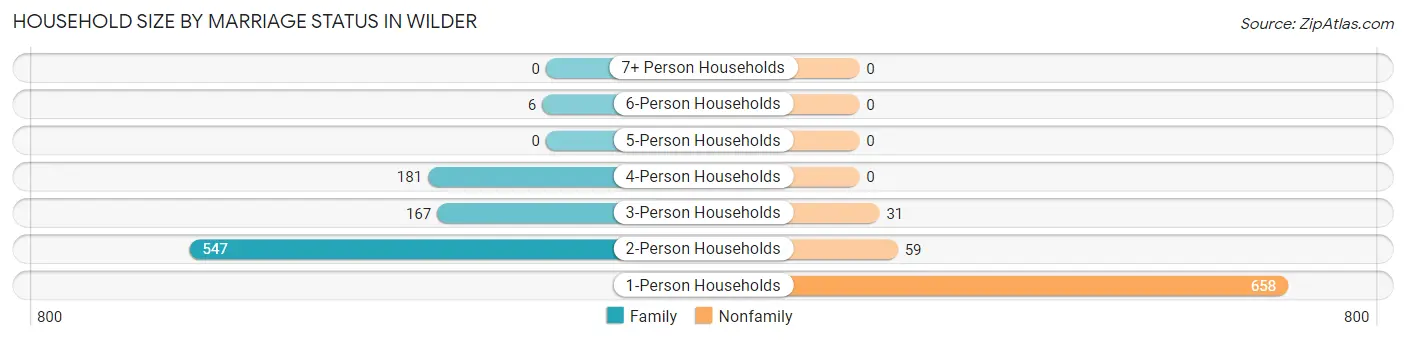
| Household Size | Family Households | Nonfamily Households |
| 1-Person Households | - | 658 (39.9%) |
| 2-Person Households | 547 (33.2%) | 59 (3.6%) |
| 3-Person Households | 167 (10.1%) | 31 (1.9%) |
| 4-Person Households | 181 (11.0%) | 0 (0.0%) |
| 5-Person Households | 0 (0.0%) | 0 (0.0%) |
| 6-Person Households | 6 (0.4%) | 0 (0.0%) |
| 7+ Person Households | 0 (0.0%) | 0 (0.0%) |
| Total | 901 (54.6%) | 748 (45.4%) |
Female Fertility in Wilder
Fertility by Age in Wilder
Average fertility rate in Wilder is 37.0 births per 1,000 women. Women in the age bracket of 35 to 50 years have the highest fertility rate with 44.0 births per 1,000 women. Women in the age bracket of 35 to 50 years acount for 52.9% of all women with births.
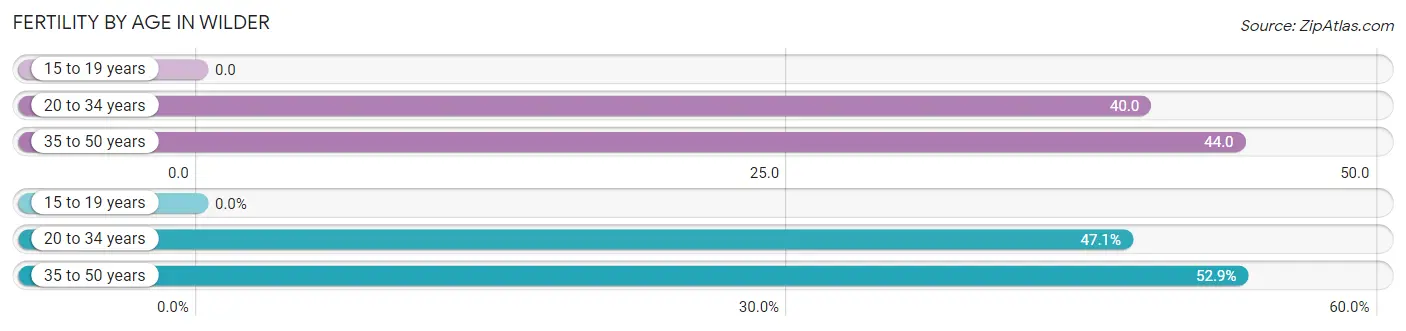
| Age Bracket | Women with Births | Births / 1,000 Women |
| 15 to 19 years | 0 (0.0%) | 0.0 |
| 20 to 34 years | 16 (47.1%) | 40.0 |
| 35 to 50 years | 18 (52.9%) | 44.0 |
| Total | 34 (100.0%) | 37.0 |
Fertility by Age by Marriage Status in Wilder
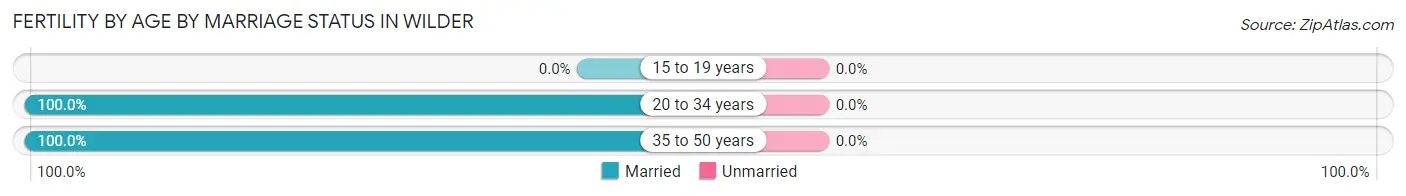
| Age Bracket | Married | Unmarried |
| 15 to 19 years | 0 (0.0%) | 0 (0.0%) |
| 20 to 34 years | 16 (100.0%) | 0 (0.0%) |
| 35 to 50 years | 18 (100.0%) | 0 (0.0%) |
| Total | 34 (100.0%) | 0 (0.0%) |
Fertility by Education in Wilder
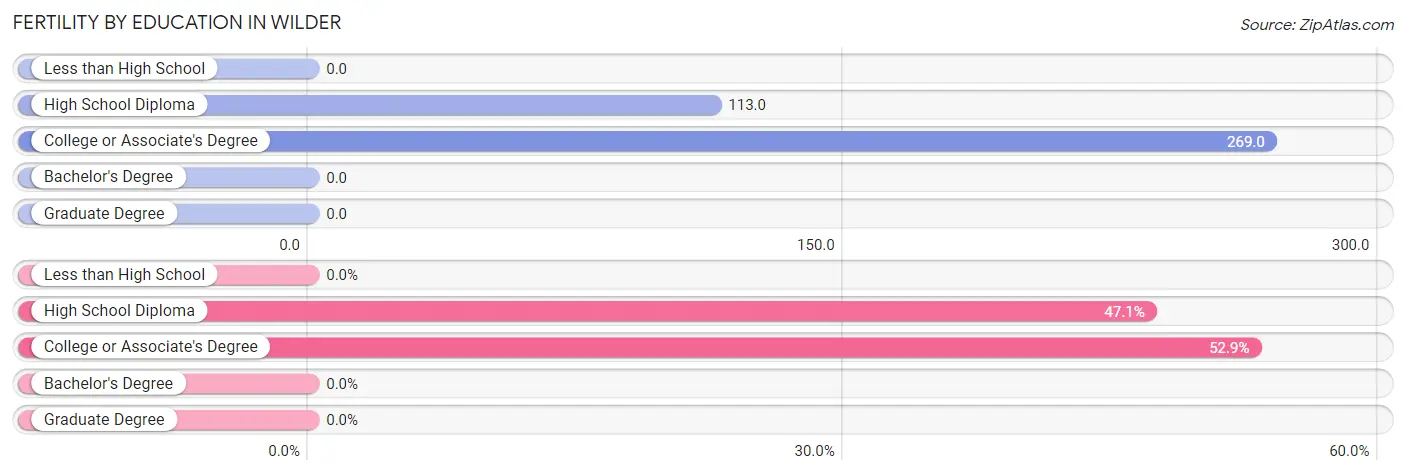
| Educational Attainment | Women with Births | Births / 1,000 Women |
| Less than High School | 0 (0.0%) | 0.0 |
| High School Diploma | 16 (47.1%) | 113.0 |
| College or Associate's Degree | 18 (52.9%) | 269.0 |
| Bachelor's Degree | 0 (0.0%) | 0.0 |
| Graduate Degree | 0 (0.0%) | 0.0 |
| Total | 34 (100.0%) | 37.0 |
Fertility by Education by Marriage Status in Wilder
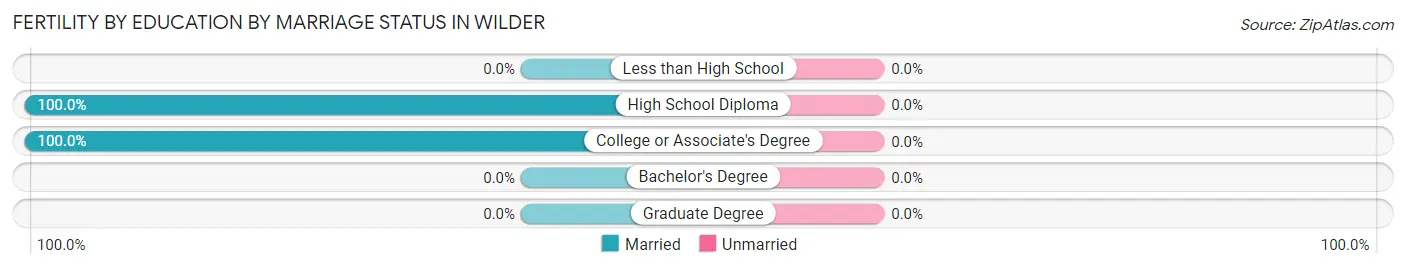
| Educational Attainment | Married | Unmarried |
| Less than High School | 0 (0.0%) | 0 (0.0%) |
| High School Diploma | 16 (100.0%) | 0 (0.0%) |
| College or Associate's Degree | 18 (100.0%) | 0 (0.0%) |
| Bachelor's Degree | 0 (0.0%) | 0 (0.0%) |
| Graduate Degree | 0 (0.0%) | 0 (0.0%) |
| Total | 34 (100.0%) | 0 (0.0%) |
Employment Characteristics in Wilder
Employment by Class of Employer in Wilder
Among the 2,002 employed individuals in Wilder, private company employees (1,125 | 56.2%), not-for-profit organizations (443 | 22.1%), and self-employed (not incorporated) (171 | 8.5%) make up the most common classes of employment.
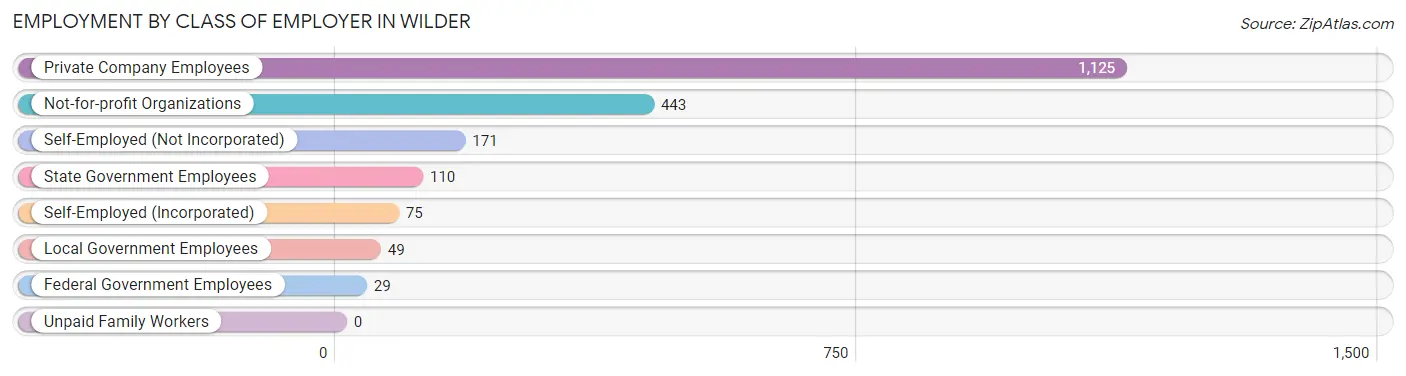
| Employer Class | # Employees | % Employees |
| Private Company Employees | 1,125 | 56.2% |
| Self-Employed (Incorporated) | 75 | 3.7% |
| Self-Employed (Not Incorporated) | 171 | 8.5% |
| Not-for-profit Organizations | 443 | 22.1% |
| Local Government Employees | 49 | 2.5% |
| State Government Employees | 110 | 5.5% |
| Federal Government Employees | 29 | 1.5% |
| Unpaid Family Workers | 0 | 0.0% |
| Total | 2,002 | 100.0% |
Employment Status by Age in Wilder
According to the labor force statistics for Wilder, out of the total population over 16 years of age (3,054), 69.8% or 2,132 individuals are in the labor force, with 5.8% or 124 of them unemployed. The age group with the highest labor force participation rate is 20 to 24 years, with 100.0% or 191 individuals in the labor force. Within the labor force, the 45 to 54 years age range has the highest percentage of unemployed individuals, with 21.0% or 75 of them being unemployed.
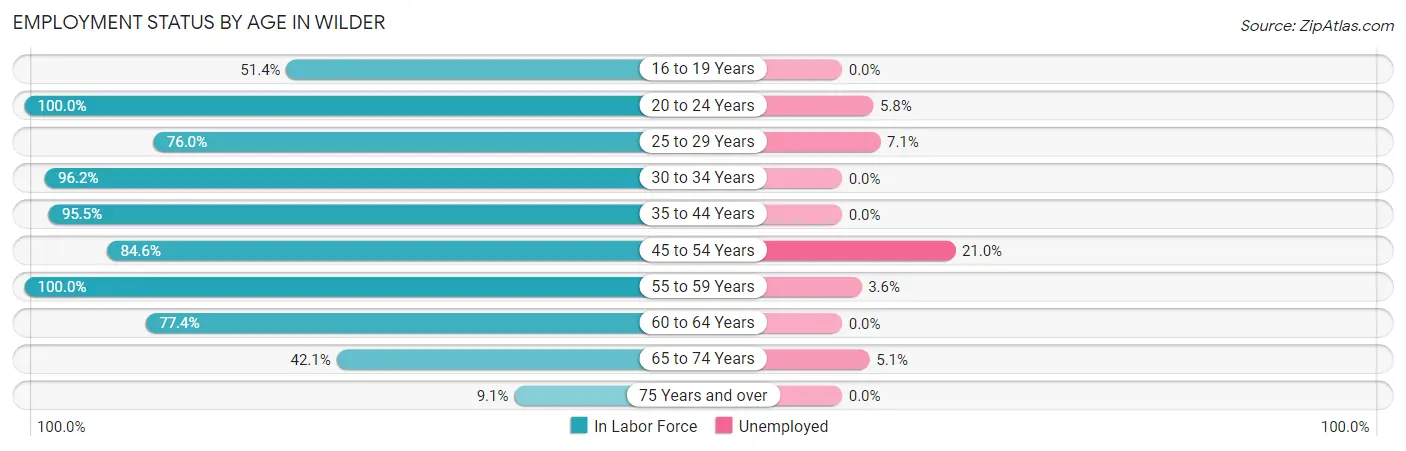
| Age Bracket | In Labor Force | Unemployed |
| 16 to 19 Years | 75 (51.4%) | 0 (0.0%) |
| 20 to 24 Years | 191 (100.0%) | 11 (5.8%) |
| 25 to 29 Years | 282 (76.0%) | 20 (7.1%) |
| 30 to 34 Years | 255 (96.2%) | 0 (0.0%) |
| 35 to 44 Years | 378 (95.5%) | 0 (0.0%) |
| 45 to 54 Years | 357 (84.6%) | 75 (21.0%) |
| 55 to 59 Years | 248 (100.0%) | 9 (3.6%) |
| 60 to 64 Years | 130 (77.4%) | 0 (0.0%) |
| 65 to 74 Years | 177 (42.1%) | 9 (5.1%) |
| 75 Years and over | 39 (9.1%) | 0 (0.0%) |
| Total | 2,132 (69.8%) | 124 (5.8%) |
Employment Status by Educational Attainment in Wilder
According to labor force statistics for Wilder, 88.2% of individuals (1,649) out of the total population between 25 and 64 years of age (1,870) are in the labor force, with 6.3% or 104 of them being unemployed. The group with the highest labor force participation rate are those with the educational attainment of bachelor's degree or higher, with 90.4% or 991 individuals in the labor force. Within the labor force, individuals with bachelor's degree or higher education have the highest percentage of unemployment, with 10.5% or 104 of them being unemployed.
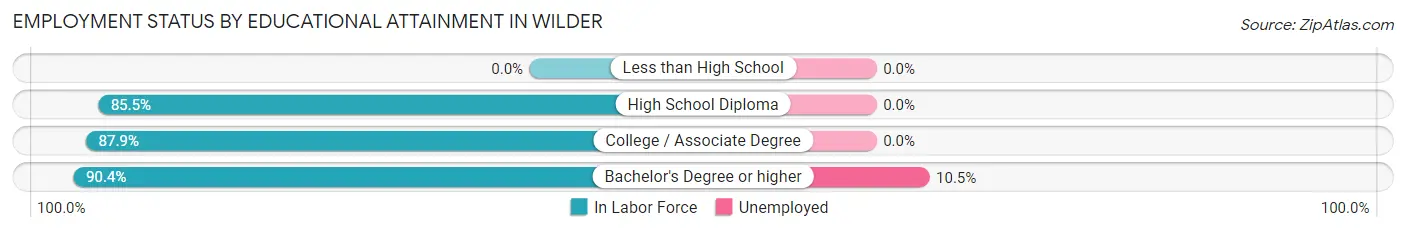
| Educational Attainment | In Labor Force | Unemployed |
| Less than High School | 0 (0.0%) | 0 (0.0%) |
| High School Diploma | 441 (85.5%) | 0 (0.0%) |
| College / Associate Degree | 218 (87.9%) | 0 (0.0%) |
| Bachelor's Degree or higher | 991 (90.4%) | 115 (10.5%) |
| Total | 1,649 (88.2%) | 118 (6.3%) |
Employment Occupations by Sex in Wilder
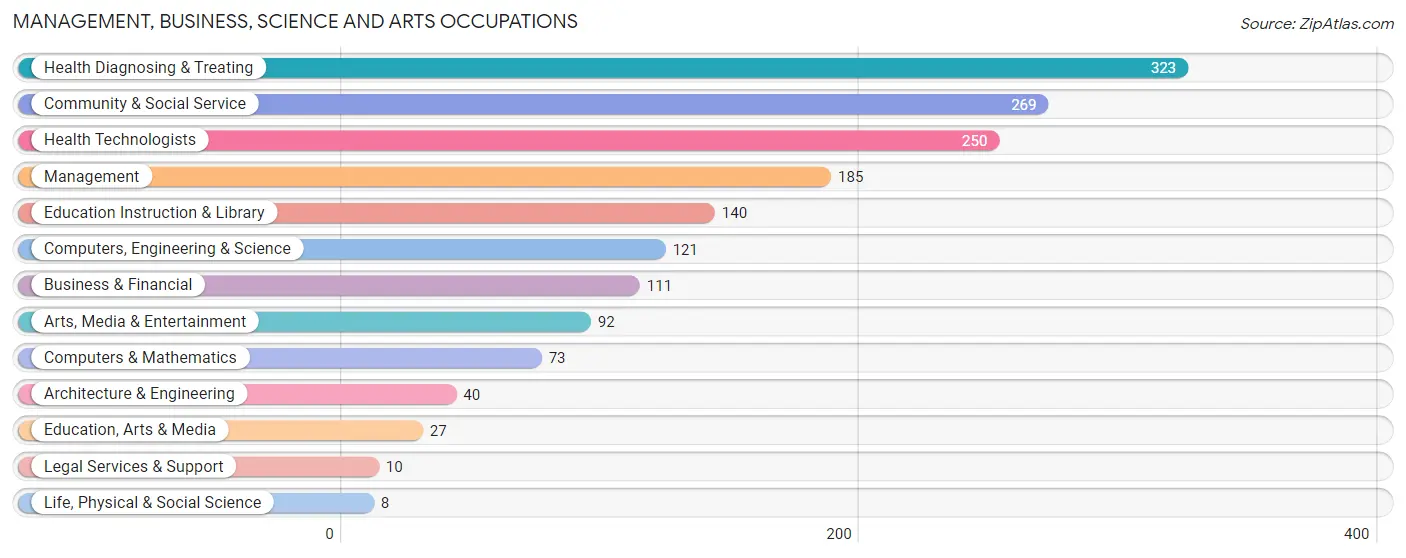
Management, Business, Science and Arts Occupations
The most common Management, Business, Science and Arts occupations in Wilder are Health Diagnosing & Treating (323 | 16.1%), Community & Social Service (269 | 13.4%), Health Technologists (250 | 12.4%), Management (185 | 9.2%), and Education Instruction & Library (140 | 7.0%).
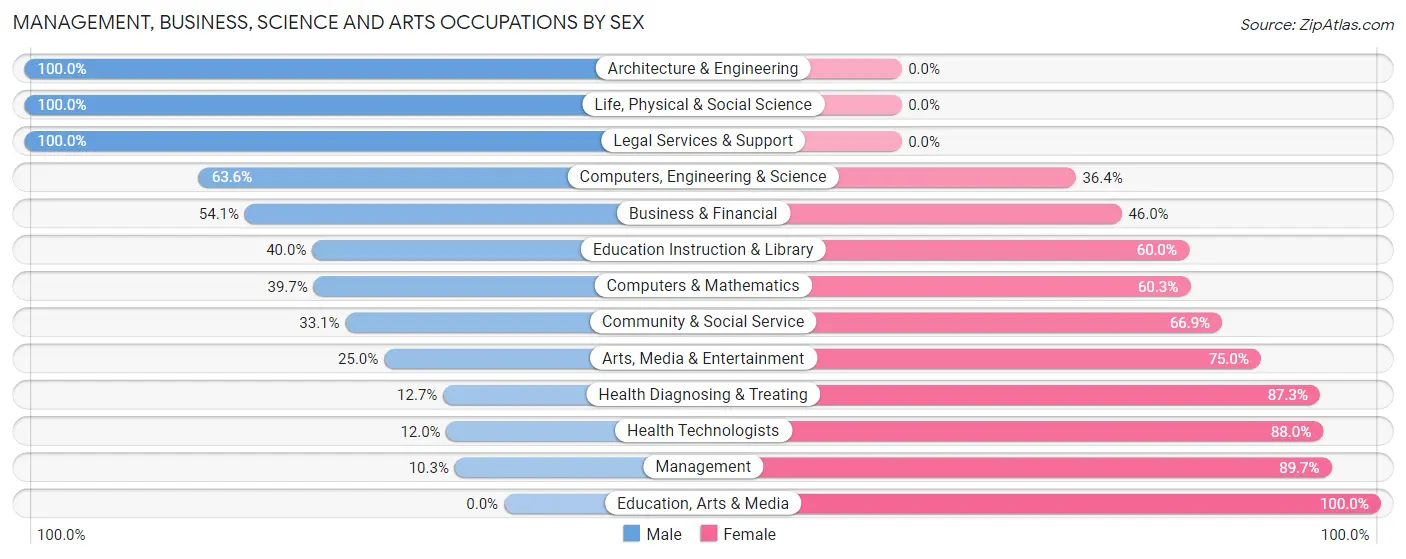
Management, Business, Science and Arts Occupations by Sex
Within the Management, Business, Science and Arts occupations in Wilder, the most male-oriented occupations are Architecture & Engineering (100.0%), Life, Physical & Social Science (100.0%), and Legal Services & Support (100.0%), while the most female-oriented occupations are Education, Arts & Media (100.0%), Management (89.7%), and Health Technologists (88.0%).
| Occupation | Male | Female |
| Management | 19 (10.3%) | 166 (89.7%) |
| Business & Financial | 60 (54.0%) | 51 (46.0%) |
| Computers, Engineering & Science | 77 (63.6%) | 44 (36.4%) |
| Computers & Mathematics | 29 (39.7%) | 44 (60.3%) |
| Architecture & Engineering | 40 (100.0%) | 0 (0.0%) |
| Life, Physical & Social Science | 8 (100.0%) | 0 (0.0%) |
| Community & Social Service | 89 (33.1%) | 180 (66.9%) |
| Education, Arts & Media | 0 (0.0%) | 27 (100.0%) |
| Legal Services & Support | 10 (100.0%) | 0 (0.0%) |
| Education Instruction & Library | 56 (40.0%) | 84 (60.0%) |
| Arts, Media & Entertainment | 23 (25.0%) | 69 (75.0%) |
| Health Diagnosing & Treating | 41 (12.7%) | 282 (87.3%) |
| Health Technologists | 30 (12.0%) | 220 (88.0%) |
| Total (Category) | 286 (28.3%) | 723 (71.7%) |
| Total (Overall) | 926 (46.1%) | 1,082 (53.9%) |
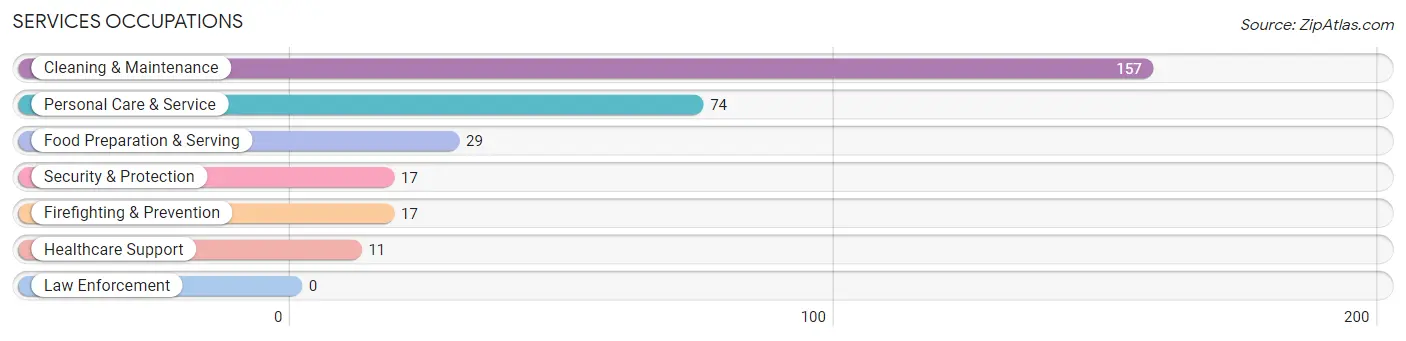
Services Occupations
The most common Services occupations in Wilder are Cleaning & Maintenance (157 | 7.8%), Personal Care & Service (74 | 3.7%), Food Preparation & Serving (29 | 1.4%), Security & Protection (17 | 0.9%), and Firefighting & Prevention (17 | 0.9%).
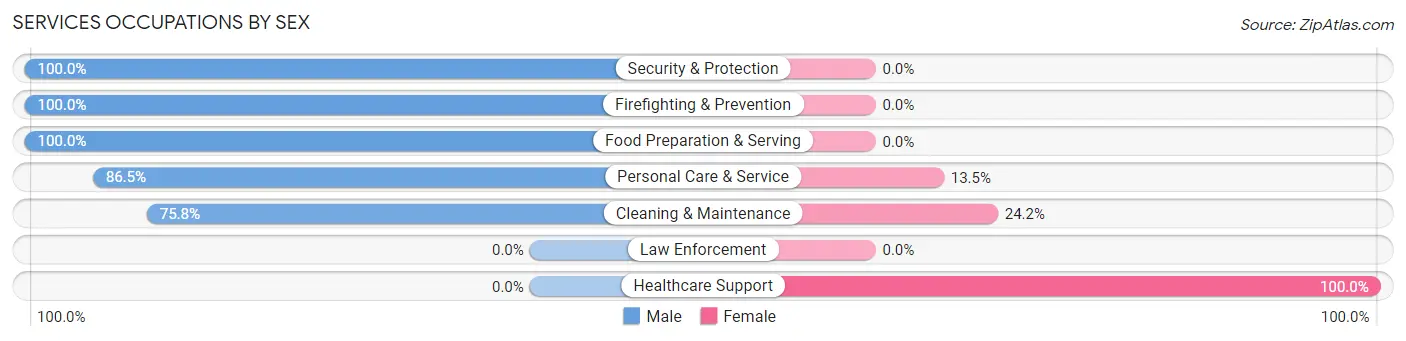
Services Occupations by Sex
Within the Services occupations in Wilder, the most male-oriented occupations are Security & Protection (100.0%), Firefighting & Prevention (100.0%), and Food Preparation & Serving (100.0%), while the most female-oriented occupations are Healthcare Support (100.0%), Cleaning & Maintenance (24.2%), and Personal Care & Service (13.5%).
| Occupation | Male | Female |
| Healthcare Support | 0 (0.0%) | 11 (100.0%) |
| Security & Protection | 17 (100.0%) | 0 (0.0%) |
| Firefighting & Prevention | 17 (100.0%) | 0 (0.0%) |
| Law Enforcement | 0 (0.0%) | 0 (0.0%) |
| Food Preparation & Serving | 29 (100.0%) | 0 (0.0%) |
| Cleaning & Maintenance | 119 (75.8%) | 38 (24.2%) |
| Personal Care & Service | 64 (86.5%) | 10 (13.5%) |
| Total (Category) | 229 (79.5%) | 59 (20.5%) |
| Total (Overall) | 926 (46.1%) | 1,082 (53.9%) |
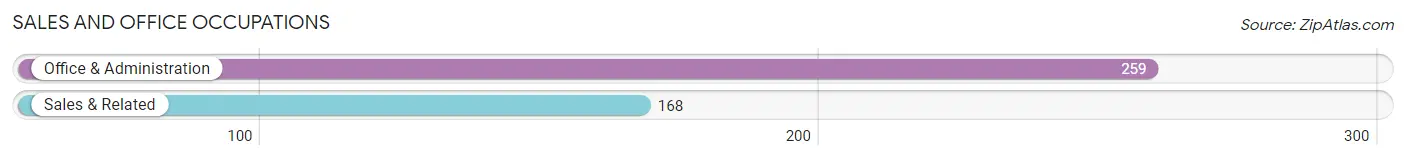
Sales and Office Occupations
The most common Sales and Office occupations in Wilder are Office & Administration (259 | 12.9%), and Sales & Related (168 | 8.4%).
Sales and Office Occupations by Sex
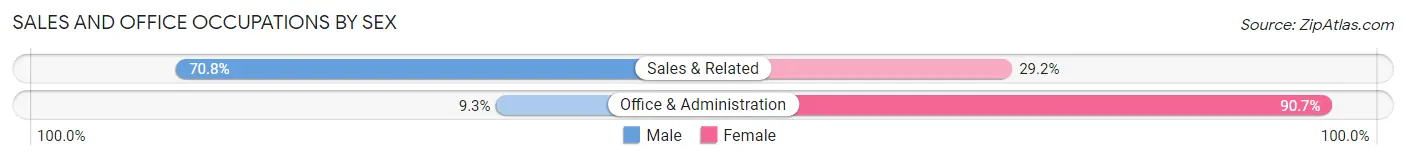
| Occupation | Male | Female |
| Sales & Related | 119 (70.8%) | 49 (29.2%) |
| Office & Administration | 24 (9.3%) | 235 (90.7%) |
| Total (Category) | 143 (33.5%) | 284 (66.5%) |
| Total (Overall) | 926 (46.1%) | 1,082 (53.9%) |
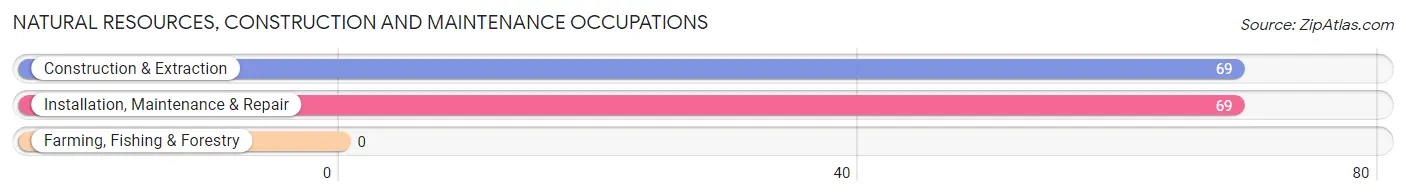
Natural Resources, Construction and Maintenance Occupations
The most common Natural Resources, Construction and Maintenance occupations in Wilder are Construction & Extraction (69 | 3.4%), and Installation, Maintenance & Repair (69 | 3.4%).
Natural Resources, Construction and Maintenance Occupations by Sex
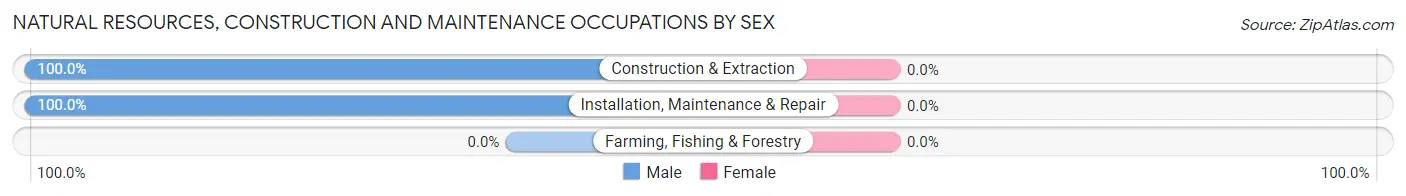
| Occupation | Male | Female |
| Farming, Fishing & Forestry | 0 (0.0%) | 0 (0.0%) |
| Construction & Extraction | 69 (100.0%) | 0 (0.0%) |
| Installation, Maintenance & Repair | 69 (100.0%) | 0 (0.0%) |
| Total (Category) | 138 (100.0%) | 0 (0.0%) |
| Total (Overall) | 926 (46.1%) | 1,082 (53.9%) |
Production, Transportation and Moving Occupations
The most common Production, Transportation and Moving occupations in Wilder are Production (92 | 4.6%), and Transportation (54 | 2.7%).
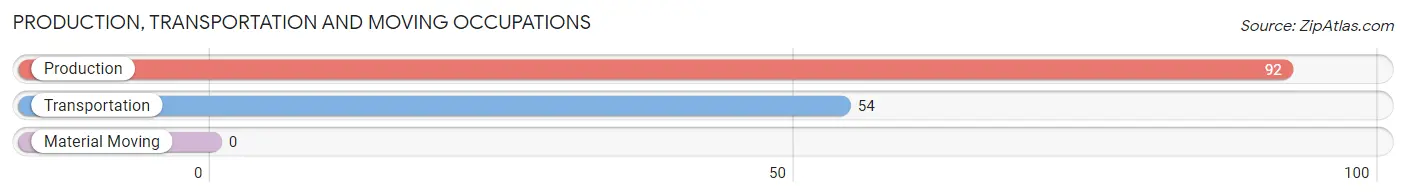
Production, Transportation and Moving Occupations by Sex
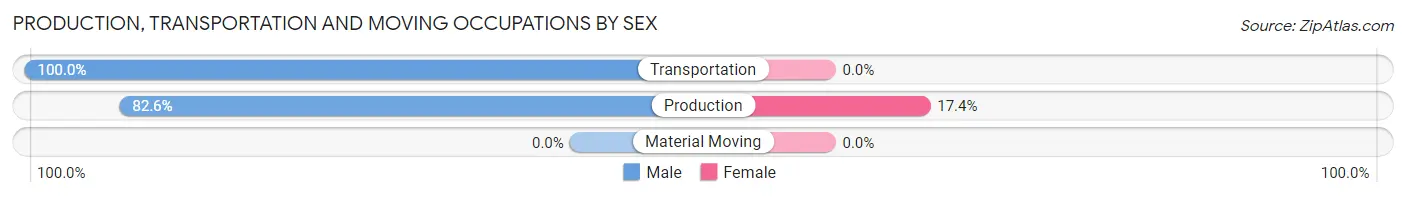
| Occupation | Male | Female |
| Production | 76 (82.6%) | 16 (17.4%) |
| Transportation | 54 (100.0%) | 0 (0.0%) |
| Material Moving | 0 (0.0%) | 0 (0.0%) |
| Total (Category) | 130 (89.0%) | 16 (11.0%) |
| Total (Overall) | 926 (46.1%) | 1,082 (53.9%) |
Employment Industries by Sex in Wilder
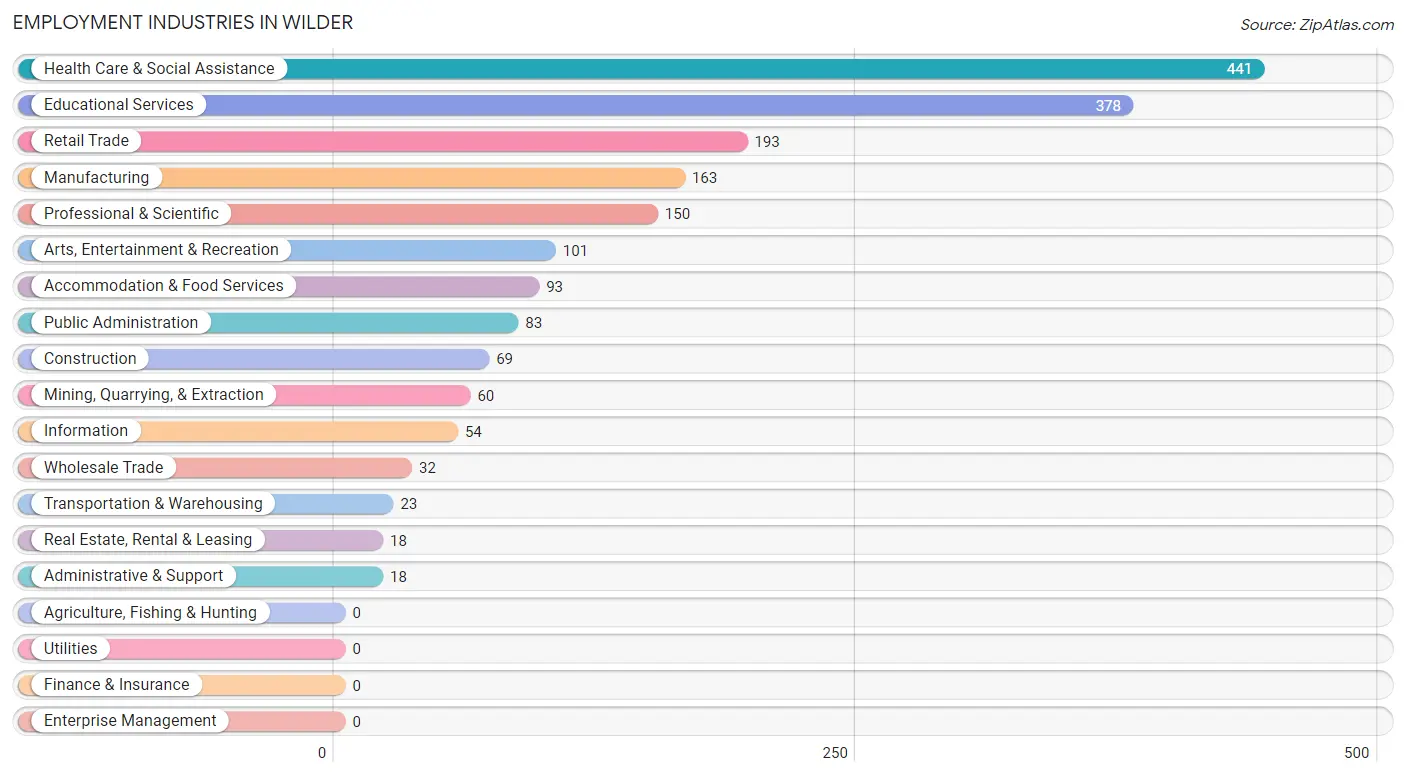
Employment Industries in Wilder
The major employment industries in Wilder include Health Care & Social Assistance (441 | 22.0%), Educational Services (378 | 18.8%), Retail Trade (193 | 9.6%), Manufacturing (163 | 8.1%), and Professional & Scientific (150 | 7.5%).
Employment Industries by Sex in Wilder
The Wilder industries that see more men than women are Construction (100.0%), Transportation & Warehousing (100.0%), and Administrative & Support (100.0%), whereas the industries that tend to have a higher number of women are Mining, Quarrying, & Extraction (100.0%), Health Care & Social Assistance (85.7%), and Educational Services (80.7%).
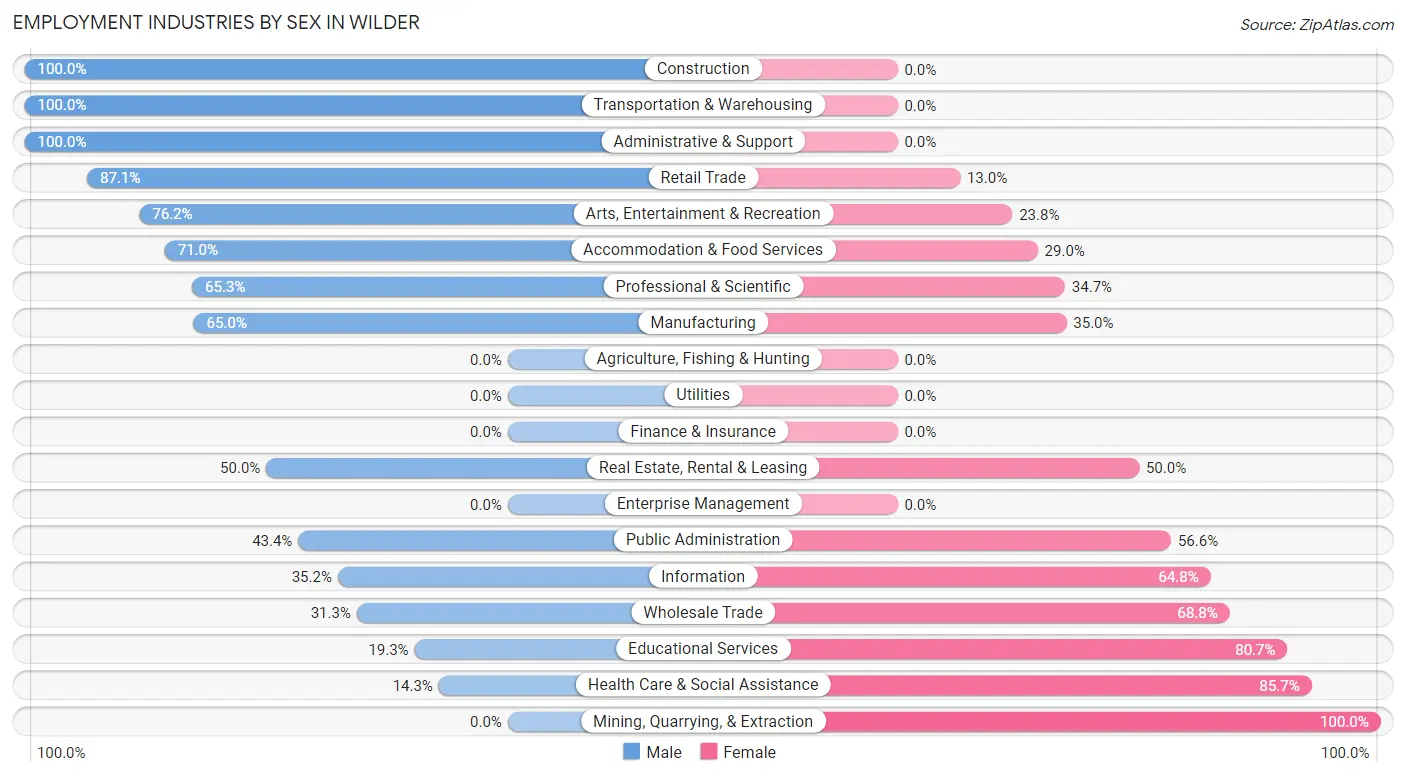
| Industry | Male | Female |
| Agriculture, Fishing & Hunting | 0 (0.0%) | 0 (0.0%) |
| Mining, Quarrying, & Extraction | 0 (0.0%) | 60 (100.0%) |
| Construction | 69 (100.0%) | 0 (0.0%) |
| Manufacturing | 106 (65.0%) | 57 (35.0%) |
| Wholesale Trade | 10 (31.2%) | 22 (68.8%) |
| Retail Trade | 168 (87.1%) | 25 (13.0%) |
| Transportation & Warehousing | 23 (100.0%) | 0 (0.0%) |
| Utilities | 0 (0.0%) | 0 (0.0%) |
| Information | 19 (35.2%) | 35 (64.8%) |
| Finance & Insurance | 0 (0.0%) | 0 (0.0%) |
| Real Estate, Rental & Leasing | 9 (50.0%) | 9 (50.0%) |
| Professional & Scientific | 98 (65.3%) | 52 (34.7%) |
| Enterprise Management | 0 (0.0%) | 0 (0.0%) |
| Administrative & Support | 18 (100.0%) | 0 (0.0%) |
| Educational Services | 73 (19.3%) | 305 (80.7%) |
| Health Care & Social Assistance | 63 (14.3%) | 378 (85.7%) |
| Arts, Entertainment & Recreation | 77 (76.2%) | 24 (23.8%) |
| Accommodation & Food Services | 66 (71.0%) | 27 (29.0%) |
| Public Administration | 36 (43.4%) | 47 (56.6%) |
| Total | 926 (46.1%) | 1,082 (53.9%) |
Education in Wilder
School Enrollment in Wilder
The most common levels of schooling among the 738 students in Wilder are high school (157 | 21.3%), graduate / professional (152 | 20.6%), and college / undergraduate (146 | 19.8%).
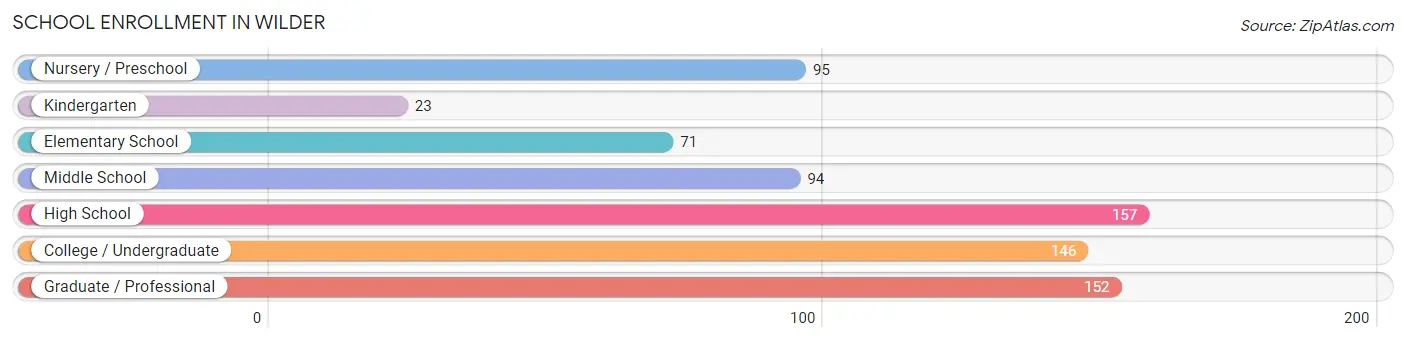
| School Level | # Students | % Students |
| Nursery / Preschool | 95 | 12.9% |
| Kindergarten | 23 | 3.1% |
| Elementary School | 71 | 9.6% |
| Middle School | 94 | 12.7% |
| High School | 157 | 21.3% |
| College / Undergraduate | 146 | 19.8% |
| Graduate / Professional | 152 | 20.6% |
| Total | 738 | 100.0% |
School Enrollment by Age by Funding Source in Wilder
Out of a total of 738 students who are enrolled in schools in Wilder, 219 (29.7%) attend a private institution, while the remaining 519 (70.3%) are enrolled in public schools. The age group of 25 to 34 year olds has the highest likelihood of being enrolled in private schools, with 162 (100.0% in the age bracket) enrolled. Conversely, the age group of 5 to 9 year old has the lowest likelihood of being enrolled in a private school, with 99 (100.0% in the age bracket) attending a public institution.
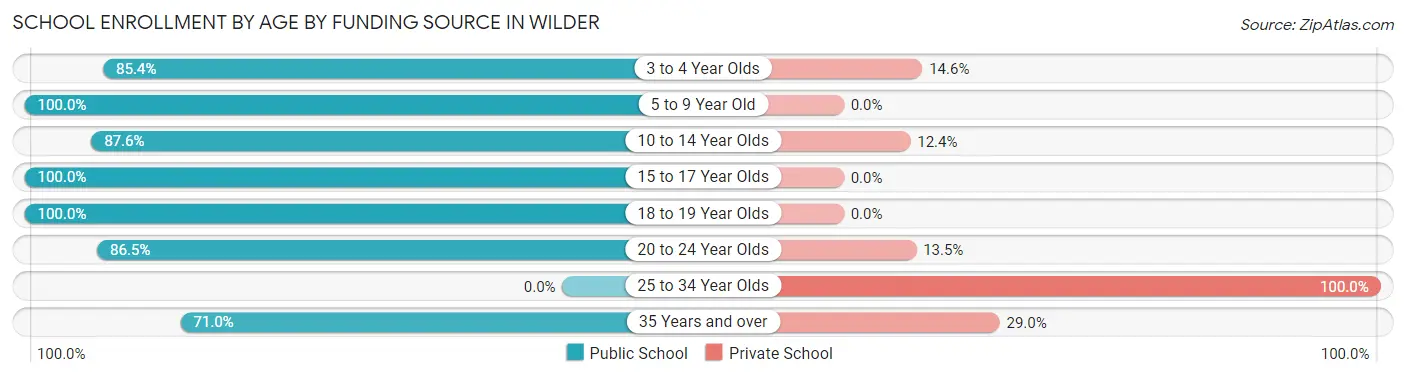
| Age Bracket | Public School | Private School |
| 3 to 4 Year Olds | 70 (85.4%) | 12 (14.6%) |
| 5 to 9 Year Old | 99 (100.0%) | 0 (0.0%) |
| 10 to 14 Year Olds | 120 (87.6%) | 17 (12.4%) |
| 15 to 17 Year Olds | 63 (100.0%) | 0 (0.0%) |
| 18 to 19 Year Olds | 59 (100.0%) | 0 (0.0%) |
| 20 to 24 Year Olds | 64 (86.5%) | 10 (13.5%) |
| 25 to 34 Year Olds | 0 (0.0%) | 162 (100.0%) |
| 35 Years and over | 44 (71.0%) | 18 (29.0%) |
| Total | 519 (70.3%) | 219 (29.7%) |
Educational Attainment by Field of Study in Wilder
Science & technology (238 | 13.3%), education (199 | 11.1%), engineering (184 | 10.3%), bio, nature & agricultural (179 | 10.0%), and social sciences (146 | 8.2%) are the most common fields of study among 1,786 individuals in Wilder who have obtained a bachelor's degree or higher.
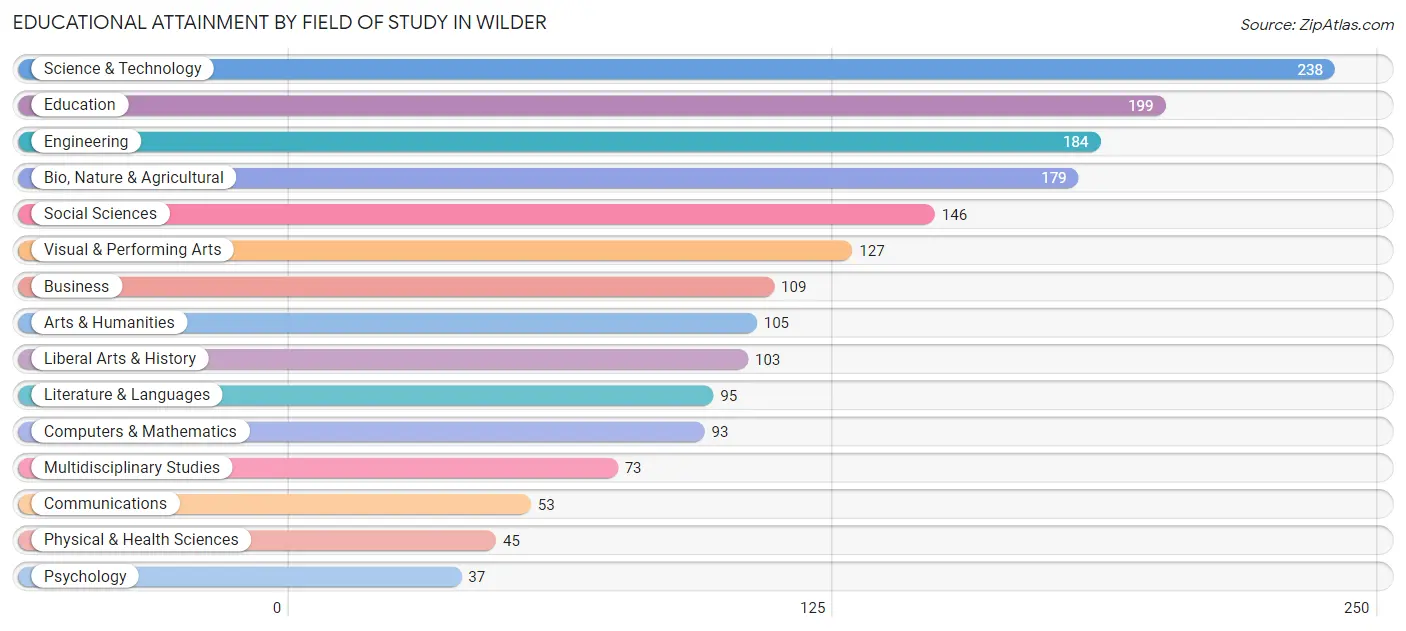
| Field of Study | # Graduates | % Graduates |
| Computers & Mathematics | 93 | 5.2% |
| Bio, Nature & Agricultural | 179 | 10.0% |
| Physical & Health Sciences | 45 | 2.5% |
| Psychology | 37 | 2.1% |
| Social Sciences | 146 | 8.2% |
| Engineering | 184 | 10.3% |
| Multidisciplinary Studies | 73 | 4.1% |
| Science & Technology | 238 | 13.3% |
| Business | 109 | 6.1% |
| Education | 199 | 11.1% |
| Literature & Languages | 95 | 5.3% |
| Liberal Arts & History | 103 | 5.8% |
| Visual & Performing Arts | 127 | 7.1% |
| Communications | 53 | 3.0% |
| Arts & Humanities | 105 | 5.9% |
| Total | 1,786 | 100.0% |
Transportation & Commute in Wilder
Vehicle Availability by Sex in Wilder
The most prevalent vehicle ownership categories in Wilder are males with 2 vehicles (531, accounting for 57.3%) and females with 2 vehicles (534, making up 49.3%).
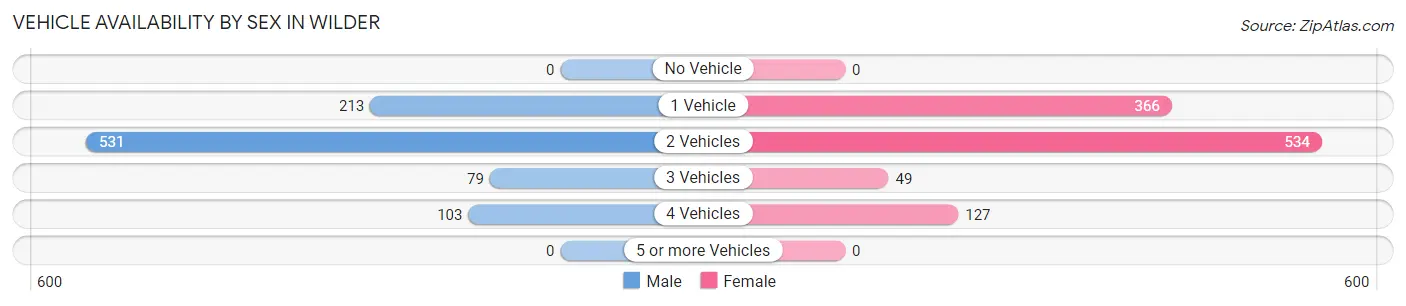
| Vehicles Available | Male | Female |
| No Vehicle | 0 (0.0%) | 0 (0.0%) |
| 1 Vehicle | 213 (23.0%) | 366 (34.0%) |
| 2 Vehicles | 531 (57.3%) | 534 (49.6%) |
| 3 Vehicles | 79 (8.5%) | 49 (4.5%) |
| 4 Vehicles | 103 (11.1%) | 127 (11.8%) |
| 5 or more Vehicles | 0 (0.0%) | 0 (0.0%) |
| Total | 926 (100.0%) | 1,076 (100.0%) |
Commute Time in Wilder
The most frequently occuring commute durations in Wilder are 10 to 14 minutes (421 commuters, 23.1%), 5 to 9 minutes (416 commuters, 22.9%), and 20 to 24 minutes (331 commuters, 18.2%).
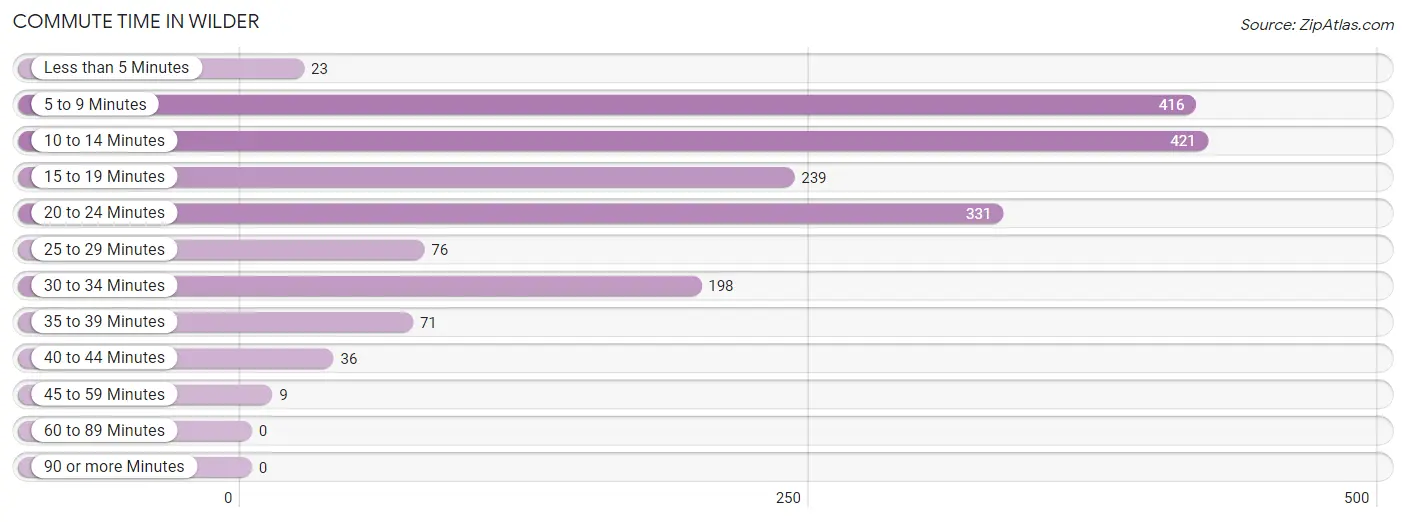
| Commute Time | # Commuters | % Commuters |
| Less than 5 Minutes | 23 | 1.3% |
| 5 to 9 Minutes | 416 | 22.9% |
| 10 to 14 Minutes | 421 | 23.1% |
| 15 to 19 Minutes | 239 | 13.1% |
| 20 to 24 Minutes | 331 | 18.2% |
| 25 to 29 Minutes | 76 | 4.2% |
| 30 to 34 Minutes | 198 | 10.9% |
| 35 to 39 Minutes | 71 | 3.9% |
| 40 to 44 Minutes | 36 | 2.0% |
| 45 to 59 Minutes | 9 | 0.5% |
| 60 to 89 Minutes | 0 | 0.0% |
| 90 or more Minutes | 0 | 0.0% |
Commute Time by Sex in Wilder
The most common commute times in Wilder are 5 to 9 minutes (283 commuters, 33.1%) for males and 10 to 14 minutes (298 commuters, 30.9%) for females.
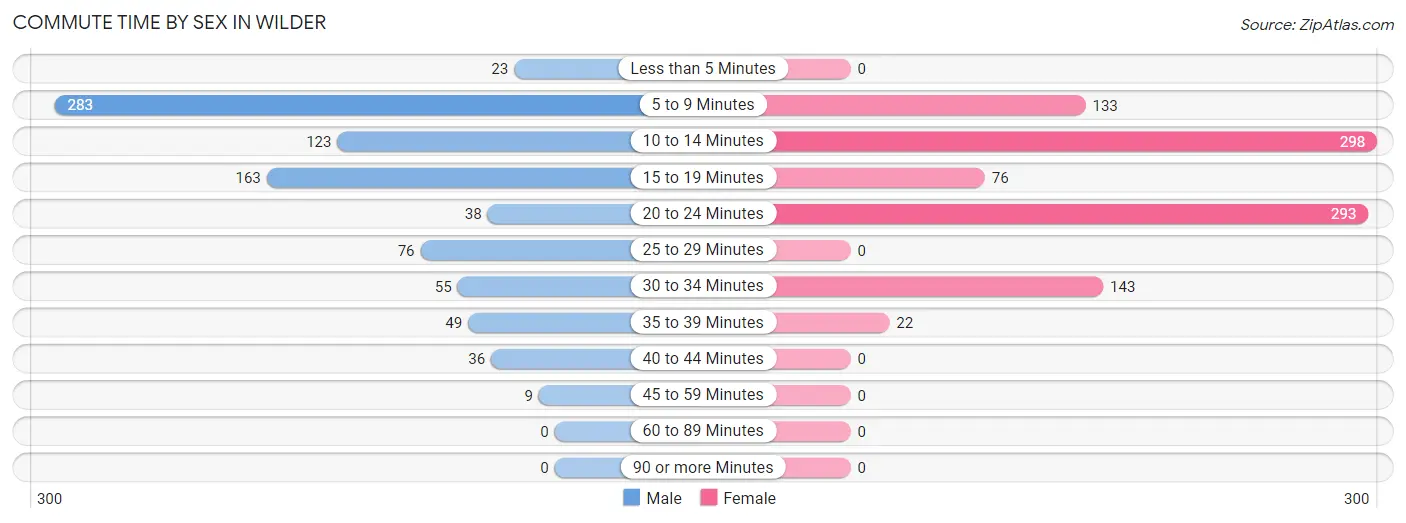
| Commute Time | Male | Female |
| Less than 5 Minutes | 23 (2.7%) | 0 (0.0%) |
| 5 to 9 Minutes | 283 (33.1%) | 133 (13.8%) |
| 10 to 14 Minutes | 123 (14.4%) | 298 (30.9%) |
| 15 to 19 Minutes | 163 (19.1%) | 76 (7.9%) |
| 20 to 24 Minutes | 38 (4.4%) | 293 (30.4%) |
| 25 to 29 Minutes | 76 (8.9%) | 0 (0.0%) |
| 30 to 34 Minutes | 55 (6.4%) | 143 (14.8%) |
| 35 to 39 Minutes | 49 (5.7%) | 22 (2.3%) |
| 40 to 44 Minutes | 36 (4.2%) | 0 (0.0%) |
| 45 to 59 Minutes | 9 (1.1%) | 0 (0.0%) |
| 60 to 89 Minutes | 0 (0.0%) | 0 (0.0%) |
| 90 or more Minutes | 0 (0.0%) | 0 (0.0%) |
Time of Departure to Work by Sex in Wilder
The most frequent times of departure to work in Wilder are 7:30 AM to 7:59 AM (157, 18.4%) for males and 7:30 AM to 7:59 AM (362, 37.5%) for females.
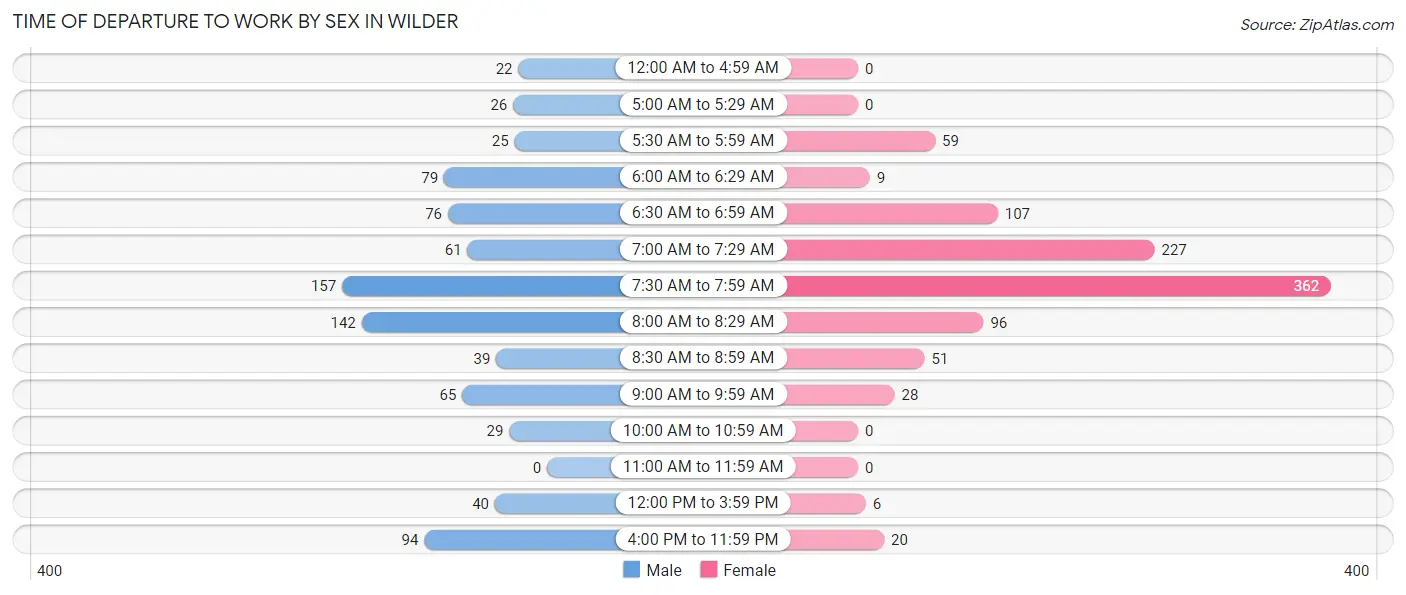
| Time of Departure | Male | Female |
| 12:00 AM to 4:59 AM | 22 (2.6%) | 0 (0.0%) |
| 5:00 AM to 5:29 AM | 26 (3.0%) | 0 (0.0%) |
| 5:30 AM to 5:59 AM | 25 (2.9%) | 59 (6.1%) |
| 6:00 AM to 6:29 AM | 79 (9.2%) | 9 (0.9%) |
| 6:30 AM to 6:59 AM | 76 (8.9%) | 107 (11.1%) |
| 7:00 AM to 7:29 AM | 61 (7.1%) | 227 (23.5%) |
| 7:30 AM to 7:59 AM | 157 (18.4%) | 362 (37.5%) |
| 8:00 AM to 8:29 AM | 142 (16.6%) | 96 (10.0%) |
| 8:30 AM to 8:59 AM | 39 (4.6%) | 51 (5.3%) |
| 9:00 AM to 9:59 AM | 65 (7.6%) | 28 (2.9%) |
| 10:00 AM to 10:59 AM | 29 (3.4%) | 0 (0.0%) |
| 11:00 AM to 11:59 AM | 0 (0.0%) | 0 (0.0%) |
| 12:00 PM to 3:59 PM | 40 (4.7%) | 6 (0.6%) |
| 4:00 PM to 11:59 PM | 94 (11.0%) | 20 (2.1%) |
| Total | 855 (100.0%) | 965 (100.0%) |
Housing Occupancy in Wilder
Occupancy by Ownership in Wilder
Of the total 1,649 dwellings in Wilder, owner-occupied units account for 1,216 (73.7%), while renter-occupied units make up 433 (26.3%).
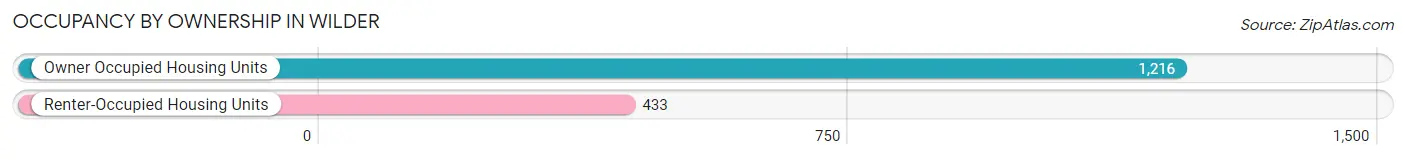
| Occupancy | # Housing Units | % Housing Units |
| Owner Occupied Housing Units | 1,216 | 73.7% |
| Renter-Occupied Housing Units | 433 | 26.3% |
| Total Occupied Housing Units | 1,649 | 100.0% |
Occupancy by Household Size in Wilder
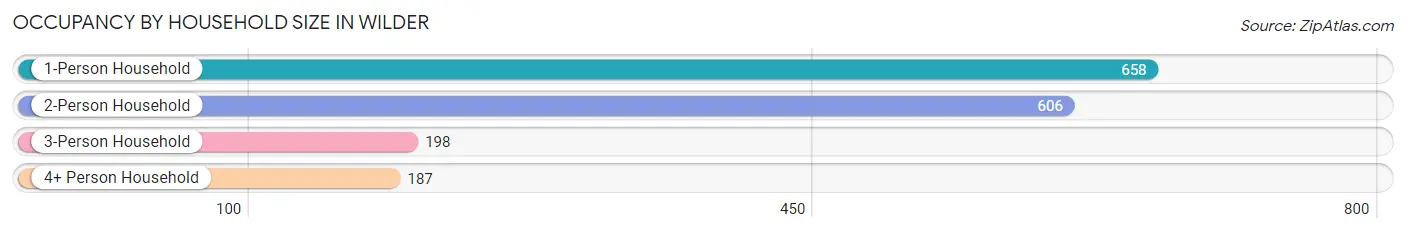
| Household Size | # Housing Units | % Housing Units |
| 1-Person Household | 658 | 39.9% |
| 2-Person Household | 606 | 36.7% |
| 3-Person Household | 198 | 12.0% |
| 4+ Person Household | 187 | 11.3% |
| Total Housing Units | 1,649 | 100.0% |
Occupancy by Ownership by Household Size in Wilder
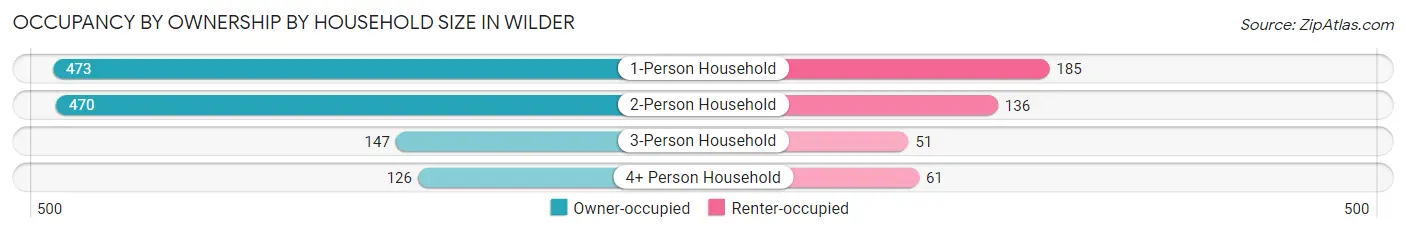
| Household Size | Owner-occupied | Renter-occupied |
| 1-Person Household | 473 (71.9%) | 185 (28.1%) |
| 2-Person Household | 470 (77.6%) | 136 (22.4%) |
| 3-Person Household | 147 (74.2%) | 51 (25.8%) |
| 4+ Person Household | 126 (67.4%) | 61 (32.6%) |
| Total Housing Units | 1,216 (73.7%) | 433 (26.3%) |
Occupancy by Educational Attainment in Wilder
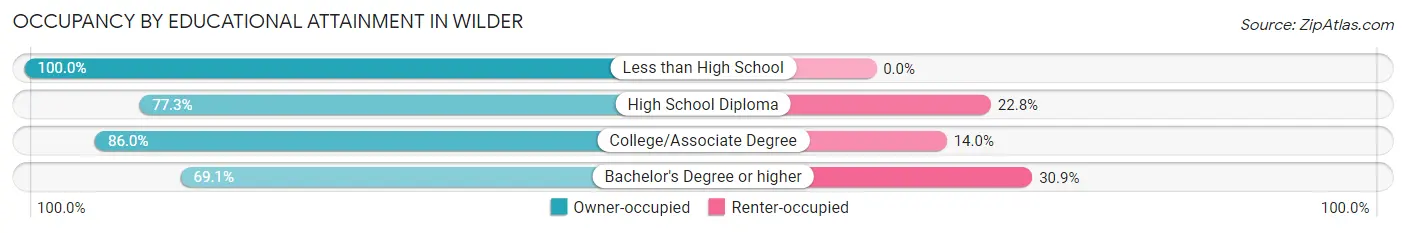
| Household Size | Owner-occupied | Renter-occupied |
| Less than High School | 28 (100.0%) | 0 (0.0%) |
| High School Diploma | 258 (77.2%) | 76 (22.8%) |
| College/Associate Degree | 209 (86.0%) | 34 (14.0%) |
| Bachelor's Degree or higher | 721 (69.1%) | 323 (30.9%) |
Occupancy by Age of Householder in Wilder
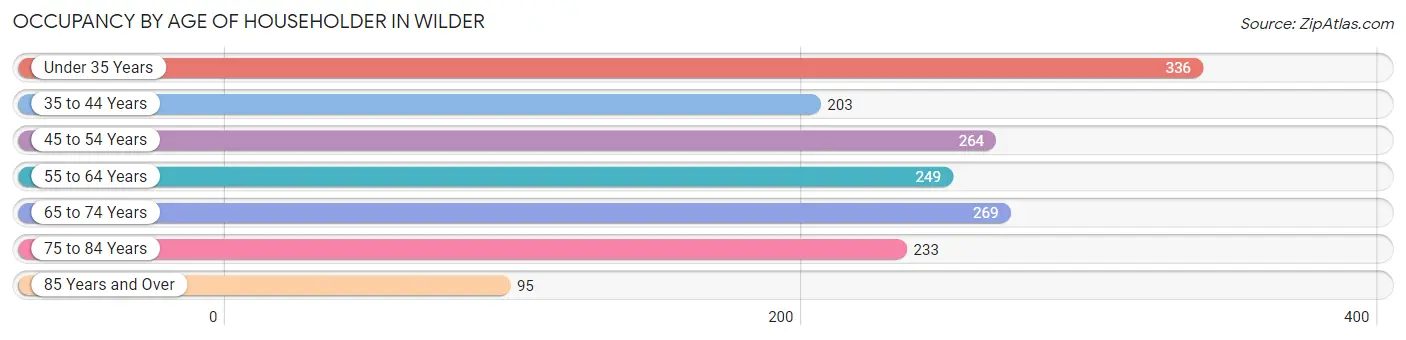
| Age Bracket | # Households | % Households |
| Under 35 Years | 336 | 20.4% |
| 35 to 44 Years | 203 | 12.3% |
| 45 to 54 Years | 264 | 16.0% |
| 55 to 64 Years | 249 | 15.1% |
| 65 to 74 Years | 269 | 16.3% |
| 75 to 84 Years | 233 | 14.1% |
| 85 Years and Over | 95 | 5.8% |
| Total | 1,649 | 100.0% |
Housing Finances in Wilder
Median Income by Occupancy in Wilder
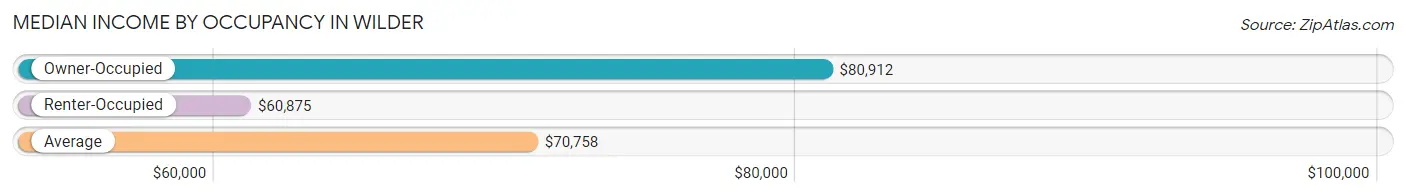
| Occupancy Type | # Households | Median Income |
| Owner-Occupied | 1,216 (73.7%) | $80,912 |
| Renter-Occupied | 433 (26.3%) | $60,875 |
| Average | 1,649 (100.0%) | $70,758 |
Occupancy by Householder Income Bracket in Wilder
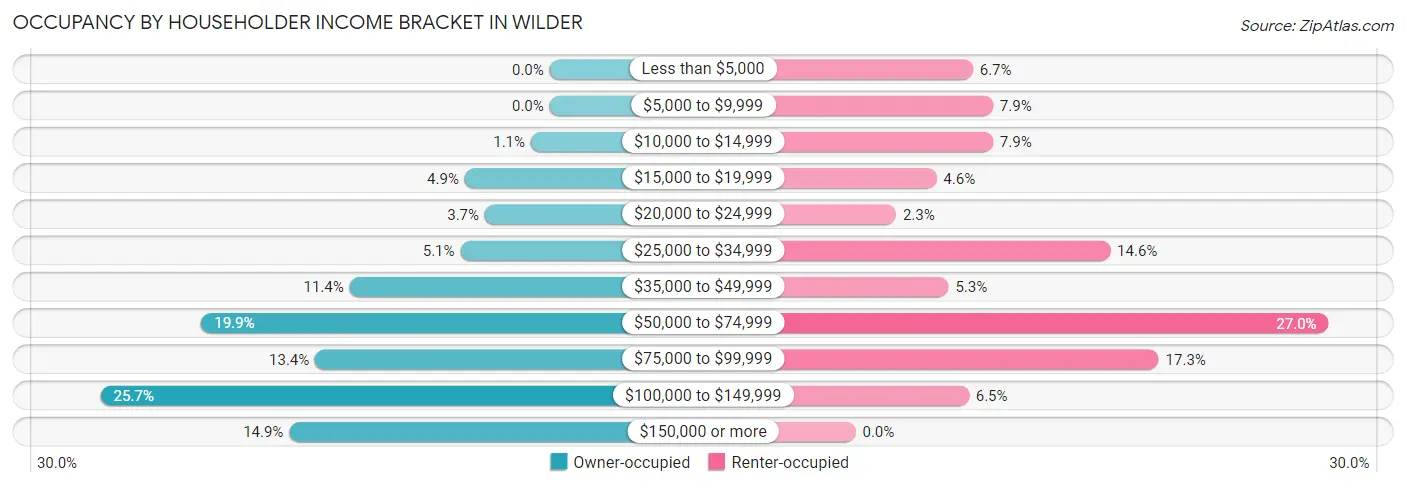
| Income Bracket | Owner-occupied | Renter-occupied |
| Less than $5,000 | 0 (0.0%) | 29 (6.7%) |
| $5,000 to $9,999 | 0 (0.0%) | 34 (7.9%) |
| $10,000 to $14,999 | 13 (1.1%) | 34 (7.9%) |
| $15,000 to $19,999 | 59 (4.9%) | 20 (4.6%) |
| $20,000 to $24,999 | 45 (3.7%) | 10 (2.3%) |
| $25,000 to $34,999 | 62 (5.1%) | 63 (14.5%) |
| $35,000 to $49,999 | 139 (11.4%) | 23 (5.3%) |
| $50,000 to $74,999 | 242 (19.9%) | 117 (27.0%) |
| $75,000 to $99,999 | 163 (13.4%) | 75 (17.3%) |
| $100,000 to $149,999 | 312 (25.7%) | 28 (6.5%) |
| $150,000 or more | 181 (14.9%) | 0 (0.0%) |
| Total | 1,216 (100.0%) | 433 (100.0%) |
Monthly Housing Cost Tiers in Wilder
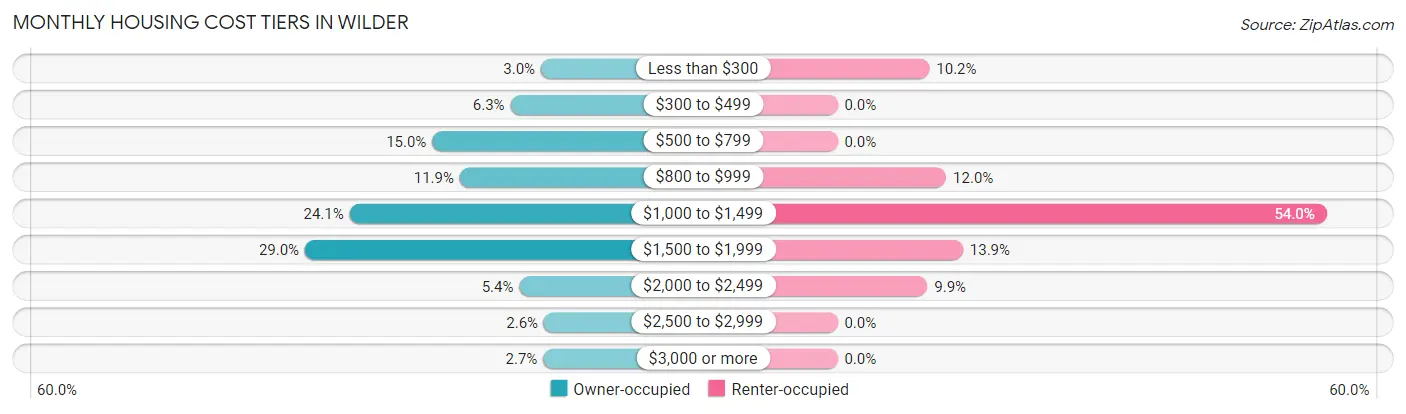
| Monthly Cost | Owner-occupied | Renter-occupied |
| Less than $300 | 36 (3.0%) | 44 (10.2%) |
| $300 to $499 | 77 (6.3%) | 0 (0.0%) |
| $500 to $799 | 182 (15.0%) | 0 (0.0%) |
| $800 to $999 | 145 (11.9%) | 52 (12.0%) |
| $1,000 to $1,499 | 293 (24.1%) | 234 (54.0%) |
| $1,500 to $1,999 | 353 (29.0%) | 60 (13.9%) |
| $2,000 to $2,499 | 65 (5.3%) | 43 (9.9%) |
| $2,500 to $2,999 | 32 (2.6%) | 0 (0.0%) |
| $3,000 or more | 33 (2.7%) | 0 (0.0%) |
| Total | 1,216 (100.0%) | 433 (100.0%) |
Physical Housing Characteristics in Wilder
Housing Structures in Wilder
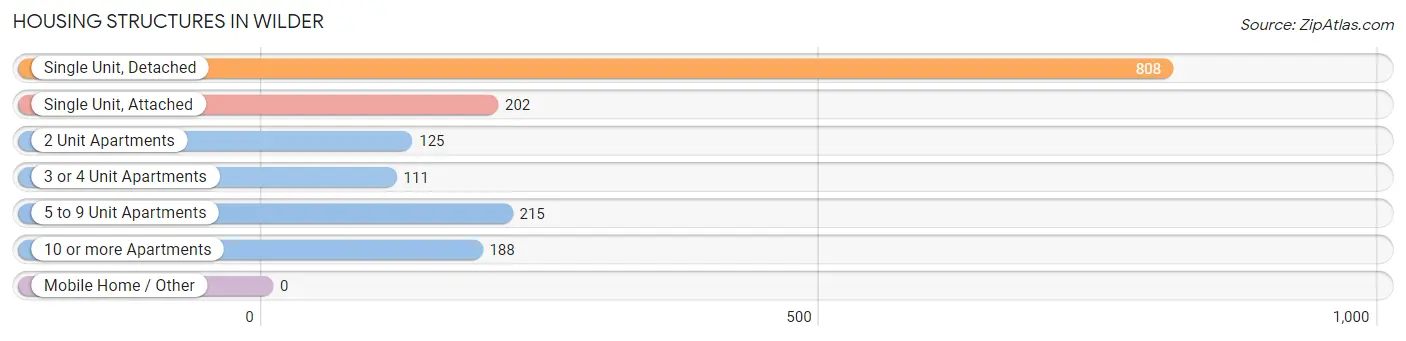
| Structure Type | # Housing Units | % Housing Units |
| Single Unit, Detached | 808 | 49.0% |
| Single Unit, Attached | 202 | 12.2% |
| 2 Unit Apartments | 125 | 7.6% |
| 3 or 4 Unit Apartments | 111 | 6.7% |
| 5 to 9 Unit Apartments | 215 | 13.0% |
| 10 or more Apartments | 188 | 11.4% |
| Mobile Home / Other | 0 | 0.0% |
| Total | 1,649 | 100.0% |
Housing Structures by Occupancy in Wilder
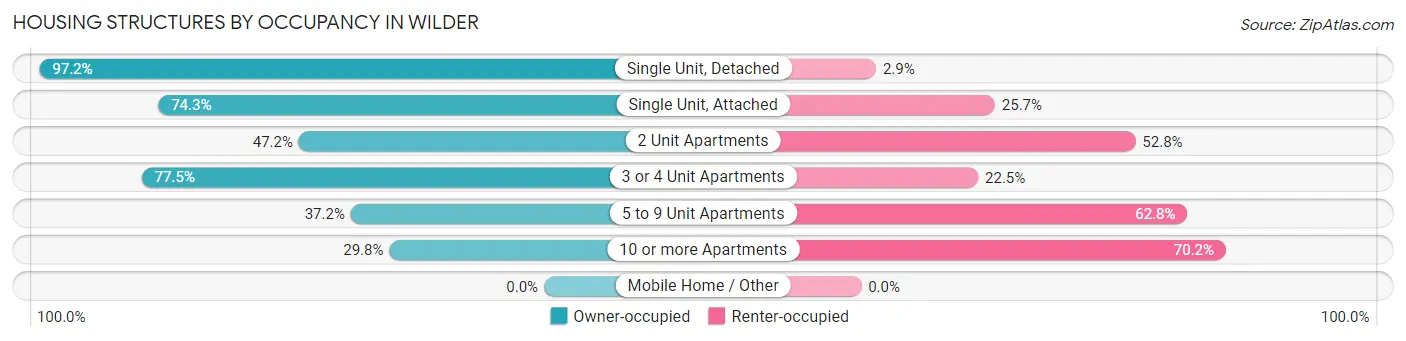
| Structure Type | Owner-occupied | Renter-occupied |
| Single Unit, Detached | 785 (97.2%) | 23 (2.9%) |
| Single Unit, Attached | 150 (74.3%) | 52 (25.7%) |
| 2 Unit Apartments | 59 (47.2%) | 66 (52.8%) |
| 3 or 4 Unit Apartments | 86 (77.5%) | 25 (22.5%) |
| 5 to 9 Unit Apartments | 80 (37.2%) | 135 (62.8%) |
| 10 or more Apartments | 56 (29.8%) | 132 (70.2%) |
| Mobile Home / Other | 0 (0.0%) | 0 (0.0%) |
| Total | 1,216 (73.7%) | 433 (26.3%) |
Housing Structures by Number of Rooms in Wilder
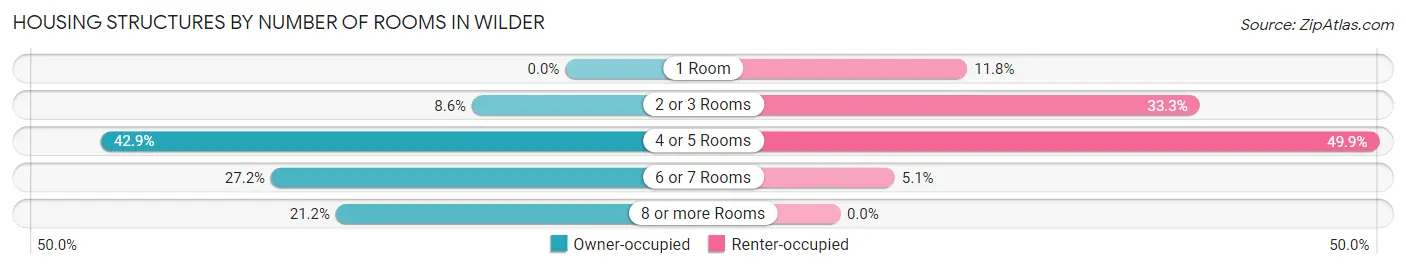
| Number of Rooms | Owner-occupied | Renter-occupied |
| 1 Room | 0 (0.0%) | 51 (11.8%) |
| 2 or 3 Rooms | 105 (8.6%) | 144 (33.3%) |
| 4 or 5 Rooms | 522 (42.9%) | 216 (49.9%) |
| 6 or 7 Rooms | 331 (27.2%) | 22 (5.1%) |
| 8 or more Rooms | 258 (21.2%) | 0 (0.0%) |
| Total | 1,216 (100.0%) | 433 (100.0%) |
Housing Structure by Heating Type in Wilder
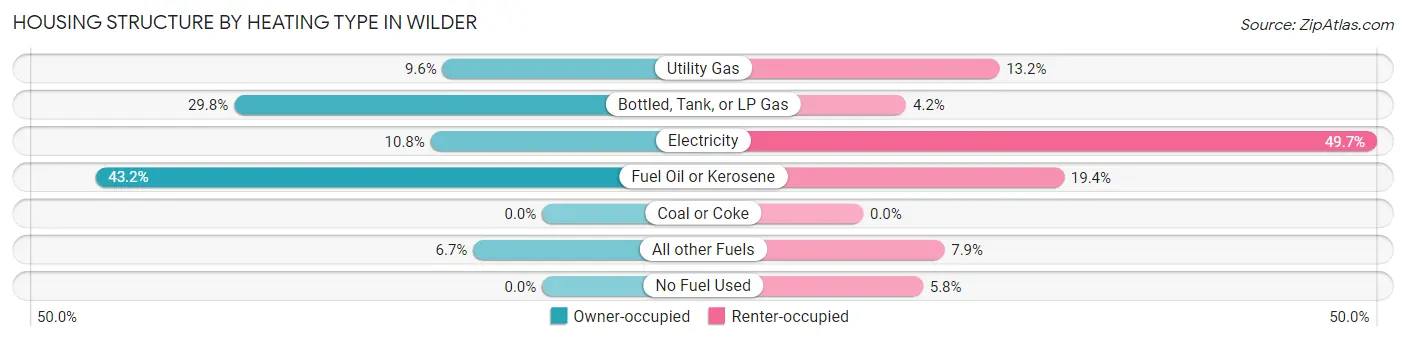
| Heating Type | Owner-occupied | Renter-occupied |
| Utility Gas | 117 (9.6%) | 57 (13.2%) |
| Bottled, Tank, or LP Gas | 362 (29.8%) | 18 (4.2%) |
| Electricity | 131 (10.8%) | 215 (49.6%) |
| Fuel Oil or Kerosene | 525 (43.2%) | 84 (19.4%) |
| Coal or Coke | 0 (0.0%) | 0 (0.0%) |
| All other Fuels | 81 (6.7%) | 34 (7.9%) |
| No Fuel Used | 0 (0.0%) | 25 (5.8%) |
| Total | 1,216 (100.0%) | 433 (100.0%) |
Household Vehicle Usage in Wilder
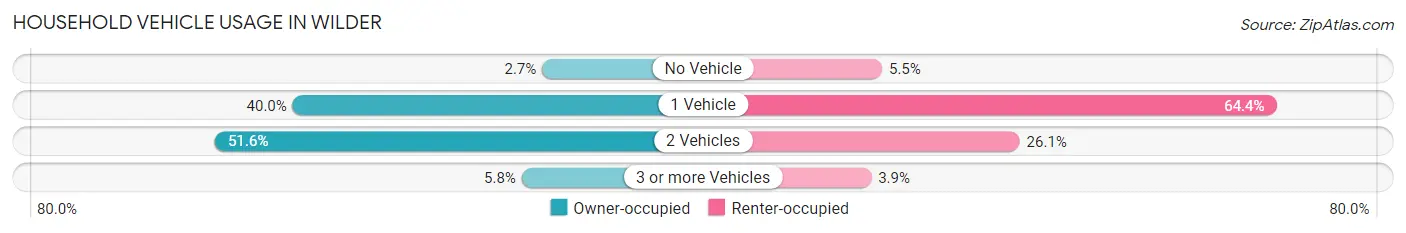
| Vehicles per Household | Owner-occupied | Renter-occupied |
| No Vehicle | 33 (2.7%) | 24 (5.5%) |
| 1 Vehicle | 486 (40.0%) | 279 (64.4%) |
| 2 Vehicles | 627 (51.6%) | 113 (26.1%) |
| 3 or more Vehicles | 70 (5.8%) | 17 (3.9%) |
| Total | 1,216 (100.0%) | 433 (100.0%) |
Real Estate & Mortgages in Wilder
Real Estate and Mortgage Overview in Wilder
| Characteristic | Without Mortgage | With Mortgage |
| Housing Units | 534 | 682 |
| Median Property Value | $225,200 | $260,900 |
| Median Household Income | $58,804 | $150 |
| Monthly Housing Costs | $810 | $33 |
| Real Estate Taxes | $4,723 | $0 |
Property Value by Mortgage Status in Wilder
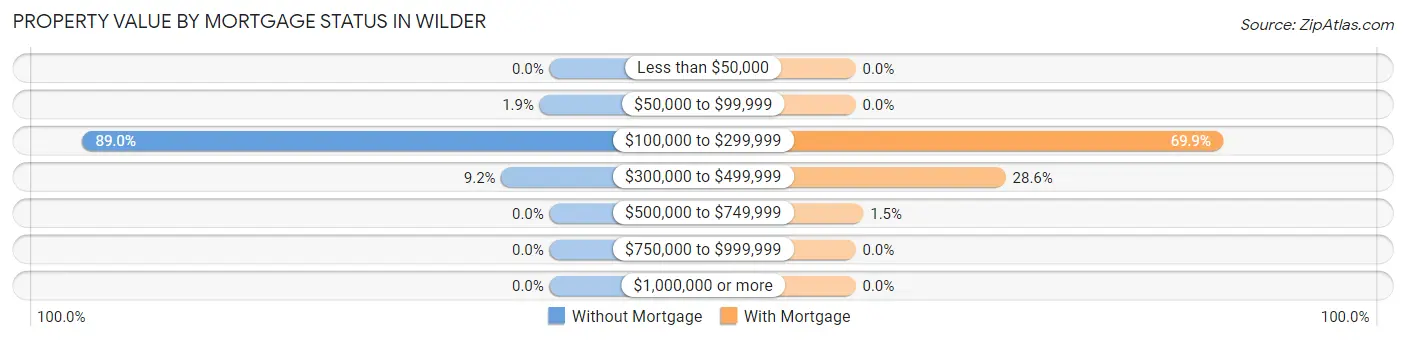
| Property Value | Without Mortgage | With Mortgage |
| Less than $50,000 | 0 (0.0%) | 0 (0.0%) |
| $50,000 to $99,999 | 10 (1.9%) | 0 (0.0%) |
| $100,000 to $299,999 | 475 (88.9%) | 477 (69.9%) |
| $300,000 to $499,999 | 49 (9.2%) | 195 (28.6%) |
| $500,000 to $749,999 | 0 (0.0%) | 10 (1.5%) |
| $750,000 to $999,999 | 0 (0.0%) | 0 (0.0%) |
| $1,000,000 or more | 0 (0.0%) | 0 (0.0%) |
| Total | 534 (100.0%) | 682 (100.0%) |
Household Income by Mortgage Status in Wilder
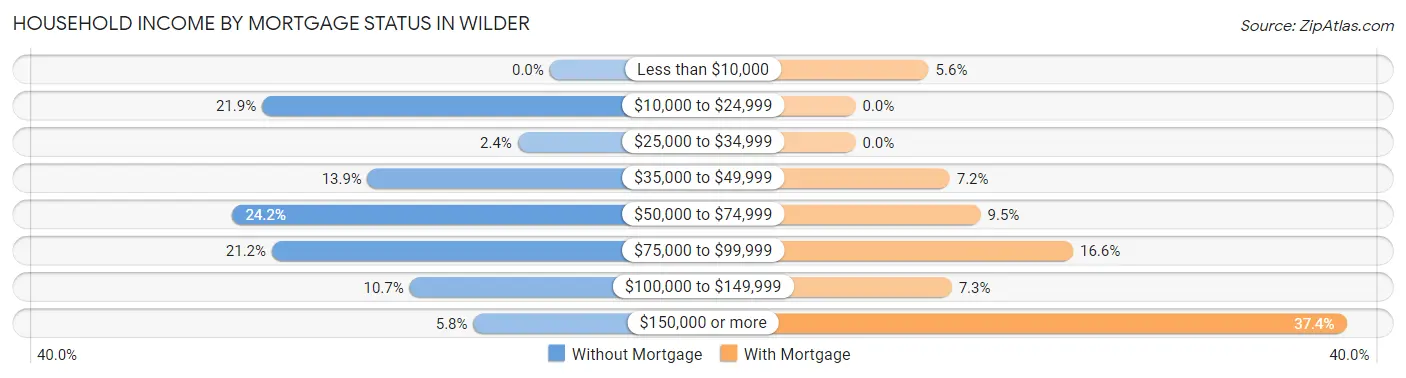
| Household Income | Without Mortgage | With Mortgage |
| Less than $10,000 | 0 (0.0%) | 38 (5.6%) |
| $10,000 to $24,999 | 117 (21.9%) | 0 (0.0%) |
| $25,000 to $34,999 | 13 (2.4%) | 0 (0.0%) |
| $35,000 to $49,999 | 74 (13.9%) | 49 (7.2%) |
| $50,000 to $74,999 | 129 (24.2%) | 65 (9.5%) |
| $75,000 to $99,999 | 113 (21.2%) | 113 (16.6%) |
| $100,000 to $149,999 | 57 (10.7%) | 50 (7.3%) |
| $150,000 or more | 31 (5.8%) | 255 (37.4%) |
| Total | 534 (100.0%) | 682 (100.0%) |
Property Value to Household Income Ratio in Wilder
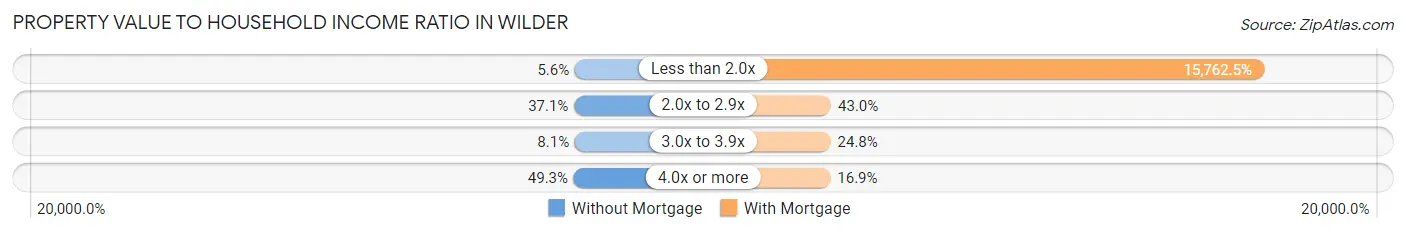
| Value-to-Income Ratio | Without Mortgage | With Mortgage |
| Less than 2.0x | 30 (5.6%) | 107,500 (15,762.5%) |
| 2.0x to 2.9x | 198 (37.1%) | 293 (43.0%) |
| 3.0x to 3.9x | 43 (8.1%) | 169 (24.8%) |
| 4.0x or more | 263 (49.2%) | 115 (16.9%) |
| Total | 534 (100.0%) | 682 (100.0%) |
Real Estate Taxes by Mortgage Status in Wilder
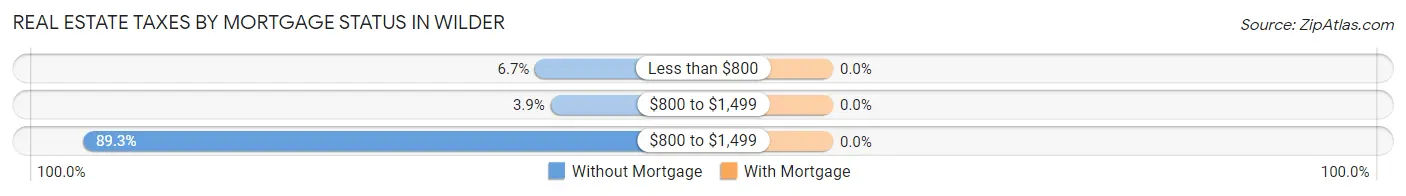
| Property Taxes | Without Mortgage | With Mortgage |
| Less than $800 | 36 (6.7%) | 0 (0.0%) |
| $800 to $1,499 | 21 (3.9%) | 0 (0.0%) |
| $800 to $1,499 | 477 (89.3%) | 0 (0.0%) |
| Total | 534 (100.0%) | 682 (100.0%) |
Health & Disability in Wilder
Health Insurance Coverage by Age in Wilder
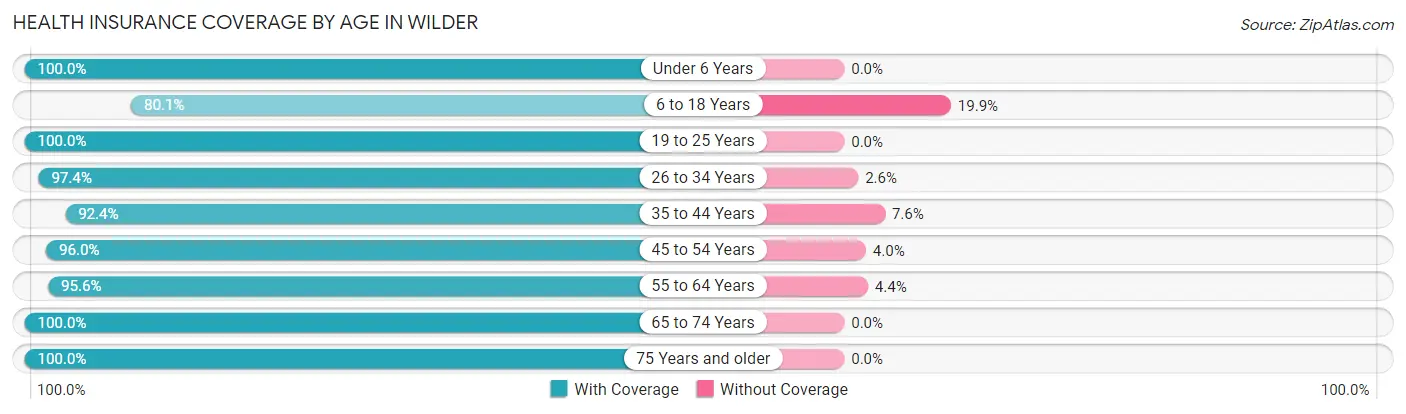
| Age Bracket | With Coverage | Without Coverage |
| Under 6 Years | 329 (100.0%) | 0 (0.0%) |
| 6 to 18 Years | 258 (80.1%) | 64 (19.9%) |
| 19 to 25 Years | 286 (100.0%) | 0 (0.0%) |
| 26 to 34 Years | 600 (97.4%) | 16 (2.6%) |
| 35 to 44 Years | 366 (92.4%) | 30 (7.6%) |
| 45 to 54 Years | 405 (96.0%) | 17 (4.0%) |
| 55 to 64 Years | 391 (95.6%) | 18 (4.4%) |
| 65 to 74 Years | 414 (100.0%) | 0 (0.0%) |
| 75 Years and older | 364 (100.0%) | 0 (0.0%) |
| Total | 3,413 (95.9%) | 145 (4.1%) |
Health Insurance Coverage by Citizenship Status in Wilder
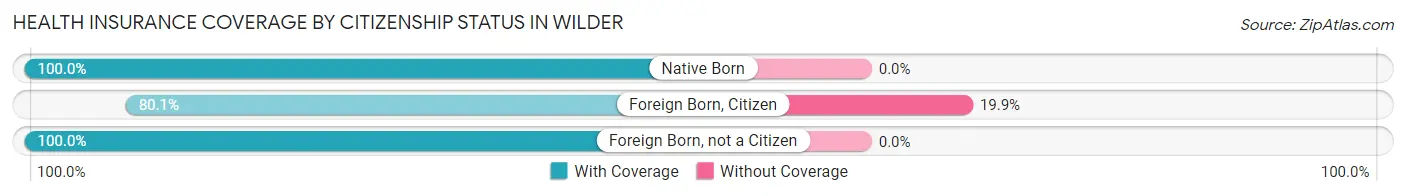
| Citizenship Status | With Coverage | Without Coverage |
| Native Born | 329 (100.0%) | 0 (0.0%) |
| Foreign Born, Citizen | 258 (80.1%) | 64 (19.9%) |
| Foreign Born, not a Citizen | 286 (100.0%) | 0 (0.0%) |
Health Insurance Coverage by Household Income in Wilder
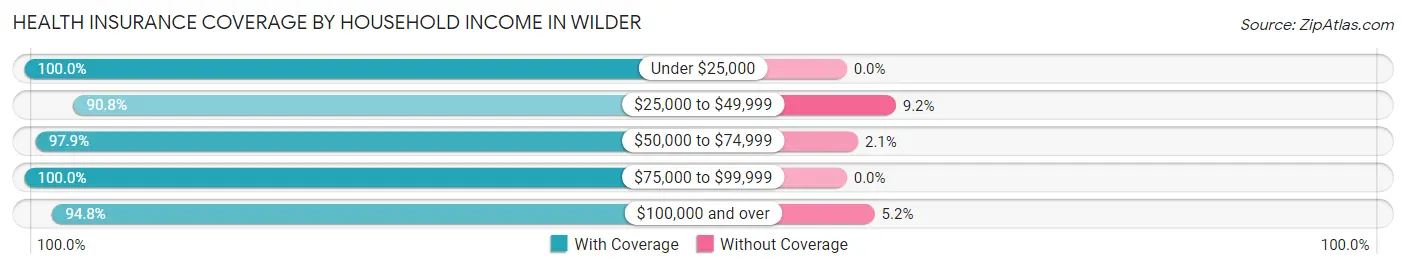
| Household Income | With Coverage | Without Coverage |
| Under $25,000 | 277 (100.0%) | 0 (0.0%) |
| $25,000 to $49,999 | 475 (90.8%) | 48 (9.2%) |
| $50,000 to $74,999 | 743 (97.9%) | 16 (2.1%) |
| $75,000 to $99,999 | 446 (100.0%) | 0 (0.0%) |
| $100,000 and over | 1,472 (94.8%) | 81 (5.2%) |
Public vs Private Health Insurance Coverage by Age in Wilder
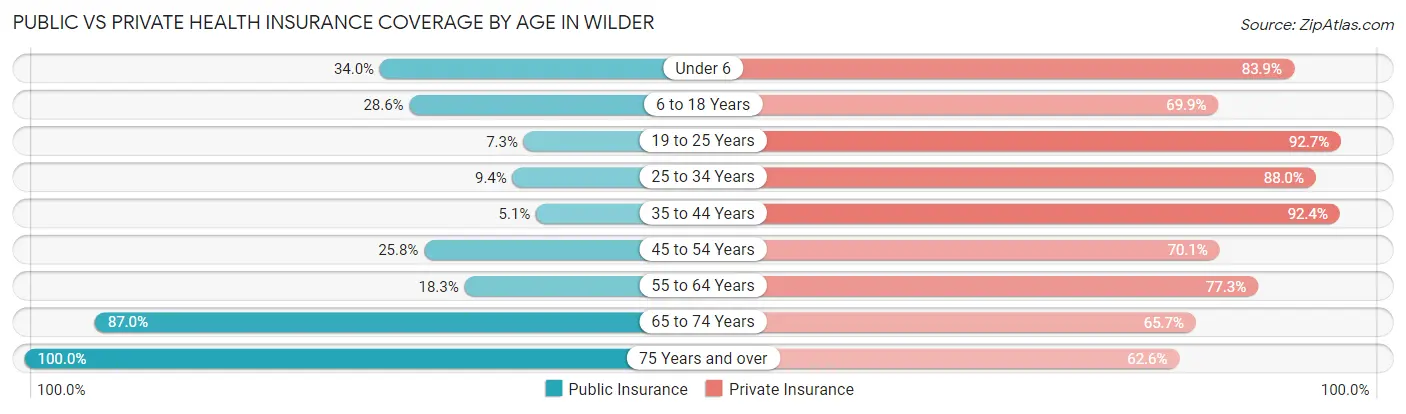
| Age Bracket | Public Insurance | Private Insurance |
| Under 6 | 112 (34.0%) | 276 (83.9%) |
| 6 to 18 Years | 92 (28.6%) | 225 (69.9%) |
| 19 to 25 Years | 21 (7.3%) | 265 (92.7%) |
| 25 to 34 Years | 58 (9.4%) | 542 (88.0%) |
| 35 to 44 Years | 20 (5.1%) | 366 (92.4%) |
| 45 to 54 Years | 109 (25.8%) | 296 (70.1%) |
| 55 to 64 Years | 75 (18.3%) | 316 (77.3%) |
| 65 to 74 Years | 360 (87.0%) | 272 (65.7%) |
| 75 Years and over | 364 (100.0%) | 228 (62.6%) |
| Total | 1,211 (34.0%) | 2,786 (78.3%) |
Disability Status by Sex by Age in Wilder
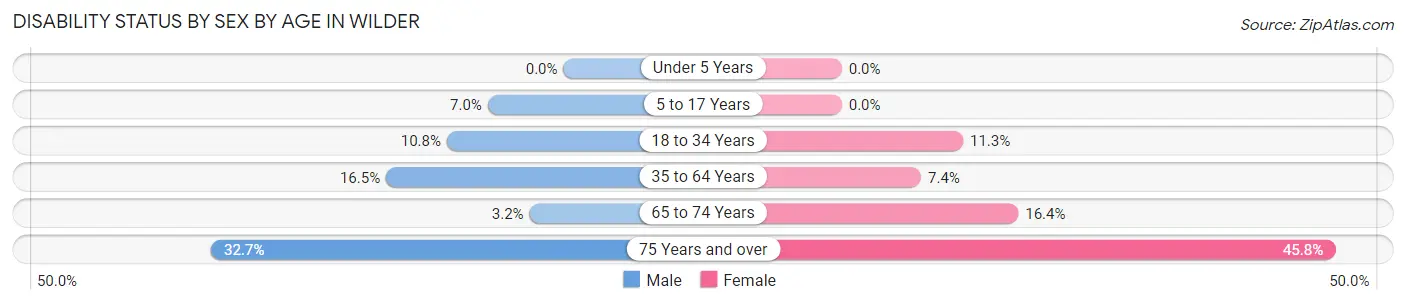
| Age Bracket | Male | Female |
| Under 5 Years | 0 (0.0%) | 0 (0.0%) |
| 5 to 17 Years | 17 (7.0%) | 0 (0.0%) |
| 18 to 34 Years | 53 (10.8%) | 53 (11.3%) |
| 35 to 64 Years | 79 (16.5%) | 55 (7.4%) |
| 65 to 74 Years | 4 (3.2%) | 47 (16.4%) |
| 75 Years and over | 34 (32.7%) | 119 (45.8%) |
Disability Class by Sex by Age in Wilder
Disability Class: Hearing Difficulty
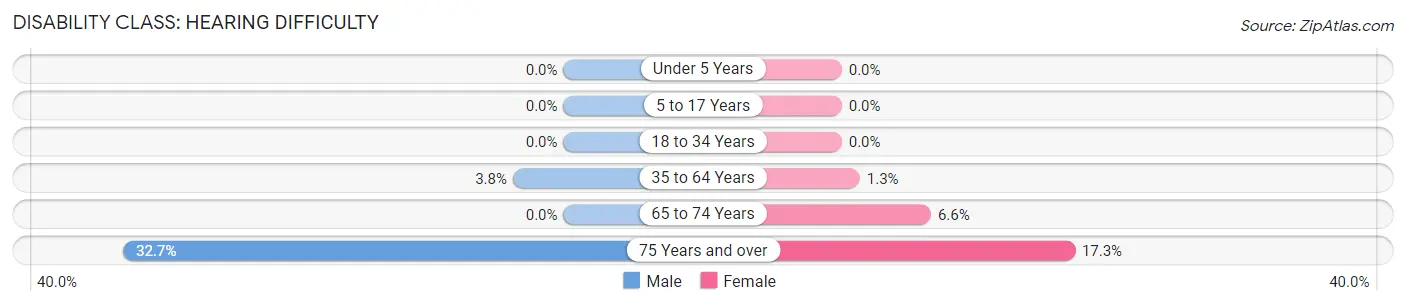
| Age Bracket | Male | Female |
| Under 5 Years | 0 (0.0%) | 0 (0.0%) |
| 5 to 17 Years | 0 (0.0%) | 0 (0.0%) |
| 18 to 34 Years | 0 (0.0%) | 0 (0.0%) |
| 35 to 64 Years | 18 (3.7%) | 10 (1.3%) |
| 65 to 74 Years | 0 (0.0%) | 19 (6.6%) |
| 75 Years and over | 34 (32.7%) | 45 (17.3%) |
Disability Class: Vision Difficulty
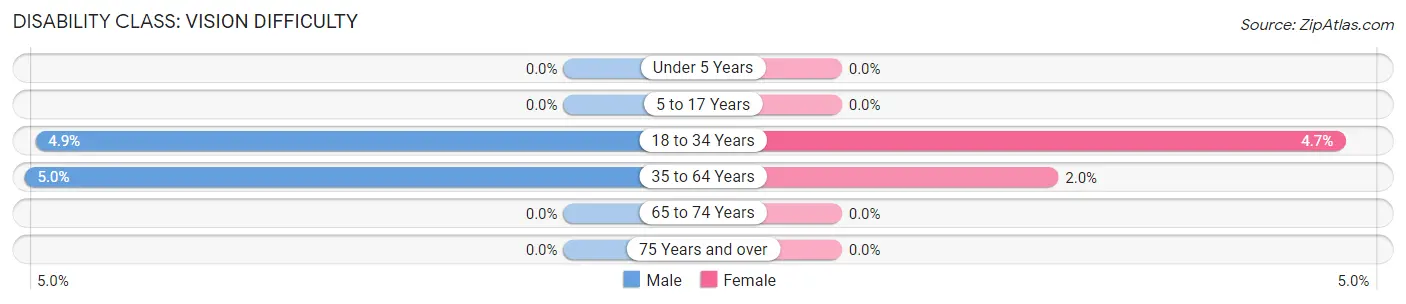
| Age Bracket | Male | Female |
| Under 5 Years | 0 (0.0%) | 0 (0.0%) |
| 5 to 17 Years | 0 (0.0%) | 0 (0.0%) |
| 18 to 34 Years | 24 (4.9%) | 22 (4.7%) |
| 35 to 64 Years | 24 (5.0%) | 15 (2.0%) |
| 65 to 74 Years | 0 (0.0%) | 0 (0.0%) |
| 75 Years and over | 0 (0.0%) | 0 (0.0%) |
Disability Class: Cognitive Difficulty
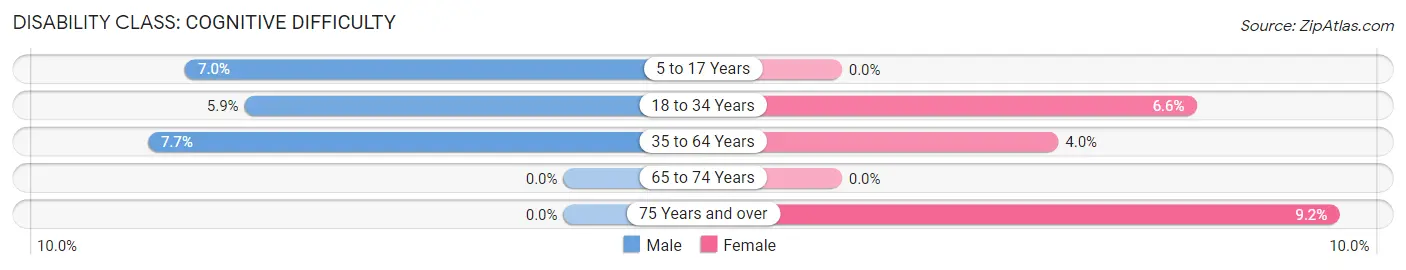
| Age Bracket | Male | Female |
| 5 to 17 Years | 17 (7.0%) | 0 (0.0%) |
| 18 to 34 Years | 29 (5.9%) | 31 (6.6%) |
| 35 to 64 Years | 37 (7.7%) | 30 (4.0%) |
| 65 to 74 Years | 0 (0.0%) | 0 (0.0%) |
| 75 Years and over | 0 (0.0%) | 24 (9.2%) |
Disability Class: Ambulatory Difficulty
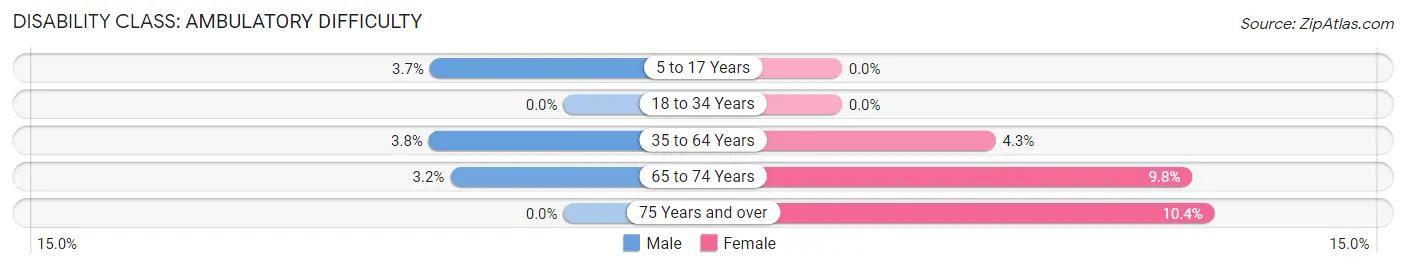
| Age Bracket | Male | Female |
| 5 to 17 Years | 9 (3.7%) | 0 (0.0%) |
| 18 to 34 Years | 0 (0.0%) | 0 (0.0%) |
| 35 to 64 Years | 18 (3.7%) | 32 (4.3%) |
| 65 to 74 Years | 4 (3.2%) | 28 (9.8%) |
| 75 Years and over | 0 (0.0%) | 27 (10.4%) |
Disability Class: Self-Care Difficulty
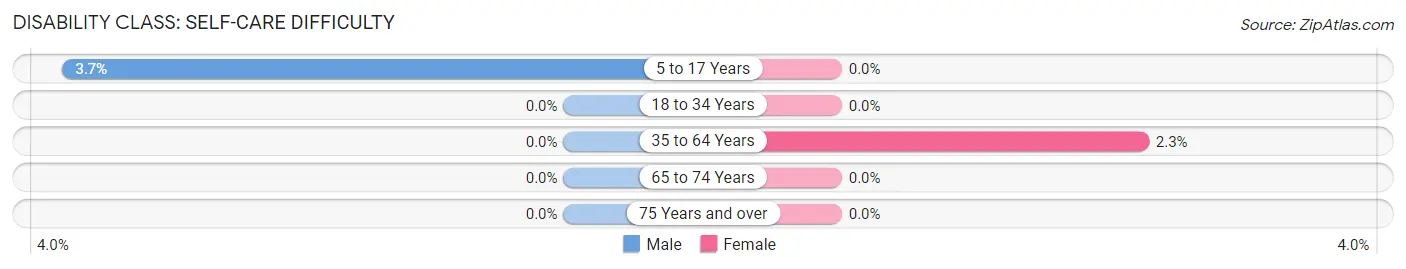
| Age Bracket | Male | Female |
| 5 to 17 Years | 9 (3.7%) | 0 (0.0%) |
| 18 to 34 Years | 0 (0.0%) | 0 (0.0%) |
| 35 to 64 Years | 0 (0.0%) | 17 (2.3%) |
| 65 to 74 Years | 0 (0.0%) | 0 (0.0%) |
| 75 Years and over | 0 (0.0%) | 0 (0.0%) |
Technology Access in Wilder
Computing Device Access in Wilder
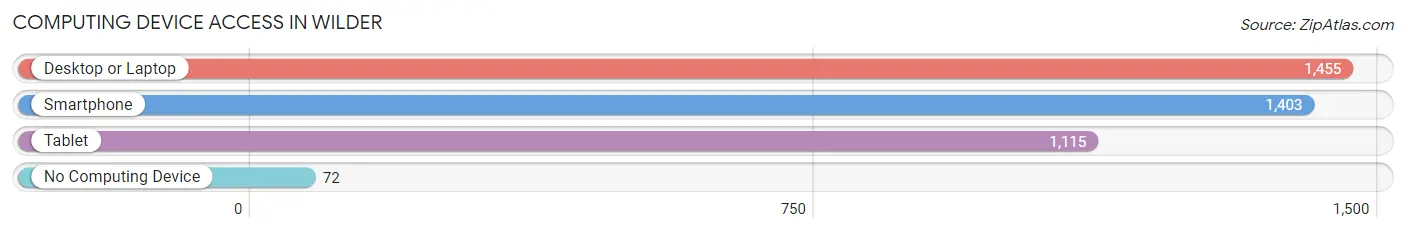
| Device Type | # Households | % Households |
| Desktop or Laptop | 1,455 | 88.2% |
| Smartphone | 1,403 | 85.1% |
| Tablet | 1,115 | 67.6% |
| No Computing Device | 72 | 4.4% |
| Total | 1,649 | 100.0% |
Internet Access in Wilder
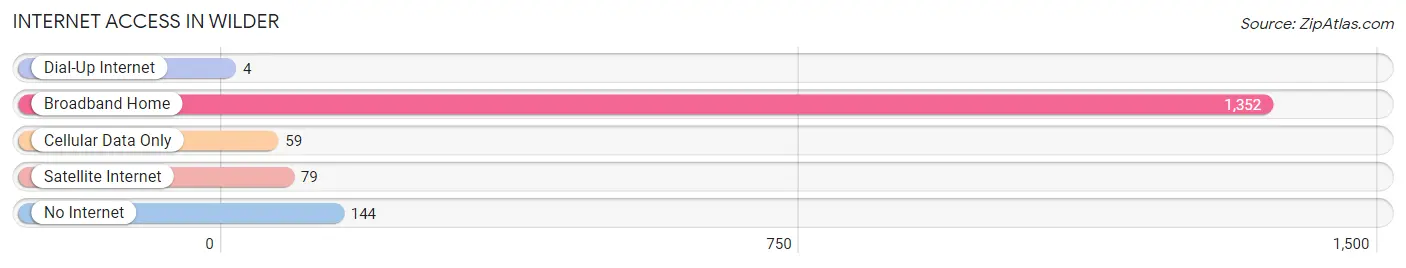
| Internet Type | # Households | % Households |
| Dial-Up Internet | 4 | 0.2% |
| Broadband Home | 1,352 | 82.0% |
| Cellular Data Only | 59 | 3.6% |
| Satellite Internet | 79 | 4.8% |
| No Internet | 144 | 8.7% |
| Total | 1,649 | 100.0% |
Wilder Summary
Wilder, Vermont is a small town located in the Connecticut River Valley in the state of Vermont. It is situated in the southeastern corner of the state, just north of the Massachusetts border. The town was first settled in 1780 and incorporated in 1781. The population of Wilder was 2,845 at the 2010 census.
Geography
Wilder is located in the Connecticut River Valley, which is a major agricultural region in Vermont. The town is situated on the east bank of the Connecticut River, which forms the border between Vermont and New Hampshire. The town is bordered by the towns of Hartford, Norwich, and Thetford. The terrain of Wilder is mostly flat, with some rolling hills in the northern part of town. The highest point in Wilder is located at the intersection of Route 5 and Route 12, at an elevation of 1,068 feet.
The climate in Wilder is typical of the New England region, with cold winters and warm summers. The average annual temperature is around 40 degrees Fahrenheit, with an average high of around 70 degrees in the summer and an average low of around 20 degrees in the winter. The town receives an average of 40 inches of precipitation per year, with most of it falling in the form of snow.
Economy
The economy of Wilder is largely based on agriculture and tourism. The town is home to several farms, which produce a variety of crops, including corn, hay, and apples. The town also has several small businesses, including a few restaurants, a grocery store, and a few retail stores.
Tourism is also an important part of the economy of Wilder. The town is home to several attractions, including the Wilder Historical Society Museum, the Wilder Nature Center, and the Wilder Dam. The town also hosts several annual events, such as the Wilder Days Festival and the Wilder Harvest Festival.
Demographics
As of the 2010 census, the population of Wilder was 2,845. The racial makeup of the town was 97.3% White, 0.7% African American, 0.3% Native American, 0.3% Asian, 0.1% Pacific Islander, 0.2% from other races, and 1.2% from two or more races. Hispanic or Latino of any race were 1.2% of the population.
The median income for a household in Wilder was $50,938, and the median income for a family was $60,938. The per capita income for the town was $25,938. About 5.3% of families and 8.2% of the population were below the poverty line, including 10.2% of those under age 18 and 5.3% of those age 65 or over.
Wilder is a small town with a rich history and a vibrant economy. The town is home to several farms, businesses, and attractions, and is a popular destination for tourists. The town has a diverse population and a strong sense of community, making it a great place to live and visit.
Common Questions
What is Per Capita Income in Wilder?
Per Capita income in Wilder is $40,938.
What is the Median Family Income in Wilder?
Median Family Income in Wilder is $100,677.
What is the Median Household income in Wilder?
Median Household Income in Wilder is $70,758.
What is Income or Wage Gap in Wilder?
Income or Wage Gap in Wilder is 19.0%.
Women in Wilder earn 81.0 cents for every dollar earned by a man.
What is Inequality or Gini Index in Wilder?
Inequality or Gini Index in Wilder is 0.39.
What is the Total Population of Wilder?
Total Population of Wilder is 3,634.
What is the Total Male Population of Wilder?
Total Male Population of Wilder is 1,637.
What is the Total Female Population of Wilder?
Total Female Population of Wilder is 1,997.
What is the Ratio of Males per 100 Females in Wilder?
There are 81.97 Males per 100 Females in Wilder.
What is the Ratio of Females per 100 Males in Wilder?
There are 121.99 Females per 100 Males in Wilder.
What is the Median Population Age in Wilder?
Median Population Age in Wilder is 40.8 Years.
What is the Average Family Size in Wilder
Average Family Size in Wilder is 2.9 People.
What is the Average Household Size in Wilder
Average Household Size in Wilder is 2.2 People.
How Large is the Labor Force in Wilder?
There are 2,132 People in the Labor Forcein in Wilder.
What is the Percentage of People in the Labor Force in Wilder?
69.8% of People are in the Labor Force in Wilder.
What is the Unemployment Rate in Wilder?
Unemployment Rate in Wilder is 5.8%.