South Yarmouth, MA Map & Demographics
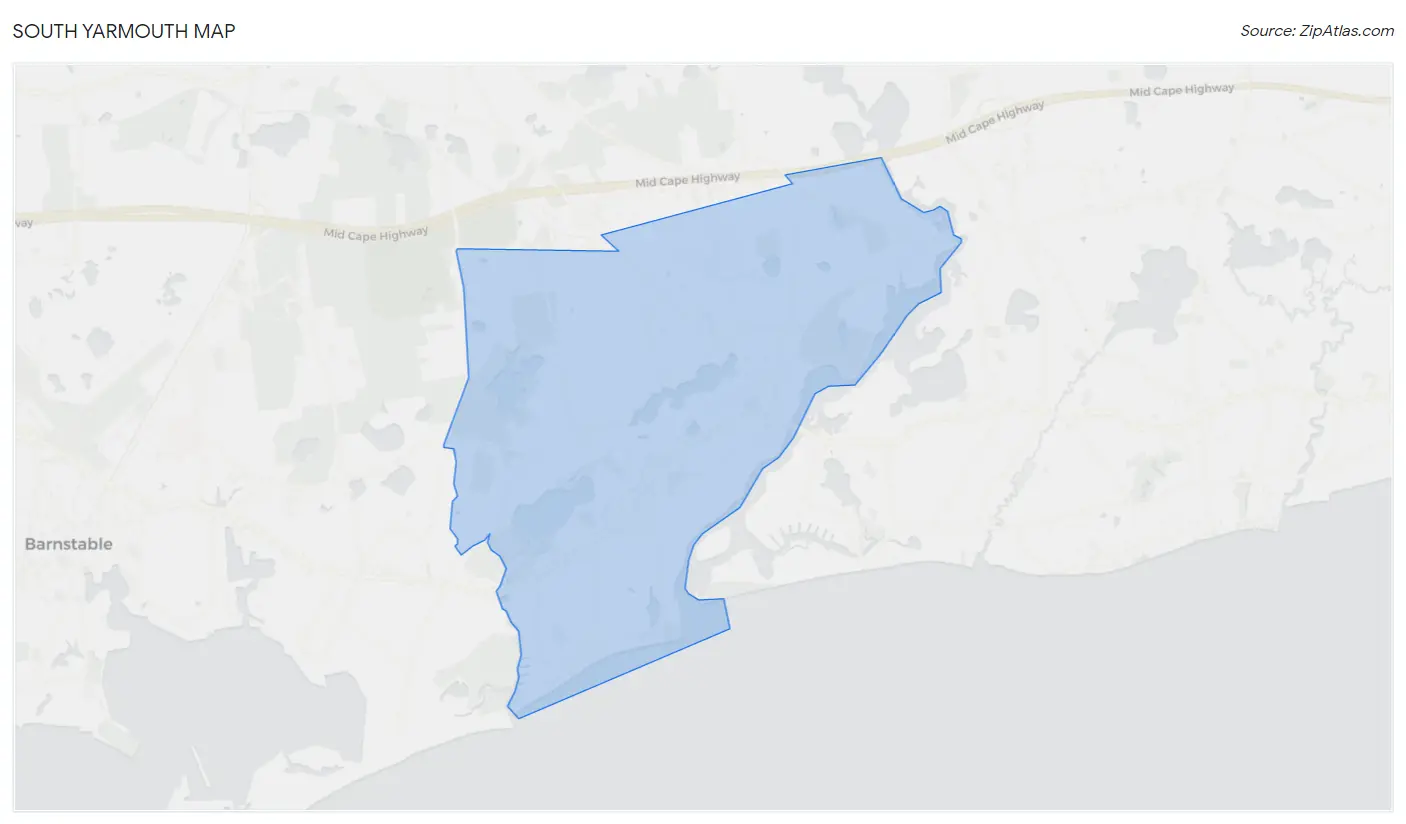
South Yarmouth Map
South Yarmouth Overview
$45,394
PER CAPITA INCOME
$91,603
AVG FAMILY INCOME
$77,723
AVG HOUSEHOLD INCOME
5.1%
WAGE / INCOME GAP [ % ]
94.9¢/ $1
WAGE / INCOME GAP [ $ ]
$10,482
FAMILY INCOME DEFICIT
0.43
INEQUALITY / GINI INDEX
11,805
TOTAL POPULATION
5,900
MALE POPULATION
5,905
FEMALE POPULATION
99.92
MALES / 100 FEMALES
100.08
FEMALES / 100 MALES
52.9
MEDIAN AGE
3.0
AVG FAMILY SIZE
2.3
AVG HOUSEHOLD SIZE
6,109
LABOR FORCE [ PEOPLE ]
58.1%
PERCENT IN LABOR FORCE
7.1%
UNEMPLOYMENT RATE
South Yarmouth Zip Codes
South Yarmouth Area Codes
Income in South Yarmouth
Income Overview in South Yarmouth
Per Capita Income in South Yarmouth is $45,394, while median incomes of families and households are $91,603 and $77,723 respectively.
| Characteristic | Number | Measure |
| Per Capita Income | 11,805 | $45,394 |
| Median Family Income | 3,046 | $91,603 |
| Mean Family Income | 3,046 | $122,040 |
| Median Household Income | 4,976 | $77,723 |
| Mean Household Income | 4,976 | $101,004 |
| Income Deficit | 3,046 | $10,482 |
| Wage / Income Gap (%) | 11,805 | 5.08% |
| Wage / Income Gap ($) | 11,805 | 94.92¢ per $1 |
| Gini / Inequality Index | 11,805 | 0.43 |
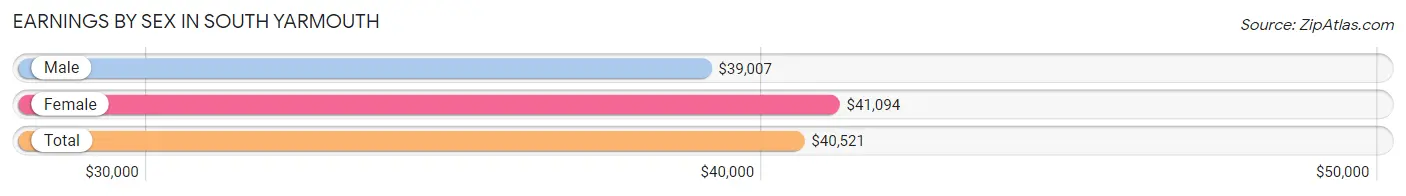
Earnings by Sex in South Yarmouth
Average Earnings in South Yarmouth are $40,521, $39,007 for men and $41,094 for women, a difference of 5.1%.
| Sex | Number | Average Earnings |
| Male | 3,563 (56.2%) | $39,007 |
| Female | 2,774 (43.8%) | $41,094 |
| Total | 6,337 (100.0%) | $40,521 |
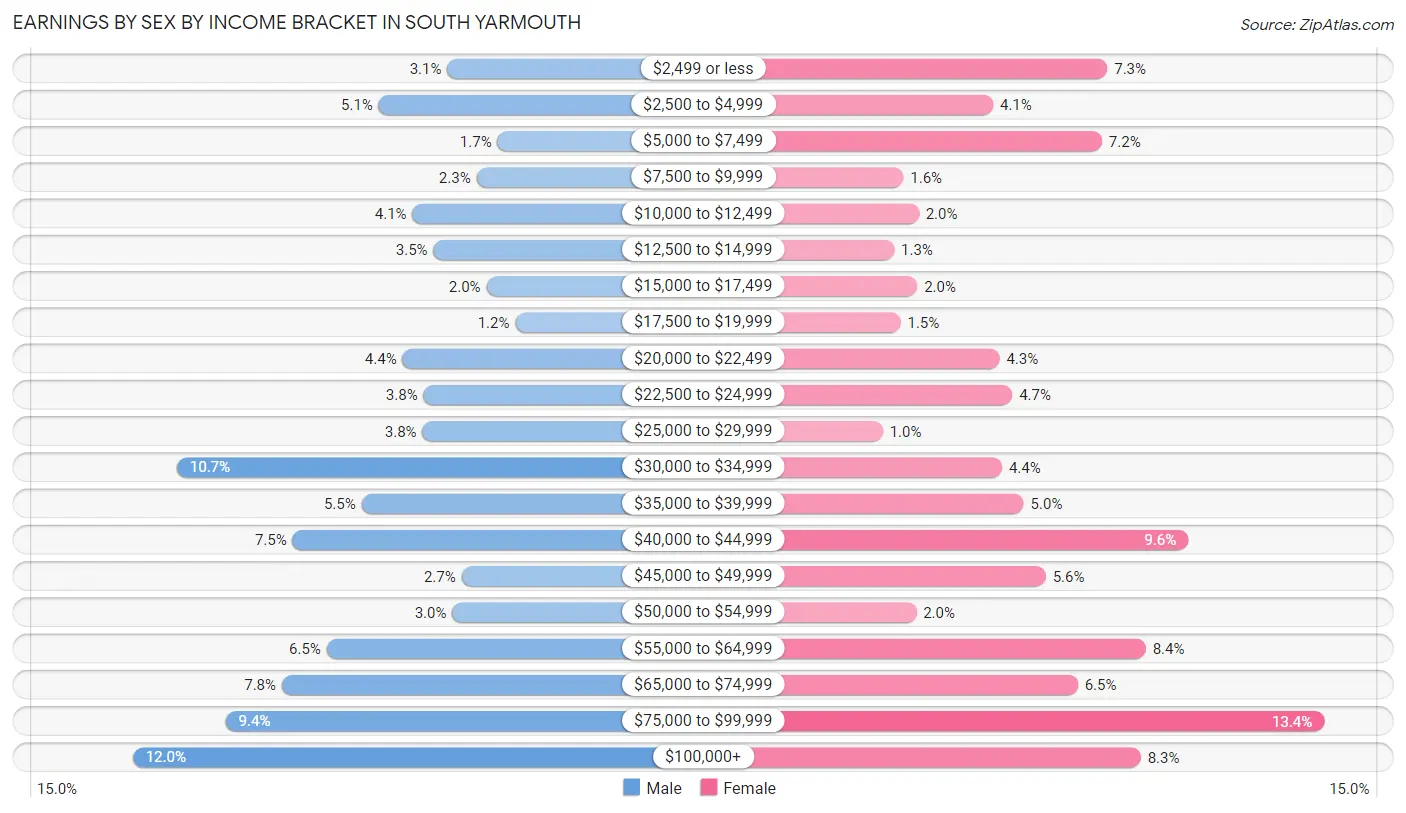
Earnings by Sex by Income Bracket in South Yarmouth
The most common earnings brackets in South Yarmouth are $100,000+ for men (426 | 12.0%) and $75,000 to $99,999 for women (372 | 13.4%).
| Income | Male | Female |
| $2,499 or less | 111 (3.1%) | 203 (7.3%) |
| $2,500 to $4,999 | 180 (5.1%) | 114 (4.1%) |
| $5,000 to $7,499 | 61 (1.7%) | 199 (7.2%) |
| $7,500 to $9,999 | 82 (2.3%) | 44 (1.6%) |
| $10,000 to $12,499 | 146 (4.1%) | 56 (2.0%) |
| $12,500 to $14,999 | 125 (3.5%) | 37 (1.3%) |
| $15,000 to $17,499 | 72 (2.0%) | 55 (2.0%) |
| $17,500 to $19,999 | 43 (1.2%) | 42 (1.5%) |
| $20,000 to $22,499 | 156 (4.4%) | 119 (4.3%) |
| $22,500 to $24,999 | 135 (3.8%) | 129 (4.6%) |
| $25,000 to $29,999 | 136 (3.8%) | 28 (1.0%) |
| $30,000 to $34,999 | 382 (10.7%) | 121 (4.4%) |
| $35,000 to $39,999 | 197 (5.5%) | 138 (5.0%) |
| $40,000 to $44,999 | 266 (7.5%) | 266 (9.6%) |
| $45,000 to $49,999 | 97 (2.7%) | 155 (5.6%) |
| $50,000 to $54,999 | 106 (3.0%) | 54 (1.9%) |
| $55,000 to $64,999 | 232 (6.5%) | 233 (8.4%) |
| $65,000 to $74,999 | 277 (7.8%) | 180 (6.5%) |
| $75,000 to $99,999 | 333 (9.3%) | 372 (13.4%) |
| $100,000+ | 426 (12.0%) | 229 (8.3%) |
| Total | 3,563 (100.0%) | 2,774 (100.0%) |
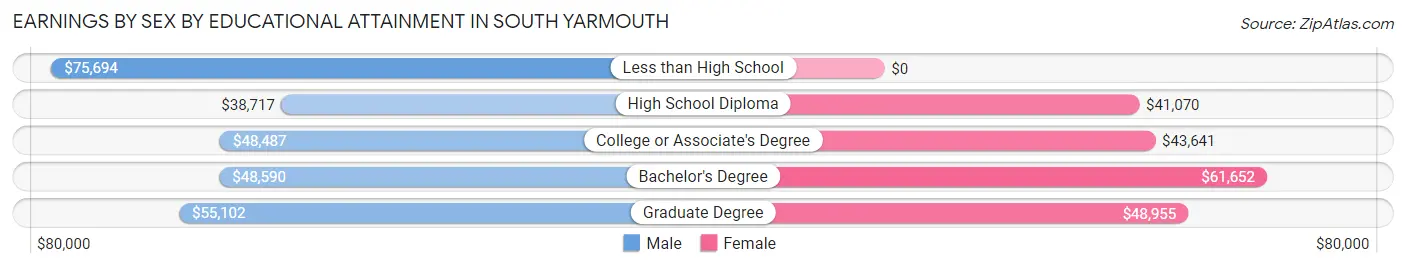
Earnings by Sex by Educational Attainment in South Yarmouth
Average earnings in South Yarmouth are $44,524 for men and $45,029 for women, a difference of 1.1%. Men with an educational attainment of less than high school enjoy the highest average annual earnings of $75,694, while those with high school diploma education earn the least with $38,717. Women with an educational attainment of bachelor's degree earn the most with the average annual earnings of $61,652, while those with high school diploma education have the smallest earnings of $41,070.
| Educational Attainment | Male Income | Female Income |
| Less than High School | $75,694 | $0 |
| High School Diploma | $38,717 | $41,070 |
| College or Associate's Degree | $48,487 | $43,641 |
| Bachelor's Degree | $48,590 | $61,652 |
| Graduate Degree | $55,102 | $48,955 |
| Total | $44,524 | $45,029 |
Family Income in South Yarmouth
Family Income Brackets in South Yarmouth
According to the South Yarmouth family income data, there are 728 families falling into the $75,000 to $99,999 income range, which is the most common income bracket and makes up 23.9% of all families. Conversely, the less than $10,000 income bracket is the least frequent group with only 30 families (1.0%) belonging to this category.
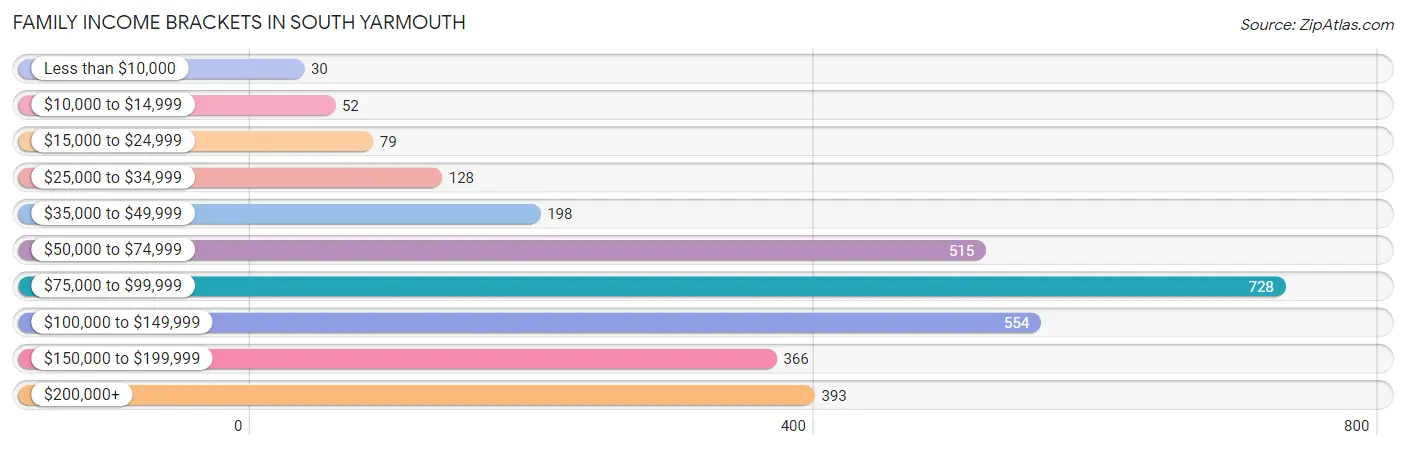
| Income Bracket | # Families | % Families |
| Less than $10,000 | 30 | 1.0% |
| $10,000 to $14,999 | 52 | 1.7% |
| $15,000 to $24,999 | 79 | 2.6% |
| $25,000 to $34,999 | 128 | 4.2% |
| $35,000 to $49,999 | 198 | 6.5% |
| $50,000 to $74,999 | 515 | 16.9% |
| $75,000 to $99,999 | 728 | 23.9% |
| $100,000 to $149,999 | 554 | 18.2% |
| $150,000 to $199,999 | 366 | 12.0% |
| $200,000+ | 393 | 12.9% |
Family Income by Famaliy Size in South Yarmouth
6-person families (16 | 0.5%) account for the highest median family income in South Yarmouth with $225,278 per family, while 2-person families (1,936 | 63.6%) have the highest median income of $45,112 per family member.
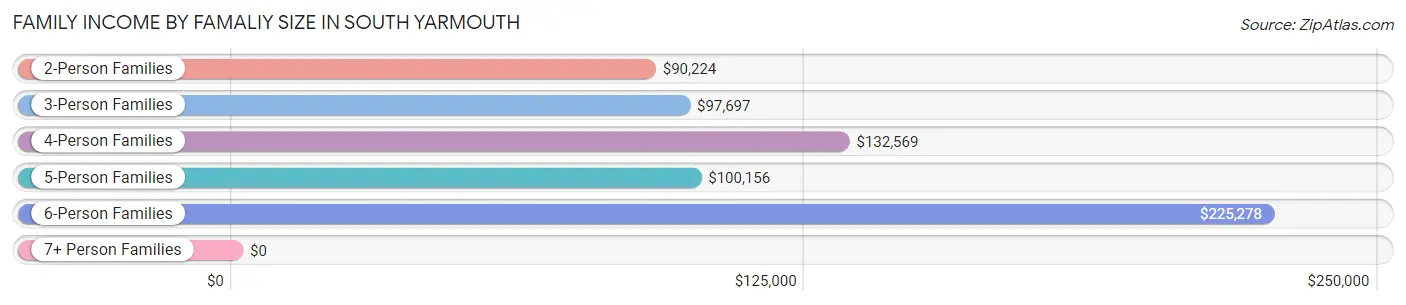
| Income Bracket | # Families | Median Income |
| 2-Person Families | 1,936 (63.6%) | $90,224 |
| 3-Person Families | 647 (21.2%) | $97,697 |
| 4-Person Families | 123 (4.0%) | $132,569 |
| 5-Person Families | 243 (8.0%) | $100,156 |
| 6-Person Families | 16 (0.5%) | $225,278 |
| 7+ Person Families | 81 (2.7%) | $0 |
| Total | 3,046 (100.0%) | $91,603 |
Family Income by Number of Earners in South Yarmouth
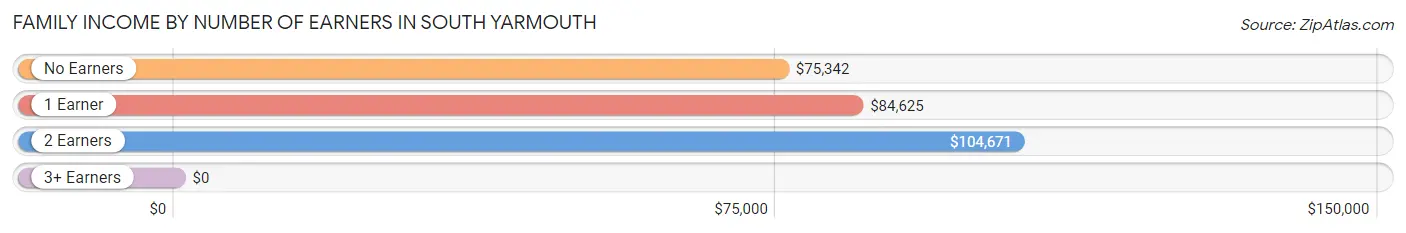
| Number of Earners | # Families | Median Income |
| No Earners | 706 (23.2%) | $75,342 |
| 1 Earner | 828 (27.2%) | $84,625 |
| 2 Earners | 1,195 (39.2%) | $104,671 |
| 3+ Earners | 317 (10.4%) | $0 |
| Total | 3,046 (100.0%) | $91,603 |
Household Income in South Yarmouth
Household Income Brackets in South Yarmouth
With 896 households falling in the category, the $50,000 to $74,999 income range is the most frequent in South Yarmouth, accounting for 18.0% of all households. In contrast, only 154 households (3.1%) fall into the $10,000 to $14,999 income bracket, making it the least populous group.
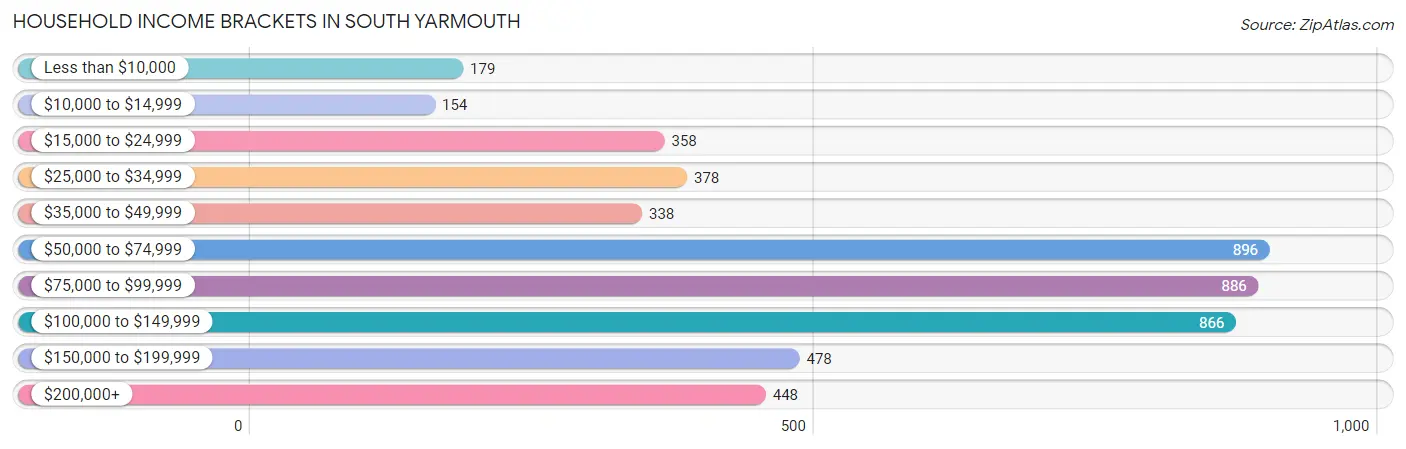
| Income Bracket | # Households | % Households |
| Less than $10,000 | 179 | 3.6% |
| $10,000 to $14,999 | 154 | 3.1% |
| $15,000 to $24,999 | 358 | 7.2% |
| $25,000 to $34,999 | 378 | 7.6% |
| $35,000 to $49,999 | 338 | 6.8% |
| $50,000 to $74,999 | 896 | 18.0% |
| $75,000 to $99,999 | 886 | 17.8% |
| $100,000 to $149,999 | 866 | 17.4% |
| $150,000 to $199,999 | 478 | 9.6% |
| $200,000+ | 448 | 9.0% |
Household Income by Householder Age in South Yarmouth
The median household income in South Yarmouth is $77,723, with the highest median household income of $97,708 found in the 25 to 44 years age bracket for the primary householder. A total of 741 households (14.9%) fall into this category. Meanwhile, the 15 to 24 years age bracket for the primary householder has the lowest median household income of $0, with 52 households (1.1%) in this group.
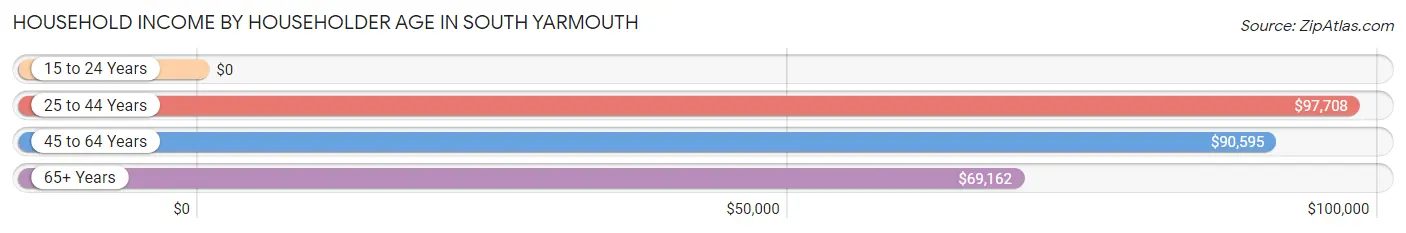
| Income Bracket | # Households | Median Income |
| 15 to 24 Years | 52 (1.1%) | $0 |
| 25 to 44 Years | 741 (14.9%) | $97,708 |
| 45 to 64 Years | 1,912 (38.4%) | $90,595 |
| 65+ Years | 2,271 (45.6%) | $69,162 |
| Total | 4,976 (100.0%) | $77,723 |
Poverty in South Yarmouth
Income Below Poverty by Sex and Age in South Yarmouth
With 5.6% poverty level for males and 10.2% for females among the residents of South Yarmouth, 6 to 11 year old males and 16 and 17 year old females are the most vulnerable to poverty, with 41 males (26.1%) and 60 females (35.5%) in their respective age groups living below the poverty level.
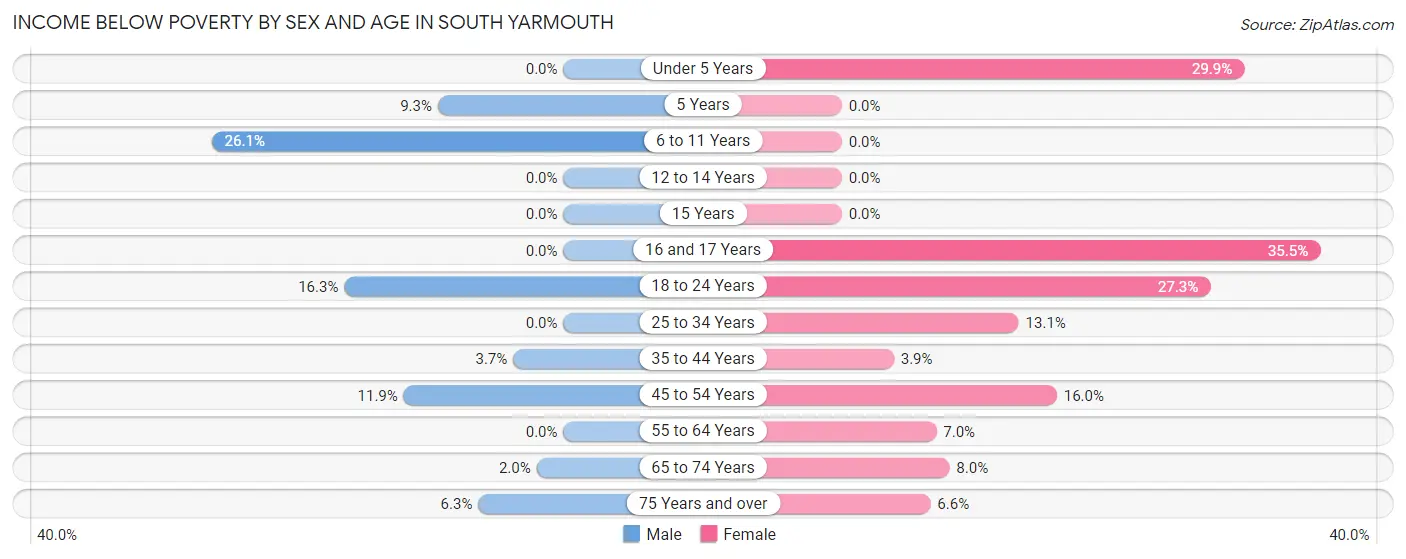
| Age Bracket | Male | Female |
| Under 5 Years | 0 (0.0%) | 43 (29.9%) |
| 5 Years | 11 (9.3%) | 0 (0.0%) |
| 6 to 11 Years | 41 (26.1%) | 0 (0.0%) |
| 12 to 14 Years | 0 (0.0%) | 0 (0.0%) |
| 15 Years | 0 (0.0%) | 0 (0.0%) |
| 16 and 17 Years | 0 (0.0%) | 60 (35.5%) |
| 18 to 24 Years | 109 (16.3%) | 76 (27.3%) |
| 25 to 34 Years | 0 (0.0%) | 75 (13.1%) |
| 35 to 44 Years | 23 (3.7%) | 16 (3.9%) |
| 45 to 54 Years | 76 (11.9%) | 91 (16.0%) |
| 55 to 64 Years | 0 (0.0%) | 86 (7.0%) |
| 65 to 74 Years | 19 (2.0%) | 78 (8.0%) |
| 75 Years and over | 46 (6.3%) | 64 (6.6%) |
| Total | 325 (5.6%) | 589 (10.2%) |
Income Above Poverty by Sex and Age in South Yarmouth
According to the poverty statistics in South Yarmouth, males aged under 5 years and females aged 5 years are the age groups that are most secure financially, with 100.0% of males and 100.0% of females in these age groups living above the poverty line.
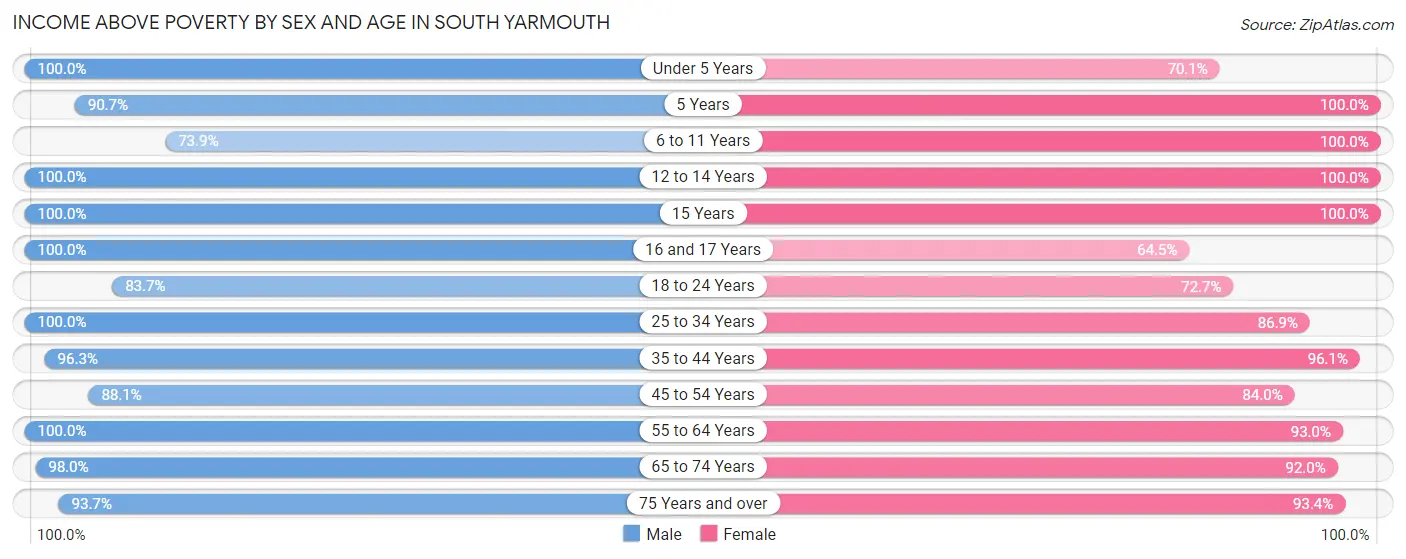
| Age Bracket | Male | Female |
| Under 5 Years | 234 (100.0%) | 101 (70.1%) |
| 5 Years | 107 (90.7%) | 104 (100.0%) |
| 6 to 11 Years | 116 (73.9%) | 214 (100.0%) |
| 12 to 14 Years | 72 (100.0%) | 81 (100.0%) |
| 15 Years | 60 (100.0%) | 29 (100.0%) |
| 16 and 17 Years | 44 (100.0%) | 109 (64.5%) |
| 18 to 24 Years | 561 (83.7%) | 202 (72.7%) |
| 25 to 34 Years | 748 (100.0%) | 496 (86.9%) |
| 35 to 44 Years | 594 (96.3%) | 398 (96.1%) |
| 45 to 54 Years | 565 (88.1%) | 479 (84.0%) |
| 55 to 64 Years | 755 (100.0%) | 1,139 (93.0%) |
| 65 to 74 Years | 938 (98.0%) | 898 (92.0%) |
| 75 Years and over | 682 (93.7%) | 909 (93.4%) |
| Total | 5,476 (94.4%) | 5,159 (89.7%) |
Income Below Poverty Among Married-Couple Families in South Yarmouth
The poverty statistics for married-couple families in South Yarmouth show that 4.0% or 86 of the total 2,130 families live below the poverty line. Families with 1 or 2 children have the highest poverty rate of 19.8%, comprising of 53 families. On the other hand, families with 3 or 4 children have the lowest poverty rate of 0.0%, which includes 0 families.
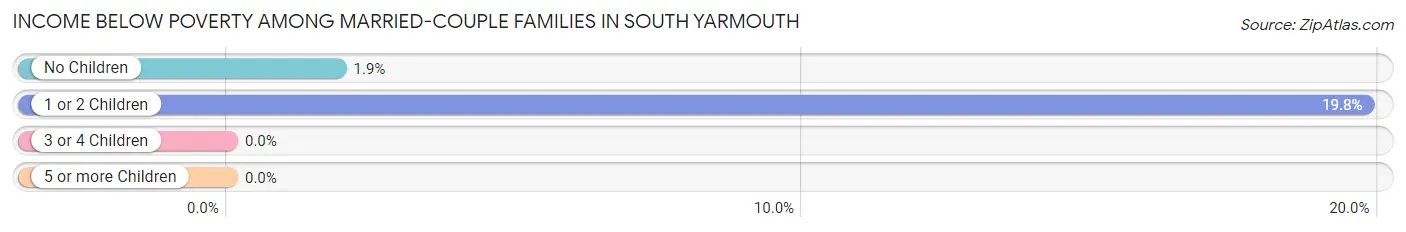
| Children | Above Poverty | Below Poverty |
| No Children | 1,710 (98.1%) | 33 (1.9%) |
| 1 or 2 Children | 215 (80.2%) | 53 (19.8%) |
| 3 or 4 Children | 119 (100.0%) | 0 (0.0%) |
| 5 or more Children | 0 (0.0%) | 0 (0.0%) |
| Total | 2,044 (96.0%) | 86 (4.0%) |
Income Below Poverty Among Single-Parent Households in South Yarmouth
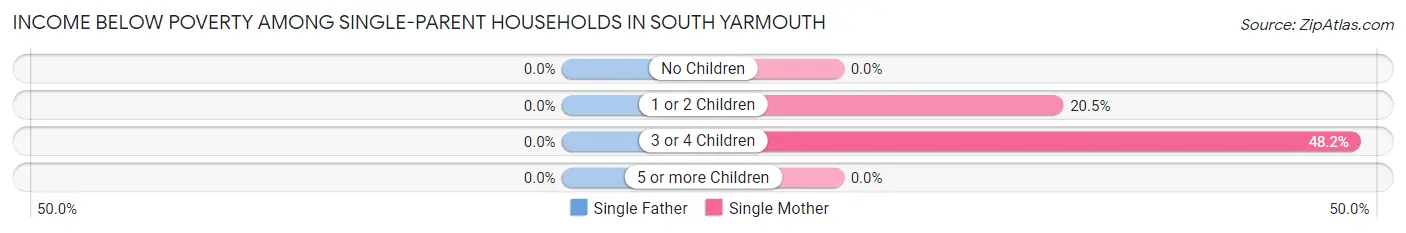
| Children | Single Father | Single Mother |
| No Children | 0 (0.0%) | 0 (0.0%) |
| 1 or 2 Children | 0 (0.0%) | 55 (20.4%) |
| 3 or 4 Children | 0 (0.0%) | 13 (48.1%) |
| 5 or more Children | 0 (0.0%) | 0 (0.0%) |
| Total | 0 (0.0%) | 68 (10.0%) |
Income Below Poverty Among Married-Couple vs Single-Parent Households in South Yarmouth
The poverty data for South Yarmouth shows that 86 of the married-couple family households (4.0%) and 68 of the single-parent households (7.4%) are living below the poverty level. Within the married-couple family households, those with 1 or 2 children have the highest poverty rate, with 53 households (19.8%) falling below the poverty line. Among the single-parent households, those with 3 or 4 children have the highest poverty rate, with 13 household (37.1%) living below poverty.
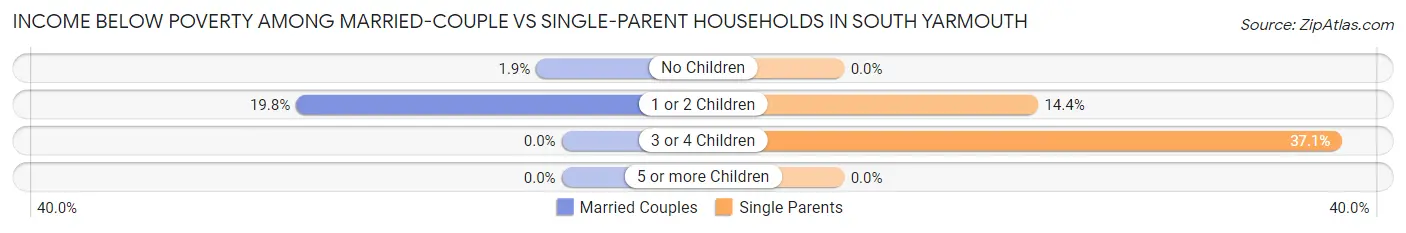
| Children | Married-Couple Families | Single-Parent Households |
| No Children | 33 (1.9%) | 0 (0.0%) |
| 1 or 2 Children | 53 (19.8%) | 55 (14.4%) |
| 3 or 4 Children | 0 (0.0%) | 13 (37.1%) |
| 5 or more Children | 0 (0.0%) | 0 (0.0%) |
| Total | 86 (4.0%) | 68 (7.4%) |
Race in South Yarmouth
The most populous races in South Yarmouth are White / Caucasian (9,231 | 78.2%), Two or more Races (861 | 7.3%), and Black / African American (810 | 6.9%).
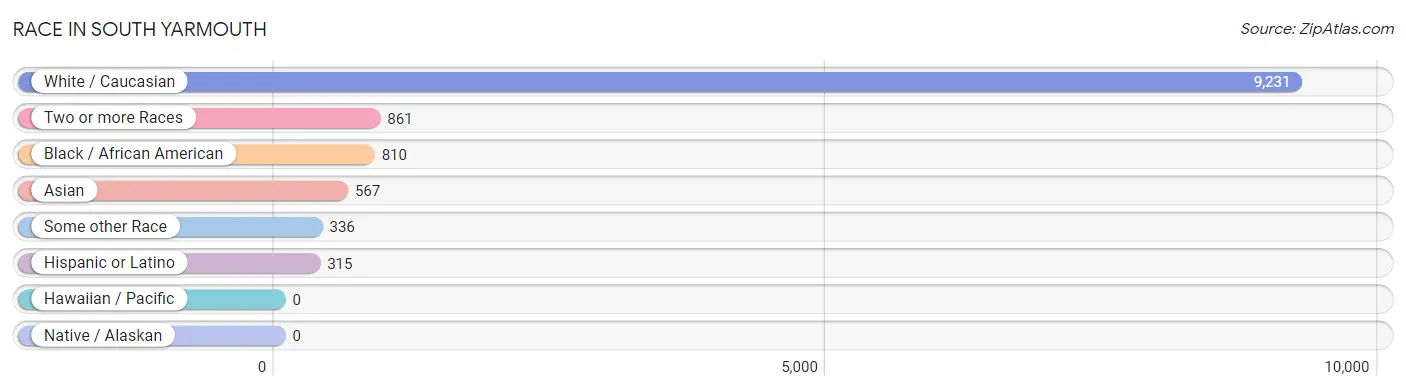
| Race | # Population | % Population |
| Asian | 567 | 4.8% |
| Black / African American | 810 | 6.9% |
| Hawaiian / Pacific | 0 | 0.0% |
| Hispanic or Latino | 315 | 2.7% |
| Native / Alaskan | 0 | 0.0% |
| White / Caucasian | 9,231 | 78.2% |
| Two or more Races | 861 | 7.3% |
| Some other Race | 336 | 2.9% |
| Total | 11,805 | 100.0% |
Ancestry in South Yarmouth
The most populous ancestries reported in South Yarmouth are Irish (2,807 | 23.8%), English (1,725 | 14.6%), Italian (1,299 | 11.0%), German (695 | 5.9%), and American (667 | 5.7%), together accounting for 60.9% of all South Yarmouth residents.
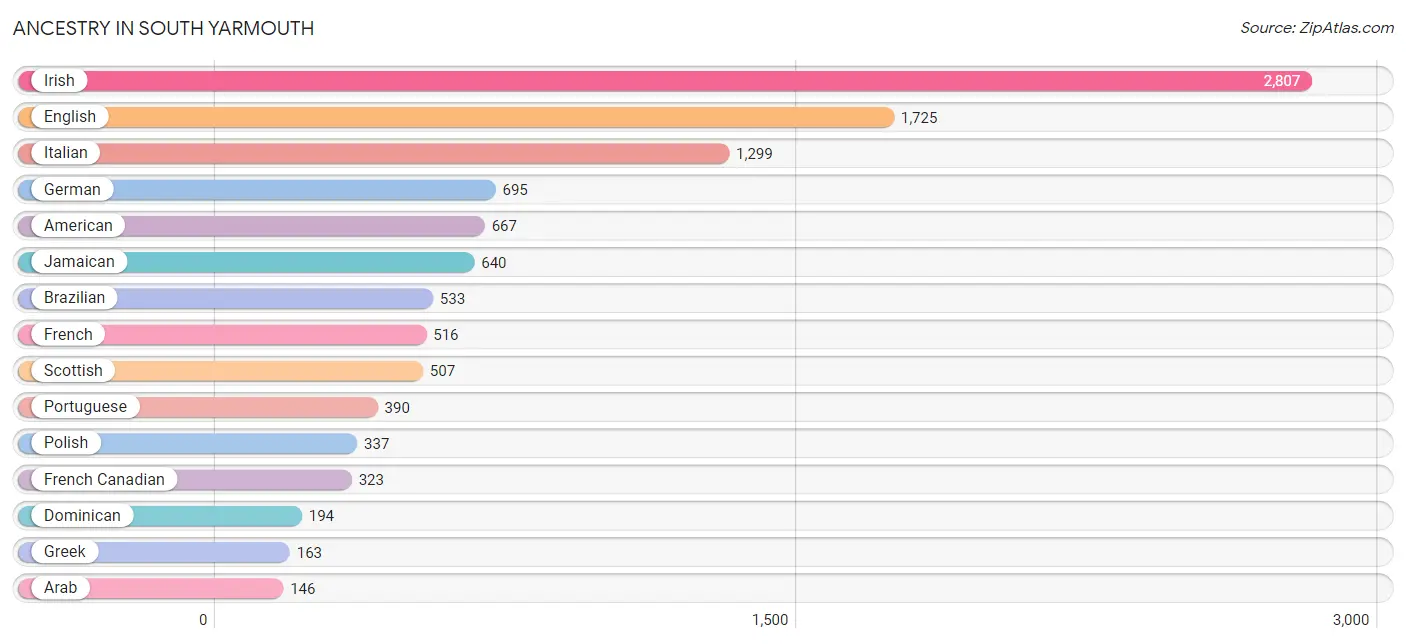
| Ancestry | # Population | % Population |
| Albanian | 53 | 0.4% |
| American | 667 | 5.7% |
| Arab | 146 | 1.2% |
| Armenian | 46 | 0.4% |
| Austrian | 53 | 0.4% |
| Bhutanese | 12 | 0.1% |
| Brazilian | 533 | 4.5% |
| British | 116 | 1.0% |
| Bulgarian | 69 | 0.6% |
| Cajun | 33 | 0.3% |
| Canadian | 19 | 0.2% |
| Cape Verdean | 62 | 0.5% |
| Cherokee | 35 | 0.3% |
| Colombian | 12 | 0.1% |
| Czech | 10 | 0.1% |
| Danish | 45 | 0.4% |
| Dominican | 194 | 1.6% |
| Dutch | 27 | 0.2% |
| Eastern European | 9 | 0.1% |
| English | 1,725 | 14.6% |
| European | 109 | 0.9% |
| Finnish | 51 | 0.4% |
| French | 516 | 4.4% |
| French Canadian | 323 | 2.7% |
| German | 695 | 5.9% |
| Greek | 163 | 1.4% |
| Hungarian | 25 | 0.2% |
| Irish | 2,807 | 23.8% |
| Italian | 1,299 | 11.0% |
| Jamaican | 640 | 5.4% |
| Korean | 10 | 0.1% |
| Lebanese | 112 | 0.9% |
| Lithuanian | 2 | 0.0% |
| Mexican | 15 | 0.1% |
| Norwegian | 138 | 1.2% |
| Polish | 337 | 2.9% |
| Portuguese | 390 | 3.3% |
| Puerto Rican | 51 | 0.4% |
| Russian | 34 | 0.3% |
| Scandinavian | 9 | 0.1% |
| Scotch-Irish | 80 | 0.7% |
| Scottish | 507 | 4.3% |
| Slavic | 16 | 0.1% |
| Slovak | 31 | 0.3% |
| South American | 12 | 0.1% |
| Spanish | 18 | 0.2% |
| Sri Lankan | 74 | 0.6% |
| Subsaharan African | 62 | 0.5% |
| Swedish | 134 | 1.1% |
| Swiss | 31 | 0.3% |
| Syrian | 34 | 0.3% |
| Thai | 92 | 0.8% |
| Ukrainian | 65 | 0.5% |
| West Indian | 23 | 0.2% | View All 54 Rows |
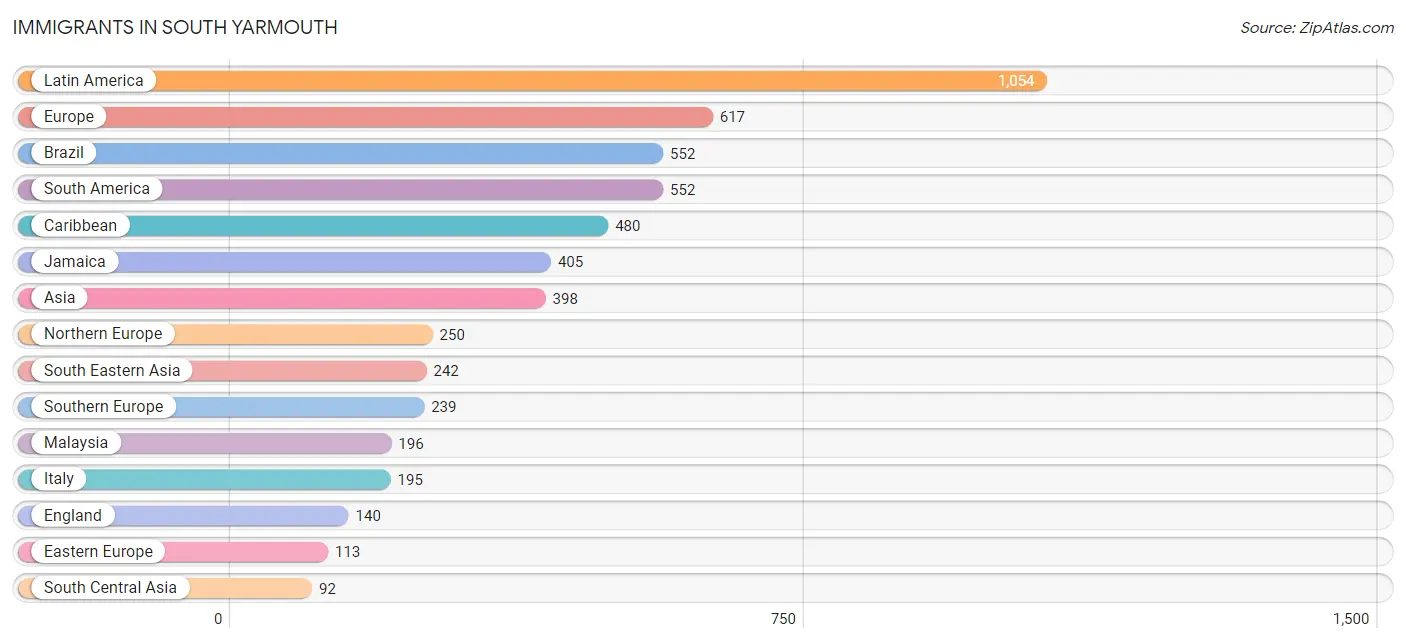
Immigrants in South Yarmouth
The most numerous immigrant groups reported in South Yarmouth came from Latin America (1,054 | 8.9%), Europe (617 | 5.2%), Brazil (552 | 4.7%), South America (552 | 4.7%), and Caribbean (480 | 4.1%), together accounting for 27.6% of all South Yarmouth residents.
| Immigration Origin | # Population | % Population |
| Asia | 398 | 3.4% |
| Brazil | 552 | 4.7% |
| Bulgaria | 69 | 0.6% |
| Cambodia | 29 | 0.3% |
| Caribbean | 480 | 4.1% |
| Central America | 22 | 0.2% |
| China | 49 | 0.4% |
| Dominican Republic | 75 | 0.6% |
| Eastern Asia | 49 | 0.4% |
| Eastern Europe | 113 | 1.0% |
| England | 140 | 1.2% |
| Europe | 617 | 5.2% |
| Greece | 26 | 0.2% |
| India | 19 | 0.2% |
| Ireland | 75 | 0.6% |
| Italy | 195 | 1.7% |
| Jamaica | 405 | 3.4% |
| Latin America | 1,054 | 8.9% |
| Malaysia | 196 | 1.7% |
| Mexico | 22 | 0.2% |
| Nepal | 57 | 0.5% |
| Northern Europe | 250 | 2.1% |
| Pakistan | 16 | 0.1% |
| Philippines | 10 | 0.1% |
| Portugal | 18 | 0.2% |
| Scotland | 7 | 0.1% |
| South America | 552 | 4.7% |
| South Central Asia | 92 | 0.8% |
| South Eastern Asia | 242 | 2.1% |
| Southern Europe | 239 | 2.0% |
| Switzerland | 15 | 0.1% |
| Syria | 15 | 0.1% |
| Ukraine | 44 | 0.4% |
| Vietnam | 7 | 0.1% |
| Western Asia | 15 | 0.1% |
| Western Europe | 15 | 0.1% | View All 36 Rows |
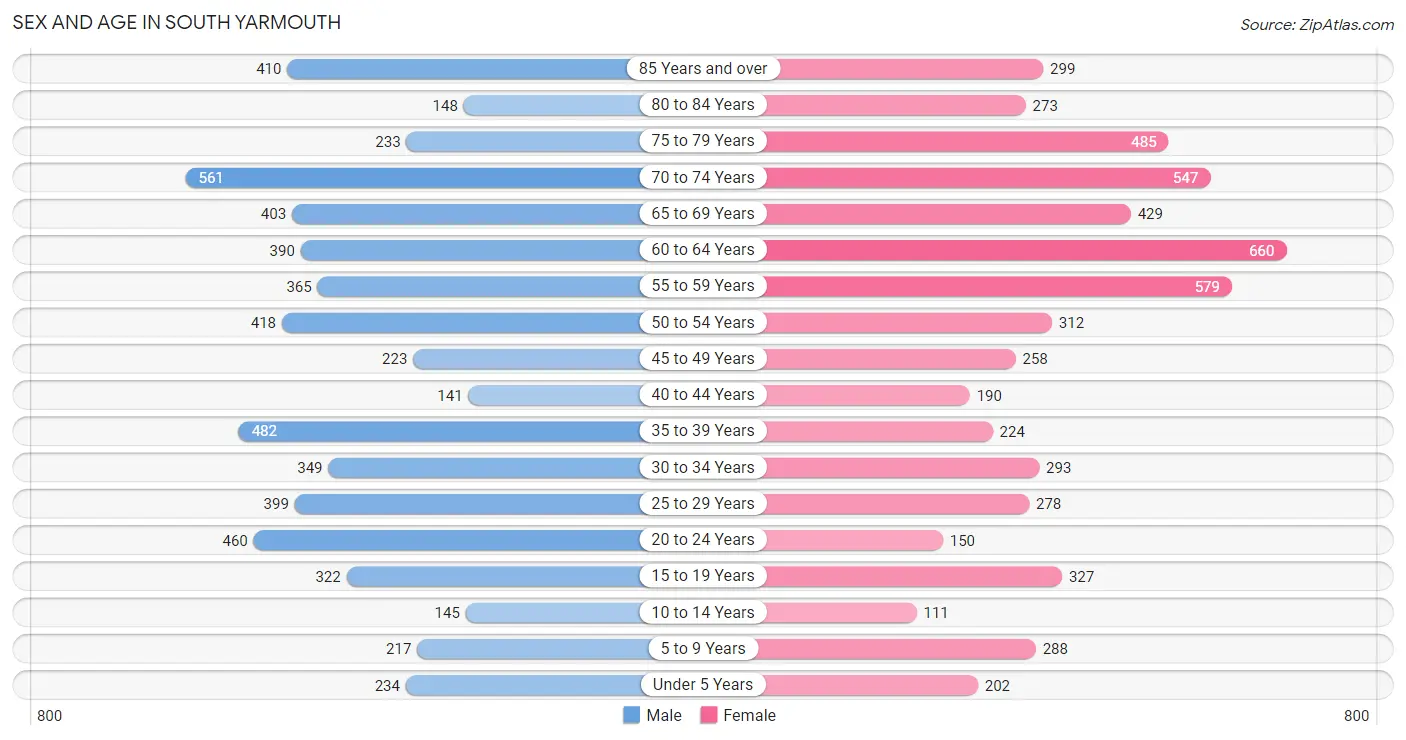
Sex and Age in South Yarmouth
Sex and Age in South Yarmouth
The most populous age groups in South Yarmouth are 70 to 74 Years (561 | 9.5%) for men and 60 to 64 Years (660 | 11.2%) for women.
| Age Bracket | Male | Female |
| Under 5 Years | 234 (4.0%) | 202 (3.4%) |
| 5 to 9 Years | 217 (3.7%) | 288 (4.9%) |
| 10 to 14 Years | 145 (2.5%) | 111 (1.9%) |
| 15 to 19 Years | 322 (5.5%) | 327 (5.5%) |
| 20 to 24 Years | 460 (7.8%) | 150 (2.5%) |
| 25 to 29 Years | 399 (6.8%) | 278 (4.7%) |
| 30 to 34 Years | 349 (5.9%) | 293 (5.0%) |
| 35 to 39 Years | 482 (8.2%) | 224 (3.8%) |
| 40 to 44 Years | 141 (2.4%) | 190 (3.2%) |
| 45 to 49 Years | 223 (3.8%) | 258 (4.4%) |
| 50 to 54 Years | 418 (7.1%) | 312 (5.3%) |
| 55 to 59 Years | 365 (6.2%) | 579 (9.8%) |
| 60 to 64 Years | 390 (6.6%) | 660 (11.2%) |
| 65 to 69 Years | 403 (6.8%) | 429 (7.3%) |
| 70 to 74 Years | 561 (9.5%) | 547 (9.3%) |
| 75 to 79 Years | 233 (4.0%) | 485 (8.2%) |
| 80 to 84 Years | 148 (2.5%) | 273 (4.6%) |
| 85 Years and over | 410 (7.0%) | 299 (5.1%) |
| Total | 5,900 (100.0%) | 5,905 (100.0%) |
Families and Households in South Yarmouth
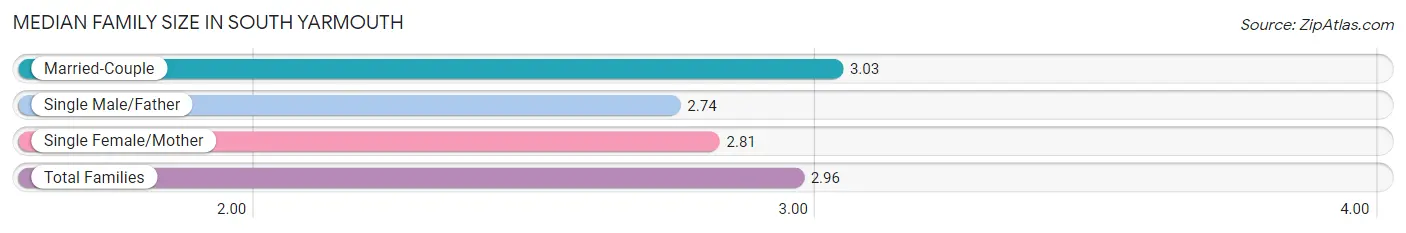
Median Family Size in South Yarmouth
The median family size in South Yarmouth is 2.96 persons per family, with married-couple families (2,130 | 69.9%) accounting for the largest median family size of 3.03 persons per family. On the other hand, single male/father families (235 | 7.7%) represent the smallest median family size with 2.74 persons per family.
| Family Type | # Families | Family Size |
| Married-Couple | 2,130 (69.9%) | 3.03 |
| Single Male/Father | 235 (7.7%) | 2.74 |
| Single Female/Mother | 681 (22.4%) | 2.81 |
| Total Families | 3,046 (100.0%) | 2.96 |
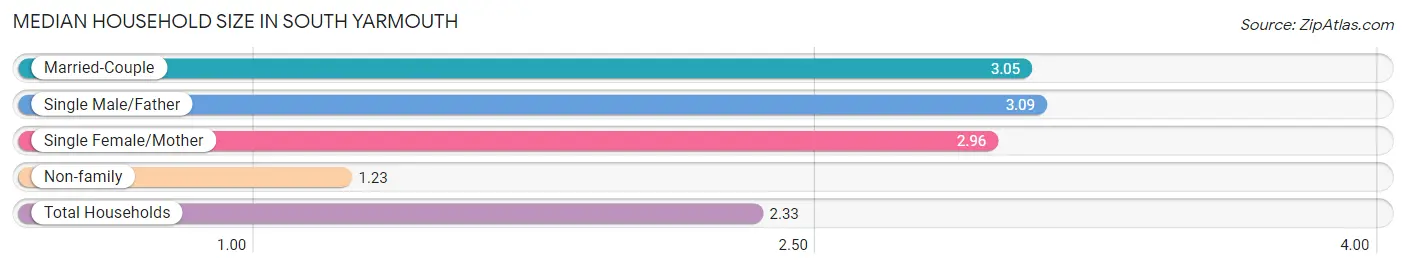
Median Household Size in South Yarmouth
The median household size in South Yarmouth is 2.33 persons per household, with single male/father households (235 | 4.7%) accounting for the largest median household size of 3.09 persons per household. non-family households (1,930 | 38.8%) represent the smallest median household size with 1.23 persons per household.
| Household Type | # Households | Household Size |
| Married-Couple | 2,130 (42.8%) | 3.05 |
| Single Male/Father | 235 (4.7%) | 3.09 |
| Single Female/Mother | 681 (13.7%) | 2.96 |
| Non-family | 1,930 (38.8%) | 1.23 |
| Total Households | 4,976 (100.0%) | 2.33 |
Household Size by Marriage Status in South Yarmouth
Out of a total of 4,976 households in South Yarmouth, 3,046 (61.2%) are family households, while 1,930 (38.8%) are nonfamily households. The most numerous type of family households are 2-person households, comprising 1,823, and the most common type of nonfamily households are 1-person households, comprising 1,659.
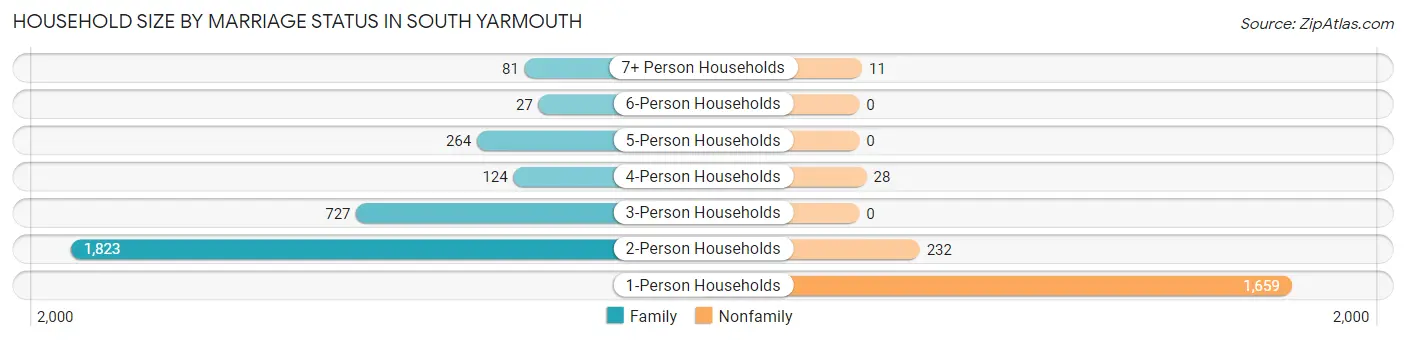
| Household Size | Family Households | Nonfamily Households |
| 1-Person Households | - | 1,659 (33.3%) |
| 2-Person Households | 1,823 (36.6%) | 232 (4.7%) |
| 3-Person Households | 727 (14.6%) | 0 (0.0%) |
| 4-Person Households | 124 (2.5%) | 28 (0.6%) |
| 5-Person Households | 264 (5.3%) | 0 (0.0%) |
| 6-Person Households | 27 (0.5%) | 0 (0.0%) |
| 7+ Person Households | 81 (1.6%) | 11 (0.2%) |
| Total | 3,046 (61.2%) | 1,930 (38.8%) |
Female Fertility in South Yarmouth
Fertility by Age in South Yarmouth
Average fertility rate in South Yarmouth is 28.0 births per 1,000 women. Women in the age bracket of 20 to 34 years have the highest fertility rate with 44.0 births per 1,000 women. Women in the age bracket of 20 to 34 years acount for 66.7% of all women with births.
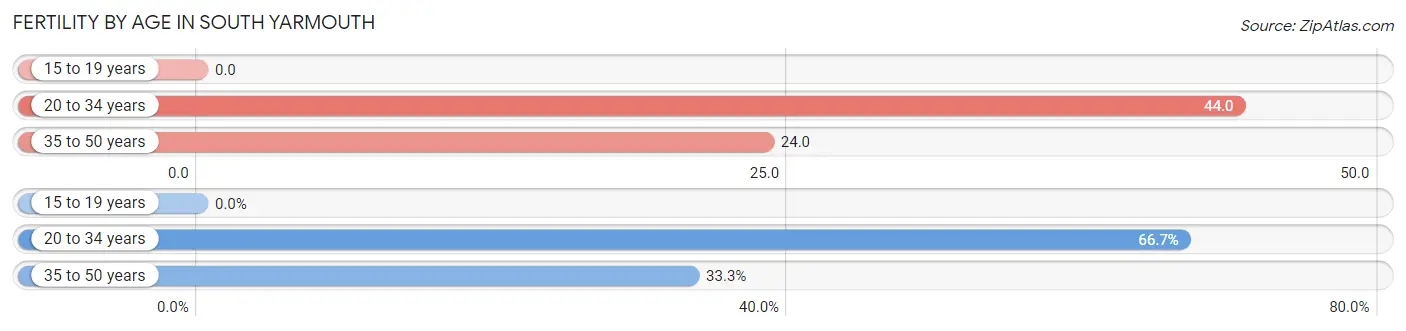
| Age Bracket | Women with Births | Births / 1,000 Women |
| 15 to 19 years | 0 (0.0%) | 0.0 |
| 20 to 34 years | 32 (66.7%) | 44.0 |
| 35 to 50 years | 16 (33.3%) | 24.0 |
| Total | 48 (100.0%) | 28.0 |
Fertility by Age by Marriage Status in South Yarmouth
35.4% of women with births (48) in South Yarmouth are married. The highest percentage of unmarried women with births falls into 20 to 34 years age bracket with 96.9% of them unmarried at the time of birth, while the lowest percentage of unmarried women with births belong to 35 to 50 years age bracket with 0.0% of them unmarried.
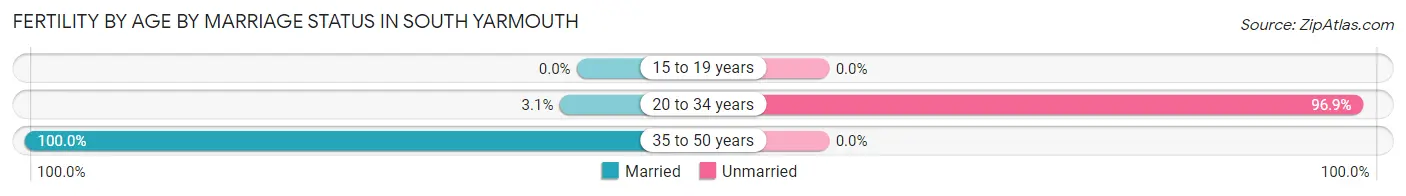
| Age Bracket | Married | Unmarried |
| 15 to 19 years | 0 (0.0%) | 0 (0.0%) |
| 20 to 34 years | 1 (3.1%) | 31 (96.9%) |
| 35 to 50 years | 16 (100.0%) | 0 (0.0%) |
| Total | 17 (35.4%) | 31 (64.6%) |
Fertility by Education in South Yarmouth
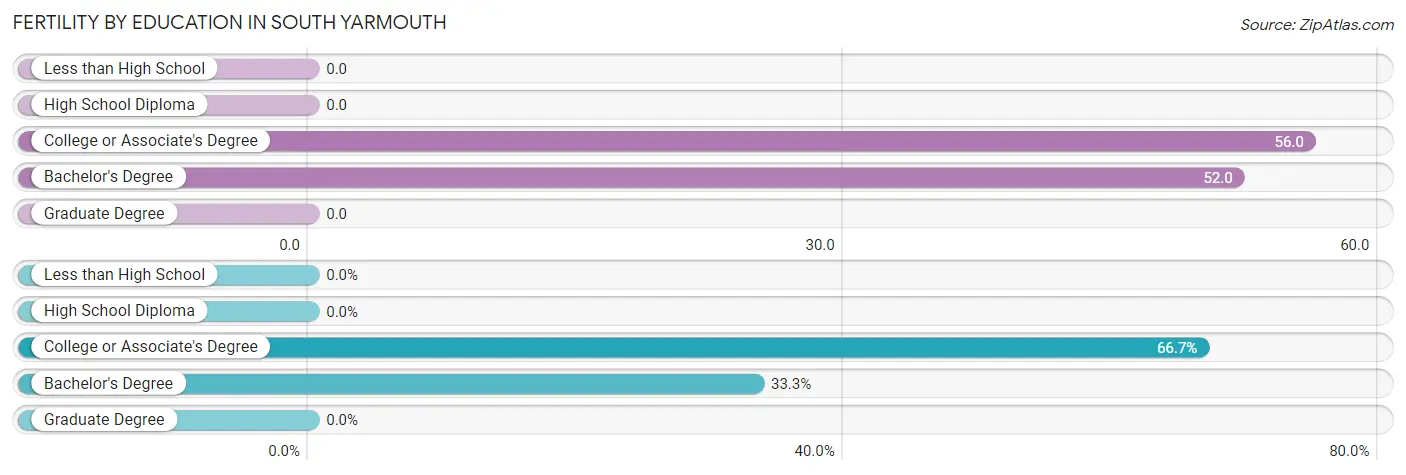
| Educational Attainment | Women with Births | Births / 1,000 Women |
| Less than High School | 0 (0.0%) | 0.0 |
| High School Diploma | 0 (0.0%) | 0.0 |
| College or Associate's Degree | 32 (66.7%) | 56.0 |
| Bachelor's Degree | 16 (33.3%) | 52.0 |
| Graduate Degree | 0 (0.0%) | 0.0 |
| Total | 48 (100.0%) | 28.0 |
Fertility by Education by Marriage Status in South Yarmouth
64.6% of women with births in South Yarmouth are unmarried. Women with the educational attainment of bachelor's degree are most likely to be married with 100.0% of them married at childbirth, while women with the educational attainment of college or associate's degree are least likely to be married with 96.9% of them unmarried at childbirth.
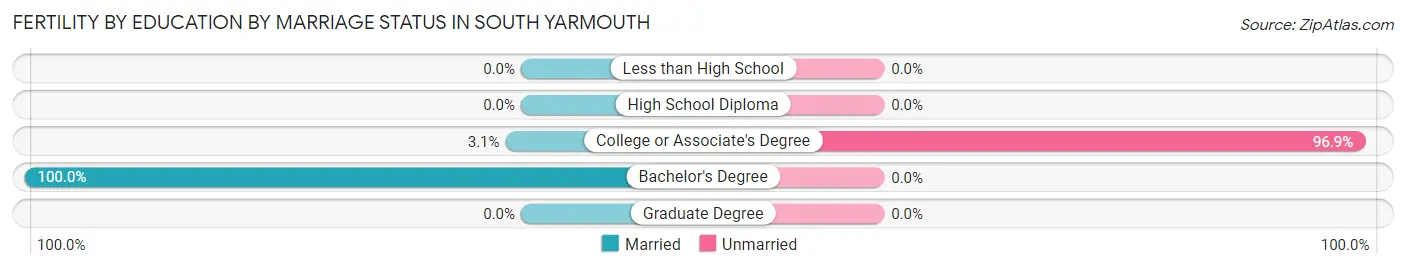
| Educational Attainment | Married | Unmarried |
| Less than High School | 0 (0.0%) | 0 (0.0%) |
| High School Diploma | 0 (0.0%) | 0 (0.0%) |
| College or Associate's Degree | 1 (3.1%) | 31 (96.9%) |
| Bachelor's Degree | 16 (100.0%) | 0 (0.0%) |
| Graduate Degree | 0 (0.0%) | 0 (0.0%) |
| Total | 17 (35.4%) | 31 (64.6%) |
Employment Characteristics in South Yarmouth
Employment by Class of Employer in South Yarmouth
Among the 5,433 employed individuals in South Yarmouth, private company employees (3,762 | 69.2%), not-for-profit organizations (611 | 11.3%), and local government employees (380 | 7.0%) make up the most common classes of employment.
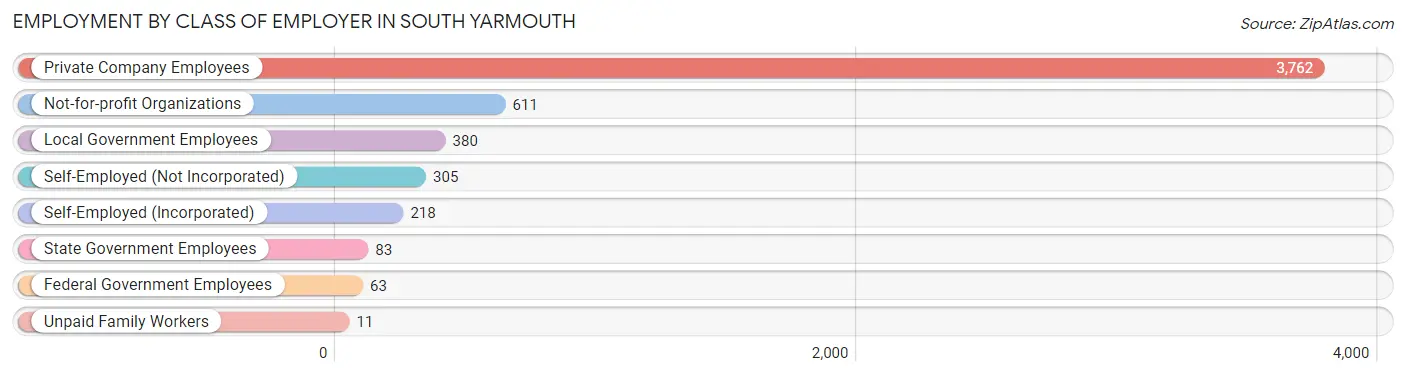
| Employer Class | # Employees | % Employees |
| Private Company Employees | 3,762 | 69.2% |
| Self-Employed (Incorporated) | 218 | 4.0% |
| Self-Employed (Not Incorporated) | 305 | 5.6% |
| Not-for-profit Organizations | 611 | 11.3% |
| Local Government Employees | 380 | 7.0% |
| State Government Employees | 83 | 1.5% |
| Federal Government Employees | 63 | 1.2% |
| Unpaid Family Workers | 11 | 0.2% |
| Total | 5,433 | 100.0% |
Employment Status by Age in South Yarmouth
According to the labor force statistics for South Yarmouth, out of the total population over 16 years of age (10,515), 58.1% or 6,109 individuals are in the labor force, with 7.1% or 434 of them unemployed. The age group with the highest labor force participation rate is 25 to 29 years, with 98.1% or 664 individuals in the labor force. Within the labor force, the 25 to 29 years age range has the highest percentage of unemployed individuals, with 22.0% or 146 of them being unemployed.
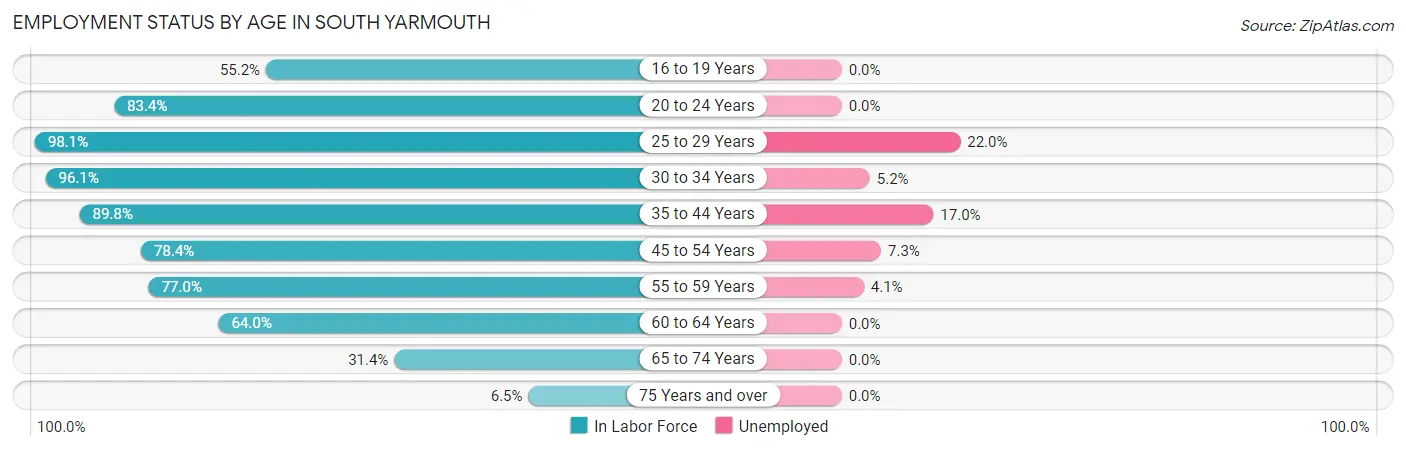
| Age Bracket | In Labor Force | Unemployed |
| 16 to 19 Years | 307 (55.2%) | 0 (0.0%) |
| 20 to 24 Years | 509 (83.4%) | 0 (0.0%) |
| 25 to 29 Years | 664 (98.1%) | 146 (22.0%) |
| 30 to 34 Years | 617 (96.1%) | 32 (5.2%) |
| 35 to 44 Years | 931 (89.8%) | 158 (17.0%) |
| 45 to 54 Years | 949 (78.4%) | 69 (7.3%) |
| 55 to 59 Years | 727 (77.0%) | 30 (4.1%) |
| 60 to 64 Years | 672 (64.0%) | 0 (0.0%) |
| 65 to 74 Years | 609 (31.4%) | 0 (0.0%) |
| 75 Years and over | 120 (6.5%) | 0 (0.0%) |
| Total | 6,109 (58.1%) | 434 (7.1%) |
Employment Status by Educational Attainment in South Yarmouth
According to labor force statistics for South Yarmouth, 82.0% of individuals (4,560) out of the total population between 25 and 64 years of age (5,561) are in the labor force, with 9.5% or 433 of them being unemployed. The group with the highest labor force participation rate are those with the educational attainment of college / associate degree, with 84.3% or 1,362 individuals in the labor force. Within the labor force, individuals with high school diploma education have the highest percentage of unemployment, with 15.8% or 284 of them being unemployed.
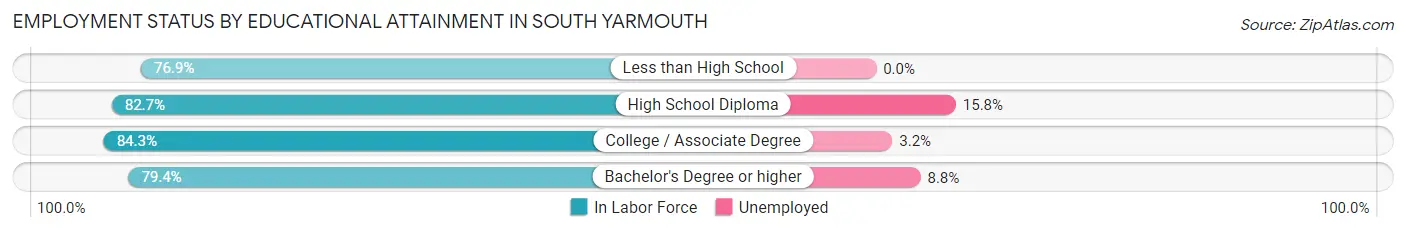
| Educational Attainment | In Labor Force | Unemployed |
| Less than High School | 186 (76.9%) | 0 (0.0%) |
| High School Diploma | 1,795 (82.7%) | 343 (15.8%) |
| College / Associate Degree | 1,362 (84.3%) | 52 (3.2%) |
| Bachelor's Degree or higher | 1,217 (79.4%) | 135 (8.8%) |
| Total | 4,560 (82.0%) | 528 (9.5%) |
Employment Occupations by Sex in South Yarmouth
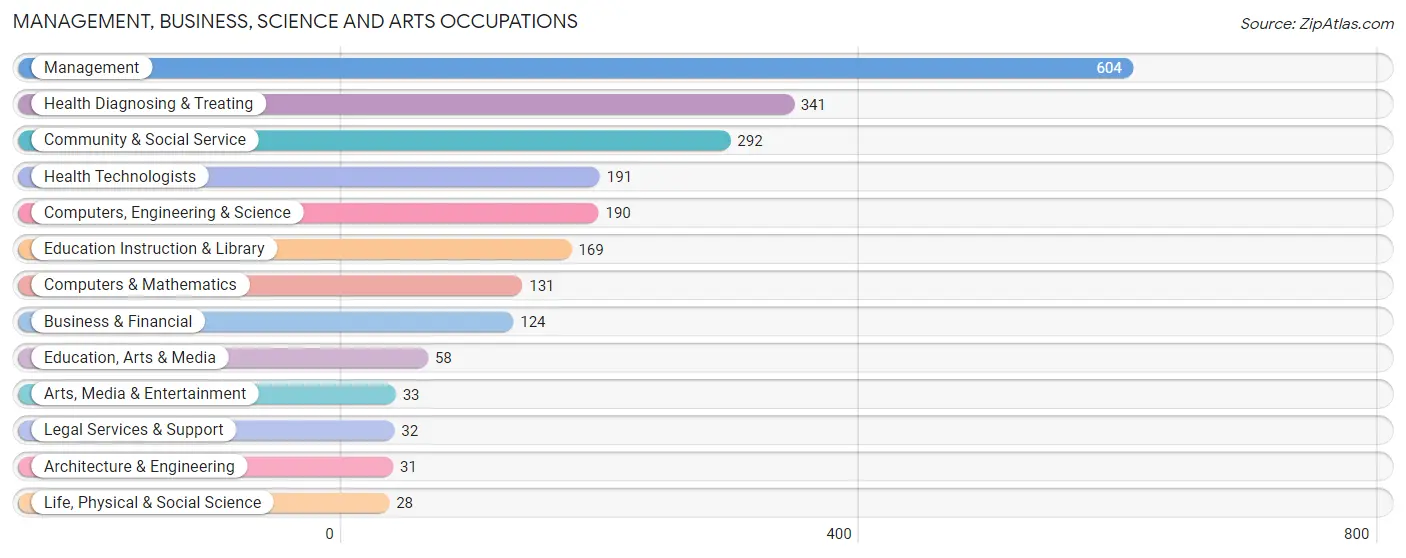
Management, Business, Science and Arts Occupations
The most common Management, Business, Science and Arts occupations in South Yarmouth are Management (604 | 10.7%), Health Diagnosing & Treating (341 | 6.0%), Community & Social Service (292 | 5.2%), Health Technologists (191 | 3.4%), and Computers, Engineering & Science (190 | 3.4%).
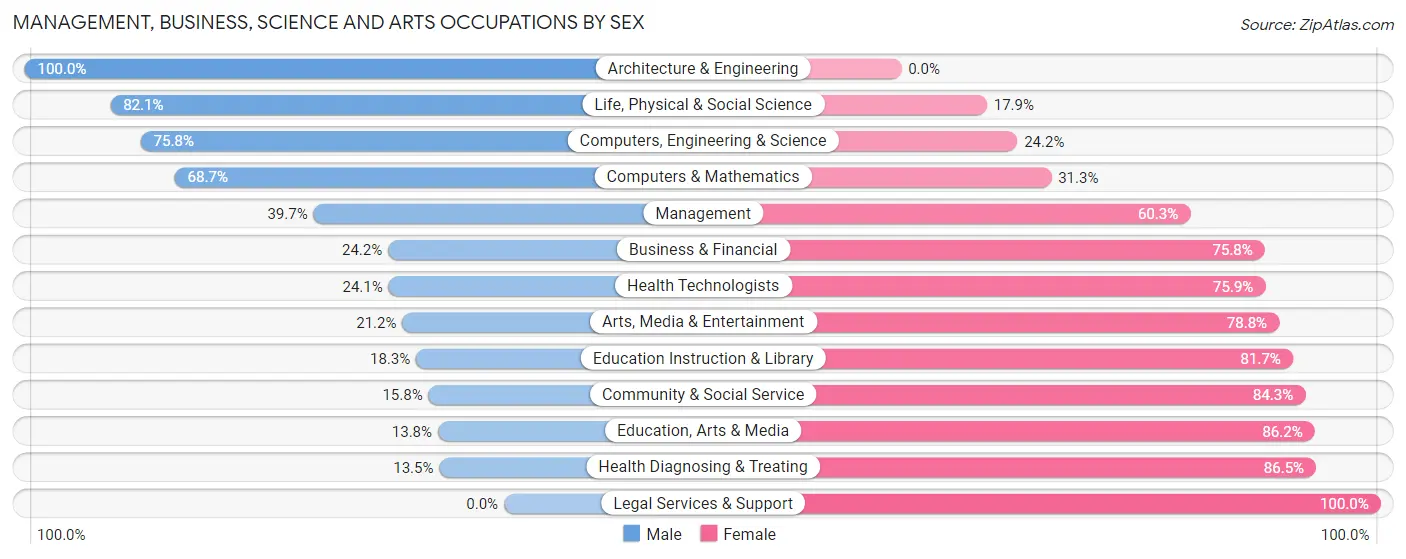
Management, Business, Science and Arts Occupations by Sex
Within the Management, Business, Science and Arts occupations in South Yarmouth, the most male-oriented occupations are Architecture & Engineering (100.0%), Life, Physical & Social Science (82.1%), and Computers, Engineering & Science (75.8%), while the most female-oriented occupations are Legal Services & Support (100.0%), Health Diagnosing & Treating (86.5%), and Education, Arts & Media (86.2%).
| Occupation | Male | Female |
| Management | 240 (39.7%) | 364 (60.3%) |
| Business & Financial | 30 (24.2%) | 94 (75.8%) |
| Computers, Engineering & Science | 144 (75.8%) | 46 (24.2%) |
| Computers & Mathematics | 90 (68.7%) | 41 (31.3%) |
| Architecture & Engineering | 31 (100.0%) | 0 (0.0%) |
| Life, Physical & Social Science | 23 (82.1%) | 5 (17.9%) |
| Community & Social Service | 46 (15.8%) | 246 (84.3%) |
| Education, Arts & Media | 8 (13.8%) | 50 (86.2%) |
| Legal Services & Support | 0 (0.0%) | 32 (100.0%) |
| Education Instruction & Library | 31 (18.3%) | 138 (81.7%) |
| Arts, Media & Entertainment | 7 (21.2%) | 26 (78.8%) |
| Health Diagnosing & Treating | 46 (13.5%) | 295 (86.5%) |
| Health Technologists | 46 (24.1%) | 145 (75.9%) |
| Total (Category) | 506 (32.6%) | 1,045 (67.4%) |
| Total (Overall) | 3,096 (54.7%) | 2,566 (45.3%) |
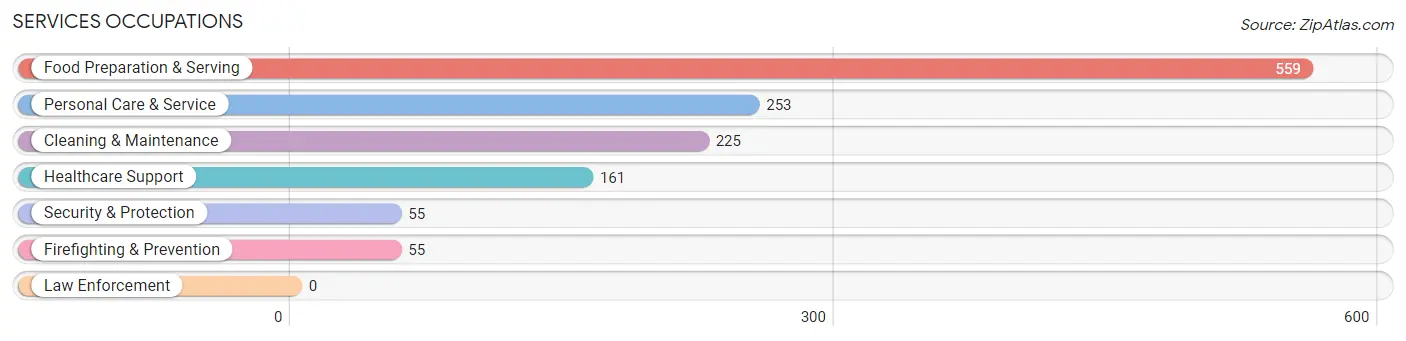
Services Occupations
The most common Services occupations in South Yarmouth are Food Preparation & Serving (559 | 9.9%), Personal Care & Service (253 | 4.5%), Cleaning & Maintenance (225 | 4.0%), Healthcare Support (161 | 2.8%), and Security & Protection (55 | 1.0%).
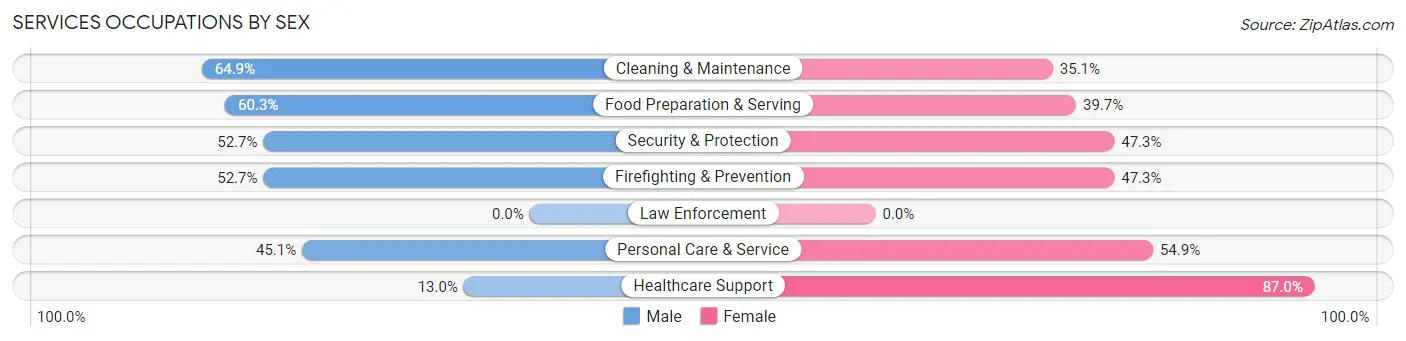
Services Occupations by Sex
Within the Services occupations in South Yarmouth, the most male-oriented occupations are Cleaning & Maintenance (64.9%), Food Preparation & Serving (60.3%), and Security & Protection (52.7%), while the most female-oriented occupations are Healthcare Support (87.0%), Personal Care & Service (54.9%), and Security & Protection (47.3%).
| Occupation | Male | Female |
| Healthcare Support | 21 (13.0%) | 140 (87.0%) |
| Security & Protection | 29 (52.7%) | 26 (47.3%) |
| Firefighting & Prevention | 29 (52.7%) | 26 (47.3%) |
| Law Enforcement | 0 (0.0%) | 0 (0.0%) |
| Food Preparation & Serving | 337 (60.3%) | 222 (39.7%) |
| Cleaning & Maintenance | 146 (64.9%) | 79 (35.1%) |
| Personal Care & Service | 114 (45.1%) | 139 (54.9%) |
| Total (Category) | 647 (51.6%) | 606 (48.4%) |
| Total (Overall) | 3,096 (54.7%) | 2,566 (45.3%) |
Sales and Office Occupations
The most common Sales and Office occupations in South Yarmouth are Sales & Related (889 | 15.7%), and Office & Administration (544 | 9.6%).
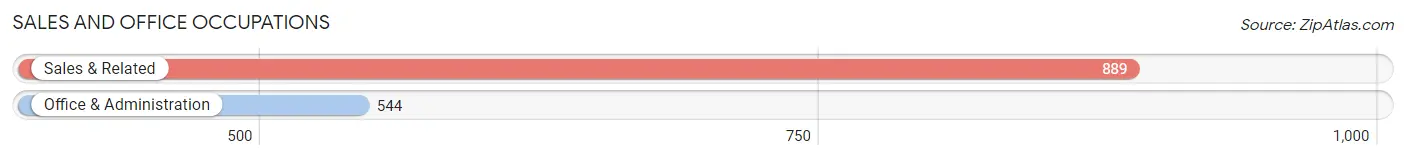
Sales and Office Occupations by Sex
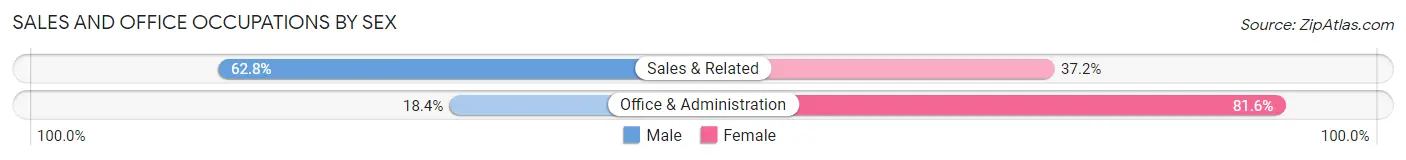
| Occupation | Male | Female |
| Sales & Related | 558 (62.8%) | 331 (37.2%) |
| Office & Administration | 100 (18.4%) | 444 (81.6%) |
| Total (Category) | 658 (45.9%) | 775 (54.1%) |
| Total (Overall) | 3,096 (54.7%) | 2,566 (45.3%) |
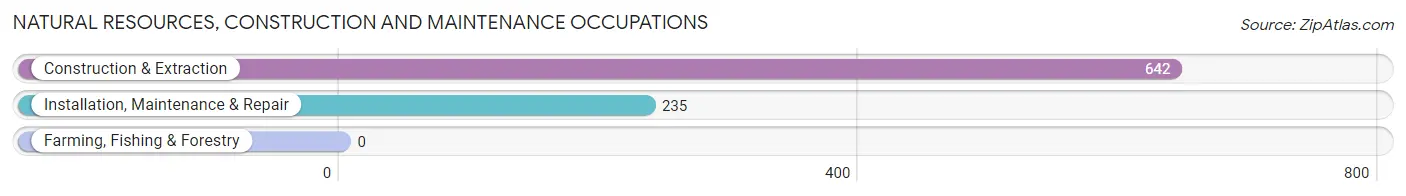
Natural Resources, Construction and Maintenance Occupations
The most common Natural Resources, Construction and Maintenance occupations in South Yarmouth are Construction & Extraction (642 | 11.3%), and Installation, Maintenance & Repair (235 | 4.2%).
Natural Resources, Construction and Maintenance Occupations by Sex
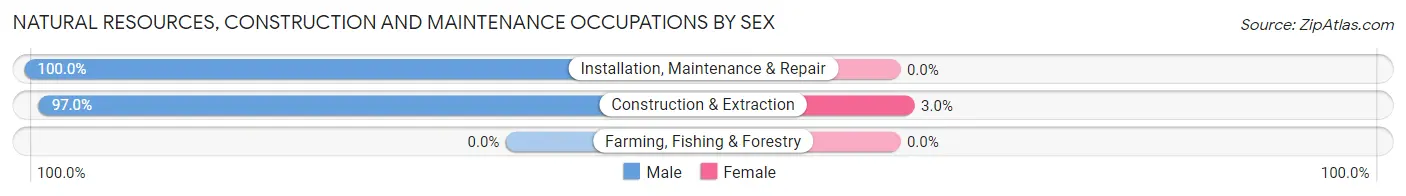
| Occupation | Male | Female |
| Farming, Fishing & Forestry | 0 (0.0%) | 0 (0.0%) |
| Construction & Extraction | 623 (97.0%) | 19 (3.0%) |
| Installation, Maintenance & Repair | 235 (100.0%) | 0 (0.0%) |
| Total (Category) | 858 (97.8%) | 19 (2.2%) |
| Total (Overall) | 3,096 (54.7%) | 2,566 (45.3%) |
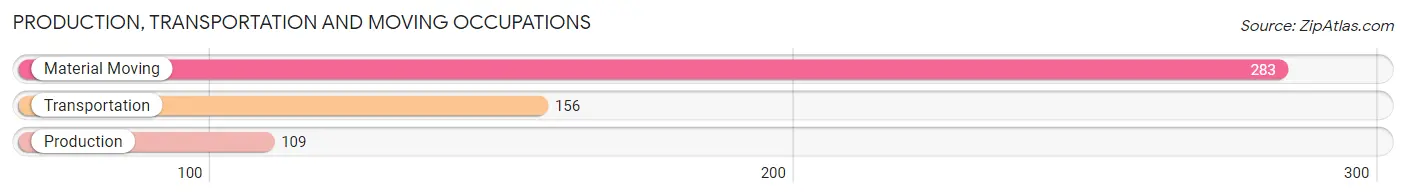
Production, Transportation and Moving Occupations
The most common Production, Transportation and Moving occupations in South Yarmouth are Material Moving (283 | 5.0%), Transportation (156 | 2.8%), and Production (109 | 1.9%).
Production, Transportation and Moving Occupations by Sex
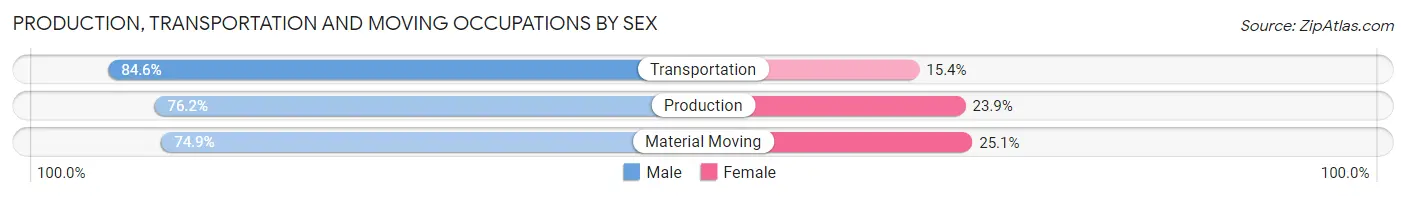
| Occupation | Male | Female |
| Production | 83 (76.1%) | 26 (23.8%) |
| Transportation | 132 (84.6%) | 24 (15.4%) |
| Material Moving | 212 (74.9%) | 71 (25.1%) |
| Total (Category) | 427 (77.9%) | 121 (22.1%) |
| Total (Overall) | 3,096 (54.7%) | 2,566 (45.3%) |
Employment Industries by Sex in South Yarmouth
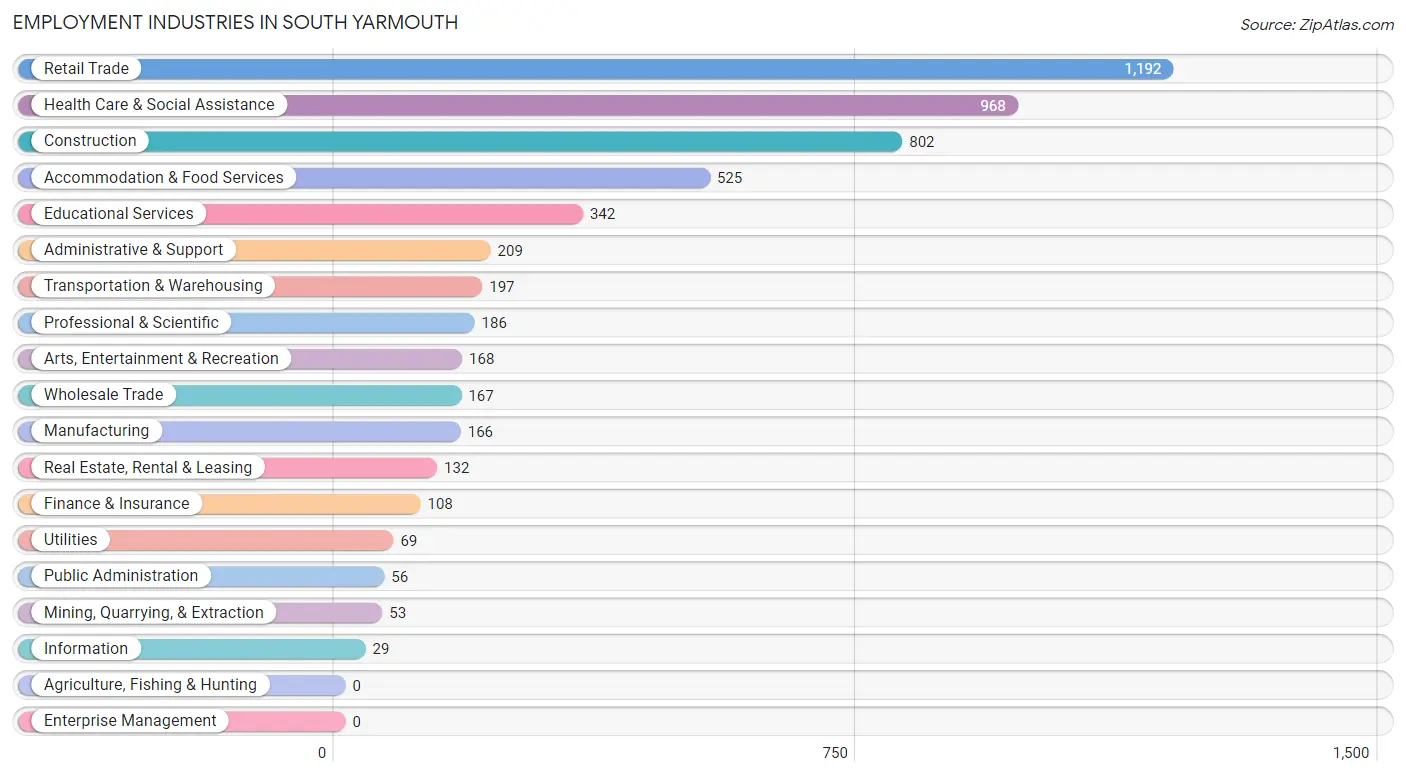
Employment Industries in South Yarmouth
The major employment industries in South Yarmouth include Retail Trade (1,192 | 21.0%), Health Care & Social Assistance (968 | 17.1%), Construction (802 | 14.2%), Accommodation & Food Services (525 | 9.3%), and Educational Services (342 | 6.0%).
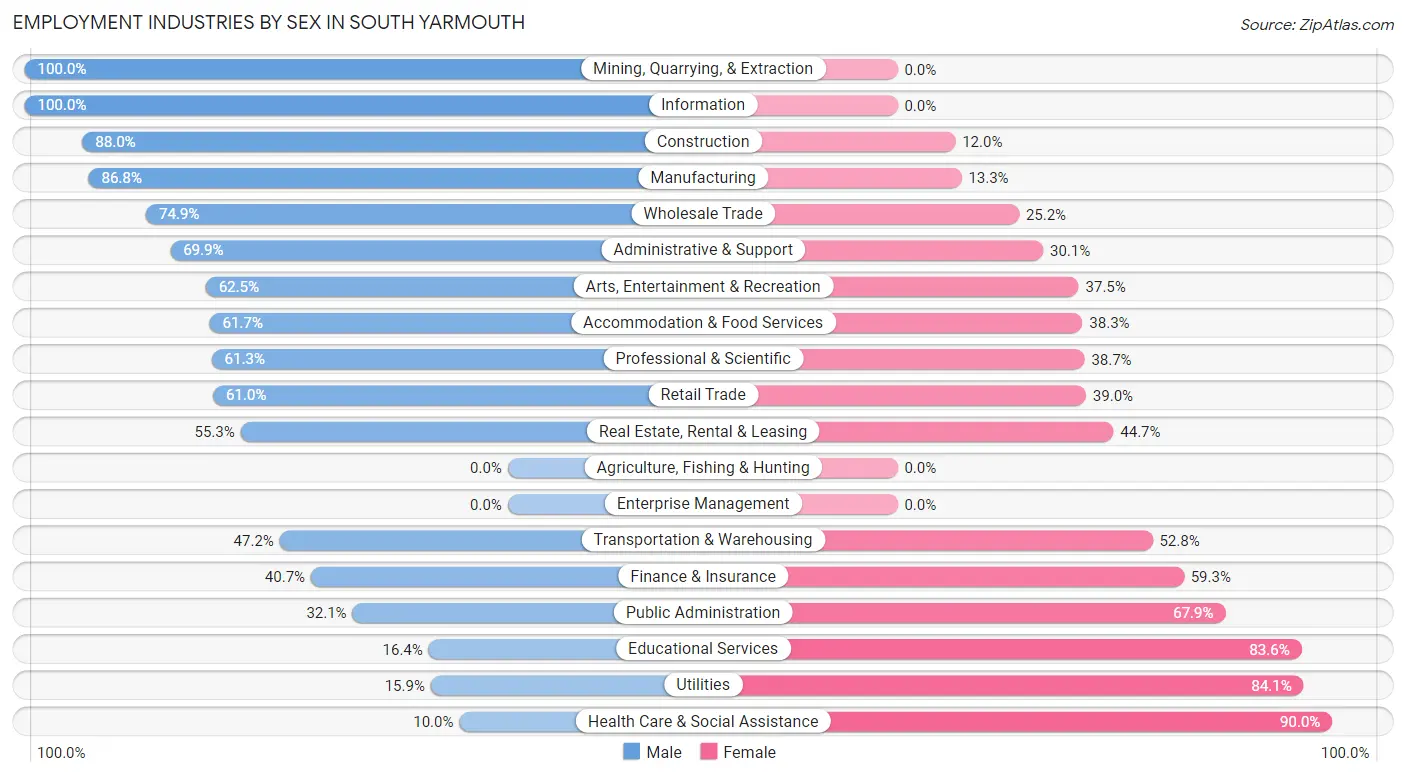
Employment Industries by Sex in South Yarmouth
The South Yarmouth industries that see more men than women are Mining, Quarrying, & Extraction (100.0%), Information (100.0%), and Construction (88.0%), whereas the industries that tend to have a higher number of women are Health Care & Social Assistance (90.0%), Utilities (84.1%), and Educational Services (83.6%).
| Industry | Male | Female |
| Agriculture, Fishing & Hunting | 0 (0.0%) | 0 (0.0%) |
| Mining, Quarrying, & Extraction | 53 (100.0%) | 0 (0.0%) |
| Construction | 706 (88.0%) | 96 (12.0%) |
| Manufacturing | 144 (86.8%) | 22 (13.3%) |
| Wholesale Trade | 125 (74.9%) | 42 (25.2%) |
| Retail Trade | 727 (61.0%) | 465 (39.0%) |
| Transportation & Warehousing | 93 (47.2%) | 104 (52.8%) |
| Utilities | 11 (15.9%) | 58 (84.1%) |
| Information | 29 (100.0%) | 0 (0.0%) |
| Finance & Insurance | 44 (40.7%) | 64 (59.3%) |
| Real Estate, Rental & Leasing | 73 (55.3%) | 59 (44.7%) |
| Professional & Scientific | 114 (61.3%) | 72 (38.7%) |
| Enterprise Management | 0 (0.0%) | 0 (0.0%) |
| Administrative & Support | 146 (69.9%) | 63 (30.1%) |
| Educational Services | 56 (16.4%) | 286 (83.6%) |
| Health Care & Social Assistance | 97 (10.0%) | 871 (90.0%) |
| Arts, Entertainment & Recreation | 105 (62.5%) | 63 (37.5%) |
| Accommodation & Food Services | 324 (61.7%) | 201 (38.3%) |
| Public Administration | 18 (32.1%) | 38 (67.9%) |
| Total | 3,096 (54.7%) | 2,566 (45.3%) |
Education in South Yarmouth
School Enrollment in South Yarmouth
The most common levels of schooling among the 1,829 students in South Yarmouth are college / undergraduate (445 | 24.3%), high school (381 | 20.8%), and elementary school (299 | 16.4%).
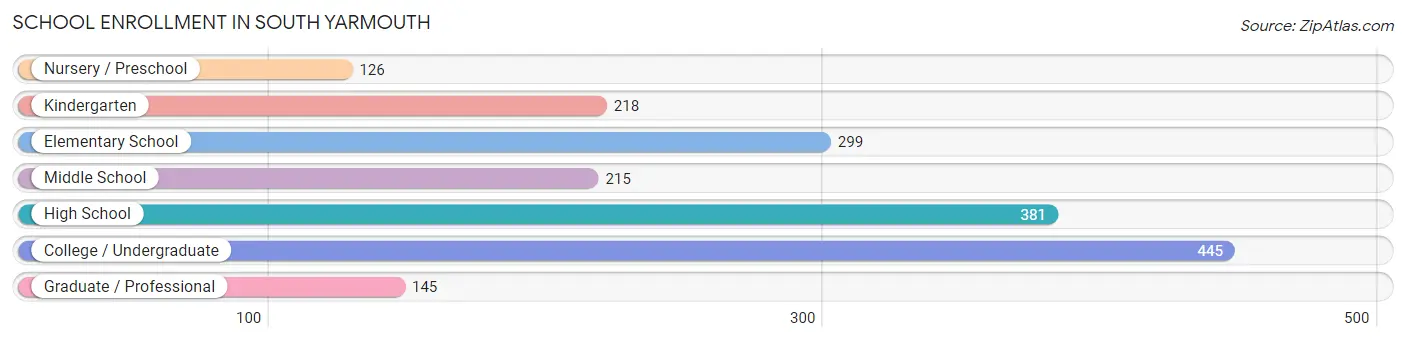
| School Level | # Students | % Students |
| Nursery / Preschool | 126 | 6.9% |
| Kindergarten | 218 | 11.9% |
| Elementary School | 299 | 16.4% |
| Middle School | 215 | 11.8% |
| High School | 381 | 20.8% |
| College / Undergraduate | 445 | 24.3% |
| Graduate / Professional | 145 | 7.9% |
| Total | 1,829 | 100.0% |
School Enrollment by Age by Funding Source in South Yarmouth
Out of a total of 1,829 students who are enrolled in schools in South Yarmouth, 305 (16.7%) attend a private institution, while the remaining 1,524 (83.3%) are enrolled in public schools. The age group of 3 to 4 year olds has the highest likelihood of being enrolled in private schools, with 55 (56.1% in the age bracket) enrolled. Conversely, the age group of 20 to 24 year olds has the lowest likelihood of being enrolled in a private school, with 223 (100.0% in the age bracket) attending a public institution.
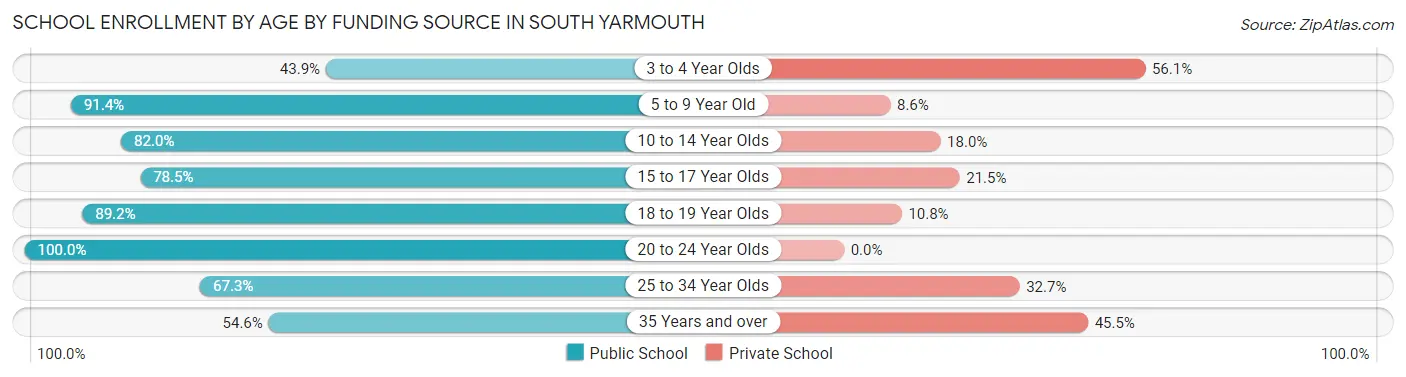
| Age Bracket | Public School | Private School |
| 3 to 4 Year Olds | 43 (43.9%) | 55 (56.1%) |
| 5 to 9 Year Old | 455 (91.4%) | 43 (8.6%) |
| 10 to 14 Year Olds | 210 (82.0%) | 46 (18.0%) |
| 15 to 17 Year Olds | 244 (78.5%) | 67 (21.5%) |
| 18 to 19 Year Olds | 224 (89.2%) | 27 (10.8%) |
| 20 to 24 Year Olds | 223 (100.0%) | 0 (0.0%) |
| 25 to 34 Year Olds | 107 (67.3%) | 52 (32.7%) |
| 35 Years and over | 18 (54.5%) | 15 (45.5%) |
| Total | 1,524 (83.3%) | 305 (16.7%) |
Educational Attainment by Field of Study in South Yarmouth
Business (597 | 18.4%), education (559 | 17.2%), psychology (305 | 9.4%), science & technology (294 | 9.0%), and liberal arts & history (253 | 7.8%) are the most common fields of study among 3,249 individuals in South Yarmouth who have obtained a bachelor's degree or higher.
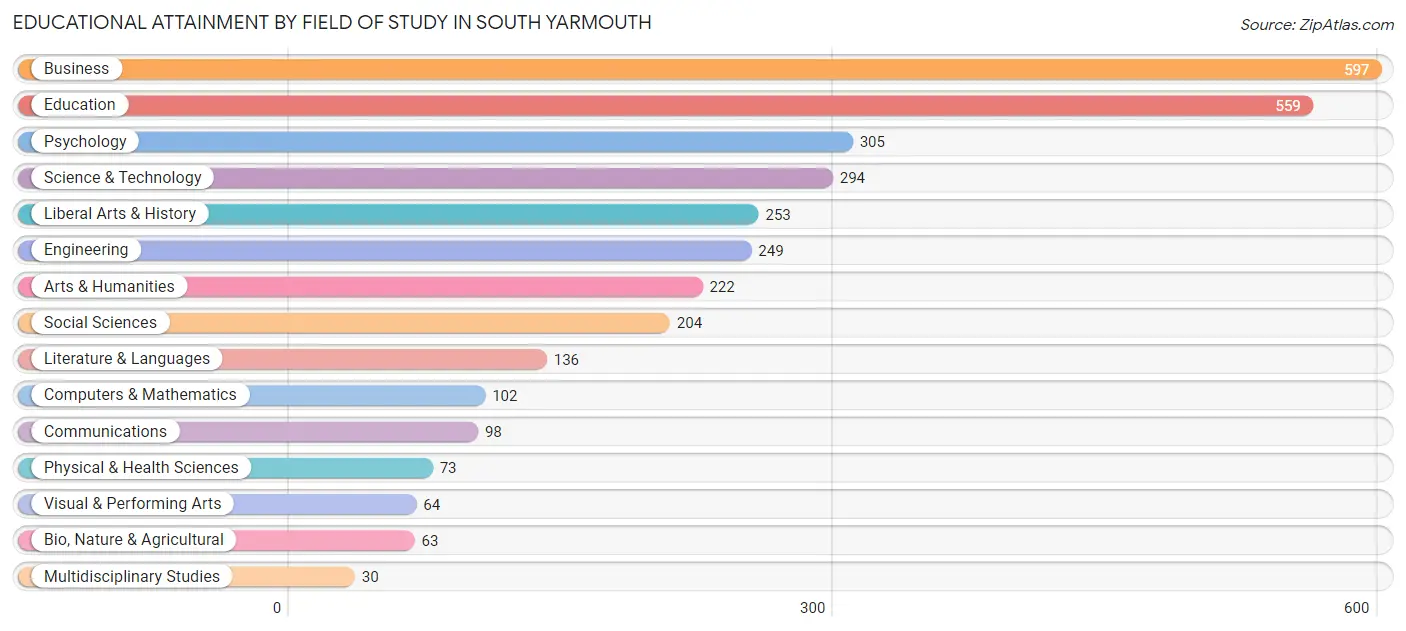
| Field of Study | # Graduates | % Graduates |
| Computers & Mathematics | 102 | 3.1% |
| Bio, Nature & Agricultural | 63 | 1.9% |
| Physical & Health Sciences | 73 | 2.2% |
| Psychology | 305 | 9.4% |
| Social Sciences | 204 | 6.3% |
| Engineering | 249 | 7.7% |
| Multidisciplinary Studies | 30 | 0.9% |
| Science & Technology | 294 | 9.0% |
| Business | 597 | 18.4% |
| Education | 559 | 17.2% |
| Literature & Languages | 136 | 4.2% |
| Liberal Arts & History | 253 | 7.8% |
| Visual & Performing Arts | 64 | 2.0% |
| Communications | 98 | 3.0% |
| Arts & Humanities | 222 | 6.8% |
| Total | 3,249 | 100.0% |
Transportation & Commute in South Yarmouth
Vehicle Availability by Sex in South Yarmouth
The most prevalent vehicle ownership categories in South Yarmouth are males with 2 vehicles (1,306, accounting for 43.9%) and females with 2 vehicles (983, making up 53.1%).
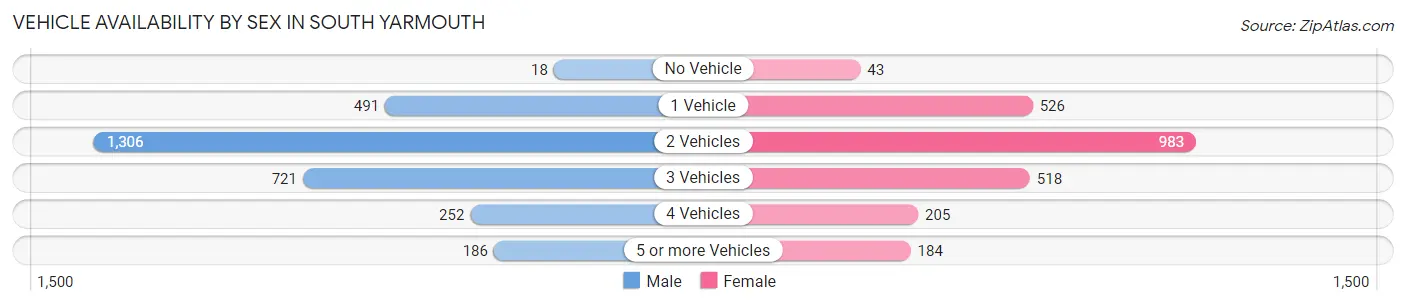
| Vehicles Available | Male | Female |
| No Vehicle | 18 (0.6%) | 43 (1.8%) |
| 1 Vehicle | 491 (16.5%) | 526 (21.4%) |
| 2 Vehicles | 1,306 (43.9%) | 983 (40.0%) |
| 3 Vehicles | 721 (24.2%) | 518 (21.1%) |
| 4 Vehicles | 252 (8.5%) | 205 (8.3%) |
| 5 or more Vehicles | 186 (6.2%) | 184 (7.5%) |
| Total | 2,974 (100.0%) | 2,459 (100.0%) |
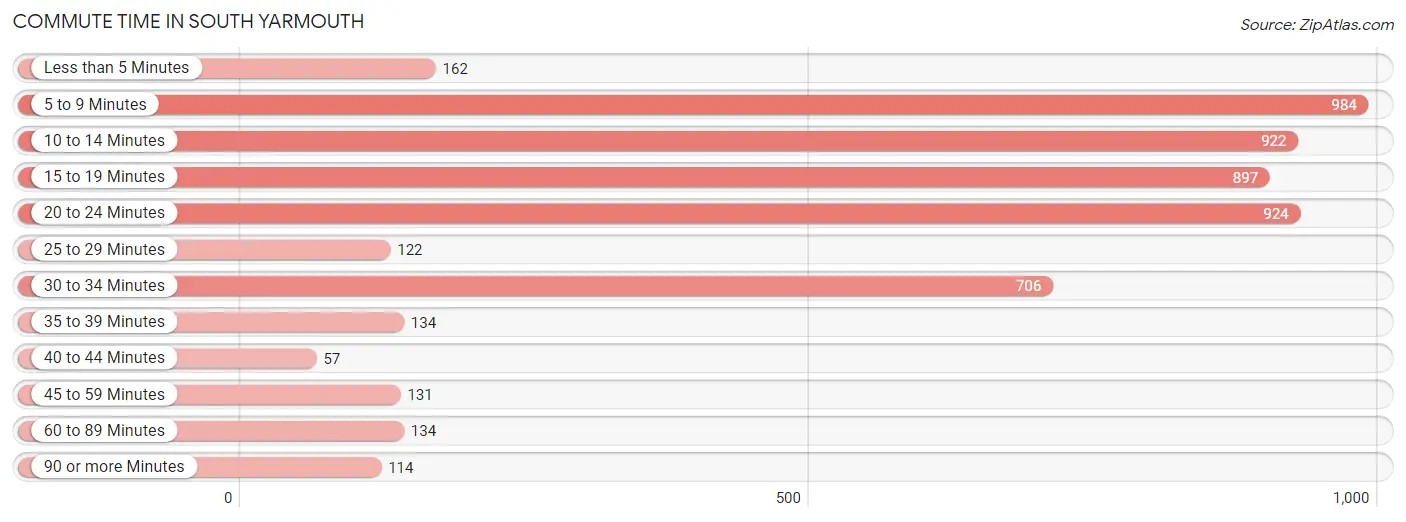
Commute Time in South Yarmouth
The most frequently occuring commute durations in South Yarmouth are 5 to 9 minutes (984 commuters, 18.6%), 20 to 24 minutes (924 commuters, 17.5%), and 10 to 14 minutes (922 commuters, 17.4%).
| Commute Time | # Commuters | % Commuters |
| Less than 5 Minutes | 162 | 3.1% |
| 5 to 9 Minutes | 984 | 18.6% |
| 10 to 14 Minutes | 922 | 17.4% |
| 15 to 19 Minutes | 897 | 17.0% |
| 20 to 24 Minutes | 924 | 17.5% |
| 25 to 29 Minutes | 122 | 2.3% |
| 30 to 34 Minutes | 706 | 13.4% |
| 35 to 39 Minutes | 134 | 2.5% |
| 40 to 44 Minutes | 57 | 1.1% |
| 45 to 59 Minutes | 131 | 2.5% |
| 60 to 89 Minutes | 134 | 2.5% |
| 90 or more Minutes | 114 | 2.2% |
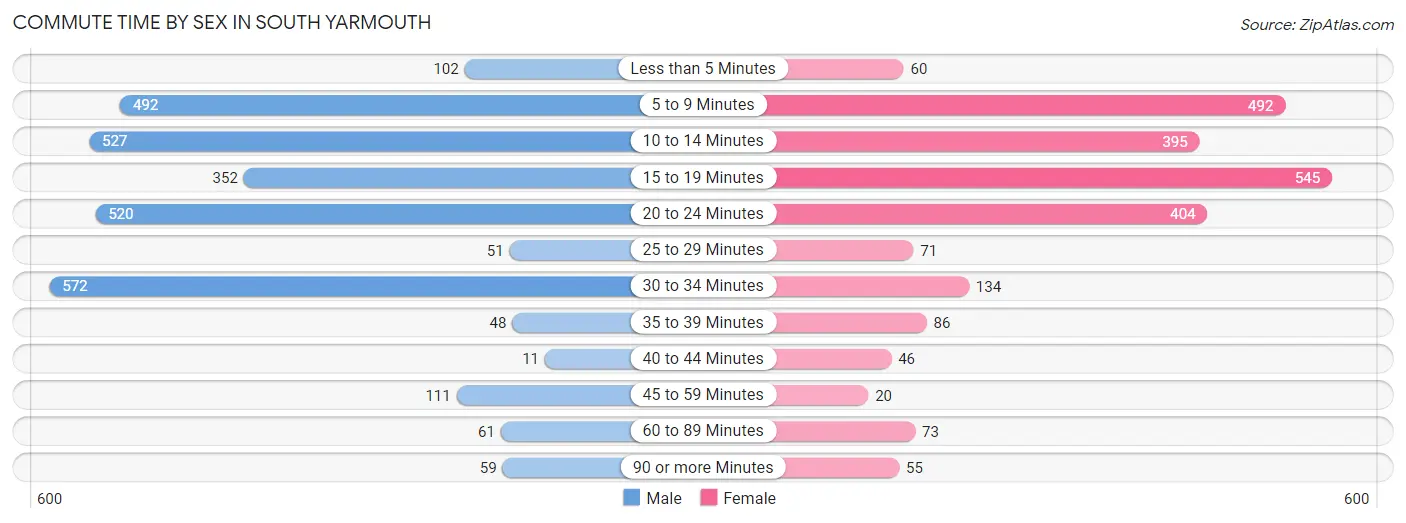
Commute Time by Sex in South Yarmouth
The most common commute times in South Yarmouth are 30 to 34 minutes (572 commuters, 19.7%) for males and 15 to 19 minutes (545 commuters, 22.9%) for females.
| Commute Time | Male | Female |
| Less than 5 Minutes | 102 (3.5%) | 60 (2.5%) |
| 5 to 9 Minutes | 492 (16.9%) | 492 (20.7%) |
| 10 to 14 Minutes | 527 (18.1%) | 395 (16.6%) |
| 15 to 19 Minutes | 352 (12.1%) | 545 (22.9%) |
| 20 to 24 Minutes | 520 (17.9%) | 404 (17.0%) |
| 25 to 29 Minutes | 51 (1.8%) | 71 (3.0%) |
| 30 to 34 Minutes | 572 (19.7%) | 134 (5.6%) |
| 35 to 39 Minutes | 48 (1.7%) | 86 (3.6%) |
| 40 to 44 Minutes | 11 (0.4%) | 46 (1.9%) |
| 45 to 59 Minutes | 111 (3.8%) | 20 (0.8%) |
| 60 to 89 Minutes | 61 (2.1%) | 73 (3.1%) |
| 90 or more Minutes | 59 (2.0%) | 55 (2.3%) |
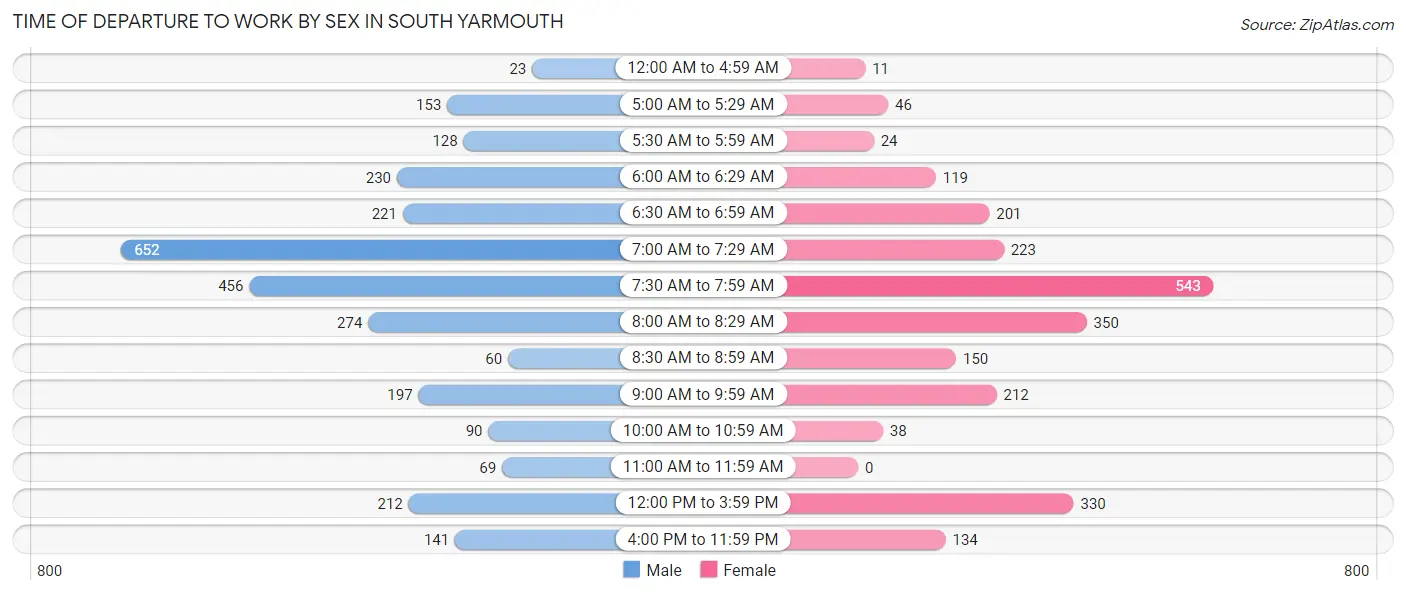
Time of Departure to Work by Sex in South Yarmouth
The most frequent times of departure to work in South Yarmouth are 7:00 AM to 7:29 AM (652, 22.4%) for males and 7:30 AM to 7:59 AM (543, 22.8%) for females.
| Time of Departure | Male | Female |
| 12:00 AM to 4:59 AM | 23 (0.8%) | 11 (0.5%) |
| 5:00 AM to 5:29 AM | 153 (5.3%) | 46 (1.9%) |
| 5:30 AM to 5:59 AM | 128 (4.4%) | 24 (1.0%) |
| 6:00 AM to 6:29 AM | 230 (7.9%) | 119 (5.0%) |
| 6:30 AM to 6:59 AM | 221 (7.6%) | 201 (8.4%) |
| 7:00 AM to 7:29 AM | 652 (22.4%) | 223 (9.4%) |
| 7:30 AM to 7:59 AM | 456 (15.7%) | 543 (22.8%) |
| 8:00 AM to 8:29 AM | 274 (9.4%) | 350 (14.7%) |
| 8:30 AM to 8:59 AM | 60 (2.1%) | 150 (6.3%) |
| 9:00 AM to 9:59 AM | 197 (6.8%) | 212 (8.9%) |
| 10:00 AM to 10:59 AM | 90 (3.1%) | 38 (1.6%) |
| 11:00 AM to 11:59 AM | 69 (2.4%) | 0 (0.0%) |
| 12:00 PM to 3:59 PM | 212 (7.3%) | 330 (13.9%) |
| 4:00 PM to 11:59 PM | 141 (4.9%) | 134 (5.6%) |
| Total | 2,906 (100.0%) | 2,381 (100.0%) |
Housing Occupancy in South Yarmouth
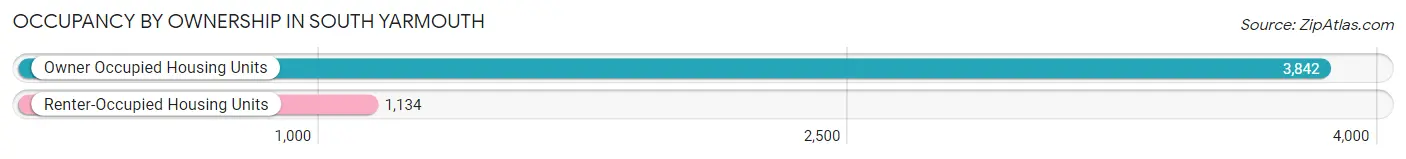
Occupancy by Ownership in South Yarmouth
Of the total 4,976 dwellings in South Yarmouth, owner-occupied units account for 3,842 (77.2%), while renter-occupied units make up 1,134 (22.8%).
| Occupancy | # Housing Units | % Housing Units |
| Owner Occupied Housing Units | 3,842 | 77.2% |
| Renter-Occupied Housing Units | 1,134 | 22.8% |
| Total Occupied Housing Units | 4,976 | 100.0% |
Occupancy by Household Size in South Yarmouth
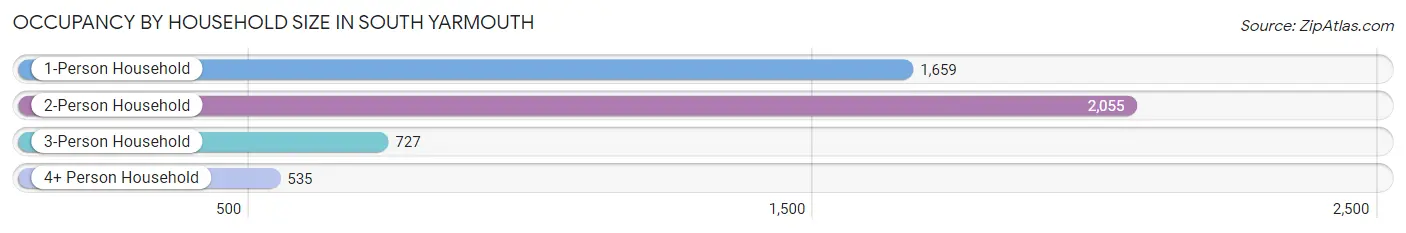
| Household Size | # Housing Units | % Housing Units |
| 1-Person Household | 1,659 | 33.3% |
| 2-Person Household | 2,055 | 41.3% |
| 3-Person Household | 727 | 14.6% |
| 4+ Person Household | 535 | 10.7% |
| Total Housing Units | 4,976 | 100.0% |
Occupancy by Ownership by Household Size in South Yarmouth
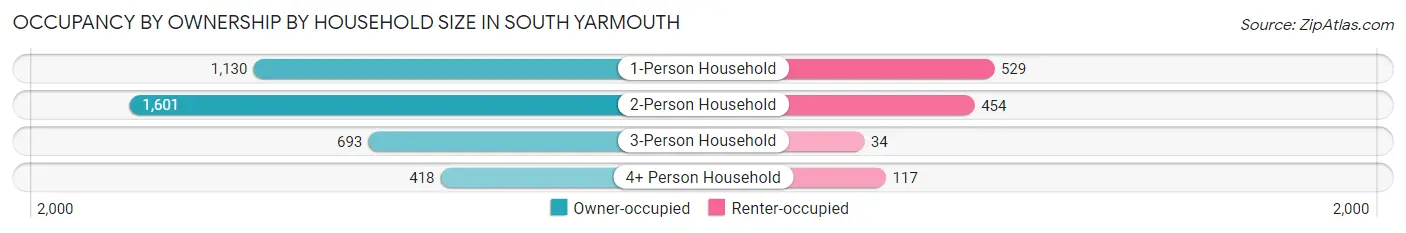
| Household Size | Owner-occupied | Renter-occupied |
| 1-Person Household | 1,130 (68.1%) | 529 (31.9%) |
| 2-Person Household | 1,601 (77.9%) | 454 (22.1%) |
| 3-Person Household | 693 (95.3%) | 34 (4.7%) |
| 4+ Person Household | 418 (78.1%) | 117 (21.9%) |
| Total Housing Units | 3,842 (77.2%) | 1,134 (22.8%) |
Occupancy by Educational Attainment in South Yarmouth
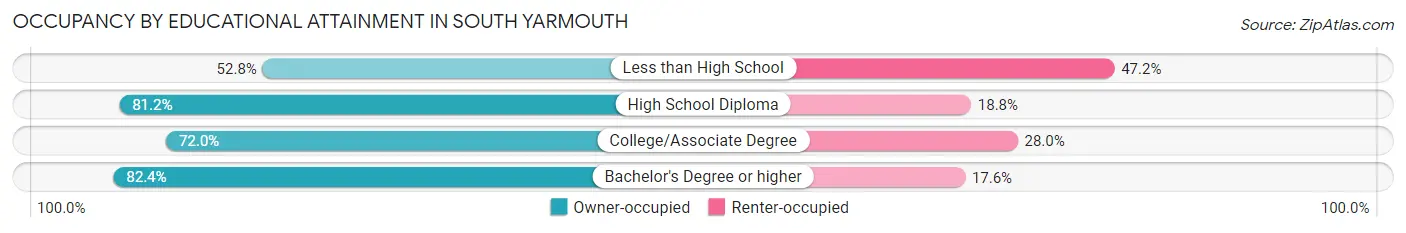
| Household Size | Owner-occupied | Renter-occupied |
| Less than High School | 85 (52.8%) | 76 (47.2%) |
| High School Diploma | 987 (81.2%) | 228 (18.8%) |
| College/Associate Degree | 1,356 (72.0%) | 528 (28.0%) |
| Bachelor's Degree or higher | 1,414 (82.4%) | 302 (17.6%) |
Occupancy by Age of Householder in South Yarmouth
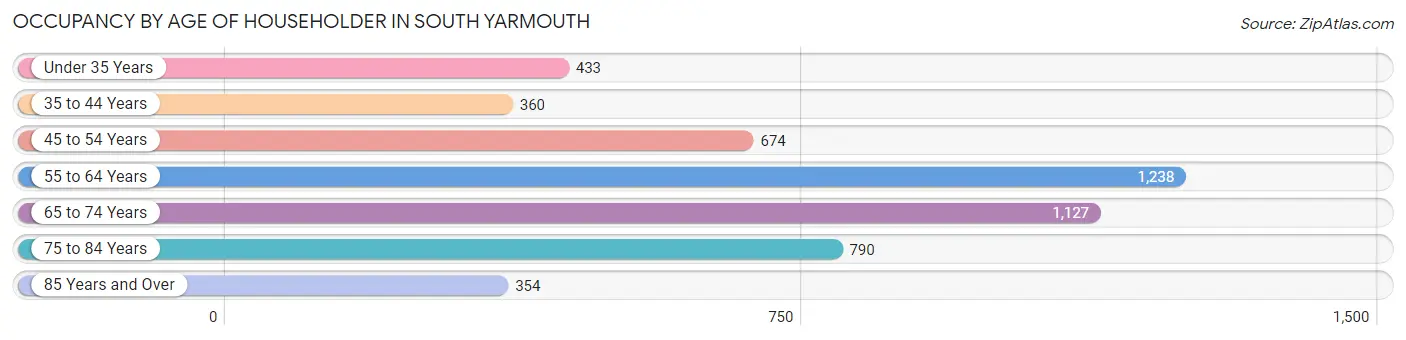
| Age Bracket | # Households | % Households |
| Under 35 Years | 433 | 8.7% |
| 35 to 44 Years | 360 | 7.2% |
| 45 to 54 Years | 674 | 13.6% |
| 55 to 64 Years | 1,238 | 24.9% |
| 65 to 74 Years | 1,127 | 22.7% |
| 75 to 84 Years | 790 | 15.9% |
| 85 Years and Over | 354 | 7.1% |
| Total | 4,976 | 100.0% |
Housing Finances in South Yarmouth
Median Income by Occupancy in South Yarmouth
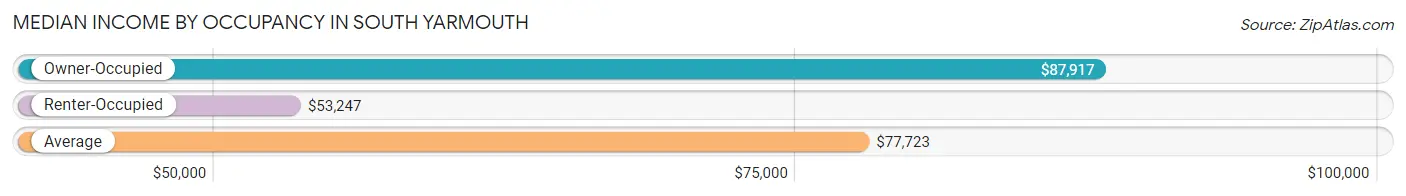
| Occupancy Type | # Households | Median Income |
| Owner-Occupied | 3,842 (77.2%) | $87,917 |
| Renter-Occupied | 1,134 (22.8%) | $53,247 |
| Average | 4,976 (100.0%) | $77,723 |
Occupancy by Householder Income Bracket in South Yarmouth
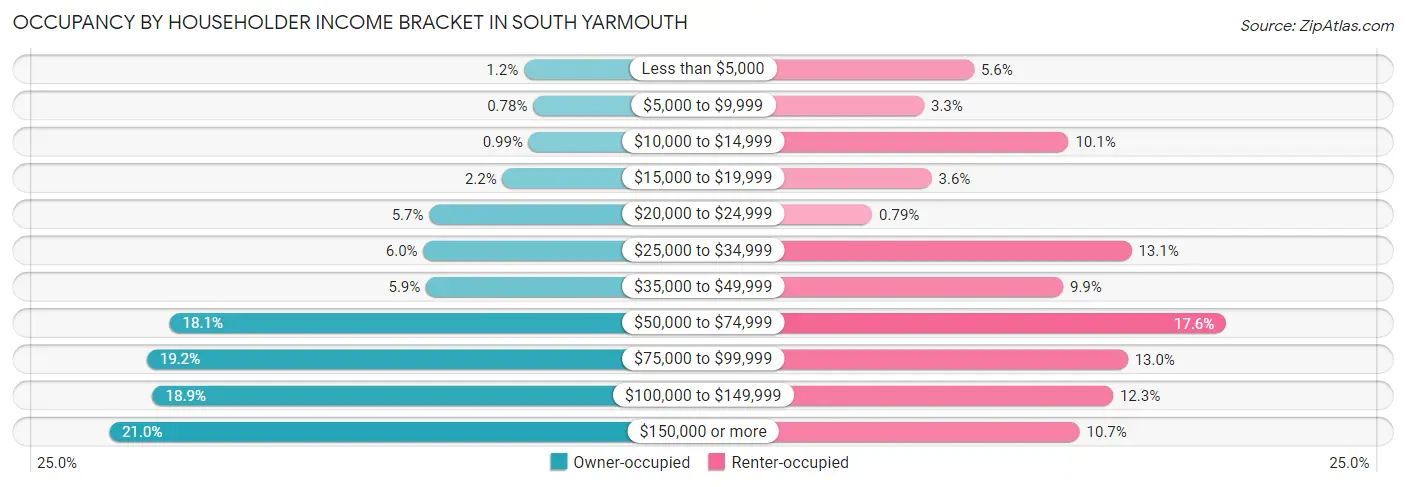
| Income Bracket | Owner-occupied | Renter-occupied |
| Less than $5,000 | 47 (1.2%) | 64 (5.6%) |
| $5,000 to $9,999 | 30 (0.8%) | 37 (3.3%) |
| $10,000 to $14,999 | 38 (1.0%) | 115 (10.1%) |
| $15,000 to $19,999 | 86 (2.2%) | 41 (3.6%) |
| $20,000 to $24,999 | 220 (5.7%) | 9 (0.8%) |
| $25,000 to $34,999 | 231 (6.0%) | 149 (13.1%) |
| $35,000 to $49,999 | 226 (5.9%) | 112 (9.9%) |
| $50,000 to $74,999 | 695 (18.1%) | 200 (17.6%) |
| $75,000 to $99,999 | 737 (19.2%) | 147 (13.0%) |
| $100,000 to $149,999 | 726 (18.9%) | 139 (12.3%) |
| $150,000 or more | 806 (21.0%) | 121 (10.7%) |
| Total | 3,842 (100.0%) | 1,134 (100.0%) |
Monthly Housing Cost Tiers in South Yarmouth
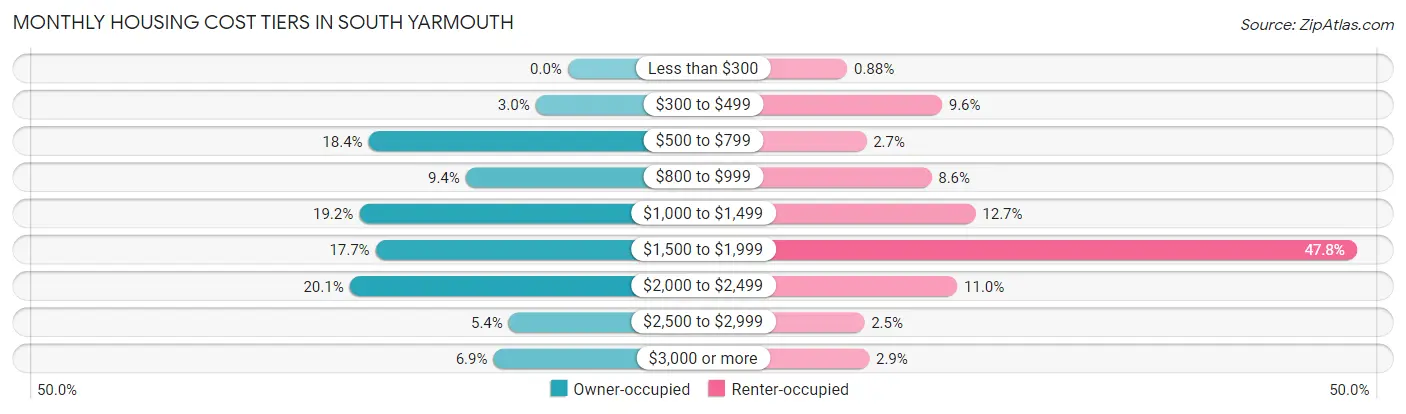
| Monthly Cost | Owner-occupied | Renter-occupied |
| Less than $300 | 0 (0.0%) | 10 (0.9%) |
| $300 to $499 | 114 (3.0%) | 109 (9.6%) |
| $500 to $799 | 705 (18.3%) | 30 (2.6%) |
| $800 to $999 | 361 (9.4%) | 98 (8.6%) |
| $1,000 to $1,499 | 738 (19.2%) | 144 (12.7%) |
| $1,500 to $1,999 | 680 (17.7%) | 542 (47.8%) |
| $2,000 to $2,499 | 772 (20.1%) | 125 (11.0%) |
| $2,500 to $2,999 | 209 (5.4%) | 28 (2.5%) |
| $3,000 or more | 263 (6.9%) | 33 (2.9%) |
| Total | 3,842 (100.0%) | 1,134 (100.0%) |
Physical Housing Characteristics in South Yarmouth
Housing Structures in South Yarmouth
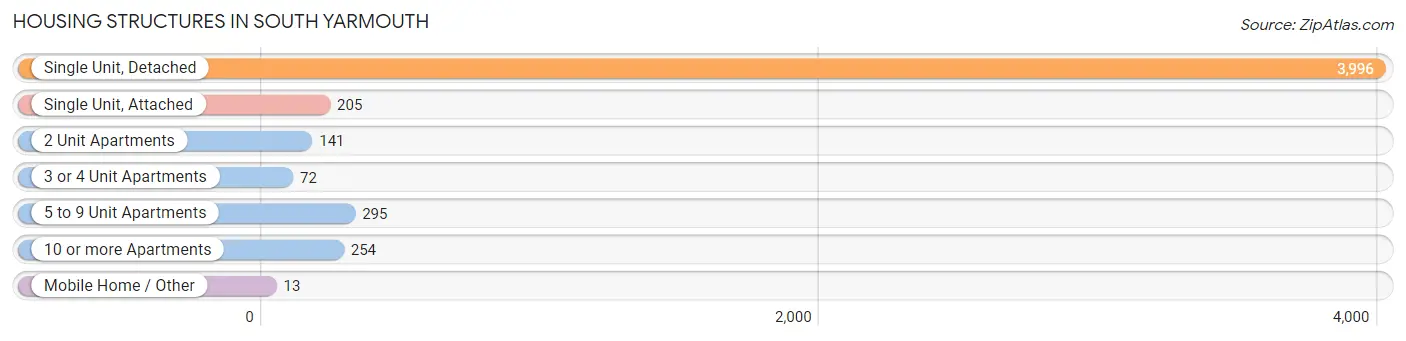
| Structure Type | # Housing Units | % Housing Units |
| Single Unit, Detached | 3,996 | 80.3% |
| Single Unit, Attached | 205 | 4.1% |
| 2 Unit Apartments | 141 | 2.8% |
| 3 or 4 Unit Apartments | 72 | 1.5% |
| 5 to 9 Unit Apartments | 295 | 5.9% |
| 10 or more Apartments | 254 | 5.1% |
| Mobile Home / Other | 13 | 0.3% |
| Total | 4,976 | 100.0% |
Housing Structures by Occupancy in South Yarmouth
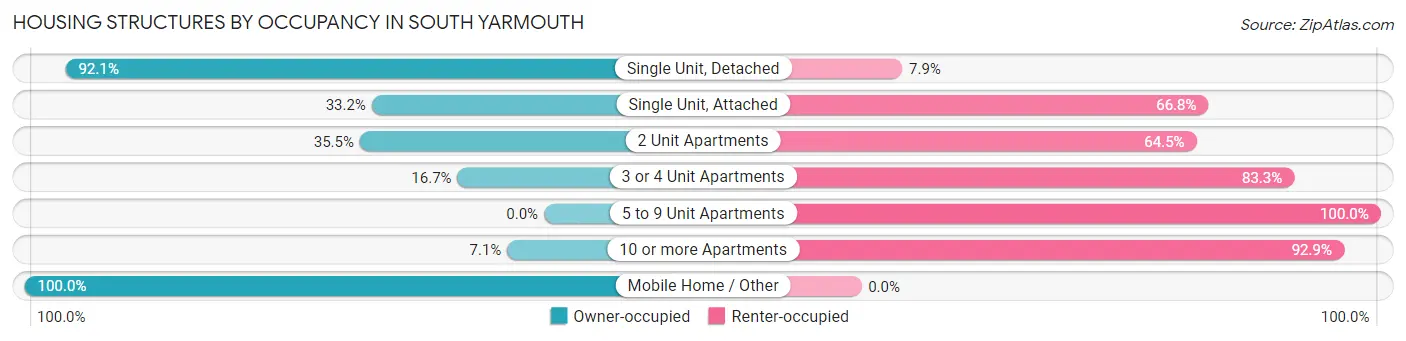
| Structure Type | Owner-occupied | Renter-occupied |
| Single Unit, Detached | 3,681 (92.1%) | 315 (7.9%) |
| Single Unit, Attached | 68 (33.2%) | 137 (66.8%) |
| 2 Unit Apartments | 50 (35.5%) | 91 (64.5%) |
| 3 or 4 Unit Apartments | 12 (16.7%) | 60 (83.3%) |
| 5 to 9 Unit Apartments | 0 (0.0%) | 295 (100.0%) |
| 10 or more Apartments | 18 (7.1%) | 236 (92.9%) |
| Mobile Home / Other | 13 (100.0%) | 0 (0.0%) |
| Total | 3,842 (77.2%) | 1,134 (22.8%) |
Housing Structures by Number of Rooms in South Yarmouth
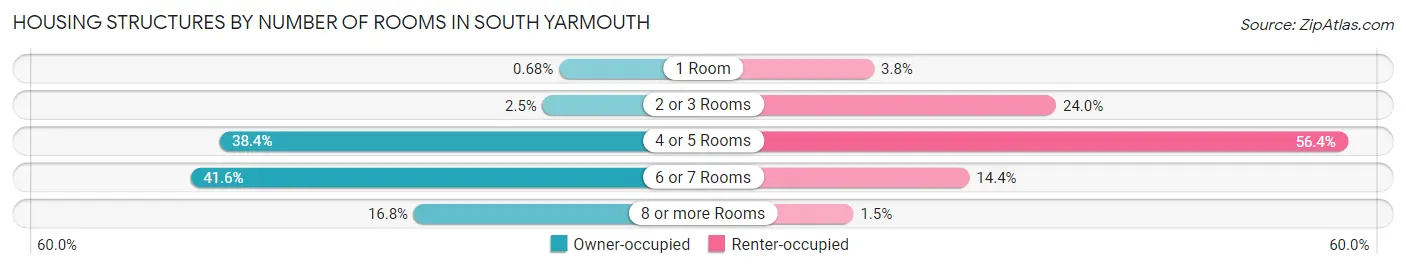
| Number of Rooms | Owner-occupied | Renter-occupied |
| 1 Room | 26 (0.7%) | 43 (3.8%) |
| 2 or 3 Rooms | 96 (2.5%) | 272 (24.0%) |
| 4 or 5 Rooms | 1,476 (38.4%) | 639 (56.4%) |
| 6 or 7 Rooms | 1,599 (41.6%) | 163 (14.4%) |
| 8 or more Rooms | 645 (16.8%) | 17 (1.5%) |
| Total | 3,842 (100.0%) | 1,134 (100.0%) |
Housing Structure by Heating Type in South Yarmouth
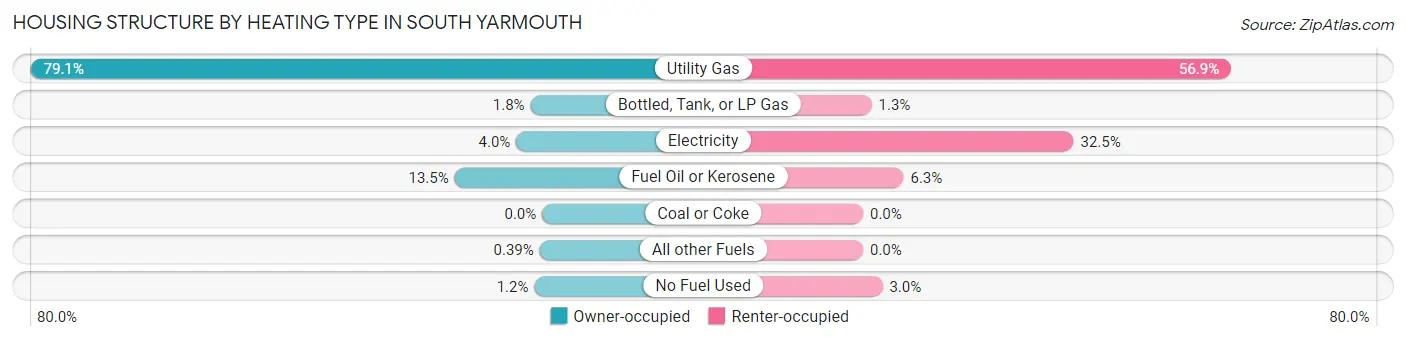
| Heating Type | Owner-occupied | Renter-occupied |
| Utility Gas | 3,038 (79.1%) | 645 (56.9%) |
| Bottled, Tank, or LP Gas | 69 (1.8%) | 15 (1.3%) |
| Electricity | 154 (4.0%) | 369 (32.5%) |
| Fuel Oil or Kerosene | 520 (13.5%) | 71 (6.3%) |
| Coal or Coke | 0 (0.0%) | 0 (0.0%) |
| All other Fuels | 15 (0.4%) | 0 (0.0%) |
| No Fuel Used | 46 (1.2%) | 34 (3.0%) |
| Total | 3,842 (100.0%) | 1,134 (100.0%) |
Household Vehicle Usage in South Yarmouth
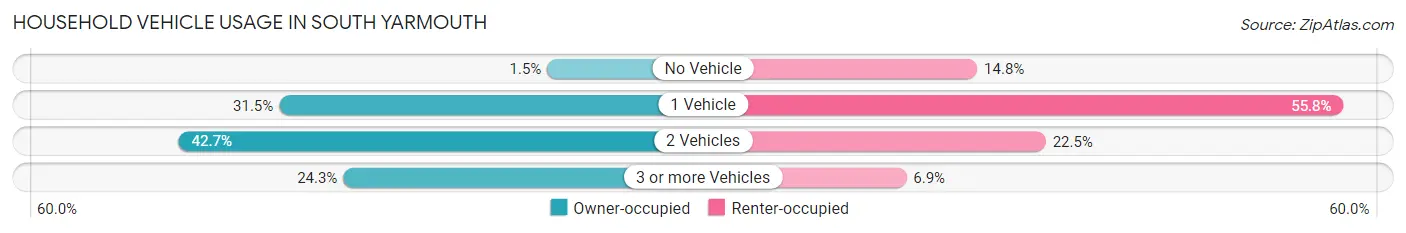
| Vehicles per Household | Owner-occupied | Renter-occupied |
| No Vehicle | 56 (1.5%) | 168 (14.8%) |
| 1 Vehicle | 1,210 (31.5%) | 633 (55.8%) |
| 2 Vehicles | 1,642 (42.7%) | 255 (22.5%) |
| 3 or more Vehicles | 934 (24.3%) | 78 (6.9%) |
| Total | 3,842 (100.0%) | 1,134 (100.0%) |
Real Estate & Mortgages in South Yarmouth
Real Estate and Mortgage Overview in South Yarmouth
| Characteristic | Without Mortgage | With Mortgage |
| Housing Units | 1,447 | 2,395 |
| Median Property Value | $468,500 | $406,000 |
| Median Household Income | $83,107 | $591 |
| Monthly Housing Costs | $842 | $263 |
| Real Estate Taxes | $3,979 | $28 |
Property Value by Mortgage Status in South Yarmouth
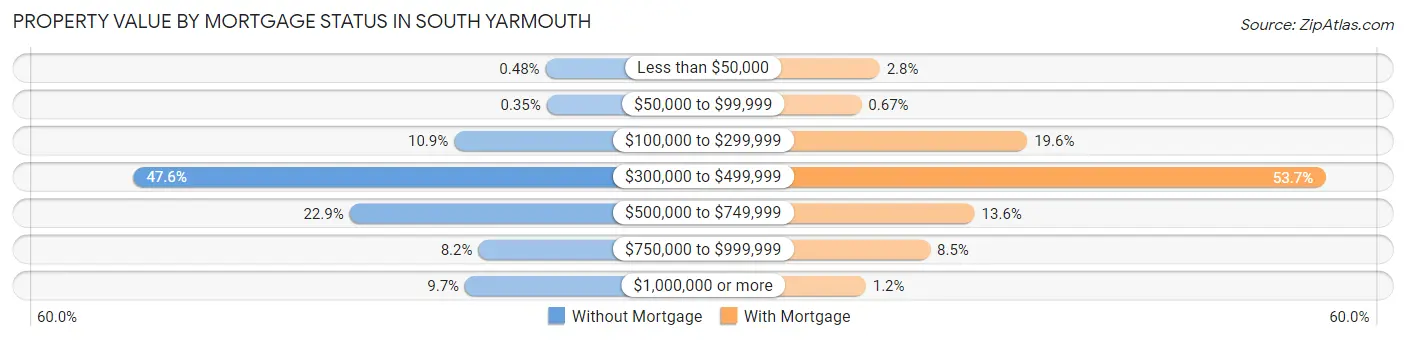
| Property Value | Without Mortgage | With Mortgage |
| Less than $50,000 | 7 (0.5%) | 66 (2.8%) |
| $50,000 to $99,999 | 5 (0.4%) | 16 (0.7%) |
| $100,000 to $299,999 | 158 (10.9%) | 470 (19.6%) |
| $300,000 to $499,999 | 688 (47.5%) | 1,285 (53.6%) |
| $500,000 to $749,999 | 331 (22.9%) | 326 (13.6%) |
| $750,000 to $999,999 | 118 (8.2%) | 204 (8.5%) |
| $1,000,000 or more | 140 (9.7%) | 28 (1.2%) |
| Total | 1,447 (100.0%) | 2,395 (100.0%) |
Household Income by Mortgage Status in South Yarmouth
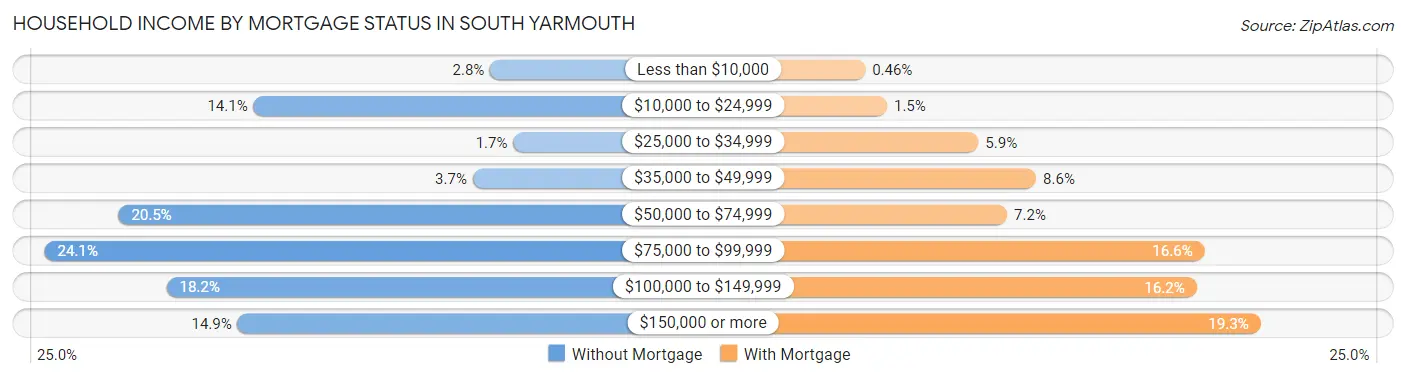
| Household Income | Without Mortgage | With Mortgage |
| Less than $10,000 | 41 (2.8%) | 11 (0.5%) |
| $10,000 to $24,999 | 204 (14.1%) | 36 (1.5%) |
| $25,000 to $34,999 | 25 (1.7%) | 140 (5.9%) |
| $35,000 to $49,999 | 53 (3.7%) | 206 (8.6%) |
| $50,000 to $74,999 | 297 (20.5%) | 173 (7.2%) |
| $75,000 to $99,999 | 348 (24.0%) | 398 (16.6%) |
| $100,000 to $149,999 | 264 (18.2%) | 389 (16.2%) |
| $150,000 or more | 215 (14.9%) | 462 (19.3%) |
| Total | 1,447 (100.0%) | 2,395 (100.0%) |
Property Value to Household Income Ratio in South Yarmouth
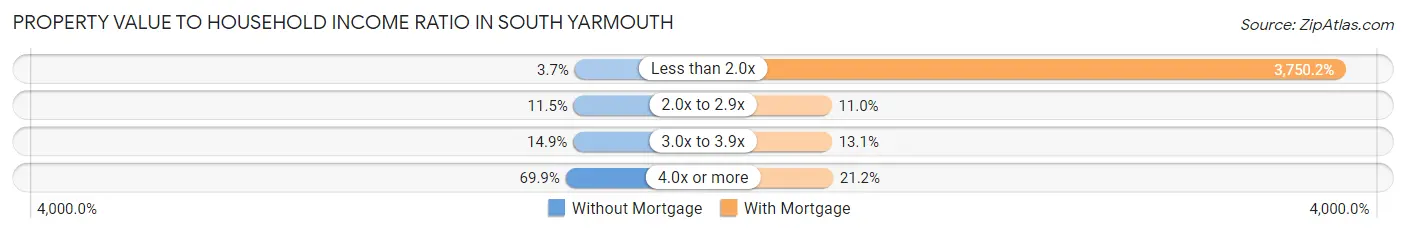
| Value-to-Income Ratio | Without Mortgage | With Mortgage |
| Less than 2.0x | 54 (3.7%) | 89,817 (3,750.2%) |
| 2.0x to 2.9x | 166 (11.5%) | 263 (11.0%) |
| 3.0x to 3.9x | 216 (14.9%) | 314 (13.1%) |
| 4.0x or more | 1,011 (69.9%) | 508 (21.2%) |
| Total | 1,447 (100.0%) | 2,395 (100.0%) |
Real Estate Taxes by Mortgage Status in South Yarmouth
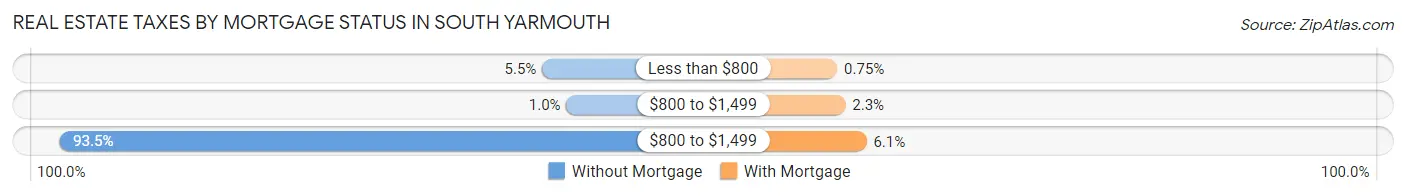
| Property Taxes | Without Mortgage | With Mortgage |
| Less than $800 | 79 (5.5%) | 18 (0.7%) |
| $800 to $1,499 | 15 (1.0%) | 54 (2.2%) |
| $800 to $1,499 | 1,353 (93.5%) | 146 (6.1%) |
| Total | 1,447 (100.0%) | 2,395 (100.0%) |
Health & Disability in South Yarmouth
Health Insurance Coverage by Age in South Yarmouth
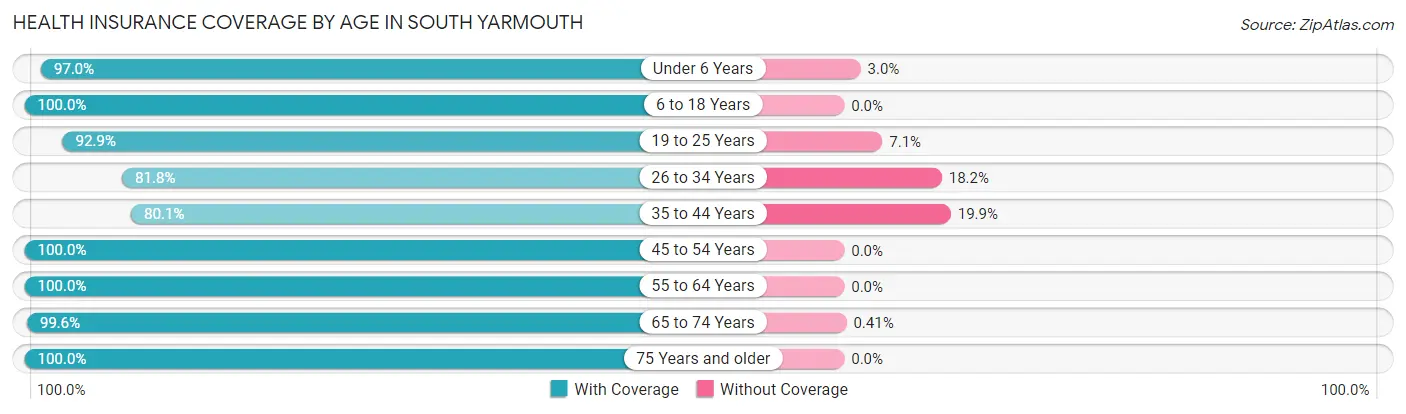
| Age Bracket | With Coverage | Without Coverage |
| Under 6 Years | 638 (97.0%) | 20 (3.0%) |
| 6 to 18 Years | 939 (100.0%) | 0 (0.0%) |
| 19 to 25 Years | 970 (92.9%) | 74 (7.1%) |
| 26 to 34 Years | 918 (81.8%) | 204 (18.2%) |
| 35 to 44 Years | 819 (80.1%) | 203 (19.9%) |
| 45 to 54 Years | 1,211 (100.0%) | 0 (0.0%) |
| 55 to 64 Years | 1,980 (100.0%) | 0 (0.0%) |
| 65 to 74 Years | 1,925 (99.6%) | 8 (0.4%) |
| 75 Years and older | 1,701 (100.0%) | 0 (0.0%) |
| Total | 11,101 (95.6%) | 509 (4.4%) |
Health Insurance Coverage by Citizenship Status in South Yarmouth
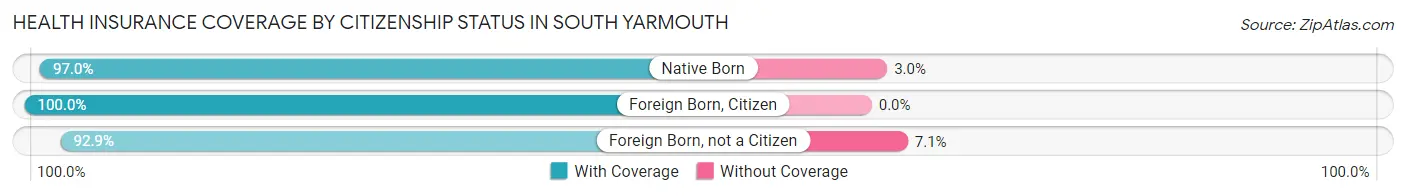
| Citizenship Status | With Coverage | Without Coverage |
| Native Born | 638 (97.0%) | 20 (3.0%) |
| Foreign Born, Citizen | 939 (100.0%) | 0 (0.0%) |
| Foreign Born, not a Citizen | 970 (92.9%) | 74 (7.1%) |
Health Insurance Coverage by Household Income in South Yarmouth
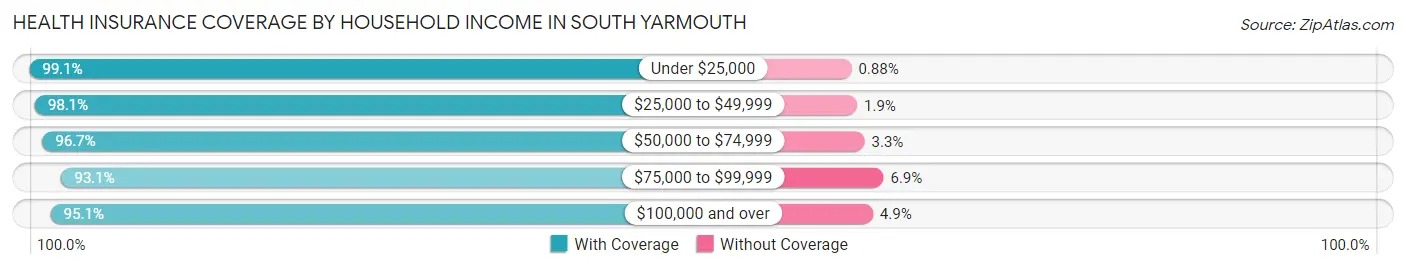
| Household Income | With Coverage | Without Coverage |
| Under $25,000 | 899 (99.1%) | 8 (0.9%) |
| $25,000 to $49,999 | 1,268 (98.1%) | 25 (1.9%) |
| $50,000 to $74,999 | 1,801 (96.7%) | 62 (3.3%) |
| $75,000 to $99,999 | 2,110 (93.1%) | 156 (6.9%) |
| $100,000 and over | 5,018 (95.1%) | 258 (4.9%) |
Public vs Private Health Insurance Coverage by Age in South Yarmouth
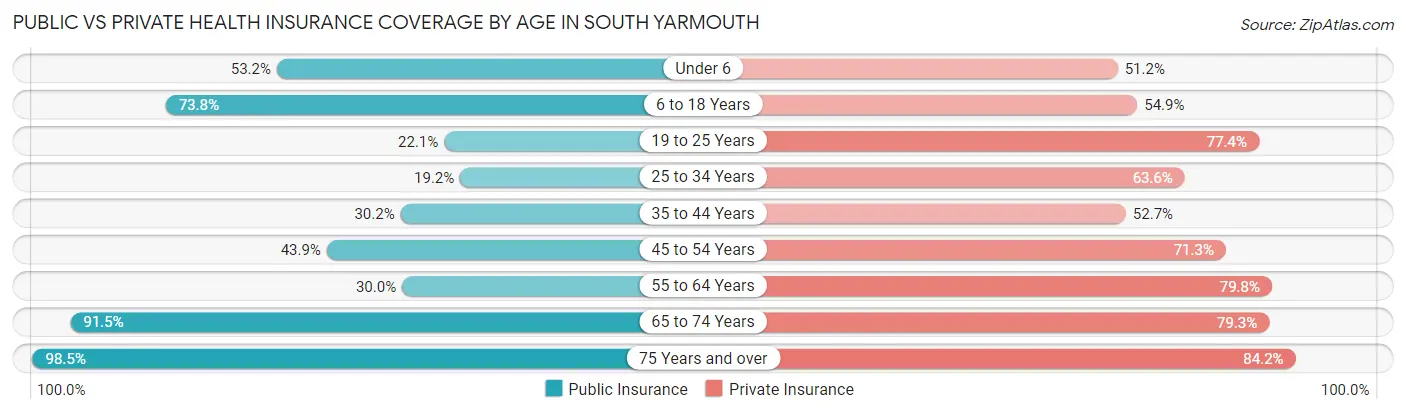
| Age Bracket | Public Insurance | Private Insurance |
| Under 6 | 350 (53.2%) | 337 (51.2%) |
| 6 to 18 Years | 693 (73.8%) | 515 (54.8%) |
| 19 to 25 Years | 231 (22.1%) | 808 (77.4%) |
| 25 to 34 Years | 215 (19.2%) | 714 (63.6%) |
| 35 to 44 Years | 309 (30.2%) | 539 (52.7%) |
| 45 to 54 Years | 532 (43.9%) | 863 (71.3%) |
| 55 to 64 Years | 593 (29.9%) | 1,580 (79.8%) |
| 65 to 74 Years | 1,769 (91.5%) | 1,533 (79.3%) |
| 75 Years and over | 1,676 (98.5%) | 1,432 (84.2%) |
| Total | 6,368 (54.8%) | 8,321 (71.7%) |
Disability Status by Sex by Age in South Yarmouth
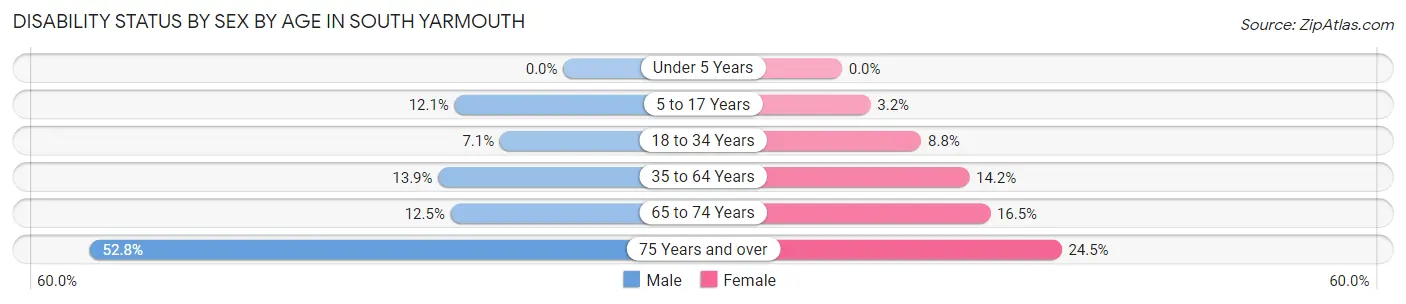
| Age Bracket | Male | Female |
| Under 5 Years | 0 (0.0%) | 0 (0.0%) |
| 5 to 17 Years | 56 (12.1%) | 19 (3.2%) |
| 18 to 34 Years | 100 (7.0%) | 75 (8.8%) |
| 35 to 64 Years | 279 (13.9%) | 313 (14.2%) |
| 65 to 74 Years | 120 (12.5%) | 161 (16.5%) |
| 75 Years and over | 384 (52.7%) | 238 (24.5%) |
Disability Class by Sex by Age in South Yarmouth
Disability Class: Hearing Difficulty
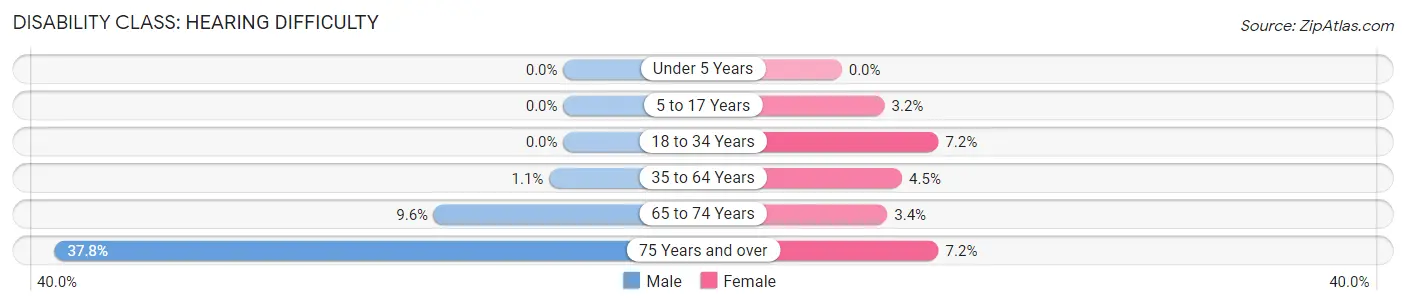
| Age Bracket | Male | Female |
| Under 5 Years | 0 (0.0%) | 0 (0.0%) |
| 5 to 17 Years | 0 (0.0%) | 19 (3.2%) |
| 18 to 34 Years | 0 (0.0%) | 61 (7.2%) |
| 35 to 64 Years | 21 (1.1%) | 99 (4.5%) |
| 65 to 74 Years | 92 (9.6%) | 33 (3.4%) |
| 75 Years and over | 275 (37.8%) | 70 (7.2%) |
Disability Class: Vision Difficulty
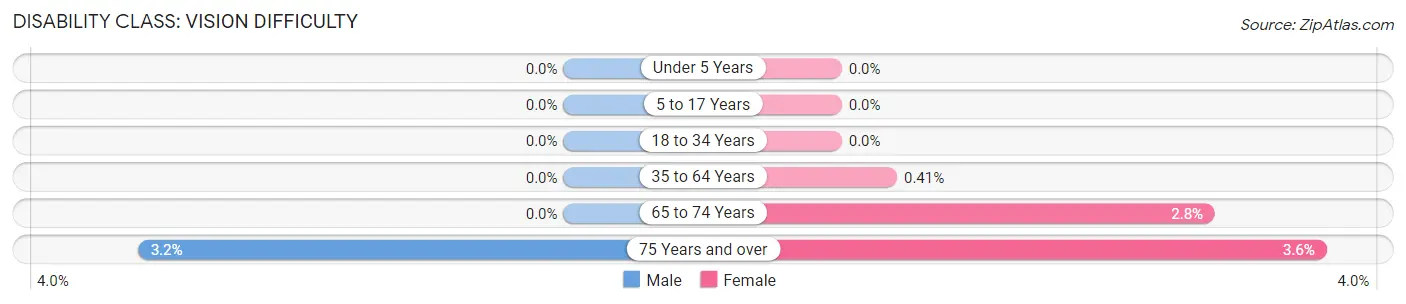
| Age Bracket | Male | Female |
| Under 5 Years | 0 (0.0%) | 0 (0.0%) |
| 5 to 17 Years | 0 (0.0%) | 0 (0.0%) |
| 18 to 34 Years | 0 (0.0%) | 0 (0.0%) |
| 35 to 64 Years | 0 (0.0%) | 9 (0.4%) |
| 65 to 74 Years | 0 (0.0%) | 27 (2.8%) |
| 75 Years and over | 23 (3.2%) | 35 (3.6%) |
Disability Class: Cognitive Difficulty
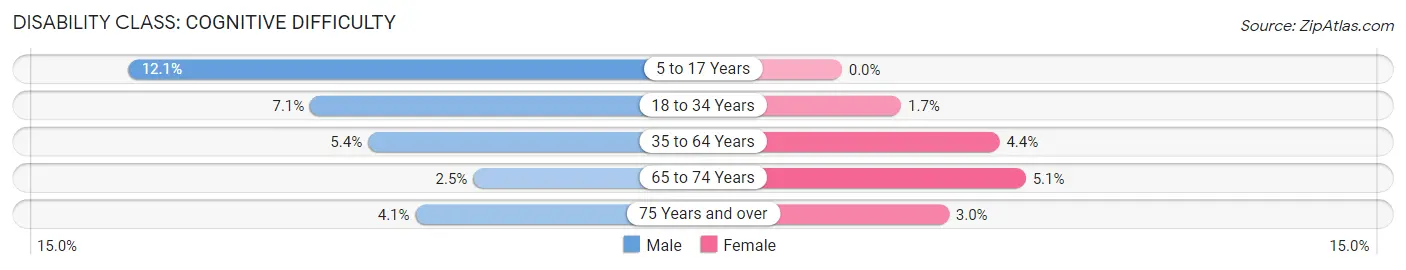
| Age Bracket | Male | Female |
| 5 to 17 Years | 56 (12.1%) | 0 (0.0%) |
| 18 to 34 Years | 100 (7.0%) | 14 (1.7%) |
| 35 to 64 Years | 109 (5.4%) | 97 (4.4%) |
| 65 to 74 Years | 24 (2.5%) | 50 (5.1%) |
| 75 Years and over | 30 (4.1%) | 29 (3.0%) |
Disability Class: Ambulatory Difficulty
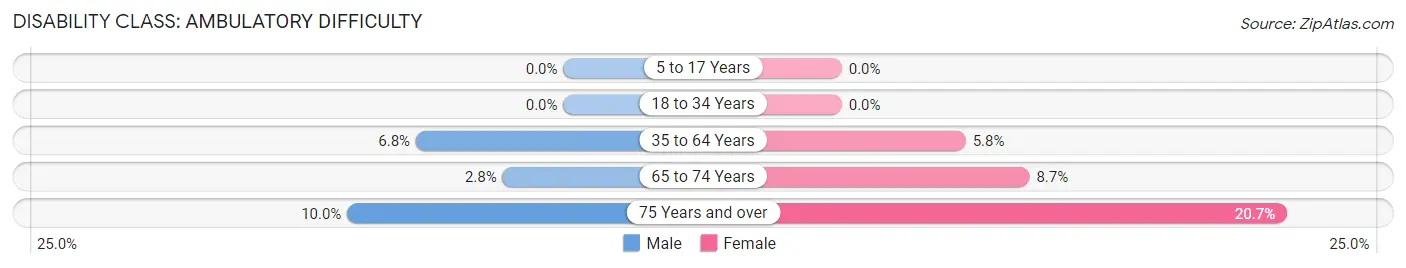
| Age Bracket | Male | Female |
| 5 to 17 Years | 0 (0.0%) | 0 (0.0%) |
| 18 to 34 Years | 0 (0.0%) | 0 (0.0%) |
| 35 to 64 Years | 137 (6.8%) | 127 (5.8%) |
| 65 to 74 Years | 27 (2.8%) | 85 (8.7%) |
| 75 Years and over | 73 (10.0%) | 201 (20.7%) |
Disability Class: Self-Care Difficulty
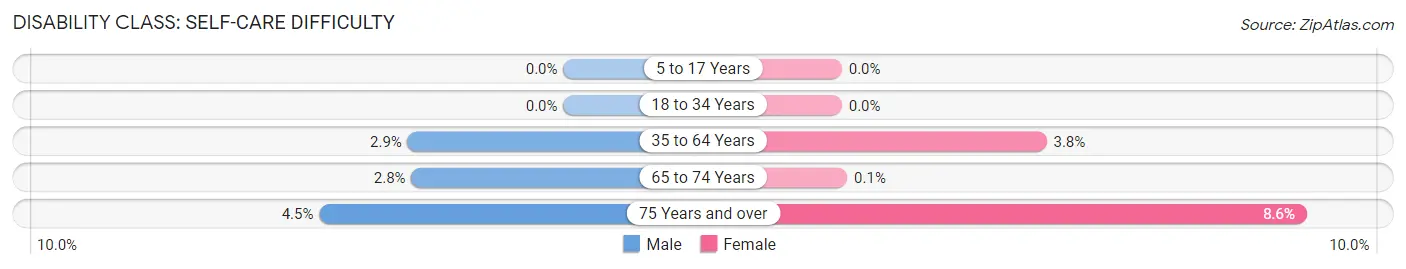
| Age Bracket | Male | Female |
| 5 to 17 Years | 0 (0.0%) | 0 (0.0%) |
| 18 to 34 Years | 0 (0.0%) | 0 (0.0%) |
| 35 to 64 Years | 58 (2.9%) | 84 (3.8%) |
| 65 to 74 Years | 27 (2.8%) | 1 (0.1%) |
| 75 Years and over | 33 (4.5%) | 84 (8.6%) |
Technology Access in South Yarmouth
Computing Device Access in South Yarmouth
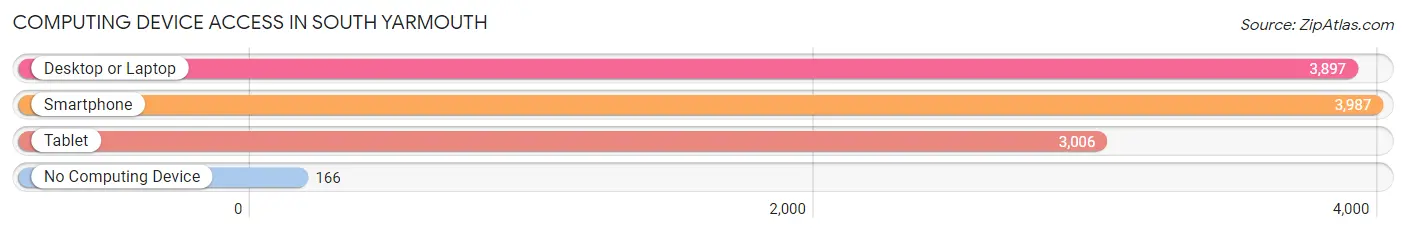
| Device Type | # Households | % Households |
| Desktop or Laptop | 3,897 | 78.3% |
| Smartphone | 3,987 | 80.1% |
| Tablet | 3,006 | 60.4% |
| No Computing Device | 166 | 3.3% |
| Total | 4,976 | 100.0% |
Internet Access in South Yarmouth
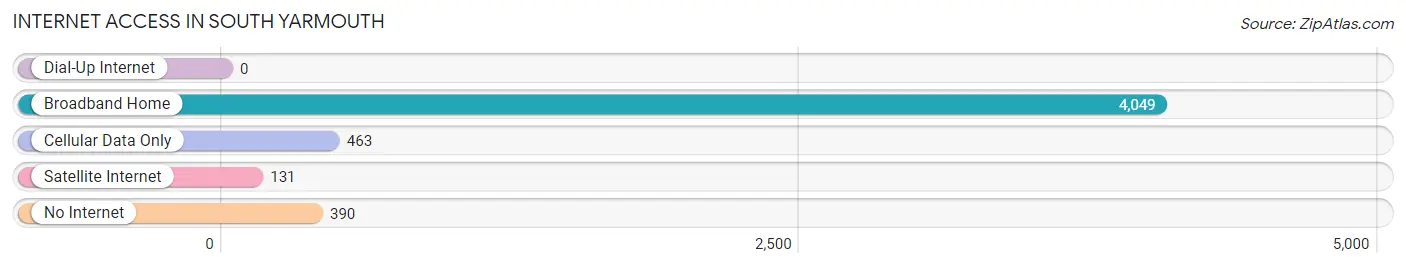
| Internet Type | # Households | % Households |
| Dial-Up Internet | 0 | 0.0% |
| Broadband Home | 4,049 | 81.4% |
| Cellular Data Only | 463 | 9.3% |
| Satellite Internet | 131 | 2.6% |
| No Internet | 390 | 7.8% |
| Total | 4,976 | 100.0% |
South Yarmouth Summary
South Yarmouth is a town located in Barnstable County, Massachusetts, United States. It is located on the south side of Cape Cod, and is bordered by the towns of Yarmouth to the north, Dennis to the east, and Barnstable to the south. The town has a population of approximately 10,000 people, and is a popular tourist destination.
History
South Yarmouth was first settled in 1639 by a group of English settlers from the Plymouth Colony. The town was originally part of the town of Yarmouth, but was incorporated as its own town in 1837. The town was named after the town of Yarmouth in England.
In the 19th century, South Yarmouth was a popular summer resort destination for wealthy Bostonians. The town was home to several large hotels, including the Ocean House, which was built in 1875 and was one of the largest hotels on Cape Cod.
In the 20th century, South Yarmouth became a popular destination for vacationers from all over the United States. The town was home to several amusement parks, including the Sea View Park, which opened in the 1920s and was one of the first amusement parks on Cape Cod.
Geography
South Yarmouth is located on the south side of Cape Cod, and is bordered by the towns of Yarmouth to the north, Dennis to the east, and Barnstable to the south. The town is located on the shores of Nantucket Sound, and is home to several beaches, including South Beach, Sea View Beach, and Bass River Beach.
The town is located in a temperate climate, with warm summers and mild winters. The average temperature in the summer is around 70 degrees Fahrenheit, and the average temperature in the winter is around 40 degrees Fahrenheit.
Economy
South Yarmouth is a popular tourist destination, and the town’s economy is largely based on tourism. The town is home to several hotels, restaurants, and shops, and is also home to several amusement parks, including the Sea View Park.
The town is also home to several marinas, which provide services to boaters from all over the United States. The town is also home to several boatyards, which provide services to boat owners from all over the United States.
Demographics
As of the 2010 census, South Yarmouth had a population of 10,000 people. The town has a median household income of $50,000, and the median age of the population is 45 years old. The town is predominantly white, with approximately 90% of the population being white. The town is also home to a small Hispanic population, with approximately 5% of the population being Hispanic.
Common Questions
What is Per Capita Income in South Yarmouth?
Per Capita income in South Yarmouth is $45,394.
What is the Median Family Income in South Yarmouth?
Median Family Income in South Yarmouth is $91,603.
What is the Median Household income in South Yarmouth?
Median Household Income in South Yarmouth is $77,723.
What is Income or Wage Gap in South Yarmouth?
Income or Wage Gap in South Yarmouth is 5.1%.
Women in South Yarmouth earn 94.9 cents for every dollar earned by a man.
What is Family Income Deficit in South Yarmouth?
Family Income Deficit in South Yarmouth is $10,482.
Families that are below poverty line in South Yarmouth earn $10,482 less on average than the poverty threshold level.
What is Inequality or Gini Index in South Yarmouth?
Inequality or Gini Index in South Yarmouth is 0.43.
What is the Total Population of South Yarmouth?
Total Population of South Yarmouth is 11,805.
What is the Total Male Population of South Yarmouth?
Total Male Population of South Yarmouth is 5,900.
What is the Total Female Population of South Yarmouth?
Total Female Population of South Yarmouth is 5,905.
What is the Ratio of Males per 100 Females in South Yarmouth?
There are 99.92 Males per 100 Females in South Yarmouth.
What is the Ratio of Females per 100 Males in South Yarmouth?
There are 100.08 Females per 100 Males in South Yarmouth.
What is the Median Population Age in South Yarmouth?
Median Population Age in South Yarmouth is 52.9 Years.
What is the Average Family Size in South Yarmouth
Average Family Size in South Yarmouth is 3.0 People.
What is the Average Household Size in South Yarmouth
Average Household Size in South Yarmouth is 2.3 People.
How Large is the Labor Force in South Yarmouth?
There are 6,109 People in the Labor Forcein in South Yarmouth.
What is the Percentage of People in the Labor Force in South Yarmouth?
58.1% of People are in the Labor Force in South Yarmouth.
What is the Unemployment Rate in South Yarmouth?
Unemployment Rate in South Yarmouth is 7.1%.