Pendleton, SC Map & Demographics
Pendleton Map
Pendleton Overview
$41,200
PER CAPITA INCOME
$82,708
AVG FAMILY INCOME
$63,750
AVG HOUSEHOLD INCOME
31.6%
WAGE / INCOME GAP [ % ]
68.4¢/ $1
WAGE / INCOME GAP [ $ ]
$4,984
FAMILY INCOME DEFICIT
0.53
INEQUALITY / GINI INDEX
3,498
TOTAL POPULATION
1,669
MALE POPULATION
1,829
FEMALE POPULATION
91.25
MALES / 100 FEMALES
109.59
FEMALES / 100 MALES
40.7
MEDIAN AGE
2.5
AVG FAMILY SIZE
1.9
AVG HOUSEHOLD SIZE
1,875
LABOR FORCE [ PEOPLE ]
62.0%
PERCENT IN LABOR FORCE
2.9%
UNEMPLOYMENT RATE
Pendleton Zip Codes
Pendleton Area Codes
Income in Pendleton
Income Overview in Pendleton
Per Capita Income in Pendleton is $41,200, while median incomes of families and households are $82,708 and $63,750 respectively.
| Characteristic | Number | Measure |
| Per Capita Income | 3,498 | $41,200 |
| Median Family Income | 846 | $82,708 |
| Mean Family Income | 846 | $129,476 |
| Median Household Income | 1,851 | $63,750 |
| Mean Household Income | 1,851 | $86,898 |
| Income Deficit | 846 | $4,984 |
| Wage / Income Gap (%) | 3,498 | 31.62% |
| Wage / Income Gap ($) | 3,498 | 68.38¢ per $1 |
| Gini / Inequality Index | 3,498 | 0.53 |
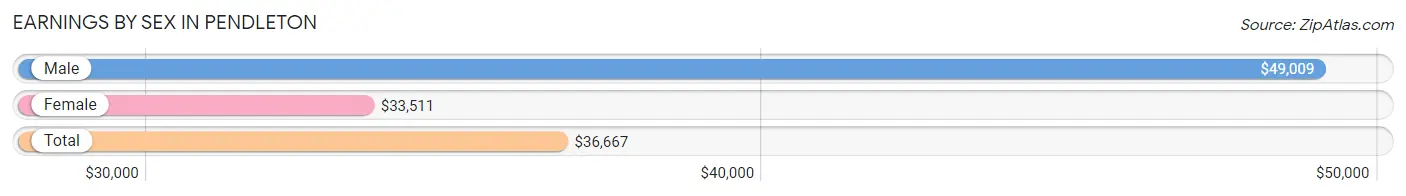
Earnings by Sex in Pendleton
Average Earnings in Pendleton are $36,667, $49,009 for men and $33,511 for women, a difference of 31.6%.
| Sex | Number | Average Earnings |
| Male | 879 (45.6%) | $49,009 |
| Female | 1,047 (54.4%) | $33,511 |
| Total | 1,926 (100.0%) | $36,667 |
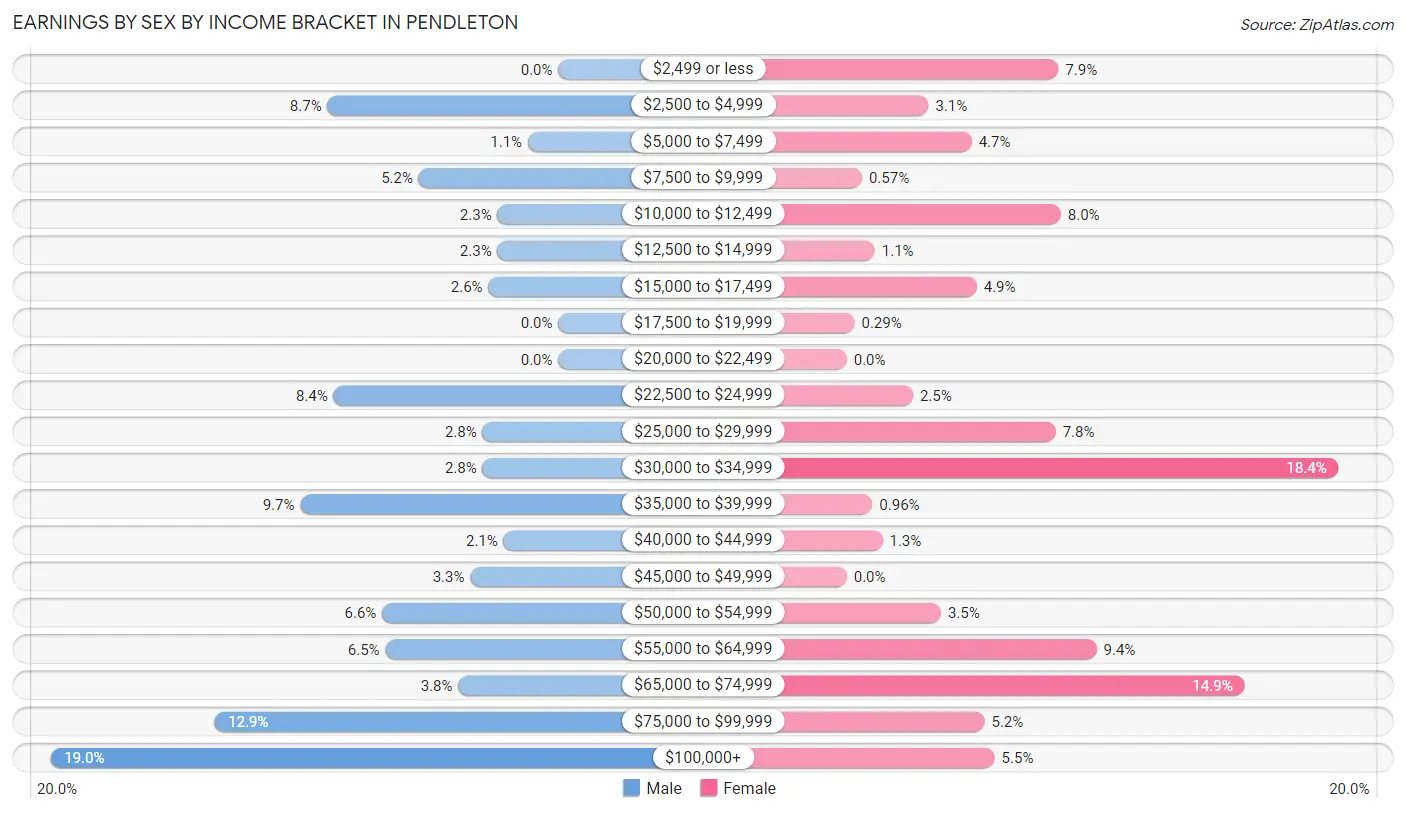
Earnings by Sex by Income Bracket in Pendleton
The most common earnings brackets in Pendleton are $100,000+ for men (167 | 19.0%) and $30,000 to $34,999 for women (193 | 18.4%).
| Income | Male | Female |
| $2,499 or less | 0 (0.0%) | 83 (7.9%) |
| $2,500 to $4,999 | 76 (8.6%) | 32 (3.1%) |
| $5,000 to $7,499 | 10 (1.1%) | 49 (4.7%) |
| $7,500 to $9,999 | 46 (5.2%) | 6 (0.6%) |
| $10,000 to $12,499 | 20 (2.3%) | 84 (8.0%) |
| $12,500 to $14,999 | 20 (2.3%) | 11 (1.1%) |
| $15,000 to $17,499 | 23 (2.6%) | 51 (4.9%) |
| $17,500 to $19,999 | 0 (0.0%) | 3 (0.3%) |
| $20,000 to $22,499 | 0 (0.0%) | 0 (0.0%) |
| $22,500 to $24,999 | 74 (8.4%) | 26 (2.5%) |
| $25,000 to $29,999 | 25 (2.8%) | 82 (7.8%) |
| $30,000 to $34,999 | 25 (2.8%) | 193 (18.4%) |
| $35,000 to $39,999 | 85 (9.7%) | 10 (1.0%) |
| $40,000 to $44,999 | 18 (2.1%) | 14 (1.3%) |
| $45,000 to $49,999 | 29 (3.3%) | 0 (0.0%) |
| $50,000 to $54,999 | 58 (6.6%) | 37 (3.5%) |
| $55,000 to $64,999 | 57 (6.5%) | 98 (9.4%) |
| $65,000 to $74,999 | 33 (3.7%) | 156 (14.9%) |
| $75,000 to $99,999 | 113 (12.9%) | 54 (5.2%) |
| $100,000+ | 167 (19.0%) | 58 (5.5%) |
| Total | 879 (100.0%) | 1,047 (100.0%) |
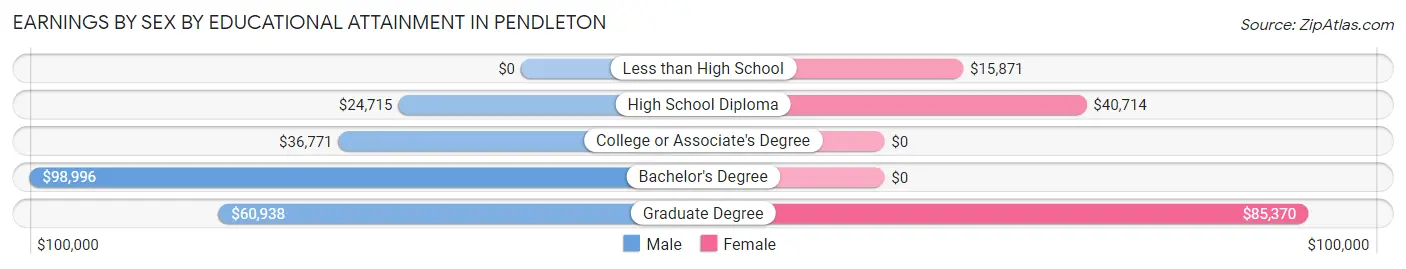
Earnings by Sex by Educational Attainment in Pendleton
Average earnings in Pendleton are $52,944 for men and $41,518 for women, a difference of 21.6%. Men with an educational attainment of bachelor's degree enjoy the highest average annual earnings of $98,996, while those with high school diploma education earn the least with $24,715. Women with an educational attainment of graduate degree earn the most with the average annual earnings of $85,370, while those with less than high school education have the smallest earnings of $15,871.
| Educational Attainment | Male Income | Female Income |
| Less than High School | - | - |
| High School Diploma | $24,715 | $40,714 |
| College or Associate's Degree | $36,771 | $0 |
| Bachelor's Degree | $98,996 | $0 |
| Graduate Degree | $60,938 | $85,370 |
| Total | $52,944 | $41,518 |
Family Income in Pendleton
Family Income Brackets in Pendleton
According to the Pendleton family income data, there are 175 families falling into the $200,000+ income range, which is the most common income bracket and makes up 20.7% of all families. Conversely, the $10,000 to $14,999 income bracket is the least frequent group with only 6 families (0.7%) belonging to this category.
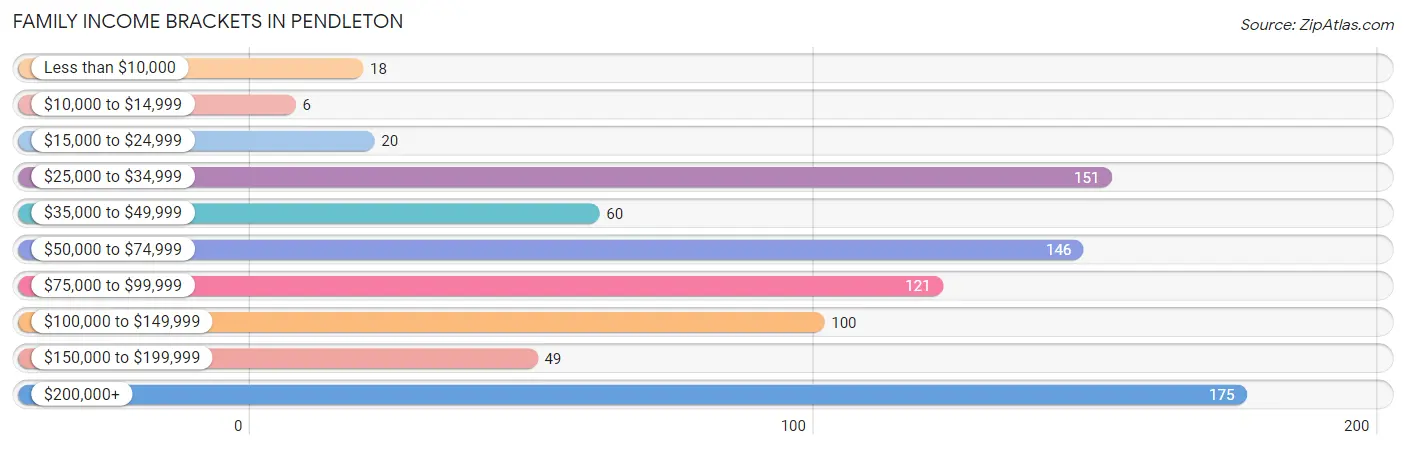
| Income Bracket | # Families | % Families |
| Less than $10,000 | 18 | 2.1% |
| $10,000 to $14,999 | 6 | 0.7% |
| $15,000 to $24,999 | 20 | 2.4% |
| $25,000 to $34,999 | 151 | 17.8% |
| $35,000 to $49,999 | 60 | 7.1% |
| $50,000 to $74,999 | 146 | 17.3% |
| $75,000 to $99,999 | 121 | 14.3% |
| $100,000 to $149,999 | 100 | 11.8% |
| $150,000 to $199,999 | 49 | 5.8% |
| $200,000+ | 175 | 20.7% |
Family Income by Famaliy Size in Pendleton
3-person families (76 | 9.0%) account for the highest median family income in Pendleton with $101,500 per family, while 2-person families (501 | 59.2%) have the highest median income of $48,794 per family member.
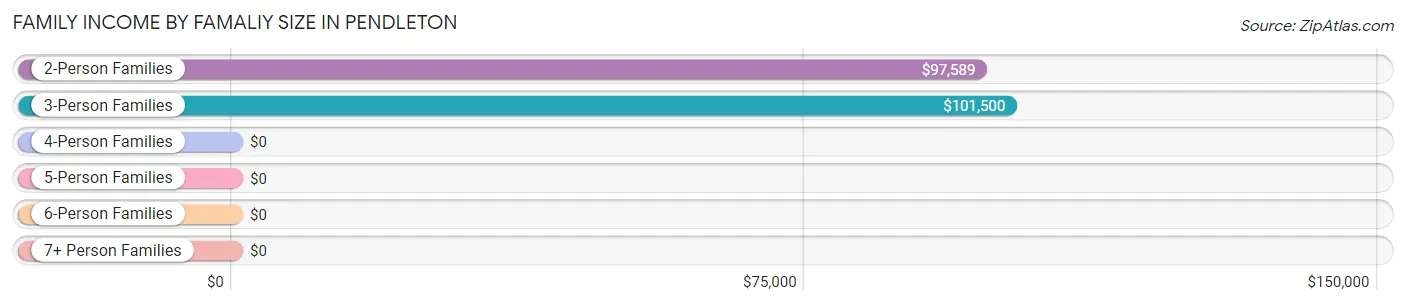
| Income Bracket | # Families | Median Income |
| 2-Person Families | 501 (59.2%) | $97,589 |
| 3-Person Families | 76 (9.0%) | $101,500 |
| 4-Person Families | 215 (25.4%) | $0 |
| 5-Person Families | 51 (6.0%) | $0 |
| 6-Person Families | 0 (0.0%) | $0 |
| 7+ Person Families | 3 (0.4%) | $0 |
| Total | 846 (100.0%) | $82,708 |
Family Income by Number of Earners in Pendleton
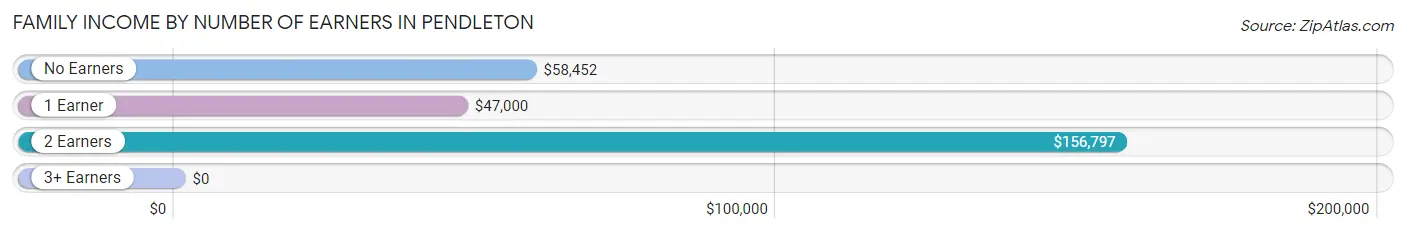
| Number of Earners | # Families | Median Income |
| No Earners | 102 (12.1%) | $58,452 |
| 1 Earner | 386 (45.6%) | $47,000 |
| 2 Earners | 353 (41.7%) | $156,797 |
| 3+ Earners | 5 (0.6%) | $0 |
| Total | 846 (100.0%) | $82,708 |
Household Income in Pendleton
Household Income Brackets in Pendleton
With 378 households falling in the category, the $50,000 to $74,999 income range is the most frequent in Pendleton, accounting for 20.4% of all households. In contrast, only 52 households (2.8%) fall into the $150,000 to $199,999 income bracket, making it the least populous group.
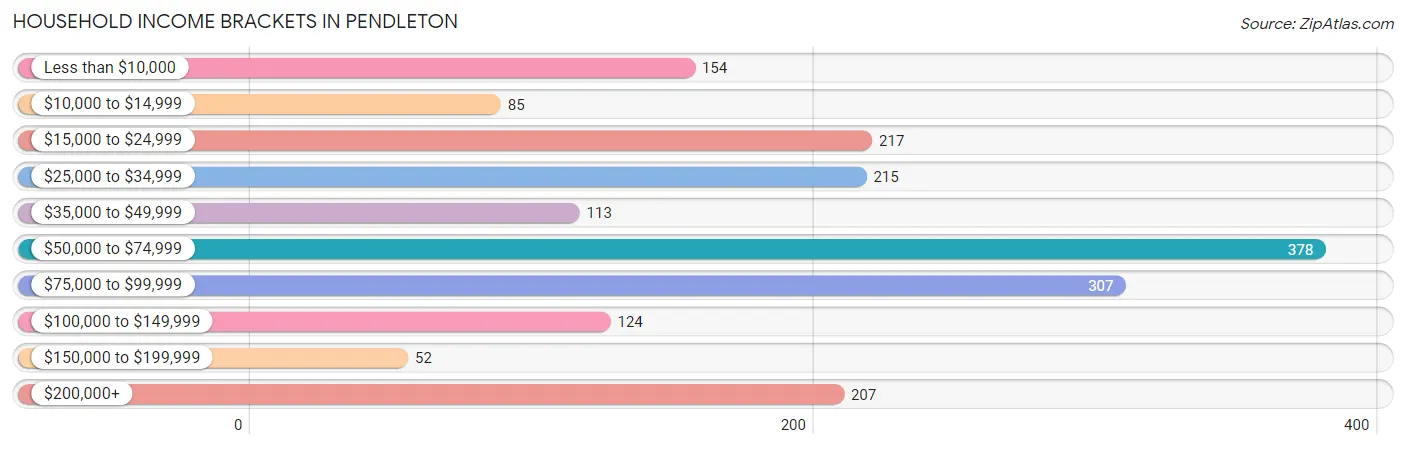
| Income Bracket | # Households | % Households |
| Less than $10,000 | 154 | 8.3% |
| $10,000 to $14,999 | 85 | 4.6% |
| $15,000 to $24,999 | 217 | 11.7% |
| $25,000 to $34,999 | 215 | 11.6% |
| $35,000 to $49,999 | 113 | 6.1% |
| $50,000 to $74,999 | 378 | 20.4% |
| $75,000 to $99,999 | 307 | 16.6% |
| $100,000 to $149,999 | 124 | 6.7% |
| $150,000 to $199,999 | 52 | 2.8% |
| $200,000+ | 207 | 11.2% |
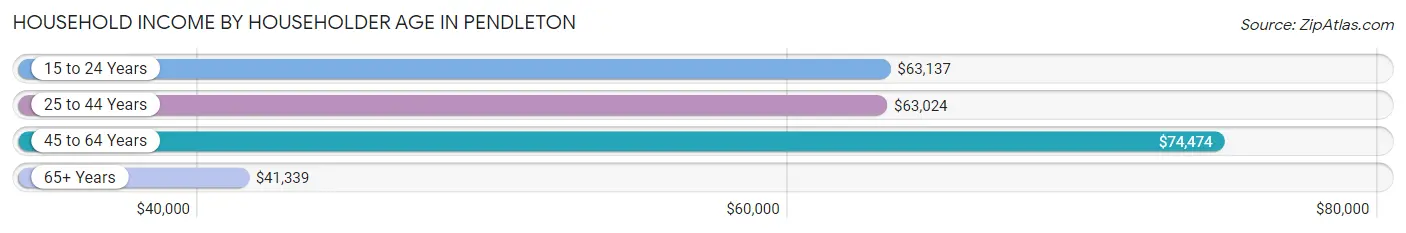
Household Income by Householder Age in Pendleton
The median household income in Pendleton is $63,750, with the highest median household income of $74,474 found in the 45 to 64 years age bracket for the primary householder. A total of 580 households (31.3%) fall into this category. Meanwhile, the 65+ years age bracket for the primary householder has the lowest median household income of $41,339, with 455 households (24.6%) in this group.
| Income Bracket | # Households | Median Income |
| 15 to 24 Years | 191 (10.3%) | $63,137 |
| 25 to 44 Years | 625 (33.8%) | $63,024 |
| 45 to 64 Years | 580 (31.3%) | $74,474 |
| 65+ Years | 455 (24.6%) | $41,339 |
| Total | 1,851 (100.0%) | $63,750 |
Poverty in Pendleton
Income Below Poverty by Sex and Age in Pendleton
With 16.1% poverty level for males and 24.3% for females among the residents of Pendleton, 6 to 11 year old males and 12 to 14 year old females are the most vulnerable to poverty, with 37 males (58.7%) and 20 females (100.0%) in their respective age groups living below the poverty level.
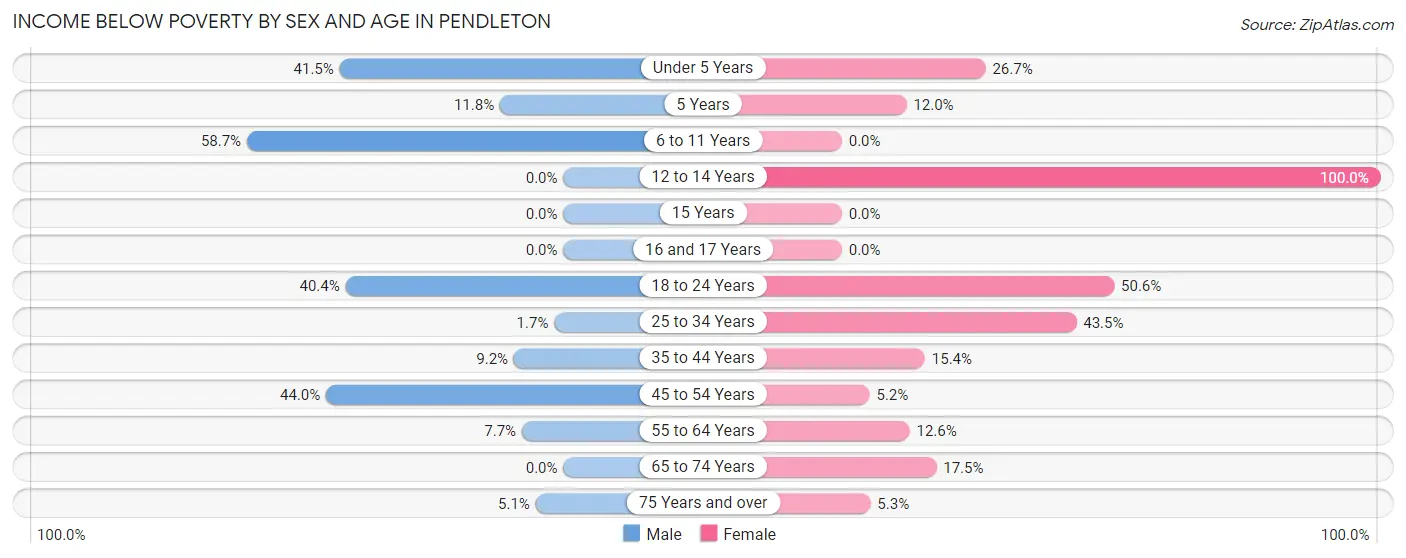
| Age Bracket | Male | Female |
| Under 5 Years | 49 (41.5%) | 16 (26.7%) |
| 5 Years | 4 (11.8%) | 3 (12.0%) |
| 6 to 11 Years | 37 (58.7%) | 0 (0.0%) |
| 12 to 14 Years | 0 (0.0%) | 20 (100.0%) |
| 15 Years | 0 (0.0%) | 0 (0.0%) |
| 16 and 17 Years | 0 (0.0%) | 0 (0.0%) |
| 18 to 24 Years | 76 (40.4%) | 137 (50.5%) |
| 25 to 34 Years | 3 (1.7%) | 158 (43.5%) |
| 35 to 44 Years | 21 (9.2%) | 33 (15.4%) |
| 45 to 54 Years | 59 (44.0%) | 10 (5.1%) |
| 55 to 64 Years | 13 (7.7%) | 42 (12.6%) |
| 65 to 74 Years | 0 (0.0%) | 20 (17.5%) |
| 75 Years and over | 6 (5.1%) | 6 (5.3%) |
| Total | 268 (16.1%) | 445 (24.3%) |
Income Above Poverty by Sex and Age in Pendleton
According to the poverty statistics in Pendleton, males aged 12 to 14 years and females aged 6 to 11 years are the age groups that are most secure financially, with 100.0% of males and 100.0% of females in these age groups living above the poverty line.
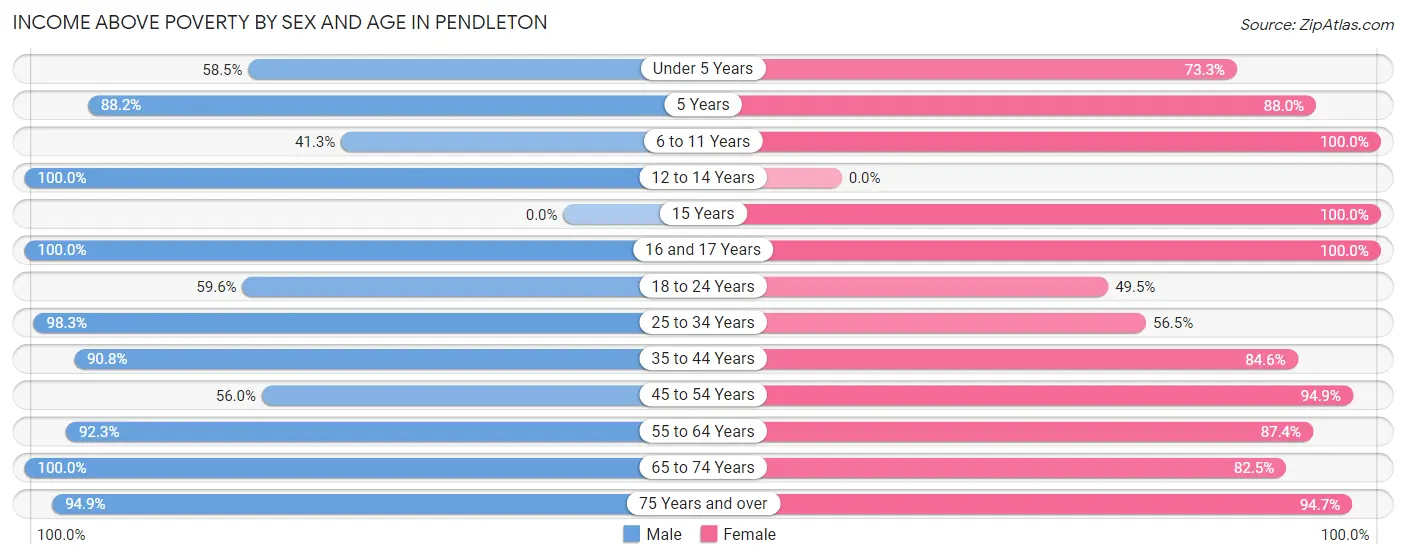
| Age Bracket | Male | Female |
| Under 5 Years | 69 (58.5%) | 44 (73.3%) |
| 5 Years | 30 (88.2%) | 22 (88.0%) |
| 6 to 11 Years | 26 (41.3%) | 33 (100.0%) |
| 12 to 14 Years | 35 (100.0%) | 0 (0.0%) |
| 15 Years | 0 (0.0%) | 86 (100.0%) |
| 16 and 17 Years | 70 (100.0%) | 2 (100.0%) |
| 18 to 24 Years | 112 (59.6%) | 134 (49.4%) |
| 25 to 34 Years | 175 (98.3%) | 205 (56.5%) |
| 35 to 44 Years | 208 (90.8%) | 181 (84.6%) |
| 45 to 54 Years | 75 (56.0%) | 184 (94.9%) |
| 55 to 64 Years | 156 (92.3%) | 292 (87.4%) |
| 65 to 74 Years | 334 (100.0%) | 94 (82.5%) |
| 75 Years and over | 111 (94.9%) | 107 (94.7%) |
| Total | 1,401 (83.9%) | 1,384 (75.7%) |
Income Below Poverty Among Married-Couple Families in Pendleton
The poverty statistics for married-couple families in Pendleton show that 17.3% or 120 of the total 692 families live below the poverty line. Families with 3 or 4 children have the highest poverty rate of 39.2%, comprising of 20 families. On the other hand, families with no children have the lowest poverty rate of 1.6%, which includes 6 families.
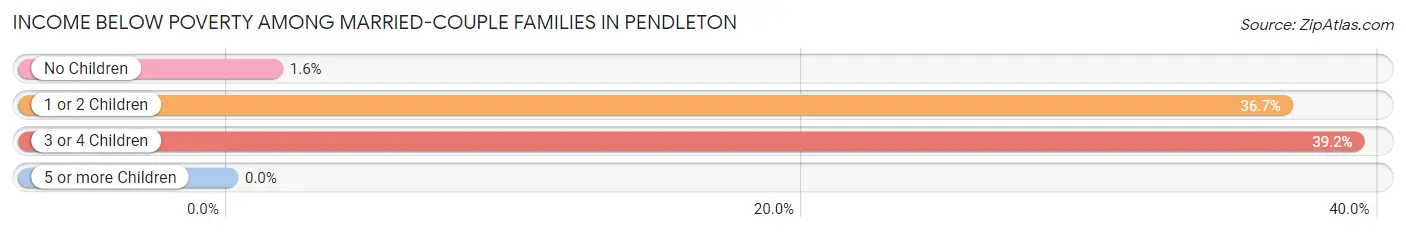
| Children | Above Poverty | Below Poverty |
| No Children | 379 (98.4%) | 6 (1.6%) |
| 1 or 2 Children | 162 (63.3%) | 94 (36.7%) |
| 3 or 4 Children | 31 (60.8%) | 20 (39.2%) |
| 5 or more Children | 0 (0.0%) | 0 (0.0%) |
| Total | 572 (82.7%) | 120 (17.3%) |
Income Below Poverty Among Single-Parent Households in Pendleton
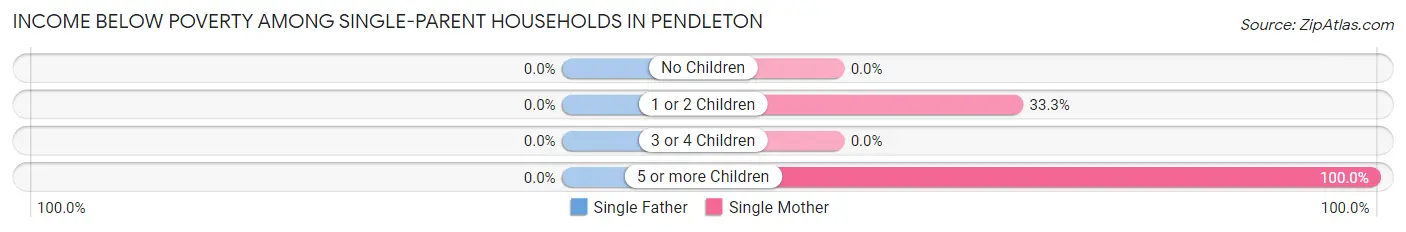
| Children | Single Father | Single Mother |
| No Children | 0 (0.0%) | 0 (0.0%) |
| 1 or 2 Children | 0 (0.0%) | 18 (33.3%) |
| 3 or 4 Children | 0 (0.0%) | 0 (0.0%) |
| 5 or more Children | 0 (0.0%) | 3 (100.0%) |
| Total | 0 (0.0%) | 21 (16.3%) |
Income Below Poverty Among Married-Couple vs Single-Parent Households in Pendleton
The poverty data for Pendleton shows that 120 of the married-couple family households (17.3%) and 21 of the single-parent households (13.6%) are living below the poverty level. Within the married-couple family households, those with 3 or 4 children have the highest poverty rate, with 20 households (39.2%) falling below the poverty line. Among the single-parent households, those with 5 or more children have the highest poverty rate, with 3 household (100.0%) living below poverty.
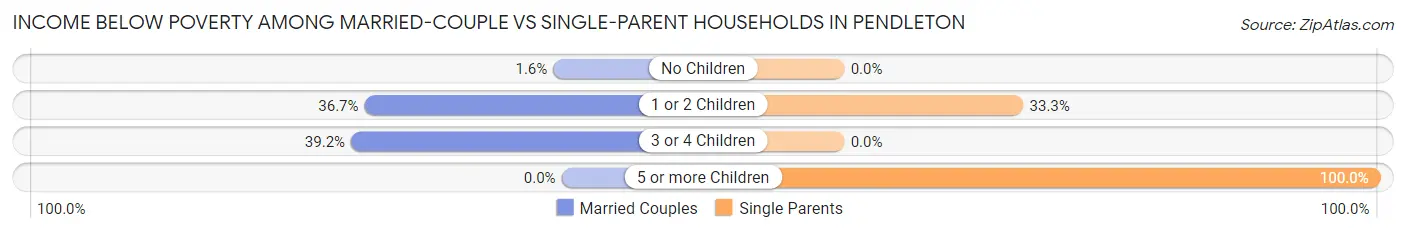
| Children | Married-Couple Families | Single-Parent Households |
| No Children | 6 (1.6%) | 0 (0.0%) |
| 1 or 2 Children | 94 (36.7%) | 18 (33.3%) |
| 3 or 4 Children | 20 (39.2%) | 0 (0.0%) |
| 5 or more Children | 0 (0.0%) | 3 (100.0%) |
| Total | 120 (17.3%) | 21 (13.6%) |
Race in Pendleton
The most populous races in Pendleton are White / Caucasian (2,726 | 77.9%), Black / African American (480 | 13.7%), and Two or more Races (218 | 6.2%).
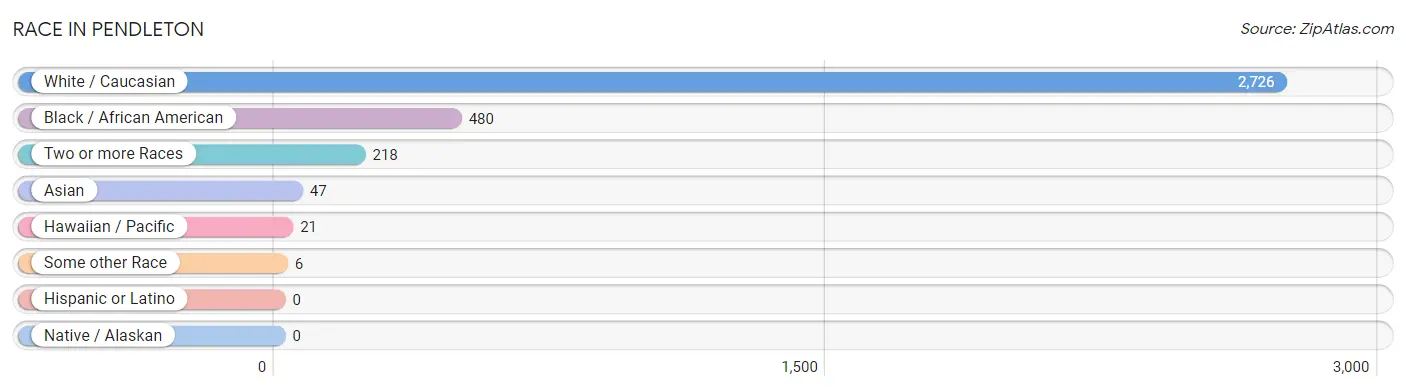
| Race | # Population | % Population |
| Asian | 47 | 1.3% |
| Black / African American | 480 | 13.7% |
| Hawaiian / Pacific | 21 | 0.6% |
| Hispanic or Latino | 0 | 0.0% |
| Native / Alaskan | 0 | 0.0% |
| White / Caucasian | 2,726 | 77.9% |
| Two or more Races | 218 | 6.2% |
| Some other Race | 6 | 0.2% |
| Total | 3,498 | 100.0% |
Ancestry in Pendleton
The most populous ancestries reported in Pendleton are English (704 | 20.1%), German (552 | 15.8%), Scotch-Irish (344 | 9.8%), French (247 | 7.1%), and Scottish (195 | 5.6%), together accounting for 58.4% of all Pendleton residents.
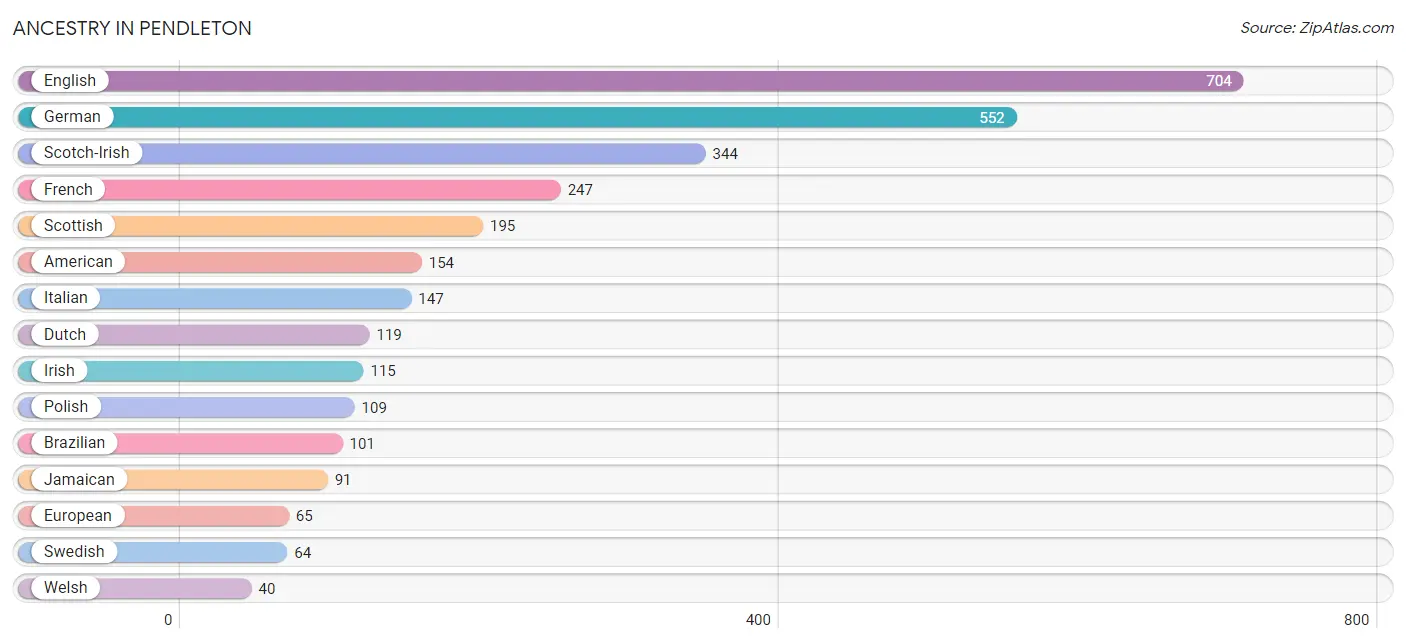
| Ancestry | # Population | % Population |
| African | 24 | 0.7% |
| American | 154 | 4.4% |
| Blackfeet | 12 | 0.3% |
| Brazilian | 101 | 2.9% |
| British | 24 | 0.7% |
| Cherokee | 12 | 0.3% |
| Dutch | 119 | 3.4% |
| English | 704 | 20.1% |
| European | 65 | 1.9% |
| Finnish | 7 | 0.2% |
| French | 247 | 7.1% |
| French Canadian | 8 | 0.2% |
| German | 552 | 15.8% |
| Hungarian | 21 | 0.6% |
| Irish | 115 | 3.3% |
| Italian | 147 | 4.2% |
| Jamaican | 91 | 2.6% |
| Korean | 8 | 0.2% |
| Norwegian | 18 | 0.5% |
| Polish | 109 | 3.1% |
| Scotch-Irish | 344 | 9.8% |
| Scottish | 195 | 5.6% |
| Sri Lankan | 15 | 0.4% |
| Subsaharan African | 24 | 0.7% |
| Swedish | 64 | 1.8% |
| Swiss | 35 | 1.0% |
| Thai | 32 | 0.9% |
| Welsh | 40 | 1.1% | View All 28 Rows |
Immigrants in Pendleton
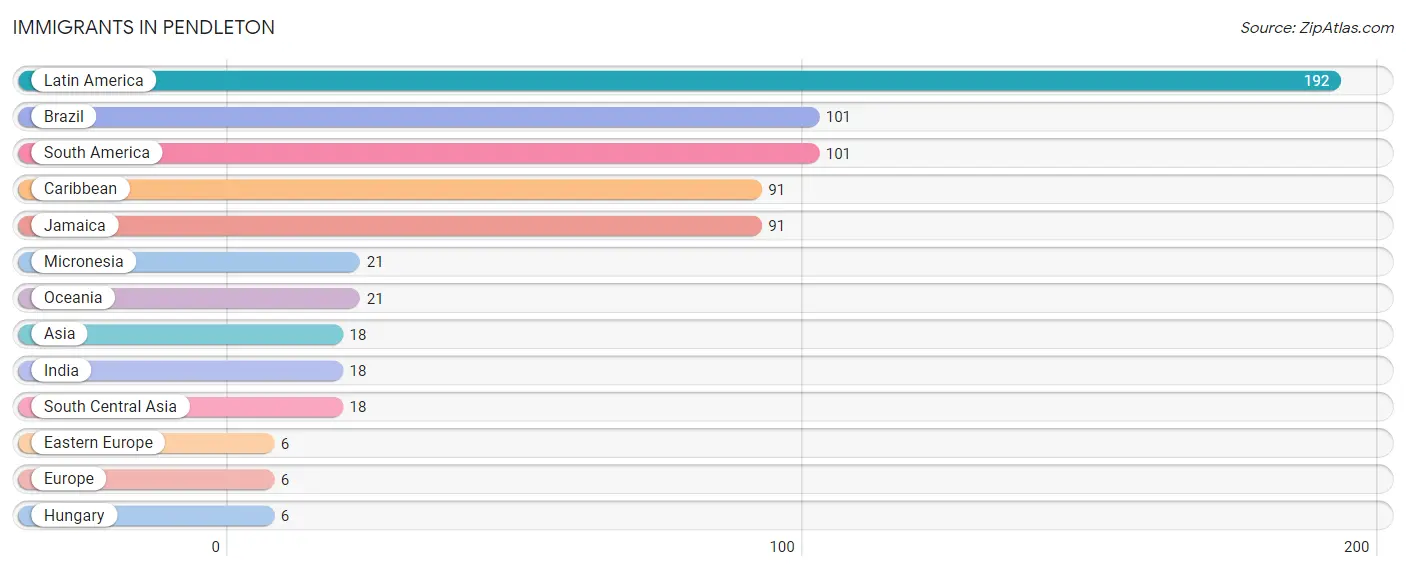
The most numerous immigrant groups reported in Pendleton came from Latin America (192 | 5.5%), Brazil (101 | 2.9%), South America (101 | 2.9%), Caribbean (91 | 2.6%), and Jamaica (91 | 2.6%), together accounting for 16.5% of all Pendleton residents.
| Immigration Origin | # Population | % Population |
| Asia | 18 | 0.5% |
| Brazil | 101 | 2.9% |
| Caribbean | 91 | 2.6% |
| Eastern Europe | 6 | 0.2% |
| Europe | 6 | 0.2% |
| Hungary | 6 | 0.2% |
| India | 18 | 0.5% |
| Jamaica | 91 | 2.6% |
| Latin America | 192 | 5.5% |
| Micronesia | 21 | 0.6% |
| Oceania | 21 | 0.6% |
| South America | 101 | 2.9% |
| South Central Asia | 18 | 0.5% | View All 13 Rows |
Sex and Age in Pendleton
Sex and Age in Pendleton
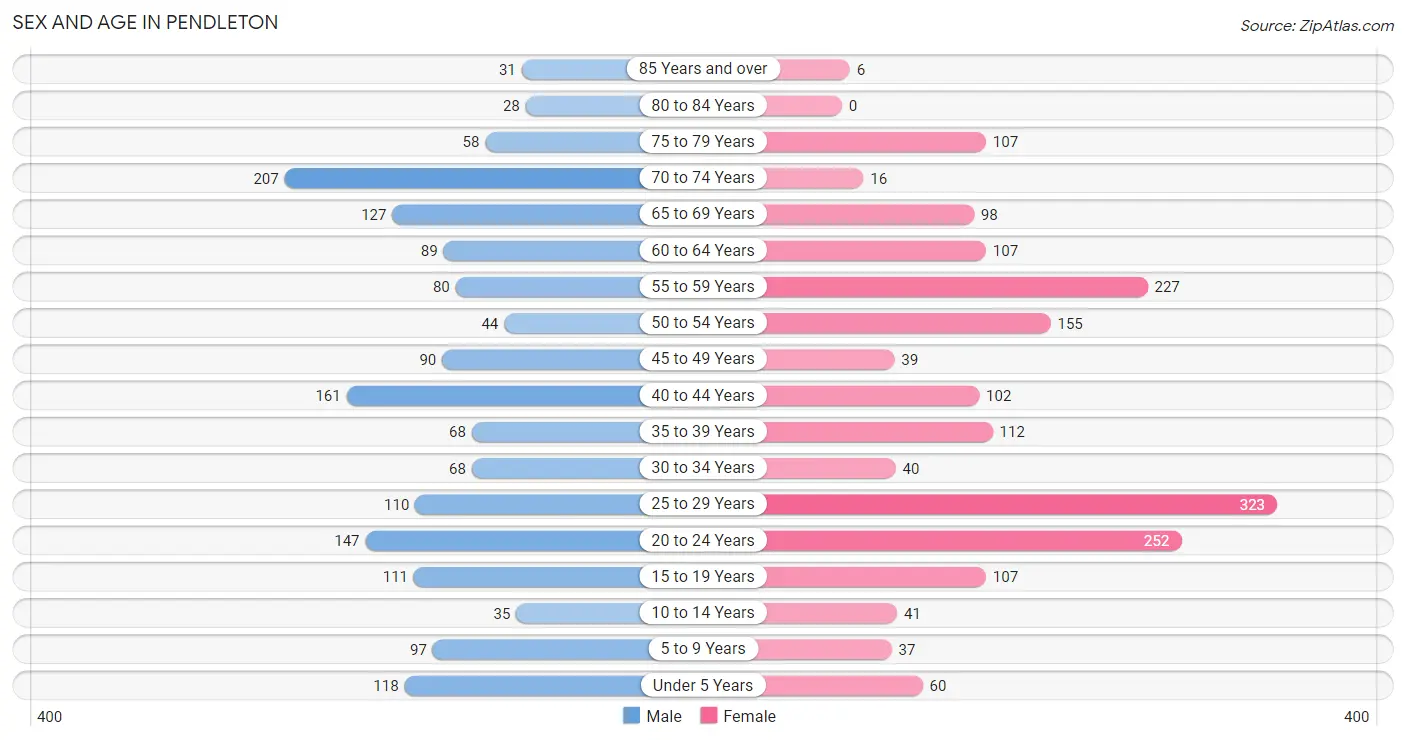
The most populous age groups in Pendleton are 70 to 74 Years (207 | 12.4%) for men and 25 to 29 Years (323 | 17.7%) for women.
| Age Bracket | Male | Female |
| Under 5 Years | 118 (7.1%) | 60 (3.3%) |
| 5 to 9 Years | 97 (5.8%) | 37 (2.0%) |
| 10 to 14 Years | 35 (2.1%) | 41 (2.2%) |
| 15 to 19 Years | 111 (6.7%) | 107 (5.9%) |
| 20 to 24 Years | 147 (8.8%) | 252 (13.8%) |
| 25 to 29 Years | 110 (6.6%) | 323 (17.7%) |
| 30 to 34 Years | 68 (4.1%) | 40 (2.2%) |
| 35 to 39 Years | 68 (4.1%) | 112 (6.1%) |
| 40 to 44 Years | 161 (9.7%) | 102 (5.6%) |
| 45 to 49 Years | 90 (5.4%) | 39 (2.1%) |
| 50 to 54 Years | 44 (2.6%) | 155 (8.5%) |
| 55 to 59 Years | 80 (4.8%) | 227 (12.4%) |
| 60 to 64 Years | 89 (5.3%) | 107 (5.9%) |
| 65 to 69 Years | 127 (7.6%) | 98 (5.4%) |
| 70 to 74 Years | 207 (12.4%) | 16 (0.9%) |
| 75 to 79 Years | 58 (3.5%) | 107 (5.9%) |
| 80 to 84 Years | 28 (1.7%) | 0 (0.0%) |
| 85 Years and over | 31 (1.9%) | 6 (0.3%) |
| Total | 1,669 (100.0%) | 1,829 (100.0%) |
Families and Households in Pendleton
Median Family Size in Pendleton
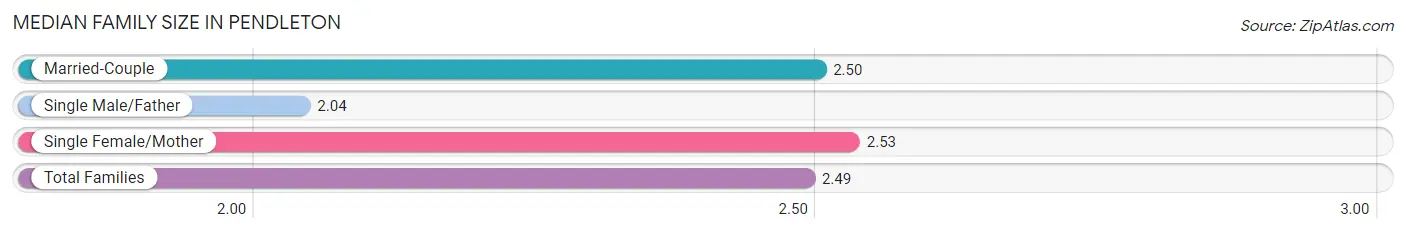
The median family size in Pendleton is 2.49 persons per family, with single female/mother families (129 | 15.2%) accounting for the largest median family size of 2.53 persons per family. On the other hand, single male/father families (25 | 3.0%) represent the smallest median family size with 2.04 persons per family.
| Family Type | # Families | Family Size |
| Married-Couple | 692 (81.8%) | 2.50 |
| Single Male/Father | 25 (3.0%) | 2.04 |
| Single Female/Mother | 129 (15.2%) | 2.53 |
| Total Families | 846 (100.0%) | 2.49 |
Median Household Size in Pendleton
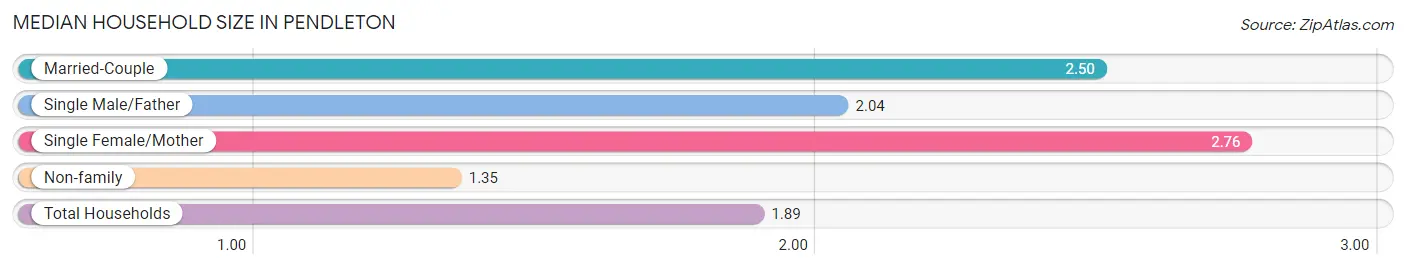
The median household size in Pendleton is 1.89 persons per household, with single female/mother households (129 | 7.0%) accounting for the largest median household size of 2.76 persons per household. non-family households (1,005 | 54.3%) represent the smallest median household size with 1.35 persons per household.
| Household Type | # Households | Household Size |
| Married-Couple | 692 (37.4%) | 2.50 |
| Single Male/Father | 25 (1.3%) | 2.04 |
| Single Female/Mother | 129 (7.0%) | 2.76 |
| Non-family | 1,005 (54.3%) | 1.35 |
| Total Households | 1,851 (100.0%) | 1.89 |
Household Size by Marriage Status in Pendleton
Out of a total of 1,851 households in Pendleton, 846 (45.7%) are family households, while 1,005 (54.3%) are nonfamily households. The most numerous type of family households are 2-person households, comprising 486, and the most common type of nonfamily households are 1-person households, comprising 770.
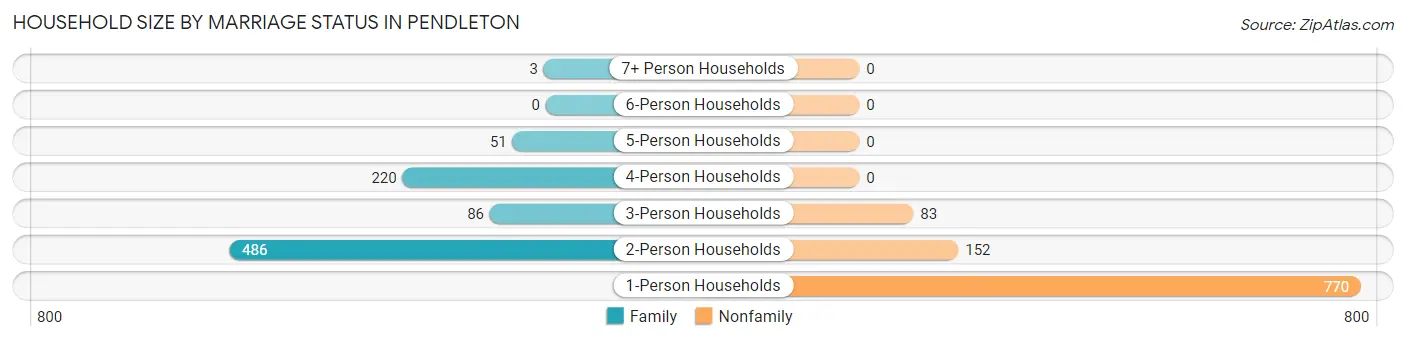
| Household Size | Family Households | Nonfamily Households |
| 1-Person Households | - | 770 (41.6%) |
| 2-Person Households | 486 (26.3%) | 152 (8.2%) |
| 3-Person Households | 86 (4.6%) | 83 (4.5%) |
| 4-Person Households | 220 (11.9%) | 0 (0.0%) |
| 5-Person Households | 51 (2.8%) | 0 (0.0%) |
| 6-Person Households | 0 (0.0%) | 0 (0.0%) |
| 7+ Person Households | 3 (0.2%) | 0 (0.0%) |
| Total | 846 (45.7%) | 1,005 (54.3%) |
Female Fertility in Pendleton
Fertility by Age in Pendleton
| Age Bracket | Women with Births | Births / 1,000 Women |
| 15 to 19 years | 0 (0.0%) | 0.0 |
| 20 to 34 years | 0 (0.0%) | 0.0 |
| 35 to 50 years | 0 (0.0%) | 0.0 |
| Total | 0 (0.0%) | 0.0 |
Fertility by Age by Marriage Status in Pendleton
| Age Bracket | Married | Unmarried |
| 15 to 19 years | 0 (0.0%) | 0 (0.0%) |
| 20 to 34 years | 0 (0.0%) | 0 (0.0%) |
| 35 to 50 years | 0 (0.0%) | 0 (0.0%) |
| Total | 0 (0.0%) | 0 (0.0%) |
Fertility by Education in Pendleton
| Educational Attainment | Women with Births | Births / 1,000 Women |
| Less than High School | 0 (0.0%) | 0.0 |
| High School Diploma | 0 (0.0%) | 0.0 |
| College or Associate's Degree | 0 (0.0%) | 0.0 |
| Bachelor's Degree | 0 (0.0%) | 0.0 |
| Graduate Degree | 0 (0.0%) | 0.0 |
| Total | 0 (0.0%) | 0.0 |
Fertility by Education by Marriage Status in Pendleton
| Educational Attainment | Married | Unmarried |
| Less than High School | 0 (0.0%) | 0 (0.0%) |
| High School Diploma | 0 (0.0%) | 0 (0.0%) |
| College or Associate's Degree | 0 (0.0%) | 0 (0.0%) |
| Bachelor's Degree | 0 (0.0%) | 0 (0.0%) |
| Graduate Degree | 0 (0.0%) | 0 (0.0%) |
| Total | 0 (0.0%) | 0 (0.0%) |
Employment Characteristics in Pendleton
Employment by Class of Employer in Pendleton
Among the 1,820 employed individuals in Pendleton, private company employees (1,141 | 62.7%), state government employees (232 | 12.8%), and not-for-profit organizations (224 | 12.3%) make up the most common classes of employment.
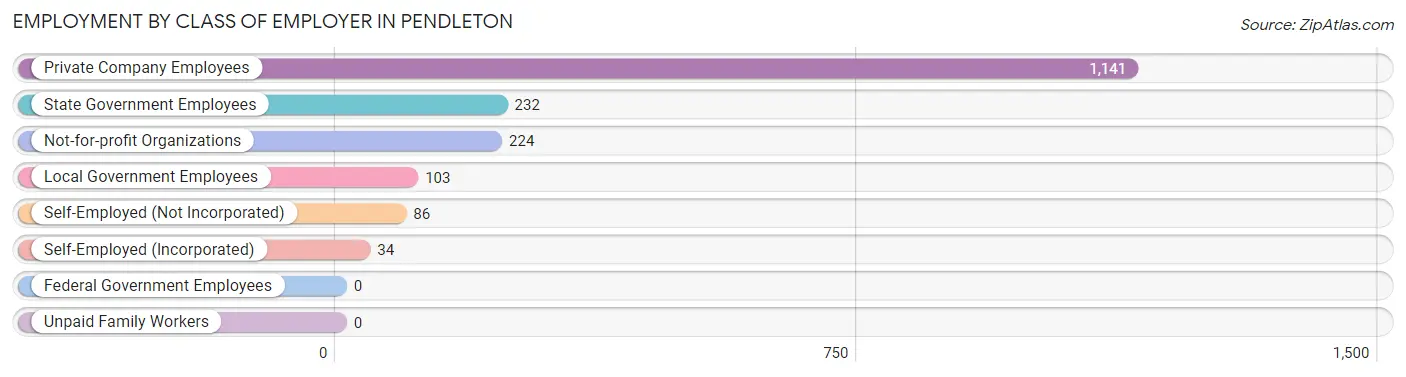
| Employer Class | # Employees | % Employees |
| Private Company Employees | 1,141 | 62.7% |
| Self-Employed (Incorporated) | 34 | 1.9% |
| Self-Employed (Not Incorporated) | 86 | 4.7% |
| Not-for-profit Organizations | 224 | 12.3% |
| Local Government Employees | 103 | 5.7% |
| State Government Employees | 232 | 12.8% |
| Federal Government Employees | 0 | 0.0% |
| Unpaid Family Workers | 0 | 0.0% |
| Total | 1,820 | 100.0% |
Employment Status by Age in Pendleton
According to the labor force statistics for Pendleton, out of the total population over 16 years of age (3,024), 62.0% or 1,875 individuals are in the labor force, with 2.9% or 54 of them unemployed. The age group with the highest labor force participation rate is 55 to 59 years, with 91.9% or 282 individuals in the labor force. Within the labor force, the 30 to 34 years age range has the highest percentage of unemployed individuals, with 15.0% or 12 of them being unemployed.
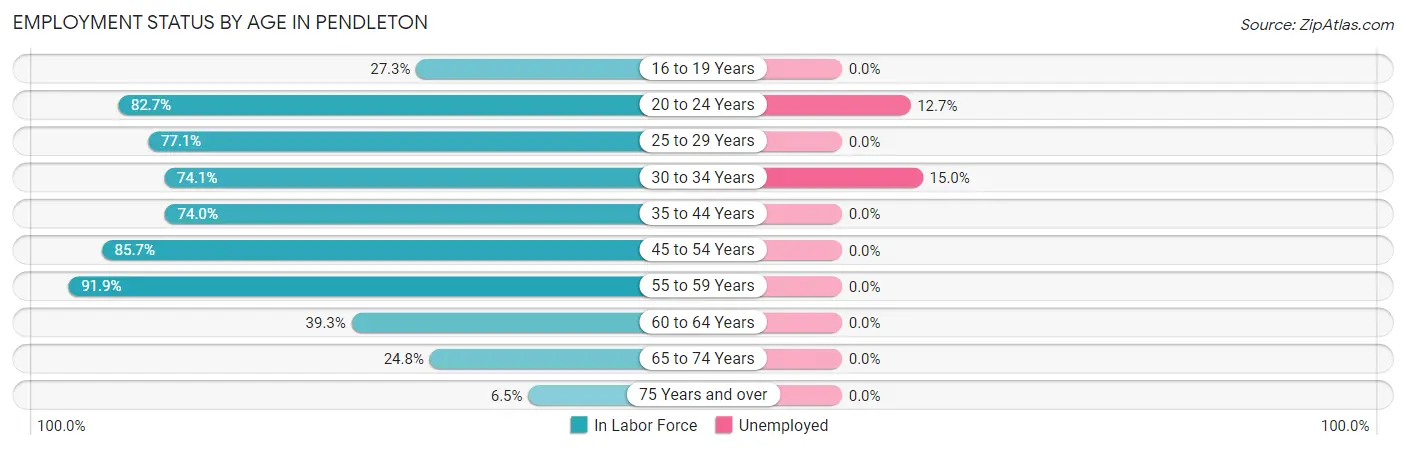
| Age Bracket | In Labor Force | Unemployed |
| 16 to 19 Years | 36 (27.3%) | 0 (0.0%) |
| 20 to 24 Years | 330 (82.7%) | 42 (12.7%) |
| 25 to 29 Years | 334 (77.1%) | 0 (0.0%) |
| 30 to 34 Years | 80 (74.1%) | 12 (15.0%) |
| 35 to 44 Years | 328 (74.0%) | 0 (0.0%) |
| 45 to 54 Years | 281 (85.7%) | 0 (0.0%) |
| 55 to 59 Years | 282 (91.9%) | 0 (0.0%) |
| 60 to 64 Years | 77 (39.3%) | 0 (0.0%) |
| 65 to 74 Years | 111 (24.8%) | 0 (0.0%) |
| 75 Years and over | 15 (6.5%) | 0 (0.0%) |
| Total | 1,875 (62.0%) | 54 (2.9%) |
Employment Status by Educational Attainment in Pendleton
According to labor force statistics for Pendleton, 76.1% of individuals (1,381) out of the total population between 25 and 64 years of age (1,815) are in the labor force, with 0.9% or 12 of them being unemployed. The group with the highest labor force participation rate are those with the educational attainment of bachelor's degree or higher, with 84.6% or 890 individuals in the labor force. Within the labor force, individuals with high school diploma education have the highest percentage of unemployment, with 7.1% or 12 of them being unemployed.
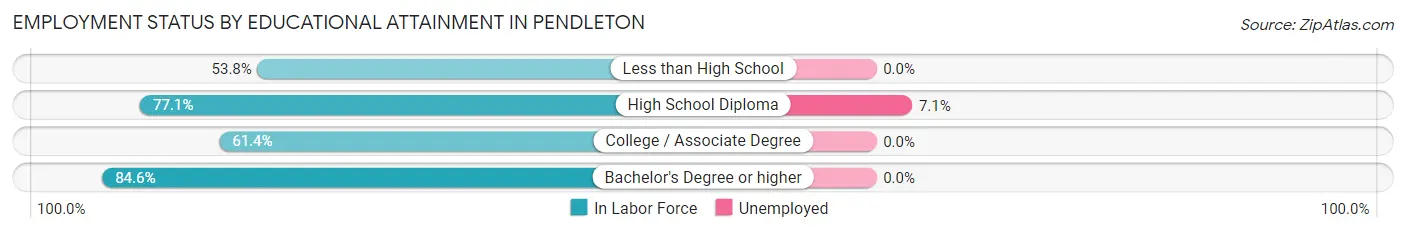
| Educational Attainment | In Labor Force | Unemployed |
| Less than High School | 77 (53.8%) | 0 (0.0%) |
| High School Diploma | 168 (77.1%) | 15 (7.1%) |
| College / Associate Degree | 247 (61.4%) | 0 (0.0%) |
| Bachelor's Degree or higher | 890 (84.6%) | 0 (0.0%) |
| Total | 1,381 (76.1%) | 16 (0.9%) |
Employment Occupations by Sex in Pendleton
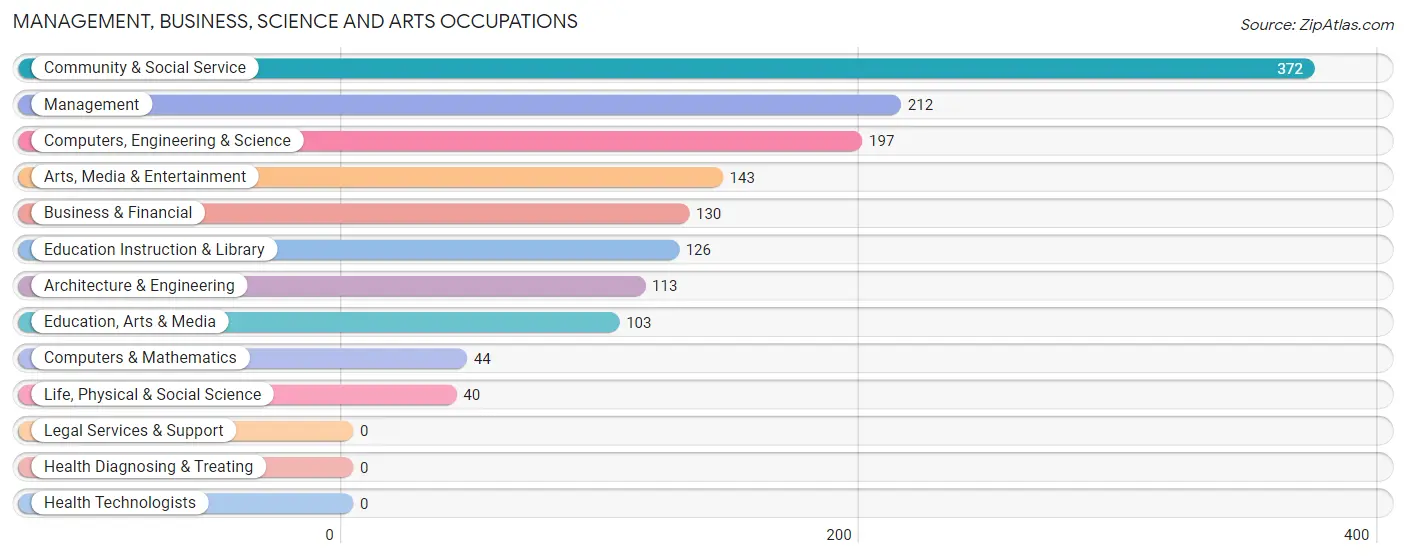
Management, Business, Science and Arts Occupations
The most common Management, Business, Science and Arts occupations in Pendleton are Community & Social Service (372 | 20.4%), Management (212 | 11.7%), Computers, Engineering & Science (197 | 10.8%), Arts, Media & Entertainment (143 | 7.9%), and Business & Financial (130 | 7.1%).
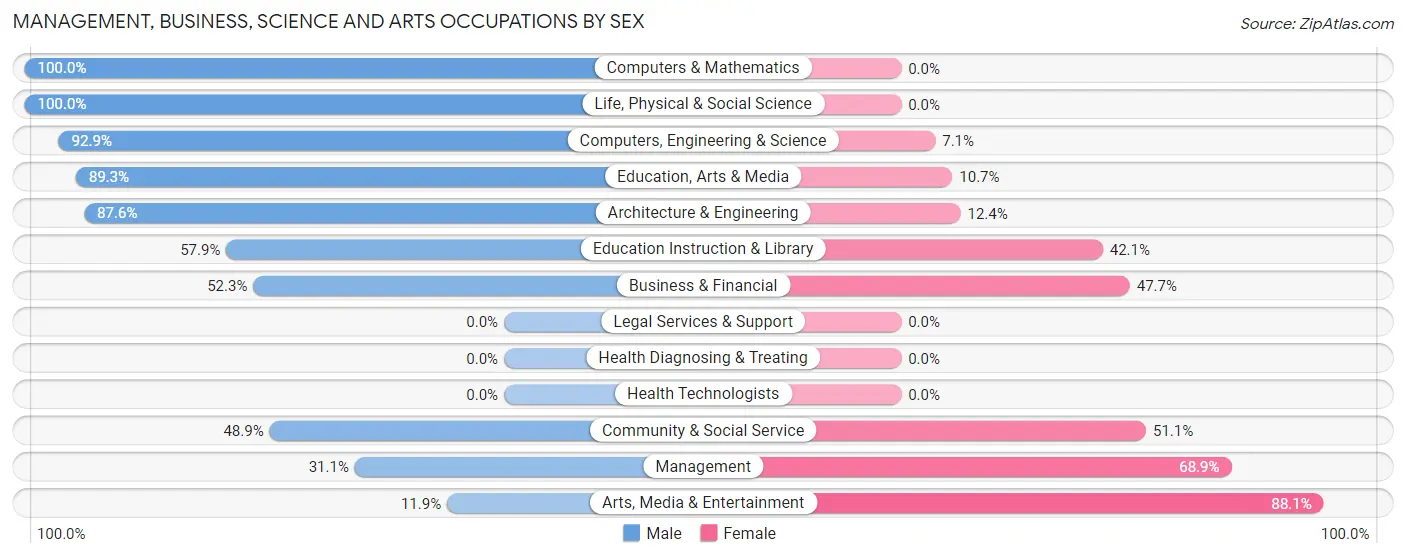
Management, Business, Science and Arts Occupations by Sex
Within the Management, Business, Science and Arts occupations in Pendleton, the most male-oriented occupations are Computers & Mathematics (100.0%), Life, Physical & Social Science (100.0%), and Computers, Engineering & Science (92.9%), while the most female-oriented occupations are Arts, Media & Entertainment (88.1%), Management (68.9%), and Community & Social Service (51.1%).
| Occupation | Male | Female |
| Management | 66 (31.1%) | 146 (68.9%) |
| Business & Financial | 68 (52.3%) | 62 (47.7%) |
| Computers, Engineering & Science | 183 (92.9%) | 14 (7.1%) |
| Computers & Mathematics | 44 (100.0%) | 0 (0.0%) |
| Architecture & Engineering | 99 (87.6%) | 14 (12.4%) |
| Life, Physical & Social Science | 40 (100.0%) | 0 (0.0%) |
| Community & Social Service | 182 (48.9%) | 190 (51.1%) |
| Education, Arts & Media | 92 (89.3%) | 11 (10.7%) |
| Legal Services & Support | 0 (0.0%) | 0 (0.0%) |
| Education Instruction & Library | 73 (57.9%) | 53 (42.1%) |
| Arts, Media & Entertainment | 17 (11.9%) | 126 (88.1%) |
| Health Diagnosing & Treating | 0 (0.0%) | 0 (0.0%) |
| Health Technologists | 0 (0.0%) | 0 (0.0%) |
| Total (Category) | 499 (54.8%) | 412 (45.2%) |
| Total (Overall) | 841 (46.2%) | 979 (53.8%) |
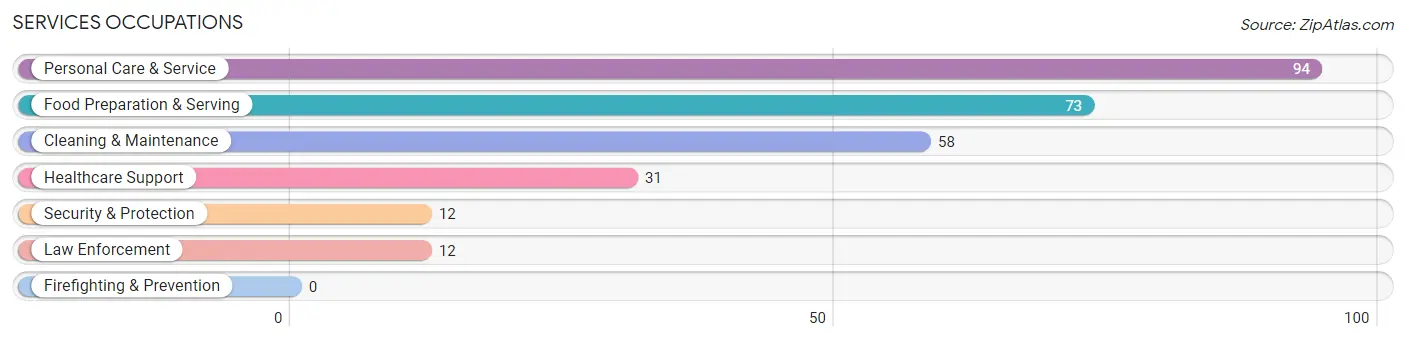
Services Occupations
The most common Services occupations in Pendleton are Personal Care & Service (94 | 5.2%), Food Preparation & Serving (73 | 4.0%), Cleaning & Maintenance (58 | 3.2%), Healthcare Support (31 | 1.7%), and Security & Protection (12 | 0.7%).
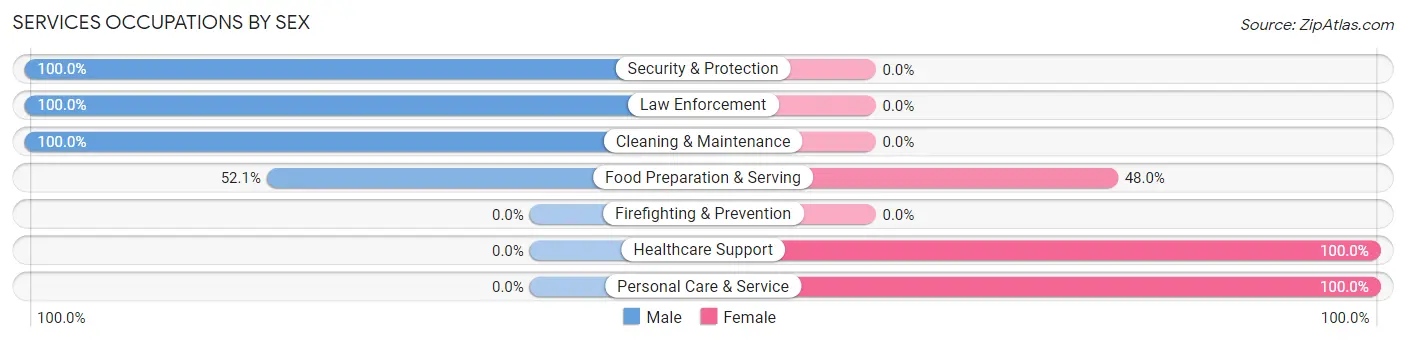
Services Occupations by Sex
Within the Services occupations in Pendleton, the most male-oriented occupations are Security & Protection (100.0%), Law Enforcement (100.0%), and Cleaning & Maintenance (100.0%), while the most female-oriented occupations are Healthcare Support (100.0%), Personal Care & Service (100.0%), and Food Preparation & Serving (47.9%).
| Occupation | Male | Female |
| Healthcare Support | 0 (0.0%) | 31 (100.0%) |
| Security & Protection | 12 (100.0%) | 0 (0.0%) |
| Firefighting & Prevention | 0 (0.0%) | 0 (0.0%) |
| Law Enforcement | 12 (100.0%) | 0 (0.0%) |
| Food Preparation & Serving | 38 (52.0%) | 35 (47.9%) |
| Cleaning & Maintenance | 58 (100.0%) | 0 (0.0%) |
| Personal Care & Service | 0 (0.0%) | 94 (100.0%) |
| Total (Category) | 108 (40.3%) | 160 (59.7%) |
| Total (Overall) | 841 (46.2%) | 979 (53.8%) |
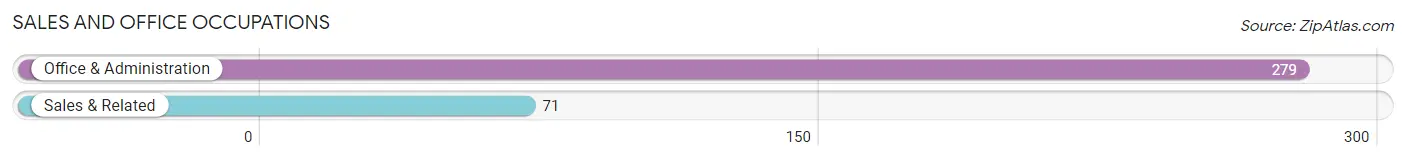
Sales and Office Occupations
The most common Sales and Office occupations in Pendleton are Office & Administration (279 | 15.3%), and Sales & Related (71 | 3.9%).
Sales and Office Occupations by Sex
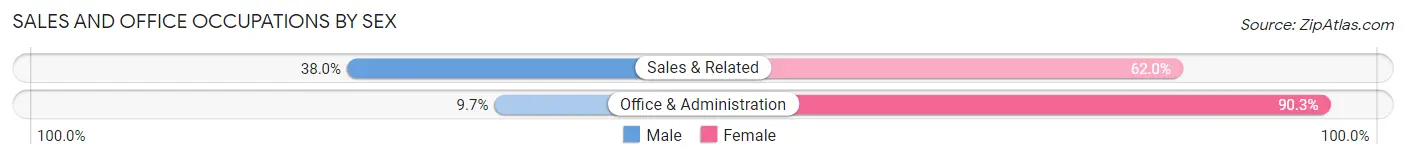
| Occupation | Male | Female |
| Sales & Related | 27 (38.0%) | 44 (62.0%) |
| Office & Administration | 27 (9.7%) | 252 (90.3%) |
| Total (Category) | 54 (15.4%) | 296 (84.6%) |
| Total (Overall) | 841 (46.2%) | 979 (53.8%) |
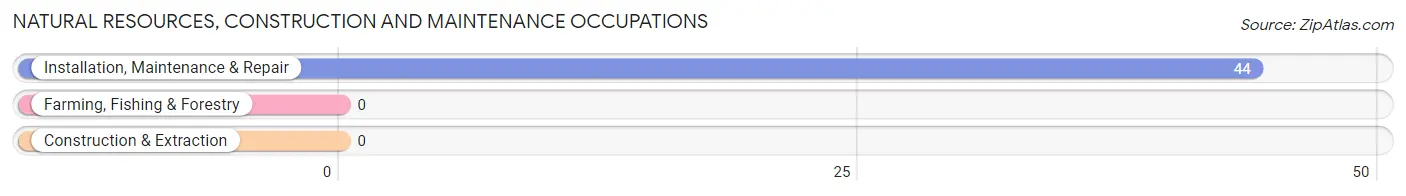
Natural Resources, Construction and Maintenance Occupations
The most common Natural Resources, Construction and Maintenance occupations in Pendleton are , and Installation, Maintenance & Repair (44 | 2.4%).
Natural Resources, Construction and Maintenance Occupations by Sex
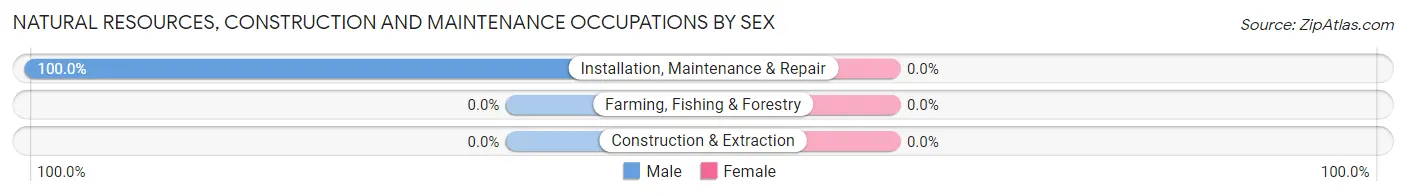
| Occupation | Male | Female |
| Farming, Fishing & Forestry | 0 (0.0%) | 0 (0.0%) |
| Construction & Extraction | 0 (0.0%) | 0 (0.0%) |
| Installation, Maintenance & Repair | 44 (100.0%) | 0 (0.0%) |
| Total (Category) | 44 (100.0%) | 0 (0.0%) |
| Total (Overall) | 841 (46.2%) | 979 (53.8%) |
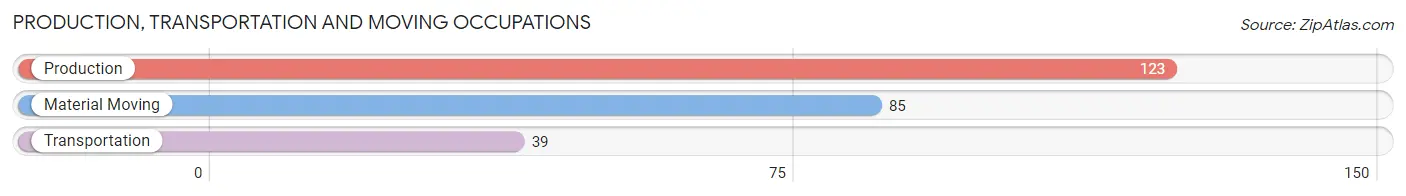
Production, Transportation and Moving Occupations
The most common Production, Transportation and Moving occupations in Pendleton are Production (123 | 6.8%), Material Moving (85 | 4.7%), and Transportation (39 | 2.1%).
Production, Transportation and Moving Occupations by Sex
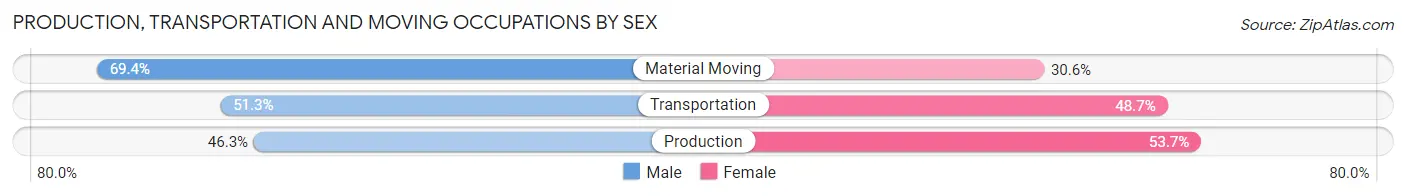
| Occupation | Male | Female |
| Production | 57 (46.3%) | 66 (53.7%) |
| Transportation | 20 (51.3%) | 19 (48.7%) |
| Material Moving | 59 (69.4%) | 26 (30.6%) |
| Total (Category) | 136 (55.1%) | 111 (44.9%) |
| Total (Overall) | 841 (46.2%) | 979 (53.8%) |
Employment Industries by Sex in Pendleton
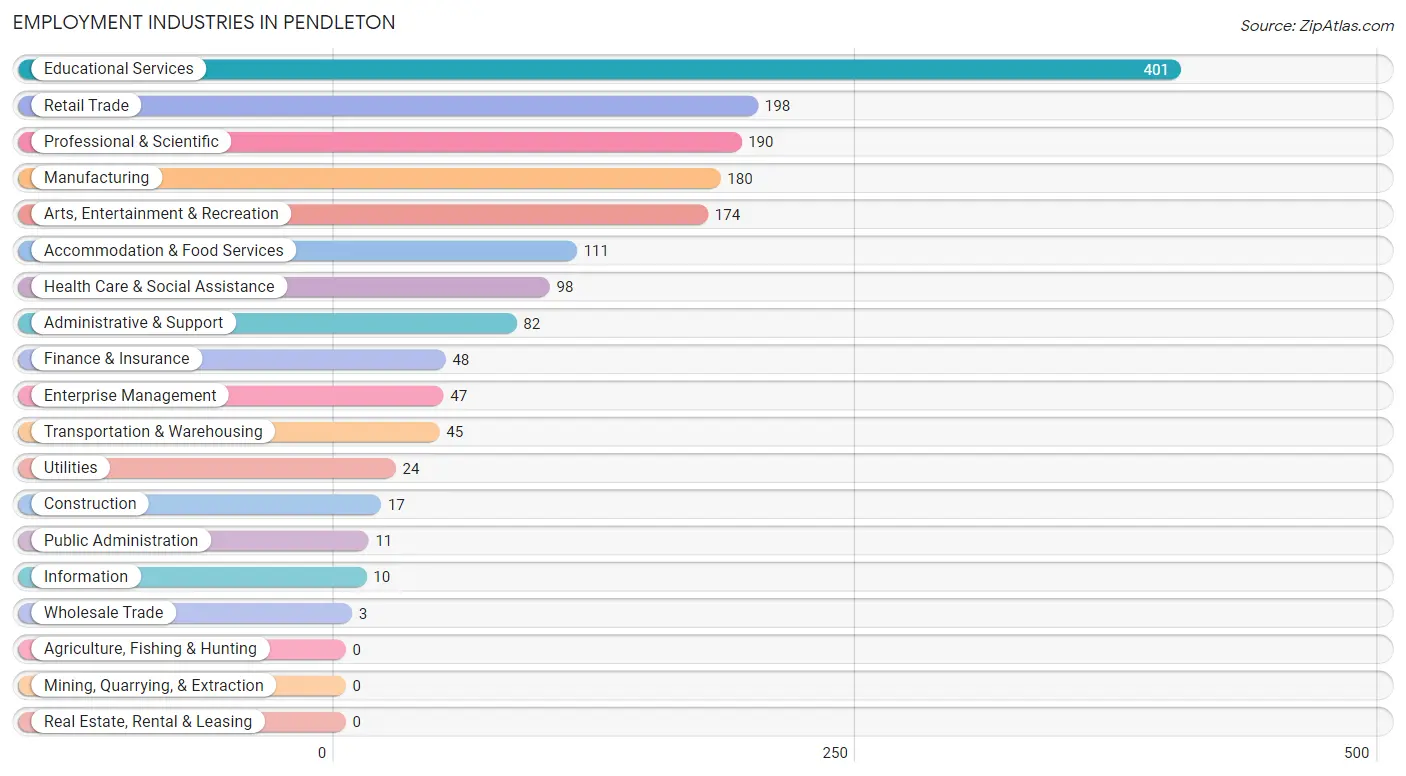
Employment Industries in Pendleton
The major employment industries in Pendleton include Educational Services (401 | 22.0%), Retail Trade (198 | 10.9%), Professional & Scientific (190 | 10.4%), Manufacturing (180 | 9.9%), and Arts, Entertainment & Recreation (174 | 9.6%).
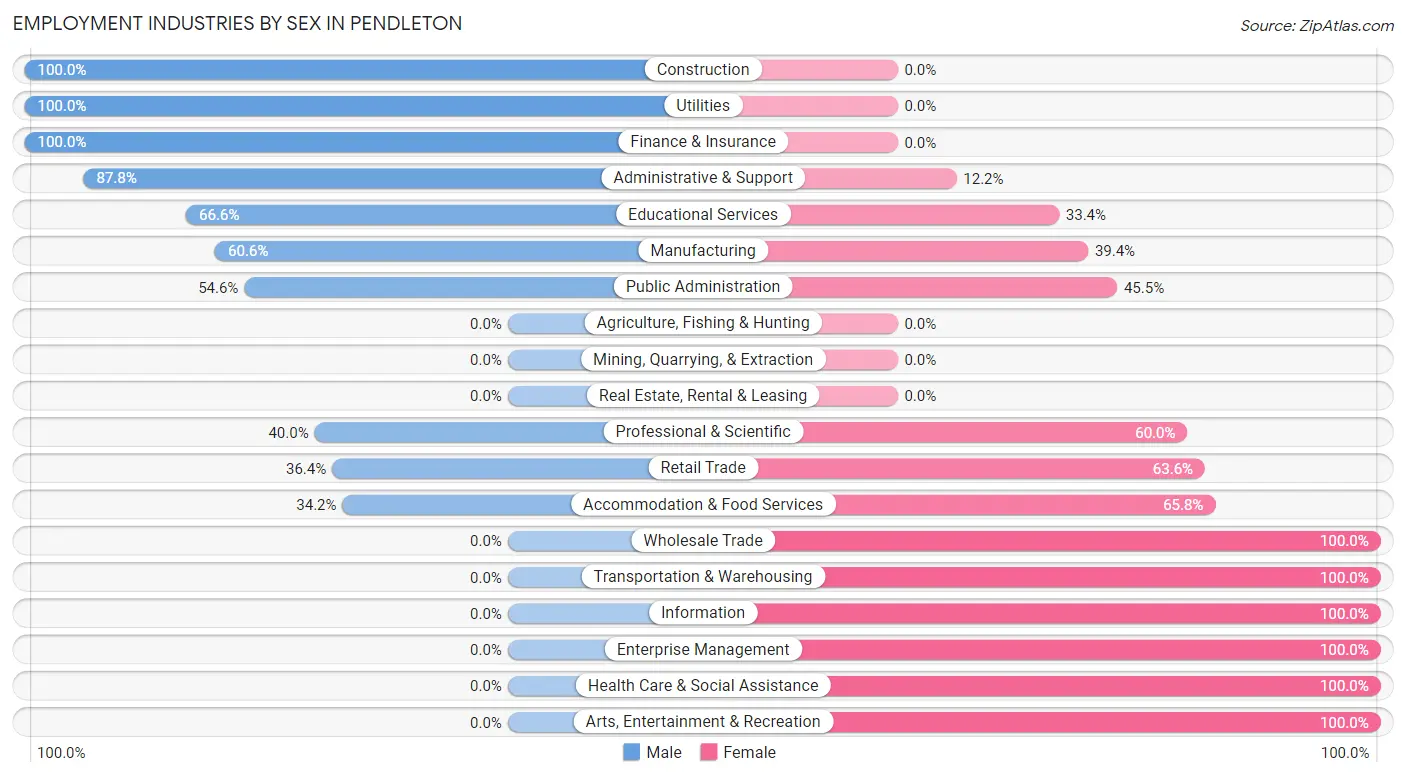
Employment Industries by Sex in Pendleton
The Pendleton industries that see more men than women are Construction (100.0%), Utilities (100.0%), and Finance & Insurance (100.0%), whereas the industries that tend to have a higher number of women are Wholesale Trade (100.0%), Transportation & Warehousing (100.0%), and Information (100.0%).
| Industry | Male | Female |
| Agriculture, Fishing & Hunting | 0 (0.0%) | 0 (0.0%) |
| Mining, Quarrying, & Extraction | 0 (0.0%) | 0 (0.0%) |
| Construction | 17 (100.0%) | 0 (0.0%) |
| Manufacturing | 109 (60.6%) | 71 (39.4%) |
| Wholesale Trade | 0 (0.0%) | 3 (100.0%) |
| Retail Trade | 72 (36.4%) | 126 (63.6%) |
| Transportation & Warehousing | 0 (0.0%) | 45 (100.0%) |
| Utilities | 24 (100.0%) | 0 (0.0%) |
| Information | 0 (0.0%) | 10 (100.0%) |
| Finance & Insurance | 48 (100.0%) | 0 (0.0%) |
| Real Estate, Rental & Leasing | 0 (0.0%) | 0 (0.0%) |
| Professional & Scientific | 76 (40.0%) | 114 (60.0%) |
| Enterprise Management | 0 (0.0%) | 47 (100.0%) |
| Administrative & Support | 72 (87.8%) | 10 (12.2%) |
| Educational Services | 267 (66.6%) | 134 (33.4%) |
| Health Care & Social Assistance | 0 (0.0%) | 98 (100.0%) |
| Arts, Entertainment & Recreation | 0 (0.0%) | 174 (100.0%) |
| Accommodation & Food Services | 38 (34.2%) | 73 (65.8%) |
| Public Administration | 6 (54.5%) | 5 (45.5%) |
| Total | 841 (46.2%) | 979 (53.8%) |
Education in Pendleton
School Enrollment in Pendleton
The most common levels of schooling among the 814 students in Pendleton are college / undergraduate (295 | 36.2%), high school (215 | 26.4%), and nursery / preschool (128 | 15.7%).
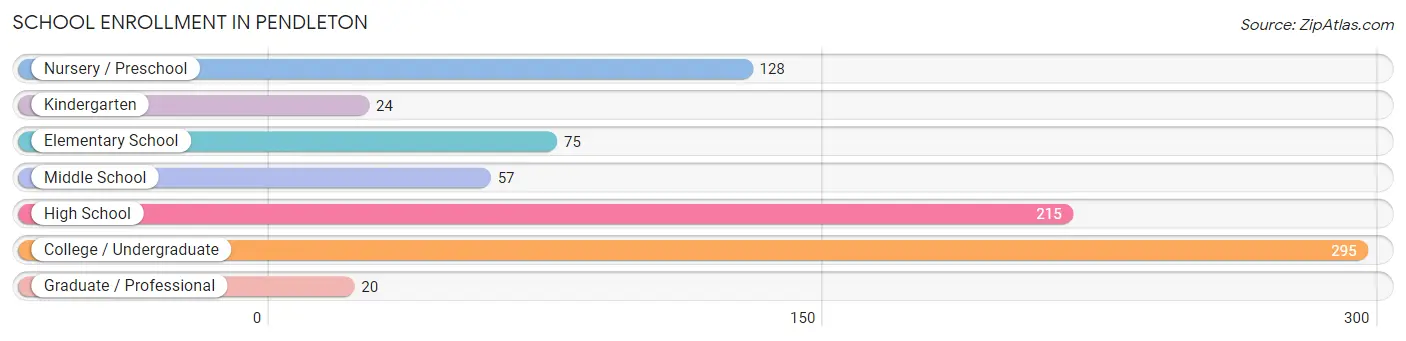
| School Level | # Students | % Students |
| Nursery / Preschool | 128 | 15.7% |
| Kindergarten | 24 | 2.9% |
| Elementary School | 75 | 9.2% |
| Middle School | 57 | 7.0% |
| High School | 215 | 26.4% |
| College / Undergraduate | 295 | 36.2% |
| Graduate / Professional | 20 | 2.5% |
| Total | 814 | 100.0% |
School Enrollment by Age by Funding Source in Pendleton
Out of a total of 814 students who are enrolled in schools in Pendleton, 184 (22.6%) attend a private institution, while the remaining 630 (77.4%) are enrolled in public schools. The age group of 15 to 17 year olds has the highest likelihood of being enrolled in private schools, with 129 (81.7% in the age bracket) enrolled. Conversely, the age group of 10 to 14 year olds has the lowest likelihood of being enrolled in a private school, with 76 (100.0% in the age bracket) attending a public institution.
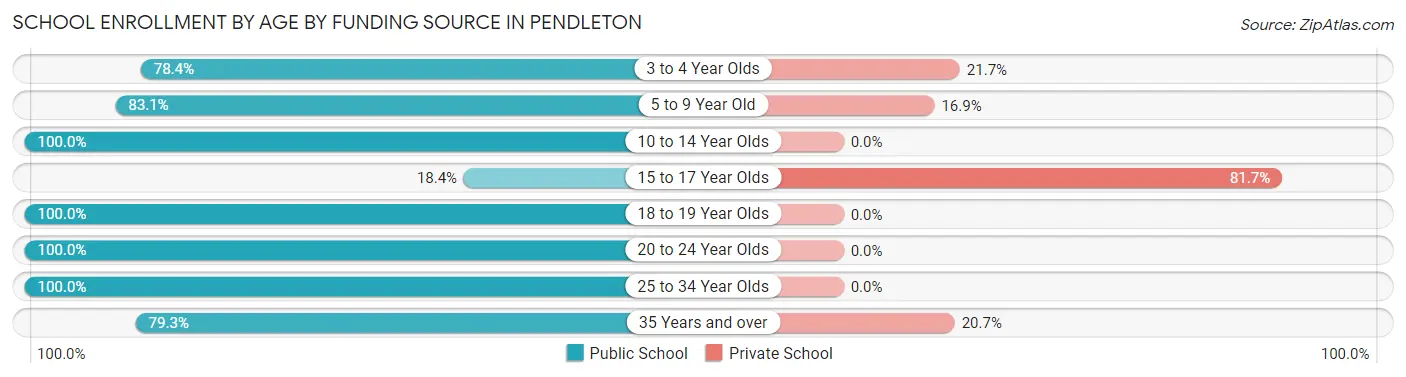
| Age Bracket | Public School | Private School |
| 3 to 4 Year Olds | 76 (78.3%) | 21 (21.6%) |
| 5 to 9 Year Old | 108 (83.1%) | 22 (16.9%) |
| 10 to 14 Year Olds | 76 (100.0%) | 0 (0.0%) |
| 15 to 17 Year Olds | 29 (18.3%) | 129 (81.7%) |
| 18 to 19 Year Olds | 41 (100.0%) | 0 (0.0%) |
| 20 to 24 Year Olds | 195 (100.0%) | 0 (0.0%) |
| 25 to 34 Year Olds | 59 (100.0%) | 0 (0.0%) |
| 35 Years and over | 46 (79.3%) | 12 (20.7%) |
| Total | 630 (77.4%) | 184 (22.6%) |
Educational Attainment by Field of Study in Pendleton
Business (219 | 15.5%), computers & mathematics (168 | 11.9%), engineering (168 | 11.9%), bio, nature & agricultural (132 | 9.3%), and social sciences (123 | 8.7%) are the most common fields of study among 1,417 individuals in Pendleton who have obtained a bachelor's degree or higher.
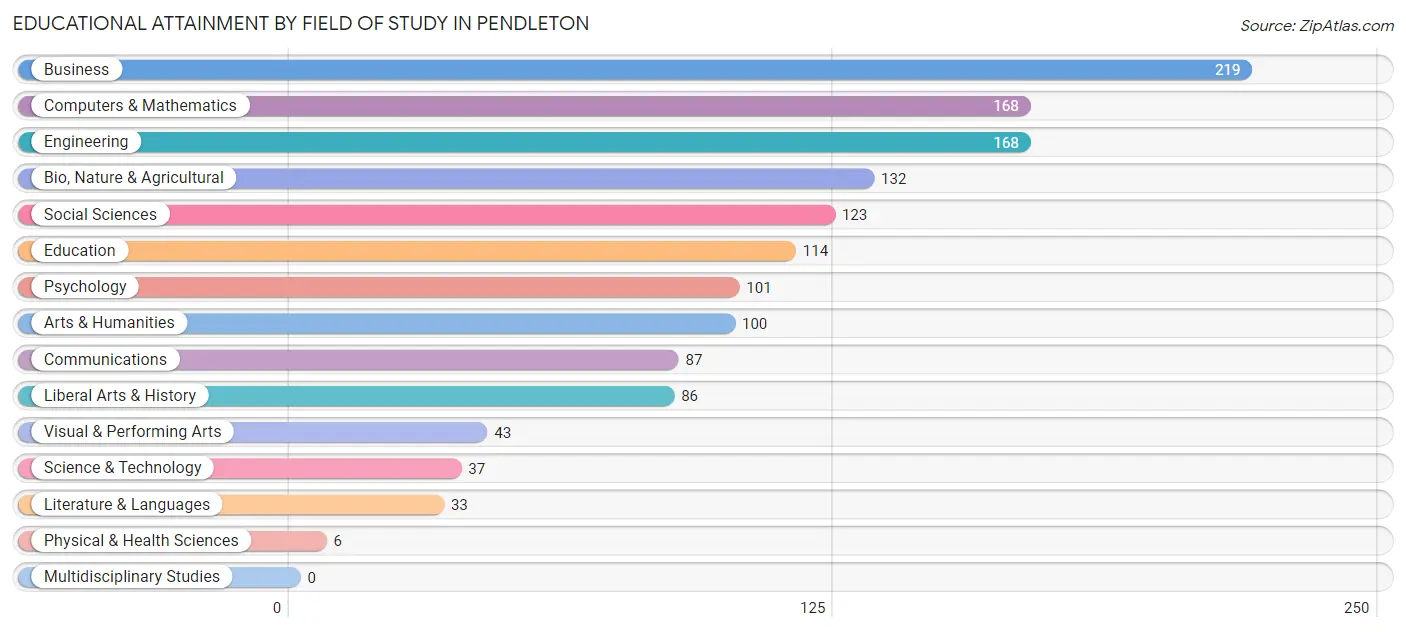
| Field of Study | # Graduates | % Graduates |
| Computers & Mathematics | 168 | 11.9% |
| Bio, Nature & Agricultural | 132 | 9.3% |
| Physical & Health Sciences | 6 | 0.4% |
| Psychology | 101 | 7.1% |
| Social Sciences | 123 | 8.7% |
| Engineering | 168 | 11.9% |
| Multidisciplinary Studies | 0 | 0.0% |
| Science & Technology | 37 | 2.6% |
| Business | 219 | 15.5% |
| Education | 114 | 8.1% |
| Literature & Languages | 33 | 2.3% |
| Liberal Arts & History | 86 | 6.1% |
| Visual & Performing Arts | 43 | 3.0% |
| Communications | 87 | 6.1% |
| Arts & Humanities | 100 | 7.1% |
| Total | 1,417 | 100.0% |
Transportation & Commute in Pendleton
Vehicle Availability by Sex in Pendleton
The most prevalent vehicle ownership categories in Pendleton are males with 2 vehicles (571, accounting for 67.9%) and females with 2 vehicles (589, making up 58.3%).
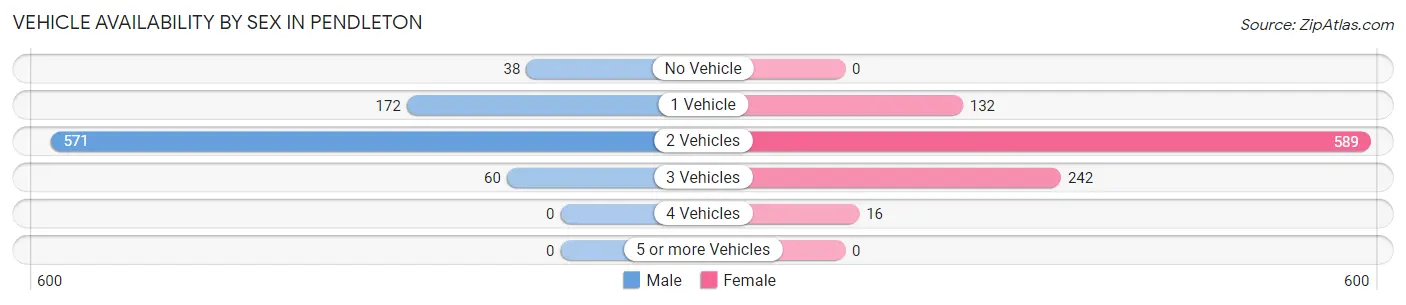
| Vehicles Available | Male | Female |
| No Vehicle | 38 (4.5%) | 0 (0.0%) |
| 1 Vehicle | 172 (20.4%) | 132 (13.5%) |
| 2 Vehicles | 571 (67.9%) | 589 (60.2%) |
| 3 Vehicles | 60 (7.1%) | 242 (24.7%) |
| 4 Vehicles | 0 (0.0%) | 16 (1.6%) |
| 5 or more Vehicles | 0 (0.0%) | 0 (0.0%) |
| Total | 841 (100.0%) | 979 (100.0%) |
Commute Time in Pendleton
The most frequently occuring commute durations in Pendleton are 15 to 19 minutes (428 commuters, 26.8%), 20 to 24 minutes (333 commuters, 20.8%), and 10 to 14 minutes (219 commuters, 13.7%).
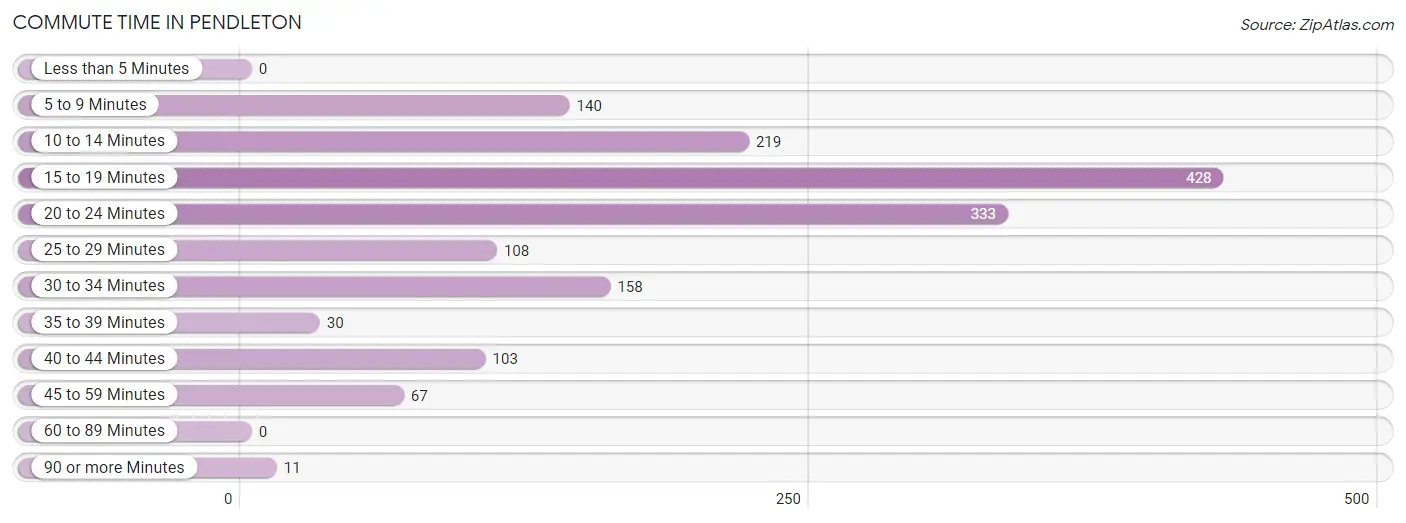
| Commute Time | # Commuters | % Commuters |
| Less than 5 Minutes | 0 | 0.0% |
| 5 to 9 Minutes | 140 | 8.8% |
| 10 to 14 Minutes | 219 | 13.7% |
| 15 to 19 Minutes | 428 | 26.8% |
| 20 to 24 Minutes | 333 | 20.8% |
| 25 to 29 Minutes | 108 | 6.8% |
| 30 to 34 Minutes | 158 | 9.9% |
| 35 to 39 Minutes | 30 | 1.9% |
| 40 to 44 Minutes | 103 | 6.5% |
| 45 to 59 Minutes | 67 | 4.2% |
| 60 to 89 Minutes | 0 | 0.0% |
| 90 or more Minutes | 11 | 0.7% |
Commute Time by Sex in Pendleton
The most common commute times in Pendleton are 20 to 24 minutes (273 commuters, 35.0%) for males and 15 to 19 minutes (275 commuters, 33.6%) for females.
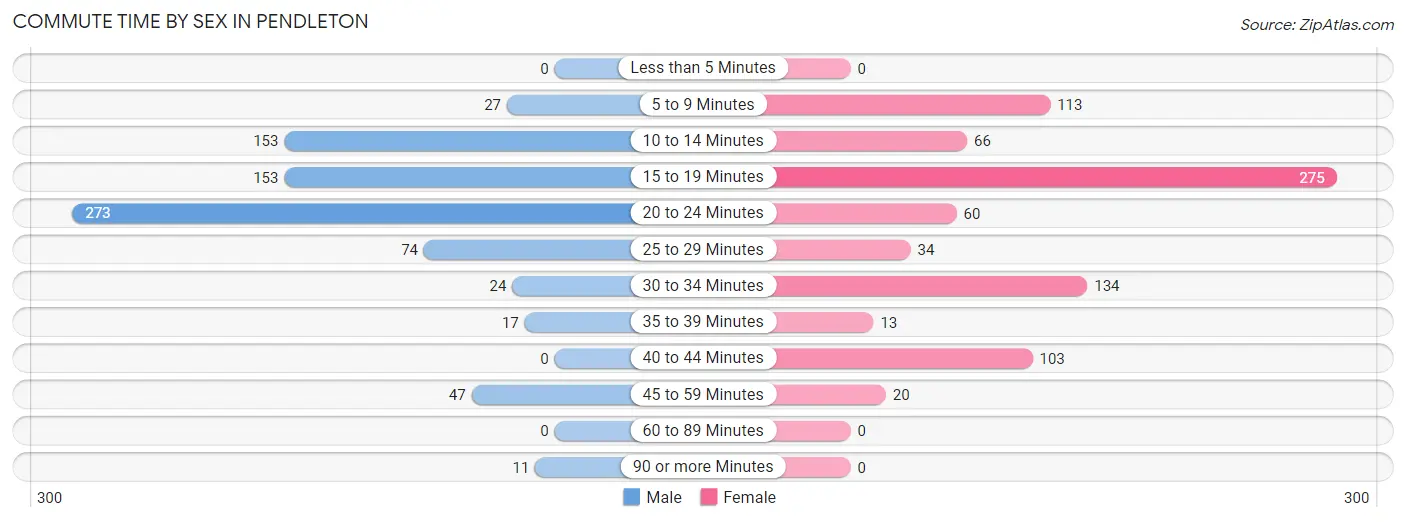
| Commute Time | Male | Female |
| Less than 5 Minutes | 0 (0.0%) | 0 (0.0%) |
| 5 to 9 Minutes | 27 (3.5%) | 113 (13.8%) |
| 10 to 14 Minutes | 153 (19.6%) | 66 (8.1%) |
| 15 to 19 Minutes | 153 (19.6%) | 275 (33.6%) |
| 20 to 24 Minutes | 273 (35.0%) | 60 (7.3%) |
| 25 to 29 Minutes | 74 (9.5%) | 34 (4.2%) |
| 30 to 34 Minutes | 24 (3.1%) | 134 (16.4%) |
| 35 to 39 Minutes | 17 (2.2%) | 13 (1.6%) |
| 40 to 44 Minutes | 0 (0.0%) | 103 (12.6%) |
| 45 to 59 Minutes | 47 (6.0%) | 20 (2.4%) |
| 60 to 89 Minutes | 0 (0.0%) | 0 (0.0%) |
| 90 or more Minutes | 11 (1.4%) | 0 (0.0%) |
Time of Departure to Work by Sex in Pendleton
The most frequent times of departure to work in Pendleton are 7:30 AM to 7:59 AM (256, 32.9%) for males and 9:00 AM to 9:59 AM (179, 21.9%) for females.
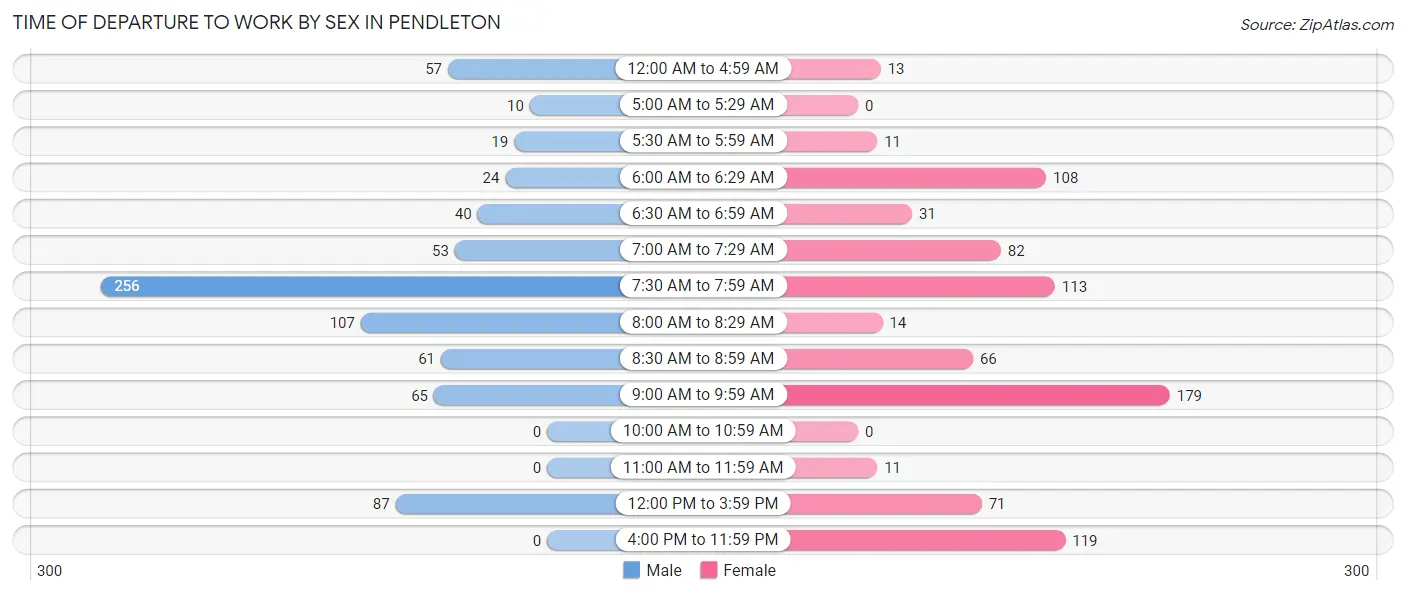
| Time of Departure | Male | Female |
| 12:00 AM to 4:59 AM | 57 (7.3%) | 13 (1.6%) |
| 5:00 AM to 5:29 AM | 10 (1.3%) | 0 (0.0%) |
| 5:30 AM to 5:59 AM | 19 (2.4%) | 11 (1.3%) |
| 6:00 AM to 6:29 AM | 24 (3.1%) | 108 (13.2%) |
| 6:30 AM to 6:59 AM | 40 (5.1%) | 31 (3.8%) |
| 7:00 AM to 7:29 AM | 53 (6.8%) | 82 (10.0%) |
| 7:30 AM to 7:59 AM | 256 (32.9%) | 113 (13.8%) |
| 8:00 AM to 8:29 AM | 107 (13.7%) | 14 (1.7%) |
| 8:30 AM to 8:59 AM | 61 (7.8%) | 66 (8.1%) |
| 9:00 AM to 9:59 AM | 65 (8.3%) | 179 (21.9%) |
| 10:00 AM to 10:59 AM | 0 (0.0%) | 0 (0.0%) |
| 11:00 AM to 11:59 AM | 0 (0.0%) | 11 (1.3%) |
| 12:00 PM to 3:59 PM | 87 (11.2%) | 71 (8.7%) |
| 4:00 PM to 11:59 PM | 0 (0.0%) | 119 (14.5%) |
| Total | 779 (100.0%) | 818 (100.0%) |
Housing Occupancy in Pendleton
Occupancy by Ownership in Pendleton
Of the total 1,851 dwellings in Pendleton, owner-occupied units account for 1,005 (54.3%), while renter-occupied units make up 846 (45.7%).
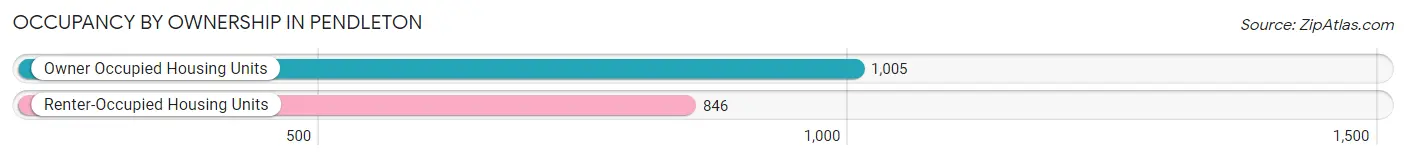
| Occupancy | # Housing Units | % Housing Units |
| Owner Occupied Housing Units | 1,005 | 54.3% |
| Renter-Occupied Housing Units | 846 | 45.7% |
| Total Occupied Housing Units | 1,851 | 100.0% |
Occupancy by Household Size in Pendleton
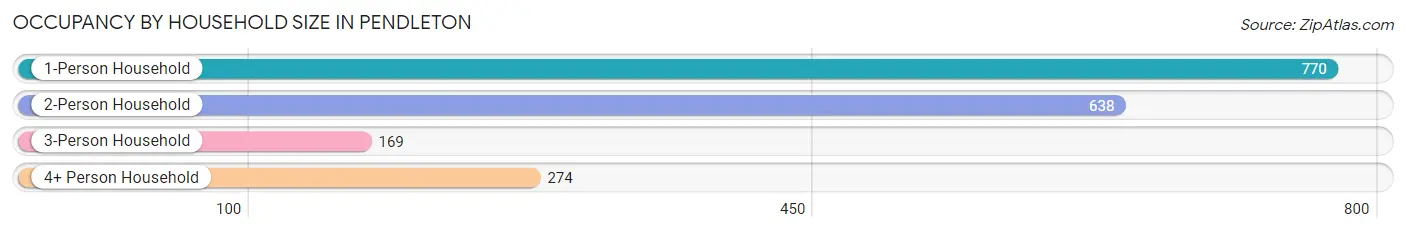
| Household Size | # Housing Units | % Housing Units |
| 1-Person Household | 770 | 41.6% |
| 2-Person Household | 638 | 34.5% |
| 3-Person Household | 169 | 9.1% |
| 4+ Person Household | 274 | 14.8% |
| Total Housing Units | 1,851 | 100.0% |
Occupancy by Ownership by Household Size in Pendleton
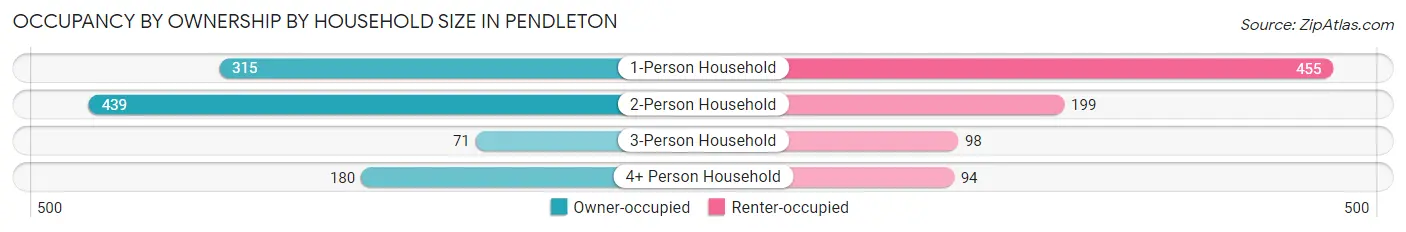
| Household Size | Owner-occupied | Renter-occupied |
| 1-Person Household | 315 (40.9%) | 455 (59.1%) |
| 2-Person Household | 439 (68.8%) | 199 (31.2%) |
| 3-Person Household | 71 (42.0%) | 98 (58.0%) |
| 4+ Person Household | 180 (65.7%) | 94 (34.3%) |
| Total Housing Units | 1,005 (54.3%) | 846 (45.7%) |
Occupancy by Educational Attainment in Pendleton
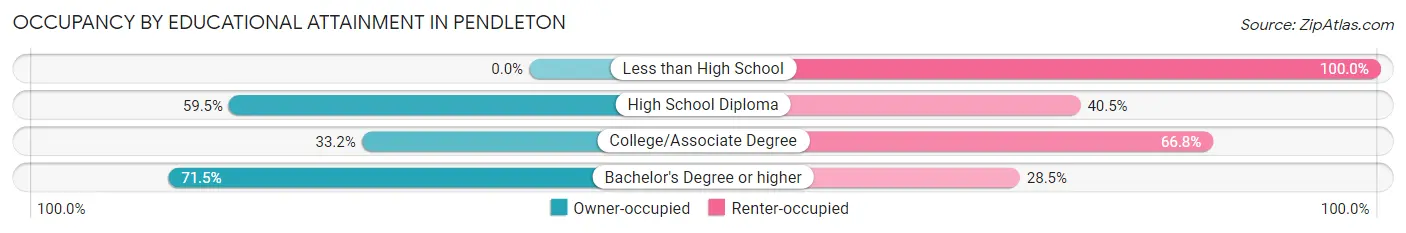
| Household Size | Owner-occupied | Renter-occupied |
| Less than High School | 0 (0.0%) | 149 (100.0%) |
| High School Diploma | 119 (59.5%) | 81 (40.5%) |
| College/Associate Degree | 163 (33.2%) | 328 (66.8%) |
| Bachelor's Degree or higher | 723 (71.5%) | 288 (28.5%) |
Occupancy by Age of Householder in Pendleton
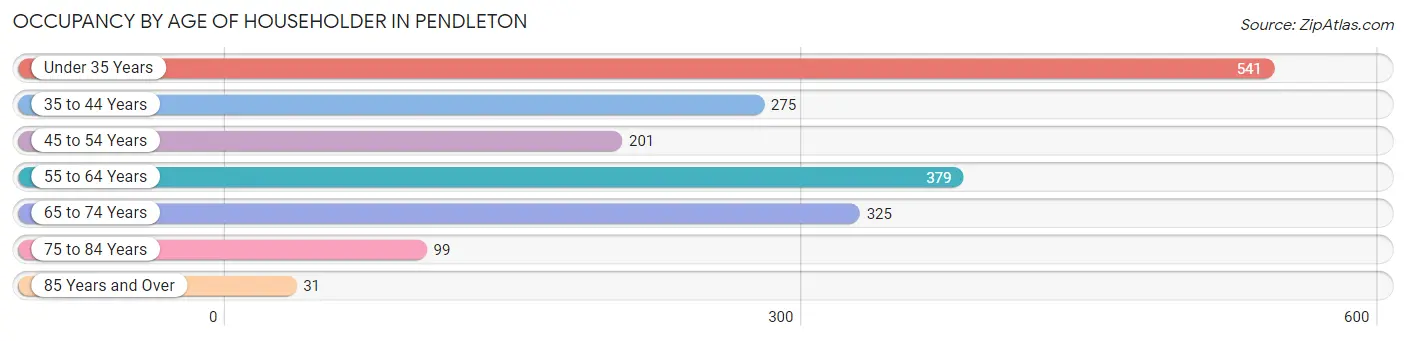
| Age Bracket | # Households | % Households |
| Under 35 Years | 541 | 29.2% |
| 35 to 44 Years | 275 | 14.9% |
| 45 to 54 Years | 201 | 10.9% |
| 55 to 64 Years | 379 | 20.5% |
| 65 to 74 Years | 325 | 17.6% |
| 75 to 84 Years | 99 | 5.3% |
| 85 Years and Over | 31 | 1.7% |
| Total | 1,851 | 100.0% |
Housing Finances in Pendleton
Median Income by Occupancy in Pendleton
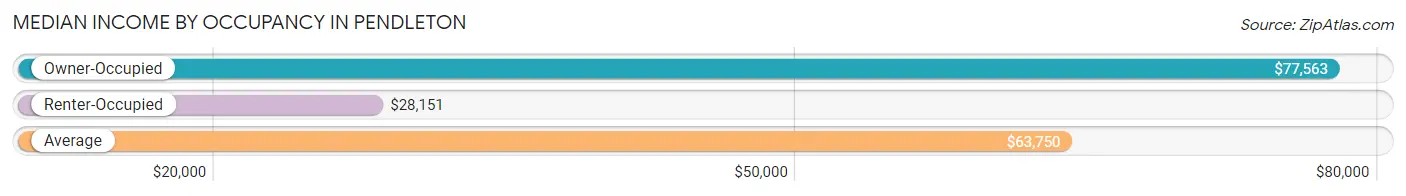
| Occupancy Type | # Households | Median Income |
| Owner-Occupied | 1,005 (54.3%) | $77,563 |
| Renter-Occupied | 846 (45.7%) | $28,151 |
| Average | 1,851 (100.0%) | $63,750 |
Occupancy by Householder Income Bracket in Pendleton
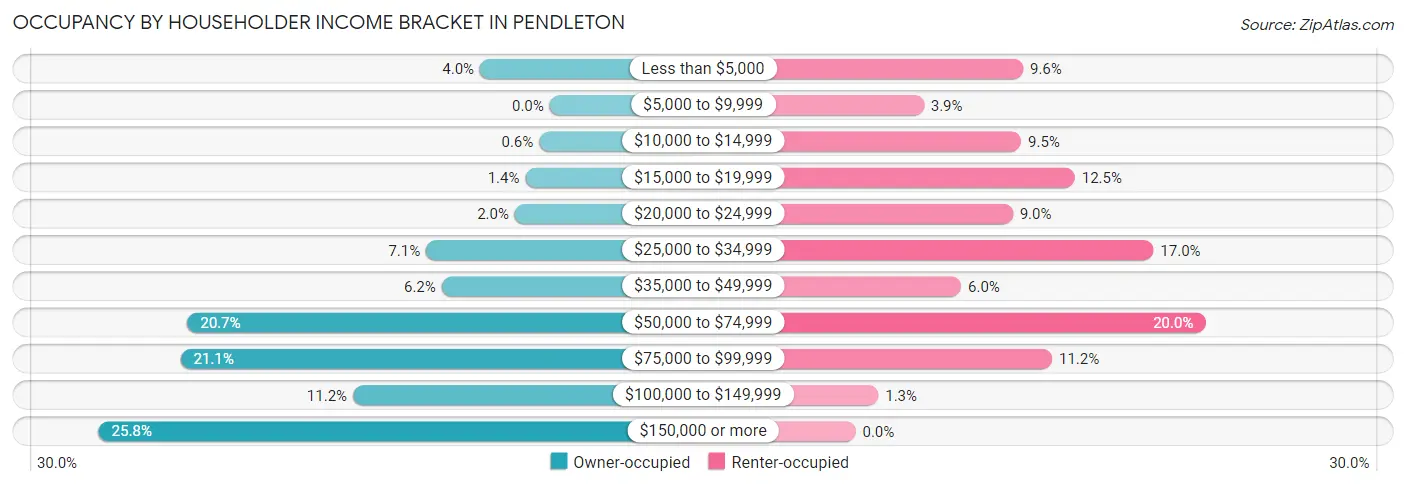
| Income Bracket | Owner-occupied | Renter-occupied |
| Less than $5,000 | 40 (4.0%) | 81 (9.6%) |
| $5,000 to $9,999 | 0 (0.0%) | 33 (3.9%) |
| $10,000 to $14,999 | 6 (0.6%) | 80 (9.5%) |
| $15,000 to $19,999 | 14 (1.4%) | 106 (12.5%) |
| $20,000 to $24,999 | 20 (2.0%) | 76 (9.0%) |
| $25,000 to $34,999 | 71 (7.1%) | 144 (17.0%) |
| $35,000 to $49,999 | 62 (6.2%) | 51 (6.0%) |
| $50,000 to $74,999 | 208 (20.7%) | 169 (20.0%) |
| $75,000 to $99,999 | 212 (21.1%) | 95 (11.2%) |
| $100,000 to $149,999 | 113 (11.2%) | 11 (1.3%) |
| $150,000 or more | 259 (25.8%) | 0 (0.0%) |
| Total | 1,005 (100.0%) | 846 (100.0%) |
Monthly Housing Cost Tiers in Pendleton
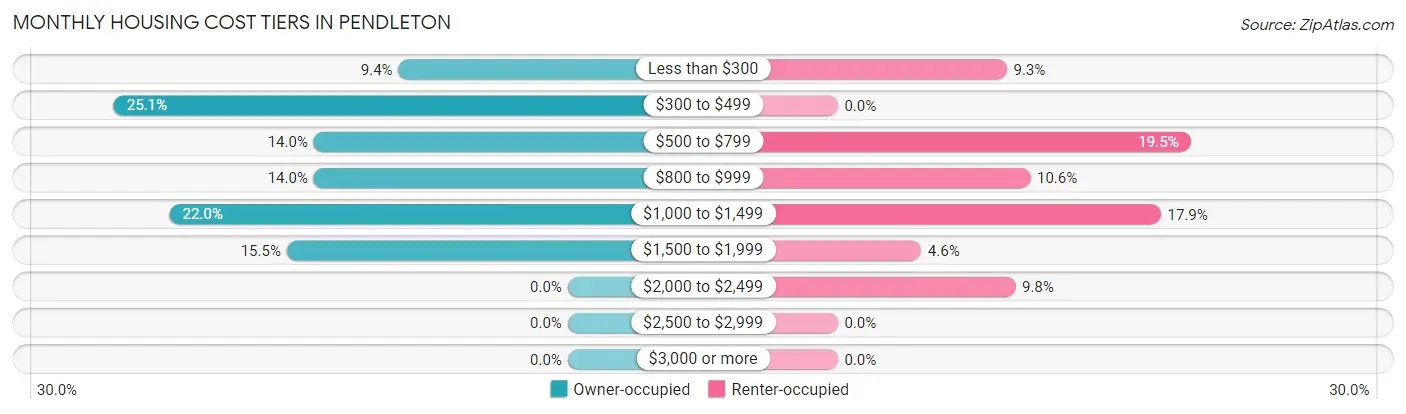
| Monthly Cost | Owner-occupied | Renter-occupied |
| Less than $300 | 94 (9.3%) | 79 (9.3%) |
| $300 to $499 | 252 (25.1%) | 0 (0.0%) |
| $500 to $799 | 141 (14.0%) | 165 (19.5%) |
| $800 to $999 | 141 (14.0%) | 90 (10.6%) |
| $1,000 to $1,499 | 221 (22.0%) | 151 (17.8%) |
| $1,500 to $1,999 | 156 (15.5%) | 39 (4.6%) |
| $2,000 to $2,499 | 0 (0.0%) | 83 (9.8%) |
| $2,500 to $2,999 | 0 (0.0%) | 0 (0.0%) |
| $3,000 or more | 0 (0.0%) | 0 (0.0%) |
| Total | 1,005 (100.0%) | 846 (100.0%) |
Physical Housing Characteristics in Pendleton
Housing Structures in Pendleton
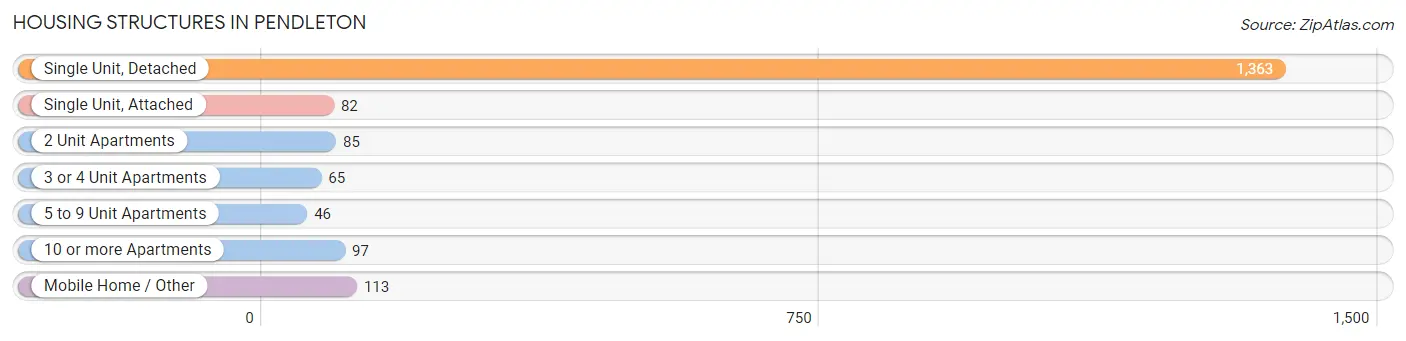
| Structure Type | # Housing Units | % Housing Units |
| Single Unit, Detached | 1,363 | 73.6% |
| Single Unit, Attached | 82 | 4.4% |
| 2 Unit Apartments | 85 | 4.6% |
| 3 or 4 Unit Apartments | 65 | 3.5% |
| 5 to 9 Unit Apartments | 46 | 2.5% |
| 10 or more Apartments | 97 | 5.2% |
| Mobile Home / Other | 113 | 6.1% |
| Total | 1,851 | 100.0% |
Housing Structures by Occupancy in Pendleton
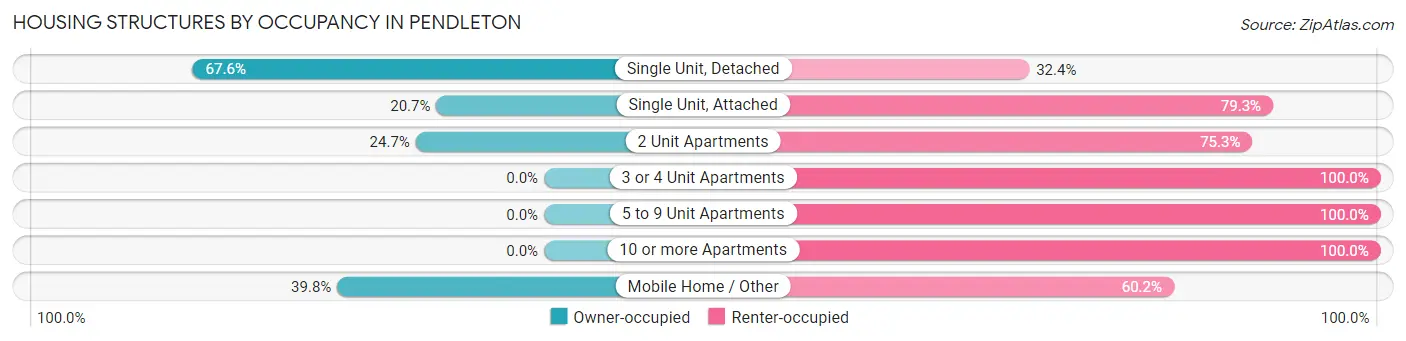
| Structure Type | Owner-occupied | Renter-occupied |
| Single Unit, Detached | 922 (67.6%) | 441 (32.4%) |
| Single Unit, Attached | 17 (20.7%) | 65 (79.3%) |
| 2 Unit Apartments | 21 (24.7%) | 64 (75.3%) |
| 3 or 4 Unit Apartments | 0 (0.0%) | 65 (100.0%) |
| 5 to 9 Unit Apartments | 0 (0.0%) | 46 (100.0%) |
| 10 or more Apartments | 0 (0.0%) | 97 (100.0%) |
| Mobile Home / Other | 45 (39.8%) | 68 (60.2%) |
| Total | 1,005 (54.3%) | 846 (45.7%) |
Housing Structures by Number of Rooms in Pendleton
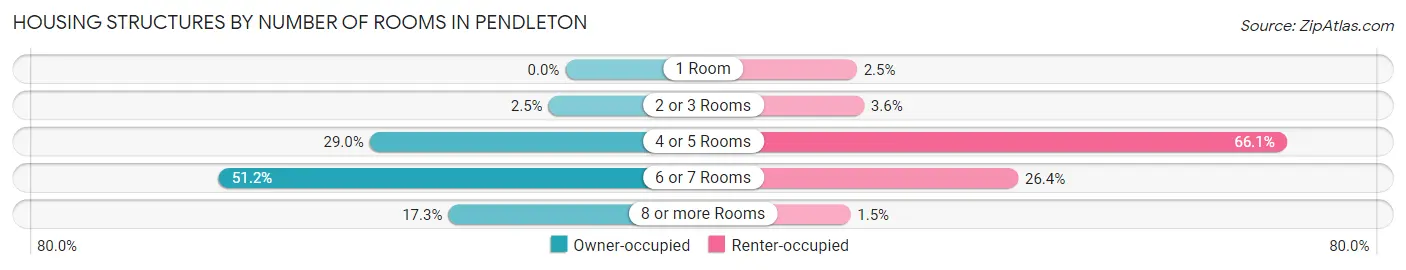
| Number of Rooms | Owner-occupied | Renter-occupied |
| 1 Room | 0 (0.0%) | 21 (2.5%) |
| 2 or 3 Rooms | 25 (2.5%) | 30 (3.5%) |
| 4 or 5 Rooms | 291 (29.0%) | 559 (66.1%) |
| 6 or 7 Rooms | 515 (51.2%) | 223 (26.4%) |
| 8 or more Rooms | 174 (17.3%) | 13 (1.5%) |
| Total | 1,005 (100.0%) | 846 (100.0%) |
Housing Structure by Heating Type in Pendleton
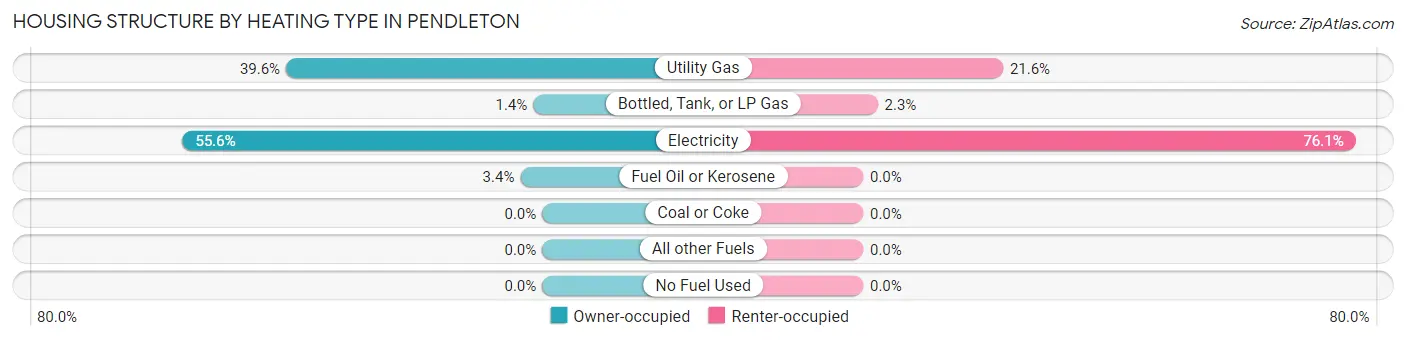
| Heating Type | Owner-occupied | Renter-occupied |
| Utility Gas | 398 (39.6%) | 183 (21.6%) |
| Bottled, Tank, or LP Gas | 14 (1.4%) | 19 (2.2%) |
| Electricity | 559 (55.6%) | 644 (76.1%) |
| Fuel Oil or Kerosene | 34 (3.4%) | 0 (0.0%) |
| Coal or Coke | 0 (0.0%) | 0 (0.0%) |
| All other Fuels | 0 (0.0%) | 0 (0.0%) |
| No Fuel Used | 0 (0.0%) | 0 (0.0%) |
| Total | 1,005 (100.0%) | 846 (100.0%) |
Household Vehicle Usage in Pendleton
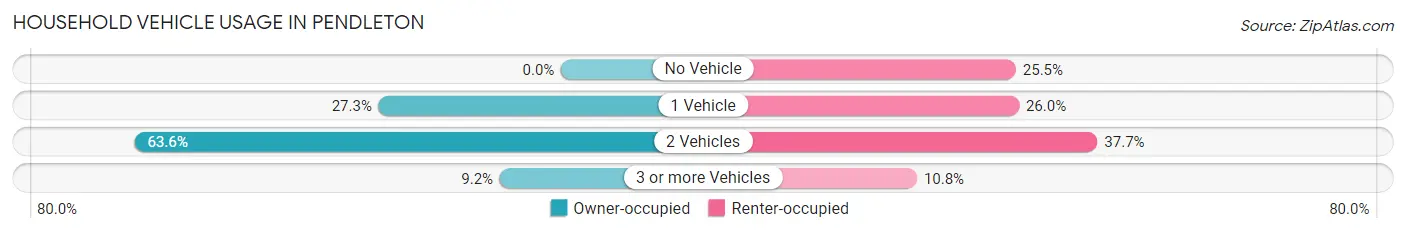
| Vehicles per Household | Owner-occupied | Renter-occupied |
| No Vehicle | 0 (0.0%) | 216 (25.5%) |
| 1 Vehicle | 274 (27.3%) | 220 (26.0%) |
| 2 Vehicles | 639 (63.6%) | 319 (37.7%) |
| 3 or more Vehicles | 92 (9.1%) | 91 (10.8%) |
| Total | 1,005 (100.0%) | 846 (100.0%) |
Real Estate & Mortgages in Pendleton
Real Estate and Mortgage Overview in Pendleton
| Characteristic | Without Mortgage | With Mortgage |
| Housing Units | 426 | 579 |
| Median Property Value | $223,500 | $194,300 |
| Median Household Income | - | - |
| Monthly Housing Costs | $358 | $0 |
| Real Estate Taxes | $848 | $0 |
Property Value by Mortgage Status in Pendleton
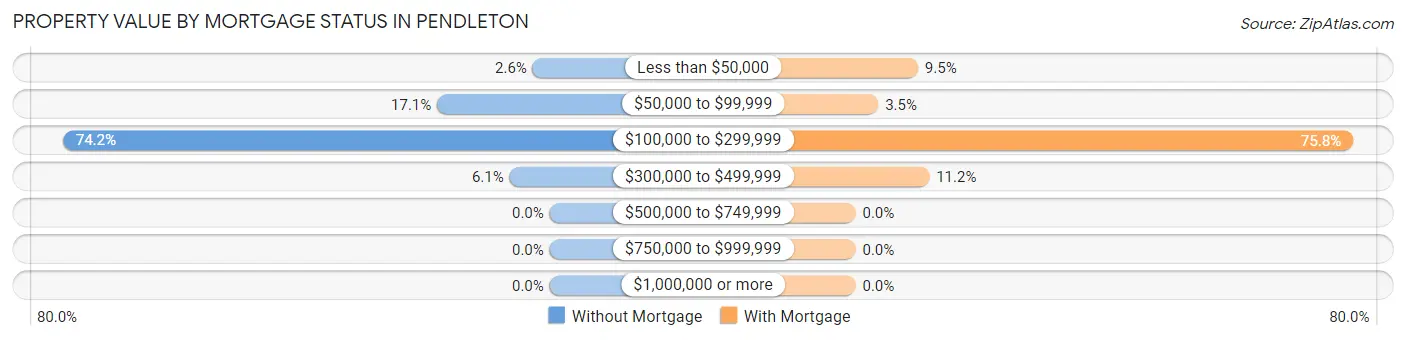
| Property Value | Without Mortgage | With Mortgage |
| Less than $50,000 | 11 (2.6%) | 55 (9.5%) |
| $50,000 to $99,999 | 73 (17.1%) | 20 (3.5%) |
| $100,000 to $299,999 | 316 (74.2%) | 439 (75.8%) |
| $300,000 to $499,999 | 26 (6.1%) | 65 (11.2%) |
| $500,000 to $749,999 | 0 (0.0%) | 0 (0.0%) |
| $750,000 to $999,999 | 0 (0.0%) | 0 (0.0%) |
| $1,000,000 or more | 0 (0.0%) | 0 (0.0%) |
| Total | 426 (100.0%) | 579 (100.0%) |
Household Income by Mortgage Status in Pendleton
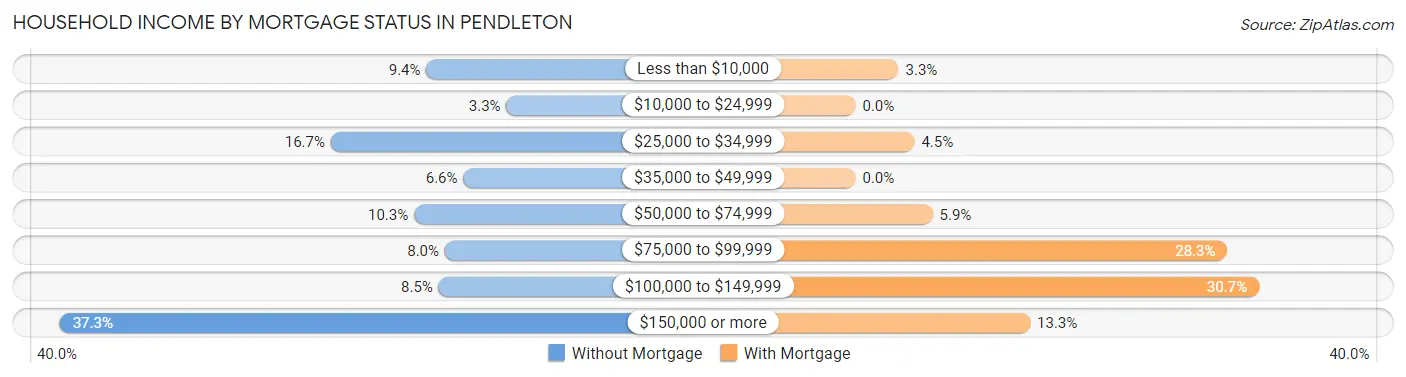
| Household Income | Without Mortgage | With Mortgage |
| Less than $10,000 | 40 (9.4%) | 19 (3.3%) |
| $10,000 to $24,999 | 14 (3.3%) | 0 (0.0%) |
| $25,000 to $34,999 | 71 (16.7%) | 26 (4.5%) |
| $35,000 to $49,999 | 28 (6.6%) | 0 (0.0%) |
| $50,000 to $74,999 | 44 (10.3%) | 34 (5.9%) |
| $75,000 to $99,999 | 34 (8.0%) | 164 (28.3%) |
| $100,000 to $149,999 | 36 (8.5%) | 178 (30.7%) |
| $150,000 or more | 159 (37.3%) | 77 (13.3%) |
| Total | 426 (100.0%) | 579 (100.0%) |
Property Value to Household Income Ratio in Pendleton
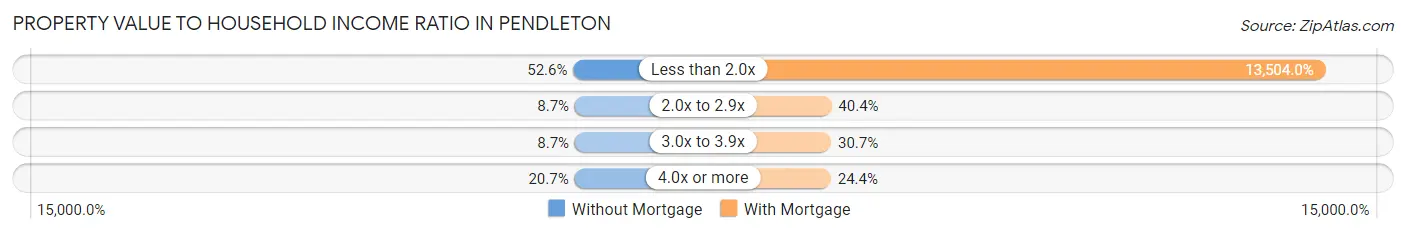
| Value-to-Income Ratio | Without Mortgage | With Mortgage |
| Less than 2.0x | 224 (52.6%) | 78,188 (13,504.0%) |
| 2.0x to 2.9x | 37 (8.7%) | 234 (40.4%) |
| 3.0x to 3.9x | 37 (8.7%) | 178 (30.7%) |
| 4.0x or more | 88 (20.7%) | 141 (24.3%) |
| Total | 426 (100.0%) | 579 (100.0%) |
Real Estate Taxes by Mortgage Status in Pendleton
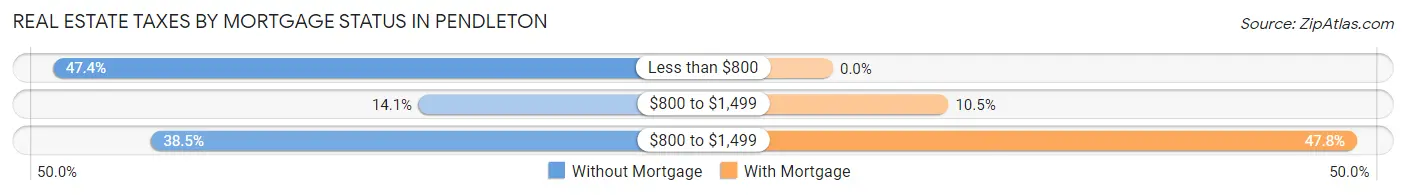
| Property Taxes | Without Mortgage | With Mortgage |
| Less than $800 | 202 (47.4%) | 0 (0.0%) |
| $800 to $1,499 | 60 (14.1%) | 61 (10.5%) |
| $800 to $1,499 | 164 (38.5%) | 277 (47.8%) |
| Total | 426 (100.0%) | 579 (100.0%) |
Health & Disability in Pendleton
Health Insurance Coverage by Age in Pendleton
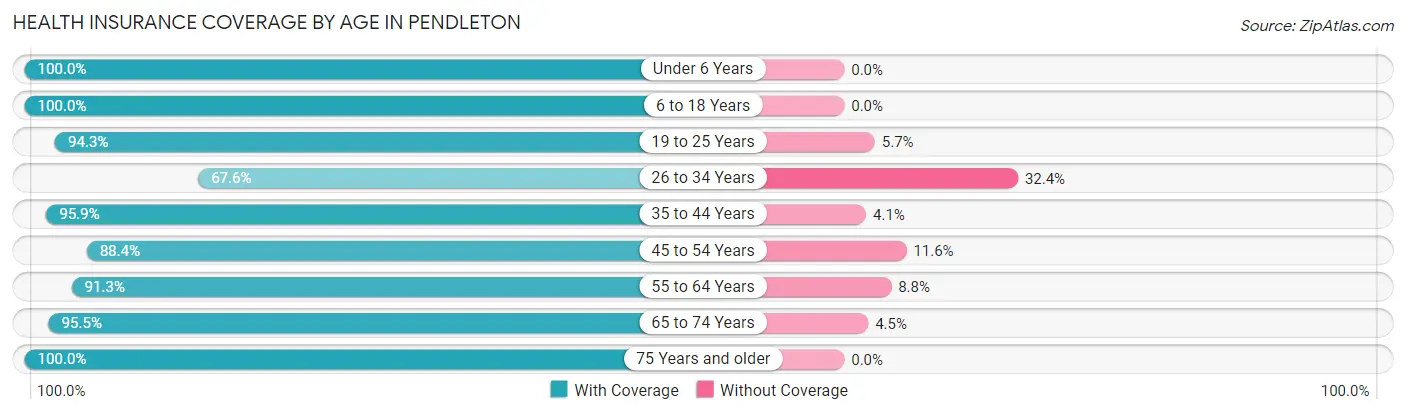
| Age Bracket | With Coverage | Without Coverage |
| Under 6 Years | 237 (100.0%) | 0 (0.0%) |
| 6 to 18 Years | 309 (100.0%) | 0 (0.0%) |
| 19 to 25 Years | 480 (94.3%) | 29 (5.7%) |
| 26 to 34 Years | 332 (67.6%) | 159 (32.4%) |
| 35 to 44 Years | 425 (95.9%) | 18 (4.1%) |
| 45 to 54 Years | 290 (88.4%) | 38 (11.6%) |
| 55 to 64 Years | 459 (91.2%) | 44 (8.7%) |
| 65 to 74 Years | 428 (95.5%) | 20 (4.5%) |
| 75 Years and older | 230 (100.0%) | 0 (0.0%) |
| Total | 3,190 (91.2%) | 308 (8.8%) |
Health Insurance Coverage by Citizenship Status in Pendleton
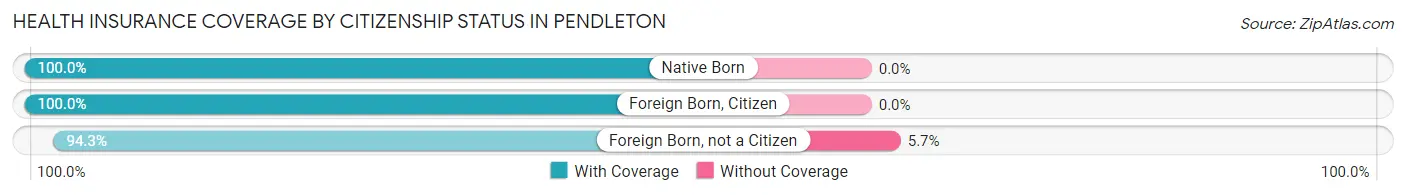
| Citizenship Status | With Coverage | Without Coverage |
| Native Born | 237 (100.0%) | 0 (0.0%) |
| Foreign Born, Citizen | 309 (100.0%) | 0 (0.0%) |
| Foreign Born, not a Citizen | 480 (94.3%) | 29 (5.7%) |
Health Insurance Coverage by Household Income in Pendleton
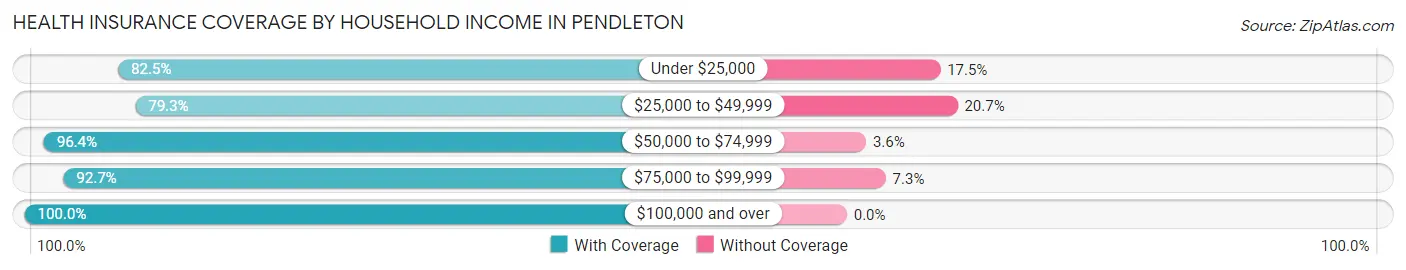
| Household Income | With Coverage | Without Coverage |
| Under $25,000 | 514 (82.5%) | 109 (17.5%) |
| $25,000 to $49,999 | 470 (79.3%) | 123 (20.7%) |
| $50,000 to $74,999 | 776 (96.4%) | 29 (3.6%) |
| $75,000 to $99,999 | 599 (92.7%) | 47 (7.3%) |
| $100,000 and over | 831 (100.0%) | 0 (0.0%) |
Public vs Private Health Insurance Coverage by Age in Pendleton
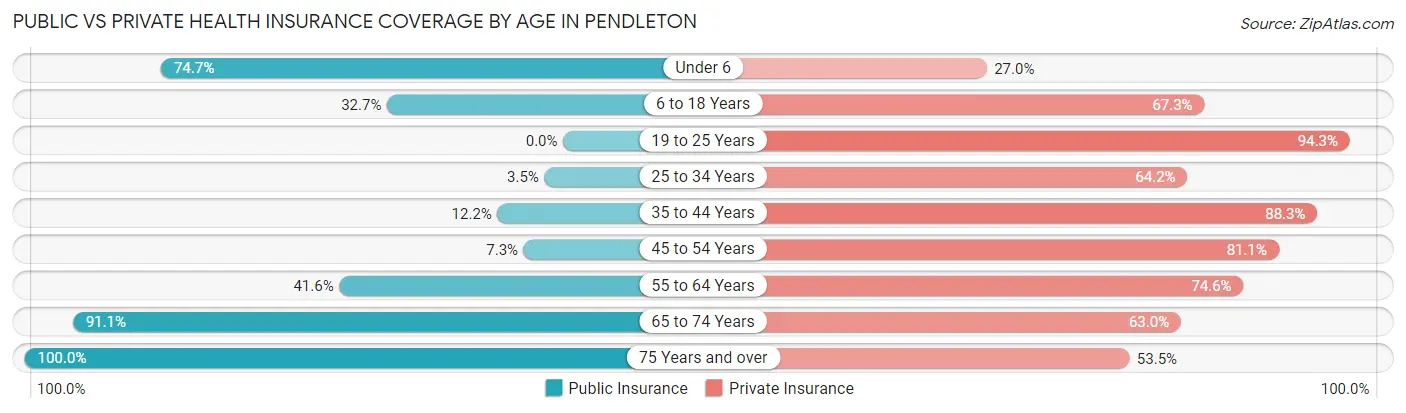
| Age Bracket | Public Insurance | Private Insurance |
| Under 6 | 177 (74.7%) | 64 (27.0%) |
| 6 to 18 Years | 101 (32.7%) | 208 (67.3%) |
| 19 to 25 Years | 0 (0.0%) | 480 (94.3%) |
| 25 to 34 Years | 17 (3.5%) | 315 (64.1%) |
| 35 to 44 Years | 54 (12.2%) | 391 (88.3%) |
| 45 to 54 Years | 24 (7.3%) | 266 (81.1%) |
| 55 to 64 Years | 209 (41.5%) | 375 (74.6%) |
| 65 to 74 Years | 408 (91.1%) | 282 (62.9%) |
| 75 Years and over | 230 (100.0%) | 123 (53.5%) |
| Total | 1,220 (34.9%) | 2,504 (71.6%) |
Disability Status by Sex by Age in Pendleton
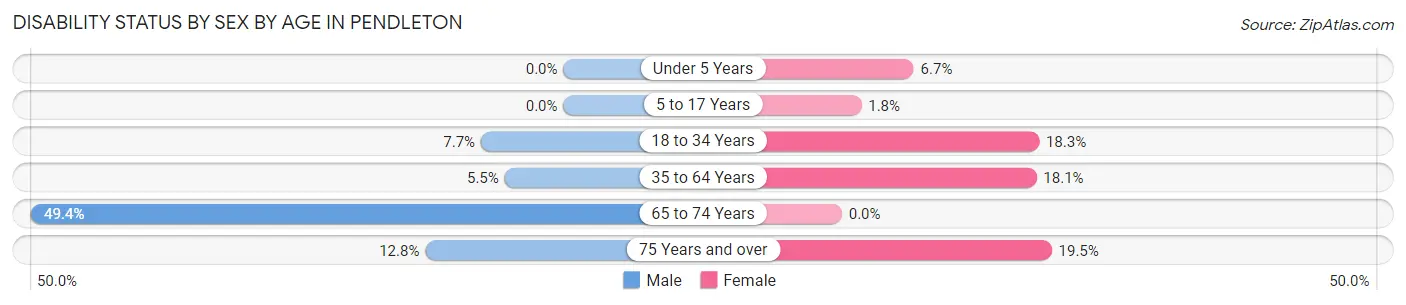
| Age Bracket | Male | Female |
| Under 5 Years | 0 (0.0%) | 4 (6.7%) |
| 5 to 17 Years | 0 (0.0%) | 3 (1.8%) |
| 18 to 34 Years | 28 (7.6%) | 116 (18.3%) |
| 35 to 64 Years | 29 (5.4%) | 134 (18.1%) |
| 65 to 74 Years | 165 (49.4%) | 0 (0.0%) |
| 75 Years and over | 15 (12.8%) | 22 (19.5%) |
Disability Class by Sex by Age in Pendleton
Disability Class: Hearing Difficulty
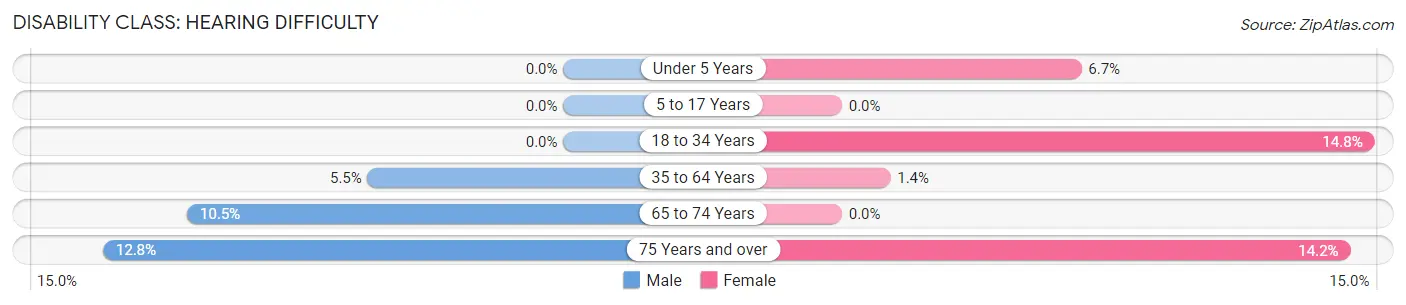
| Age Bracket | Male | Female |
| Under 5 Years | 0 (0.0%) | 4 (6.7%) |
| 5 to 17 Years | 0 (0.0%) | 0 (0.0%) |
| 18 to 34 Years | 0 (0.0%) | 94 (14.8%) |
| 35 to 64 Years | 29 (5.4%) | 10 (1.3%) |
| 65 to 74 Years | 35 (10.5%) | 0 (0.0%) |
| 75 Years and over | 15 (12.8%) | 16 (14.2%) |
Disability Class: Vision Difficulty
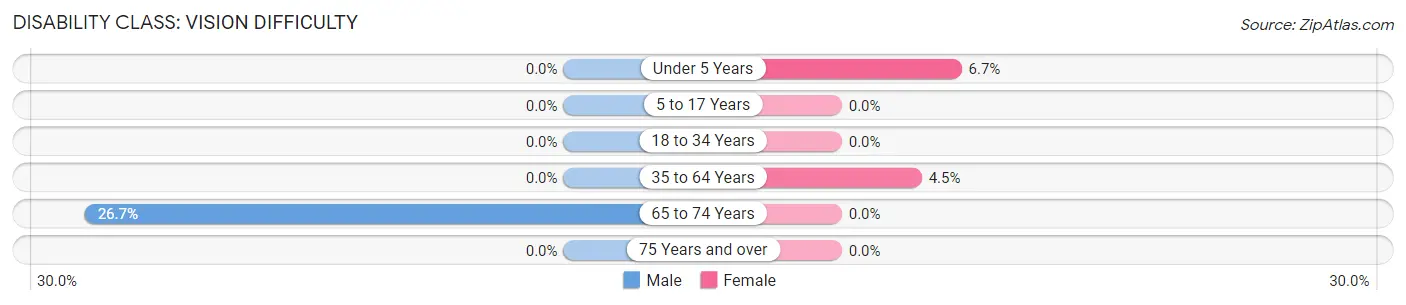
| Age Bracket | Male | Female |
| Under 5 Years | 0 (0.0%) | 4 (6.7%) |
| 5 to 17 Years | 0 (0.0%) | 0 (0.0%) |
| 18 to 34 Years | 0 (0.0%) | 0 (0.0%) |
| 35 to 64 Years | 0 (0.0%) | 33 (4.4%) |
| 65 to 74 Years | 89 (26.7%) | 0 (0.0%) |
| 75 Years and over | 0 (0.0%) | 0 (0.0%) |
Disability Class: Cognitive Difficulty
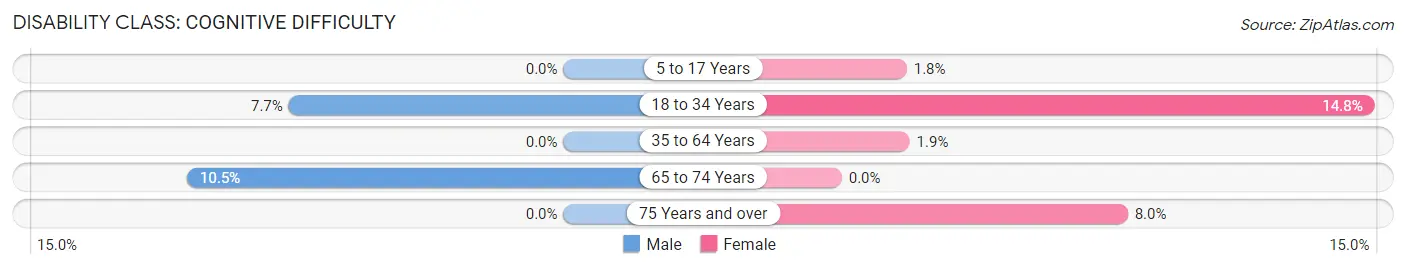
| Age Bracket | Male | Female |
| 5 to 17 Years | 0 (0.0%) | 3 (1.8%) |
| 18 to 34 Years | 28 (7.6%) | 94 (14.8%) |
| 35 to 64 Years | 0 (0.0%) | 14 (1.9%) |
| 65 to 74 Years | 35 (10.5%) | 0 (0.0%) |
| 75 Years and over | 0 (0.0%) | 9 (8.0%) |
Disability Class: Ambulatory Difficulty
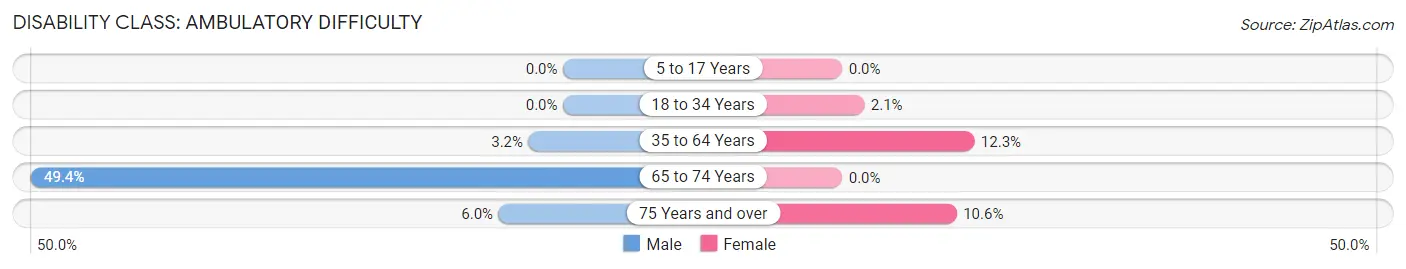
| Age Bracket | Male | Female |
| 5 to 17 Years | 0 (0.0%) | 0 (0.0%) |
| 18 to 34 Years | 0 (0.0%) | 13 (2.1%) |
| 35 to 64 Years | 17 (3.2%) | 91 (12.3%) |
| 65 to 74 Years | 165 (49.4%) | 0 (0.0%) |
| 75 Years and over | 7 (6.0%) | 12 (10.6%) |
Disability Class: Self-Care Difficulty
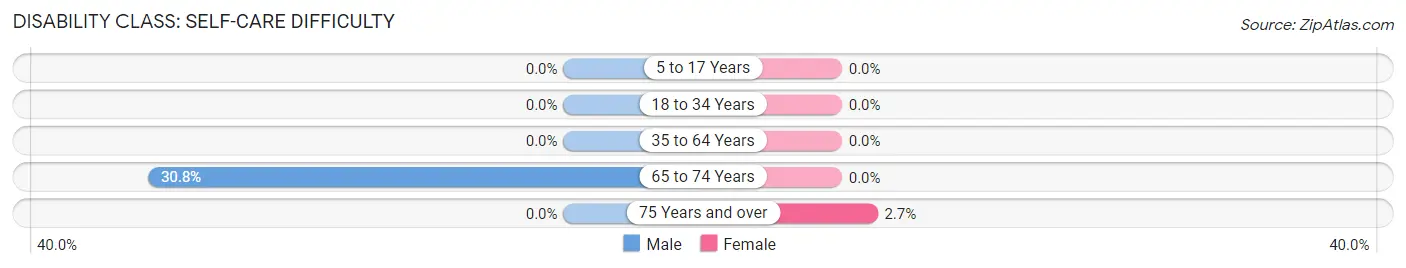
| Age Bracket | Male | Female |
| 5 to 17 Years | 0 (0.0%) | 0 (0.0%) |
| 18 to 34 Years | 0 (0.0%) | 0 (0.0%) |
| 35 to 64 Years | 0 (0.0%) | 0 (0.0%) |
| 65 to 74 Years | 103 (30.8%) | 0 (0.0%) |
| 75 Years and over | 0 (0.0%) | 3 (2.6%) |
Technology Access in Pendleton
Computing Device Access in Pendleton
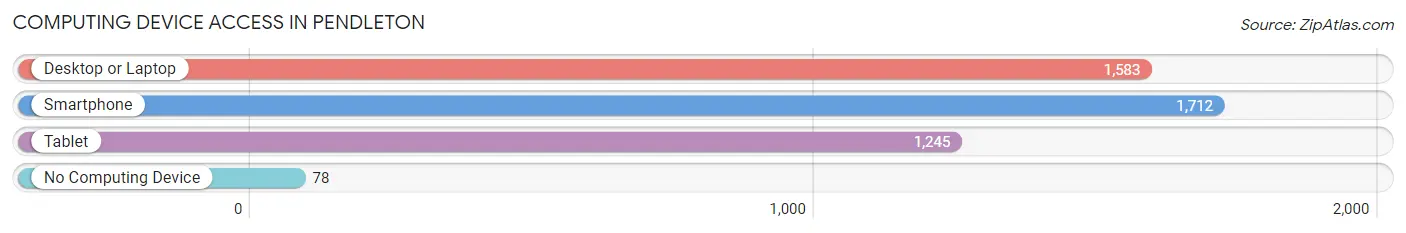
| Device Type | # Households | % Households |
| Desktop or Laptop | 1,583 | 85.5% |
| Smartphone | 1,712 | 92.5% |
| Tablet | 1,245 | 67.3% |
| No Computing Device | 78 | 4.2% |
| Total | 1,851 | 100.0% |
Internet Access in Pendleton
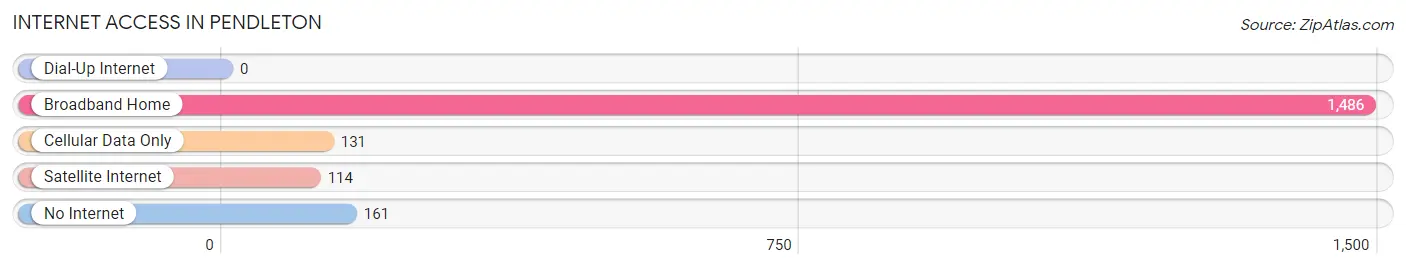
| Internet Type | # Households | % Households |
| Dial-Up Internet | 0 | 0.0% |
| Broadband Home | 1,486 | 80.3% |
| Cellular Data Only | 131 | 7.1% |
| Satellite Internet | 114 | 6.2% |
| No Internet | 161 | 8.7% |
| Total | 1,851 | 100.0% |
Pendleton Summary
Pendleton, South Carolina is a small town located in Anderson County, South Carolina. It is situated in the foothills of the Blue Ridge Mountains and is part of the Upstate region of South Carolina. The town has a population of approximately 2,000 people and is located about 25 miles from the city of Greenville.
History
Pendleton was founded in 1790 by Revolutionary War veteran Richard Pearis. He named the town after his father, Thomas Pendleton, who was a prominent figure in the area. The town was originally a trading post and was the first settlement in Anderson County. In 1815, the town was incorporated and the first post office was established.
In the early 19th century, Pendleton was a thriving agricultural community. Cotton was the main crop grown in the area and the town was home to several cotton mills. The town also had a thriving business district with several stores, banks, and other businesses.
In the late 19th century, Pendleton began to decline as the cotton industry moved away from the area. The town was also affected by the Great Depression and World War II. After the war, the town began to slowly recover and the population began to grow again.
Geography
Pendleton is located in the foothills of the Blue Ridge Mountains in Anderson County, South Carolina. The town is situated at an elevation of 830 feet above sea level. The town is located about 25 miles from the city of Greenville and is part of the Upstate region of South Carolina.
The town is located in a rural area and is surrounded by forests and farmland. The town is also located near several lakes, including Lake Hartwell and Lake Keowee.
Economy
The economy of Pendleton is largely based on agriculture and tourism. The town is home to several farms that produce a variety of crops, including cotton, corn, soybeans, and wheat. The town is also home to several wineries and vineyards.
Tourism is also an important part of the economy of Pendleton. The town is home to several historic sites, including the Pendleton Historic District, which is listed on the National Register of Historic Places. The town is also home to several parks and recreational areas, including the Pendleton Recreation Area.
Demographics
As of the 2010 census, the population of Pendleton was 2,042. The racial makeup of the town was 87.3% White, 8.7% African American, 0.3% Native American, 0.7% Asian, 0.1% Pacific Islander, 1.2% from other races, and 1.9% from two or more races. Hispanic or Latino of any race were 3.2% of the population.
The median household income in Pendleton was $37,917, and the median family income was $45,938. The per capita income in Pendleton was $20,845. About 11.2% of families and 14.2% of the population were below the poverty line, including 19.2% of those under age 18 and 8.2% of those age 65 or over.
Common Questions
What is Per Capita Income in Pendleton?
Per Capita income in Pendleton is $41,200.
What is the Median Family Income in Pendleton?
Median Family Income in Pendleton is $82,708.
What is the Median Household income in Pendleton?
Median Household Income in Pendleton is $63,750.
What is Income or Wage Gap in Pendleton?
Income or Wage Gap in Pendleton is 31.6%.
Women in Pendleton earn 68.4 cents for every dollar earned by a man.
What is Family Income Deficit in Pendleton?
Family Income Deficit in Pendleton is $4,984.
Families that are below poverty line in Pendleton earn $4,984 less on average than the poverty threshold level.
What is Inequality or Gini Index in Pendleton?
Inequality or Gini Index in Pendleton is 0.53.
What is the Total Population of Pendleton?
Total Population of Pendleton is 3,498.
What is the Total Male Population of Pendleton?
Total Male Population of Pendleton is 1,669.
What is the Total Female Population of Pendleton?
Total Female Population of Pendleton is 1,829.
What is the Ratio of Males per 100 Females in Pendleton?
There are 91.25 Males per 100 Females in Pendleton.
What is the Ratio of Females per 100 Males in Pendleton?
There are 109.59 Females per 100 Males in Pendleton.
What is the Median Population Age in Pendleton?
Median Population Age in Pendleton is 40.7 Years.
What is the Average Family Size in Pendleton
Average Family Size in Pendleton is 2.5 People.
What is the Average Household Size in Pendleton
Average Household Size in Pendleton is 1.9 People.
How Large is the Labor Force in Pendleton?
There are 1,875 People in the Labor Forcein in Pendleton.
What is the Percentage of People in the Labor Force in Pendleton?
62.0% of People are in the Labor Force in Pendleton.
What is the Unemployment Rate in Pendleton?
Unemployment Rate in Pendleton is 2.9%.