Napanoch, NY Map & Demographics
Napanoch Map
Napanoch Overview
$43,747
PER CAPITA INCOME
$132,171
AVG FAMILY INCOME
$78,125
AVG HOUSEHOLD INCOME
29.4%
WAGE / INCOME GAP [ % ]
70.6¢/ $1
WAGE / INCOME GAP [ $ ]
0.40
INEQUALITY / GINI INDEX
843
TOTAL POPULATION
375
MALE POPULATION
468
FEMALE POPULATION
80.13
MALES / 100 FEMALES
124.80
FEMALES / 100 MALES
52.0
MEDIAN AGE
3.0
AVG FAMILY SIZE
2.2
AVG HOUSEHOLD SIZE
443
LABOR FORCE [ PEOPLE ]
59.1%
PERCENT IN LABOR FORCE
2.3%
UNEMPLOYMENT RATE
Napanoch Zip Codes
Napanoch Area Codes
Income in Napanoch
Income Overview in Napanoch
Per Capita Income in Napanoch is $43,747, while median incomes of families and households are $132,171 and $78,125 respectively.
| Characteristic | Number | Measure |
| Per Capita Income | 843 | $43,747 |
| Median Family Income | 211 | $132,171 |
| Mean Family Income | 211 | $130,145 |
| Median Household Income | 389 | $78,125 |
| Mean Household Income | 389 | $92,347 |
| Income Deficit | 211 | $0 |
| Wage / Income Gap (%) | 843 | 29.43% |
| Wage / Income Gap ($) | 843 | 70.57¢ per $1 |
| Gini / Inequality Index | 843 | 0.40 |
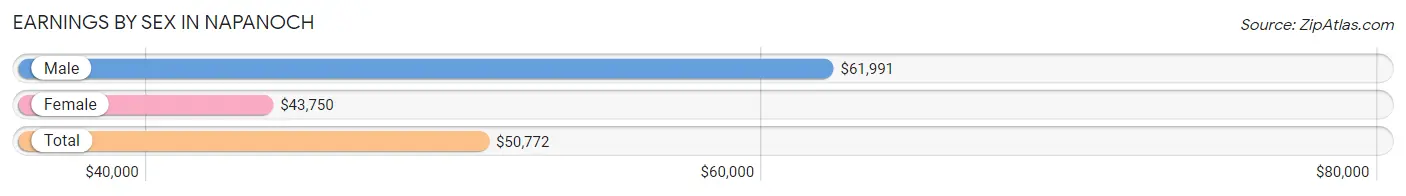
Earnings by Sex in Napanoch
Average Earnings in Napanoch are $50,772, $61,991 for men and $43,750 for women, a difference of 29.4%.
| Sex | Number | Average Earnings |
| Male | 191 (38.6%) | $61,991 |
| Female | 304 (61.4%) | $43,750 |
| Total | 495 (100.0%) | $50,772 |
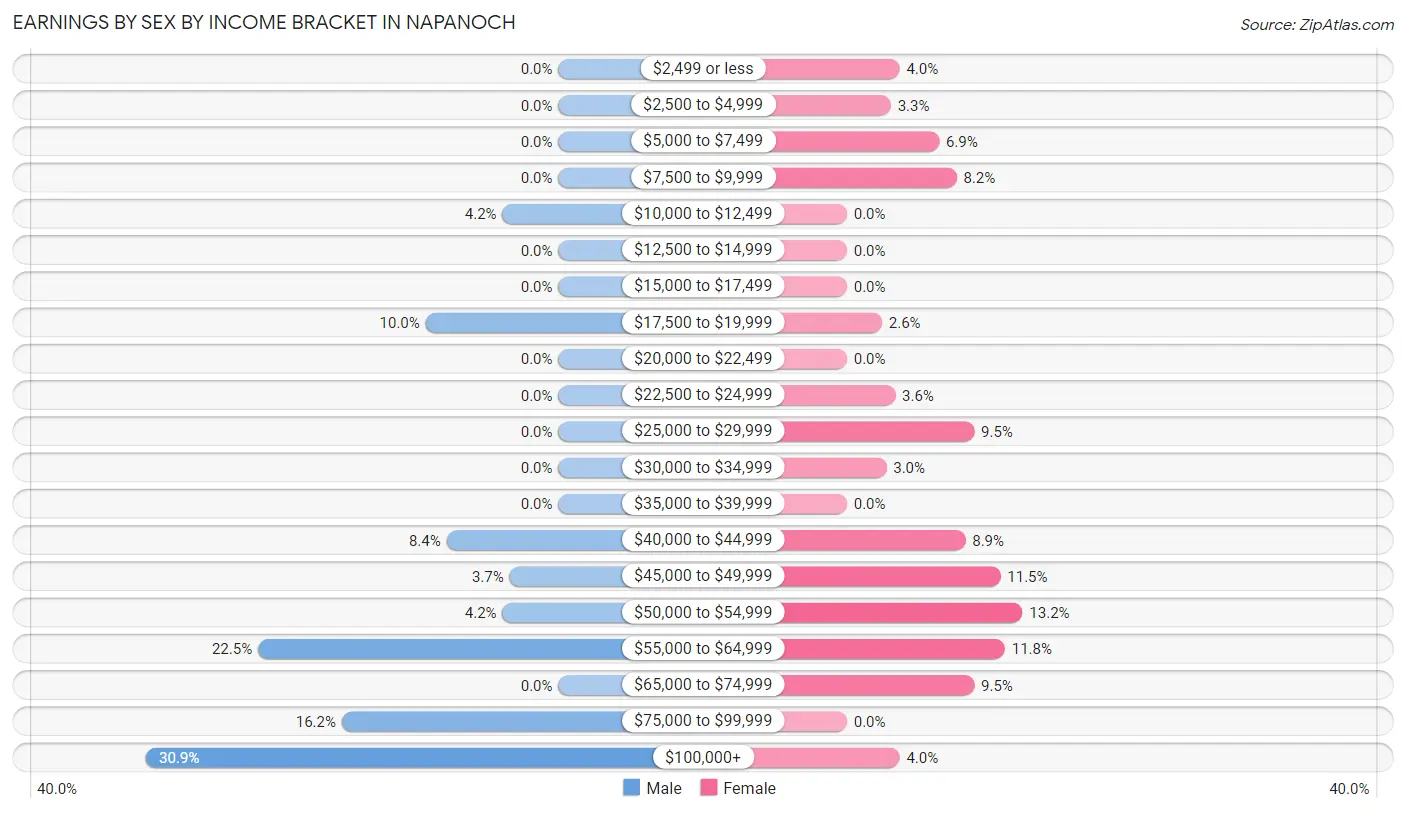
Earnings by Sex by Income Bracket in Napanoch
The most common earnings brackets in Napanoch are $100,000+ for men (59 | 30.9%) and $50,000 to $54,999 for women (40 | 13.2%).
| Income | Male | Female |
| $2,499 or less | 0 (0.0%) | 12 (4.0%) |
| $2,500 to $4,999 | 0 (0.0%) | 10 (3.3%) |
| $5,000 to $7,499 | 0 (0.0%) | 21 (6.9%) |
| $7,500 to $9,999 | 0 (0.0%) | 25 (8.2%) |
| $10,000 to $12,499 | 8 (4.2%) | 0 (0.0%) |
| $12,500 to $14,999 | 0 (0.0%) | 0 (0.0%) |
| $15,000 to $17,499 | 0 (0.0%) | 0 (0.0%) |
| $17,500 to $19,999 | 19 (10.0%) | 8 (2.6%) |
| $20,000 to $22,499 | 0 (0.0%) | 0 (0.0%) |
| $22,500 to $24,999 | 0 (0.0%) | 11 (3.6%) |
| $25,000 to $29,999 | 0 (0.0%) | 29 (9.5%) |
| $30,000 to $34,999 | 0 (0.0%) | 9 (3.0%) |
| $35,000 to $39,999 | 0 (0.0%) | 0 (0.0%) |
| $40,000 to $44,999 | 16 (8.4%) | 27 (8.9%) |
| $45,000 to $49,999 | 7 (3.7%) | 35 (11.5%) |
| $50,000 to $54,999 | 8 (4.2%) | 40 (13.2%) |
| $55,000 to $64,999 | 43 (22.5%) | 36 (11.8%) |
| $65,000 to $74,999 | 0 (0.0%) | 29 (9.5%) |
| $75,000 to $99,999 | 31 (16.2%) | 0 (0.0%) |
| $100,000+ | 59 (30.9%) | 12 (4.0%) |
| Total | 191 (100.0%) | 304 (100.0%) |
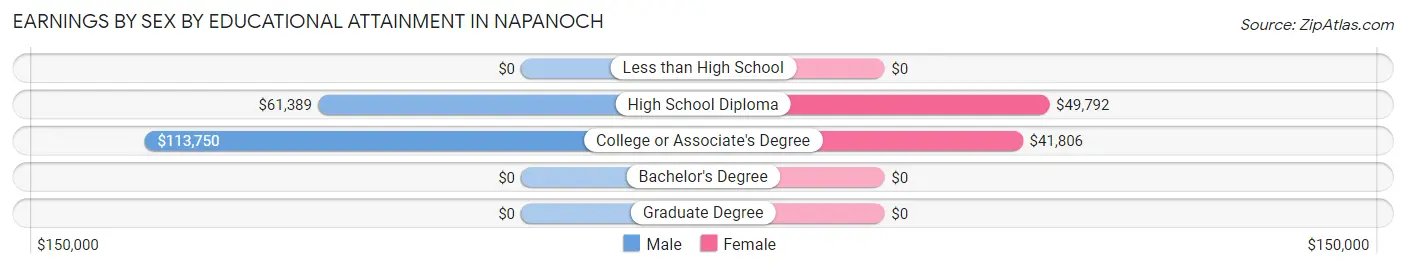
Earnings by Sex by Educational Attainment in Napanoch
Average earnings in Napanoch are $61,991 for men and $50,433 for women, a difference of 18.6%. Men with an educational attainment of college or associate's degree enjoy the highest average annual earnings of $113,750, while those with high school diploma education earn the least with $61,389. Women with an educational attainment of high school diploma earn the most with the average annual earnings of $49,792, while those with college or associate's degree education have the smallest earnings of $41,806.
| Educational Attainment | Male Income | Female Income |
| Less than High School | - | - |
| High School Diploma | $61,389 | $49,792 |
| College or Associate's Degree | $113,750 | $41,806 |
| Bachelor's Degree | - | - |
| Graduate Degree | - | - |
| Total | $61,991 | $50,433 |
Family Income in Napanoch
Family Income Brackets in Napanoch
According to the Napanoch family income data, there are 64 families falling into the $150,000 to $199,999 income range, which is the most common income bracket and makes up 30.3% of all families.
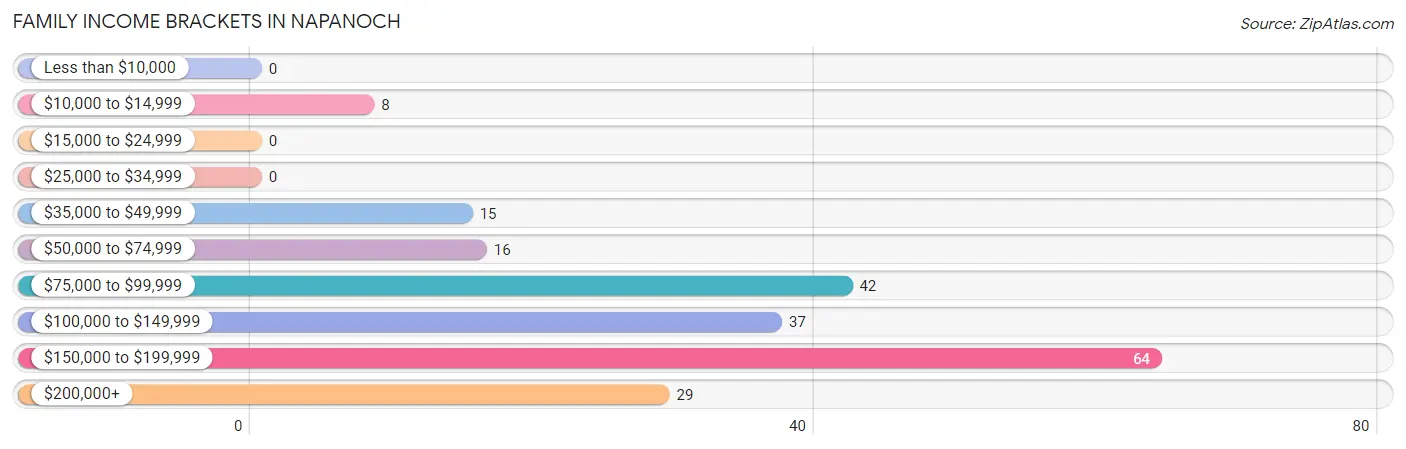
| Income Bracket | # Families | % Families |
| Less than $10,000 | 0 | 0.0% |
| $10,000 to $14,999 | 8 | 3.8% |
| $15,000 to $24,999 | 0 | 0.0% |
| $25,000 to $34,999 | 0 | 0.0% |
| $35,000 to $49,999 | 15 | 7.1% |
| $50,000 to $74,999 | 16 | 7.6% |
| $75,000 to $99,999 | 42 | 19.9% |
| $100,000 to $149,999 | 37 | 17.5% |
| $150,000 to $199,999 | 64 | 30.3% |
| $200,000+ | 29 | 13.7% |
Family Income by Famaliy Size in Napanoch
3-person families (98 | 46.5%) account for the highest median family income in Napanoch with $160,833 per family, while 2-person families (79 | 37.4%) have the highest median income of $56,484 per family member.
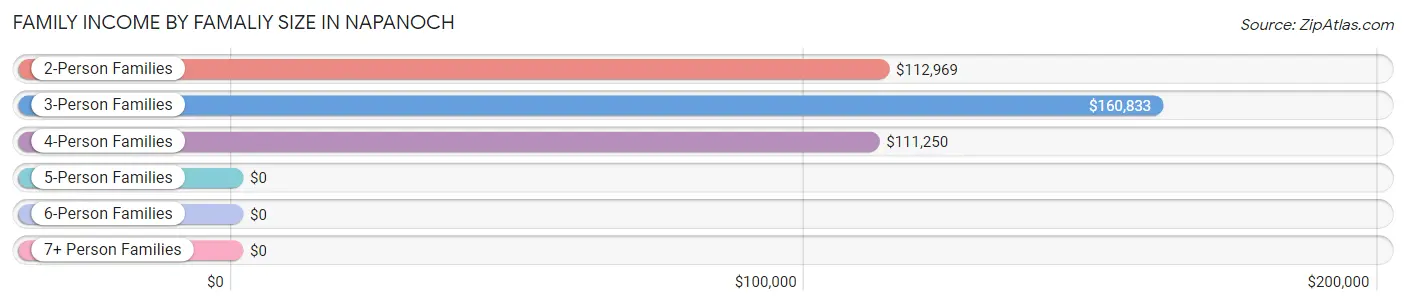
| Income Bracket | # Families | Median Income |
| 2-Person Families | 79 (37.4%) | $112,969 |
| 3-Person Families | 98 (46.5%) | $160,833 |
| 4-Person Families | 34 (16.1%) | $111,250 |
| 5-Person Families | 0 (0.0%) | $0 |
| 6-Person Families | 0 (0.0%) | $0 |
| 7+ Person Families | 0 (0.0%) | $0 |
| Total | 211 (100.0%) | $132,171 |
Family Income by Number of Earners in Napanoch
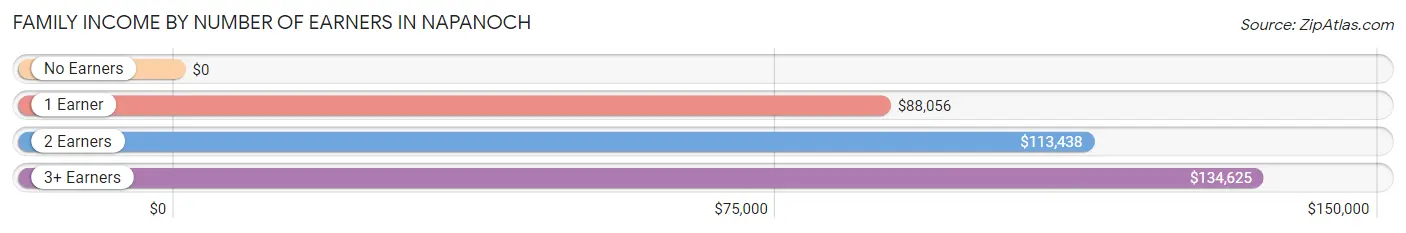
| Number of Earners | # Families | Median Income |
| No Earners | 32 (15.2%) | $0 |
| 1 Earner | 52 (24.6%) | $88,056 |
| 2 Earners | 72 (34.1%) | $113,438 |
| 3+ Earners | 55 (26.1%) | $134,625 |
| Total | 211 (100.0%) | $132,171 |
Household Income in Napanoch
Household Income Brackets in Napanoch
With 67 households falling in the category, the $100,000 to $149,999 income range is the most frequent in Napanoch, accounting for 17.2% of all households. In contrast, only 8 households (2.1%) fall into the $10,000 to $14,999 income bracket, making it the least populous group.
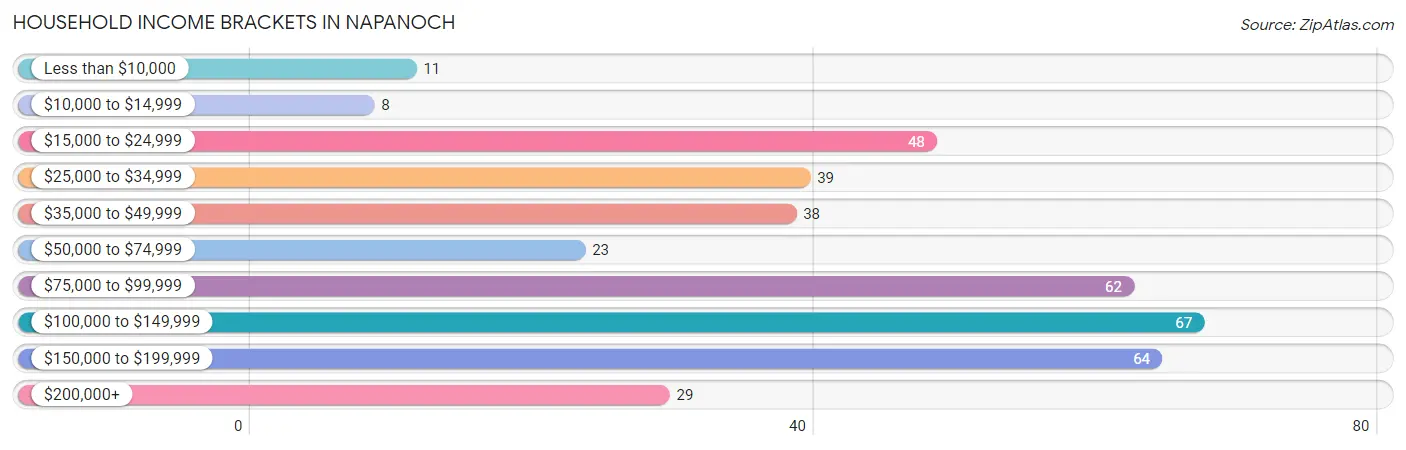
| Income Bracket | # Households | % Households |
| Less than $10,000 | 11 | 2.8% |
| $10,000 to $14,999 | 8 | 2.1% |
| $15,000 to $24,999 | 48 | 12.3% |
| $25,000 to $34,999 | 39 | 10.0% |
| $35,000 to $49,999 | 38 | 9.8% |
| $50,000 to $74,999 | 23 | 5.9% |
| $75,000 to $99,999 | 62 | 15.9% |
| $100,000 to $149,999 | 67 | 17.2% |
| $150,000 to $199,999 | 64 | 16.5% |
| $200,000+ | 29 | 7.5% |
Household Income by Householder Age in Napanoch
The median household income in Napanoch is $78,125, with the highest median household income of $112,574 found in the 45 to 64 years age bracket for the primary householder. A total of 162 households (41.6%) fall into this category.
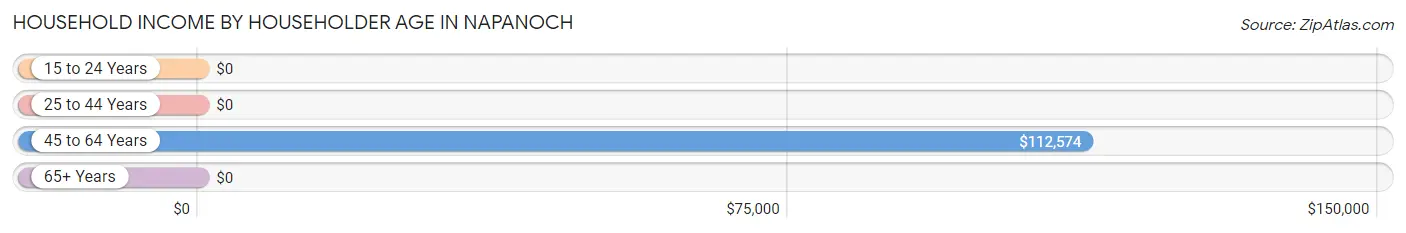
| Income Bracket | # Households | Median Income |
| 15 to 24 Years | 0 (0.0%) | $0 |
| 25 to 44 Years | 49 (12.6%) | $0 |
| 45 to 64 Years | 162 (41.6%) | $112,574 |
| 65+ Years | 178 (45.8%) | $0 |
| Total | 389 (100.0%) | $78,125 |
Poverty in Napanoch
Income Below Poverty by Sex and Age in Napanoch
With 1.6% poverty level for males and 7.0% for females among the residents of Napanoch, 75 year old and over males and 75 year old and over females are the most vulnerable to poverty, with 6 males (23.1%) and 21 females (27.3%) in their respective age groups living below the poverty level.
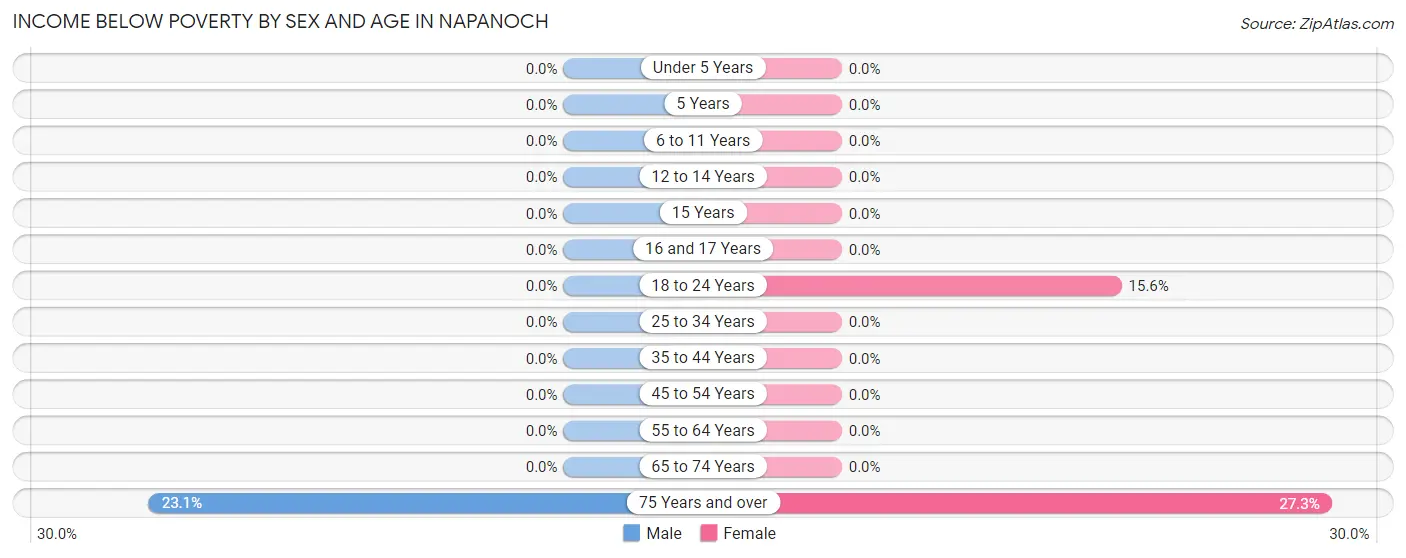
| Age Bracket | Male | Female |
| Under 5 Years | 0 (0.0%) | 0 (0.0%) |
| 5 Years | 0 (0.0%) | 0 (0.0%) |
| 6 to 11 Years | 0 (0.0%) | 0 (0.0%) |
| 12 to 14 Years | 0 (0.0%) | 0 (0.0%) |
| 15 Years | 0 (0.0%) | 0 (0.0%) |
| 16 and 17 Years | 0 (0.0%) | 0 (0.0%) |
| 18 to 24 Years | 0 (0.0%) | 12 (15.6%) |
| 25 to 34 Years | 0 (0.0%) | 0 (0.0%) |
| 35 to 44 Years | 0 (0.0%) | 0 (0.0%) |
| 45 to 54 Years | 0 (0.0%) | 0 (0.0%) |
| 55 to 64 Years | 0 (0.0%) | 0 (0.0%) |
| 65 to 74 Years | 0 (0.0%) | 0 (0.0%) |
| 75 Years and over | 6 (23.1%) | 21 (27.3%) |
| Total | 6 (1.6%) | 33 (7.0%) |
Income Above Poverty by Sex and Age in Napanoch
According to the poverty statistics in Napanoch, males aged 6 to 11 years and females aged under 5 years are the age groups that are most secure financially, with 100.0% of males and 100.0% of females in these age groups living above the poverty line.
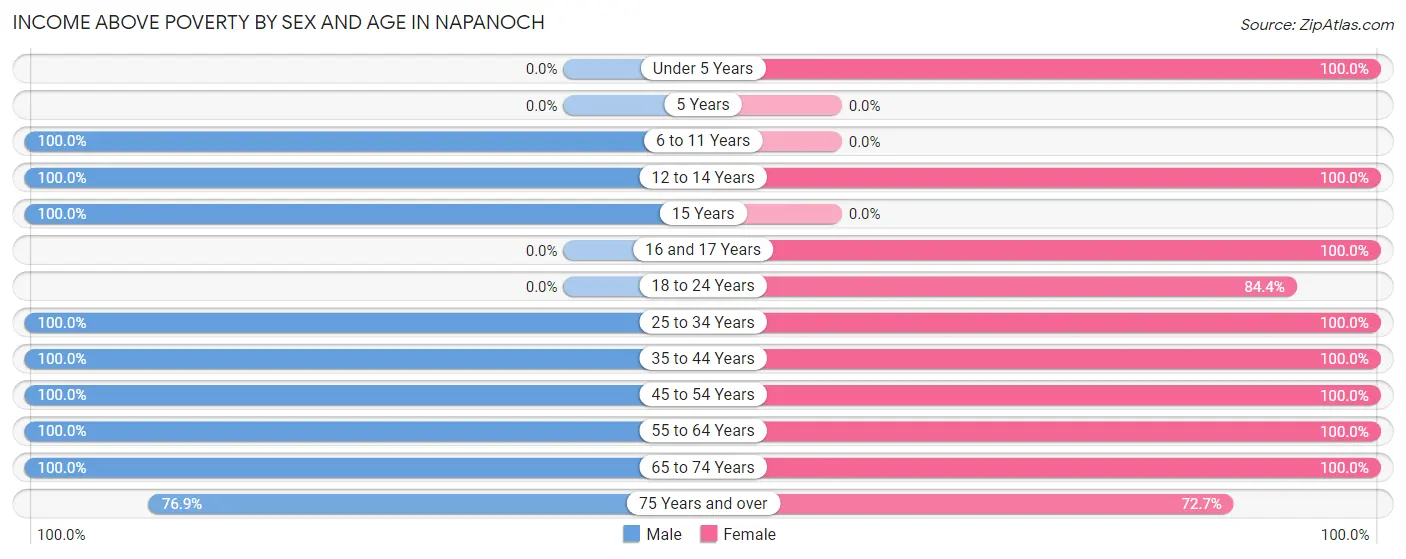
| Age Bracket | Male | Female |
| Under 5 Years | 0 (0.0%) | 13 (100.0%) |
| 5 Years | 0 (0.0%) | 0 (0.0%) |
| 6 to 11 Years | 34 (100.0%) | 0 (0.0%) |
| 12 to 14 Years | 16 (100.0%) | 21 (100.0%) |
| 15 Years | 10 (100.0%) | 0 (0.0%) |
| 16 and 17 Years | 0 (0.0%) | 12 (100.0%) |
| 18 to 24 Years | 0 (0.0%) | 65 (84.4%) |
| 25 to 34 Years | 15 (100.0%) | 29 (100.0%) |
| 35 to 44 Years | 25 (100.0%) | 59 (100.0%) |
| 45 to 54 Years | 91 (100.0%) | 75 (100.0%) |
| 55 to 64 Years | 67 (100.0%) | 71 (100.0%) |
| 65 to 74 Years | 91 (100.0%) | 34 (100.0%) |
| 75 Years and over | 20 (76.9%) | 56 (72.7%) |
| Total | 369 (98.4%) | 435 (92.9%) |
Income Below Poverty Among Married-Couple Families in Napanoch
The poverty statistics for married-couple families in Napanoch show that 4.8% or 8 of the total 167 families live below the poverty line. Families with no children have the highest poverty rate of 6.8%, comprising of 8 families. On the other hand, families with 1 or 2 children have the lowest poverty rate of 0.0%, which includes 0 families.
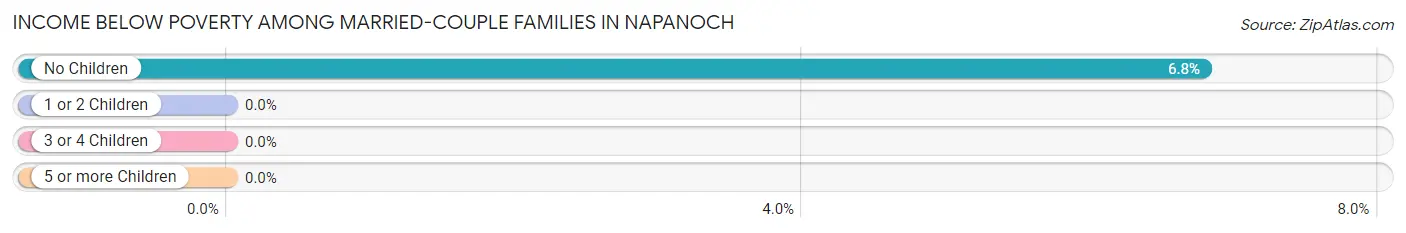
| Children | Above Poverty | Below Poverty |
| No Children | 110 (93.2%) | 8 (6.8%) |
| 1 or 2 Children | 49 (100.0%) | 0 (0.0%) |
| 3 or 4 Children | 0 (0.0%) | 0 (0.0%) |
| 5 or more Children | 0 (0.0%) | 0 (0.0%) |
| Total | 159 (95.2%) | 8 (4.8%) |
Income Below Poverty Among Single-Parent Households in Napanoch
| Children | Single Father | Single Mother |
| No Children | 0 (0.0%) | 0 (0.0%) |
| 1 or 2 Children | 0 (0.0%) | 0 (0.0%) |
| 3 or 4 Children | 0 (0.0%) | 0 (0.0%) |
| 5 or more Children | 0 (0.0%) | 0 (0.0%) |
| Total | 0 (0.0%) | 0 (0.0%) |
Income Below Poverty Among Married-Couple vs Single-Parent Households in Napanoch
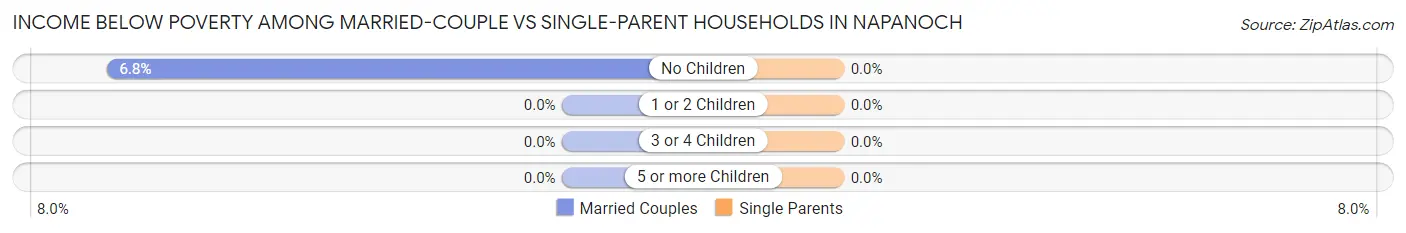
| Children | Married-Couple Families | Single-Parent Households |
| No Children | 8 (6.8%) | 0 (0.0%) |
| 1 or 2 Children | 0 (0.0%) | 0 (0.0%) |
| 3 or 4 Children | 0 (0.0%) | 0 (0.0%) |
| 5 or more Children | 0 (0.0%) | 0 (0.0%) |
| Total | 8 (4.8%) | 0 (0.0%) |
Race in Napanoch
The most populous races in Napanoch are White / Caucasian (746 | 88.5%), Hispanic or Latino (99 | 11.7%), and Some other Race (67 | 8.0%).
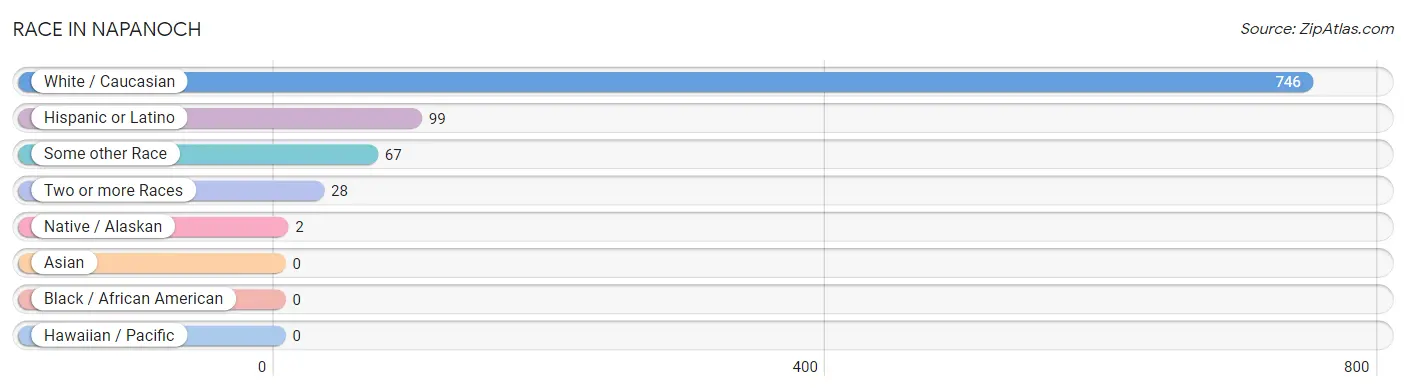
| Race | # Population | % Population |
| Asian | 0 | 0.0% |
| Black / African American | 0 | 0.0% |
| Hawaiian / Pacific | 0 | 0.0% |
| Hispanic or Latino | 99 | 11.7% |
| Native / Alaskan | 2 | 0.2% |
| White / Caucasian | 746 | 88.5% |
| Two or more Races | 28 | 3.3% |
| Some other Race | 67 | 8.0% |
| Total | 843 | 100.0% |
Ancestry in Napanoch
The most populous ancestries reported in Napanoch are German (225 | 26.7%), Irish (208 | 24.7%), English (139 | 16.5%), Italian (107 | 12.7%), and Puerto Rican (74 | 8.8%), together accounting for 89.3% of all Napanoch residents.
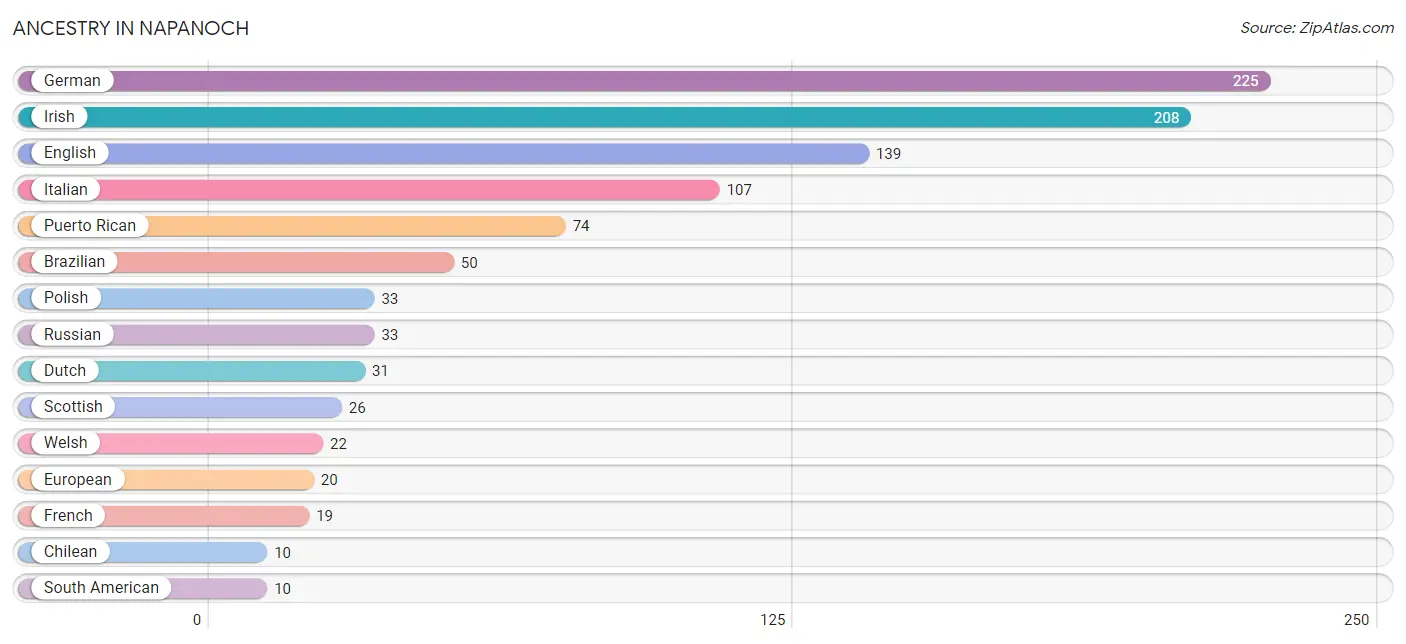
| Ancestry | # Population | % Population |
| American | 2 | 0.2% |
| Brazilian | 50 | 5.9% |
| Chilean | 10 | 1.2% |
| Dutch | 31 | 3.7% |
| English | 139 | 16.5% |
| European | 20 | 2.4% |
| French | 19 | 2.2% |
| German | 225 | 26.7% |
| Irish | 208 | 24.7% |
| Italian | 107 | 12.7% |
| Polish | 33 | 3.9% |
| Puerto Rican | 74 | 8.8% |
| Russian | 33 | 3.9% |
| Scottish | 26 | 3.1% |
| South American | 10 | 1.2% |
| Tohono O'Odham | 2 | 0.2% |
| Welsh | 22 | 2.6% | View All 17 Rows |
Immigrants in Napanoch
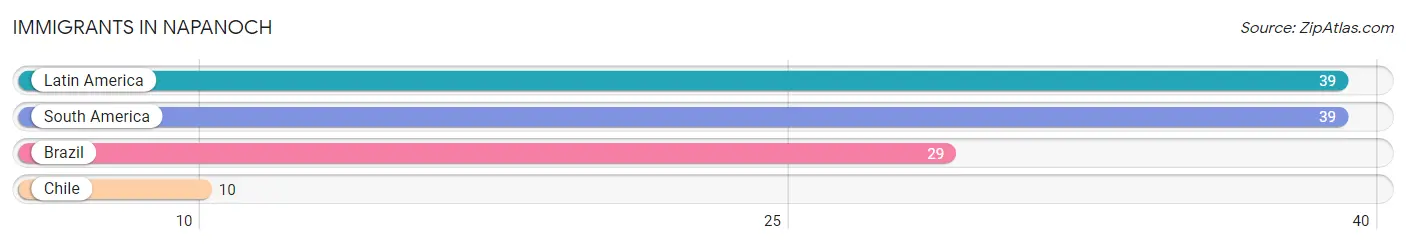
The most numerous immigrant groups reported in Napanoch came from Latin America (39 | 4.6%), South America (39 | 4.6%), Brazil (29 | 3.4%), and Chile (10 | 1.2%), together accounting for 13.9% of all Napanoch residents.
| Immigration Origin | # Population | % Population |
| Brazil | 29 | 3.4% |
| Chile | 10 | 1.2% |
| Latin America | 39 | 4.6% |
| South America | 39 | 4.6% | View All 4 Rows |
Sex and Age in Napanoch
Sex and Age in Napanoch
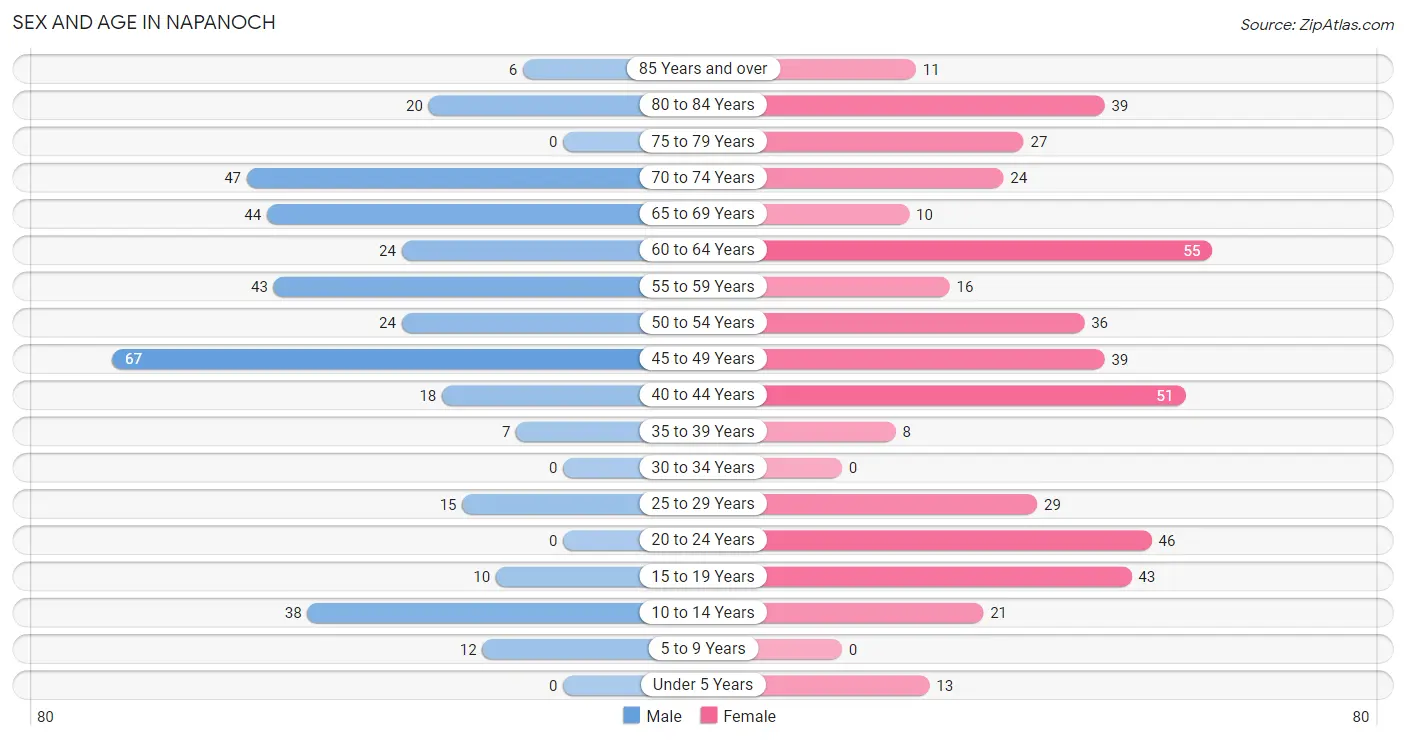
The most populous age groups in Napanoch are 45 to 49 Years (67 | 17.9%) for men and 60 to 64 Years (55 | 11.7%) for women.
| Age Bracket | Male | Female |
| Under 5 Years | 0 (0.0%) | 13 (2.8%) |
| 5 to 9 Years | 12 (3.2%) | 0 (0.0%) |
| 10 to 14 Years | 38 (10.1%) | 21 (4.5%) |
| 15 to 19 Years | 10 (2.7%) | 43 (9.2%) |
| 20 to 24 Years | 0 (0.0%) | 46 (9.8%) |
| 25 to 29 Years | 15 (4.0%) | 29 (6.2%) |
| 30 to 34 Years | 0 (0.0%) | 0 (0.0%) |
| 35 to 39 Years | 7 (1.9%) | 8 (1.7%) |
| 40 to 44 Years | 18 (4.8%) | 51 (10.9%) |
| 45 to 49 Years | 67 (17.9%) | 39 (8.3%) |
| 50 to 54 Years | 24 (6.4%) | 36 (7.7%) |
| 55 to 59 Years | 43 (11.5%) | 16 (3.4%) |
| 60 to 64 Years | 24 (6.4%) | 55 (11.7%) |
| 65 to 69 Years | 44 (11.7%) | 10 (2.1%) |
| 70 to 74 Years | 47 (12.5%) | 24 (5.1%) |
| 75 to 79 Years | 0 (0.0%) | 27 (5.8%) |
| 80 to 84 Years | 20 (5.3%) | 39 (8.3%) |
| 85 Years and over | 6 (1.6%) | 11 (2.4%) |
| Total | 375 (100.0%) | 468 (100.0%) |
Families and Households in Napanoch
Median Family Size in Napanoch
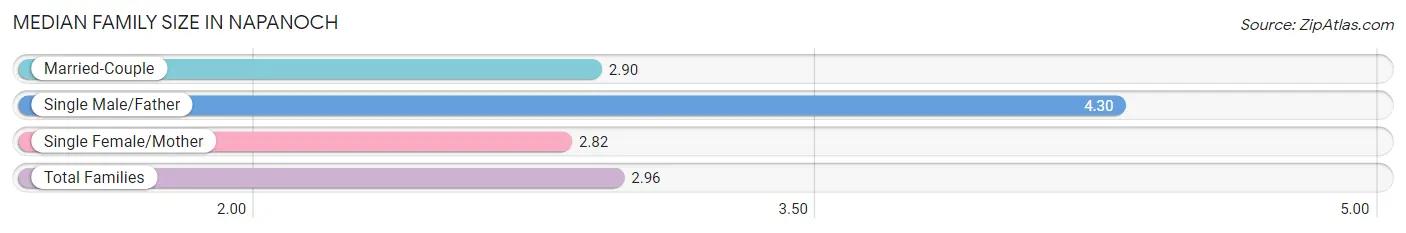
The median family size in Napanoch is 2.96 persons per family, with single male/father families (10 | 4.7%) accounting for the largest median family size of 4.3 persons per family. On the other hand, single female/mother families (34 | 16.1%) represent the smallest median family size with 2.82 persons per family.
| Family Type | # Families | Family Size |
| Married-Couple | 167 (79.1%) | 2.90 |
| Single Male/Father | 10 (4.7%) | 4.30 |
| Single Female/Mother | 34 (16.1%) | 2.82 |
| Total Families | 211 (100.0%) | 2.96 |
Median Household Size in Napanoch
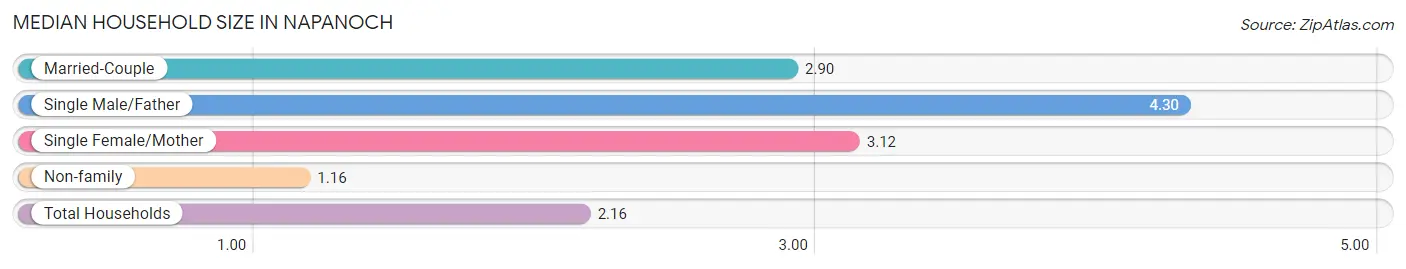
The median household size in Napanoch is 2.16 persons per household, with single male/father households (10 | 2.6%) accounting for the largest median household size of 4.3 persons per household. non-family households (178 | 45.8%) represent the smallest median household size with 1.16 persons per household.
| Household Type | # Households | Household Size |
| Married-Couple | 167 (42.9%) | 2.90 |
| Single Male/Father | 10 (2.6%) | 4.30 |
| Single Female/Mother | 34 (8.7%) | 3.12 |
| Non-family | 178 (45.8%) | 1.16 |
| Total Households | 389 (100.0%) | 2.16 |
Household Size by Marriage Status in Napanoch
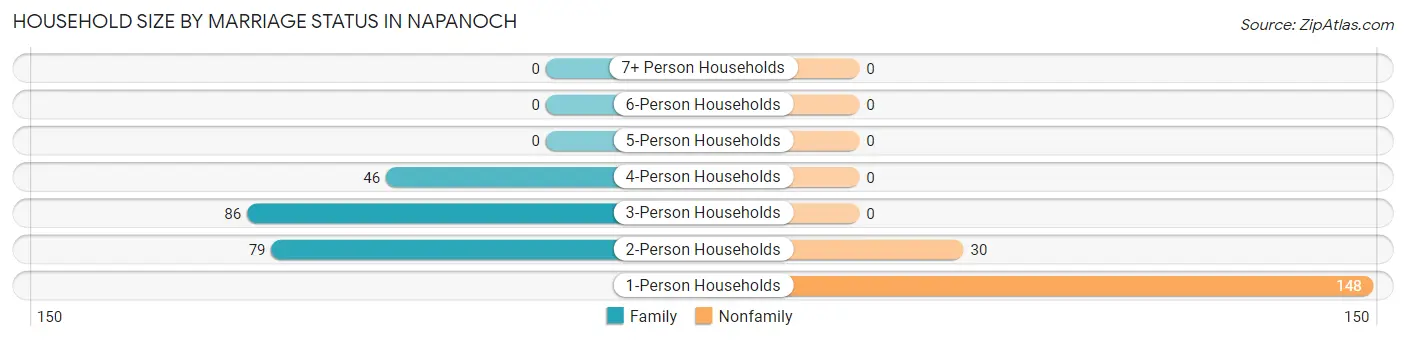
Out of a total of 389 households in Napanoch, 211 (54.2%) are family households, while 178 (45.8%) are nonfamily households. The most numerous type of family households are 3-person households, comprising 86, and the most common type of nonfamily households are 1-person households, comprising 148.
| Household Size | Family Households | Nonfamily Households |
| 1-Person Households | - | 148 (38.1%) |
| 2-Person Households | 79 (20.3%) | 30 (7.7%) |
| 3-Person Households | 86 (22.1%) | 0 (0.0%) |
| 4-Person Households | 46 (11.8%) | 0 (0.0%) |
| 5-Person Households | 0 (0.0%) | 0 (0.0%) |
| 6-Person Households | 0 (0.0%) | 0 (0.0%) |
| 7+ Person Households | 0 (0.0%) | 0 (0.0%) |
| Total | 211 (54.2%) | 178 (45.8%) |
Female Fertility in Napanoch
Fertility by Age in Napanoch
| Age Bracket | Women with Births | Births / 1,000 Women |
| 15 to 19 years | 0 (0.0%) | 0.0 |
| 20 to 34 years | 0 (0.0%) | 0.0 |
| 35 to 50 years | 0 (0.0%) | 0.0 |
| Total | 0 (0.0%) | 0.0 |
Fertility by Age by Marriage Status in Napanoch
| Age Bracket | Married | Unmarried |
| 15 to 19 years | 0 (0.0%) | 0 (0.0%) |
| 20 to 34 years | 0 (0.0%) | 0 (0.0%) |
| 35 to 50 years | 0 (0.0%) | 0 (0.0%) |
| Total | 0 (0.0%) | 0 (0.0%) |
Fertility by Education in Napanoch
| Educational Attainment | Women with Births | Births / 1,000 Women |
| Less than High School | 0 (0.0%) | 0.0 |
| High School Diploma | 0 (0.0%) | 0.0 |
| College or Associate's Degree | 0 (0.0%) | 0.0 |
| Bachelor's Degree | 0 (0.0%) | 0.0 |
| Graduate Degree | 0 (0.0%) | 0.0 |
| Total | 0 (0.0%) | 0.0 |
Fertility by Education by Marriage Status in Napanoch
| Educational Attainment | Married | Unmarried |
| Less than High School | 0 (0.0%) | 0 (0.0%) |
| High School Diploma | 0 (0.0%) | 0 (0.0%) |
| College or Associate's Degree | 0 (0.0%) | 0 (0.0%) |
| Bachelor's Degree | 0 (0.0%) | 0 (0.0%) |
| Graduate Degree | 0 (0.0%) | 0 (0.0%) |
| Total | 0 (0.0%) | 0 (0.0%) |
Employment Characteristics in Napanoch
Employment by Class of Employer in Napanoch
Among the 419 employed individuals in Napanoch, private company employees (224 | 53.5%), state government employees (62 | 14.8%), and local government employees (55 | 13.1%) make up the most common classes of employment.
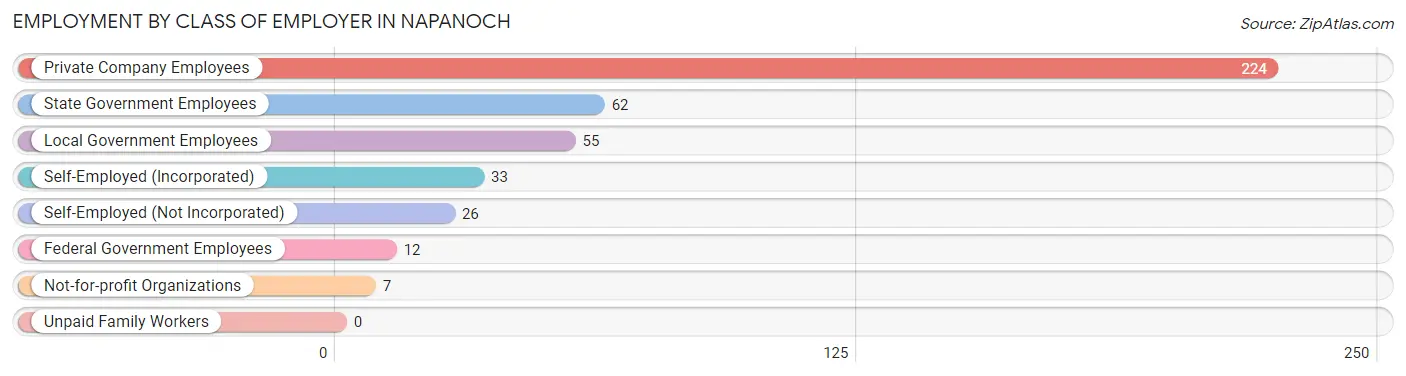
| Employer Class | # Employees | % Employees |
| Private Company Employees | 224 | 53.5% |
| Self-Employed (Incorporated) | 33 | 7.9% |
| Self-Employed (Not Incorporated) | 26 | 6.2% |
| Not-for-profit Organizations | 7 | 1.7% |
| Local Government Employees | 55 | 13.1% |
| State Government Employees | 62 | 14.8% |
| Federal Government Employees | 12 | 2.9% |
| Unpaid Family Workers | 0 | 0.0% |
| Total | 419 | 100.0% |
Employment Status by Age in Napanoch
According to the labor force statistics for Napanoch, out of the total population over 16 years of age (749), 59.1% or 443 individuals are in the labor force, with 2.3% or 10 of them unemployed. The age group with the highest labor force participation rate is 20 to 24 years, with 100.0% or 46 individuals in the labor force. Within the labor force, the 35 to 44 years age range has the highest percentage of unemployed individuals, with 13.0% or 10 of them being unemployed.
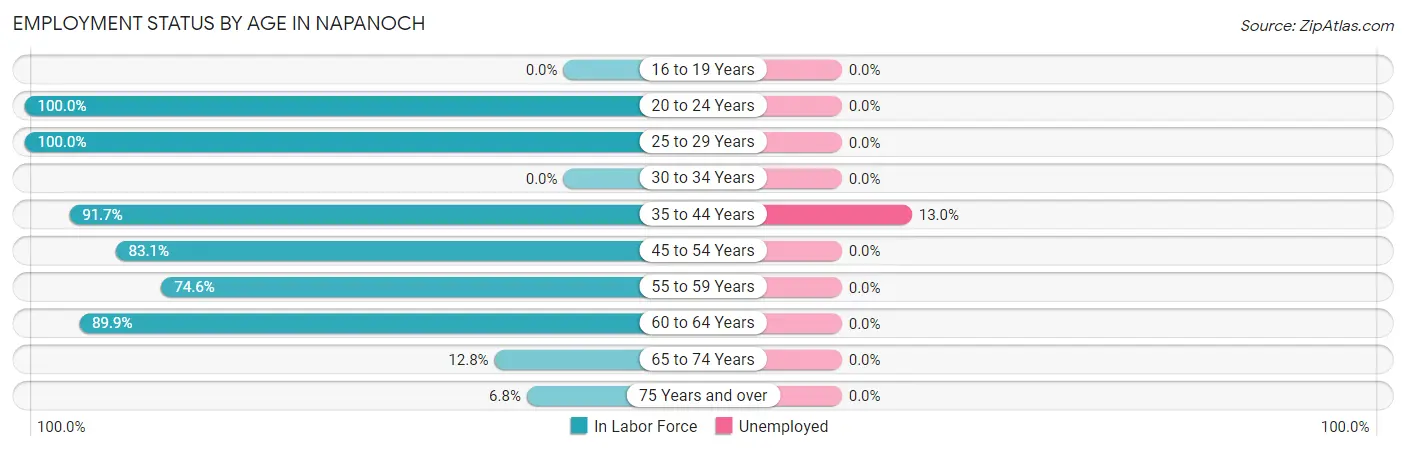
| Age Bracket | In Labor Force | Unemployed |
| 16 to 19 Years | 0 (0.0%) | 0 (0.0%) |
| 20 to 24 Years | 46 (100.0%) | 0 (0.0%) |
| 25 to 29 Years | 44 (100.0%) | 0 (0.0%) |
| 30 to 34 Years | 0 (0.0%) | 0 (0.0%) |
| 35 to 44 Years | 77 (91.7%) | 10 (13.0%) |
| 45 to 54 Years | 138 (83.1%) | 0 (0.0%) |
| 55 to 59 Years | 44 (74.6%) | 0 (0.0%) |
| 60 to 64 Years | 71 (89.9%) | 0 (0.0%) |
| 65 to 74 Years | 16 (12.8%) | 0 (0.0%) |
| 75 Years and over | 7 (6.8%) | 0 (0.0%) |
| Total | 443 (59.1%) | 10 (2.3%) |
Employment Status by Educational Attainment in Napanoch
According to labor force statistics for Napanoch, 86.6% of individuals (374) out of the total population between 25 and 64 years of age (432) are in the labor force, with 2.7% or 10 of them being unemployed. The group with the highest labor force participation rate are those with the educational attainment of college / associate degree, with 96.2% or 176 individuals in the labor force. Within the labor force, individuals with high school diploma education have the highest percentage of unemployment, with 8.5% or 10 of them being unemployed.
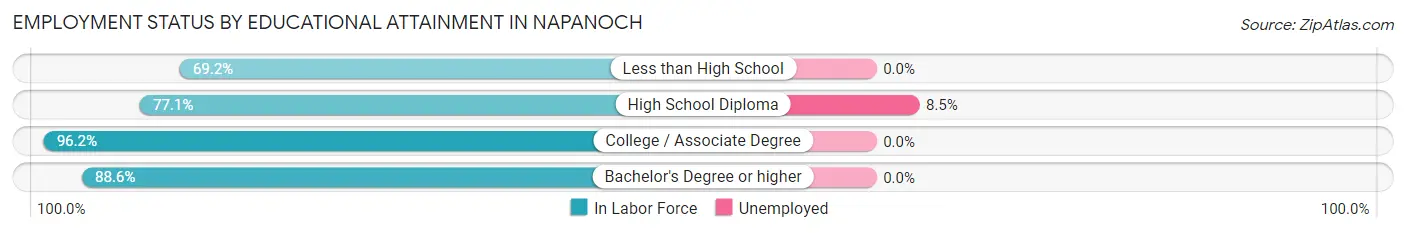
| Educational Attainment | In Labor Force | Unemployed |
| Less than High School | 18 (69.2%) | 0 (0.0%) |
| High School Diploma | 118 (77.1%) | 13 (8.5%) |
| College / Associate Degree | 176 (96.2%) | 0 (0.0%) |
| Bachelor's Degree or higher | 62 (88.6%) | 0 (0.0%) |
| Total | 374 (86.6%) | 12 (2.7%) |
Employment Occupations by Sex in Napanoch
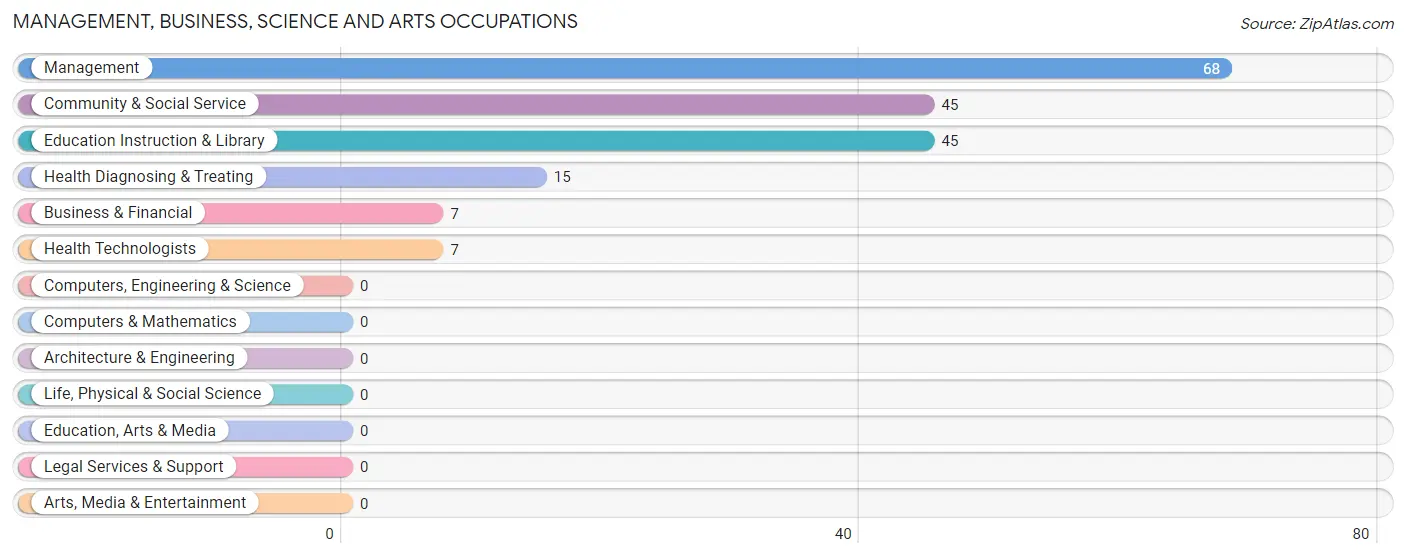
Management, Business, Science and Arts Occupations
The most common Management, Business, Science and Arts occupations in Napanoch are Management (68 | 15.7%), Community & Social Service (45 | 10.4%), Education Instruction & Library (45 | 10.4%), Health Diagnosing & Treating (15 | 3.5%), and Business & Financial (7 | 1.6%).
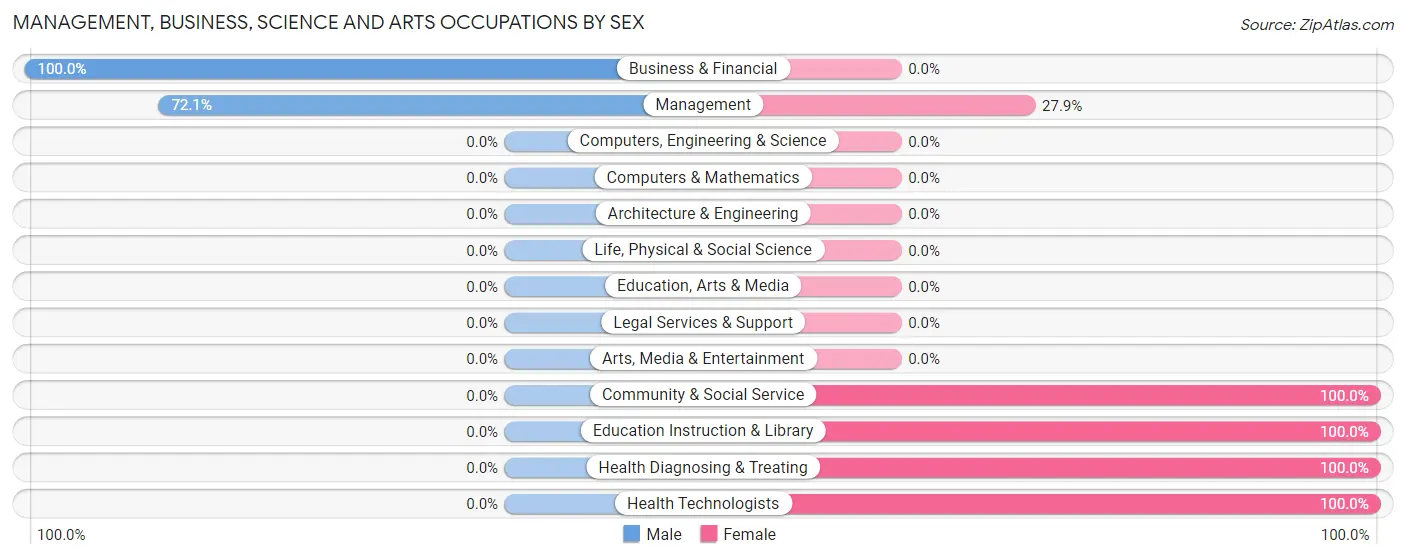
Management, Business, Science and Arts Occupations by Sex
Within the Management, Business, Science and Arts occupations in Napanoch, the most male-oriented occupations are Business & Financial (100.0%), and Management (72.1%), while the most female-oriented occupations are Community & Social Service (100.0%), Education Instruction & Library (100.0%), and Health Diagnosing & Treating (100.0%).
| Occupation | Male | Female |
| Management | 49 (72.1%) | 19 (27.9%) |
| Business & Financial | 7 (100.0%) | 0 (0.0%) |
| Computers, Engineering & Science | 0 (0.0%) | 0 (0.0%) |
| Computers & Mathematics | 0 (0.0%) | 0 (0.0%) |
| Architecture & Engineering | 0 (0.0%) | 0 (0.0%) |
| Life, Physical & Social Science | 0 (0.0%) | 0 (0.0%) |
| Community & Social Service | 0 (0.0%) | 45 (100.0%) |
| Education, Arts & Media | 0 (0.0%) | 0 (0.0%) |
| Legal Services & Support | 0 (0.0%) | 0 (0.0%) |
| Education Instruction & Library | 0 (0.0%) | 45 (100.0%) |
| Arts, Media & Entertainment | 0 (0.0%) | 0 (0.0%) |
| Health Diagnosing & Treating | 0 (0.0%) | 15 (100.0%) |
| Health Technologists | 0 (0.0%) | 7 (100.0%) |
| Total (Category) | 56 (41.5%) | 79 (58.5%) |
| Total (Overall) | 172 (39.7%) | 261 (60.3%) |
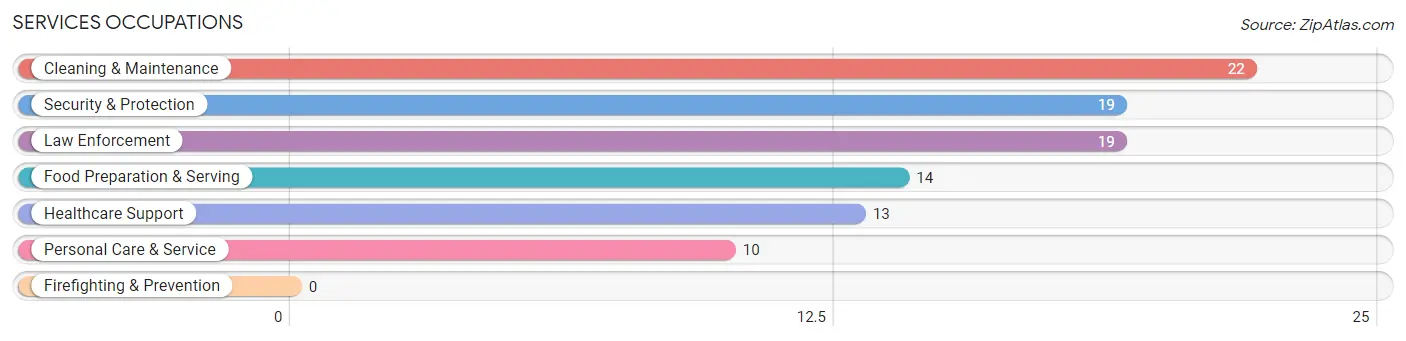
Services Occupations
The most common Services occupations in Napanoch are Cleaning & Maintenance (22 | 5.1%), Security & Protection (19 | 4.4%), Law Enforcement (19 | 4.4%), Food Preparation & Serving (14 | 3.2%), and Healthcare Support (13 | 3.0%).
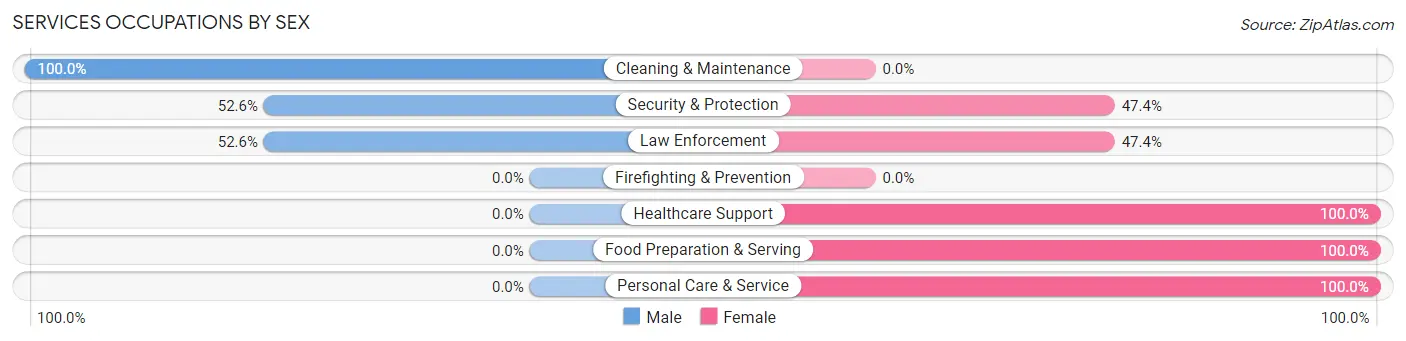
Services Occupations by Sex
Within the Services occupations in Napanoch, the most male-oriented occupations are Cleaning & Maintenance (100.0%), Security & Protection (52.6%), and Law Enforcement (52.6%), while the most female-oriented occupations are Healthcare Support (100.0%), Food Preparation & Serving (100.0%), and Personal Care & Service (100.0%).
| Occupation | Male | Female |
| Healthcare Support | 0 (0.0%) | 13 (100.0%) |
| Security & Protection | 10 (52.6%) | 9 (47.4%) |
| Firefighting & Prevention | 0 (0.0%) | 0 (0.0%) |
| Law Enforcement | 10 (52.6%) | 9 (47.4%) |
| Food Preparation & Serving | 0 (0.0%) | 14 (100.0%) |
| Cleaning & Maintenance | 22 (100.0%) | 0 (0.0%) |
| Personal Care & Service | 0 (0.0%) | 10 (100.0%) |
| Total (Category) | 32 (41.0%) | 46 (59.0%) |
| Total (Overall) | 172 (39.7%) | 261 (60.3%) |
Sales and Office Occupations
The most common Sales and Office occupations in Napanoch are Sales & Related (71 | 16.4%), and Office & Administration (58 | 13.4%).

Sales and Office Occupations by Sex

| Occupation | Male | Female |
| Sales & Related | 8 (11.3%) | 63 (88.7%) |
| Office & Administration | 16 (27.6%) | 42 (72.4%) |
| Total (Category) | 24 (18.6%) | 105 (81.4%) |
| Total (Overall) | 172 (39.7%) | 261 (60.3%) |
Natural Resources, Construction and Maintenance Occupations
The most common Natural Resources, Construction and Maintenance occupations in Napanoch are Installation, Maintenance & Repair (20 | 4.6%), and Construction & Extraction (18 | 4.2%).
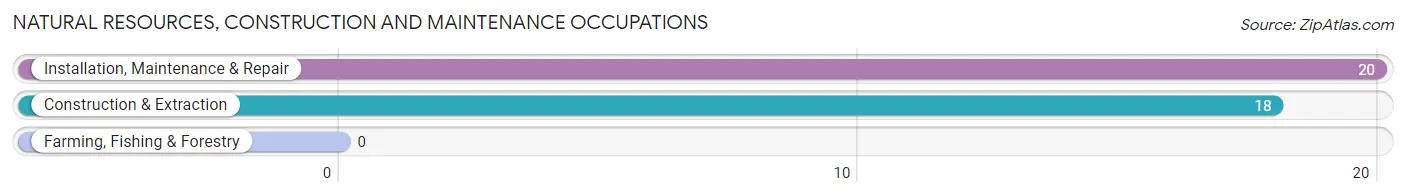
Natural Resources, Construction and Maintenance Occupations by Sex

| Occupation | Male | Female |
| Farming, Fishing & Forestry | 0 (0.0%) | 0 (0.0%) |
| Construction & Extraction | 18 (100.0%) | 0 (0.0%) |
| Installation, Maintenance & Repair | 20 (100.0%) | 0 (0.0%) |
| Total (Category) | 38 (100.0%) | 0 (0.0%) |
| Total (Overall) | 172 (39.7%) | 261 (60.3%) |
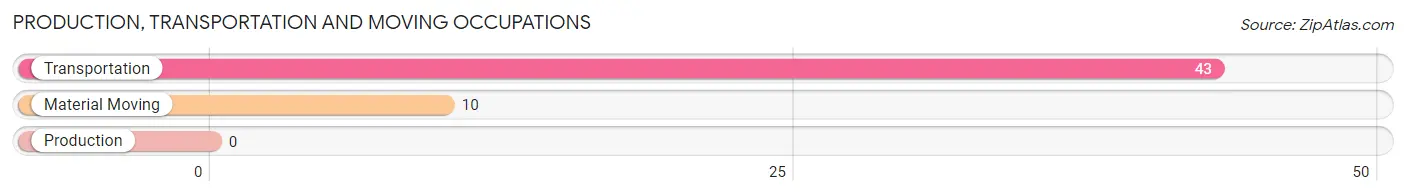
Production, Transportation and Moving Occupations
The most common Production, Transportation and Moving occupations in Napanoch are Transportation (43 | 9.9%), and Material Moving (10 | 2.3%).
Production, Transportation and Moving Occupations by Sex
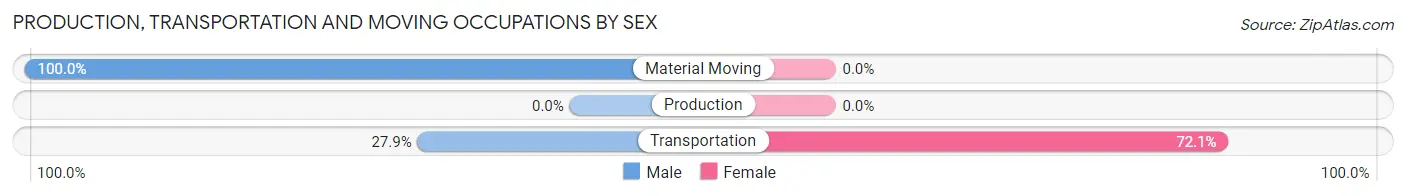
| Occupation | Male | Female |
| Production | 0 (0.0%) | 0 (0.0%) |
| Transportation | 12 (27.9%) | 31 (72.1%) |
| Material Moving | 10 (100.0%) | 0 (0.0%) |
| Total (Category) | 22 (41.5%) | 31 (58.5%) |
| Total (Overall) | 172 (39.7%) | 261 (60.3%) |
Employment Industries by Sex in Napanoch
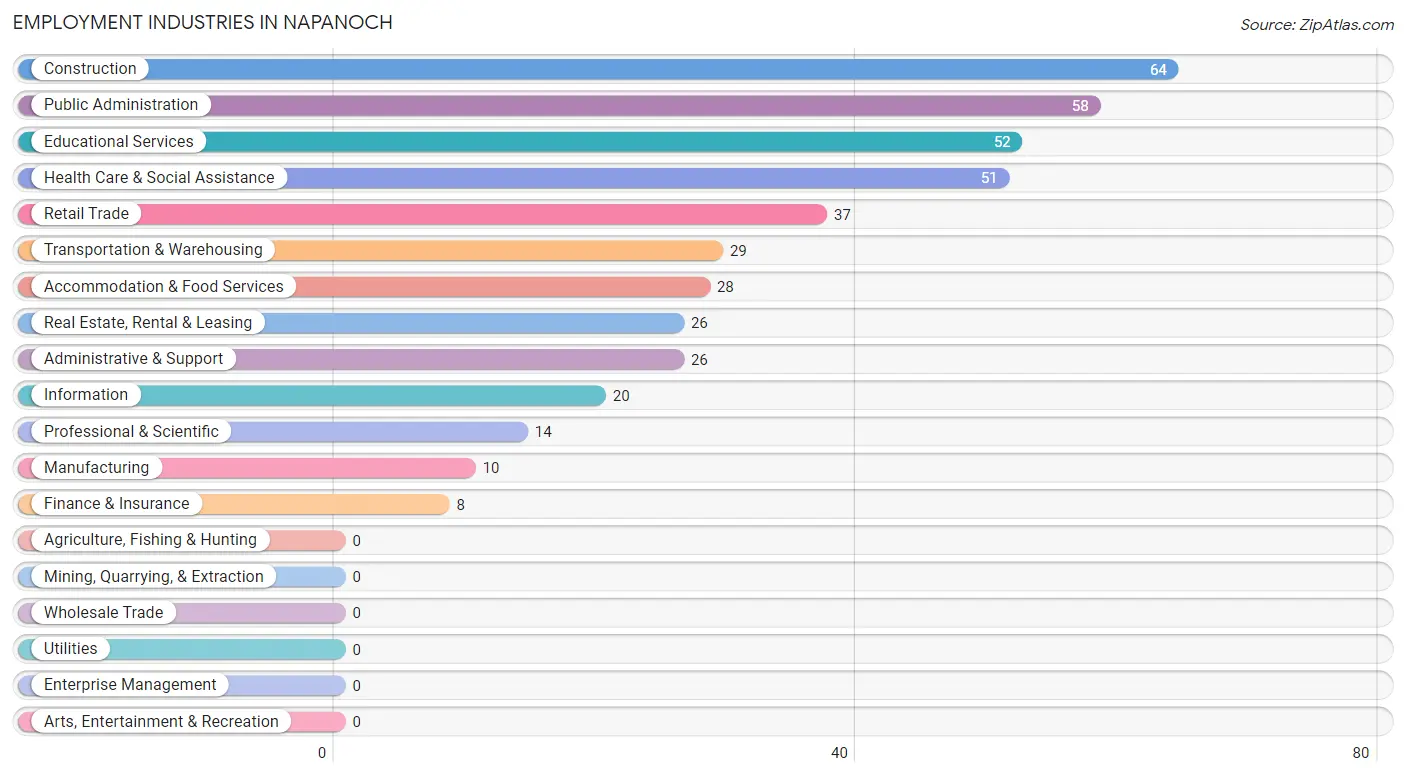
Employment Industries in Napanoch
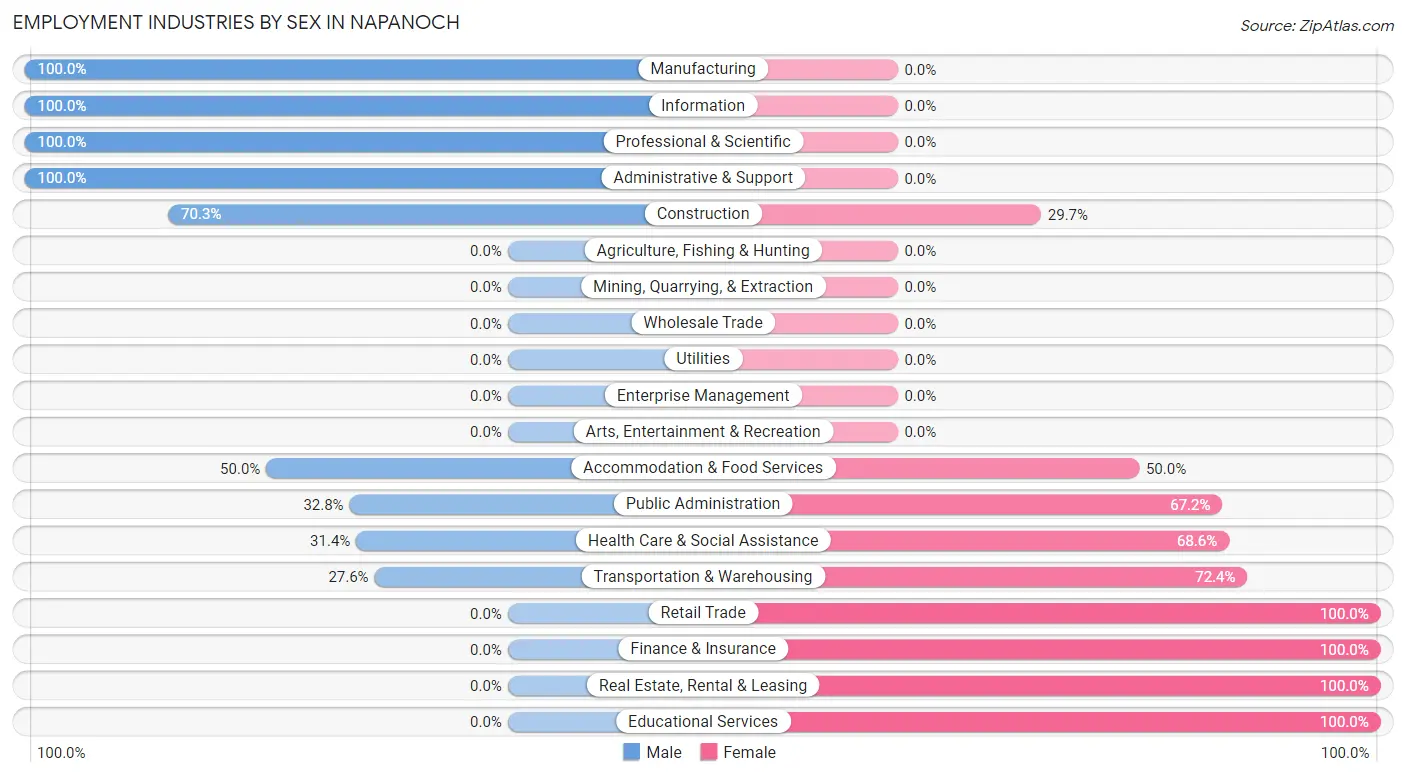
The major employment industries in Napanoch include Construction (64 | 14.8%), Public Administration (58 | 13.4%), Educational Services (52 | 12.0%), Health Care & Social Assistance (51 | 11.8%), and Retail Trade (37 | 8.6%).
Employment Industries by Sex in Napanoch
The Napanoch industries that see more men than women are Manufacturing (100.0%), Information (100.0%), and Professional & Scientific (100.0%), whereas the industries that tend to have a higher number of women are Retail Trade (100.0%), Finance & Insurance (100.0%), and Real Estate, Rental & Leasing (100.0%).
| Industry | Male | Female |
| Agriculture, Fishing & Hunting | 0 (0.0%) | 0 (0.0%) |
| Mining, Quarrying, & Extraction | 0 (0.0%) | 0 (0.0%) |
| Construction | 45 (70.3%) | 19 (29.7%) |
| Manufacturing | 10 (100.0%) | 0 (0.0%) |
| Wholesale Trade | 0 (0.0%) | 0 (0.0%) |
| Retail Trade | 0 (0.0%) | 37 (100.0%) |
| Transportation & Warehousing | 8 (27.6%) | 21 (72.4%) |
| Utilities | 0 (0.0%) | 0 (0.0%) |
| Information | 20 (100.0%) | 0 (0.0%) |
| Finance & Insurance | 0 (0.0%) | 8 (100.0%) |
| Real Estate, Rental & Leasing | 0 (0.0%) | 26 (100.0%) |
| Professional & Scientific | 14 (100.0%) | 0 (0.0%) |
| Enterprise Management | 0 (0.0%) | 0 (0.0%) |
| Administrative & Support | 26 (100.0%) | 0 (0.0%) |
| Educational Services | 0 (0.0%) | 52 (100.0%) |
| Health Care & Social Assistance | 16 (31.4%) | 35 (68.6%) |
| Arts, Entertainment & Recreation | 0 (0.0%) | 0 (0.0%) |
| Accommodation & Food Services | 14 (50.0%) | 14 (50.0%) |
| Public Administration | 19 (32.8%) | 39 (67.2%) |
| Total | 172 (39.7%) | 261 (60.3%) |
Education in Napanoch
School Enrollment in Napanoch
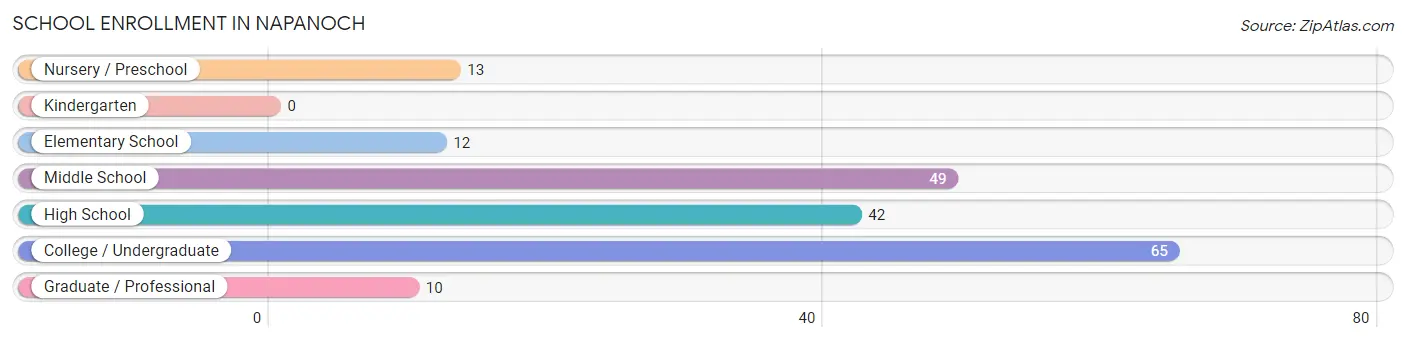
The most common levels of schooling among the 191 students in Napanoch are college / undergraduate (65 | 34.0%), middle school (49 | 25.7%), and high school (42 | 22.0%).
| School Level | # Students | % Students |
| Nursery / Preschool | 13 | 6.8% |
| Kindergarten | 0 | 0.0% |
| Elementary School | 12 | 6.3% |
| Middle School | 49 | 25.7% |
| High School | 42 | 22.0% |
| College / Undergraduate | 65 | 34.0% |
| Graduate / Professional | 10 | 5.2% |
| Total | 191 | 100.0% |
School Enrollment by Age by Funding Source in Napanoch
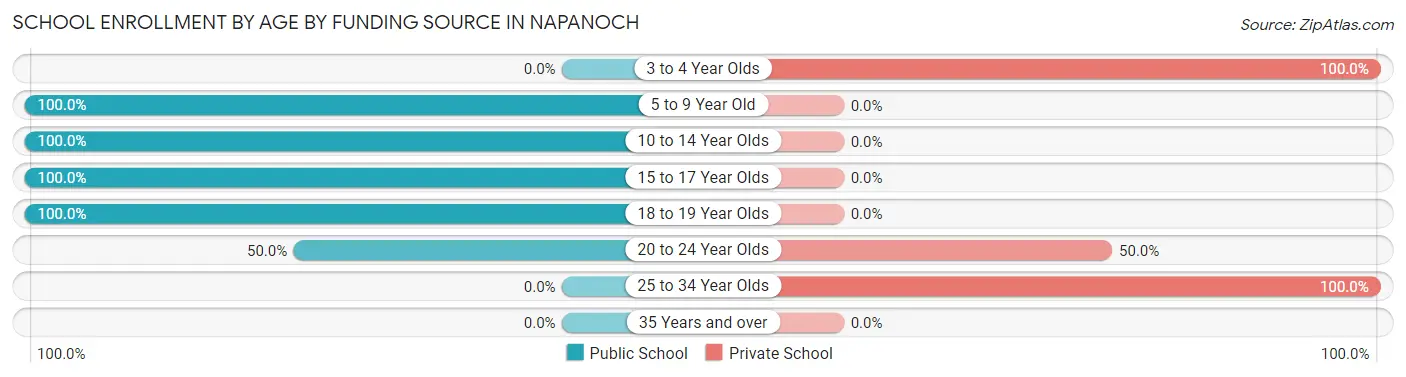
Out of a total of 191 students who are enrolled in schools in Napanoch, 44 (23.0%) attend a private institution, while the remaining 147 (77.0%) are enrolled in public schools. The age group of 3 to 4 year olds has the highest likelihood of being enrolled in private schools, with 13 (100.0% in the age bracket) enrolled. Conversely, the age group of 5 to 9 year old has the lowest likelihood of being enrolled in a private school, with 12 (100.0% in the age bracket) attending a public institution.
| Age Bracket | Public School | Private School |
| 3 to 4 Year Olds | 0 (0.0%) | 13 (100.0%) |
| 5 to 9 Year Old | 12 (100.0%) | 0 (0.0%) |
| 10 to 14 Year Olds | 59 (100.0%) | 0 (0.0%) |
| 15 to 17 Year Olds | 22 (100.0%) | 0 (0.0%) |
| 18 to 19 Year Olds | 31 (100.0%) | 0 (0.0%) |
| 20 to 24 Year Olds | 23 (50.0%) | 23 (50.0%) |
| 25 to 34 Year Olds | 0 (0.0%) | 8 (100.0%) |
| 35 Years and over | 0 (0.0%) | 0 (0.0%) |
| Total | 147 (77.0%) | 44 (23.0%) |
Educational Attainment by Field of Study in Napanoch
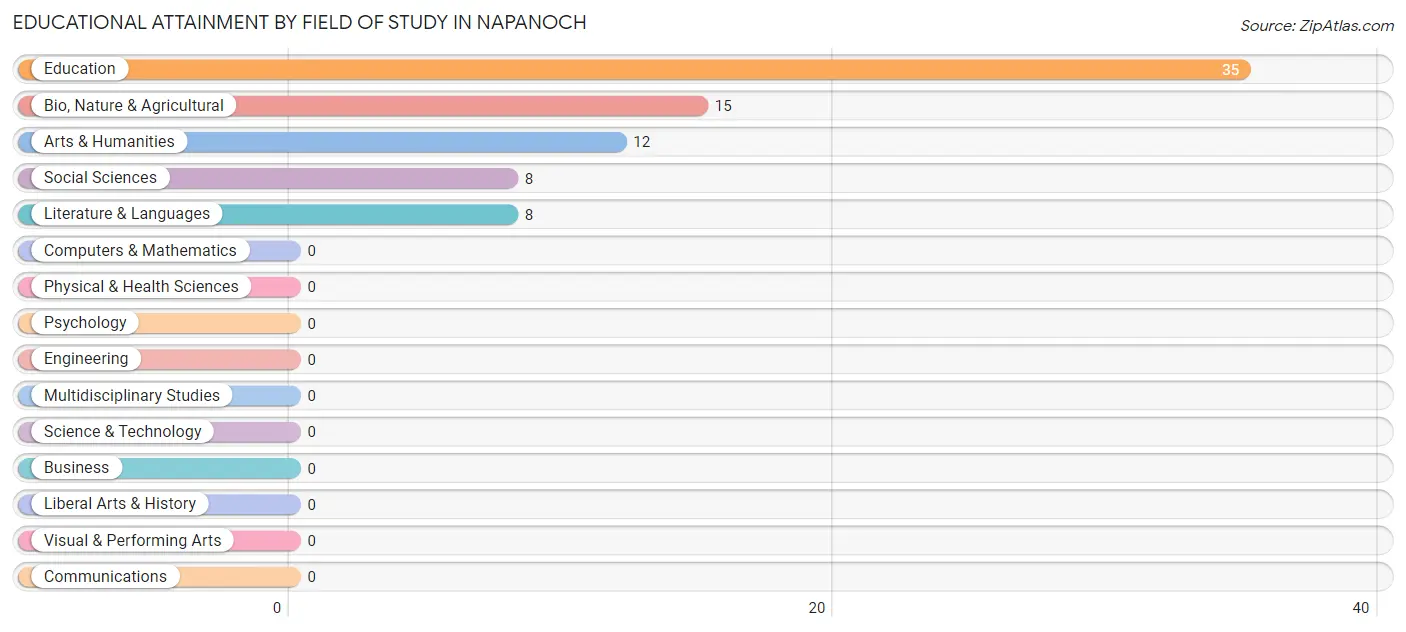
Education (35 | 44.9%), bio, nature & agricultural (15 | 19.2%), arts & humanities (12 | 15.4%), social sciences (8 | 10.3%), and literature & languages (8 | 10.3%) are the most common fields of study among 78 individuals in Napanoch who have obtained a bachelor's degree or higher.
| Field of Study | # Graduates | % Graduates |
| Computers & Mathematics | 0 | 0.0% |
| Bio, Nature & Agricultural | 15 | 19.2% |
| Physical & Health Sciences | 0 | 0.0% |
| Psychology | 0 | 0.0% |
| Social Sciences | 8 | 10.3% |
| Engineering | 0 | 0.0% |
| Multidisciplinary Studies | 0 | 0.0% |
| Science & Technology | 0 | 0.0% |
| Business | 0 | 0.0% |
| Education | 35 | 44.9% |
| Literature & Languages | 8 | 10.3% |
| Liberal Arts & History | 0 | 0.0% |
| Visual & Performing Arts | 0 | 0.0% |
| Communications | 0 | 0.0% |
| Arts & Humanities | 12 | 15.4% |
| Total | 78 | 100.0% |
Transportation & Commute in Napanoch
Vehicle Availability by Sex in Napanoch
The most prevalent vehicle ownership categories in Napanoch are males with 3 vehicles (73, accounting for 42.4%) and females with 3 vehicles (95, making up 29.5%).
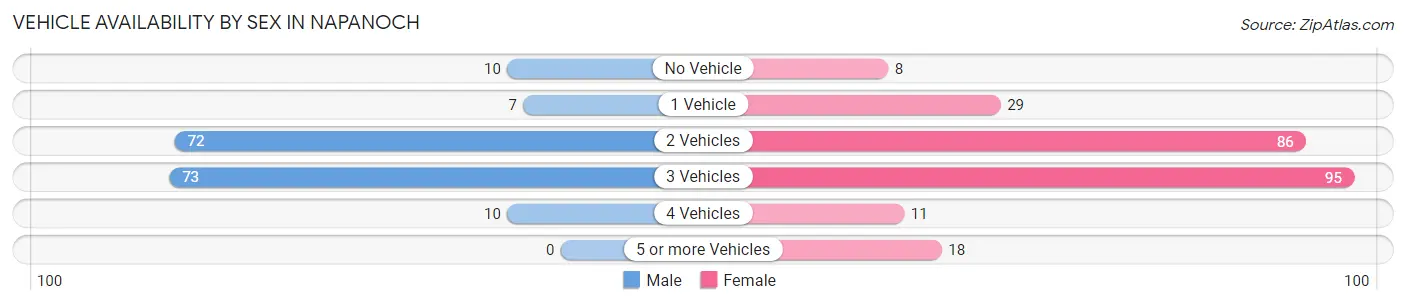
| Vehicles Available | Male | Female |
| No Vehicle | 10 (5.8%) | 8 (3.2%) |
| 1 Vehicle | 7 (4.1%) | 29 (11.7%) |
| 2 Vehicles | 72 (41.9%) | 86 (34.8%) |
| 3 Vehicles | 73 (42.4%) | 95 (38.5%) |
| 4 Vehicles | 10 (5.8%) | 11 (4.4%) |
| 5 or more Vehicles | 0 (0.0%) | 18 (7.3%) |
| Total | 172 (100.0%) | 247 (100.0%) |
Commute Time in Napanoch
The most frequently occuring commute durations in Napanoch are 60 to 89 minutes (69 commuters, 17.6%), 20 to 24 minutes (65 commuters, 16.6%), and 5 to 9 minutes (54 commuters, 13.8%).
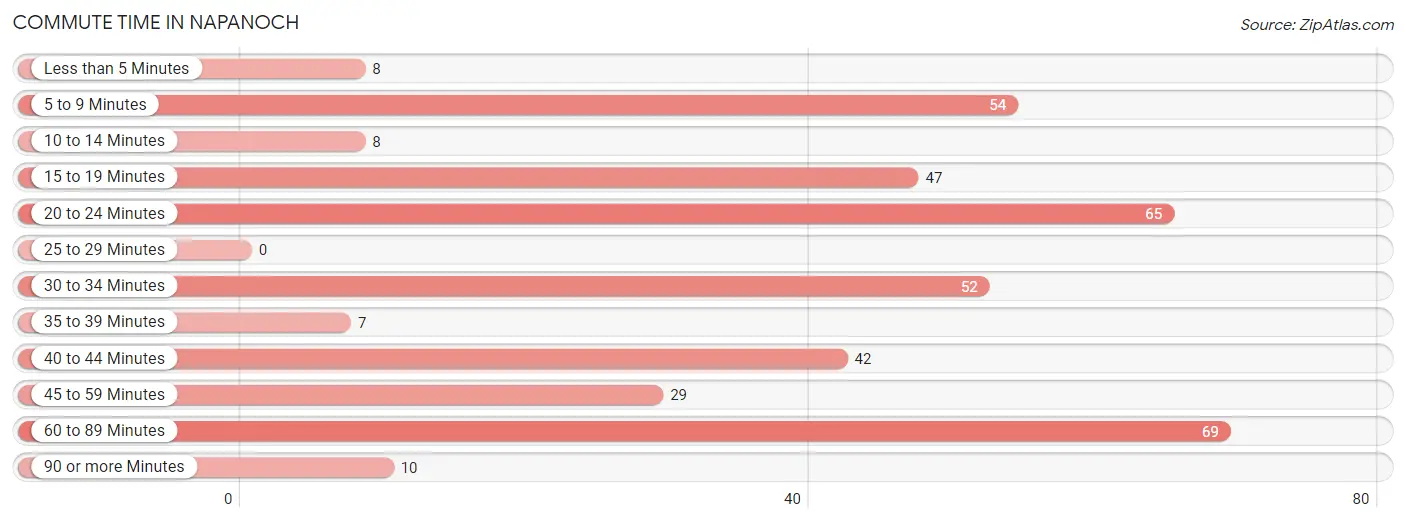
| Commute Time | # Commuters | % Commuters |
| Less than 5 Minutes | 8 | 2.1% |
| 5 to 9 Minutes | 54 | 13.8% |
| 10 to 14 Minutes | 8 | 2.1% |
| 15 to 19 Minutes | 47 | 12.0% |
| 20 to 24 Minutes | 65 | 16.6% |
| 25 to 29 Minutes | 0 | 0.0% |
| 30 to 34 Minutes | 52 | 13.3% |
| 35 to 39 Minutes | 7 | 1.8% |
| 40 to 44 Minutes | 42 | 10.7% |
| 45 to 59 Minutes | 29 | 7.4% |
| 60 to 89 Minutes | 69 | 17.6% |
| 90 or more Minutes | 10 | 2.6% |
Commute Time by Sex in Napanoch
The most common commute times in Napanoch are 40 to 44 minutes (42 commuters, 24.4%) for males and 5 to 9 minutes (46 commuters, 21.0%) for females.
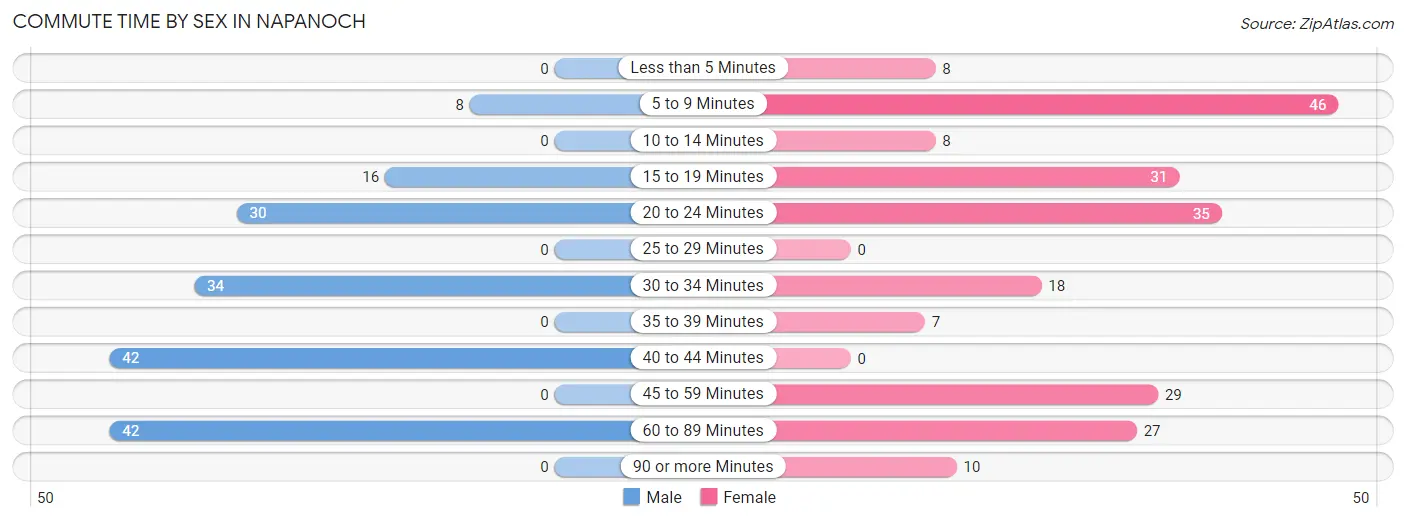
| Commute Time | Male | Female |
| Less than 5 Minutes | 0 (0.0%) | 8 (3.6%) |
| 5 to 9 Minutes | 8 (4.6%) | 46 (21.0%) |
| 10 to 14 Minutes | 0 (0.0%) | 8 (3.6%) |
| 15 to 19 Minutes | 16 (9.3%) | 31 (14.2%) |
| 20 to 24 Minutes | 30 (17.4%) | 35 (16.0%) |
| 25 to 29 Minutes | 0 (0.0%) | 0 (0.0%) |
| 30 to 34 Minutes | 34 (19.8%) | 18 (8.2%) |
| 35 to 39 Minutes | 0 (0.0%) | 7 (3.2%) |
| 40 to 44 Minutes | 42 (24.4%) | 0 (0.0%) |
| 45 to 59 Minutes | 0 (0.0%) | 29 (13.2%) |
| 60 to 89 Minutes | 42 (24.4%) | 27 (12.3%) |
| 90 or more Minutes | 0 (0.0%) | 10 (4.6%) |
Time of Departure to Work by Sex in Napanoch
The most frequent times of departure to work in Napanoch are 7:00 AM to 7:29 AM (63, 36.6%) for males and 7:30 AM to 7:59 AM (74, 33.8%) for females.
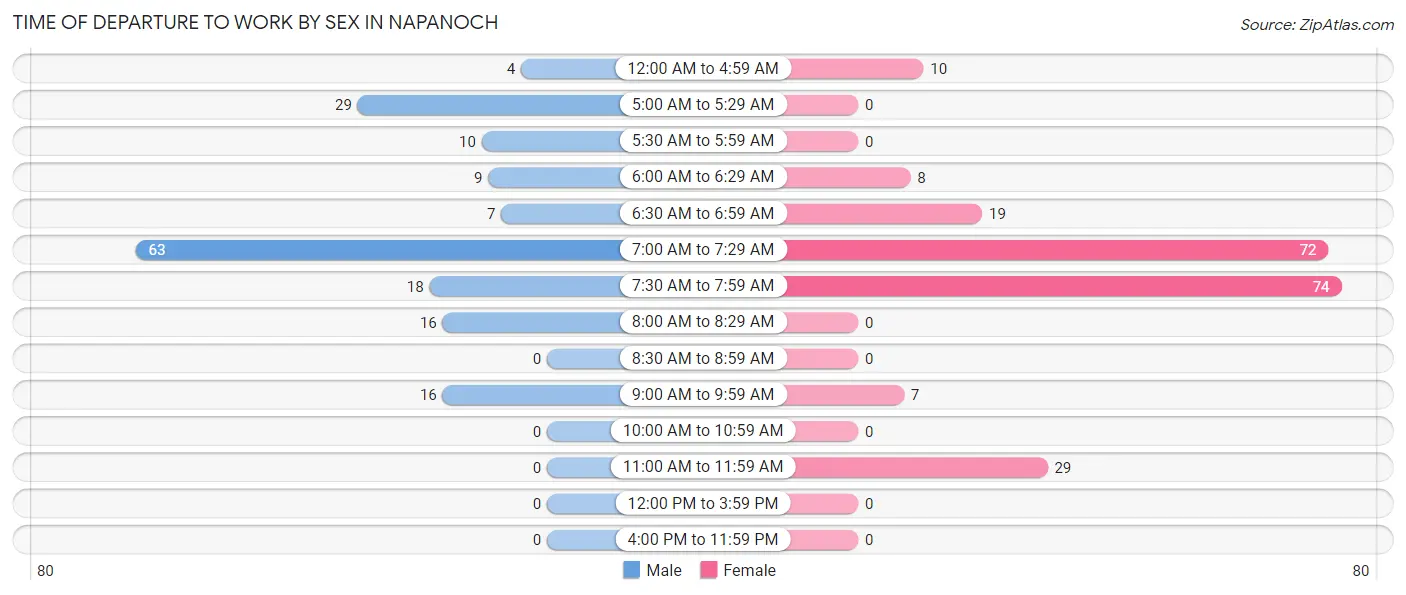
| Time of Departure | Male | Female |
| 12:00 AM to 4:59 AM | 4 (2.3%) | 10 (4.6%) |
| 5:00 AM to 5:29 AM | 29 (16.9%) | 0 (0.0%) |
| 5:30 AM to 5:59 AM | 10 (5.8%) | 0 (0.0%) |
| 6:00 AM to 6:29 AM | 9 (5.2%) | 8 (3.6%) |
| 6:30 AM to 6:59 AM | 7 (4.1%) | 19 (8.7%) |
| 7:00 AM to 7:29 AM | 63 (36.6%) | 72 (32.9%) |
| 7:30 AM to 7:59 AM | 18 (10.5%) | 74 (33.8%) |
| 8:00 AM to 8:29 AM | 16 (9.3%) | 0 (0.0%) |
| 8:30 AM to 8:59 AM | 0 (0.0%) | 0 (0.0%) |
| 9:00 AM to 9:59 AM | 16 (9.3%) | 7 (3.2%) |
| 10:00 AM to 10:59 AM | 0 (0.0%) | 0 (0.0%) |
| 11:00 AM to 11:59 AM | 0 (0.0%) | 29 (13.2%) |
| 12:00 PM to 3:59 PM | 0 (0.0%) | 0 (0.0%) |
| 4:00 PM to 11:59 PM | 0 (0.0%) | 0 (0.0%) |
| Total | 172 (100.0%) | 219 (100.0%) |
Housing Occupancy in Napanoch
Occupancy by Ownership in Napanoch
Of the total 389 dwellings in Napanoch, owner-occupied units account for 356 (91.5%), while renter-occupied units make up 33 (8.5%).
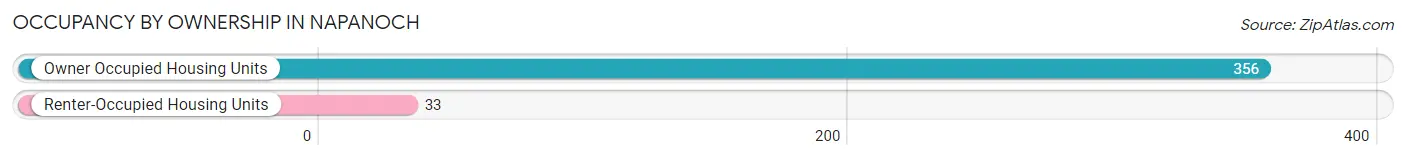
| Occupancy | # Housing Units | % Housing Units |
| Owner Occupied Housing Units | 356 | 91.5% |
| Renter-Occupied Housing Units | 33 | 8.5% |
| Total Occupied Housing Units | 389 | 100.0% |
Occupancy by Household Size in Napanoch
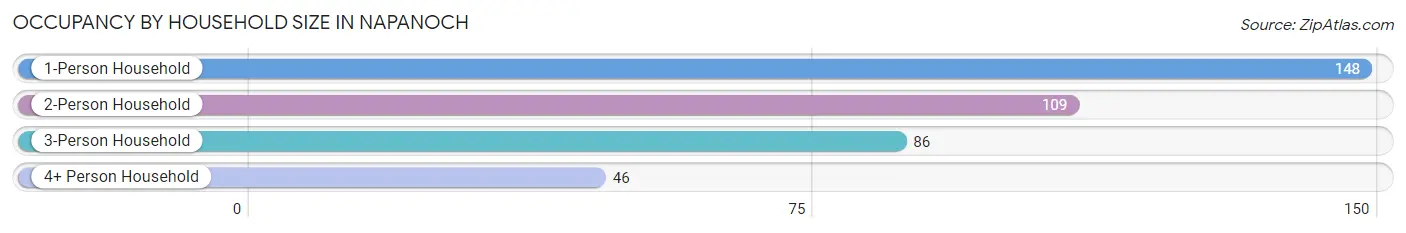
| Household Size | # Housing Units | % Housing Units |
| 1-Person Household | 148 | 38.1% |
| 2-Person Household | 109 | 28.0% |
| 3-Person Household | 86 | 22.1% |
| 4+ Person Household | 46 | 11.8% |
| Total Housing Units | 389 | 100.0% |
Occupancy by Ownership by Household Size in Napanoch
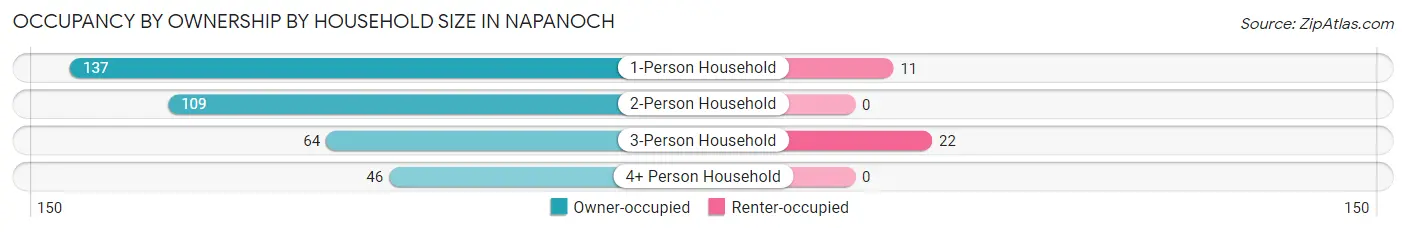
| Household Size | Owner-occupied | Renter-occupied |
| 1-Person Household | 137 (92.6%) | 11 (7.4%) |
| 2-Person Household | 109 (100.0%) | 0 (0.0%) |
| 3-Person Household | 64 (74.4%) | 22 (25.6%) |
| 4+ Person Household | 46 (100.0%) | 0 (0.0%) |
| Total Housing Units | 356 (91.5%) | 33 (8.5%) |
Occupancy by Educational Attainment in Napanoch
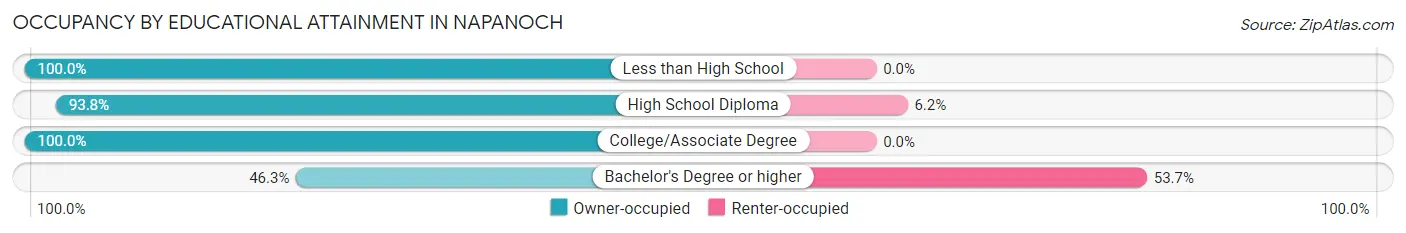
| Household Size | Owner-occupied | Renter-occupied |
| Less than High School | 34 (100.0%) | 0 (0.0%) |
| High School Diploma | 166 (93.8%) | 11 (6.2%) |
| College/Associate Degree | 137 (100.0%) | 0 (0.0%) |
| Bachelor's Degree or higher | 19 (46.3%) | 22 (53.7%) |
Occupancy by Age of Householder in Napanoch
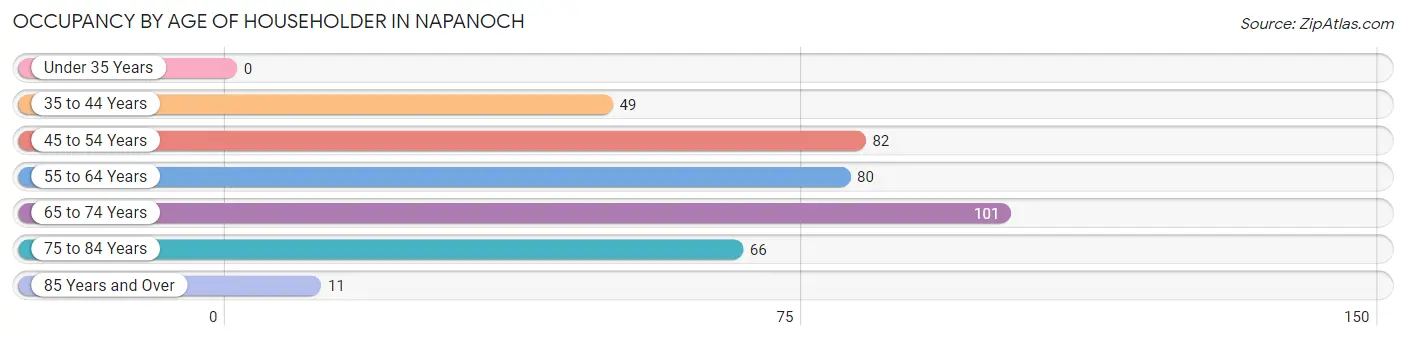
| Age Bracket | # Households | % Households |
| Under 35 Years | 0 | 0.0% |
| 35 to 44 Years | 49 | 12.6% |
| 45 to 54 Years | 82 | 21.1% |
| 55 to 64 Years | 80 | 20.6% |
| 65 to 74 Years | 101 | 26.0% |
| 75 to 84 Years | 66 | 17.0% |
| 85 Years and Over | 11 | 2.8% |
| Total | 389 | 100.0% |
Housing Finances in Napanoch
Median Income by Occupancy in Napanoch
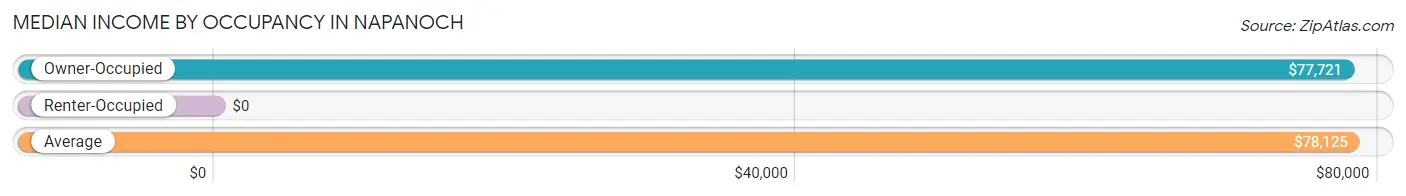
| Occupancy Type | # Households | Median Income |
| Owner-Occupied | 356 (91.5%) | $77,721 |
| Renter-Occupied | 33 (8.5%) | $0 |
| Average | 389 (100.0%) | $78,125 |
Occupancy by Householder Income Bracket in Napanoch
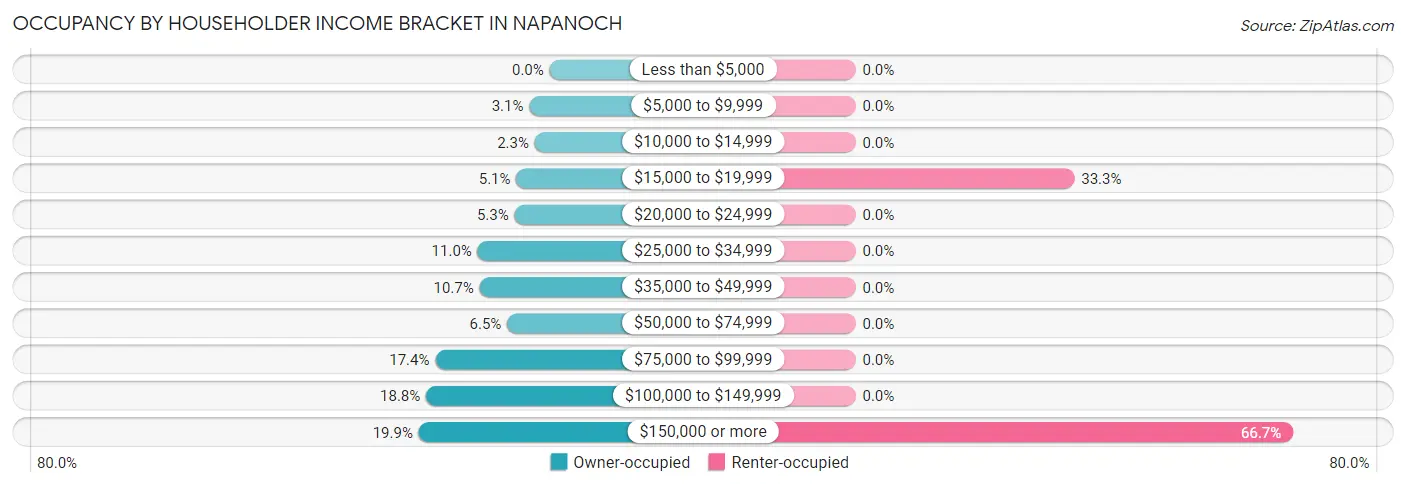
| Income Bracket | Owner-occupied | Renter-occupied |
| Less than $5,000 | 0 (0.0%) | 0 (0.0%) |
| $5,000 to $9,999 | 11 (3.1%) | 0 (0.0%) |
| $10,000 to $14,999 | 8 (2.2%) | 0 (0.0%) |
| $15,000 to $19,999 | 18 (5.1%) | 11 (33.3%) |
| $20,000 to $24,999 | 19 (5.3%) | 0 (0.0%) |
| $25,000 to $34,999 | 39 (11.0%) | 0 (0.0%) |
| $35,000 to $49,999 | 38 (10.7%) | 0 (0.0%) |
| $50,000 to $74,999 | 23 (6.5%) | 0 (0.0%) |
| $75,000 to $99,999 | 62 (17.4%) | 0 (0.0%) |
| $100,000 to $149,999 | 67 (18.8%) | 0 (0.0%) |
| $150,000 or more | 71 (19.9%) | 22 (66.7%) |
| Total | 356 (100.0%) | 33 (100.0%) |
Monthly Housing Cost Tiers in Napanoch
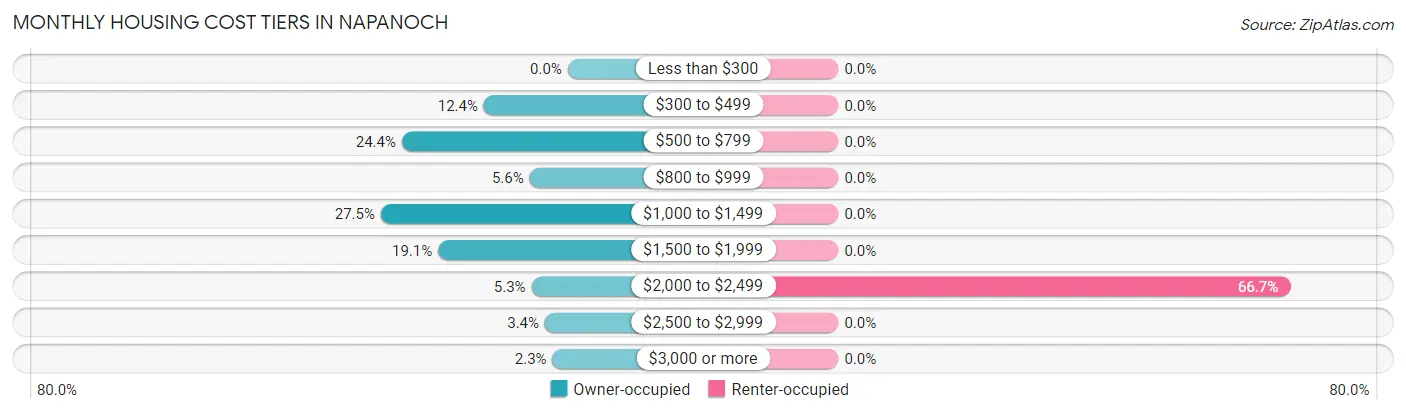
| Monthly Cost | Owner-occupied | Renter-occupied |
| Less than $300 | 0 (0.0%) | 0 (0.0%) |
| $300 to $499 | 44 (12.4%) | 0 (0.0%) |
| $500 to $799 | 87 (24.4%) | 0 (0.0%) |
| $800 to $999 | 20 (5.6%) | 0 (0.0%) |
| $1,000 to $1,499 | 98 (27.5%) | 0 (0.0%) |
| $1,500 to $1,999 | 68 (19.1%) | 0 (0.0%) |
| $2,000 to $2,499 | 19 (5.3%) | 22 (66.7%) |
| $2,500 to $2,999 | 12 (3.4%) | 0 (0.0%) |
| $3,000 or more | 8 (2.2%) | 0 (0.0%) |
| Total | 356 (100.0%) | 33 (100.0%) |
Physical Housing Characteristics in Napanoch
Housing Structures in Napanoch
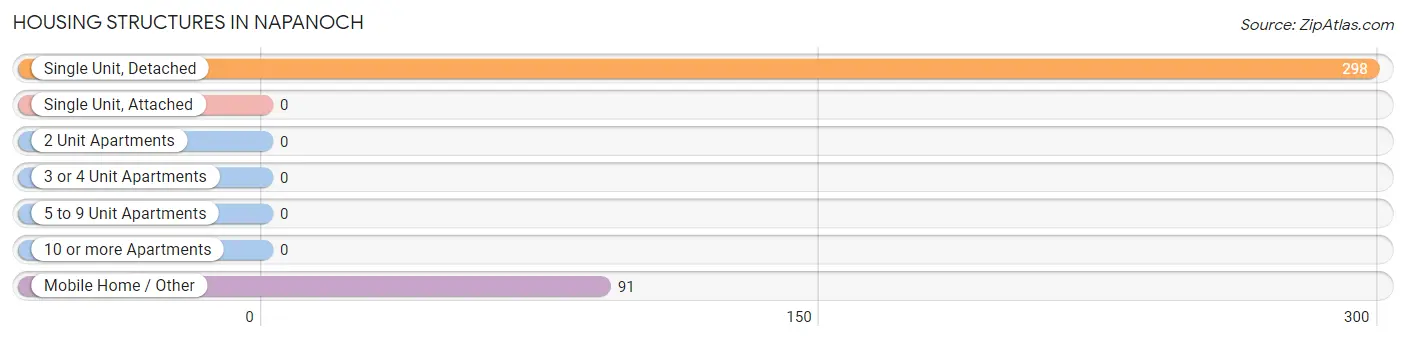
| Structure Type | # Housing Units | % Housing Units |
| Single Unit, Detached | 298 | 76.6% |
| Single Unit, Attached | 0 | 0.0% |
| 2 Unit Apartments | 0 | 0.0% |
| 3 or 4 Unit Apartments | 0 | 0.0% |
| 5 to 9 Unit Apartments | 0 | 0.0% |
| 10 or more Apartments | 0 | 0.0% |
| Mobile Home / Other | 91 | 23.4% |
| Total | 389 | 100.0% |
Housing Structures by Occupancy in Napanoch
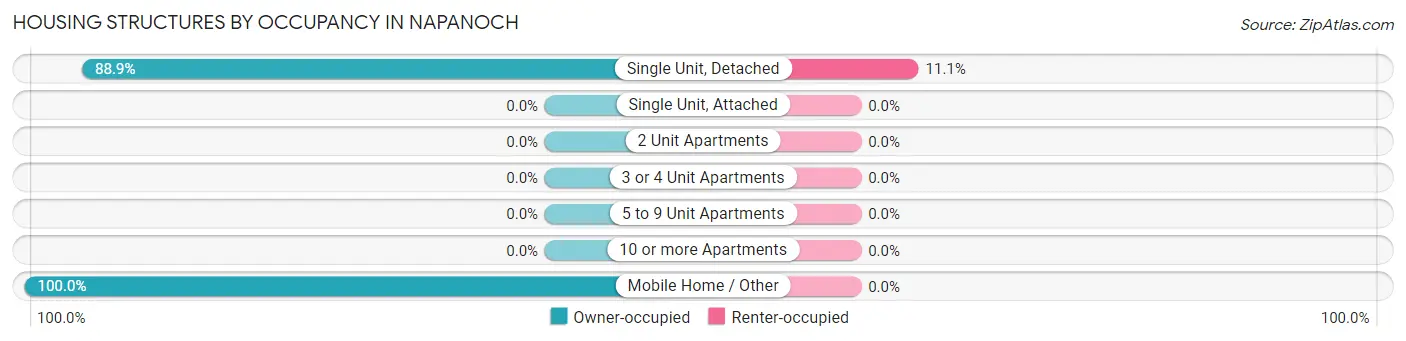
| Structure Type | Owner-occupied | Renter-occupied |
| Single Unit, Detached | 265 (88.9%) | 33 (11.1%) |
| Single Unit, Attached | 0 (0.0%) | 0 (0.0%) |
| 2 Unit Apartments | 0 (0.0%) | 0 (0.0%) |
| 3 or 4 Unit Apartments | 0 (0.0%) | 0 (0.0%) |
| 5 to 9 Unit Apartments | 0 (0.0%) | 0 (0.0%) |
| 10 or more Apartments | 0 (0.0%) | 0 (0.0%) |
| Mobile Home / Other | 91 (100.0%) | 0 (0.0%) |
| Total | 356 (91.5%) | 33 (8.5%) |
Housing Structures by Number of Rooms in Napanoch
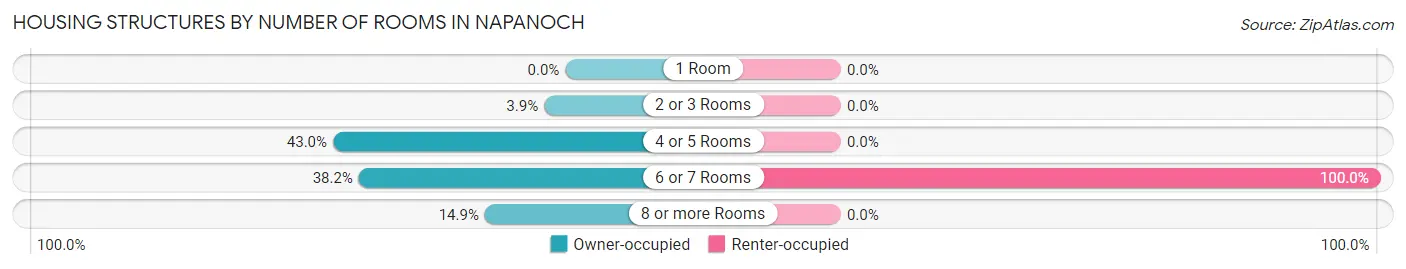
| Number of Rooms | Owner-occupied | Renter-occupied |
| 1 Room | 0 (0.0%) | 0 (0.0%) |
| 2 or 3 Rooms | 14 (3.9%) | 0 (0.0%) |
| 4 or 5 Rooms | 153 (43.0%) | 0 (0.0%) |
| 6 or 7 Rooms | 136 (38.2%) | 33 (100.0%) |
| 8 or more Rooms | 53 (14.9%) | 0 (0.0%) |
| Total | 356 (100.0%) | 33 (100.0%) |
Housing Structure by Heating Type in Napanoch
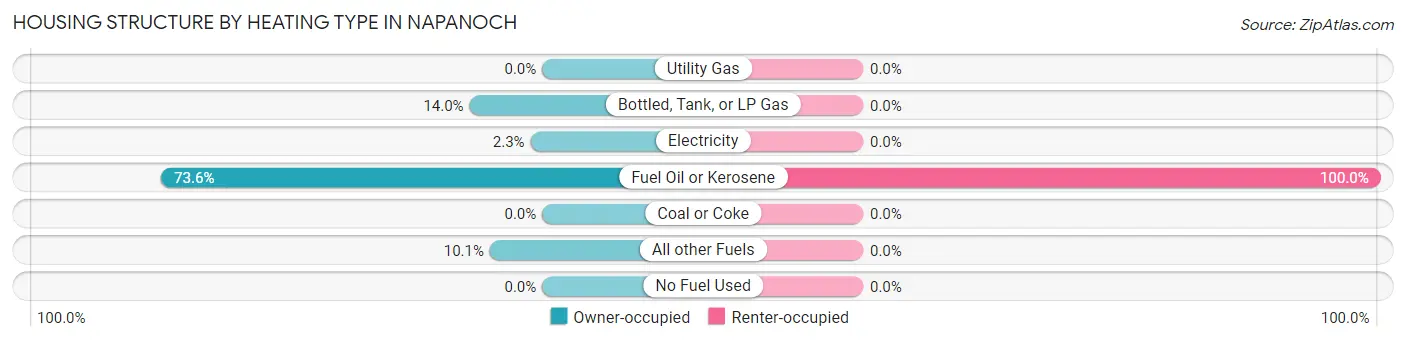
| Heating Type | Owner-occupied | Renter-occupied |
| Utility Gas | 0 (0.0%) | 0 (0.0%) |
| Bottled, Tank, or LP Gas | 50 (14.0%) | 0 (0.0%) |
| Electricity | 8 (2.2%) | 0 (0.0%) |
| Fuel Oil or Kerosene | 262 (73.6%) | 33 (100.0%) |
| Coal or Coke | 0 (0.0%) | 0 (0.0%) |
| All other Fuels | 36 (10.1%) | 0 (0.0%) |
| No Fuel Used | 0 (0.0%) | 0 (0.0%) |
| Total | 356 (100.0%) | 33 (100.0%) |
Household Vehicle Usage in Napanoch
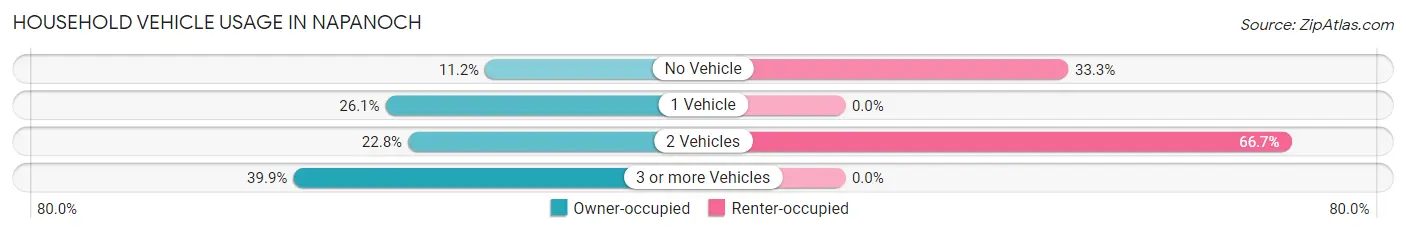
| Vehicles per Household | Owner-occupied | Renter-occupied |
| No Vehicle | 40 (11.2%) | 11 (33.3%) |
| 1 Vehicle | 93 (26.1%) | 0 (0.0%) |
| 2 Vehicles | 81 (22.8%) | 22 (66.7%) |
| 3 or more Vehicles | 142 (39.9%) | 0 (0.0%) |
| Total | 356 (100.0%) | 33 (100.0%) |
Real Estate & Mortgages in Napanoch
Real Estate and Mortgage Overview in Napanoch
| Characteristic | Without Mortgage | With Mortgage |
| Housing Units | 197 | 159 |
| Median Property Value | $112,800 | $170,800 |
| Median Household Income | - | - |
| Monthly Housing Costs | $684 | $8 |
| Real Estate Taxes | $2,339 | $19 |
Property Value by Mortgage Status in Napanoch
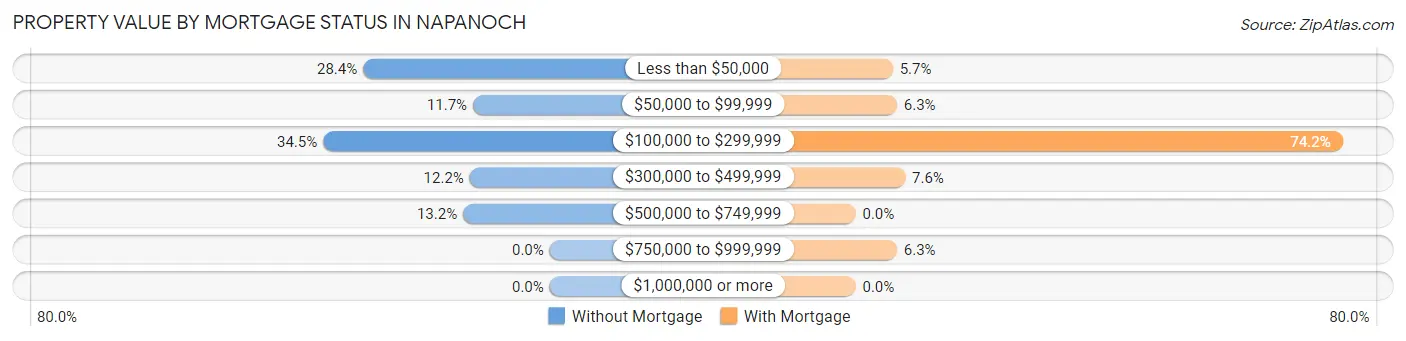
| Property Value | Without Mortgage | With Mortgage |
| Less than $50,000 | 56 (28.4%) | 9 (5.7%) |
| $50,000 to $99,999 | 23 (11.7%) | 10 (6.3%) |
| $100,000 to $299,999 | 68 (34.5%) | 118 (74.2%) |
| $300,000 to $499,999 | 24 (12.2%) | 12 (7.5%) |
| $500,000 to $749,999 | 26 (13.2%) | 0 (0.0%) |
| $750,000 to $999,999 | 0 (0.0%) | 10 (6.3%) |
| $1,000,000 or more | 0 (0.0%) | 0 (0.0%) |
| Total | 197 (100.0%) | 159 (100.0%) |
Household Income by Mortgage Status in Napanoch
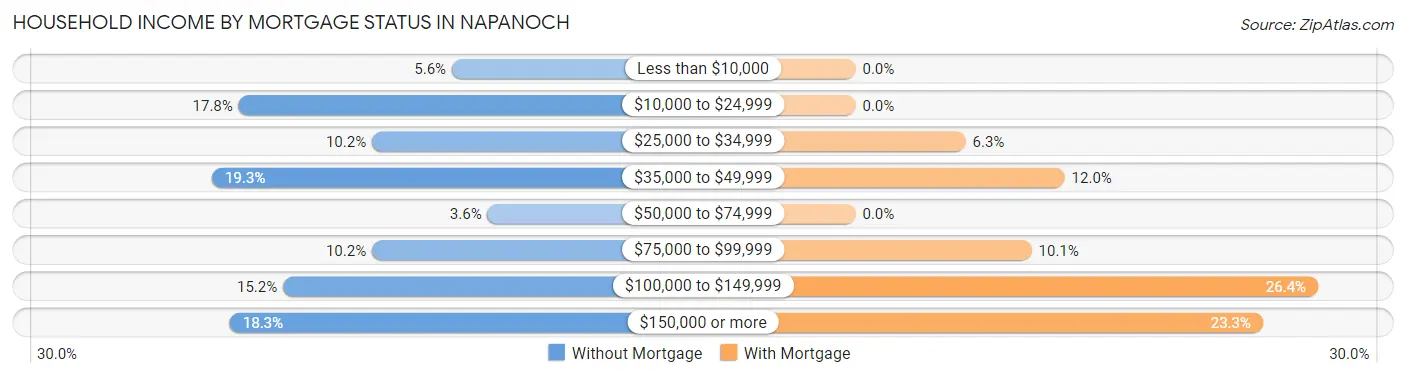
| Household Income | Without Mortgage | With Mortgage |
| Less than $10,000 | 11 (5.6%) | 0 (0.0%) |
| $10,000 to $24,999 | 35 (17.8%) | 0 (0.0%) |
| $25,000 to $34,999 | 20 (10.2%) | 10 (6.3%) |
| $35,000 to $49,999 | 38 (19.3%) | 19 (11.9%) |
| $50,000 to $74,999 | 7 (3.5%) | 0 (0.0%) |
| $75,000 to $99,999 | 20 (10.2%) | 16 (10.1%) |
| $100,000 to $149,999 | 30 (15.2%) | 42 (26.4%) |
| $150,000 or more | 36 (18.3%) | 37 (23.3%) |
| Total | 197 (100.0%) | 159 (100.0%) |
Property Value to Household Income Ratio in Napanoch
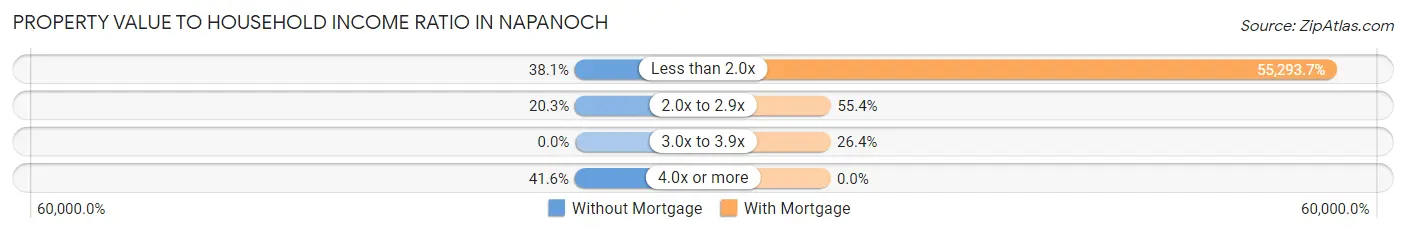
| Value-to-Income Ratio | Without Mortgage | With Mortgage |
| Less than 2.0x | 75 (38.1%) | 87,917 (55,293.7%) |
| 2.0x to 2.9x | 40 (20.3%) | 88 (55.3%) |
| 3.0x to 3.9x | 0 (0.0%) | 42 (26.4%) |
| 4.0x or more | 82 (41.6%) | 0 (0.0%) |
| Total | 197 (100.0%) | 159 (100.0%) |
Real Estate Taxes by Mortgage Status in Napanoch
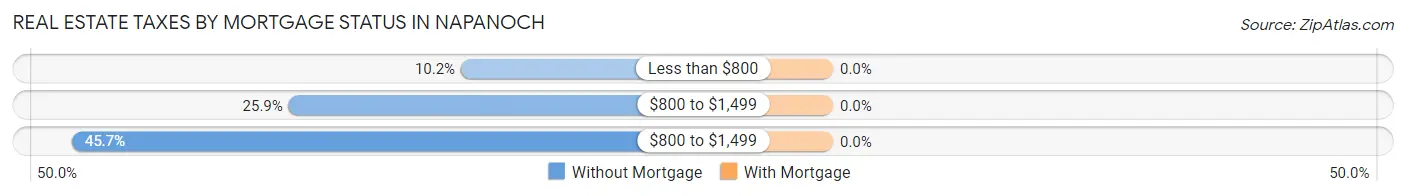
| Property Taxes | Without Mortgage | With Mortgage |
| Less than $800 | 20 (10.2%) | 0 (0.0%) |
| $800 to $1,499 | 51 (25.9%) | 0 (0.0%) |
| $800 to $1,499 | 90 (45.7%) | 0 (0.0%) |
| Total | 197 (100.0%) | 159 (100.0%) |
Health & Disability in Napanoch
Health Insurance Coverage by Age in Napanoch
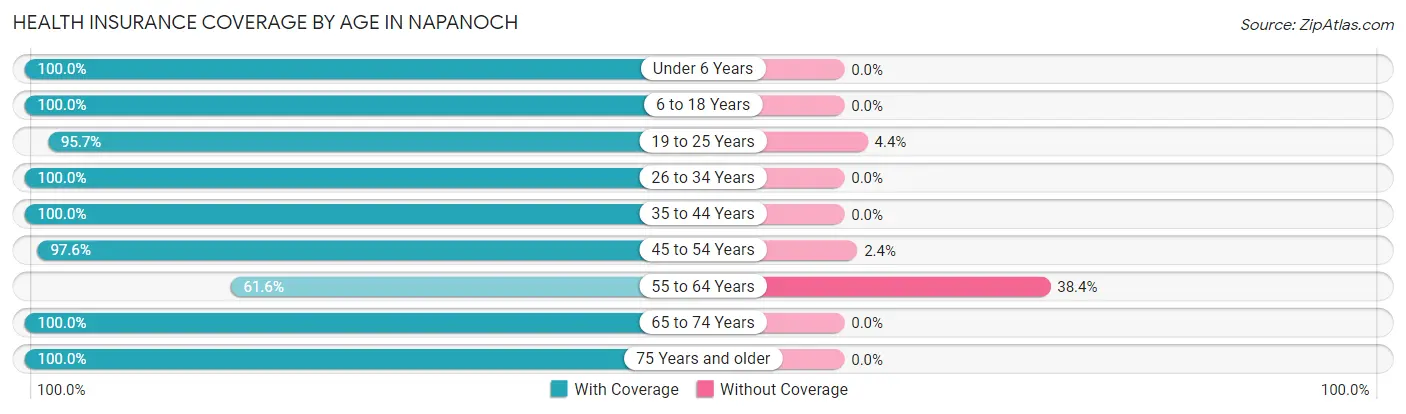
| Age Bracket | With Coverage | Without Coverage |
| Under 6 Years | 13 (100.0%) | 0 (0.0%) |
| 6 to 18 Years | 124 (100.0%) | 0 (0.0%) |
| 19 to 25 Years | 44 (95.7%) | 2 (4.3%) |
| 26 to 34 Years | 44 (100.0%) | 0 (0.0%) |
| 35 to 44 Years | 84 (100.0%) | 0 (0.0%) |
| 45 to 54 Years | 162 (97.6%) | 4 (2.4%) |
| 55 to 64 Years | 85 (61.6%) | 53 (38.4%) |
| 65 to 74 Years | 125 (100.0%) | 0 (0.0%) |
| 75 Years and older | 103 (100.0%) | 0 (0.0%) |
| Total | 784 (93.0%) | 59 (7.0%) |
Health Insurance Coverage by Citizenship Status in Napanoch

| Citizenship Status | With Coverage | Without Coverage |
| Native Born | 13 (100.0%) | 0 (0.0%) |
| Foreign Born, Citizen | 124 (100.0%) | 0 (0.0%) |
| Foreign Born, not a Citizen | 44 (95.7%) | 2 (4.3%) |
Health Insurance Coverage by Household Income in Napanoch
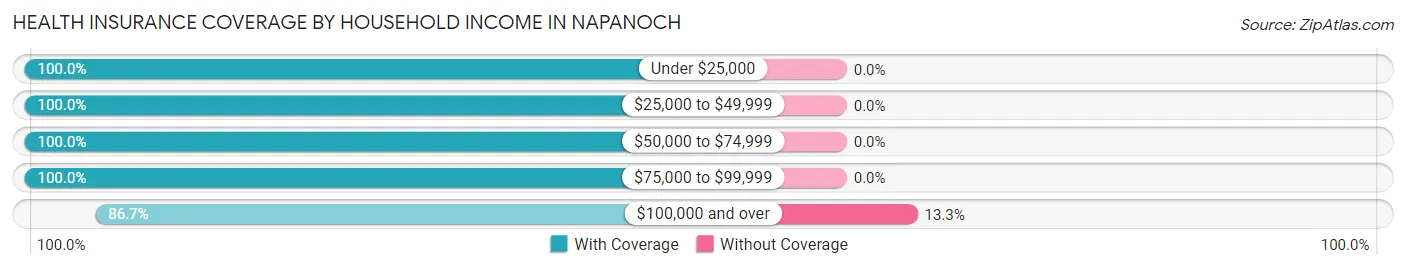
| Household Income | With Coverage | Without Coverage |
| Under $25,000 | 73 (100.0%) | 0 (0.0%) |
| $25,000 to $49,999 | 110 (100.0%) | 0 (0.0%) |
| $50,000 to $74,999 | 59 (100.0%) | 0 (0.0%) |
| $75,000 to $99,999 | 154 (100.0%) | 0 (0.0%) |
| $100,000 and over | 386 (86.7%) | 59 (13.3%) |
Public vs Private Health Insurance Coverage by Age in Napanoch
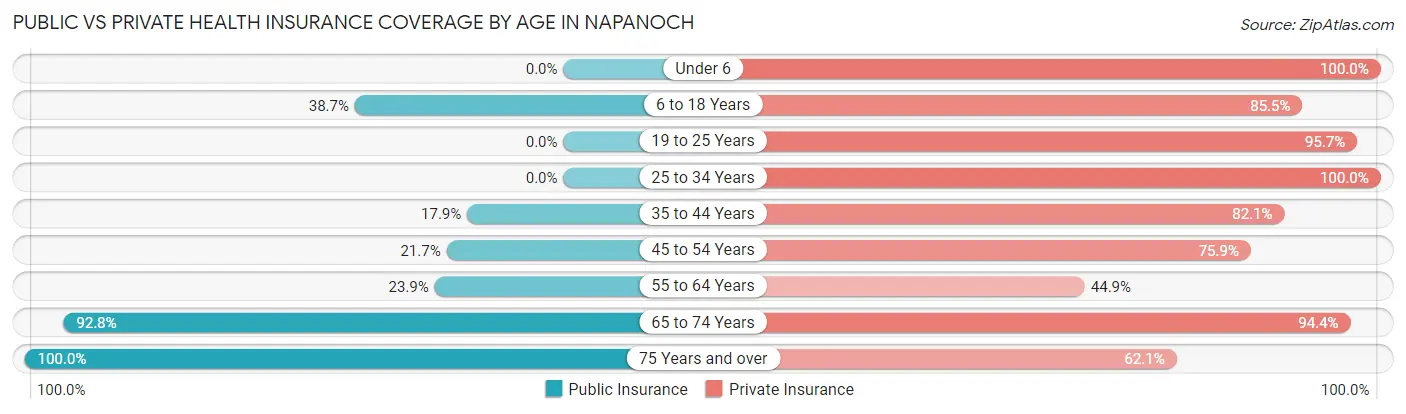
| Age Bracket | Public Insurance | Private Insurance |
| Under 6 | 0 (0.0%) | 13 (100.0%) |
| 6 to 18 Years | 48 (38.7%) | 106 (85.5%) |
| 19 to 25 Years | 0 (0.0%) | 44 (95.7%) |
| 25 to 34 Years | 0 (0.0%) | 44 (100.0%) |
| 35 to 44 Years | 15 (17.9%) | 69 (82.1%) |
| 45 to 54 Years | 36 (21.7%) | 126 (75.9%) |
| 55 to 64 Years | 33 (23.9%) | 62 (44.9%) |
| 65 to 74 Years | 116 (92.8%) | 118 (94.4%) |
| 75 Years and over | 103 (100.0%) | 64 (62.1%) |
| Total | 351 (41.6%) | 646 (76.6%) |
Disability Status by Sex by Age in Napanoch
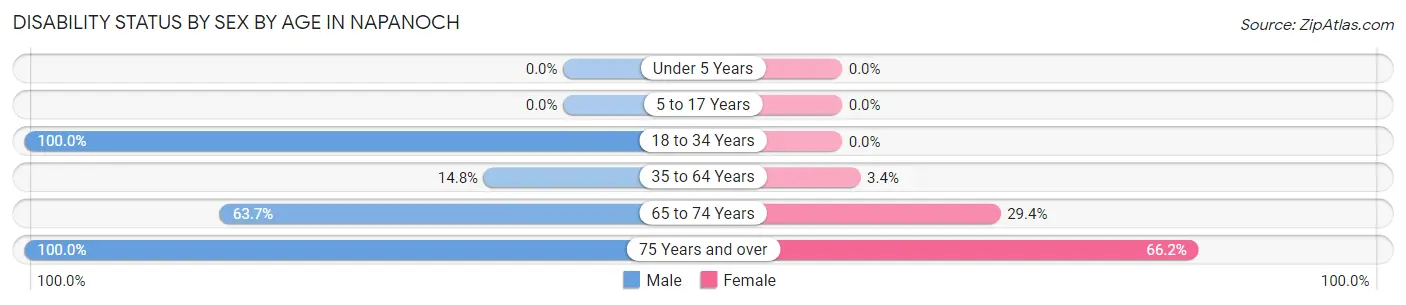
| Age Bracket | Male | Female |
| Under 5 Years | 0 (0.0%) | 0 (0.0%) |
| 5 to 17 Years | 0 (0.0%) | 0 (0.0%) |
| 18 to 34 Years | 15 (100.0%) | 0 (0.0%) |
| 35 to 64 Years | 27 (14.7%) | 7 (3.4%) |
| 65 to 74 Years | 58 (63.7%) | 10 (29.4%) |
| 75 Years and over | 26 (100.0%) | 51 (66.2%) |
Disability Class by Sex by Age in Napanoch
Disability Class: Hearing Difficulty
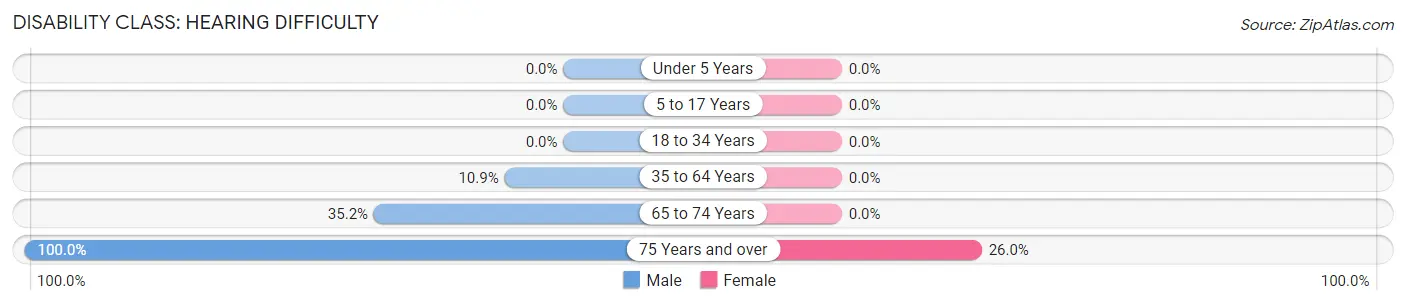
| Age Bracket | Male | Female |
| Under 5 Years | 0 (0.0%) | 0 (0.0%) |
| 5 to 17 Years | 0 (0.0%) | 0 (0.0%) |
| 18 to 34 Years | 0 (0.0%) | 0 (0.0%) |
| 35 to 64 Years | 20 (10.9%) | 0 (0.0%) |
| 65 to 74 Years | 32 (35.2%) | 0 (0.0%) |
| 75 Years and over | 26 (100.0%) | 20 (26.0%) |
Disability Class: Vision Difficulty
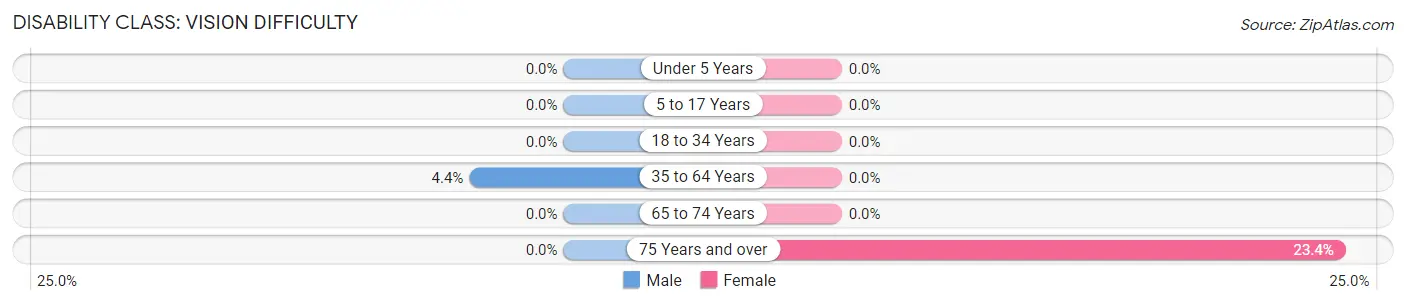
| Age Bracket | Male | Female |
| Under 5 Years | 0 (0.0%) | 0 (0.0%) |
| 5 to 17 Years | 0 (0.0%) | 0 (0.0%) |
| 18 to 34 Years | 0 (0.0%) | 0 (0.0%) |
| 35 to 64 Years | 8 (4.4%) | 0 (0.0%) |
| 65 to 74 Years | 0 (0.0%) | 0 (0.0%) |
| 75 Years and over | 0 (0.0%) | 18 (23.4%) |
Disability Class: Cognitive Difficulty
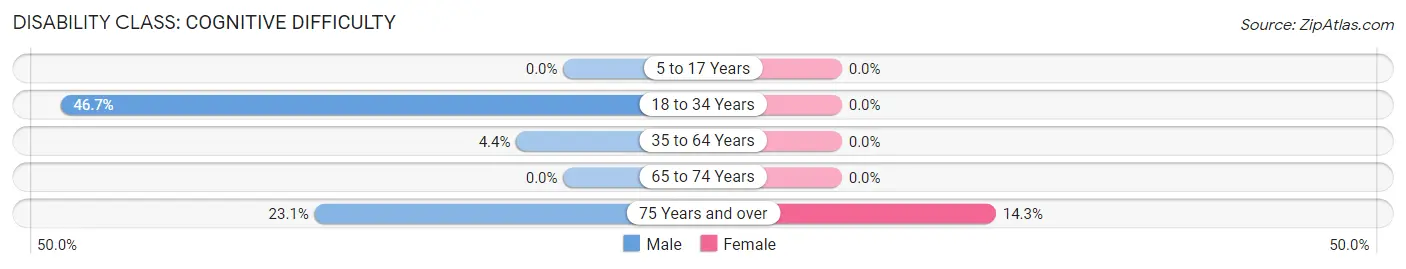
| Age Bracket | Male | Female |
| 5 to 17 Years | 0 (0.0%) | 0 (0.0%) |
| 18 to 34 Years | 7 (46.7%) | 0 (0.0%) |
| 35 to 64 Years | 8 (4.4%) | 0 (0.0%) |
| 65 to 74 Years | 0 (0.0%) | 0 (0.0%) |
| 75 Years and over | 6 (23.1%) | 11 (14.3%) |
Disability Class: Ambulatory Difficulty
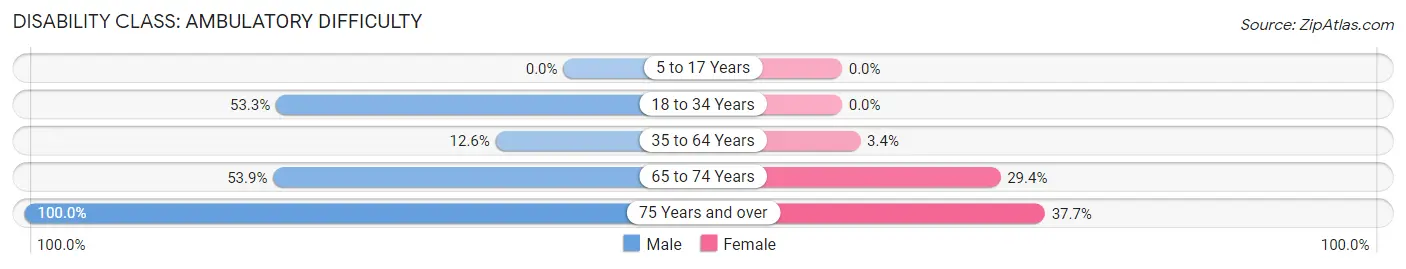
| Age Bracket | Male | Female |
| 5 to 17 Years | 0 (0.0%) | 0 (0.0%) |
| 18 to 34 Years | 8 (53.3%) | 0 (0.0%) |
| 35 to 64 Years | 23 (12.6%) | 7 (3.4%) |
| 65 to 74 Years | 49 (53.8%) | 10 (29.4%) |
| 75 Years and over | 26 (100.0%) | 29 (37.7%) |
Disability Class: Self-Care Difficulty
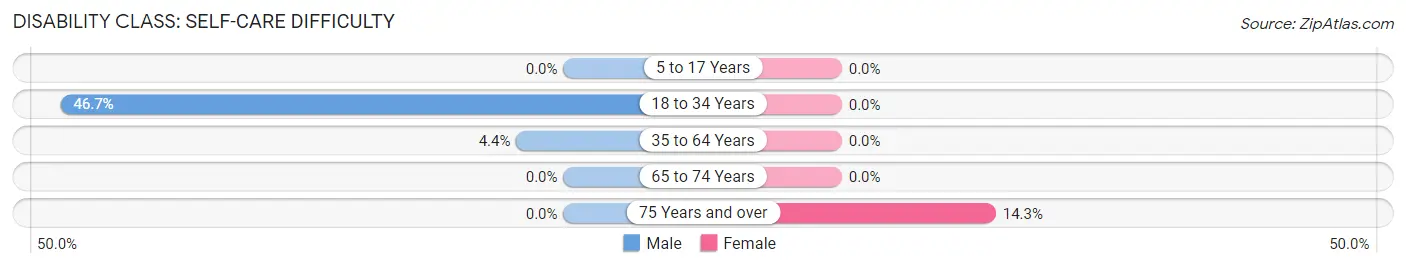
| Age Bracket | Male | Female |
| 5 to 17 Years | 0 (0.0%) | 0 (0.0%) |
| 18 to 34 Years | 7 (46.7%) | 0 (0.0%) |
| 35 to 64 Years | 8 (4.4%) | 0 (0.0%) |
| 65 to 74 Years | 0 (0.0%) | 0 (0.0%) |
| 75 Years and over | 0 (0.0%) | 11 (14.3%) |
Technology Access in Napanoch
Computing Device Access in Napanoch
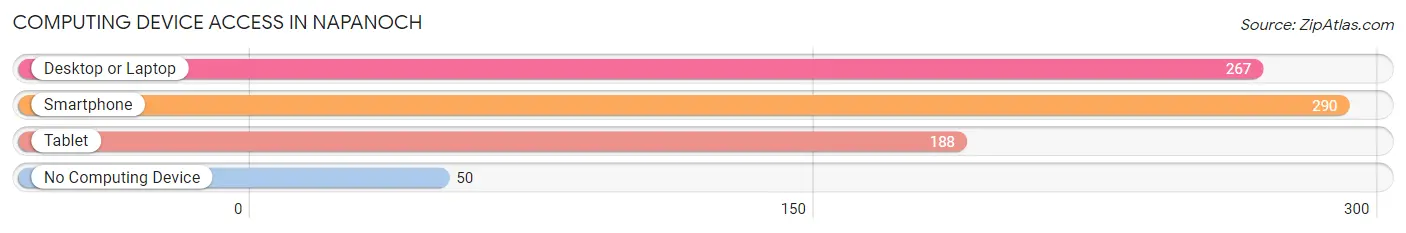
| Device Type | # Households | % Households |
| Desktop or Laptop | 267 | 68.6% |
| Smartphone | 290 | 74.6% |
| Tablet | 188 | 48.3% |
| No Computing Device | 50 | 12.9% |
| Total | 389 | 100.0% |
Internet Access in Napanoch
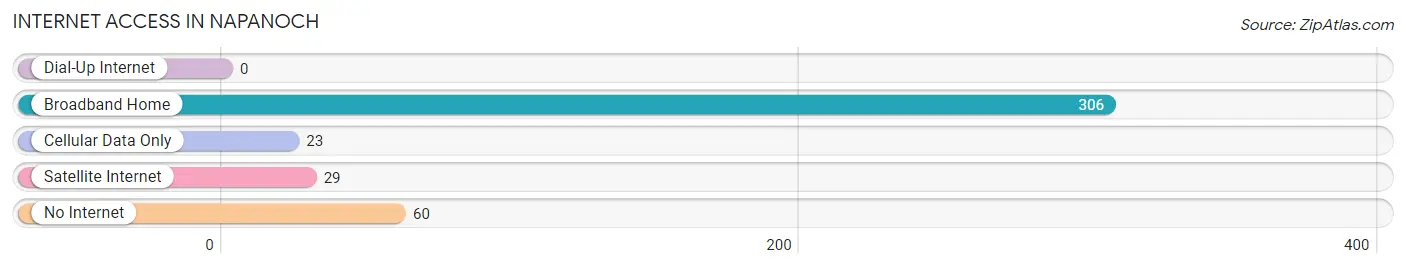
| Internet Type | # Households | % Households |
| Dial-Up Internet | 0 | 0.0% |
| Broadband Home | 306 | 78.7% |
| Cellular Data Only | 23 | 5.9% |
| Satellite Internet | 29 | 7.5% |
| No Internet | 60 | 15.4% |
| Total | 389 | 100.0% |
Napanoch Summary
Napanoch is a hamlet located in the town of Wawarsing in Ulster County, New York. It is situated in the foothills of the Shawangunk Mountains, approximately 70 miles north of New York City. The hamlet is located on the banks of the Rondout Creek, which is a tributary of the Hudson River. The population of Napanoch was 1,845 as of the 2010 census.
Geography
Napanoch is located at 41°45'N 74°25'W (41.75, -74.42). According to the United States Census Bureau, the hamlet has a total area of 1.2 square miles, all of it land.
The hamlet is located in the foothills of the Shawangunk Mountains, which are part of the Appalachian Mountains. The Shawangunk Ridge is a popular destination for rock climbing, hiking, and other outdoor activities. The Rondout Creek runs through the hamlet, and is a tributary of the Hudson River.
History
The area that is now Napanoch was originally inhabited by the Lenape Native Americans. The first European settlers arrived in the area in the late 17th century. The hamlet was originally known as "Napanoch Flats" and was part of the town of Rochester. In 1809, the town of Wawarsing was formed, and Napanoch became part of it.
The hamlet was an important stop on the Delaware and Hudson Canal, which was built in the early 19th century. The canal was used to transport coal from Pennsylvania to New York City. The canal was in operation until 1898, when it was replaced by the Ulster and Delaware Railroad.
The hamlet was also home to a number of industries, including a tannery, a grist mill, and a sawmill. The tannery was in operation until the early 20th century.
Economy
The economy of Napanoch is largely based on tourism. The hamlet is home to a number of bed and breakfasts, as well as a number of restaurants and shops. The hamlet is also home to a number of outdoor recreation businesses, such as rock climbing and kayaking.
The hamlet is also home to a number of small businesses, including a lumber yard, a hardware store, and a gas station.
Demographics
As of the 2010 census, the population of Napanoch was 1,845. The racial makeup of the hamlet was 94.3% White, 1.2% African American, 0.3% Native American, 0.7% Asian, 0.1% Pacific Islander, 1.2% from other races, and 2.3% from two or more races. Hispanic or Latino of any race were 4.2% of the population.
The median household income in Napanoch was $45,938, and the median family income was $50,938. The per capita income was $20,938. About 10.3% of families and 13.2% of the population were below the poverty line, including 17.2% of those under age 18 and 8.2% of those age 65 or over.
The population of Napanoch is largely rural, with most of the population living in single-family homes. The hamlet is served by the Ellenville Central School District.
Common Questions
What is Per Capita Income in Napanoch?
Per Capita income in Napanoch is $43,747.
What is the Median Family Income in Napanoch?
Median Family Income in Napanoch is $132,171.
What is the Median Household income in Napanoch?
Median Household Income in Napanoch is $78,125.
What is Income or Wage Gap in Napanoch?
Income or Wage Gap in Napanoch is 29.4%.
Women in Napanoch earn 70.6 cents for every dollar earned by a man.
What is Inequality or Gini Index in Napanoch?
Inequality or Gini Index in Napanoch is 0.40.
What is the Total Population of Napanoch?
Total Population of Napanoch is 843.
What is the Total Male Population of Napanoch?
Total Male Population of Napanoch is 375.
What is the Total Female Population of Napanoch?
Total Female Population of Napanoch is 468.
What is the Ratio of Males per 100 Females in Napanoch?
There are 80.13 Males per 100 Females in Napanoch.
What is the Ratio of Females per 100 Males in Napanoch?
There are 124.80 Females per 100 Males in Napanoch.
What is the Median Population Age in Napanoch?
Median Population Age in Napanoch is 52.0 Years.
What is the Average Family Size in Napanoch
Average Family Size in Napanoch is 3.0 People.
What is the Average Household Size in Napanoch
Average Household Size in Napanoch is 2.2 People.
How Large is the Labor Force in Napanoch?
There are 443 People in the Labor Forcein in Napanoch.
What is the Percentage of People in the Labor Force in Napanoch?
59.1% of People are in the Labor Force in Napanoch.
What is the Unemployment Rate in Napanoch?
Unemployment Rate in Napanoch is 2.3%.