Long Branch, NJ Map & Demographics
Long Branch Map
Long Branch Overview
$39,010
PER CAPITA INCOME
$82,368
AVG FAMILY INCOME
$72,234
AVG HOUSEHOLD INCOME
35.7%
WAGE / INCOME GAP [ % ]
64.3¢/ $1
WAGE / INCOME GAP [ $ ]
$13,351
FAMILY INCOME DEFICIT
0.48
INEQUALITY / GINI INDEX
31,932
TOTAL POPULATION
14,721
MALE POPULATION
17,211
FEMALE POPULATION
85.53
MALES / 100 FEMALES
116.91
FEMALES / 100 MALES
36.5
MEDIAN AGE
3.0
AVG FAMILY SIZE
2.5
AVG HOUSEHOLD SIZE
16,851
LABOR FORCE [ PEOPLE ]
65.3%
PERCENT IN LABOR FORCE
7.1%
UNEMPLOYMENT RATE
Long Branch Zip Codes
Income in Long Branch
Income Overview in Long Branch
Per Capita Income in Long Branch is $39,010, while median incomes of families and households are $82,368 and $72,234 respectively.
| Characteristic | Number | Measure |
| Per Capita Income | 31,932 | $39,010 |
| Median Family Income | 8,030 | $82,368 |
| Mean Family Income | 8,030 | $107,019 |
| Median Household Income | 12,813 | $72,234 |
| Mean Household Income | 12,813 | $98,215 |
| Income Deficit | 8,030 | $13,351 |
| Wage / Income Gap (%) | 31,932 | 35.67% |
| Wage / Income Gap ($) | 31,932 | 64.33¢ per $1 |
| Gini / Inequality Index | 31,932 | 0.48 |
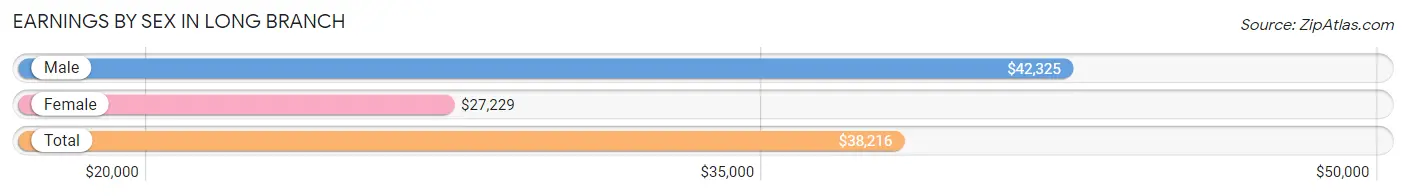
Earnings by Sex in Long Branch
Average Earnings in Long Branch are $38,216, $42,325 for men and $27,229 for women, a difference of 35.7%.
| Sex | Number | Average Earnings |
| Male | 9,374 (52.5%) | $42,325 |
| Female | 8,478 (47.5%) | $27,229 |
| Total | 17,852 (100.0%) | $38,216 |
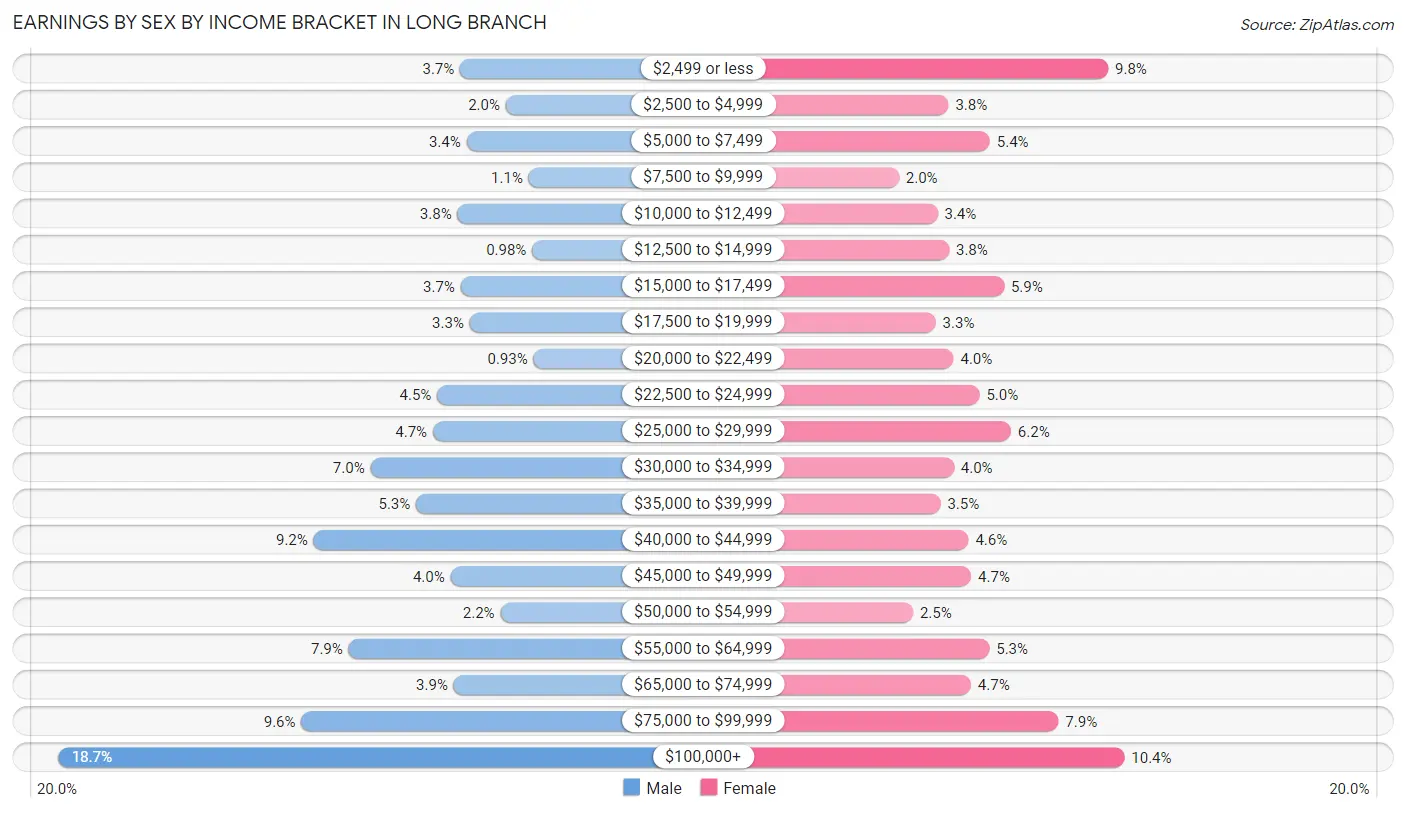
Earnings by Sex by Income Bracket in Long Branch
The most common earnings brackets in Long Branch are $100,000+ for men (1,755 | 18.7%) and $100,000+ for women (882 | 10.4%).
| Income | Male | Female |
| $2,499 or less | 345 (3.7%) | 830 (9.8%) |
| $2,500 to $4,999 | 185 (2.0%) | 323 (3.8%) |
| $5,000 to $7,499 | 322 (3.4%) | 454 (5.4%) |
| $7,500 to $9,999 | 104 (1.1%) | 165 (1.9%) |
| $10,000 to $12,499 | 354 (3.8%) | 288 (3.4%) |
| $12,500 to $14,999 | 92 (1.0%) | 325 (3.8%) |
| $15,000 to $17,499 | 343 (3.7%) | 499 (5.9%) |
| $17,500 to $19,999 | 311 (3.3%) | 282 (3.3%) |
| $20,000 to $22,499 | 87 (0.9%) | 339 (4.0%) |
| $22,500 to $24,999 | 426 (4.5%) | 421 (5.0%) |
| $25,000 to $29,999 | 441 (4.7%) | 521 (6.1%) |
| $30,000 to $34,999 | 660 (7.0%) | 340 (4.0%) |
| $35,000 to $39,999 | 500 (5.3%) | 298 (3.5%) |
| $40,000 to $44,999 | 860 (9.2%) | 387 (4.6%) |
| $45,000 to $49,999 | 379 (4.0%) | 395 (4.7%) |
| $50,000 to $54,999 | 203 (2.2%) | 210 (2.5%) |
| $55,000 to $64,999 | 737 (7.9%) | 453 (5.3%) |
| $65,000 to $74,999 | 367 (3.9%) | 394 (4.6%) |
| $75,000 to $99,999 | 903 (9.6%) | 672 (7.9%) |
| $100,000+ | 1,755 (18.7%) | 882 (10.4%) |
| Total | 9,374 (100.0%) | 8,478 (100.0%) |
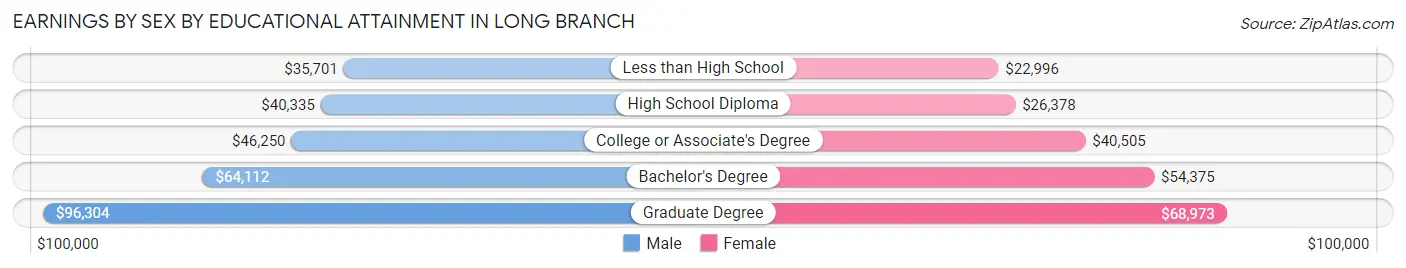
Earnings by Sex by Educational Attainment in Long Branch
Average earnings in Long Branch are $49,403 for men and $38,977 for women, a difference of 21.1%. Men with an educational attainment of graduate degree enjoy the highest average annual earnings of $96,304, while those with less than high school education earn the least with $35,701. Women with an educational attainment of graduate degree earn the most with the average annual earnings of $68,973, while those with less than high school education have the smallest earnings of $22,996.
| Educational Attainment | Male Income | Female Income |
| Less than High School | $35,701 | $22,996 |
| High School Diploma | $40,335 | $26,378 |
| College or Associate's Degree | $46,250 | $40,505 |
| Bachelor's Degree | $64,112 | $54,375 |
| Graduate Degree | $96,304 | $68,973 |
| Total | $49,403 | $38,977 |
Family Income in Long Branch
Family Income Brackets in Long Branch
According to the Long Branch family income data, there are 1,662 families falling into the $100,000 to $149,999 income range, which is the most common income bracket and makes up 20.7% of all families. Conversely, the $10,000 to $14,999 income bracket is the least frequent group with only 257 families (3.2%) belonging to this category.
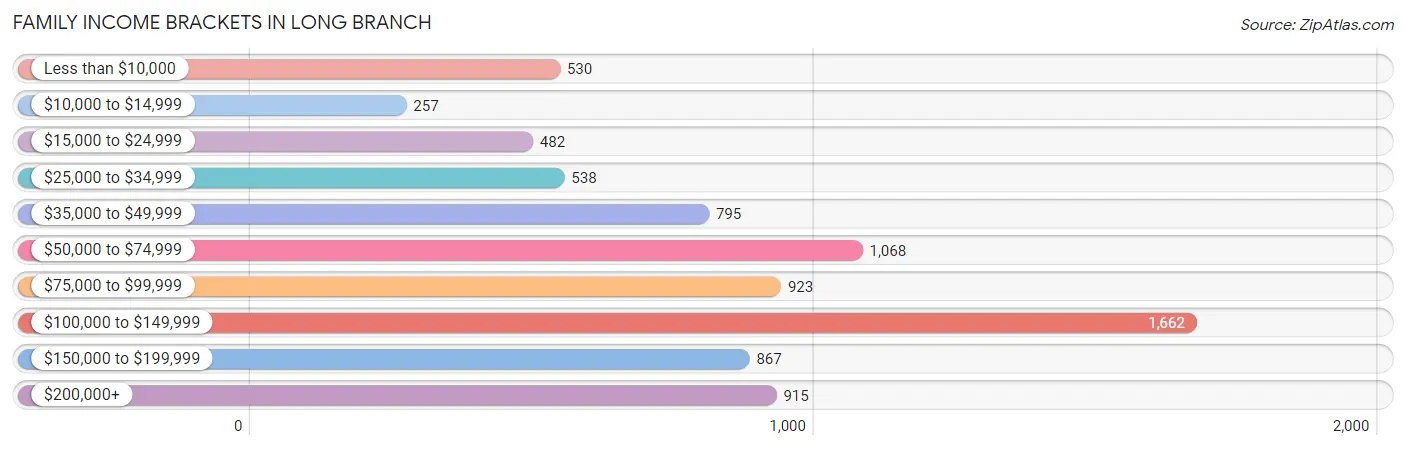
| Income Bracket | # Families | % Families |
| Less than $10,000 | 530 | 6.6% |
| $10,000 to $14,999 | 257 | 3.2% |
| $15,000 to $24,999 | 482 | 6.0% |
| $25,000 to $34,999 | 538 | 6.7% |
| $35,000 to $49,999 | 795 | 9.9% |
| $50,000 to $74,999 | 1,068 | 13.3% |
| $75,000 to $99,999 | 923 | 11.5% |
| $100,000 to $149,999 | 1,662 | 20.7% |
| $150,000 to $199,999 | 867 | 10.8% |
| $200,000+ | 915 | 11.4% |
Family Income by Famaliy Size in Long Branch
4-person families (1,526 | 19.0%) account for the highest median family income in Long Branch with $111,750 per family, while 2-person families (3,635 | 45.3%) have the highest median income of $40,558 per family member.
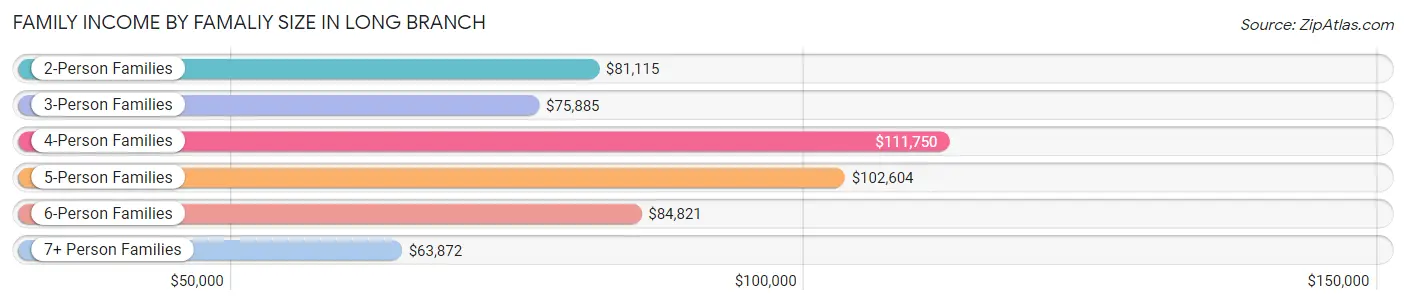
| Income Bracket | # Families | Median Income |
| 2-Person Families | 3,635 (45.3%) | $81,115 |
| 3-Person Families | 2,023 (25.2%) | $75,885 |
| 4-Person Families | 1,526 (19.0%) | $111,750 |
| 5-Person Families | 575 (7.2%) | $102,604 |
| 6-Person Families | 108 (1.3%) | $84,821 |
| 7+ Person Families | 163 (2.0%) | $63,872 |
| Total | 8,030 (100.0%) | $82,368 |
Family Income by Number of Earners in Long Branch
The median family income in Long Branch is $82,368, with families comprising 3+ earners (1,075) having the highest median family income of $136,119, while families with no earners (1,064) have the lowest median family income of $26,288, accounting for 13.4% and 13.3% of families, respectively.
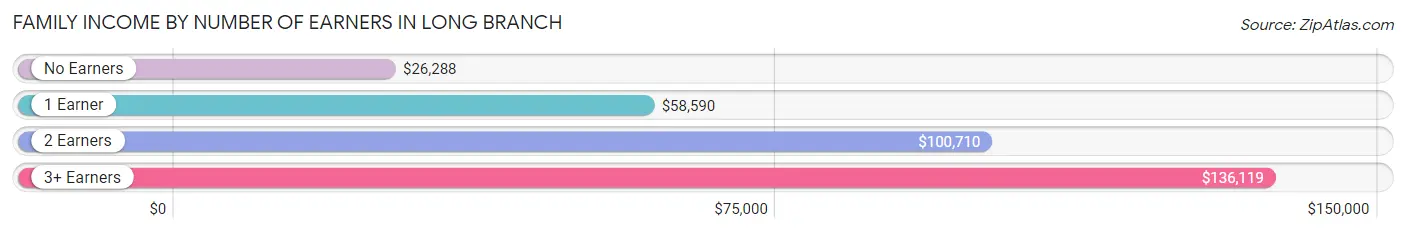
| Number of Earners | # Families | Median Income |
| No Earners | 1,064 (13.3%) | $26,288 |
| 1 Earner | 2,838 (35.3%) | $58,590 |
| 2 Earners | 3,053 (38.0%) | $100,710 |
| 3+ Earners | 1,075 (13.4%) | $136,119 |
| Total | 8,030 (100.0%) | $82,368 |
Household Income in Long Branch
Household Income Brackets in Long Branch
With 2,332 households falling in the category, the $100,000 to $149,999 income range is the most frequent in Long Branch, accounting for 18.2% of all households. In contrast, only 769 households (6.0%) fall into the $10,000 to $14,999 income bracket, making it the least populous group.
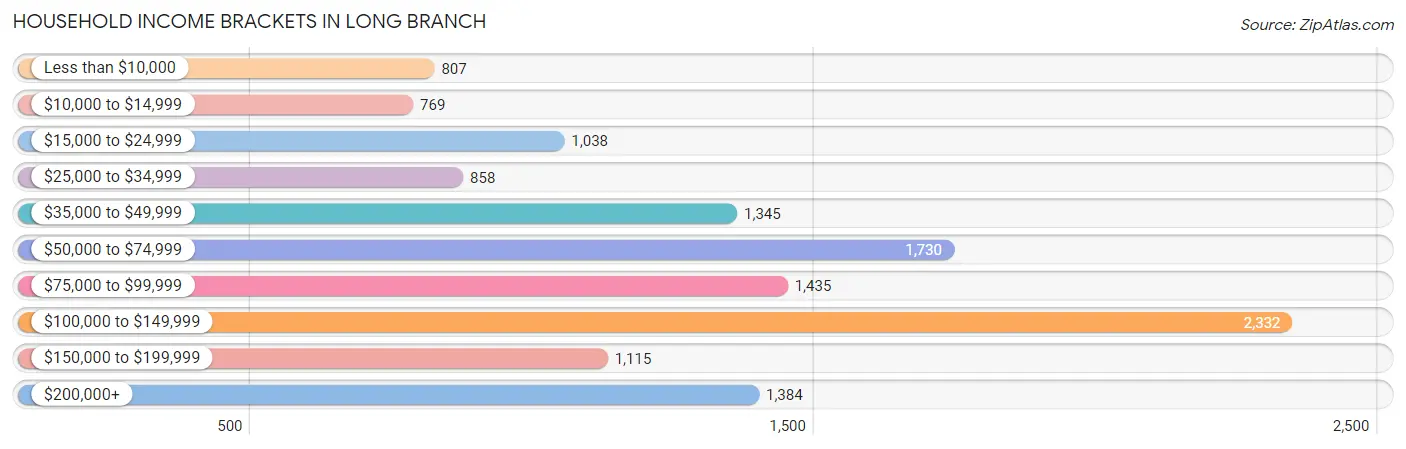
| Income Bracket | # Households | % Households |
| Less than $10,000 | 807 | 6.3% |
| $10,000 to $14,999 | 769 | 6.0% |
| $15,000 to $24,999 | 1,038 | 8.1% |
| $25,000 to $34,999 | 858 | 6.7% |
| $35,000 to $49,999 | 1,345 | 10.5% |
| $50,000 to $74,999 | 1,730 | 13.5% |
| $75,000 to $99,999 | 1,435 | 11.2% |
| $100,000 to $149,999 | 2,332 | 18.2% |
| $150,000 to $199,999 | 1,115 | 8.7% |
| $200,000+ | 1,384 | 10.8% |
Household Income by Householder Age in Long Branch
The median household income in Long Branch is $72,234, with the highest median household income of $91,184 found in the 45 to 64 years age bracket for the primary householder. A total of 4,398 households (34.3%) fall into this category. Meanwhile, the 15 to 24 years age bracket for the primary householder has the lowest median household income of $0, with 749 households (5.9%) in this group.
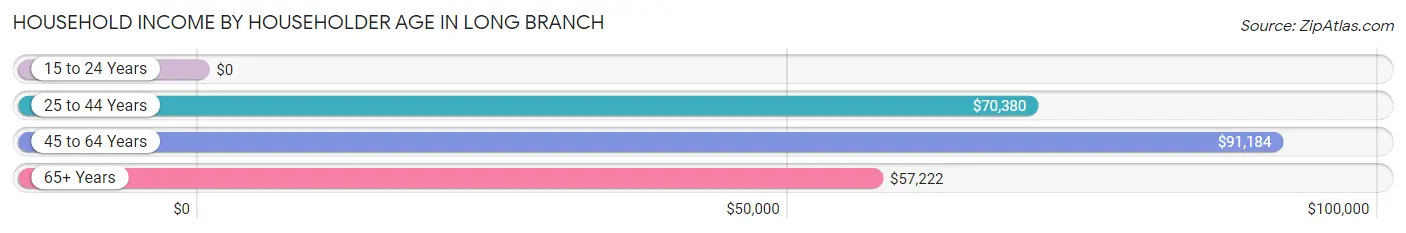
| Income Bracket | # Households | Median Income |
| 15 to 24 Years | 749 (5.9%) | $0 |
| 25 to 44 Years | 4,274 (33.4%) | $70,380 |
| 45 to 64 Years | 4,398 (34.3%) | $91,184 |
| 65+ Years | 3,392 (26.5%) | $57,222 |
| Total | 12,813 (100.0%) | $72,234 |
Poverty in Long Branch
Income Below Poverty by Sex and Age in Long Branch
With 13.8% poverty level for males and 23.6% for females among the residents of Long Branch, 6 to 11 year old males and 5 year old females are the most vulnerable to poverty, with 349 males (37.0%) and 195 females (77.4%) in their respective age groups living below the poverty level.
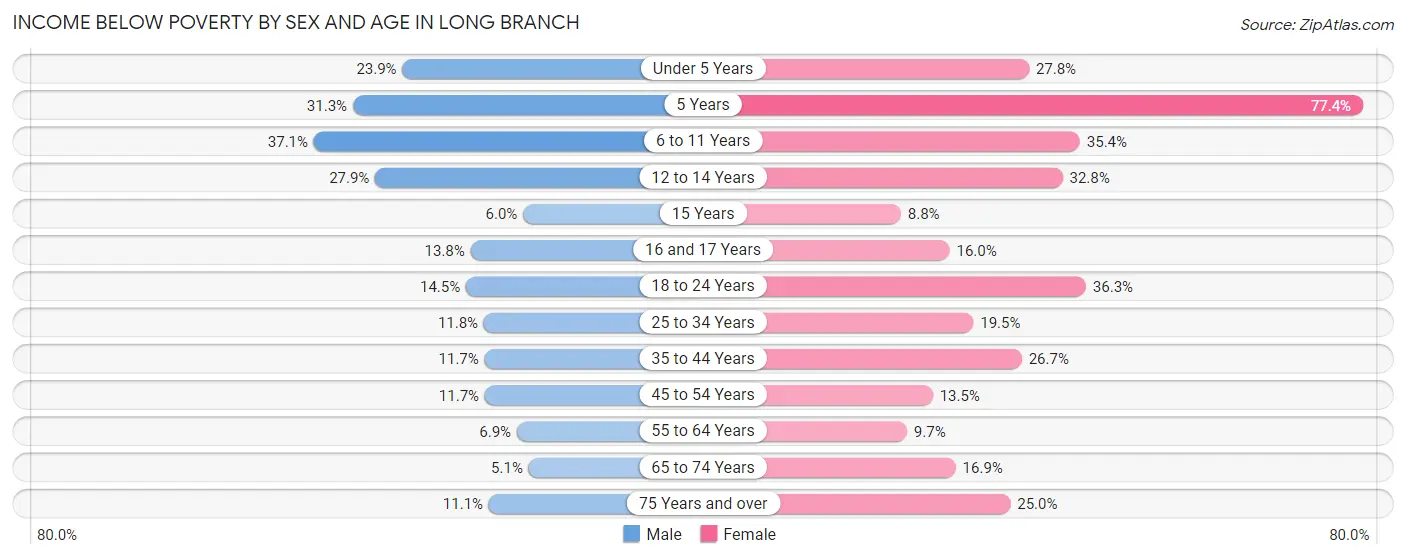
| Age Bracket | Male | Female |
| Under 5 Years | 194 (23.9%) | 336 (27.8%) |
| 5 Years | 25 (31.2%) | 195 (77.4%) |
| 6 to 11 Years | 349 (37.0%) | 409 (35.3%) |
| 12 to 14 Years | 152 (27.9%) | 197 (32.8%) |
| 15 Years | 12 (6.0%) | 10 (8.8%) |
| 16 and 17 Years | 34 (13.8%) | 84 (16.0%) |
| 18 to 24 Years | 288 (14.4%) | 729 (36.2%) |
| 25 to 34 Years | 228 (11.8%) | 463 (19.5%) |
| 35 to 44 Years | 239 (11.7%) | 549 (26.7%) |
| 45 to 54 Years | 198 (11.7%) | 247 (13.5%) |
| 55 to 64 Years | 132 (6.9%) | 181 (9.7%) |
| 65 to 74 Years | 68 (5.1%) | 296 (16.9%) |
| 75 Years and over | 94 (11.1%) | 308 (25.0%) |
| Total | 2,013 (13.8%) | 4,004 (23.6%) |
Income Above Poverty by Sex and Age in Long Branch
According to the poverty statistics in Long Branch, males aged 65 to 74 years and females aged 15 years are the age groups that are most secure financially, with 94.9% of males and 91.2% of females in these age groups living above the poverty line.
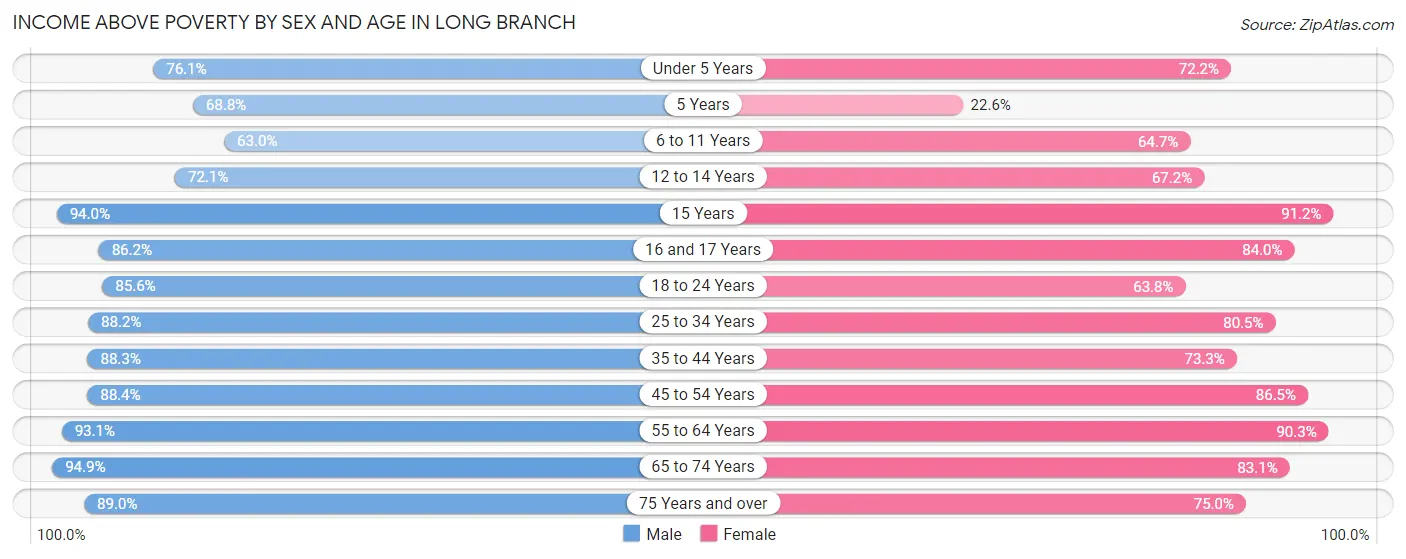
| Age Bracket | Male | Female |
| Under 5 Years | 618 (76.1%) | 873 (72.2%) |
| 5 Years | 55 (68.8%) | 57 (22.6%) |
| 6 to 11 Years | 593 (62.9%) | 748 (64.6%) |
| 12 to 14 Years | 392 (72.1%) | 404 (67.2%) |
| 15 Years | 189 (94.0%) | 104 (91.2%) |
| 16 and 17 Years | 213 (86.2%) | 441 (84.0%) |
| 18 to 24 Years | 1,705 (85.6%) | 1,282 (63.7%) |
| 25 to 34 Years | 1,706 (88.2%) | 1,908 (80.5%) |
| 35 to 44 Years | 1,805 (88.3%) | 1,506 (73.3%) |
| 45 to 54 Years | 1,502 (88.3%) | 1,583 (86.5%) |
| 55 to 64 Years | 1,784 (93.1%) | 1,690 (90.3%) |
| 65 to 74 Years | 1,254 (94.9%) | 1,454 (83.1%) |
| 75 Years and over | 757 (88.9%) | 923 (75.0%) |
| Total | 12,573 (86.2%) | 12,973 (76.4%) |
Income Below Poverty Among Married-Couple Families in Long Branch
The poverty statistics for married-couple families in Long Branch show that 6.9% or 341 of the total 4,927 families live below the poverty line. Families with 3 or 4 children have the highest poverty rate of 43.3%, comprising of 113 families. On the other hand, families with 5 or more children have the lowest poverty rate of 0.0%, which includes 0 families.
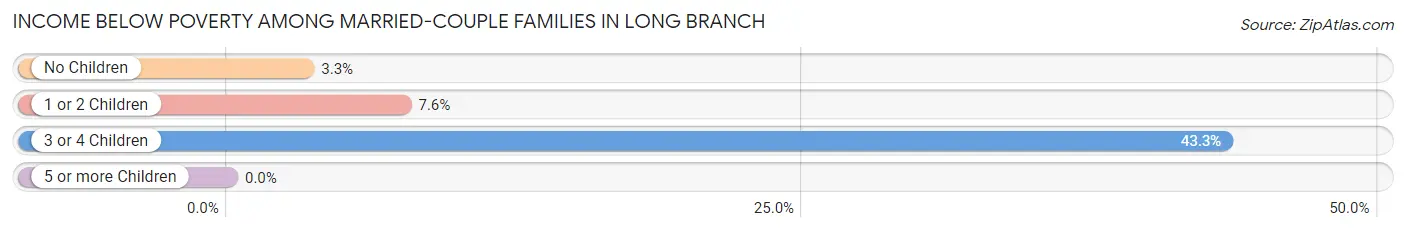
| Children | Above Poverty | Below Poverty |
| No Children | 2,828 (96.7%) | 97 (3.3%) |
| 1 or 2 Children | 1,603 (92.4%) | 131 (7.5%) |
| 3 or 4 Children | 148 (56.7%) | 113 (43.3%) |
| 5 or more Children | 7 (100.0%) | 0 (0.0%) |
| Total | 4,586 (93.1%) | 341 (6.9%) |
Income Below Poverty Among Single-Parent Households in Long Branch
According to the poverty data in Long Branch, 8.8% or 65 single-father households and 32.1% or 760 single-mother households are living below the poverty line. Among single-father households, those with 3 or 4 children have the highest poverty rate, with 25 households (33.8%) experiencing poverty. Likewise, among single-mother households, those with 3 or 4 children have the highest poverty rate, with 165 households (59.6%) falling below the poverty line.
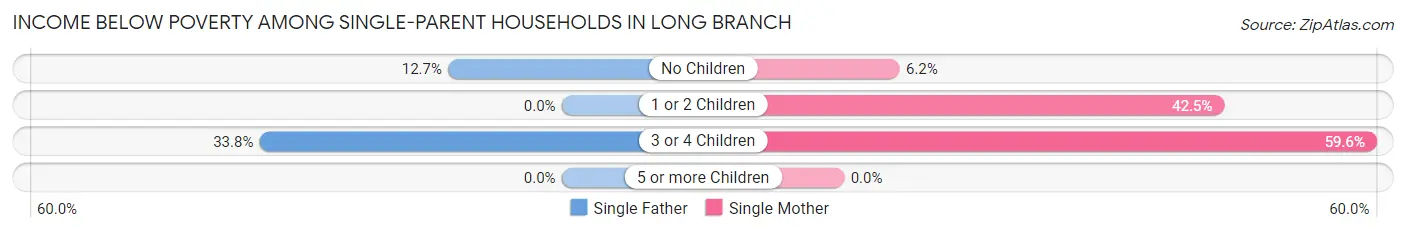
| Children | Single Father | Single Mother |
| No Children | 40 (12.7%) | 50 (6.2%) |
| 1 or 2 Children | 0 (0.0%) | 545 (42.5%) |
| 3 or 4 Children | 25 (33.8%) | 165 (59.6%) |
| 5 or more Children | 0 (0.0%) | 0 (0.0%) |
| Total | 65 (8.8%) | 760 (32.1%) |
Income Below Poverty Among Married-Couple vs Single-Parent Households in Long Branch
The poverty data for Long Branch shows that 341 of the married-couple family households (6.9%) and 825 of the single-parent households (26.6%) are living below the poverty level. Within the married-couple family households, those with 3 or 4 children have the highest poverty rate, with 113 households (43.3%) falling below the poverty line. Among the single-parent households, those with 3 or 4 children have the highest poverty rate, with 190 household (54.1%) living below poverty.
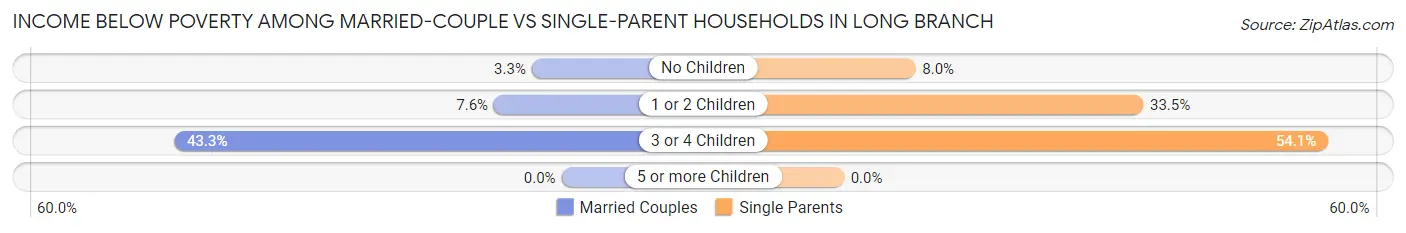
| Children | Married-Couple Families | Single-Parent Households |
| No Children | 97 (3.3%) | 90 (8.0%) |
| 1 or 2 Children | 131 (7.5%) | 545 (33.5%) |
| 3 or 4 Children | 113 (43.3%) | 190 (54.1%) |
| 5 or more Children | 0 (0.0%) | 0 (0.0%) |
| Total | 341 (6.9%) | 825 (26.6%) |
Race in Long Branch
The most populous races in Long Branch are White / Caucasian (20,582 | 64.5%), Hispanic or Latino (6,866 | 21.5%), and Black / African American (4,369 | 13.7%).
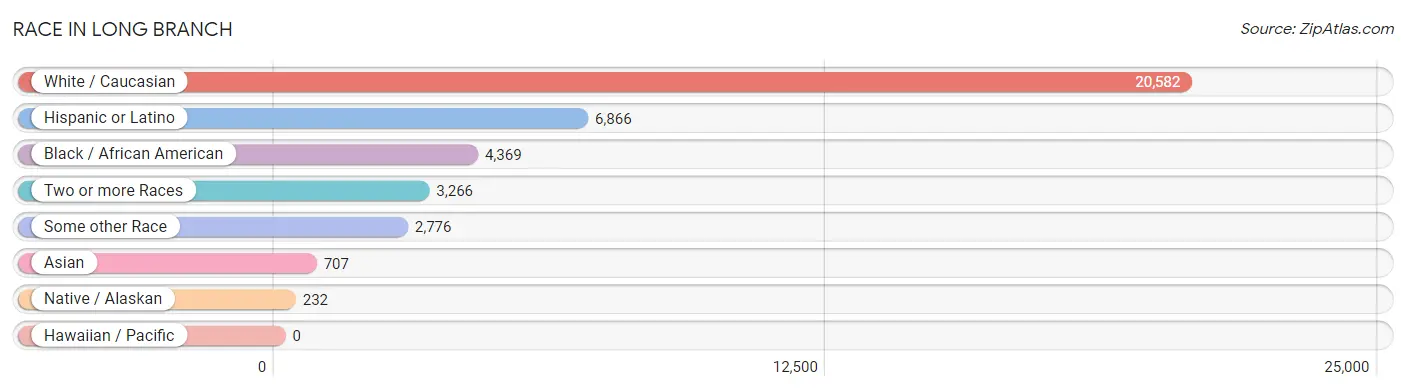
| Race | # Population | % Population |
| Asian | 707 | 2.2% |
| Black / African American | 4,369 | 13.7% |
| Hawaiian / Pacific | 0 | 0.0% |
| Hispanic or Latino | 6,866 | 21.5% |
| Native / Alaskan | 232 | 0.7% |
| White / Caucasian | 20,582 | 64.5% |
| Two or more Races | 3,266 | 10.2% |
| Some other Race | 2,776 | 8.7% |
| Total | 31,932 | 100.0% |
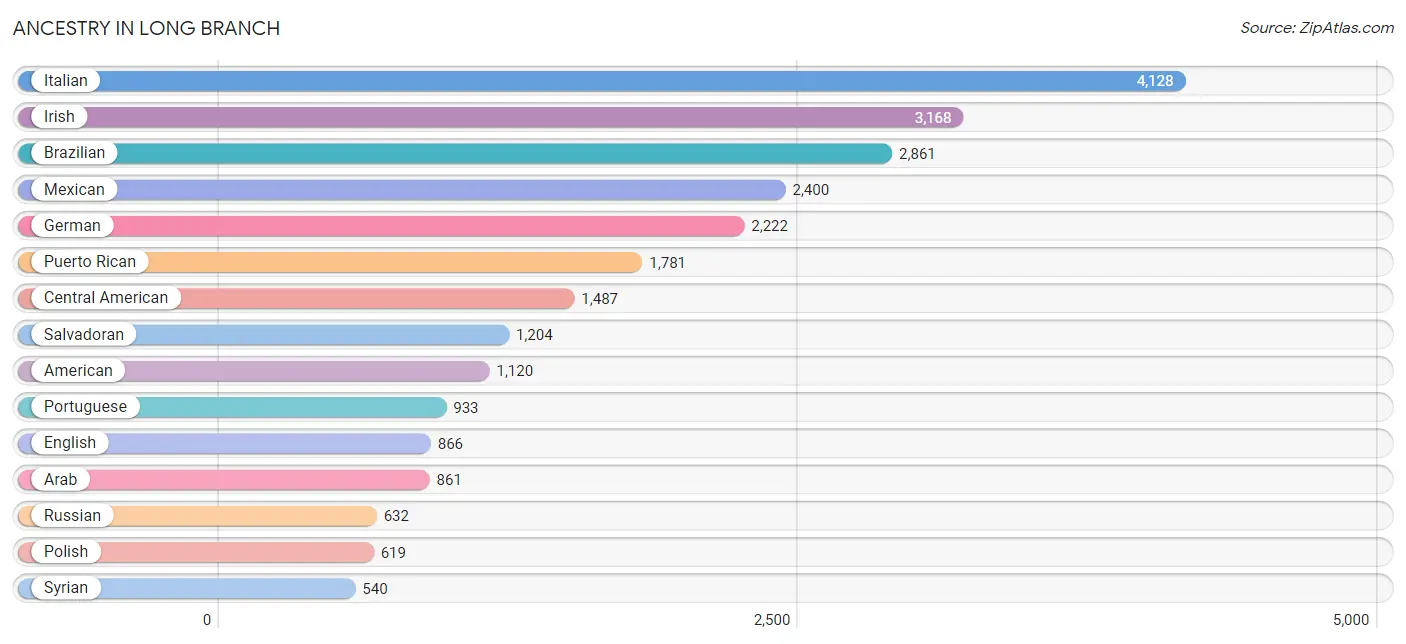
Ancestry in Long Branch
The most populous ancestries reported in Long Branch are Italian (4,128 | 12.9%), Irish (3,168 | 9.9%), Brazilian (2,861 | 9.0%), Mexican (2,400 | 7.5%), and German (2,222 | 7.0%), together accounting for 46.3% of all Long Branch residents.
| Ancestry | # Population | % Population |
| African | 79 | 0.3% |
| American | 1,120 | 3.5% |
| Arab | 861 | 2.7% |
| Argentinean | 47 | 0.2% |
| Armenian | 33 | 0.1% |
| Austrian | 104 | 0.3% |
| Belgian | 24 | 0.1% |
| Belizean | 17 | 0.1% |
| Bhutanese | 19 | 0.1% |
| Blackfeet | 46 | 0.1% |
| Bolivian | 35 | 0.1% |
| Brazilian | 2,861 | 9.0% |
| British | 77 | 0.2% |
| British West Indian | 5 | 0.0% |
| Bulgarian | 15 | 0.1% |
| Burmese | 214 | 0.7% |
| Canadian | 11 | 0.0% |
| Central American | 1,487 | 4.7% |
| Central American Indian | 22 | 0.1% |
| Cherokee | 59 | 0.2% |
| Chilean | 47 | 0.2% |
| Colombian | 60 | 0.2% |
| Costa Rican | 40 | 0.1% |
| Croatian | 1 | 0.0% |
| Cuban | 213 | 0.7% |
| Czech | 69 | 0.2% |
| Czechoslovakian | 22 | 0.1% |
| Danish | 51 | 0.2% |
| Dominican | 236 | 0.7% |
| Dutch | 146 | 0.5% |
| Eastern European | 211 | 0.7% |
| Ecuadorian | 85 | 0.3% |
| Egyptian | 47 | 0.2% |
| English | 866 | 2.7% |
| European | 248 | 0.8% |
| Finnish | 26 | 0.1% |
| French | 302 | 0.9% |
| French Canadian | 58 | 0.2% |
| German | 2,222 | 7.0% |
| Ghanaian | 9 | 0.0% |
| Greek | 152 | 0.5% |
| Guatemalan | 210 | 0.7% |
| Haitian | 163 | 0.5% |
| Honduran | 15 | 0.1% |
| Hungarian | 153 | 0.5% |
| Indian (Asian) | 134 | 0.4% |
| Irish | 3,168 | 9.9% |
| Israeli | 114 | 0.4% |
| Italian | 4,128 | 12.9% |
| Jamaican | 201 | 0.6% |
| Jordanian | 82 | 0.3% |
| Korean | 102 | 0.3% |
| Lebanese | 43 | 0.1% |
| Lithuanian | 107 | 0.3% |
| Mexican | 2,400 | 7.5% |
| Mexican American Indian | 227 | 0.7% |
| Navajo | 3 | 0.0% |
| Nicaraguan | 10 | 0.0% |
| Nigerian | 15 | 0.1% |
| Norwegian | 30 | 0.1% |
| Pakistani | 21 | 0.1% |
| Panamanian | 8 | 0.0% |
| Polish | 619 | 1.9% |
| Portuguese | 933 | 2.9% |
| Puerto Rican | 1,781 | 5.6% |
| Romanian | 240 | 0.7% |
| Russian | 632 | 2.0% |
| Salvadoran | 1,204 | 3.8% |
| Scandinavian | 18 | 0.1% |
| Scotch-Irish | 96 | 0.3% |
| Scottish | 256 | 0.8% |
| Serbian | 9 | 0.0% |
| Shoshone | 6 | 0.0% |
| Slavic | 28 | 0.1% |
| Slovak | 26 | 0.1% |
| South American | 400 | 1.3% |
| Spaniard | 237 | 0.7% |
| Spanish | 68 | 0.2% |
| Subsaharan African | 103 | 0.3% |
| Swedish | 103 | 0.3% |
| Swiss | 54 | 0.2% |
| Syrian | 540 | 1.7% |
| Thai | 258 | 0.8% |
| Turkish | 38 | 0.1% |
| Ukrainian | 60 | 0.2% |
| Venezuelan | 126 | 0.4% |
| Welsh | 43 | 0.1% |
| West Indian | 28 | 0.1% | View All 88 Rows |
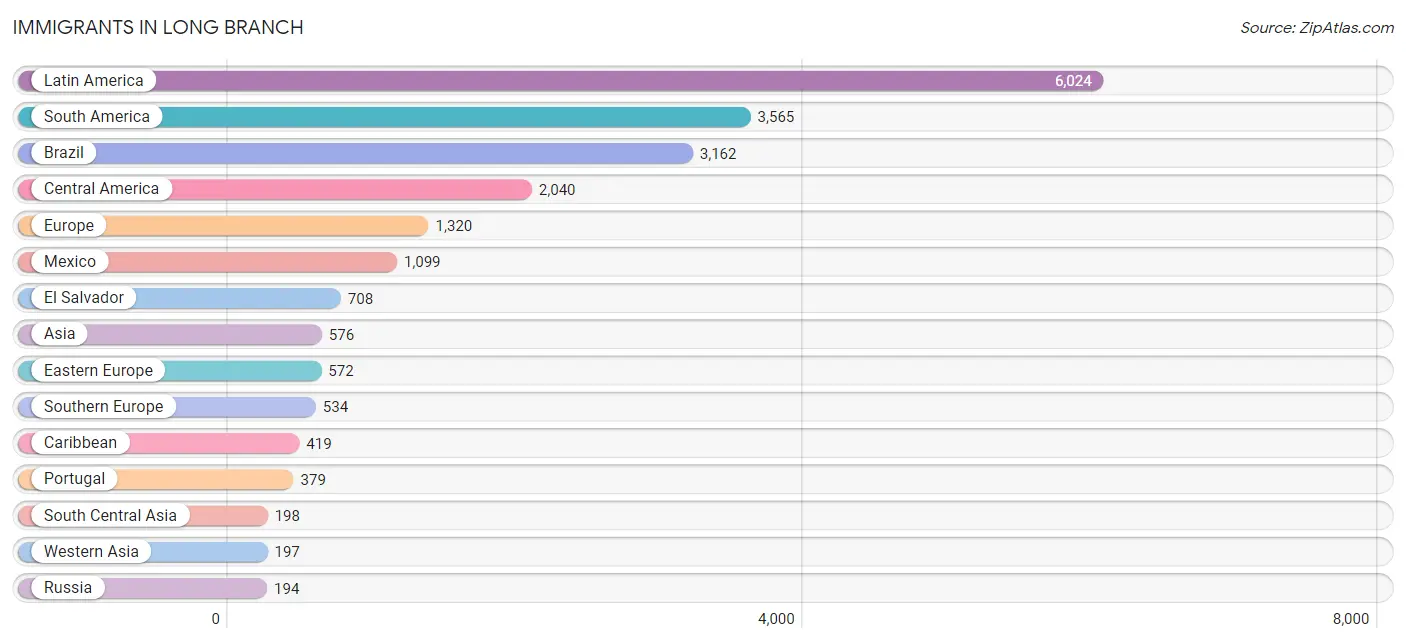
Immigrants in Long Branch
The most numerous immigrant groups reported in Long Branch came from Latin America (6,024 | 18.9%), South America (3,565 | 11.2%), Brazil (3,162 | 9.9%), Central America (2,040 | 6.4%), and Europe (1,320 | 4.1%), together accounting for 50.4% of all Long Branch residents.
| Immigration Origin | # Population | % Population |
| Africa | 164 | 0.5% |
| Asia | 576 | 1.8% |
| Austria | 19 | 0.1% |
| Belgium | 10 | 0.0% |
| Belize | 13 | 0.0% |
| Bolivia | 22 | 0.1% |
| Brazil | 3,162 | 9.9% |
| Bulgaria | 53 | 0.2% |
| Canada | 74 | 0.2% |
| Caribbean | 419 | 1.3% |
| Central America | 2,040 | 6.4% |
| Chile | 47 | 0.2% |
| China | 83 | 0.3% |
| Colombia | 2 | 0.0% |
| Costa Rica | 32 | 0.1% |
| Croatia | 1 | 0.0% |
| Cuba | 103 | 0.3% |
| Czechoslovakia | 28 | 0.1% |
| Dominican Republic | 23 | 0.1% |
| Eastern Asia | 102 | 0.3% |
| Eastern Europe | 572 | 1.8% |
| Ecuador | 54 | 0.2% |
| Egypt | 46 | 0.1% |
| El Salvador | 708 | 2.2% |
| England | 10 | 0.0% |
| Europe | 1,320 | 4.1% |
| France | 90 | 0.3% |
| Ghana | 9 | 0.0% |
| Greece | 23 | 0.1% |
| Guatemala | 175 | 0.5% |
| Guyana | 113 | 0.4% |
| Haiti | 87 | 0.3% |
| Honduras | 13 | 0.0% |
| India | 154 | 0.5% |
| Israel | 46 | 0.1% |
| Italy | 91 | 0.3% |
| Jamaica | 63 | 0.2% |
| Jordan | 29 | 0.1% |
| Kazakhstan | 22 | 0.1% |
| Korea | 19 | 0.1% |
| Latin America | 6,024 | 18.9% |
| Latvia | 53 | 0.2% |
| Mexico | 1,099 | 3.4% |
| Middle Africa | 20 | 0.1% |
| Morocco | 19 | 0.1% |
| Nigeria | 70 | 0.2% |
| Northern Africa | 65 | 0.2% |
| Northern Europe | 95 | 0.3% |
| Norway | 11 | 0.0% |
| Philippines | 63 | 0.2% |
| Poland | 28 | 0.1% |
| Portugal | 379 | 1.2% |
| Romania | 158 | 0.5% |
| Russia | 194 | 0.6% |
| Saudi Arabia | 29 | 0.1% |
| Scotland | 12 | 0.0% |
| South America | 3,565 | 11.2% |
| South Central Asia | 198 | 0.6% |
| South Eastern Asia | 79 | 0.3% |
| Southern Europe | 534 | 1.7% |
| Spain | 41 | 0.1% |
| Sri Lanka | 22 | 0.1% |
| Sweden | 10 | 0.0% |
| Thailand | 16 | 0.1% |
| Trinidad and Tobago | 143 | 0.4% |
| Turkey | 52 | 0.2% |
| Ukraine | 57 | 0.2% |
| Venezuela | 139 | 0.4% |
| Western Africa | 79 | 0.3% |
| Western Asia | 197 | 0.6% |
| Western Europe | 119 | 0.4% | View All 71 Rows |
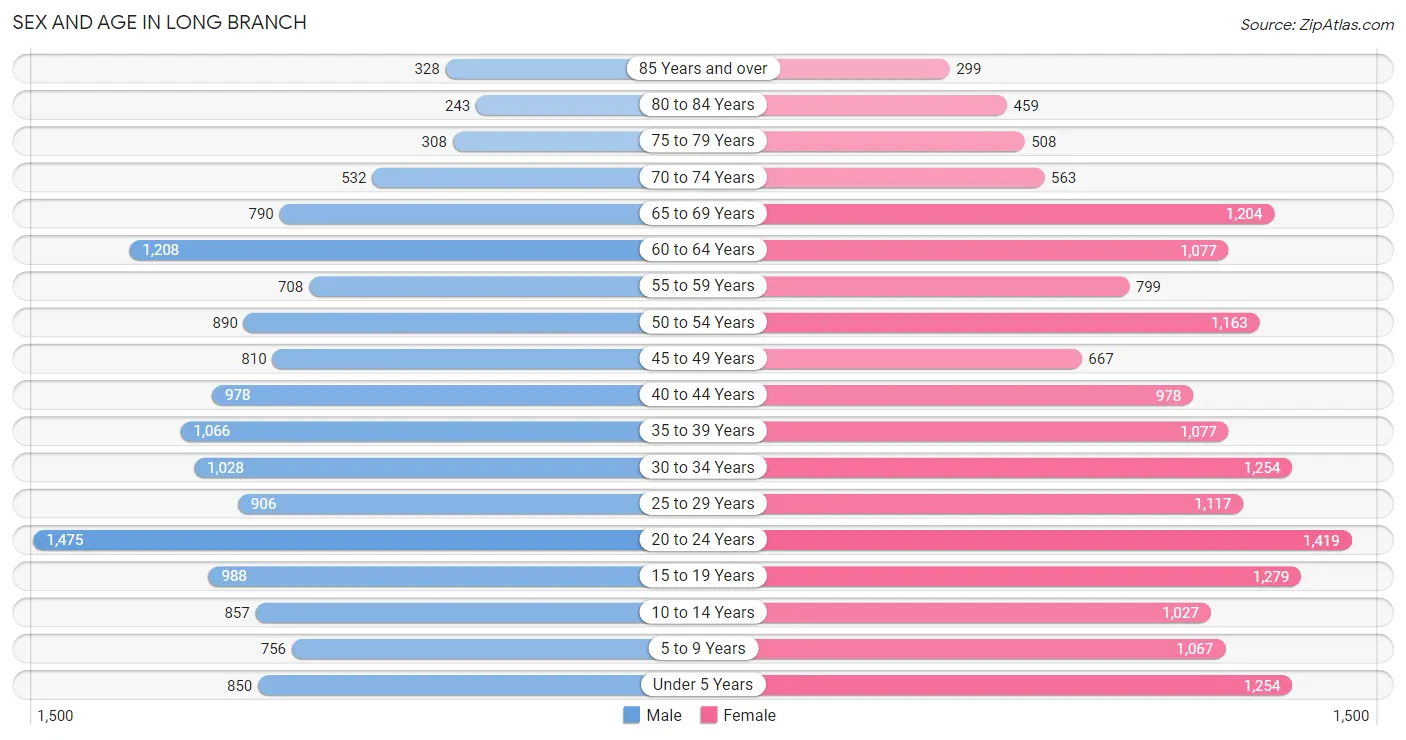
Sex and Age in Long Branch
Sex and Age in Long Branch
The most populous age groups in Long Branch are 20 to 24 Years (1,475 | 10.0%) for men and 20 to 24 Years (1,419 | 8.2%) for women.
| Age Bracket | Male | Female |
| Under 5 Years | 850 (5.8%) | 1,254 (7.3%) |
| 5 to 9 Years | 756 (5.1%) | 1,067 (6.2%) |
| 10 to 14 Years | 857 (5.8%) | 1,027 (6.0%) |
| 15 to 19 Years | 988 (6.7%) | 1,279 (7.4%) |
| 20 to 24 Years | 1,475 (10.0%) | 1,419 (8.2%) |
| 25 to 29 Years | 906 (6.1%) | 1,117 (6.5%) |
| 30 to 34 Years | 1,028 (7.0%) | 1,254 (7.3%) |
| 35 to 39 Years | 1,066 (7.2%) | 1,077 (6.3%) |
| 40 to 44 Years | 978 (6.6%) | 978 (5.7%) |
| 45 to 49 Years | 810 (5.5%) | 667 (3.9%) |
| 50 to 54 Years | 890 (6.0%) | 1,163 (6.8%) |
| 55 to 59 Years | 708 (4.8%) | 799 (4.6%) |
| 60 to 64 Years | 1,208 (8.2%) | 1,077 (6.3%) |
| 65 to 69 Years | 790 (5.4%) | 1,204 (7.0%) |
| 70 to 74 Years | 532 (3.6%) | 563 (3.3%) |
| 75 to 79 Years | 308 (2.1%) | 508 (2.9%) |
| 80 to 84 Years | 243 (1.7%) | 459 (2.7%) |
| 85 Years and over | 328 (2.2%) | 299 (1.7%) |
| Total | 14,721 (100.0%) | 17,211 (100.0%) |
Families and Households in Long Branch
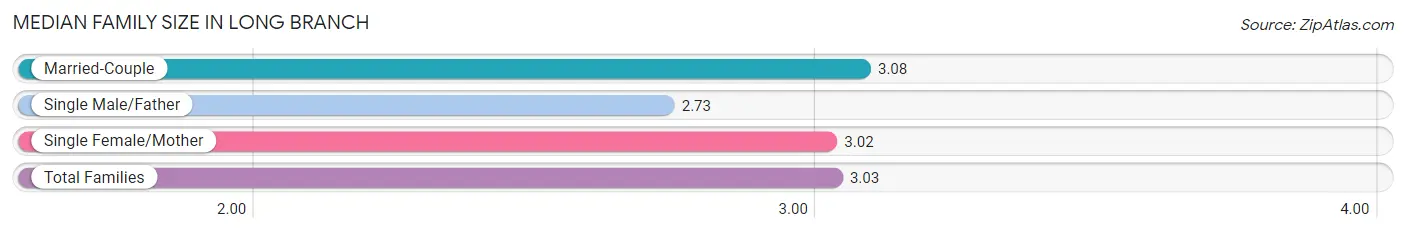
Median Family Size in Long Branch
The median family size in Long Branch is 3.03 persons per family, with married-couple families (4,927 | 61.4%) accounting for the largest median family size of 3.08 persons per family. On the other hand, single male/father families (737 | 9.2%) represent the smallest median family size with 2.73 persons per family.
| Family Type | # Families | Family Size |
| Married-Couple | 4,927 (61.4%) | 3.08 |
| Single Male/Father | 737 (9.2%) | 2.73 |
| Single Female/Mother | 2,366 (29.5%) | 3.02 |
| Total Families | 8,030 (100.0%) | 3.03 |
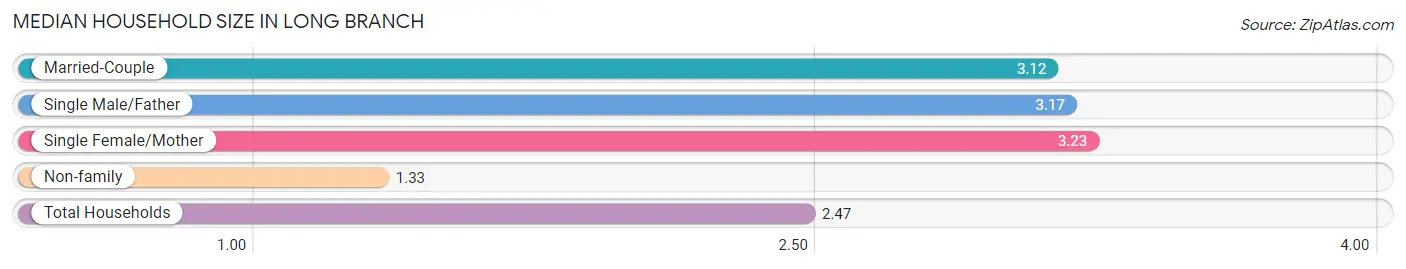
Median Household Size in Long Branch
The median household size in Long Branch is 2.47 persons per household, with single female/mother households (2,366 | 18.5%) accounting for the largest median household size of 3.23 persons per household. non-family households (4,783 | 37.3%) represent the smallest median household size with 1.33 persons per household.
| Household Type | # Households | Household Size |
| Married-Couple | 4,927 (38.5%) | 3.12 |
| Single Male/Father | 737 (5.8%) | 3.17 |
| Single Female/Mother | 2,366 (18.5%) | 3.23 |
| Non-family | 4,783 (37.3%) | 1.33 |
| Total Households | 12,813 (100.0%) | 2.47 |
Household Size by Marriage Status in Long Branch
Out of a total of 12,813 households in Long Branch, 8,030 (62.7%) are family households, while 4,783 (37.3%) are nonfamily households. The most numerous type of family households are 2-person households, comprising 3,334, and the most common type of nonfamily households are 1-person households, comprising 3,719.
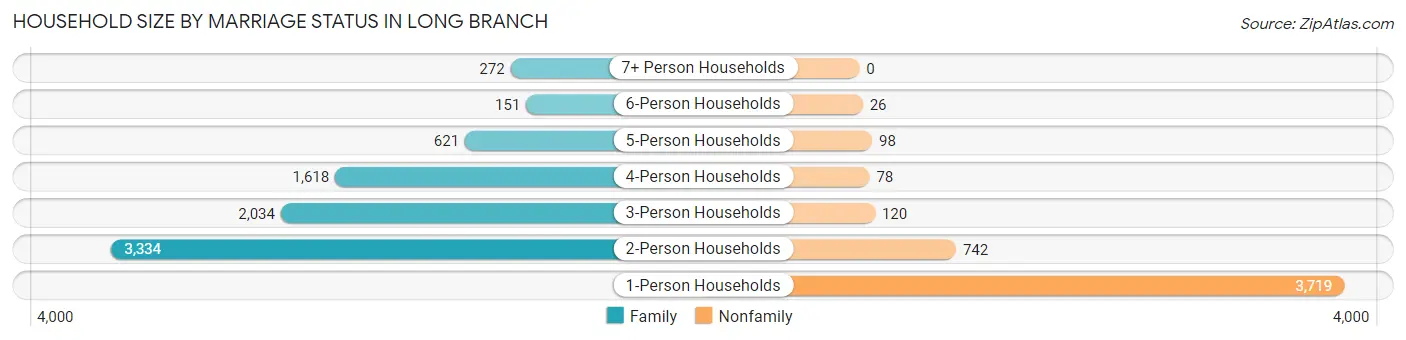
| Household Size | Family Households | Nonfamily Households |
| 1-Person Households | - | 3,719 (29.0%) |
| 2-Person Households | 3,334 (26.0%) | 742 (5.8%) |
| 3-Person Households | 2,034 (15.9%) | 120 (0.9%) |
| 4-Person Households | 1,618 (12.6%) | 78 (0.6%) |
| 5-Person Households | 621 (4.9%) | 98 (0.8%) |
| 6-Person Households | 151 (1.2%) | 26 (0.2%) |
| 7+ Person Households | 272 (2.1%) | 0 (0.0%) |
| Total | 8,030 (62.7%) | 4,783 (37.3%) |
Female Fertility in Long Branch
Fertility by Age in Long Branch
Average fertility rate in Long Branch is 51.0 births per 1,000 women. Women in the age bracket of 20 to 34 years have the highest fertility rate with 70.0 births per 1,000 women. Women in the age bracket of 20 to 34 years acount for 66.1% of all women with births.
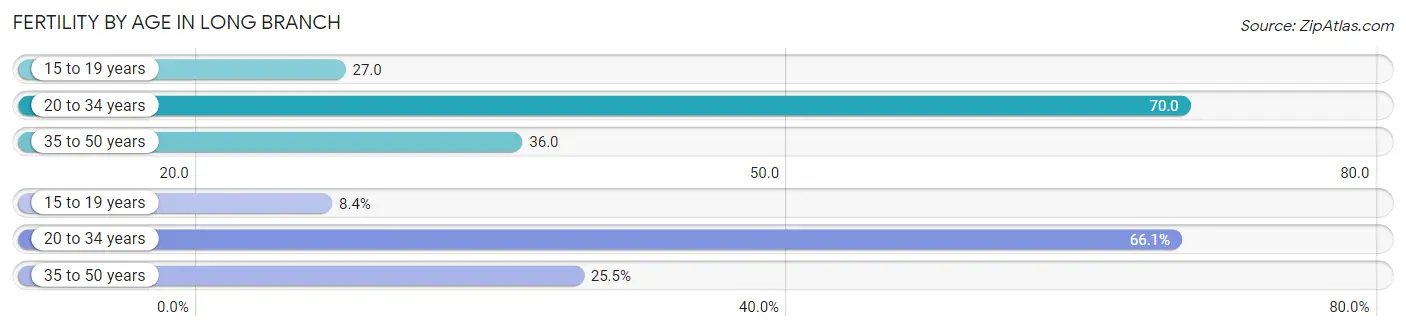
| Age Bracket | Women with Births | Births / 1,000 Women |
| 15 to 19 years | 34 (8.4%) | 27.0 |
| 20 to 34 years | 267 (66.1%) | 70.0 |
| 35 to 50 years | 103 (25.5%) | 36.0 |
| Total | 404 (100.0%) | 51.0 |
Fertility by Age by Marriage Status in Long Branch
59.9% of women with births (404) in Long Branch are married. The highest percentage of unmarried women with births falls into 35 to 50 years age bracket with 57.3% of them unmarried at the time of birth, while the lowest percentage of unmarried women with births belong to 15 to 19 years age bracket with 0.0% of them unmarried.
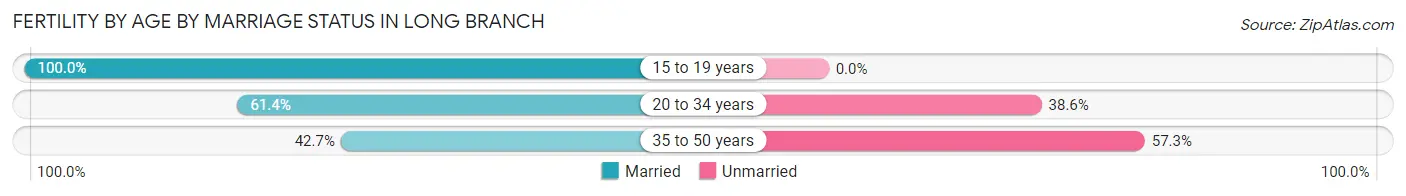
| Age Bracket | Married | Unmarried |
| 15 to 19 years | 34 (100.0%) | 0 (0.0%) |
| 20 to 34 years | 164 (61.4%) | 103 (38.6%) |
| 35 to 50 years | 44 (42.7%) | 59 (57.3%) |
| Total | 242 (59.9%) | 162 (40.1%) |
Fertility by Education in Long Branch
Average fertility rate in Long Branch is 51.0 births per 1,000 women. Women with the education attainment of graduate degree have the highest fertility rate of 102.0 births per 1,000 women, while women with the education attainment of bachelor's degree have the lowest fertility at 8.0 births per 1,000 women. Women with the education attainment of less than high school represent 43.6% of all women with births.
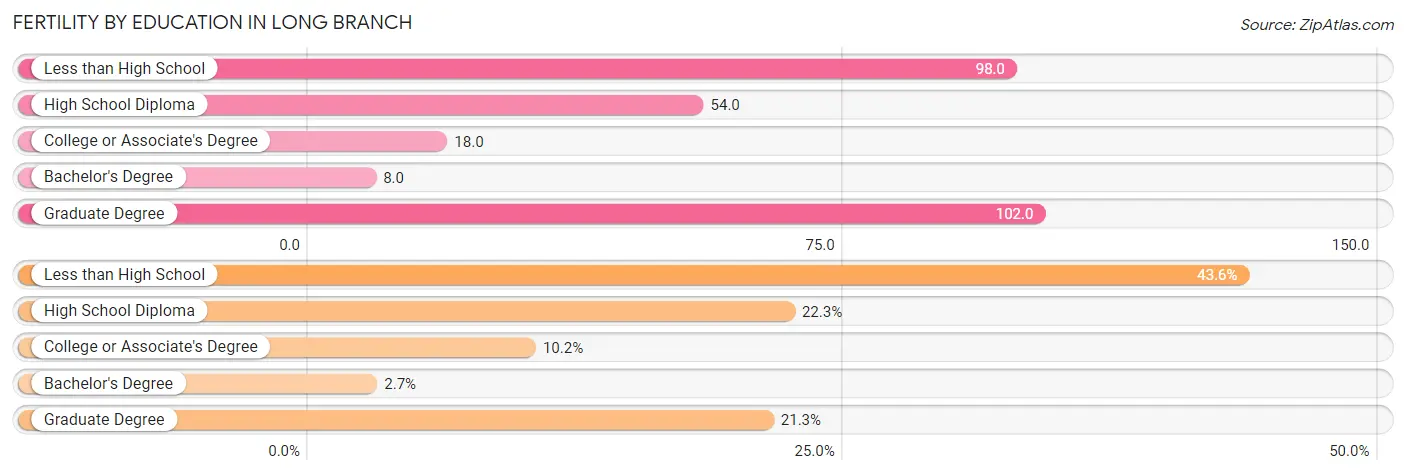
| Educational Attainment | Women with Births | Births / 1,000 Women |
| Less than High School | 176 (43.6%) | 98.0 |
| High School Diploma | 90 (22.3%) | 54.0 |
| College or Associate's Degree | 41 (10.2%) | 18.0 |
| Bachelor's Degree | 11 (2.7%) | 8.0 |
| Graduate Degree | 86 (21.3%) | 102.0 |
| Total | 404 (100.0%) | 51.0 |
Fertility by Education by Marriage Status in Long Branch
40.1% of women with births in Long Branch are unmarried. Women with the educational attainment of bachelor's degree are most likely to be married with 100.0% of them married at childbirth, while women with the educational attainment of high school diploma are least likely to be married with 52.2% of them unmarried at childbirth.
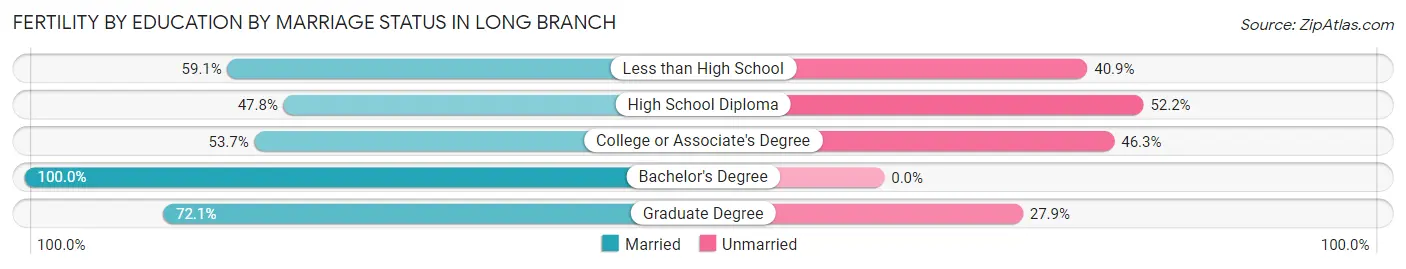
| Educational Attainment | Married | Unmarried |
| Less than High School | 104 (59.1%) | 72 (40.9%) |
| High School Diploma | 43 (47.8%) | 47 (52.2%) |
| College or Associate's Degree | 22 (53.7%) | 19 (46.3%) |
| Bachelor's Degree | 11 (100.0%) | 0 (0.0%) |
| Graduate Degree | 62 (72.1%) | 24 (27.9%) |
| Total | 242 (59.9%) | 162 (40.1%) |
Employment Characteristics in Long Branch
Employment by Class of Employer in Long Branch
Among the 15,351 employed individuals in Long Branch, private company employees (10,653 | 69.4%), not-for-profit organizations (1,287 | 8.4%), and local government employees (1,168 | 7.6%) make up the most common classes of employment.
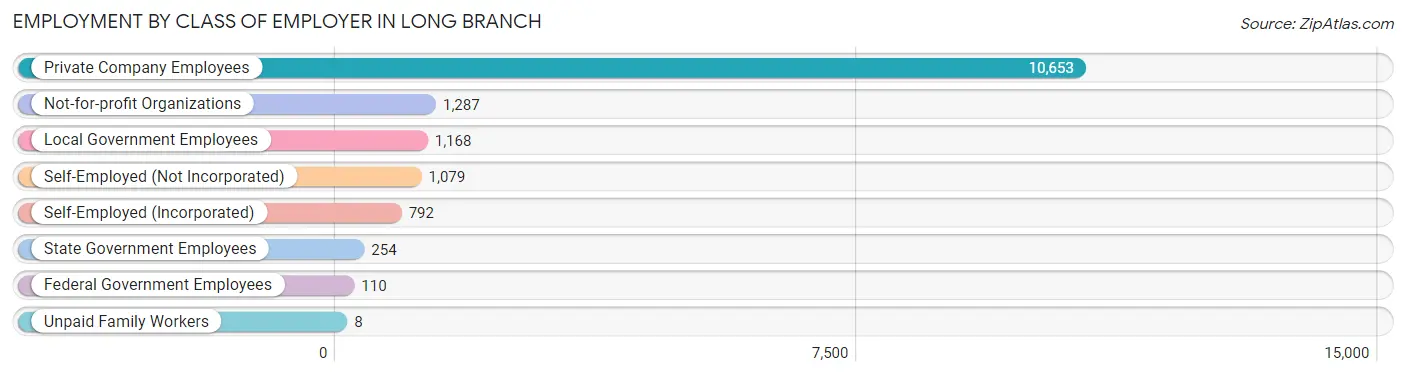
| Employer Class | # Employees | % Employees |
| Private Company Employees | 10,653 | 69.4% |
| Self-Employed (Incorporated) | 792 | 5.2% |
| Self-Employed (Not Incorporated) | 1,079 | 7.0% |
| Not-for-profit Organizations | 1,287 | 8.4% |
| Local Government Employees | 1,168 | 7.6% |
| State Government Employees | 254 | 1.7% |
| Federal Government Employees | 110 | 0.7% |
| Unpaid Family Workers | 8 | 0.1% |
| Total | 15,351 | 100.0% |
Employment Status by Age in Long Branch
According to the labor force statistics for Long Branch, out of the total population over 16 years of age (25,806), 65.3% or 16,851 individuals are in the labor force, with 7.1% or 1,196 of them unemployed. The age group with the highest labor force participation rate is 25 to 29 years, with 88.4% or 1,788 individuals in the labor force. Within the labor force, the 16 to 19 years age range has the highest percentage of unemployed individuals, with 18.0% or 132 of them being unemployed.
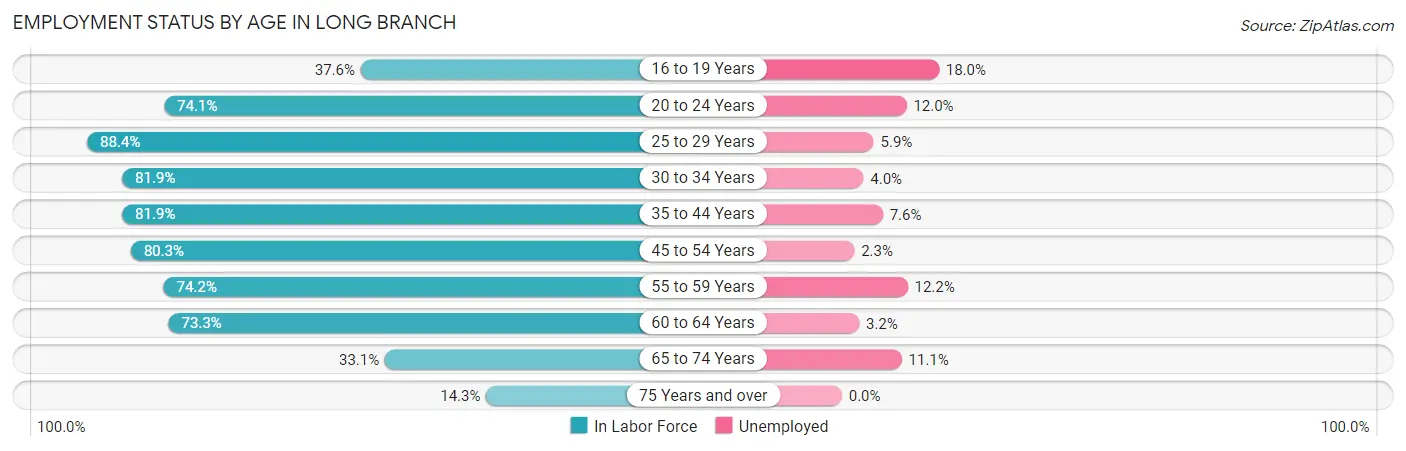
| Age Bracket | In Labor Force | Unemployed |
| 16 to 19 Years | 734 (37.6%) | 132 (18.0%) |
| 20 to 24 Years | 2,144 (74.1%) | 257 (12.0%) |
| 25 to 29 Years | 1,788 (88.4%) | 105 (5.9%) |
| 30 to 34 Years | 1,869 (81.9%) | 75 (4.0%) |
| 35 to 44 Years | 3,357 (81.9%) | 255 (7.6%) |
| 45 to 54 Years | 2,835 (80.3%) | 65 (2.3%) |
| 55 to 59 Years | 1,118 (74.2%) | 136 (12.2%) |
| 60 to 64 Years | 1,675 (73.3%) | 54 (3.2%) |
| 65 to 74 Years | 1,022 (33.1%) | 113 (11.1%) |
| 75 Years and over | 307 (14.3%) | 0 (0.0%) |
| Total | 16,851 (65.3%) | 1,196 (7.1%) |
Employment Status by Educational Attainment in Long Branch
According to labor force statistics for Long Branch, 80.4% of individuals (12,644) out of the total population between 25 and 64 years of age (15,726) are in the labor force, with 5.4% or 683 of them being unemployed. The group with the highest labor force participation rate are those with the educational attainment of college / associate degree, with 89.6% or 2,959 individuals in the labor force. Within the labor force, individuals with college / associate degree education have the highest percentage of unemployment, with 8.3% or 246 of them being unemployed.
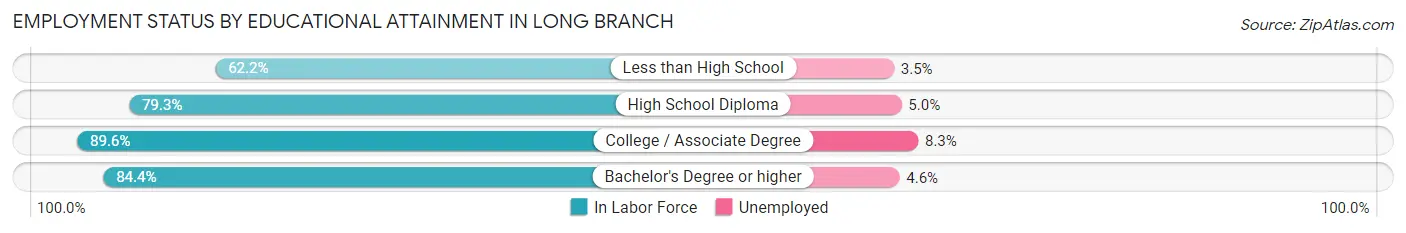
| Educational Attainment | In Labor Force | Unemployed |
| Less than High School | 1,584 (62.2%) | 89 (3.5%) |
| High School Diploma | 3,653 (79.3%) | 230 (5.0%) |
| College / Associate Degree | 2,959 (89.6%) | 274 (8.3%) |
| Bachelor's Degree or higher | 4,449 (84.4%) | 242 (4.6%) |
| Total | 12,644 (80.4%) | 849 (5.4%) |
Employment Occupations by Sex in Long Branch
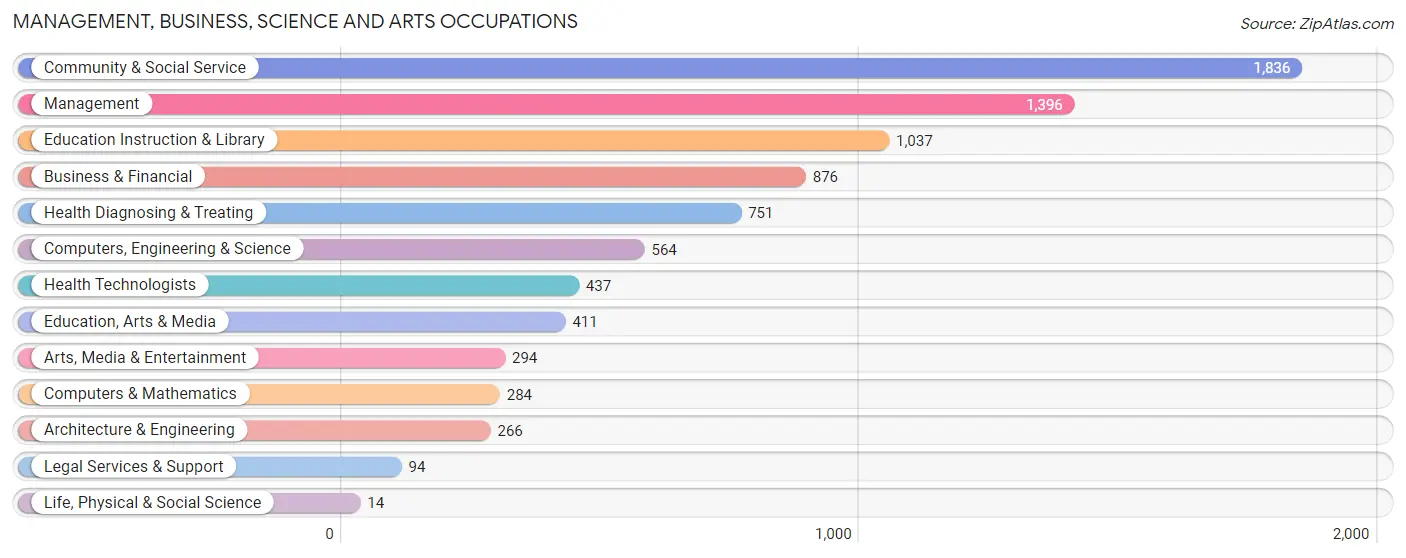
Management, Business, Science and Arts Occupations
The most common Management, Business, Science and Arts occupations in Long Branch are Community & Social Service (1,836 | 11.7%), Management (1,396 | 8.9%), Education Instruction & Library (1,037 | 6.6%), Business & Financial (876 | 5.6%), and Health Diagnosing & Treating (751 | 4.8%).
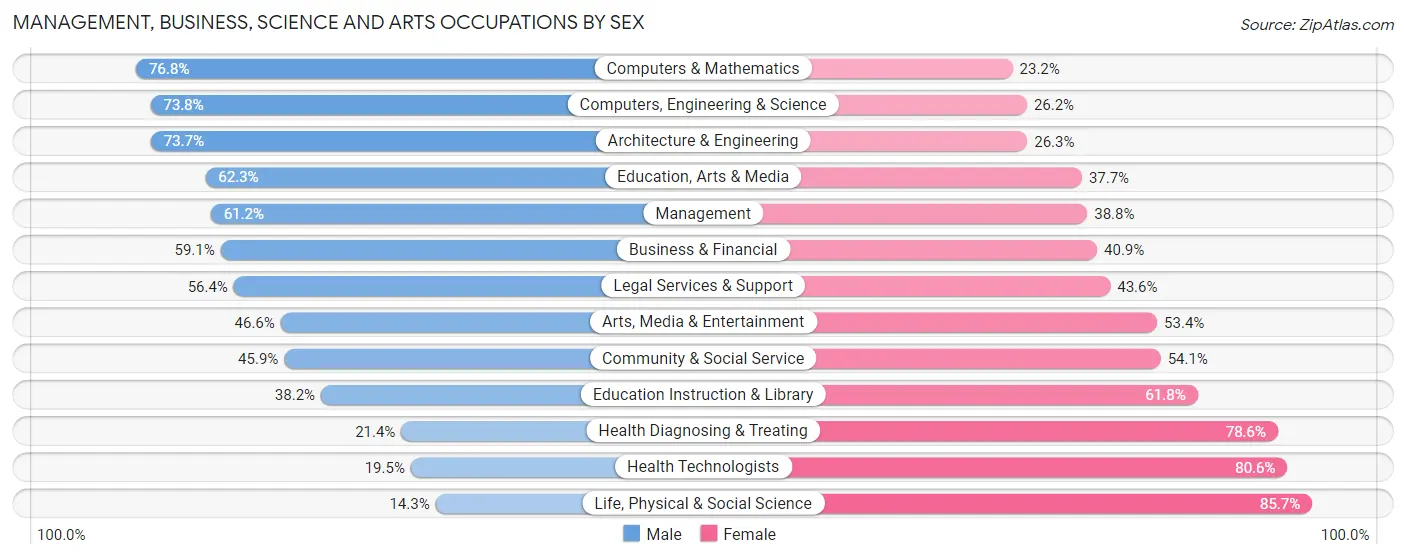
Management, Business, Science and Arts Occupations by Sex
Within the Management, Business, Science and Arts occupations in Long Branch, the most male-oriented occupations are Computers & Mathematics (76.8%), Computers, Engineering & Science (73.8%), and Architecture & Engineering (73.7%), while the most female-oriented occupations are Life, Physical & Social Science (85.7%), Health Technologists (80.5%), and Health Diagnosing & Treating (78.6%).
| Occupation | Male | Female |
| Management | 854 (61.2%) | 542 (38.8%) |
| Business & Financial | 518 (59.1%) | 358 (40.9%) |
| Computers, Engineering & Science | 416 (73.8%) | 148 (26.2%) |
| Computers & Mathematics | 218 (76.8%) | 66 (23.2%) |
| Architecture & Engineering | 196 (73.7%) | 70 (26.3%) |
| Life, Physical & Social Science | 2 (14.3%) | 12 (85.7%) |
| Community & Social Service | 842 (45.9%) | 994 (54.1%) |
| Education, Arts & Media | 256 (62.3%) | 155 (37.7%) |
| Legal Services & Support | 53 (56.4%) | 41 (43.6%) |
| Education Instruction & Library | 396 (38.2%) | 641 (61.8%) |
| Arts, Media & Entertainment | 137 (46.6%) | 157 (53.4%) |
| Health Diagnosing & Treating | 161 (21.4%) | 590 (78.6%) |
| Health Technologists | 85 (19.5%) | 352 (80.5%) |
| Total (Category) | 2,791 (51.5%) | 2,632 (48.5%) |
| Total (Overall) | 8,456 (54.0%) | 7,205 (46.0%) |
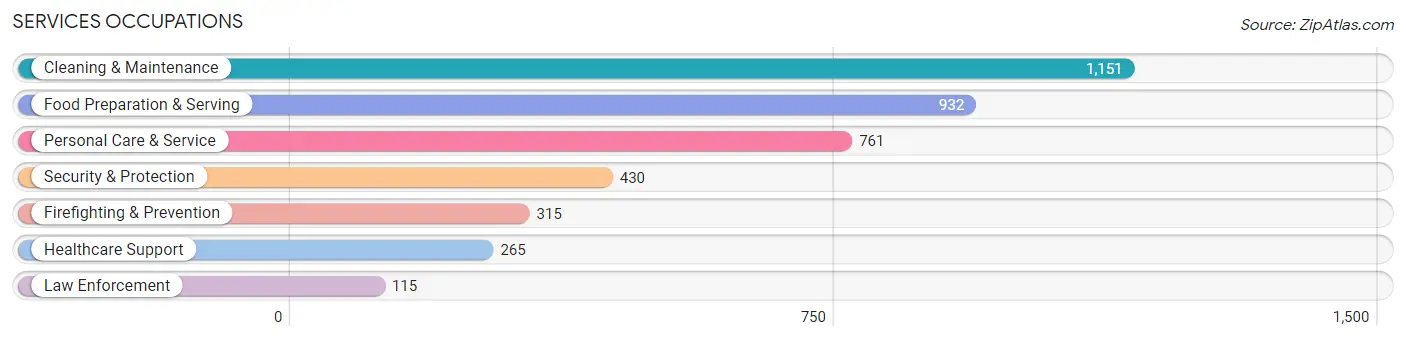
Services Occupations
The most common Services occupations in Long Branch are Cleaning & Maintenance (1,151 | 7.3%), Food Preparation & Serving (932 | 5.9%), Personal Care & Service (761 | 4.9%), Security & Protection (430 | 2.8%), and Firefighting & Prevention (315 | 2.0%).
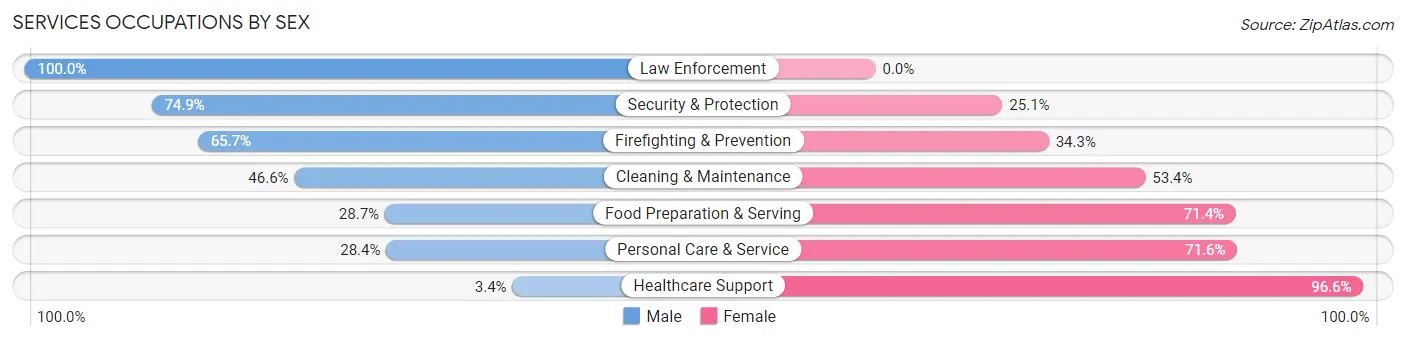
Services Occupations by Sex
Within the Services occupations in Long Branch, the most male-oriented occupations are Law Enforcement (100.0%), Security & Protection (74.9%), and Firefighting & Prevention (65.7%), while the most female-oriented occupations are Healthcare Support (96.6%), Personal Care & Service (71.6%), and Food Preparation & Serving (71.4%).
| Occupation | Male | Female |
| Healthcare Support | 9 (3.4%) | 256 (96.6%) |
| Security & Protection | 322 (74.9%) | 108 (25.1%) |
| Firefighting & Prevention | 207 (65.7%) | 108 (34.3%) |
| Law Enforcement | 115 (100.0%) | 0 (0.0%) |
| Food Preparation & Serving | 267 (28.6%) | 665 (71.4%) |
| Cleaning & Maintenance | 536 (46.6%) | 615 (53.4%) |
| Personal Care & Service | 216 (28.4%) | 545 (71.6%) |
| Total (Category) | 1,350 (38.2%) | 2,189 (61.9%) |
| Total (Overall) | 8,456 (54.0%) | 7,205 (46.0%) |
Sales and Office Occupations
The most common Sales and Office occupations in Long Branch are Sales & Related (2,031 | 13.0%), and Office & Administration (1,492 | 9.5%).

Sales and Office Occupations by Sex

| Occupation | Male | Female |
| Sales & Related | 1,163 (57.3%) | 868 (42.7%) |
| Office & Administration | 286 (19.2%) | 1,206 (80.8%) |
| Total (Category) | 1,449 (41.1%) | 2,074 (58.9%) |
| Total (Overall) | 8,456 (54.0%) | 7,205 (46.0%) |
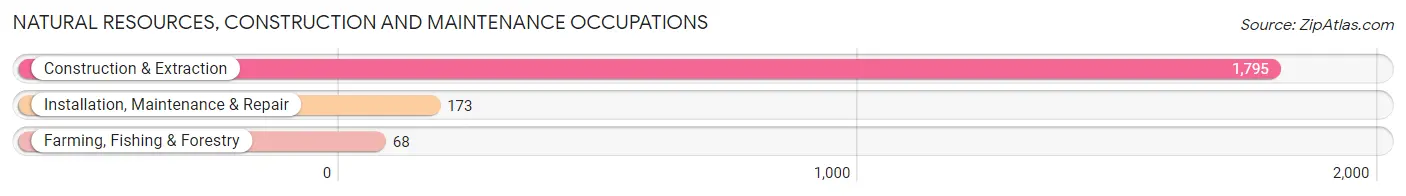
Natural Resources, Construction and Maintenance Occupations
The most common Natural Resources, Construction and Maintenance occupations in Long Branch are Construction & Extraction (1,795 | 11.5%), Installation, Maintenance & Repair (173 | 1.1%), and Farming, Fishing & Forestry (68 | 0.4%).
Natural Resources, Construction and Maintenance Occupations by Sex
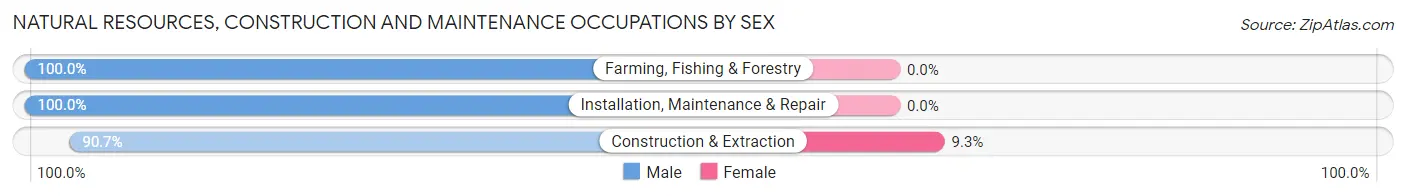
| Occupation | Male | Female |
| Farming, Fishing & Forestry | 68 (100.0%) | 0 (0.0%) |
| Construction & Extraction | 1,628 (90.7%) | 167 (9.3%) |
| Installation, Maintenance & Repair | 173 (100.0%) | 0 (0.0%) |
| Total (Category) | 1,869 (91.8%) | 167 (8.2%) |
| Total (Overall) | 8,456 (54.0%) | 7,205 (46.0%) |
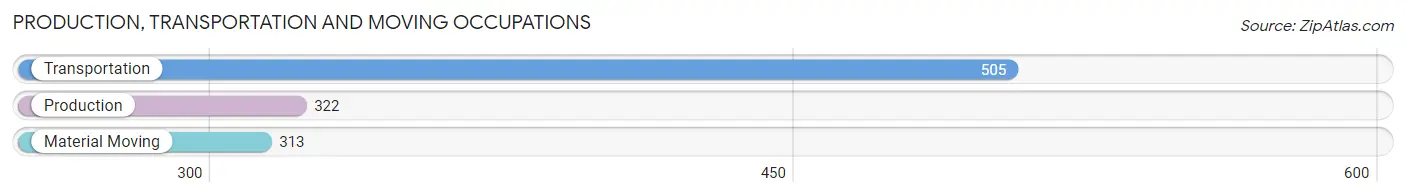
Production, Transportation and Moving Occupations
The most common Production, Transportation and Moving occupations in Long Branch are Transportation (505 | 3.2%), Production (322 | 2.1%), and Material Moving (313 | 2.0%).
Production, Transportation and Moving Occupations by Sex
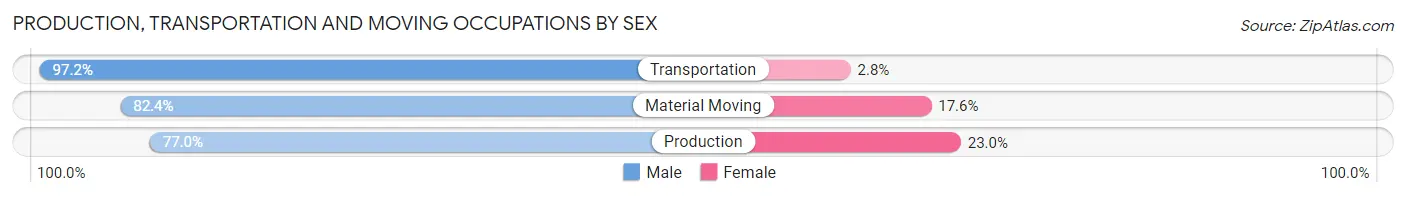
| Occupation | Male | Female |
| Production | 248 (77.0%) | 74 (23.0%) |
| Transportation | 491 (97.2%) | 14 (2.8%) |
| Material Moving | 258 (82.4%) | 55 (17.6%) |
| Total (Category) | 997 (87.5%) | 143 (12.5%) |
| Total (Overall) | 8,456 (54.0%) | 7,205 (46.0%) |
Employment Industries by Sex in Long Branch
Employment Industries in Long Branch
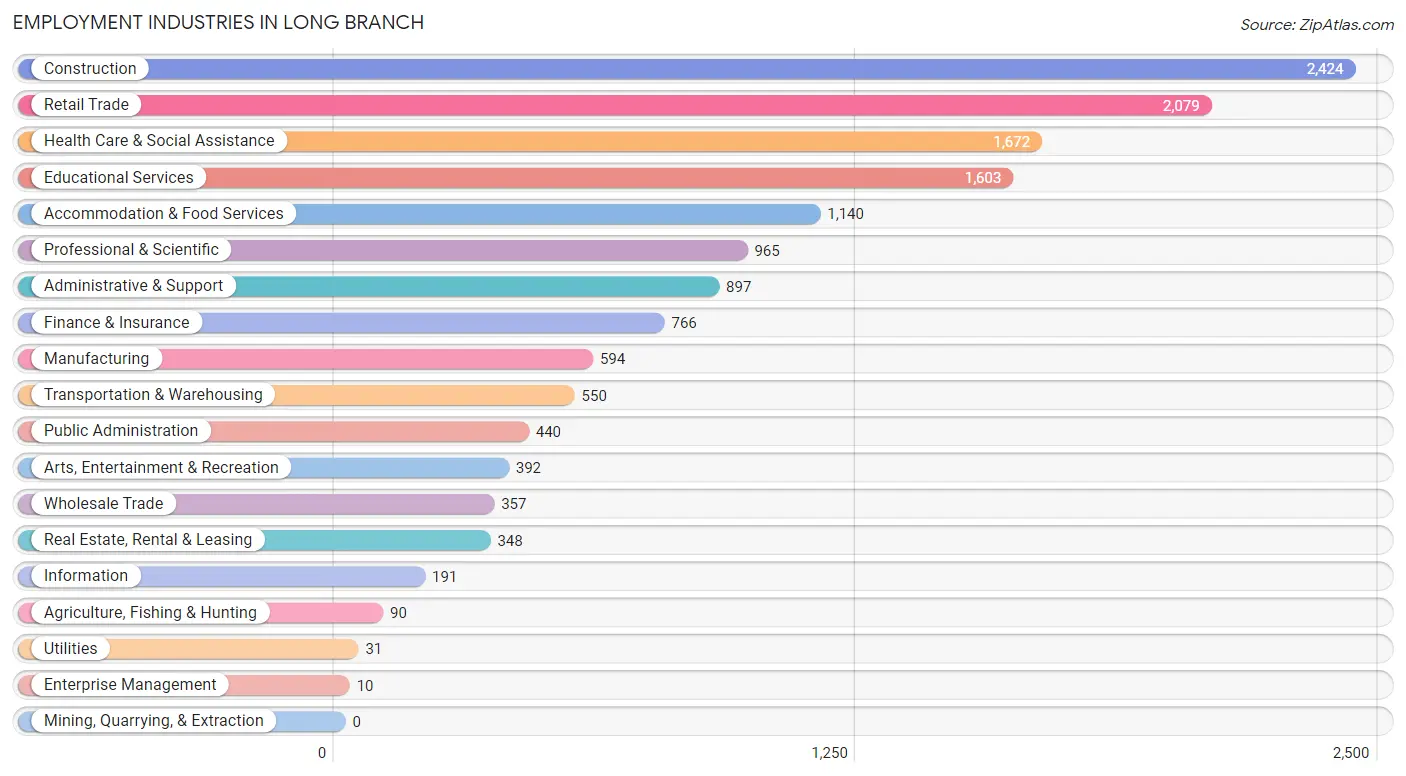
The major employment industries in Long Branch include Construction (2,424 | 15.5%), Retail Trade (2,079 | 13.3%), Health Care & Social Assistance (1,672 | 10.7%), Educational Services (1,603 | 10.2%), and Accommodation & Food Services (1,140 | 7.3%).
Employment Industries by Sex in Long Branch
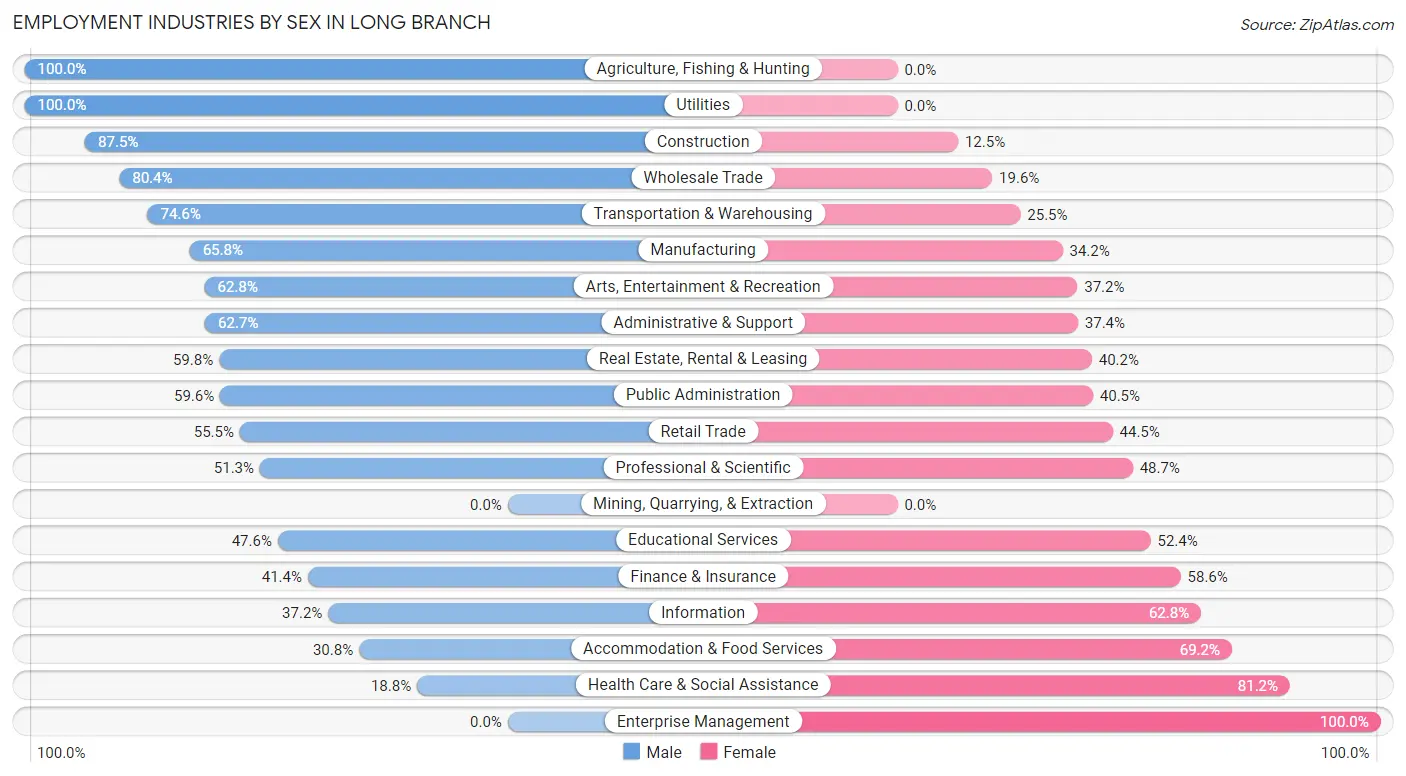
The Long Branch industries that see more men than women are Agriculture, Fishing & Hunting (100.0%), Utilities (100.0%), and Construction (87.5%), whereas the industries that tend to have a higher number of women are Enterprise Management (100.0%), Health Care & Social Assistance (81.2%), and Accommodation & Food Services (69.2%).
| Industry | Male | Female |
| Agriculture, Fishing & Hunting | 90 (100.0%) | 0 (0.0%) |
| Mining, Quarrying, & Extraction | 0 (0.0%) | 0 (0.0%) |
| Construction | 2,120 (87.5%) | 304 (12.5%) |
| Manufacturing | 391 (65.8%) | 203 (34.2%) |
| Wholesale Trade | 287 (80.4%) | 70 (19.6%) |
| Retail Trade | 1,153 (55.5%) | 926 (44.5%) |
| Transportation & Warehousing | 410 (74.6%) | 140 (25.5%) |
| Utilities | 31 (100.0%) | 0 (0.0%) |
| Information | 71 (37.2%) | 120 (62.8%) |
| Finance & Insurance | 317 (41.4%) | 449 (58.6%) |
| Real Estate, Rental & Leasing | 208 (59.8%) | 140 (40.2%) |
| Professional & Scientific | 495 (51.3%) | 470 (48.7%) |
| Enterprise Management | 0 (0.0%) | 10 (100.0%) |
| Administrative & Support | 562 (62.6%) | 335 (37.3%) |
| Educational Services | 763 (47.6%) | 840 (52.4%) |
| Health Care & Social Assistance | 314 (18.8%) | 1,358 (81.2%) |
| Arts, Entertainment & Recreation | 246 (62.8%) | 146 (37.2%) |
| Accommodation & Food Services | 351 (30.8%) | 789 (69.2%) |
| Public Administration | 262 (59.6%) | 178 (40.5%) |
| Total | 8,456 (54.0%) | 7,205 (46.0%) |
Education in Long Branch
School Enrollment in Long Branch
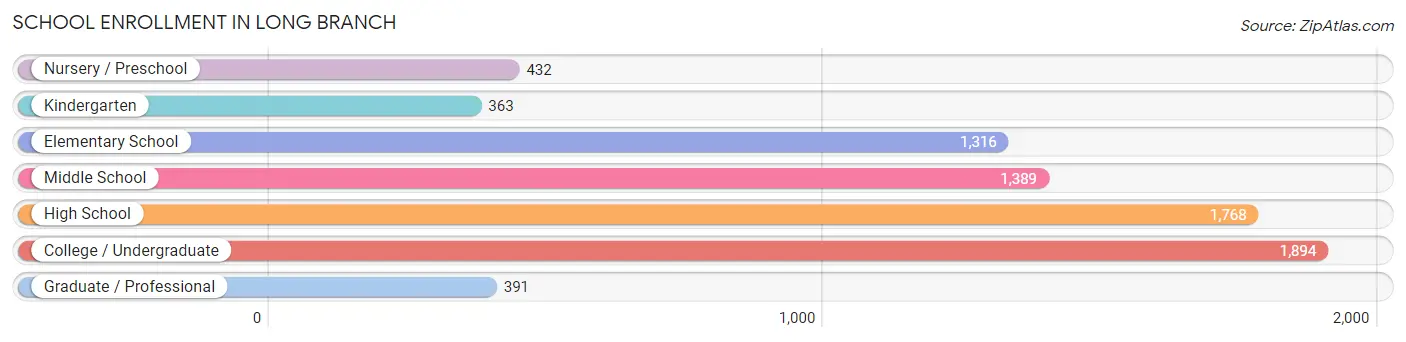
The most common levels of schooling among the 7,553 students in Long Branch are college / undergraduate (1,894 | 25.1%), high school (1,768 | 23.4%), and middle school (1,389 | 18.4%).
| School Level | # Students | % Students |
| Nursery / Preschool | 432 | 5.7% |
| Kindergarten | 363 | 4.8% |
| Elementary School | 1,316 | 17.4% |
| Middle School | 1,389 | 18.4% |
| High School | 1,768 | 23.4% |
| College / Undergraduate | 1,894 | 25.1% |
| Graduate / Professional | 391 | 5.2% |
| Total | 7,553 | 100.0% |
School Enrollment by Age by Funding Source in Long Branch
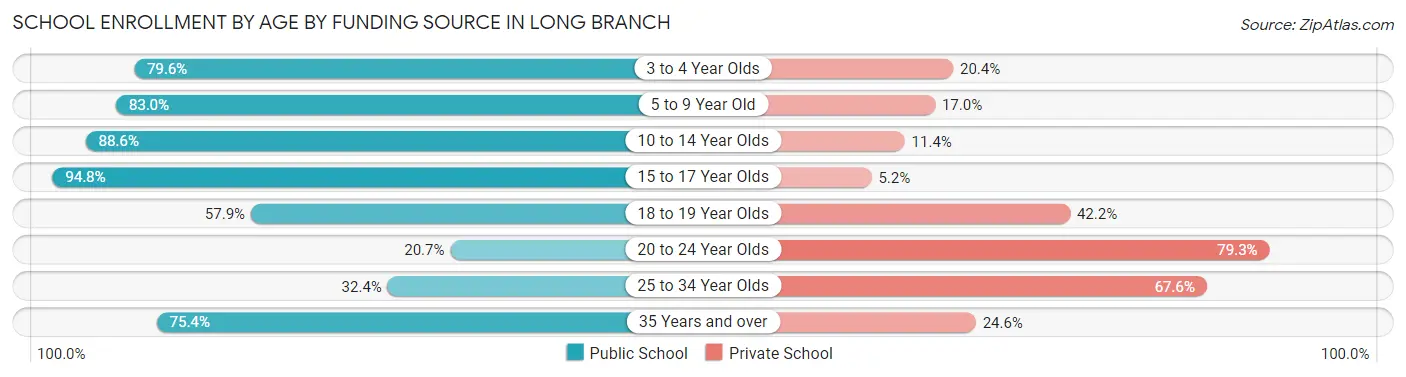
Out of a total of 7,553 students who are enrolled in schools in Long Branch, 2,357 (31.2%) attend a private institution, while the remaining 5,196 (68.8%) are enrolled in public schools. The age group of 20 to 24 year olds has the highest likelihood of being enrolled in private schools, with 1,110 (79.3% in the age bracket) enrolled. Conversely, the age group of 15 to 17 year olds has the lowest likelihood of being enrolled in a private school, with 989 (94.8% in the age bracket) attending a public institution.
| Age Bracket | Public School | Private School |
| 3 to 4 Year Olds | 340 (79.6%) | 87 (20.4%) |
| 5 to 9 Year Old | 1,283 (83.0%) | 263 (17.0%) |
| 10 to 14 Year Olds | 1,545 (88.6%) | 198 (11.4%) |
| 15 to 17 Year Olds | 989 (94.8%) | 54 (5.2%) |
| 18 to 19 Year Olds | 442 (57.9%) | 322 (42.1%) |
| 20 to 24 Year Olds | 290 (20.7%) | 1,110 (79.3%) |
| 25 to 34 Year Olds | 125 (32.4%) | 261 (67.6%) |
| 35 Years and over | 184 (75.4%) | 60 (24.6%) |
| Total | 5,196 (68.8%) | 2,357 (31.2%) |
Educational Attainment by Field of Study in Long Branch
Business (1,725 | 22.2%), education (932 | 12.0%), science & technology (803 | 10.3%), engineering (529 | 6.8%), and arts & humanities (518 | 6.7%) are the most common fields of study among 7,756 individuals in Long Branch who have obtained a bachelor's degree or higher.
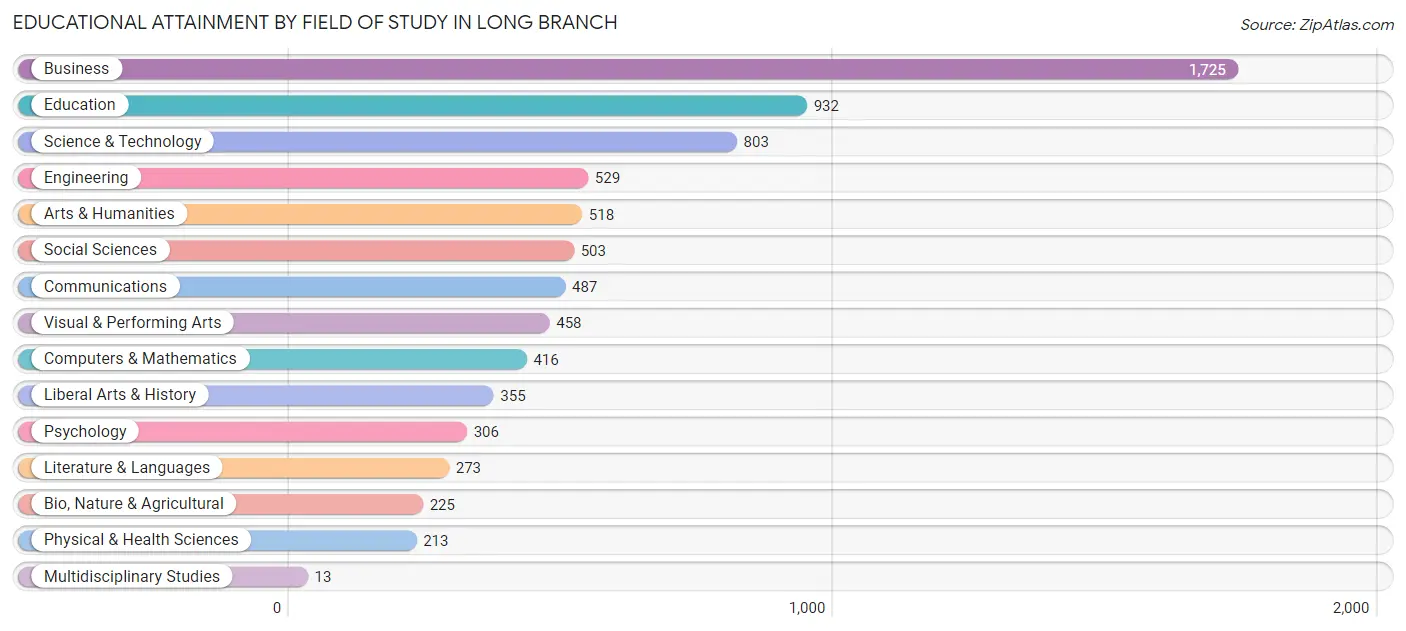
| Field of Study | # Graduates | % Graduates |
| Computers & Mathematics | 416 | 5.4% |
| Bio, Nature & Agricultural | 225 | 2.9% |
| Physical & Health Sciences | 213 | 2.8% |
| Psychology | 306 | 4.0% |
| Social Sciences | 503 | 6.5% |
| Engineering | 529 | 6.8% |
| Multidisciplinary Studies | 13 | 0.2% |
| Science & Technology | 803 | 10.3% |
| Business | 1,725 | 22.2% |
| Education | 932 | 12.0% |
| Literature & Languages | 273 | 3.5% |
| Liberal Arts & History | 355 | 4.6% |
| Visual & Performing Arts | 458 | 5.9% |
| Communications | 487 | 6.3% |
| Arts & Humanities | 518 | 6.7% |
| Total | 7,756 | 100.0% |
Transportation & Commute in Long Branch
Vehicle Availability by Sex in Long Branch
The most prevalent vehicle ownership categories in Long Branch are males with 2 vehicles (3,115, accounting for 37.6%) and females with 2 vehicles (2,754, making up 44.3%).
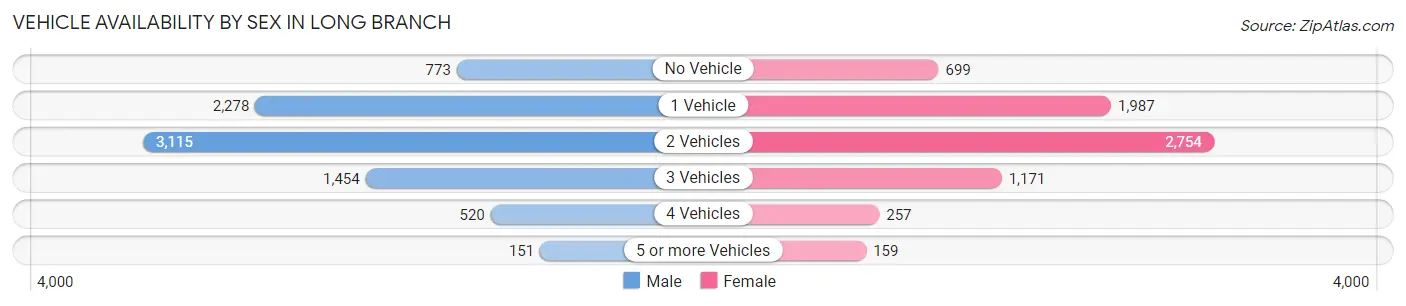
| Vehicles Available | Male | Female |
| No Vehicle | 773 (9.3%) | 699 (10.0%) |
| 1 Vehicle | 2,278 (27.5%) | 1,987 (28.3%) |
| 2 Vehicles | 3,115 (37.6%) | 2,754 (39.2%) |
| 3 Vehicles | 1,454 (17.5%) | 1,171 (16.7%) |
| 4 Vehicles | 520 (6.3%) | 257 (3.7%) |
| 5 or more Vehicles | 151 (1.8%) | 159 (2.3%) |
| Total | 8,291 (100.0%) | 7,027 (100.0%) |
Commute Time in Long Branch
The most frequently occuring commute durations in Long Branch are 10 to 14 minutes (2,403 commuters, 16.9%), 30 to 34 minutes (2,005 commuters, 14.1%), and 15 to 19 minutes (1,826 commuters, 12.9%).
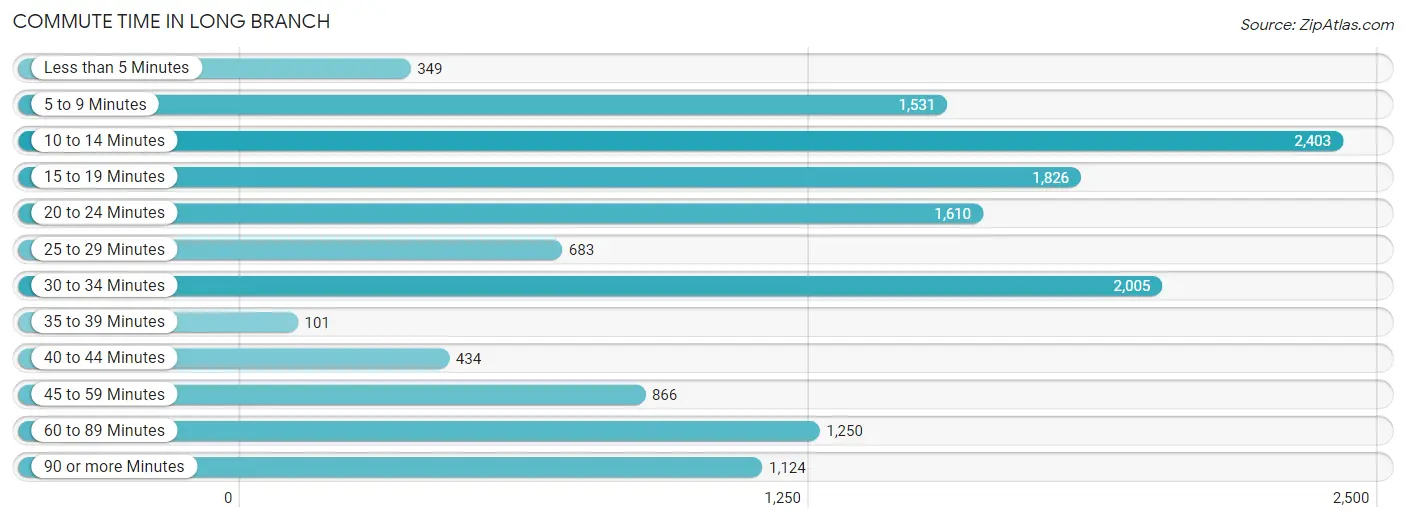
| Commute Time | # Commuters | % Commuters |
| Less than 5 Minutes | 349 | 2.5% |
| 5 to 9 Minutes | 1,531 | 10.8% |
| 10 to 14 Minutes | 2,403 | 16.9% |
| 15 to 19 Minutes | 1,826 | 12.9% |
| 20 to 24 Minutes | 1,610 | 11.4% |
| 25 to 29 Minutes | 683 | 4.8% |
| 30 to 34 Minutes | 2,005 | 14.1% |
| 35 to 39 Minutes | 101 | 0.7% |
| 40 to 44 Minutes | 434 | 3.1% |
| 45 to 59 Minutes | 866 | 6.1% |
| 60 to 89 Minutes | 1,250 | 8.8% |
| 90 or more Minutes | 1,124 | 7.9% |
Commute Time by Sex in Long Branch
The most common commute times in Long Branch are 30 to 34 minutes (1,292 commuters, 16.7%) for males and 10 to 14 minutes (1,280 commuters, 19.9%) for females.
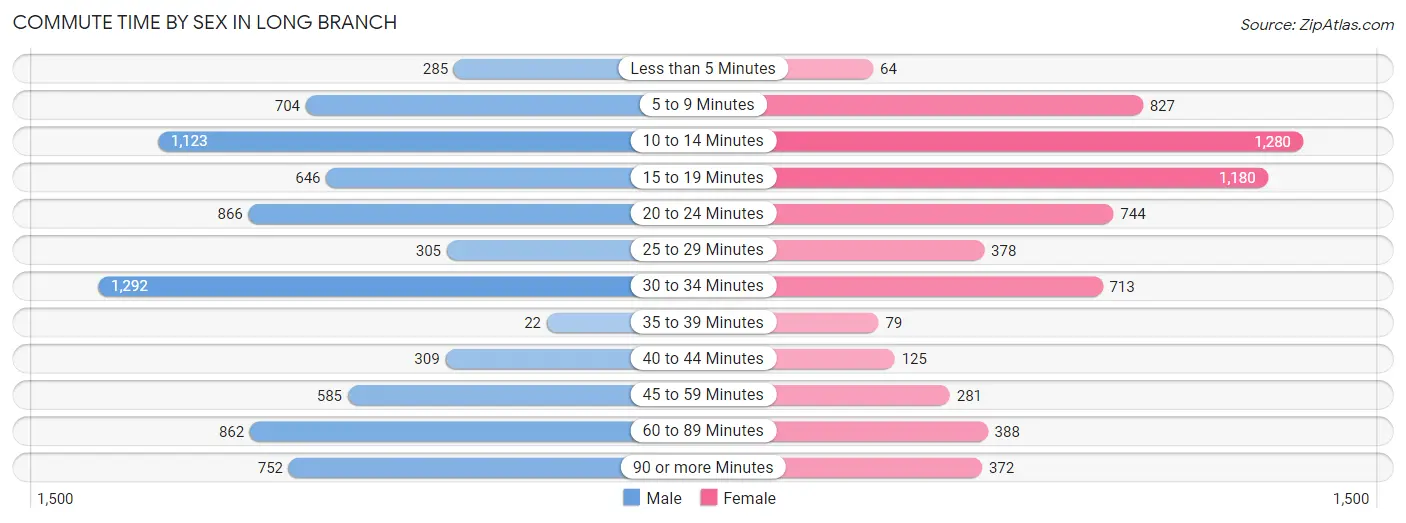
| Commute Time | Male | Female |
| Less than 5 Minutes | 285 (3.7%) | 64 (1.0%) |
| 5 to 9 Minutes | 704 (9.1%) | 827 (12.9%) |
| 10 to 14 Minutes | 1,123 (14.5%) | 1,280 (19.9%) |
| 15 to 19 Minutes | 646 (8.3%) | 1,180 (18.3%) |
| 20 to 24 Minutes | 866 (11.2%) | 744 (11.6%) |
| 25 to 29 Minutes | 305 (3.9%) | 378 (5.9%) |
| 30 to 34 Minutes | 1,292 (16.7%) | 713 (11.1%) |
| 35 to 39 Minutes | 22 (0.3%) | 79 (1.2%) |
| 40 to 44 Minutes | 309 (4.0%) | 125 (1.9%) |
| 45 to 59 Minutes | 585 (7.5%) | 281 (4.4%) |
| 60 to 89 Minutes | 862 (11.1%) | 388 (6.0%) |
| 90 or more Minutes | 752 (9.7%) | 372 (5.8%) |
Time of Departure to Work by Sex in Long Branch
The most frequent times of departure to work in Long Branch are 7:00 AM to 7:29 AM (1,373, 17.7%) for males and 8:00 AM to 8:29 AM (1,080, 16.8%) for females.
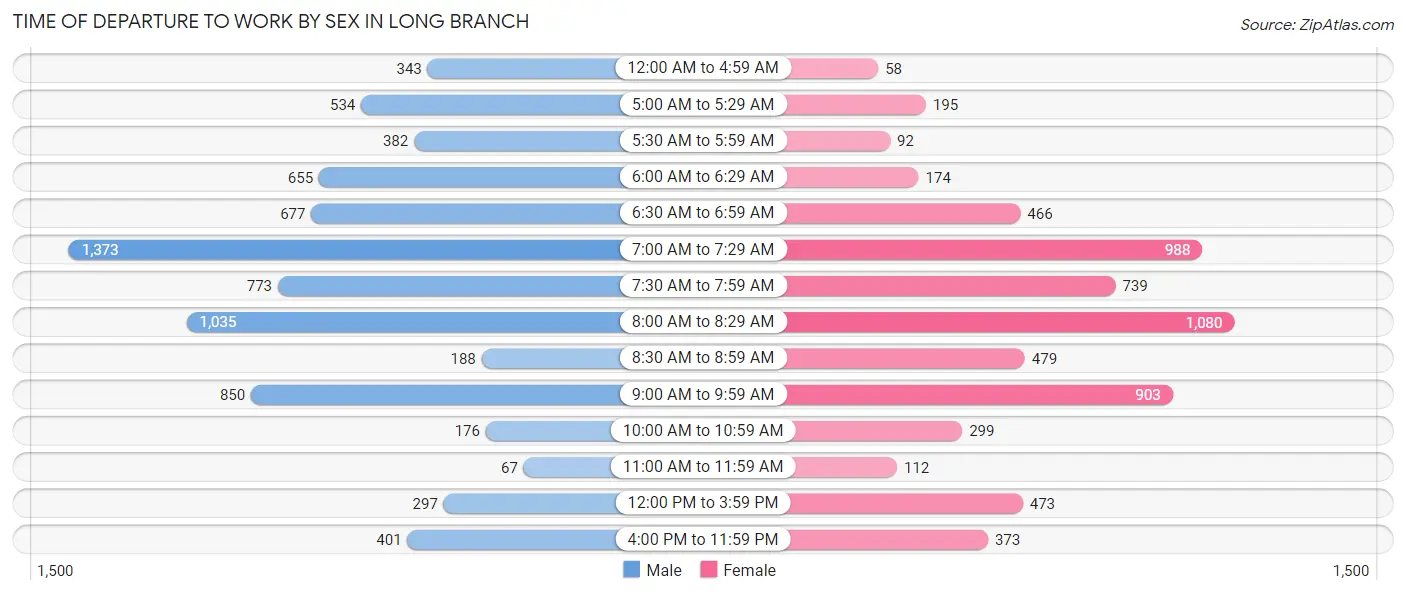
| Time of Departure | Male | Female |
| 12:00 AM to 4:59 AM | 343 (4.4%) | 58 (0.9%) |
| 5:00 AM to 5:29 AM | 534 (6.9%) | 195 (3.0%) |
| 5:30 AM to 5:59 AM | 382 (4.9%) | 92 (1.4%) |
| 6:00 AM to 6:29 AM | 655 (8.5%) | 174 (2.7%) |
| 6:30 AM to 6:59 AM | 677 (8.7%) | 466 (7.2%) |
| 7:00 AM to 7:29 AM | 1,373 (17.7%) | 988 (15.4%) |
| 7:30 AM to 7:59 AM | 773 (10.0%) | 739 (11.5%) |
| 8:00 AM to 8:29 AM | 1,035 (13.4%) | 1,080 (16.8%) |
| 8:30 AM to 8:59 AM | 188 (2.4%) | 479 (7.4%) |
| 9:00 AM to 9:59 AM | 850 (11.0%) | 903 (14.0%) |
| 10:00 AM to 10:59 AM | 176 (2.3%) | 299 (4.6%) |
| 11:00 AM to 11:59 AM | 67 (0.9%) | 112 (1.7%) |
| 12:00 PM to 3:59 PM | 297 (3.8%) | 473 (7.3%) |
| 4:00 PM to 11:59 PM | 401 (5.2%) | 373 (5.8%) |
| Total | 7,751 (100.0%) | 6,431 (100.0%) |
Housing Occupancy in Long Branch
Occupancy by Ownership in Long Branch
Of the total 12,813 dwellings in Long Branch, owner-occupied units account for 5,457 (42.6%), while renter-occupied units make up 7,356 (57.4%).
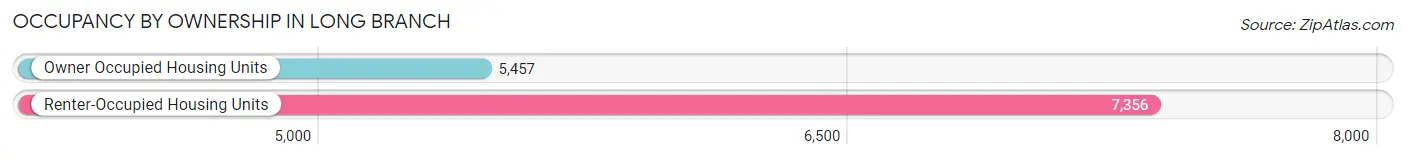
| Occupancy | # Housing Units | % Housing Units |
| Owner Occupied Housing Units | 5,457 | 42.6% |
| Renter-Occupied Housing Units | 7,356 | 57.4% |
| Total Occupied Housing Units | 12,813 | 100.0% |
Occupancy by Household Size in Long Branch
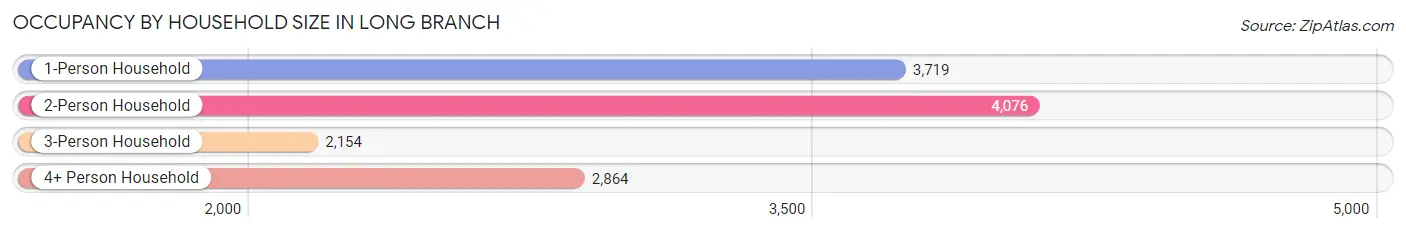
| Household Size | # Housing Units | % Housing Units |
| 1-Person Household | 3,719 | 29.0% |
| 2-Person Household | 4,076 | 31.8% |
| 3-Person Household | 2,154 | 16.8% |
| 4+ Person Household | 2,864 | 22.4% |
| Total Housing Units | 12,813 | 100.0% |
Occupancy by Ownership by Household Size in Long Branch
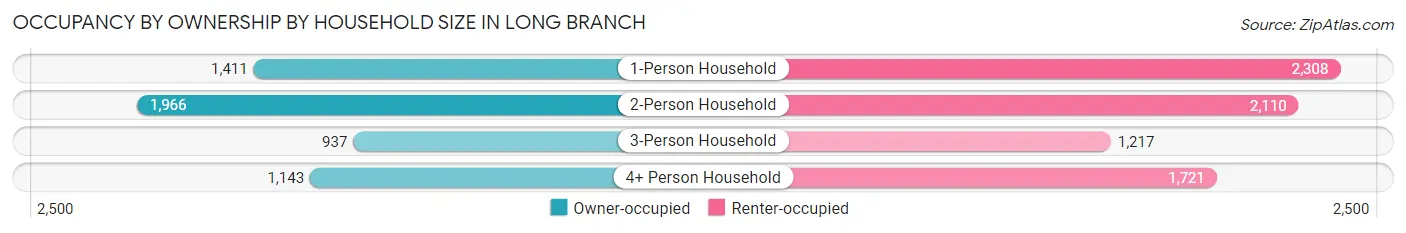
| Household Size | Owner-occupied | Renter-occupied |
| 1-Person Household | 1,411 (37.9%) | 2,308 (62.1%) |
| 2-Person Household | 1,966 (48.2%) | 2,110 (51.8%) |
| 3-Person Household | 937 (43.5%) | 1,217 (56.5%) |
| 4+ Person Household | 1,143 (39.9%) | 1,721 (60.1%) |
| Total Housing Units | 5,457 (42.6%) | 7,356 (57.4%) |
Occupancy by Educational Attainment in Long Branch
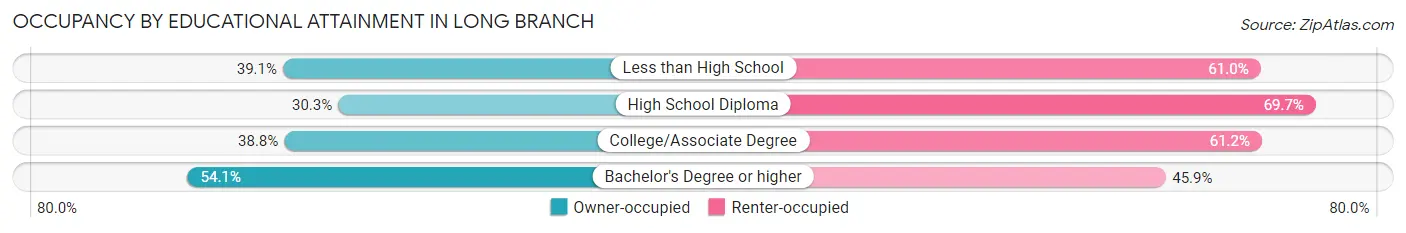
| Household Size | Owner-occupied | Renter-occupied |
| Less than High School | 735 (39.1%) | 1,147 (61.0%) |
| High School Diploma | 938 (30.3%) | 2,159 (69.7%) |
| College/Associate Degree | 1,161 (38.8%) | 1,828 (61.2%) |
| Bachelor's Degree or higher | 2,623 (54.1%) | 2,222 (45.9%) |
Occupancy by Age of Householder in Long Branch
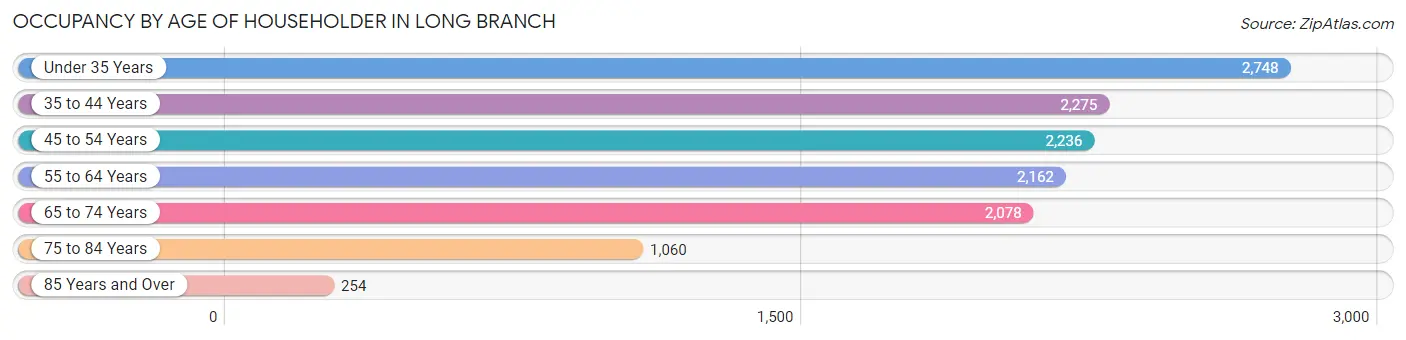
| Age Bracket | # Households | % Households |
| Under 35 Years | 2,748 | 21.4% |
| 35 to 44 Years | 2,275 | 17.8% |
| 45 to 54 Years | 2,236 | 17.4% |
| 55 to 64 Years | 2,162 | 16.9% |
| 65 to 74 Years | 2,078 | 16.2% |
| 75 to 84 Years | 1,060 | 8.3% |
| 85 Years and Over | 254 | 2.0% |
| Total | 12,813 | 100.0% |
Housing Finances in Long Branch
Median Income by Occupancy in Long Branch
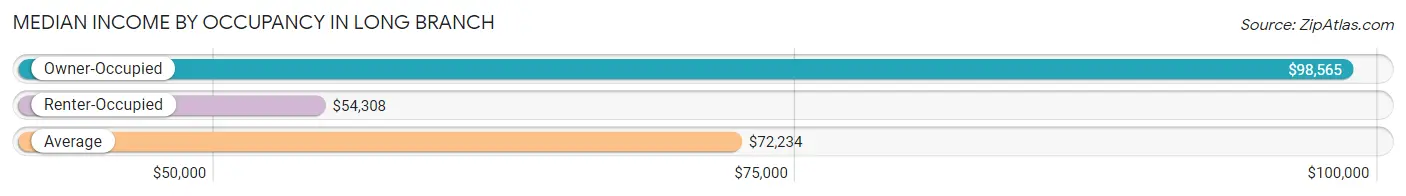
| Occupancy Type | # Households | Median Income |
| Owner-Occupied | 5,457 (42.6%) | $98,565 |
| Renter-Occupied | 7,356 (57.4%) | $54,308 |
| Average | 12,813 (100.0%) | $72,234 |
Occupancy by Householder Income Bracket in Long Branch
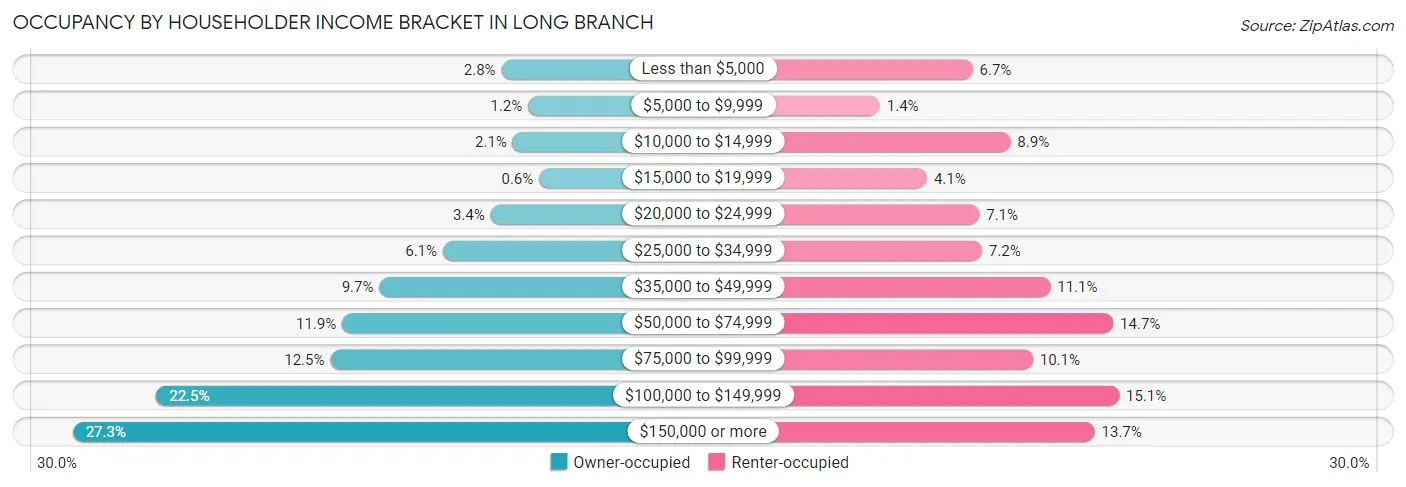
| Income Bracket | Owner-occupied | Renter-occupied |
| Less than $5,000 | 150 (2.8%) | 492 (6.7%) |
| $5,000 to $9,999 | 67 (1.2%) | 102 (1.4%) |
| $10,000 to $14,999 | 115 (2.1%) | 651 (8.8%) |
| $15,000 to $19,999 | 33 (0.6%) | 300 (4.1%) |
| $20,000 to $24,999 | 184 (3.4%) | 520 (7.1%) |
| $25,000 to $34,999 | 333 (6.1%) | 531 (7.2%) |
| $35,000 to $49,999 | 531 (9.7%) | 819 (11.1%) |
| $50,000 to $74,999 | 647 (11.9%) | 1,083 (14.7%) |
| $75,000 to $99,999 | 684 (12.5%) | 745 (10.1%) |
| $100,000 to $149,999 | 1,226 (22.5%) | 1,108 (15.1%) |
| $150,000 or more | 1,487 (27.3%) | 1,005 (13.7%) |
| Total | 5,457 (100.0%) | 7,356 (100.0%) |
Monthly Housing Cost Tiers in Long Branch
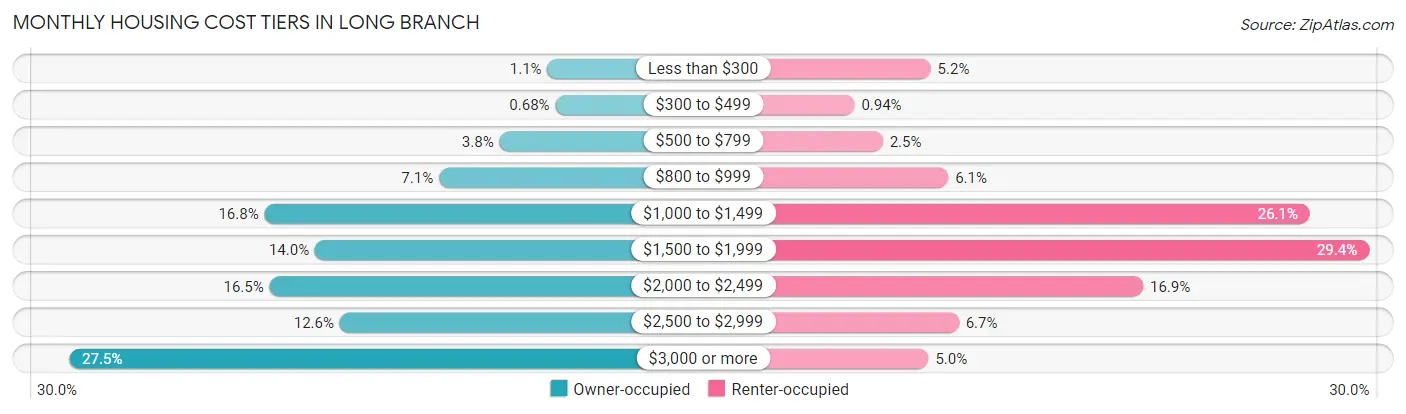
| Monthly Cost | Owner-occupied | Renter-occupied |
| Less than $300 | 61 (1.1%) | 379 (5.1%) |
| $300 to $499 | 37 (0.7%) | 69 (0.9%) |
| $500 to $799 | 206 (3.8%) | 184 (2.5%) |
| $800 to $999 | 388 (7.1%) | 450 (6.1%) |
| $1,000 to $1,499 | 914 (16.8%) | 1,919 (26.1%) |
| $1,500 to $1,999 | 762 (14.0%) | 2,160 (29.4%) |
| $2,000 to $2,499 | 899 (16.5%) | 1,242 (16.9%) |
| $2,500 to $2,999 | 687 (12.6%) | 493 (6.7%) |
| $3,000 or more | 1,503 (27.5%) | 370 (5.0%) |
| Total | 5,457 (100.0%) | 7,356 (100.0%) |
Physical Housing Characteristics in Long Branch
Housing Structures in Long Branch
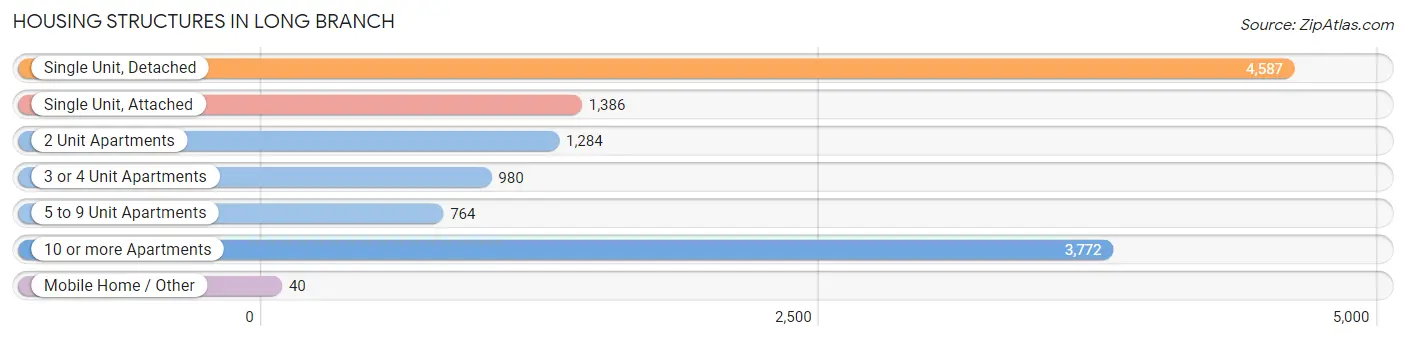
| Structure Type | # Housing Units | % Housing Units |
| Single Unit, Detached | 4,587 | 35.8% |
| Single Unit, Attached | 1,386 | 10.8% |
| 2 Unit Apartments | 1,284 | 10.0% |
| 3 or 4 Unit Apartments | 980 | 7.6% |
| 5 to 9 Unit Apartments | 764 | 6.0% |
| 10 or more Apartments | 3,772 | 29.4% |
| Mobile Home / Other | 40 | 0.3% |
| Total | 12,813 | 100.0% |
Housing Structures by Occupancy in Long Branch
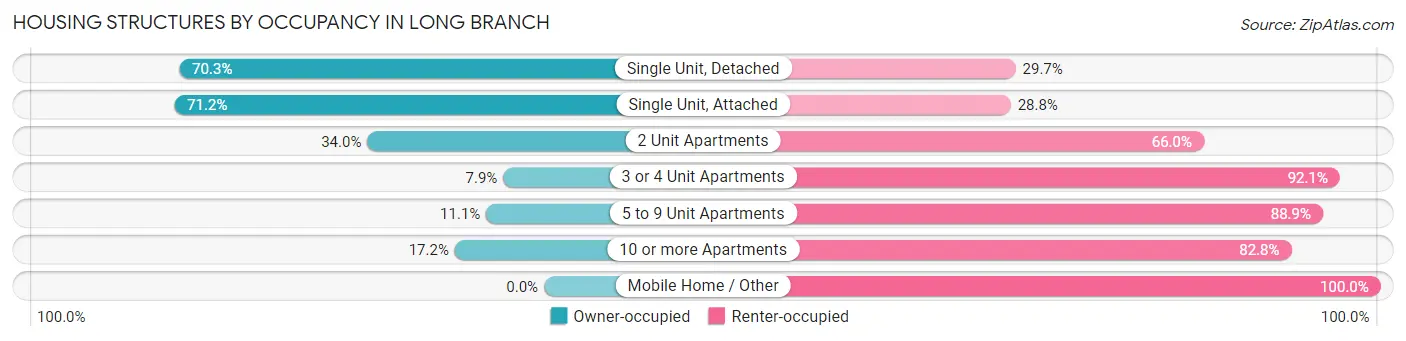
| Structure Type | Owner-occupied | Renter-occupied |
| Single Unit, Detached | 3,223 (70.3%) | 1,364 (29.7%) |
| Single Unit, Attached | 987 (71.2%) | 399 (28.8%) |
| 2 Unit Apartments | 437 (34.0%) | 847 (66.0%) |
| 3 or 4 Unit Apartments | 77 (7.9%) | 903 (92.1%) |
| 5 to 9 Unit Apartments | 85 (11.1%) | 679 (88.9%) |
| 10 or more Apartments | 648 (17.2%) | 3,124 (82.8%) |
| Mobile Home / Other | 0 (0.0%) | 40 (100.0%) |
| Total | 5,457 (42.6%) | 7,356 (57.4%) |
Housing Structures by Number of Rooms in Long Branch
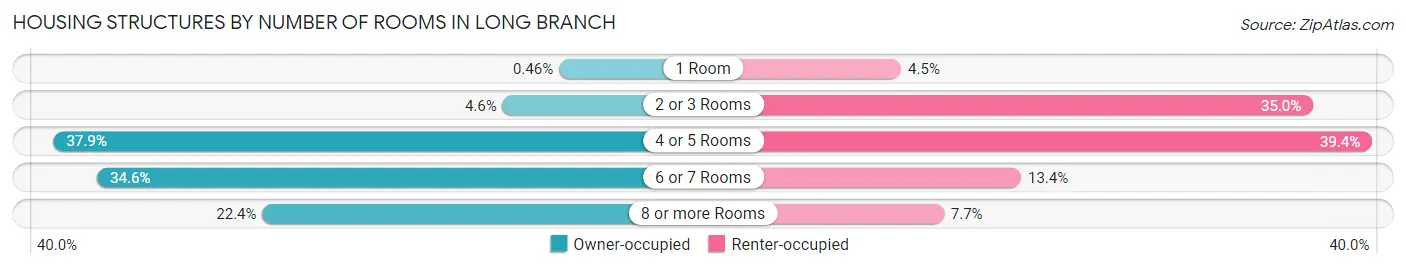
| Number of Rooms | Owner-occupied | Renter-occupied |
| 1 Room | 25 (0.5%) | 333 (4.5%) |
| 2 or 3 Rooms | 253 (4.6%) | 2,575 (35.0%) |
| 4 or 5 Rooms | 2,066 (37.9%) | 2,896 (39.4%) |
| 6 or 7 Rooms | 1,890 (34.6%) | 986 (13.4%) |
| 8 or more Rooms | 1,223 (22.4%) | 566 (7.7%) |
| Total | 5,457 (100.0%) | 7,356 (100.0%) |
Housing Structure by Heating Type in Long Branch
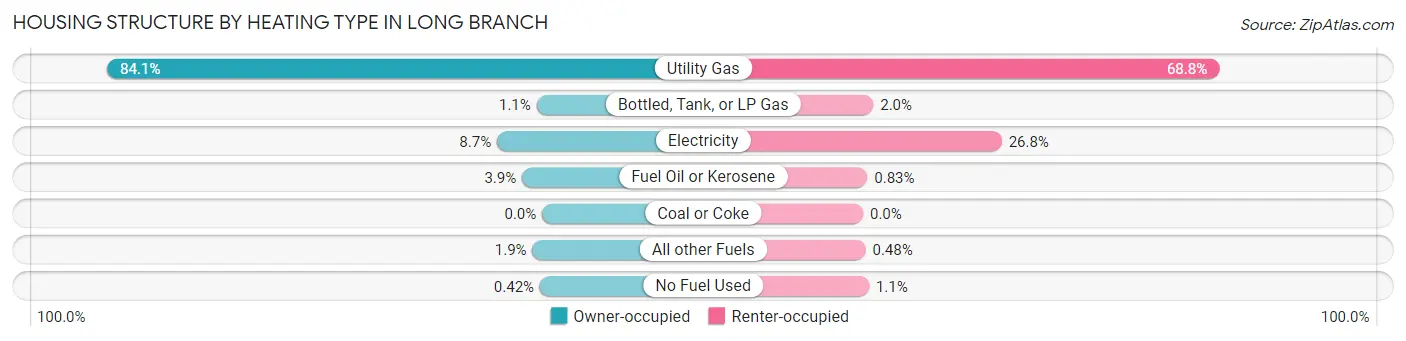
| Heating Type | Owner-occupied | Renter-occupied |
| Utility Gas | 4,587 (84.1%) | 5,059 (68.8%) |
| Bottled, Tank, or LP Gas | 58 (1.1%) | 146 (2.0%) |
| Electricity | 476 (8.7%) | 1,971 (26.8%) |
| Fuel Oil or Kerosene | 211 (3.9%) | 61 (0.8%) |
| Coal or Coke | 0 (0.0%) | 0 (0.0%) |
| All other Fuels | 102 (1.9%) | 35 (0.5%) |
| No Fuel Used | 23 (0.4%) | 84 (1.1%) |
| Total | 5,457 (100.0%) | 7,356 (100.0%) |
Household Vehicle Usage in Long Branch
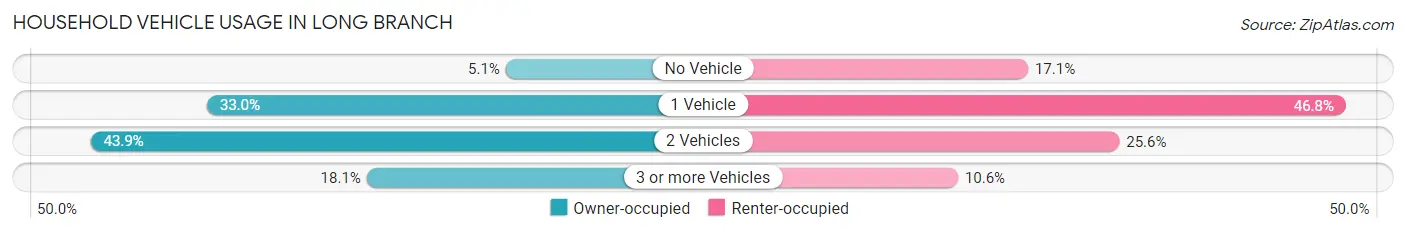
| Vehicles per Household | Owner-occupied | Renter-occupied |
| No Vehicle | 278 (5.1%) | 1,257 (17.1%) |
| 1 Vehicle | 1,800 (33.0%) | 3,439 (46.8%) |
| 2 Vehicles | 2,393 (43.9%) | 1,884 (25.6%) |
| 3 or more Vehicles | 986 (18.1%) | 776 (10.5%) |
| Total | 5,457 (100.0%) | 7,356 (100.0%) |
Real Estate & Mortgages in Long Branch
Real Estate and Mortgage Overview in Long Branch
| Characteristic | Without Mortgage | With Mortgage |
| Housing Units | 2,080 | 3,377 |
| Median Property Value | $434,700 | $452,100 |
| Median Household Income | $78,878 | $1,070 |
| Monthly Housing Costs | $1,197 | $1,378 |
| Real Estate Taxes | $8,056 | $23 |
Property Value by Mortgage Status in Long Branch
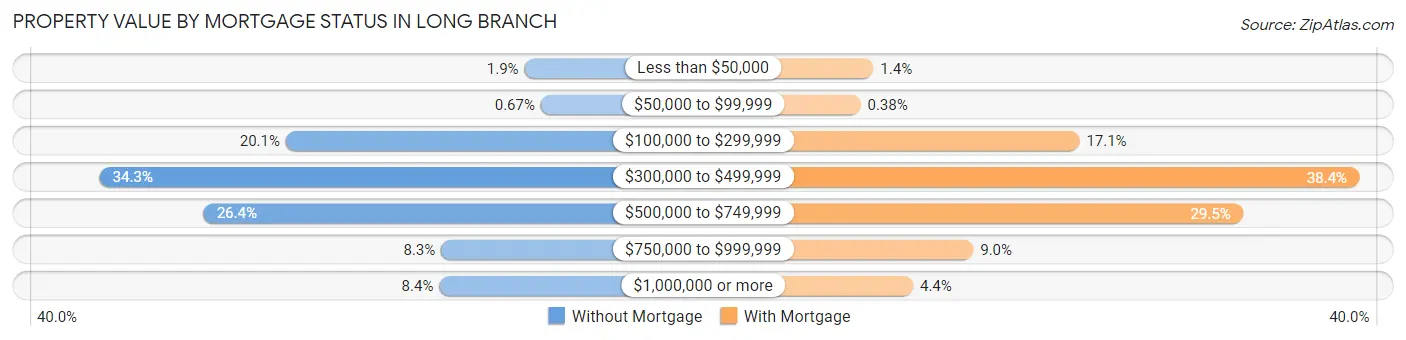
| Property Value | Without Mortgage | With Mortgage |
| Less than $50,000 | 40 (1.9%) | 46 (1.4%) |
| $50,000 to $99,999 | 14 (0.7%) | 13 (0.4%) |
| $100,000 to $299,999 | 418 (20.1%) | 576 (17.1%) |
| $300,000 to $499,999 | 713 (34.3%) | 1,295 (38.4%) |
| $500,000 to $749,999 | 548 (26.4%) | 996 (29.5%) |
| $750,000 to $999,999 | 172 (8.3%) | 303 (9.0%) |
| $1,000,000 or more | 175 (8.4%) | 148 (4.4%) |
| Total | 2,080 (100.0%) | 3,377 (100.0%) |
Household Income by Mortgage Status in Long Branch
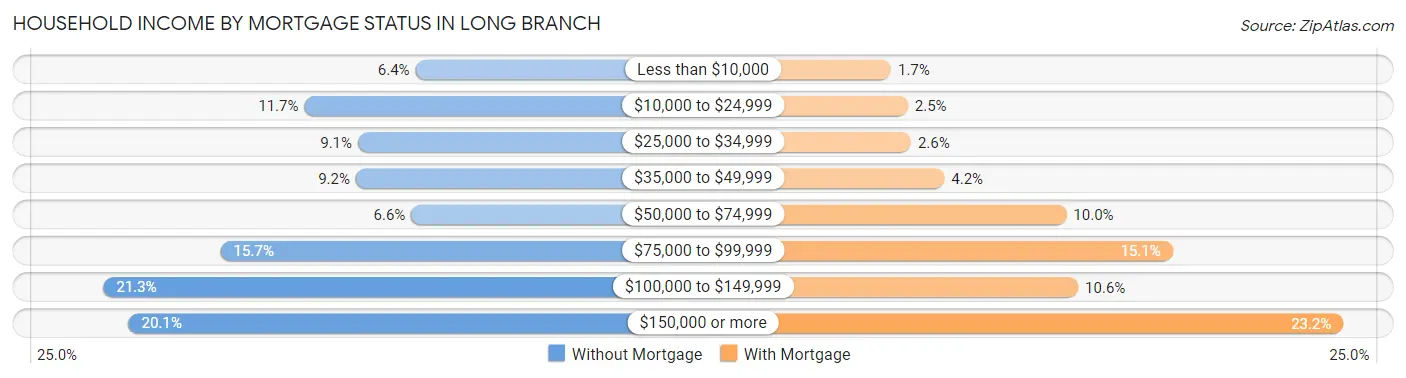
| Household Income | Without Mortgage | With Mortgage |
| Less than $10,000 | 133 (6.4%) | 57 (1.7%) |
| $10,000 to $24,999 | 243 (11.7%) | 84 (2.5%) |
| $25,000 to $34,999 | 190 (9.1%) | 89 (2.6%) |
| $35,000 to $49,999 | 192 (9.2%) | 143 (4.2%) |
| $50,000 to $74,999 | 137 (6.6%) | 339 (10.0%) |
| $75,000 to $99,999 | 326 (15.7%) | 510 (15.1%) |
| $100,000 to $149,999 | 442 (21.2%) | 358 (10.6%) |
| $150,000 or more | 417 (20.1%) | 784 (23.2%) |
| Total | 2,080 (100.0%) | 3,377 (100.0%) |
Property Value to Household Income Ratio in Long Branch
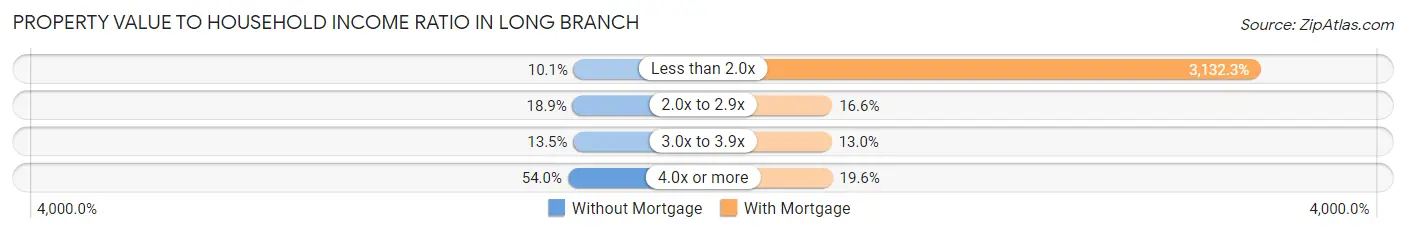
| Value-to-Income Ratio | Without Mortgage | With Mortgage |
| Less than 2.0x | 211 (10.1%) | 105,777 (3,132.3%) |
| 2.0x to 2.9x | 393 (18.9%) | 561 (16.6%) |
| 3.0x to 3.9x | 280 (13.5%) | 440 (13.0%) |
| 4.0x or more | 1,123 (54.0%) | 661 (19.6%) |
| Total | 2,080 (100.0%) | 3,377 (100.0%) |
Real Estate Taxes by Mortgage Status in Long Branch
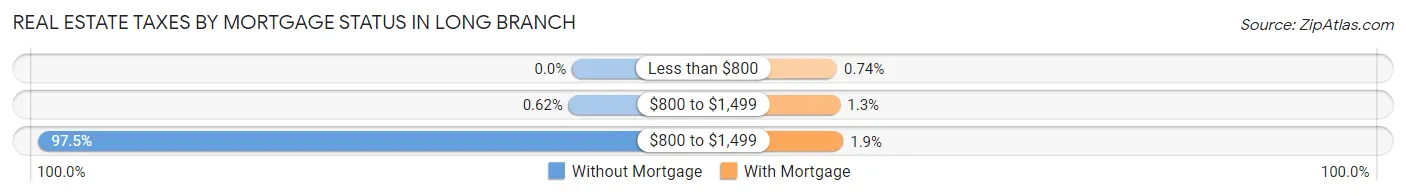
| Property Taxes | Without Mortgage | With Mortgage |
| Less than $800 | 0 (0.0%) | 25 (0.7%) |
| $800 to $1,499 | 13 (0.6%) | 45 (1.3%) |
| $800 to $1,499 | 2,027 (97.5%) | 63 (1.9%) |
| Total | 2,080 (100.0%) | 3,377 (100.0%) |
Health & Disability in Long Branch
Health Insurance Coverage by Age in Long Branch
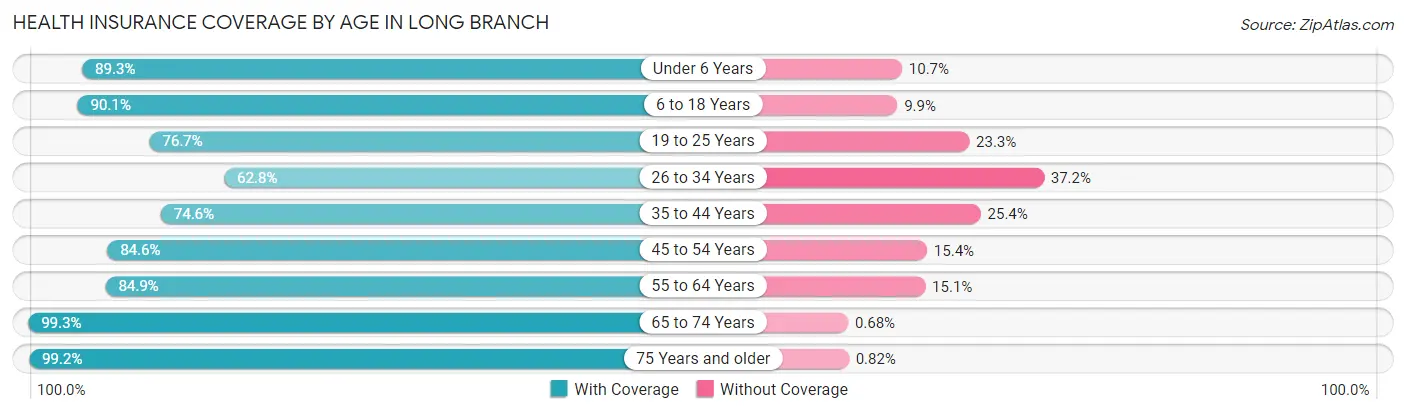
| Age Bracket | With Coverage | Without Coverage |
| Under 6 Years | 2,237 (89.3%) | 269 (10.7%) |
| 6 to 18 Years | 4,760 (90.1%) | 521 (9.9%) |
| 19 to 25 Years | 2,628 (76.7%) | 797 (23.3%) |
| 26 to 34 Years | 2,553 (62.8%) | 1,512 (37.2%) |
| 35 to 44 Years | 3,057 (74.6%) | 1,042 (25.4%) |
| 45 to 54 Years | 2,986 (84.6%) | 544 (15.4%) |
| 55 to 64 Years | 3,216 (84.9%) | 571 (15.1%) |
| 65 to 74 Years | 3,051 (99.3%) | 21 (0.7%) |
| 75 Years and older | 2,065 (99.2%) | 17 (0.8%) |
| Total | 26,553 (83.4%) | 5,294 (16.6%) |
Health Insurance Coverage by Citizenship Status in Long Branch
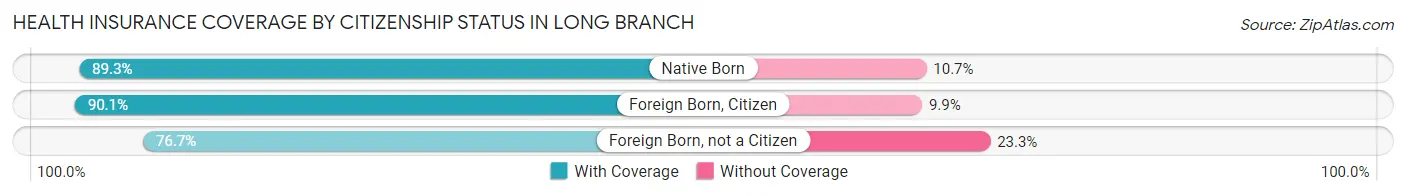
| Citizenship Status | With Coverage | Without Coverage |
| Native Born | 2,237 (89.3%) | 269 (10.7%) |
| Foreign Born, Citizen | 4,760 (90.1%) | 521 (9.9%) |
| Foreign Born, not a Citizen | 2,628 (76.7%) | 797 (23.3%) |
Health Insurance Coverage by Household Income in Long Branch
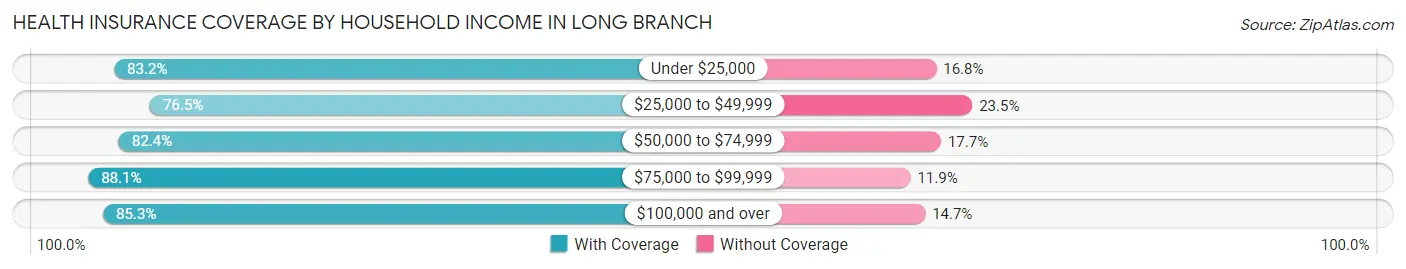
| Household Income | With Coverage | Without Coverage |
| Under $25,000 | 4,203 (83.2%) | 846 (16.8%) |
| $25,000 to $49,999 | 4,290 (76.5%) | 1,318 (23.5%) |
| $50,000 to $74,999 | 3,373 (82.4%) | 723 (17.6%) |
| $75,000 to $99,999 | 2,724 (88.1%) | 369 (11.9%) |
| $100,000 and over | 11,829 (85.3%) | 2,037 (14.7%) |
Public vs Private Health Insurance Coverage by Age in Long Branch
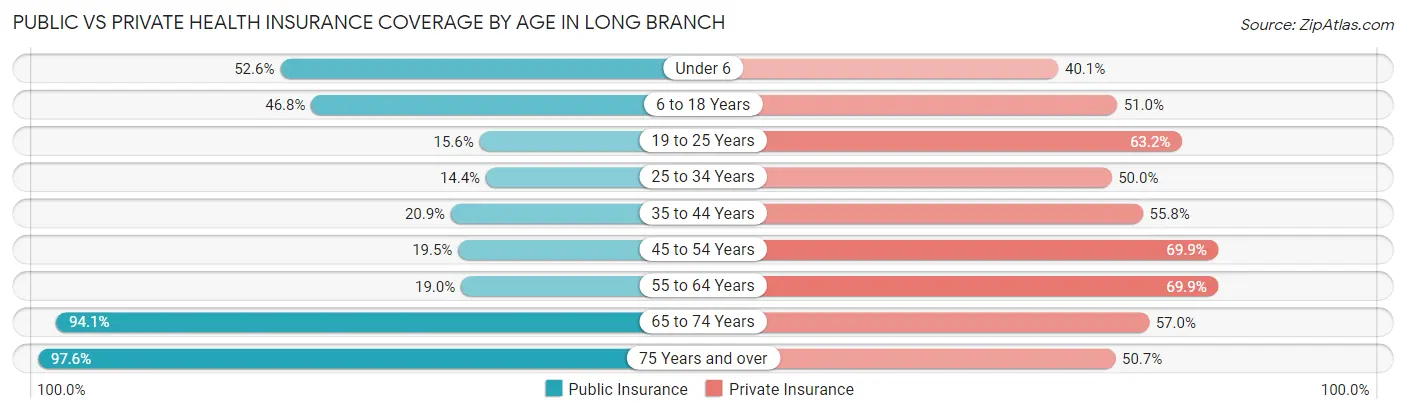
| Age Bracket | Public Insurance | Private Insurance |
| Under 6 | 1,317 (52.5%) | 1,006 (40.1%) |
| 6 to 18 Years | 2,471 (46.8%) | 2,695 (51.0%) |
| 19 to 25 Years | 533 (15.6%) | 2,164 (63.2%) |
| 25 to 34 Years | 584 (14.4%) | 2,033 (50.0%) |
| 35 to 44 Years | 855 (20.9%) | 2,289 (55.8%) |
| 45 to 54 Years | 689 (19.5%) | 2,469 (69.9%) |
| 55 to 64 Years | 719 (19.0%) | 2,648 (69.9%) |
| 65 to 74 Years | 2,892 (94.1%) | 1,750 (57.0%) |
| 75 Years and over | 2,031 (97.6%) | 1,056 (50.7%) |
| Total | 12,091 (38.0%) | 18,110 (56.9%) |
Disability Status by Sex by Age in Long Branch
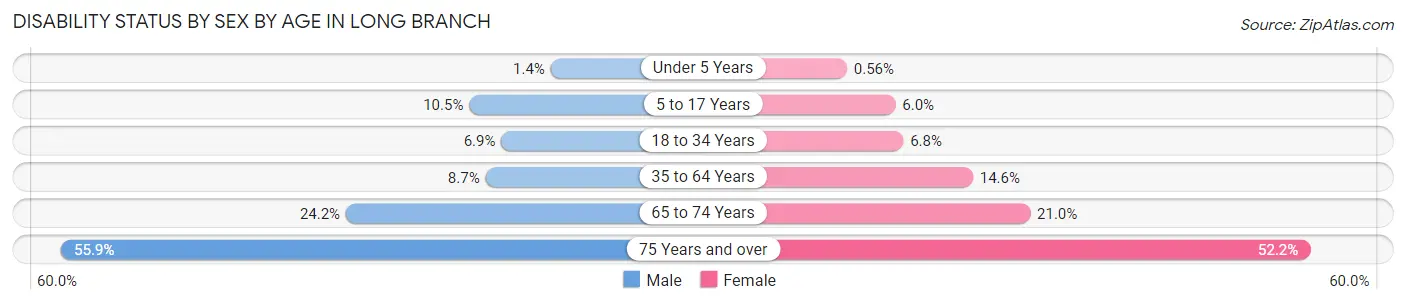
| Age Bracket | Male | Female |
| Under 5 Years | 12 (1.4%) | 7 (0.6%) |
| 5 to 17 Years | 216 (10.5%) | 163 (6.0%) |
| 18 to 34 Years | 273 (6.9%) | 303 (6.8%) |
| 35 to 64 Years | 491 (8.7%) | 840 (14.6%) |
| 65 to 74 Years | 320 (24.2%) | 367 (21.0%) |
| 75 Years and over | 476 (55.9%) | 642 (52.1%) |
Disability Class by Sex by Age in Long Branch
Disability Class: Hearing Difficulty
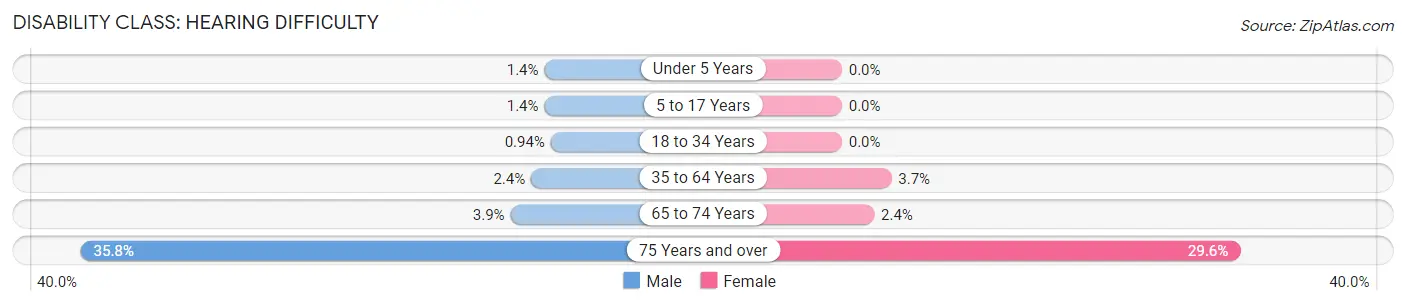
| Age Bracket | Male | Female |
| Under 5 Years | 12 (1.4%) | 0 (0.0%) |
| 5 to 17 Years | 29 (1.4%) | 0 (0.0%) |
| 18 to 34 Years | 37 (0.9%) | 0 (0.0%) |
| 35 to 64 Years | 136 (2.4%) | 212 (3.7%) |
| 65 to 74 Years | 52 (3.9%) | 42 (2.4%) |
| 75 Years and over | 305 (35.8%) | 364 (29.6%) |
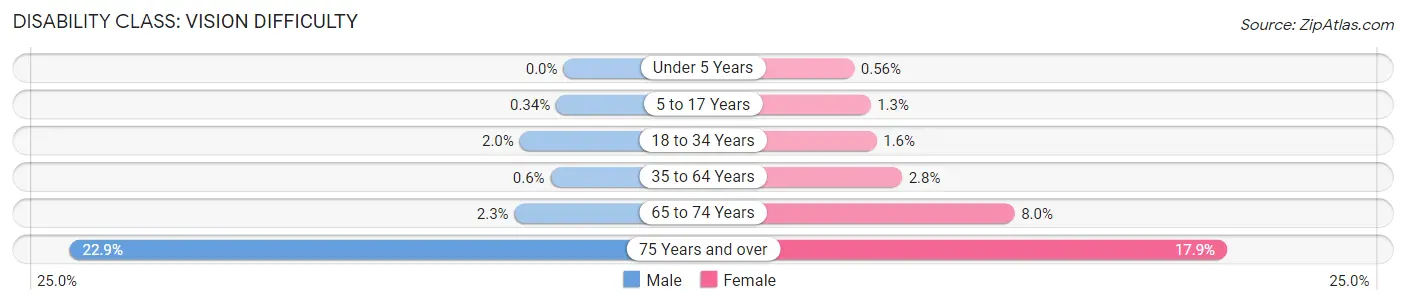
Disability Class: Vision Difficulty
| Age Bracket | Male | Female |
| Under 5 Years | 0 (0.0%) | 7 (0.6%) |
| 5 to 17 Years | 7 (0.3%) | 36 (1.3%) |
| 18 to 34 Years | 80 (2.0%) | 71 (1.6%) |
| 35 to 64 Years | 34 (0.6%) | 160 (2.8%) |
| 65 to 74 Years | 30 (2.3%) | 140 (8.0%) |
| 75 Years and over | 195 (22.9%) | 220 (17.9%) |
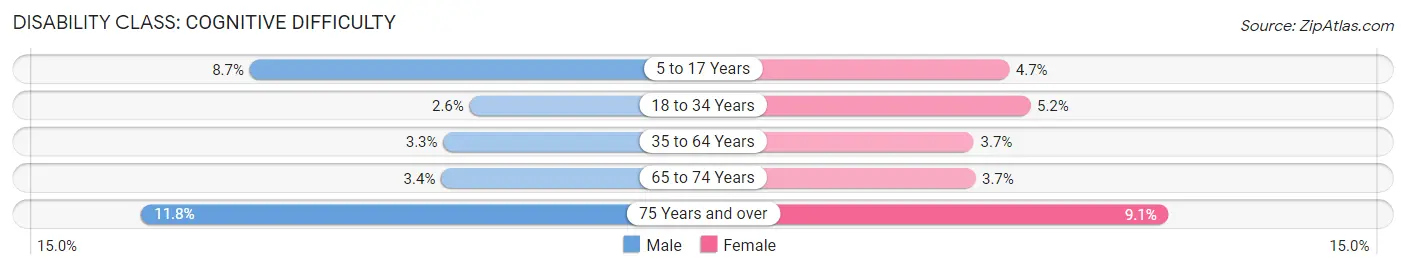
Disability Class: Cognitive Difficulty
| Age Bracket | Male | Female |
| 5 to 17 Years | 180 (8.7%) | 127 (4.6%) |
| 18 to 34 Years | 103 (2.6%) | 232 (5.2%) |
| 35 to 64 Years | 189 (3.3%) | 211 (3.7%) |
| 65 to 74 Years | 45 (3.4%) | 65 (3.7%) |
| 75 Years and over | 100 (11.7%) | 112 (9.1%) |
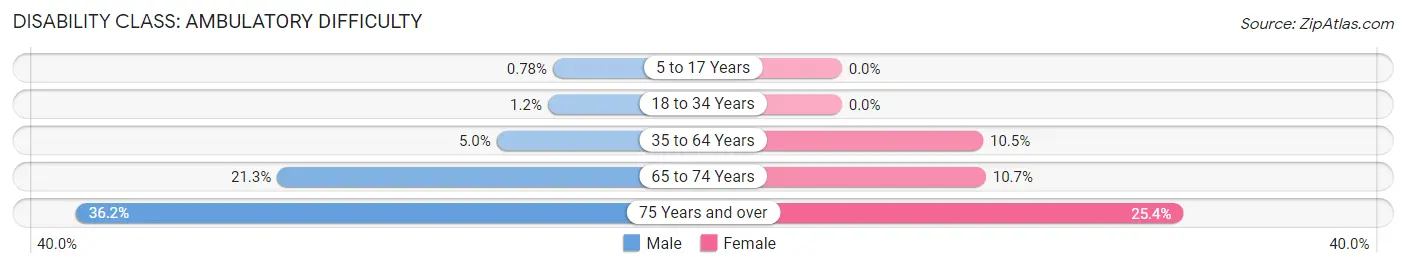
Disability Class: Ambulatory Difficulty
| Age Bracket | Male | Female |
| 5 to 17 Years | 16 (0.8%) | 0 (0.0%) |
| 18 to 34 Years | 46 (1.2%) | 0 (0.0%) |
| 35 to 64 Years | 281 (5.0%) | 604 (10.5%) |
| 65 to 74 Years | 281 (21.3%) | 187 (10.7%) |
| 75 Years and over | 308 (36.2%) | 312 (25.4%) |
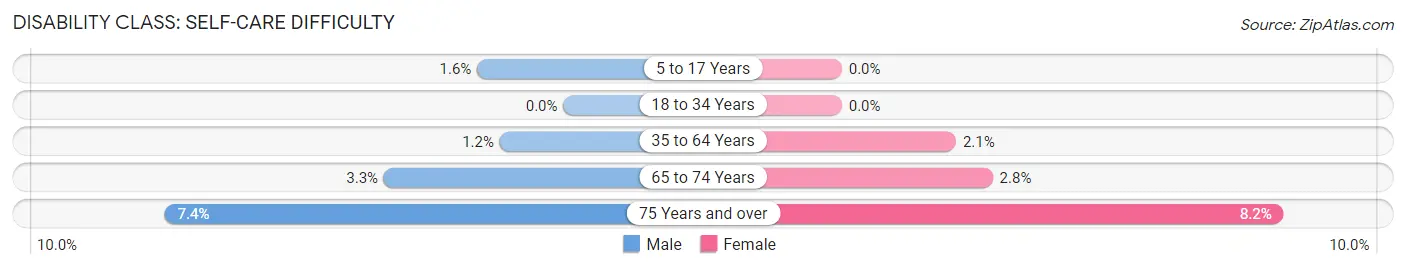
Disability Class: Self-Care Difficulty
| Age Bracket | Male | Female |
| 5 to 17 Years | 33 (1.6%) | 0 (0.0%) |
| 18 to 34 Years | 0 (0.0%) | 0 (0.0%) |
| 35 to 64 Years | 67 (1.2%) | 122 (2.1%) |
| 65 to 74 Years | 44 (3.3%) | 49 (2.8%) |
| 75 Years and over | 63 (7.4%) | 101 (8.2%) |
Technology Access in Long Branch
Computing Device Access in Long Branch
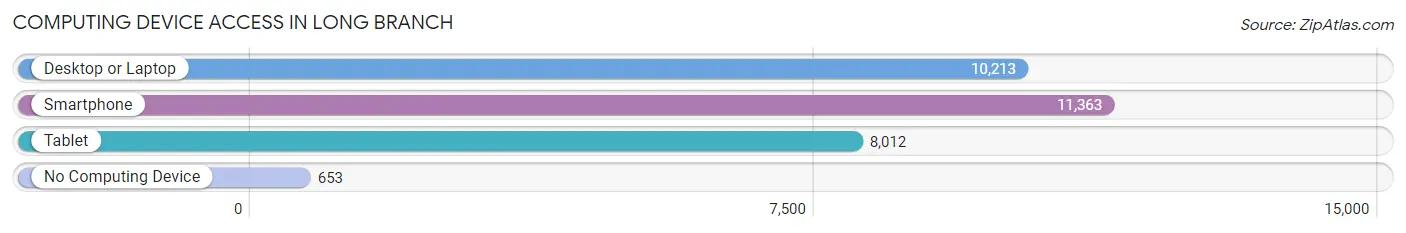
| Device Type | # Households | % Households |
| Desktop or Laptop | 10,213 | 79.7% |
| Smartphone | 11,363 | 88.7% |
| Tablet | 8,012 | 62.5% |
| No Computing Device | 653 | 5.1% |
| Total | 12,813 | 100.0% |
Internet Access in Long Branch
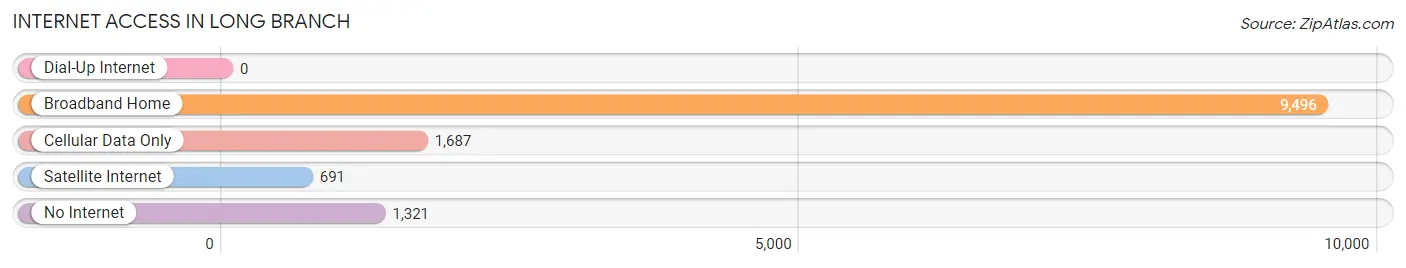
| Internet Type | # Households | % Households |
| Dial-Up Internet | 0 | 0.0% |
| Broadband Home | 9,496 | 74.1% |
| Cellular Data Only | 1,687 | 13.2% |
| Satellite Internet | 691 | 5.4% |
| No Internet | 1,321 | 10.3% |
| Total | 12,813 | 100.0% |
Long Branch Summary
Long Branch is a city located in Monmouth County, New Jersey. It is situated on the Atlantic Ocean, approximately 50 miles south of New York City. The city has a population of approximately 30,000 people and is a popular summer destination for tourists.
History
Long Branch was first settled in 1668 by English settlers. The city was originally known as Branchport, but was later renamed Long Branch in 1867. The city was a popular resort destination in the late 19th century, and was home to many wealthy families. The city was also home to the first boardwalk in the United States, which was built in 1870.
In the early 20th century, Long Branch was a popular destination for the wealthy and famous. President Ulysses S. Grant and President Grover Cleveland both had summer homes in the city. The city was also home to many famous entertainers, including the Marx Brothers, George M. Cohan, and Lillian Russell.
Geography
Long Branch is located in Monmouth County, New Jersey. It is situated on the Atlantic Ocean, approximately 50 miles south of New York City. The city has a total area of 8.3 square miles, of which 7.9 square miles is land and 0.4 square miles is water. The city is bordered by the cities of Asbury Park to the north, Oceanport to the east, and West Long Branch to the south.
Economy
Long Branch’s economy is largely based on tourism and hospitality. The city is home to many hotels, restaurants, and other tourist attractions. The city is also home to several corporate headquarters, including the headquarters of the Monmouth County Board of Realtors.
Demographics
As of the 2010 census, Long Branch had a population of 30,719 people. The racial makeup of the city was 73.3% White, 14.2% African American, 0.3% Native American, 4.2% Asian, 0.1% Pacific Islander, and 7.9% from other races. The median household income was $50,945, and the median family income was $62,813.
Long Branch is a diverse city, with a large Hispanic population. The city is home to many immigrants from Latin America, the Caribbean, and other parts of the world. The city also has a large Jewish population, with many synagogues and Jewish organizations located in the city.
Common Questions
What is Per Capita Income in Long Branch?
Per Capita income in Long Branch is $39,010.
What is the Median Family Income in Long Branch?
Median Family Income in Long Branch is $82,368.
What is the Median Household income in Long Branch?
Median Household Income in Long Branch is $72,234.
What is Income or Wage Gap in Long Branch?
Income or Wage Gap in Long Branch is 35.7%.
Women in Long Branch earn 64.3 cents for every dollar earned by a man.
What is Family Income Deficit in Long Branch?
Family Income Deficit in Long Branch is $13,351.
Families that are below poverty line in Long Branch earn $13,351 less on average than the poverty threshold level.
What is Inequality or Gini Index in Long Branch?
Inequality or Gini Index in Long Branch is 0.48.
What is the Total Population of Long Branch?
Total Population of Long Branch is 31,932.
What is the Total Male Population of Long Branch?
Total Male Population of Long Branch is 14,721.
What is the Total Female Population of Long Branch?
Total Female Population of Long Branch is 17,211.
What is the Ratio of Males per 100 Females in Long Branch?
There are 85.53 Males per 100 Females in Long Branch.
What is the Ratio of Females per 100 Males in Long Branch?
There are 116.91 Females per 100 Males in Long Branch.
What is the Median Population Age in Long Branch?
Median Population Age in Long Branch is 36.5 Years.
What is the Average Family Size in Long Branch
Average Family Size in Long Branch is 3.0 People.
What is the Average Household Size in Long Branch
Average Household Size in Long Branch is 2.5 People.
How Large is the Labor Force in Long Branch?
There are 16,851 People in the Labor Forcein in Long Branch.
What is the Percentage of People in the Labor Force in Long Branch?
65.3% of People are in the Labor Force in Long Branch.
What is the Unemployment Rate in Long Branch?
Unemployment Rate in Long Branch is 7.1%.