Falmouth, MA Map & Demographics
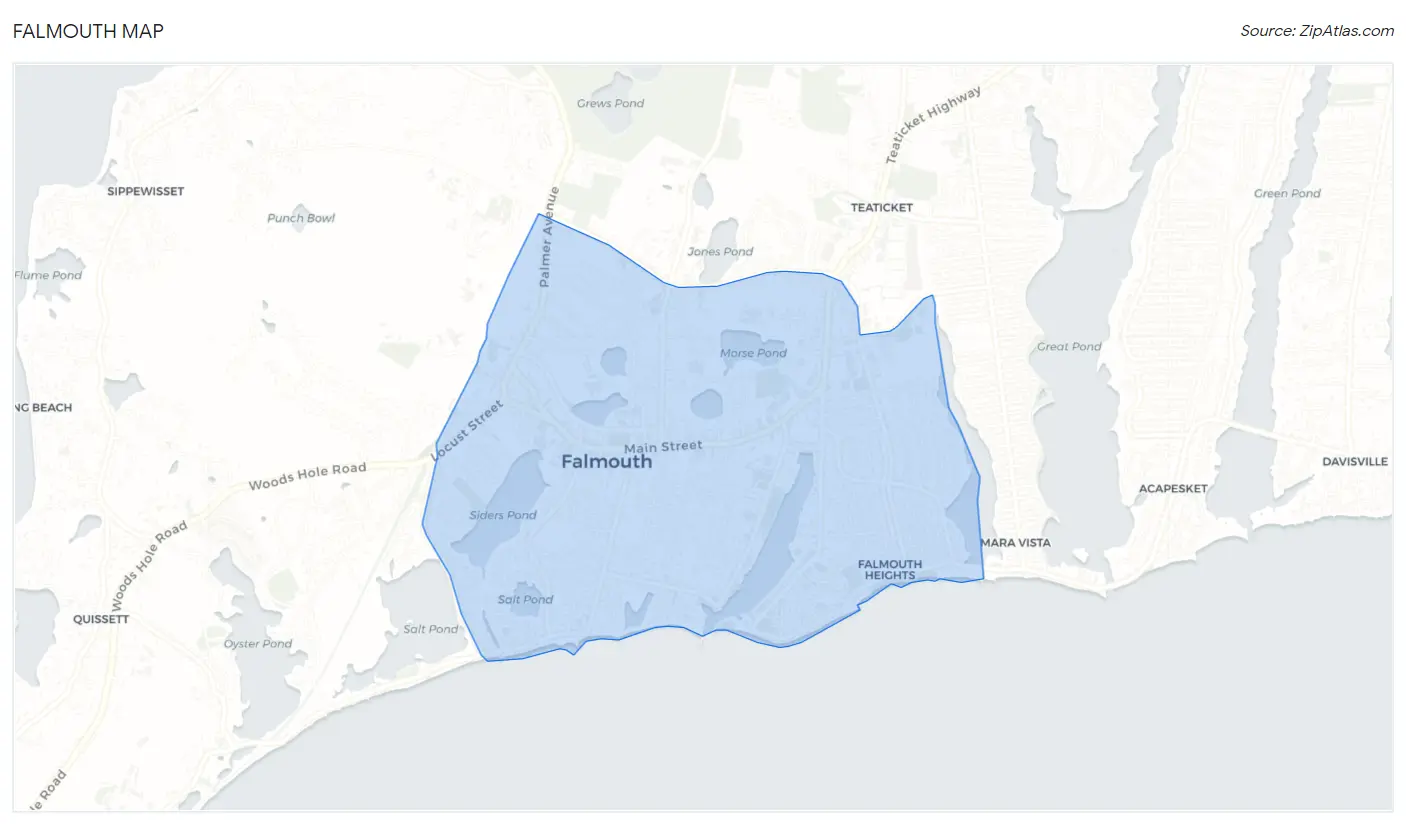
Falmouth Map
Falmouth Overview
$55,259
PER CAPITA INCOME
$110,000
AVG FAMILY INCOME
$57,333
AVG HOUSEHOLD INCOME
5.2%
WAGE / INCOME GAP [ % ]
94.8¢/ $1
WAGE / INCOME GAP [ $ ]
0.56
INEQUALITY / GINI INDEX
3,883
TOTAL POPULATION
1,682
MALE POPULATION
2,201
FEMALE POPULATION
76.42
MALES / 100 FEMALES
130.86
FEMALES / 100 MALES
62.4
MEDIAN AGE
2.5
AVG FAMILY SIZE
1.8
AVG HOUSEHOLD SIZE
1,599
LABOR FORCE [ PEOPLE ]
45.4%
PERCENT IN LABOR FORCE
3.9%
UNEMPLOYMENT RATE
Falmouth Zip Codes
Income in Falmouth
Income Overview in Falmouth
Per Capita Income in Falmouth is $55,259, while median incomes of families and households are $110,000 and $57,333 respectively.
| Characteristic | Number | Measure |
| Per Capita Income | 3,883 | $55,259 |
| Median Family Income | 968 | $110,000 |
| Mean Family Income | 968 | $151,193 |
| Median Household Income | 2,070 | $57,333 |
| Mean Household Income | 2,070 | $99,690 |
| Income Deficit | 968 | $0 |
| Wage / Income Gap (%) | 3,883 | 5.20% |
| Wage / Income Gap ($) | 3,883 | 94.80¢ per $1 |
| Gini / Inequality Index | 3,883 | 0.56 |
Earnings by Sex in Falmouth
Average Earnings in Falmouth are $42,250, $43,688 for men and $41,417 for women, a difference of 5.2%.

| Sex | Number | Average Earnings |
| Male | 763 (45.8%) | $43,688 |
| Female | 904 (54.2%) | $41,417 |
| Total | 1,667 (100.0%) | $42,250 |
Earnings by Sex by Income Bracket in Falmouth
The most common earnings brackets in Falmouth are $100,000+ for men (231 | 30.3%) and $100,000+ for women (187 | 20.7%).
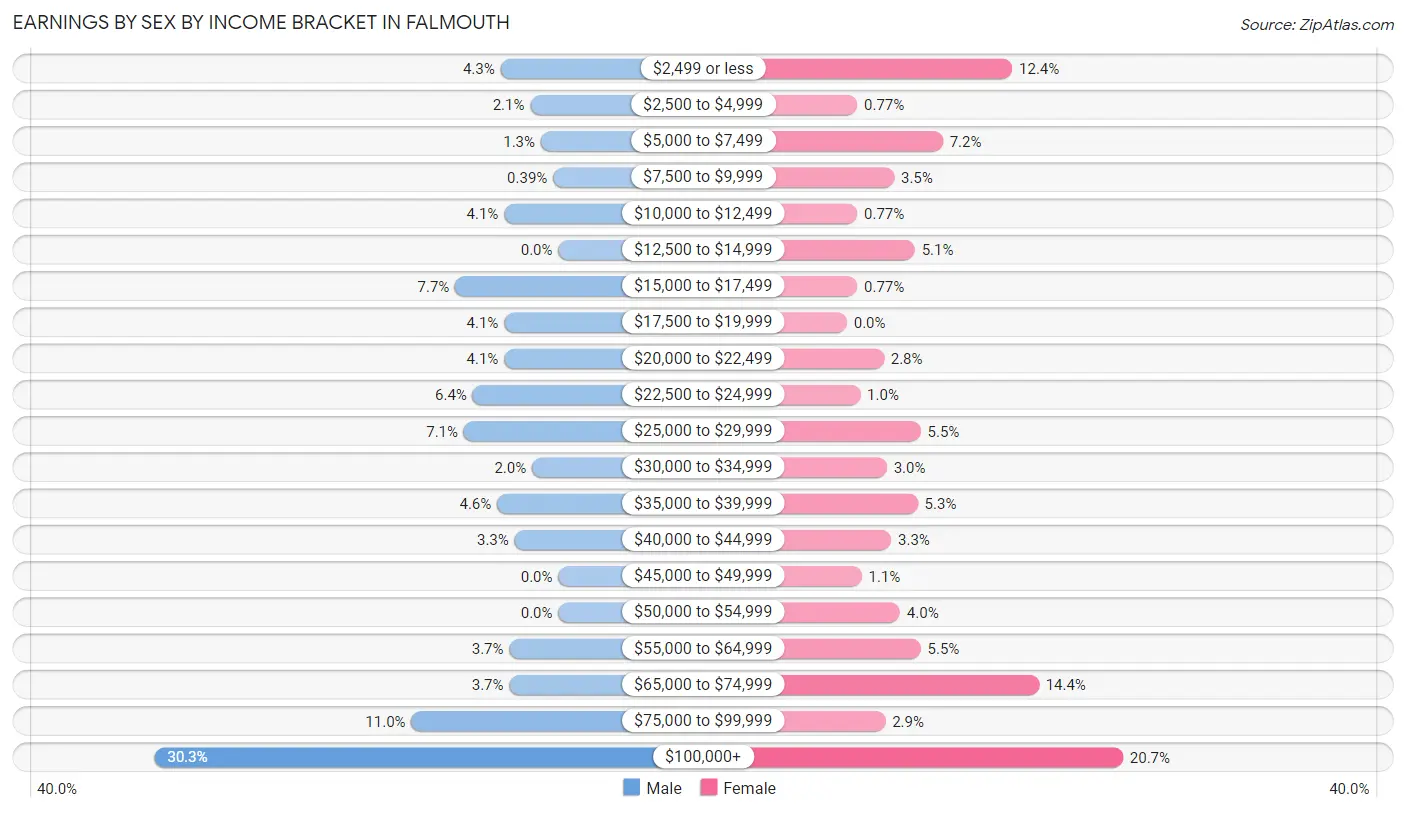
| Income | Male | Female |
| $2,499 or less | 33 (4.3%) | 112 (12.4%) |
| $2,500 to $4,999 | 16 (2.1%) | 7 (0.8%) |
| $5,000 to $7,499 | 10 (1.3%) | 65 (7.2%) |
| $7,500 to $9,999 | 3 (0.4%) | 32 (3.5%) |
| $10,000 to $12,499 | 31 (4.1%) | 7 (0.8%) |
| $12,500 to $14,999 | 0 (0.0%) | 46 (5.1%) |
| $15,000 to $17,499 | 59 (7.7%) | 7 (0.8%) |
| $17,500 to $19,999 | 31 (4.1%) | 0 (0.0%) |
| $20,000 to $22,499 | 31 (4.1%) | 25 (2.8%) |
| $22,500 to $24,999 | 49 (6.4%) | 9 (1.0%) |
| $25,000 to $29,999 | 54 (7.1%) | 50 (5.5%) |
| $30,000 to $34,999 | 15 (2.0%) | 27 (3.0%) |
| $35,000 to $39,999 | 35 (4.6%) | 48 (5.3%) |
| $40,000 to $44,999 | 25 (3.3%) | 30 (3.3%) |
| $45,000 to $49,999 | 0 (0.0%) | 10 (1.1%) |
| $50,000 to $54,999 | 0 (0.0%) | 36 (4.0%) |
| $55,000 to $64,999 | 28 (3.7%) | 50 (5.5%) |
| $65,000 to $74,999 | 28 (3.7%) | 130 (14.4%) |
| $75,000 to $99,999 | 84 (11.0%) | 26 (2.9%) |
| $100,000+ | 231 (30.3%) | 187 (20.7%) |
| Total | 763 (100.0%) | 904 (100.0%) |
Earnings by Sex by Educational Attainment in Falmouth
Average earnings in Falmouth are $65,577 for men and $40,417 for women, a difference of 38.4%. Men with an educational attainment of bachelor's degree enjoy the highest average annual earnings of $135,833, while those with less than high school education earn the least with $16,631. Women with an educational attainment of graduate degree earn the most with the average annual earnings of $102,578, while those with college or associate's degree education have the smallest earnings of $9,141.
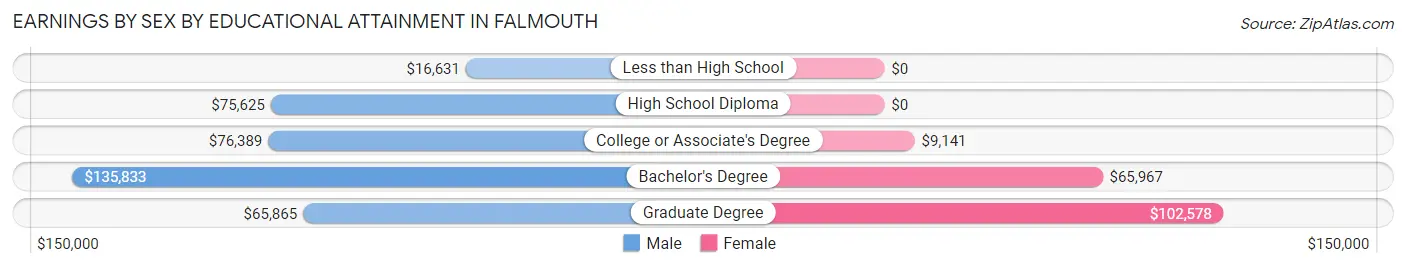
| Educational Attainment | Male Income | Female Income |
| Less than High School | $16,631 | $0 |
| High School Diploma | $75,625 | $0 |
| College or Associate's Degree | $76,389 | $9,141 |
| Bachelor's Degree | $135,833 | $65,967 |
| Graduate Degree | $65,865 | $102,578 |
| Total | $65,577 | $40,417 |
Family Income in Falmouth
Family Income Brackets in Falmouth
According to the Falmouth family income data, there are 271 families falling into the $200,000+ income range, which is the most common income bracket and makes up 28.0% of all families.
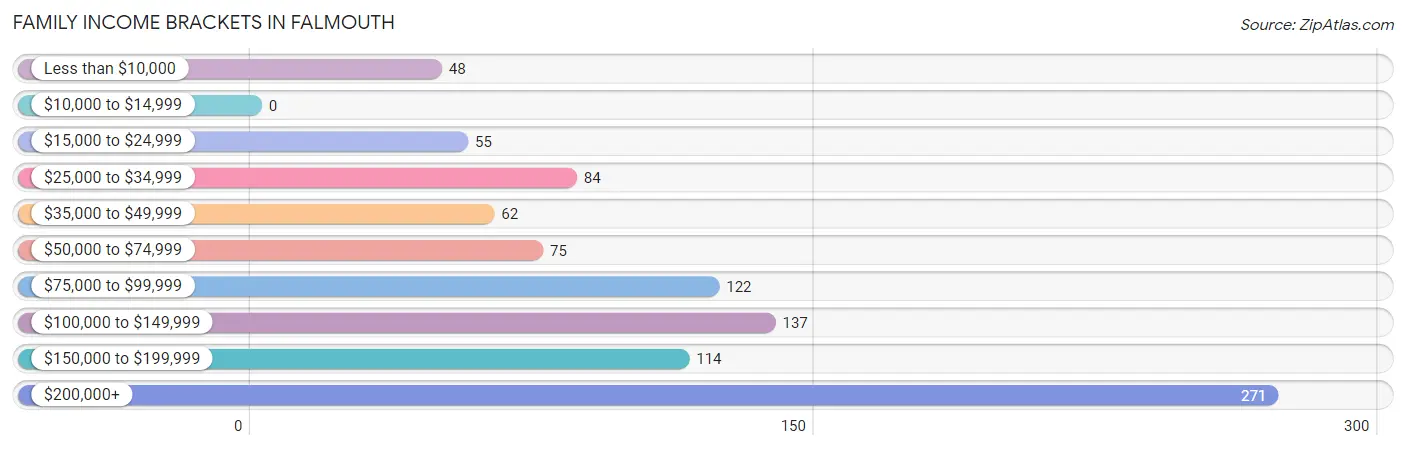
| Income Bracket | # Families | % Families |
| Less than $10,000 | 48 | 5.0% |
| $10,000 to $14,999 | 0 | 0.0% |
| $15,000 to $24,999 | 55 | 5.7% |
| $25,000 to $34,999 | 84 | 8.7% |
| $35,000 to $49,999 | 62 | 6.4% |
| $50,000 to $74,999 | 75 | 7.7% |
| $75,000 to $99,999 | 122 | 12.6% |
| $100,000 to $149,999 | 137 | 14.2% |
| $150,000 to $199,999 | 114 | 11.8% |
| $200,000+ | 271 | 28.0% |
Family Income by Famaliy Size in Falmouth
5-person families (39 | 4.0%) account for the highest median family income in Falmouth with $236,827 per family, while 2-person families (731 | 75.5%) have the highest median income of $56,875 per family member.
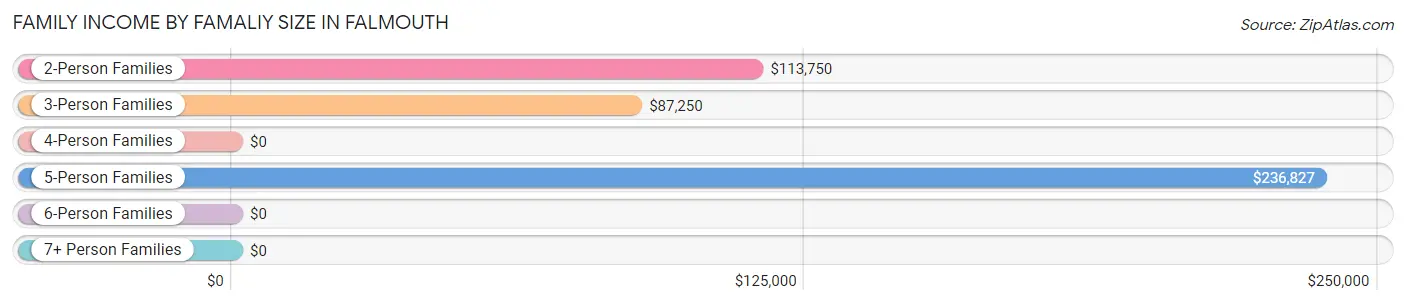
| Income Bracket | # Families | Median Income |
| 2-Person Families | 731 (75.5%) | $113,750 |
| 3-Person Families | 140 (14.5%) | $87,250 |
| 4-Person Families | 51 (5.3%) | $0 |
| 5-Person Families | 39 (4.0%) | $236,827 |
| 6-Person Families | 7 (0.7%) | $0 |
| 7+ Person Families | 0 (0.0%) | $0 |
| Total | 968 (100.0%) | $110,000 |
Family Income by Number of Earners in Falmouth
The median family income in Falmouth is $110,000, with families comprising 2 earners (296) having the highest median family income of $225,093, while families with no earners (291) have the lowest median family income of $56,563, accounting for 30.6% and 30.1% of families, respectively.
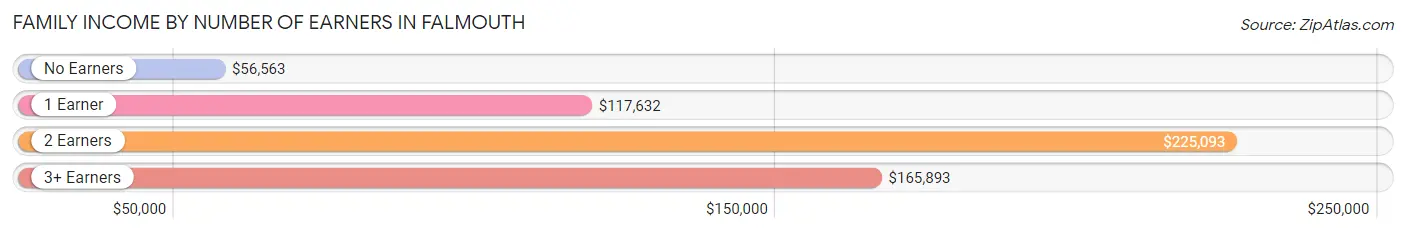
| Number of Earners | # Families | Median Income |
| No Earners | 291 (30.1%) | $56,563 |
| 1 Earner | 344 (35.5%) | $117,632 |
| 2 Earners | 296 (30.6%) | $225,093 |
| 3+ Earners | 37 (3.8%) | $165,893 |
| Total | 968 (100.0%) | $110,000 |
Household Income in Falmouth
Household Income Brackets in Falmouth
With 337 households falling in the category, the $200,000+ income range is the most frequent in Falmouth, accounting for 16.3% of all households. In contrast, only 135 households (6.5%) fall into the $35,000 to $49,999 income bracket, making it the least populous group.
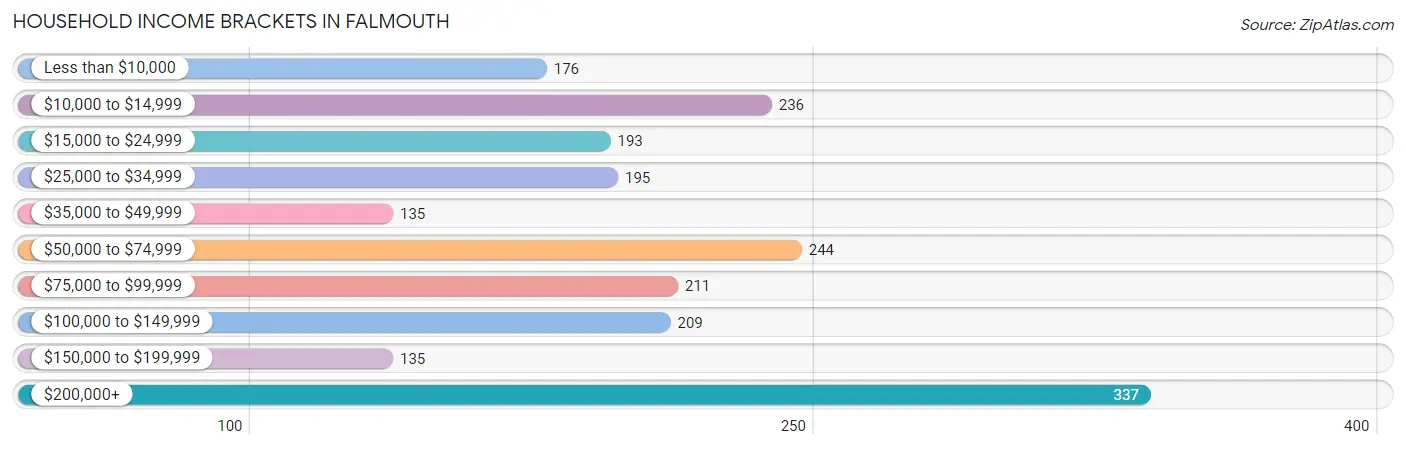
| Income Bracket | # Households | % Households |
| Less than $10,000 | 176 | 8.5% |
| $10,000 to $14,999 | 236 | 11.4% |
| $15,000 to $24,999 | 193 | 9.3% |
| $25,000 to $34,999 | 195 | 9.4% |
| $35,000 to $49,999 | 135 | 6.5% |
| $50,000 to $74,999 | 244 | 11.8% |
| $75,000 to $99,999 | 211 | 10.2% |
| $100,000 to $149,999 | 209 | 10.1% |
| $150,000 to $199,999 | 135 | 6.5% |
| $200,000+ | 337 | 16.3% |
Household Income by Householder Age in Falmouth
The median household income in Falmouth is $57,333, with the highest median household income of $66,196 found in the 45 to 64 years age bracket for the primary householder. A total of 572 households (27.6%) fall into this category. Meanwhile, the 15 to 24 years age bracket for the primary householder has the lowest median household income of $0, with 24 households (1.2%) in this group.
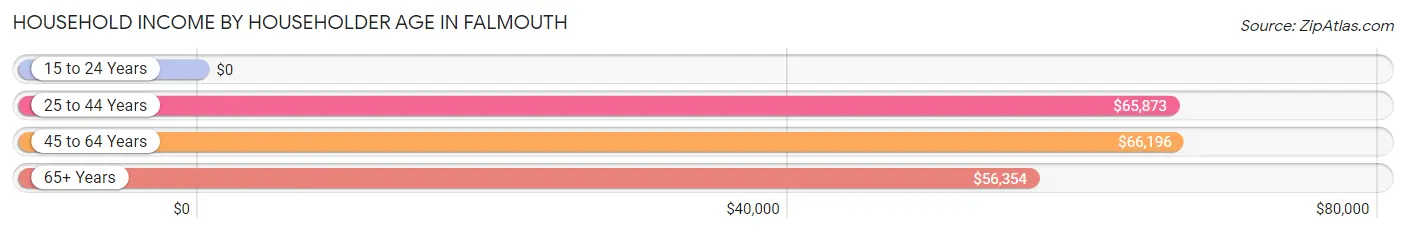
| Income Bracket | # Households | Median Income |
| 15 to 24 Years | 24 (1.2%) | $0 |
| 25 to 44 Years | 345 (16.7%) | $65,873 |
| 45 to 64 Years | 572 (27.6%) | $66,196 |
| 65+ Years | 1,129 (54.5%) | $56,354 |
| Total | 2,070 (100.0%) | $57,333 |
Poverty in Falmouth
Income Below Poverty by Sex and Age in Falmouth
With 19.8% poverty level for males and 22.8% for females among the residents of Falmouth, under 5 year old males and under 5 year old females are the most vulnerable to poverty, with 42 males (100.0%) and 53 females (58.9%) in their respective age groups living below the poverty level.
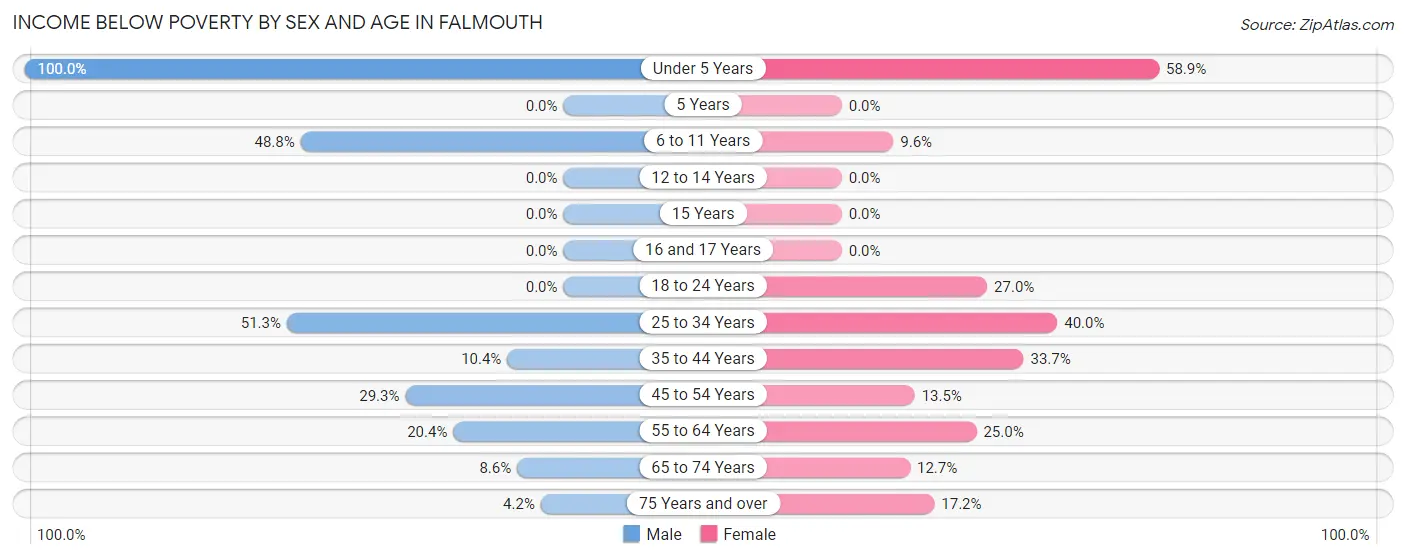
| Age Bracket | Male | Female |
| Under 5 Years | 42 (100.0%) | 53 (58.9%) |
| 5 Years | 0 (0.0%) | 0 (0.0%) |
| 6 to 11 Years | 40 (48.8%) | 9 (9.6%) |
| 12 to 14 Years | 0 (0.0%) | 0 (0.0%) |
| 15 Years | 0 (0.0%) | 0 (0.0%) |
| 16 and 17 Years | 0 (0.0%) | 0 (0.0%) |
| 18 to 24 Years | 0 (0.0%) | 34 (27.0%) |
| 25 to 34 Years | 115 (51.3%) | 96 (40.0%) |
| 35 to 44 Years | 10 (10.4%) | 57 (33.7%) |
| 45 to 54 Years | 22 (29.3%) | 28 (13.5%) |
| 55 to 64 Years | 46 (20.4%) | 76 (25.0%) |
| 65 to 74 Years | 45 (8.6%) | 59 (12.7%) |
| 75 Years and over | 10 (4.2%) | 72 (17.2%) |
| Total | 330 (19.8%) | 484 (22.8%) |
Income Above Poverty by Sex and Age in Falmouth
According to the poverty statistics in Falmouth, males aged 12 to 14 years and females aged 12 to 14 years are the age groups that are most secure financially, with 100.0% of males and 100.0% of females in these age groups living above the poverty line.
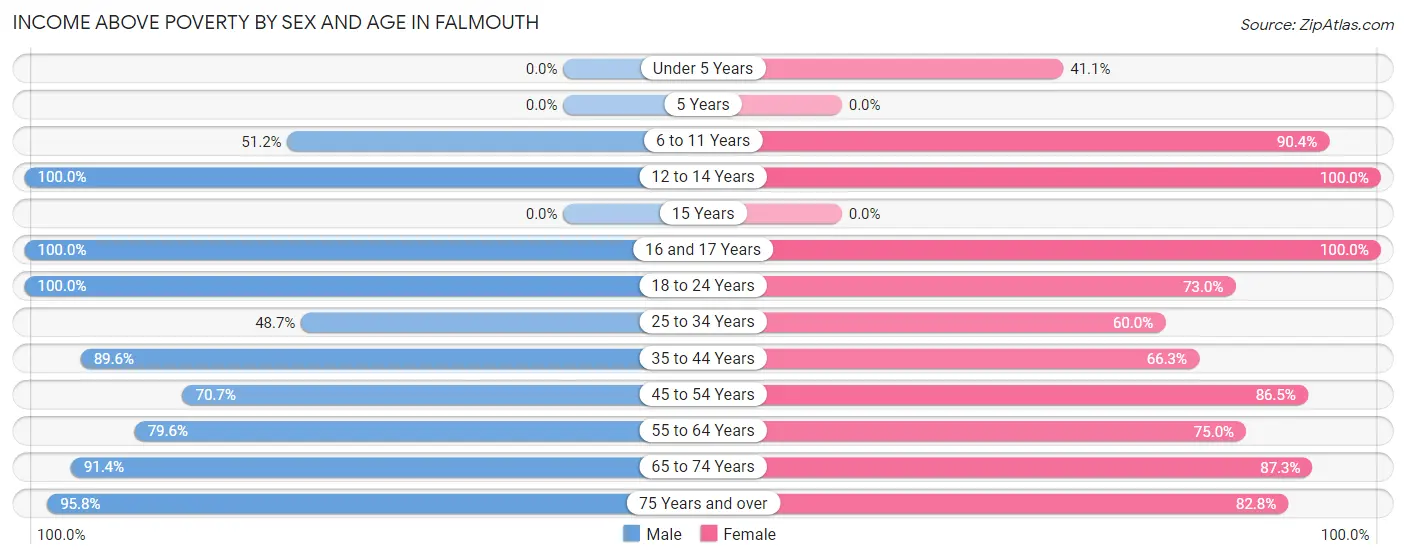
| Age Bracket | Male | Female |
| Under 5 Years | 0 (0.0%) | 37 (41.1%) |
| 5 Years | 0 (0.0%) | 0 (0.0%) |
| 6 to 11 Years | 42 (51.2%) | 85 (90.4%) |
| 12 to 14 Years | 48 (100.0%) | 5 (100.0%) |
| 15 Years | 0 (0.0%) | 0 (0.0%) |
| 16 and 17 Years | 17 (100.0%) | 6 (100.0%) |
| 18 to 24 Years | 94 (100.0%) | 92 (73.0%) |
| 25 to 34 Years | 109 (48.7%) | 144 (60.0%) |
| 35 to 44 Years | 86 (89.6%) | 112 (66.3%) |
| 45 to 54 Years | 53 (70.7%) | 179 (86.5%) |
| 55 to 64 Years | 179 (79.6%) | 228 (75.0%) |
| 65 to 74 Years | 479 (91.4%) | 407 (87.3%) |
| 75 Years and over | 228 (95.8%) | 347 (82.8%) |
| Total | 1,335 (80.2%) | 1,642 (77.2%) |
Income Below Poverty Among Married-Couple Families in Falmouth
The poverty statistics for married-couple families in Falmouth show that 4.6% or 35 of the total 758 families live below the poverty line. Families with 3 or 4 children have the highest poverty rate of 38.5%, comprising of 10 families. On the other hand, families with no children have the lowest poverty rate of 0.0%, which includes 0 families.
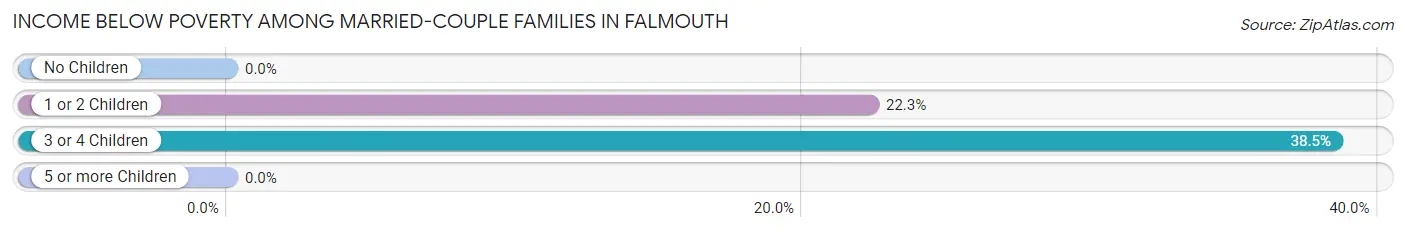
| Children | Above Poverty | Below Poverty |
| No Children | 620 (100.0%) | 0 (0.0%) |
| 1 or 2 Children | 87 (77.7%) | 25 (22.3%) |
| 3 or 4 Children | 16 (61.5%) | 10 (38.5%) |
| 5 or more Children | 0 (0.0%) | 0 (0.0%) |
| Total | 723 (95.4%) | 35 (4.6%) |
Income Below Poverty Among Single-Parent Households in Falmouth
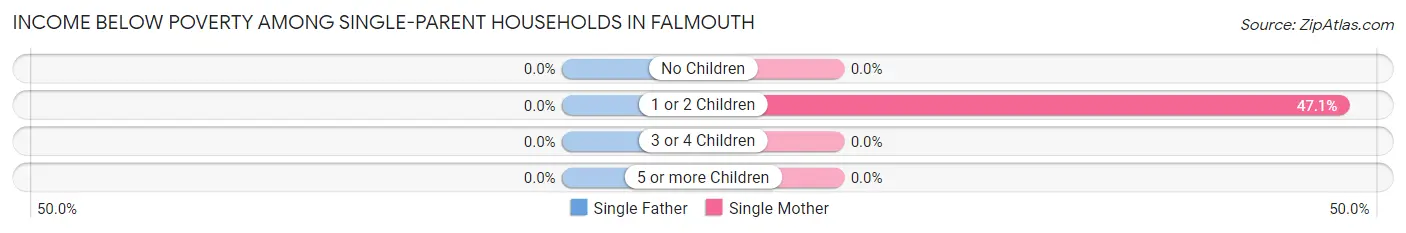
| Children | Single Father | Single Mother |
| No Children | 0 (0.0%) | 0 (0.0%) |
| 1 or 2 Children | 0 (0.0%) | 48 (47.1%) |
| 3 or 4 Children | 0 (0.0%) | 0 (0.0%) |
| 5 or more Children | 0 (0.0%) | 0 (0.0%) |
| Total | 0 (0.0%) | 48 (26.2%) |
Income Below Poverty Among Married-Couple vs Single-Parent Households in Falmouth
The poverty data for Falmouth shows that 35 of the married-couple family households (4.6%) and 48 of the single-parent households (22.9%) are living below the poverty level. Within the married-couple family households, those with 3 or 4 children have the highest poverty rate, with 10 households (38.5%) falling below the poverty line. Among the single-parent households, those with 1 or 2 children have the highest poverty rate, with 48 household (43.2%) living below poverty.
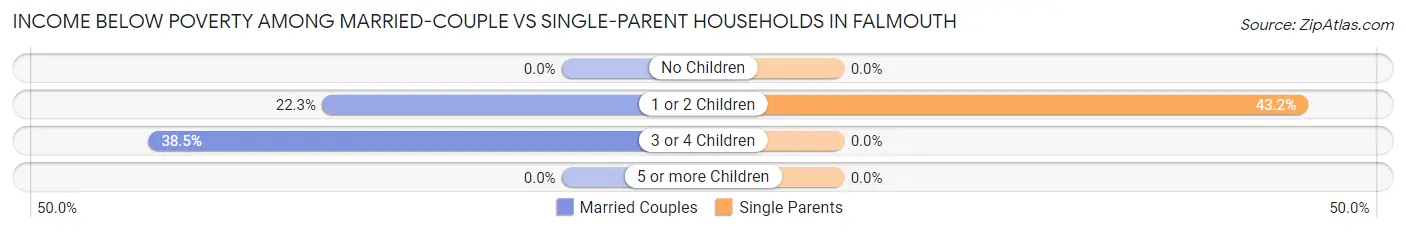
| Children | Married-Couple Families | Single-Parent Households |
| No Children | 0 (0.0%) | 0 (0.0%) |
| 1 or 2 Children | 25 (22.3%) | 48 (43.2%) |
| 3 or 4 Children | 10 (38.5%) | 0 (0.0%) |
| 5 or more Children | 0 (0.0%) | 0 (0.0%) |
| Total | 35 (4.6%) | 48 (22.9%) |
Race in Falmouth
The most populous races in Falmouth are White / Caucasian (3,214 | 82.8%), Two or more Races (344 | 8.9%), and Hispanic or Latino (128 | 3.3%).
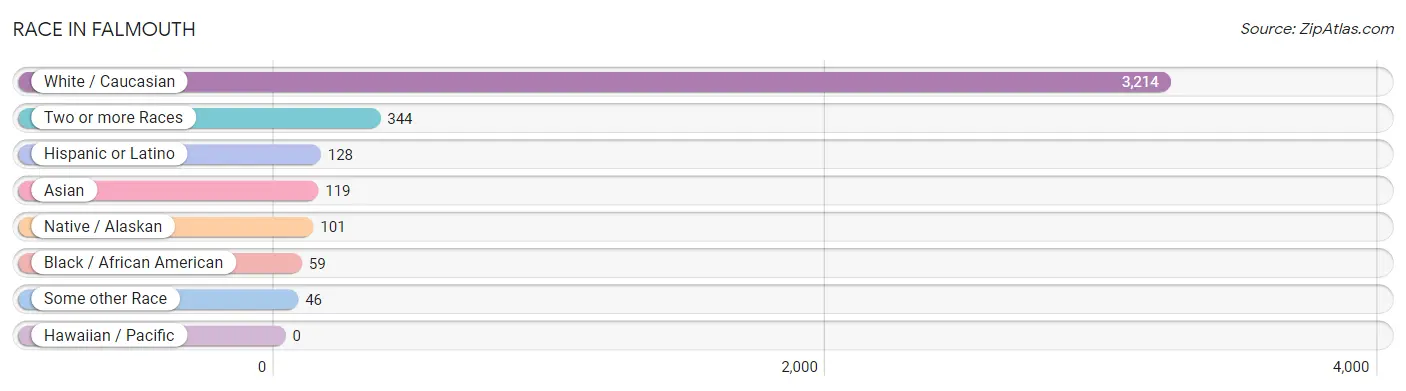
| Race | # Population | % Population |
| Asian | 119 | 3.1% |
| Black / African American | 59 | 1.5% |
| Hawaiian / Pacific | 0 | 0.0% |
| Hispanic or Latino | 128 | 3.3% |
| Native / Alaskan | 101 | 2.6% |
| White / Caucasian | 3,214 | 82.8% |
| Two or more Races | 344 | 8.9% |
| Some other Race | 46 | 1.2% |
| Total | 3,883 | 100.0% |
Ancestry in Falmouth
The most populous ancestries reported in Falmouth are Irish (929 | 23.9%), English (698 | 18.0%), Italian (293 | 7.5%), German (277 | 7.1%), and Scottish (230 | 5.9%), together accounting for 62.5% of all Falmouth residents.
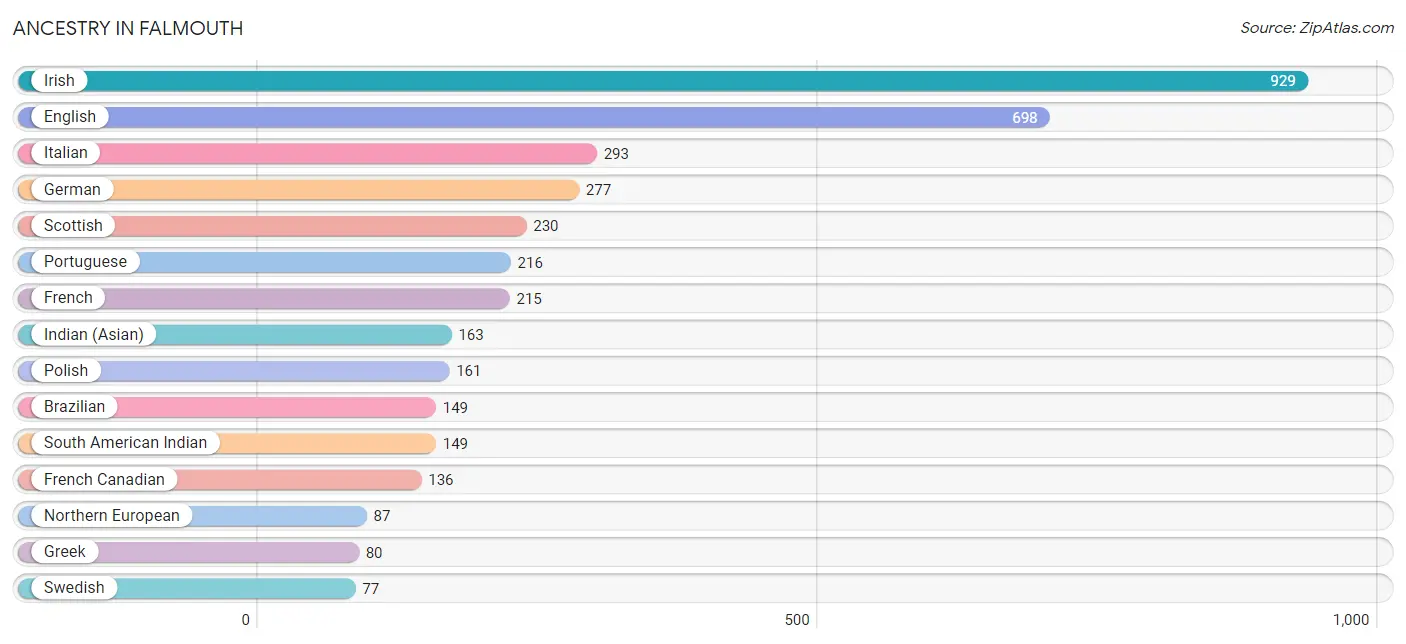
| Ancestry | # Population | % Population |
| American | 76 | 2.0% |
| Arab | 45 | 1.2% |
| Armenian | 15 | 0.4% |
| Austrian | 10 | 0.3% |
| Brazilian | 149 | 3.8% |
| British | 34 | 0.9% |
| Burmese | 20 | 0.5% |
| Canadian | 11 | 0.3% |
| Cape Verdean | 11 | 0.3% |
| Cuban | 51 | 1.3% |
| Czech | 9 | 0.2% |
| Danish | 10 | 0.3% |
| Dominican | 12 | 0.3% |
| Dutch | 34 | 0.9% |
| Eastern European | 15 | 0.4% |
| Ecuadorian | 21 | 0.5% |
| English | 698 | 18.0% |
| European | 39 | 1.0% |
| Finnish | 15 | 0.4% |
| French | 215 | 5.5% |
| French Canadian | 136 | 3.5% |
| German | 277 | 7.1% |
| Greek | 80 | 2.1% |
| Hungarian | 6 | 0.2% |
| Indian (Asian) | 163 | 4.2% |
| Irish | 929 | 23.9% |
| Italian | 293 | 7.5% |
| Mexican | 29 | 0.7% |
| Moroccan | 45 | 1.2% |
| Native Hawaiian | 29 | 0.7% |
| Northern European | 87 | 2.2% |
| Norwegian | 47 | 1.2% |
| Polish | 161 | 4.2% |
| Portuguese | 216 | 5.6% |
| Puerto Rican | 6 | 0.2% |
| Russian | 47 | 1.2% |
| Scandinavian | 10 | 0.3% |
| Scotch-Irish | 15 | 0.4% |
| Scottish | 230 | 5.9% |
| Slovak | 16 | 0.4% |
| South American | 21 | 0.5% |
| South American Indian | 149 | 3.8% |
| Subsaharan African | 11 | 0.3% |
| Swedish | 77 | 2.0% | View All 44 Rows |
Immigrants in Falmouth
The most numerous immigrant groups reported in Falmouth came from Europe (205 | 5.3%), Northern Europe (153 | 3.9%), Latin America (148 | 3.8%), Brazil (141 | 3.6%), and South America (141 | 3.6%), together accounting for 20.3% of all Falmouth residents.
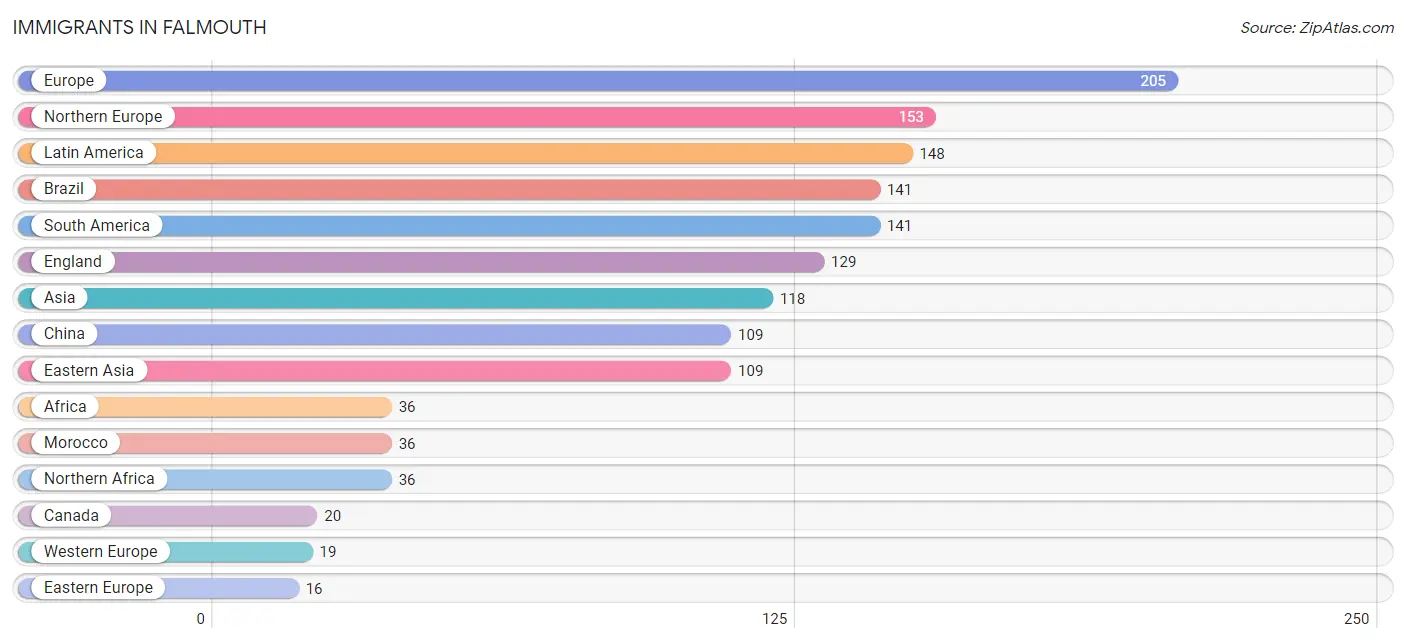
| Immigration Origin | # Population | % Population |
| Africa | 36 | 0.9% |
| Asia | 118 | 3.0% |
| Brazil | 141 | 3.6% |
| Canada | 20 | 0.5% |
| Caribbean | 7 | 0.2% |
| China | 109 | 2.8% |
| Eastern Asia | 109 | 2.8% |
| Eastern Europe | 16 | 0.4% |
| England | 129 | 3.3% |
| Europe | 205 | 5.3% |
| France | 9 | 0.2% |
| Germany | 10 | 0.3% |
| Hungary | 8 | 0.2% |
| Iran | 9 | 0.2% |
| Latin America | 148 | 3.8% |
| Morocco | 36 | 0.9% |
| Northern Africa | 36 | 0.9% |
| Northern Europe | 153 | 3.9% |
| Poland | 8 | 0.2% |
| Portugal | 14 | 0.4% |
| South America | 141 | 3.6% |
| South Central Asia | 9 | 0.2% |
| Southern Europe | 14 | 0.4% |
| Trinidad and Tobago | 7 | 0.2% |
| Western Europe | 19 | 0.5% | View All 25 Rows |
Sex and Age in Falmouth
Sex and Age in Falmouth
The most populous age groups in Falmouth are 65 to 69 Years (271 | 16.1%) for men and 70 to 74 Years (274 | 12.4%) for women.
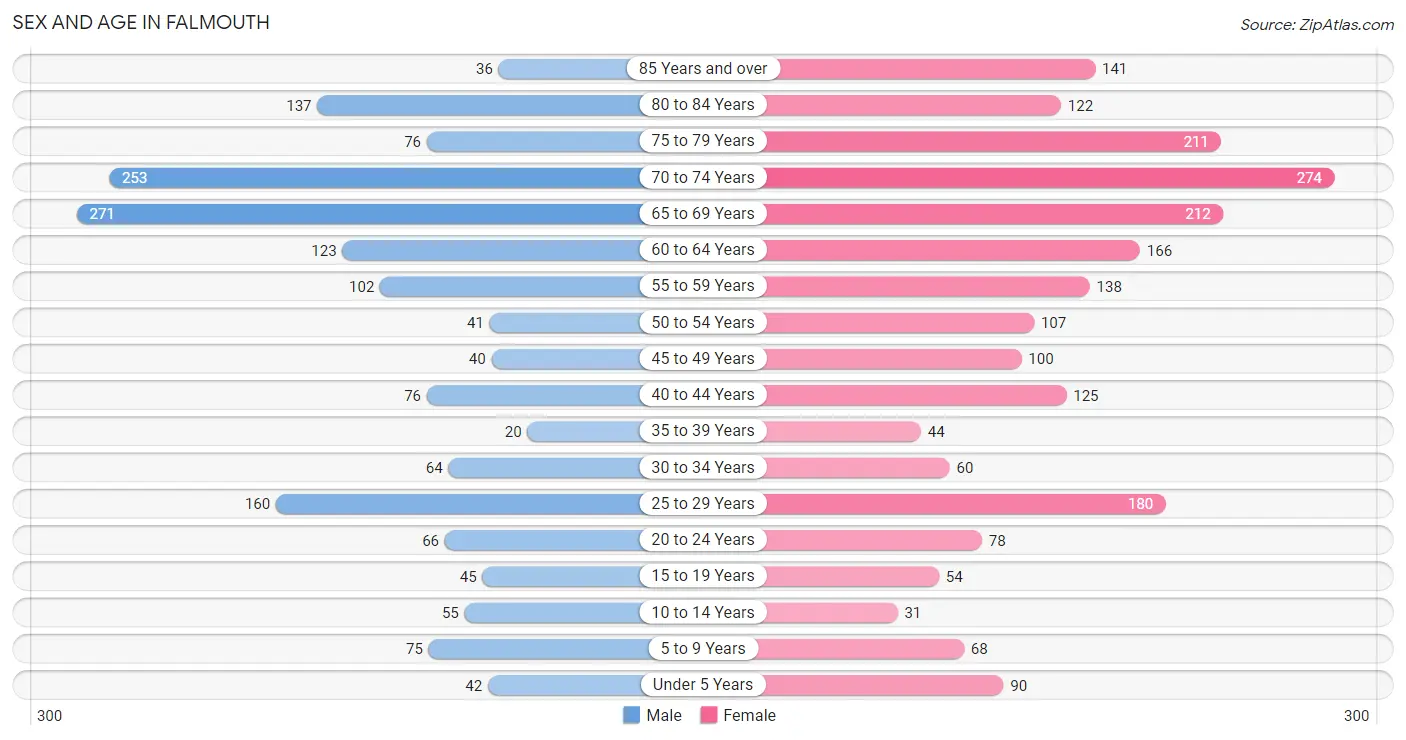
| Age Bracket | Male | Female |
| Under 5 Years | 42 (2.5%) | 90 (4.1%) |
| 5 to 9 Years | 75 (4.5%) | 68 (3.1%) |
| 10 to 14 Years | 55 (3.3%) | 31 (1.4%) |
| 15 to 19 Years | 45 (2.7%) | 54 (2.5%) |
| 20 to 24 Years | 66 (3.9%) | 78 (3.5%) |
| 25 to 29 Years | 160 (9.5%) | 180 (8.2%) |
| 30 to 34 Years | 64 (3.8%) | 60 (2.7%) |
| 35 to 39 Years | 20 (1.2%) | 44 (2.0%) |
| 40 to 44 Years | 76 (4.5%) | 125 (5.7%) |
| 45 to 49 Years | 40 (2.4%) | 100 (4.5%) |
| 50 to 54 Years | 41 (2.4%) | 107 (4.9%) |
| 55 to 59 Years | 102 (6.1%) | 138 (6.3%) |
| 60 to 64 Years | 123 (7.3%) | 166 (7.5%) |
| 65 to 69 Years | 271 (16.1%) | 212 (9.6%) |
| 70 to 74 Years | 253 (15.0%) | 274 (12.4%) |
| 75 to 79 Years | 76 (4.5%) | 211 (9.6%) |
| 80 to 84 Years | 137 (8.2%) | 122 (5.5%) |
| 85 Years and over | 36 (2.1%) | 141 (6.4%) |
| Total | 1,682 (100.0%) | 2,201 (100.0%) |
Families and Households in Falmouth
Median Family Size in Falmouth
The median family size in Falmouth is 2.55 persons per family, with single female/mother families (183 | 18.9%) accounting for the largest median family size of 2.63 persons per family. On the other hand, married-couple families (758 | 78.3%) represent the smallest median family size with 2.53 persons per family.
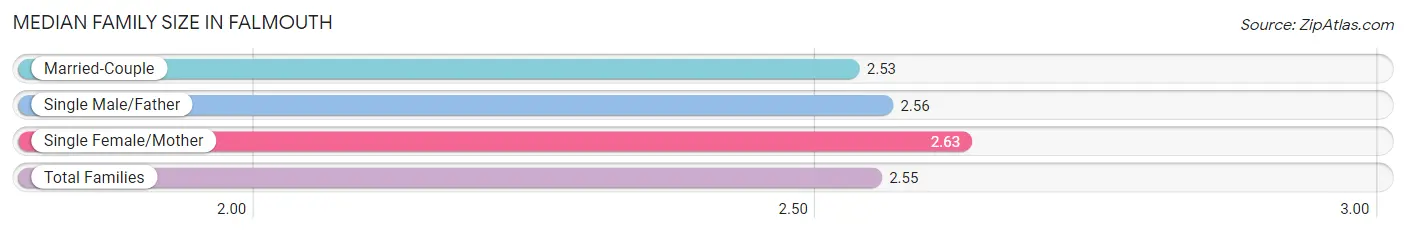
| Family Type | # Families | Family Size |
| Married-Couple | 758 (78.3%) | 2.53 |
| Single Male/Father | 27 (2.8%) | 2.56 |
| Single Female/Mother | 183 (18.9%) | 2.63 |
| Total Families | 968 (100.0%) | 2.55 |
Median Household Size in Falmouth
The median household size in Falmouth is 1.82 persons per household, with single female/mother households (183 | 8.8%) accounting for the largest median household size of 2.67 persons per household. non-family households (1,102 | 53.2%) represent the smallest median household size with 1.17 persons per household.
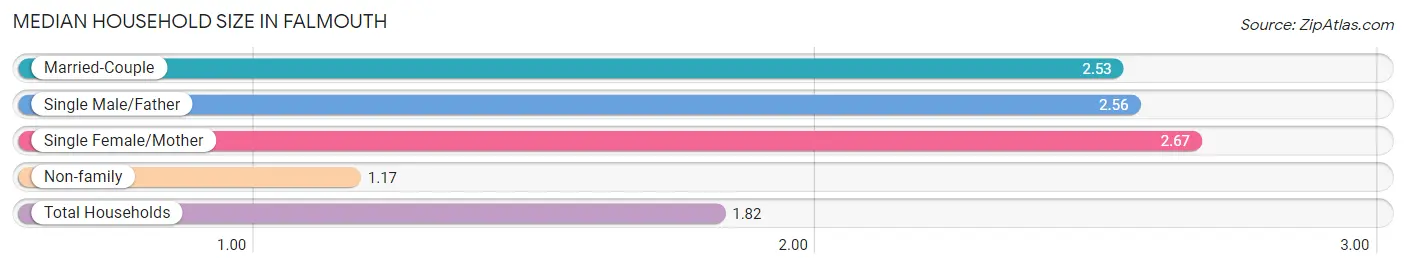
| Household Type | # Households | Household Size |
| Married-Couple | 758 (36.6%) | 2.53 |
| Single Male/Father | 27 (1.3%) | 2.56 |
| Single Female/Mother | 183 (8.8%) | 2.67 |
| Non-family | 1,102 (53.2%) | 1.17 |
| Total Households | 2,070 (100.0%) | 1.82 |
Household Size by Marriage Status in Falmouth
Out of a total of 2,070 households in Falmouth, 968 (46.8%) are family households, while 1,102 (53.2%) are nonfamily households. The most numerous type of family households are 2-person households, comprising 725, and the most common type of nonfamily households are 1-person households, comprising 1,023.
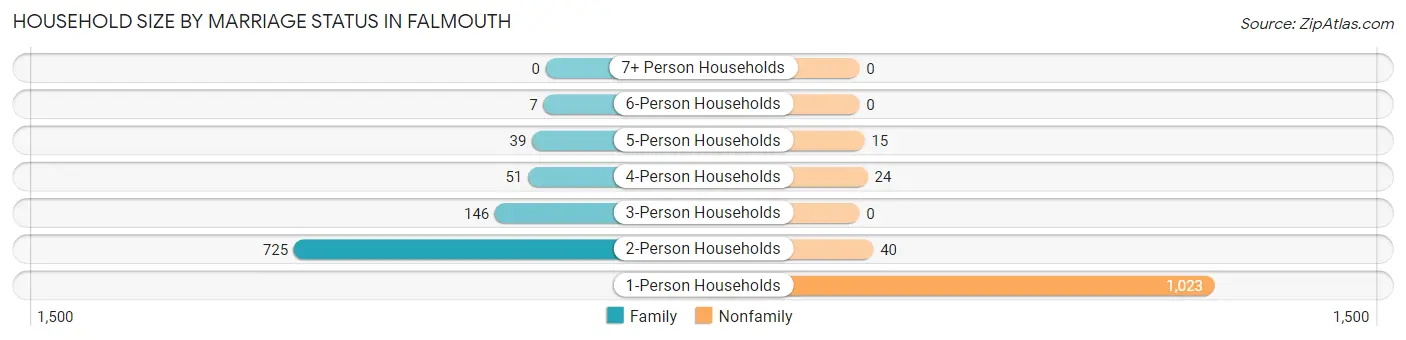
| Household Size | Family Households | Nonfamily Households |
| 1-Person Households | - | 1,023 (49.4%) |
| 2-Person Households | 725 (35.0%) | 40 (1.9%) |
| 3-Person Households | 146 (7.0%) | 0 (0.0%) |
| 4-Person Households | 51 (2.5%) | 24 (1.2%) |
| 5-Person Households | 39 (1.9%) | 15 (0.7%) |
| 6-Person Households | 7 (0.3%) | 0 (0.0%) |
| 7+ Person Households | 0 (0.0%) | 0 (0.0%) |
| Total | 968 (46.8%) | 1,102 (53.2%) |
Female Fertility in Falmouth
Fertility by Age in Falmouth
Average fertility rate in Falmouth is 58.0 births per 1,000 women. Women in the age bracket of 20 to 34 years have the highest fertility rate with 79.0 births per 1,000 women. Women in the age bracket of 20 to 34 years acount for 64.1% of all women with births.
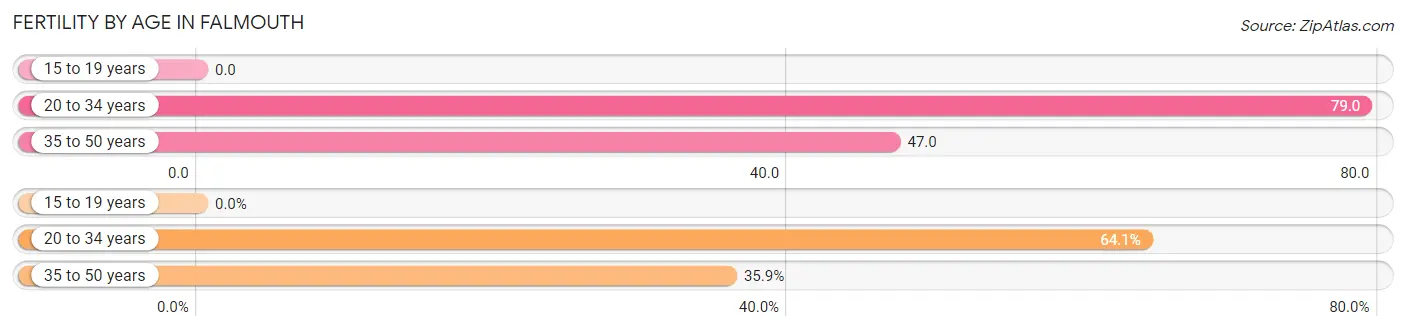
| Age Bracket | Women with Births | Births / 1,000 Women |
| 15 to 19 years | 0 (0.0%) | 0.0 |
| 20 to 34 years | 25 (64.1%) | 79.0 |
| 35 to 50 years | 14 (35.9%) | 47.0 |
| Total | 39 (100.0%) | 58.0 |
Fertility by Age by Marriage Status in Falmouth
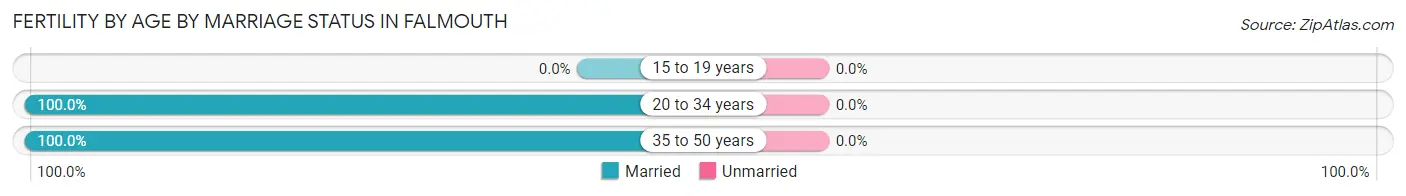
| Age Bracket | Married | Unmarried |
| 15 to 19 years | 0 (0.0%) | 0 (0.0%) |
| 20 to 34 years | 25 (100.0%) | 0 (0.0%) |
| 35 to 50 years | 14 (100.0%) | 0 (0.0%) |
| Total | 39 (100.0%) | 0 (0.0%) |
Fertility by Education in Falmouth
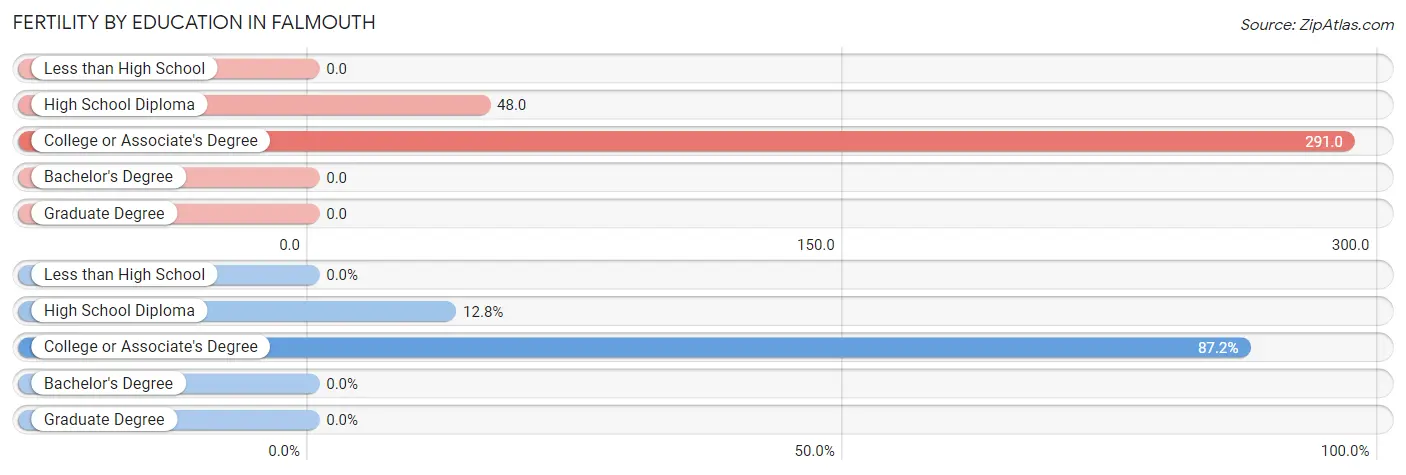
| Educational Attainment | Women with Births | Births / 1,000 Women |
| Less than High School | 0 (0.0%) | 0.0 |
| High School Diploma | 5 (12.8%) | 48.0 |
| College or Associate's Degree | 34 (87.2%) | 291.0 |
| Bachelor's Degree | 0 (0.0%) | 0.0 |
| Graduate Degree | 0 (0.0%) | 0.0 |
| Total | 39 (100.0%) | 58.0 |
Fertility by Education by Marriage Status in Falmouth
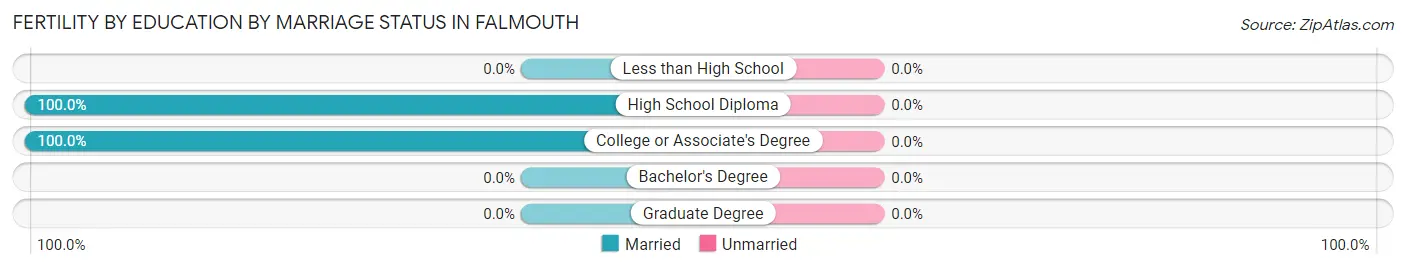
| Educational Attainment | Married | Unmarried |
| Less than High School | 0 (0.0%) | 0 (0.0%) |
| High School Diploma | 5 (100.0%) | 0 (0.0%) |
| College or Associate's Degree | 34 (100.0%) | 0 (0.0%) |
| Bachelor's Degree | 0 (0.0%) | 0 (0.0%) |
| Graduate Degree | 0 (0.0%) | 0 (0.0%) |
| Total | 39 (100.0%) | 0 (0.0%) |
Employment Characteristics in Falmouth
Employment by Class of Employer in Falmouth
Among the 1,522 employed individuals in Falmouth, private company employees (791 | 52.0%), not-for-profit organizations (319 | 21.0%), and self-employed (not incorporated) (188 | 12.3%) make up the most common classes of employment.
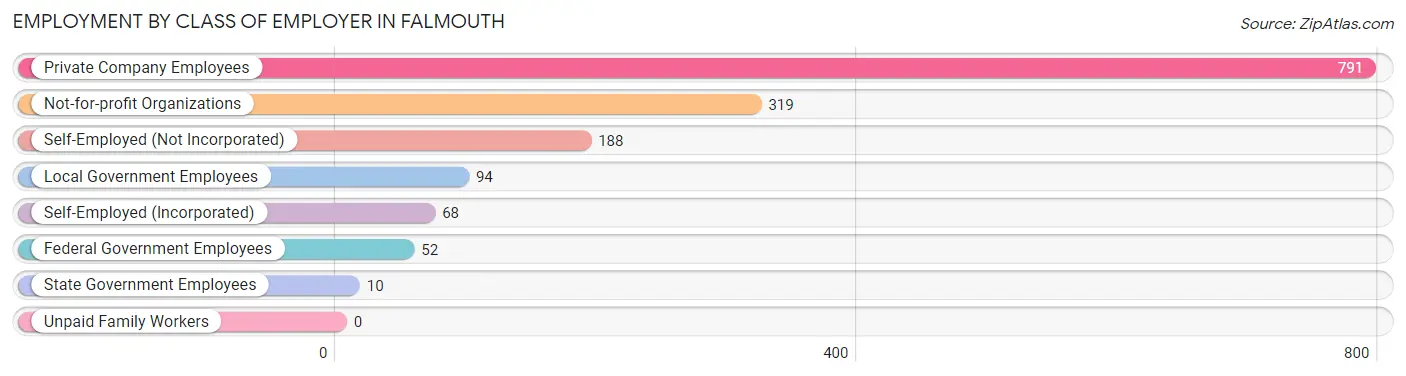
| Employer Class | # Employees | % Employees |
| Private Company Employees | 791 | 52.0% |
| Self-Employed (Incorporated) | 68 | 4.5% |
| Self-Employed (Not Incorporated) | 188 | 12.3% |
| Not-for-profit Organizations | 319 | 21.0% |
| Local Government Employees | 94 | 6.2% |
| State Government Employees | 10 | 0.7% |
| Federal Government Employees | 52 | 3.4% |
| Unpaid Family Workers | 0 | 0.0% |
| Total | 1,522 | 100.0% |
Employment Status by Age in Falmouth
According to the labor force statistics for Falmouth, out of the total population over 16 years of age (3,522), 45.4% or 1,599 individuals are in the labor force, with 3.9% or 62 of them unemployed. The age group with the highest labor force participation rate is 45 to 54 years, with 84.7% or 244 individuals in the labor force. Within the labor force, the 60 to 64 years age range has the highest percentage of unemployed individuals, with 9.7% or 17 of them being unemployed.
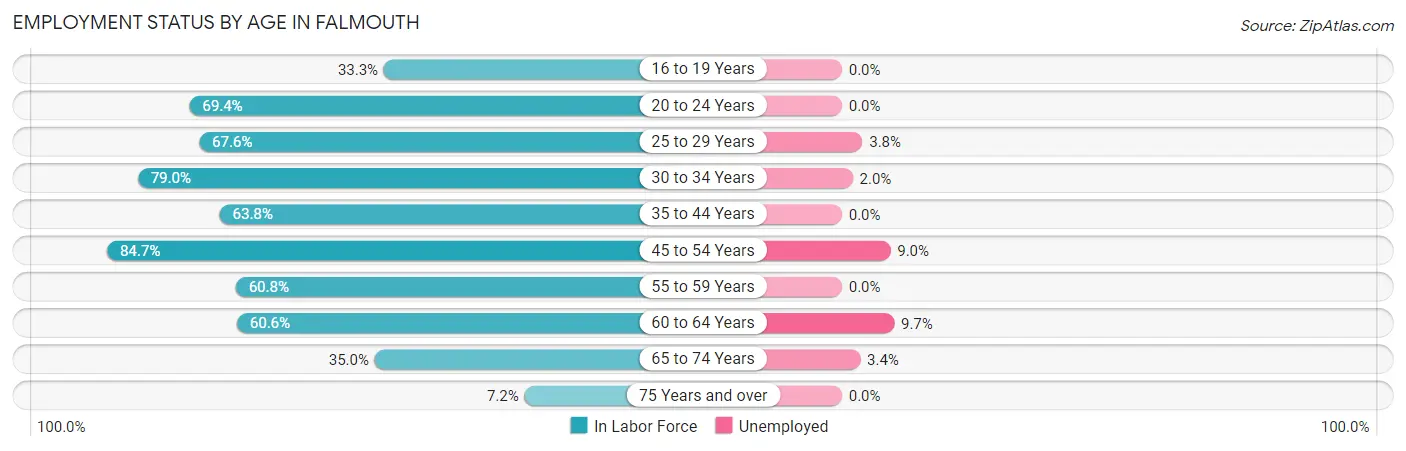
| Age Bracket | In Labor Force | Unemployed |
| 16 to 19 Years | 33 (33.3%) | 0 (0.0%) |
| 20 to 24 Years | 100 (69.4%) | 0 (0.0%) |
| 25 to 29 Years | 230 (67.6%) | 9 (3.8%) |
| 30 to 34 Years | 98 (79.0%) | 2 (2.0%) |
| 35 to 44 Years | 169 (63.8%) | 0 (0.0%) |
| 45 to 54 Years | 244 (84.7%) | 22 (9.0%) |
| 55 to 59 Years | 146 (60.8%) | 0 (0.0%) |
| 60 to 64 Years | 175 (60.6%) | 17 (9.7%) |
| 65 to 74 Years | 354 (35.0%) | 12 (3.4%) |
| 75 Years and over | 52 (7.2%) | 0 (0.0%) |
| Total | 1,599 (45.4%) | 62 (3.9%) |
Employment Status by Educational Attainment in Falmouth
According to labor force statistics for Falmouth, 68.7% of individuals (1,062) out of the total population between 25 and 64 years of age (1,546) are in the labor force, with 4.7% or 50 of them being unemployed. The group with the highest labor force participation rate are those with the educational attainment of bachelor's degree or higher, with 82.2% or 617 individuals in the labor force. Within the labor force, individuals with bachelor's degree or higher education have the highest percentage of unemployment, with 7.6% or 47 of them being unemployed.
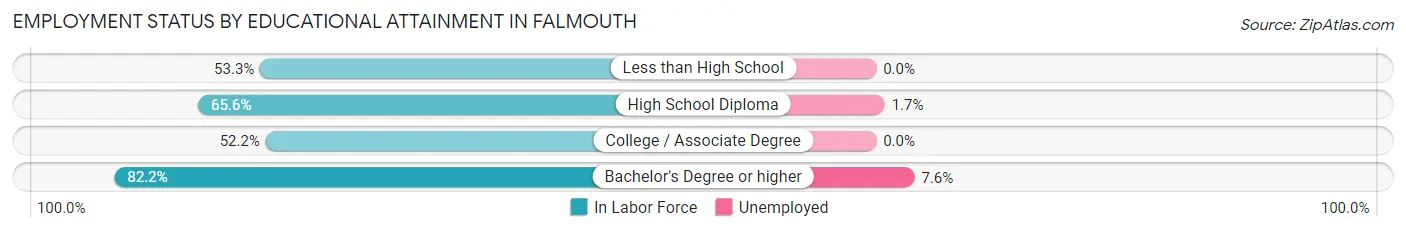
| Educational Attainment | In Labor Force | Unemployed |
| Less than High School | 106 (53.3%) | 0 (0.0%) |
| High School Diploma | 137 (65.6%) | 4 (1.7%) |
| College / Associate Degree | 202 (52.2%) | 0 (0.0%) |
| Bachelor's Degree or higher | 617 (82.2%) | 57 (7.6%) |
| Total | 1,062 (68.7%) | 73 (4.7%) |
Employment Occupations by Sex in Falmouth
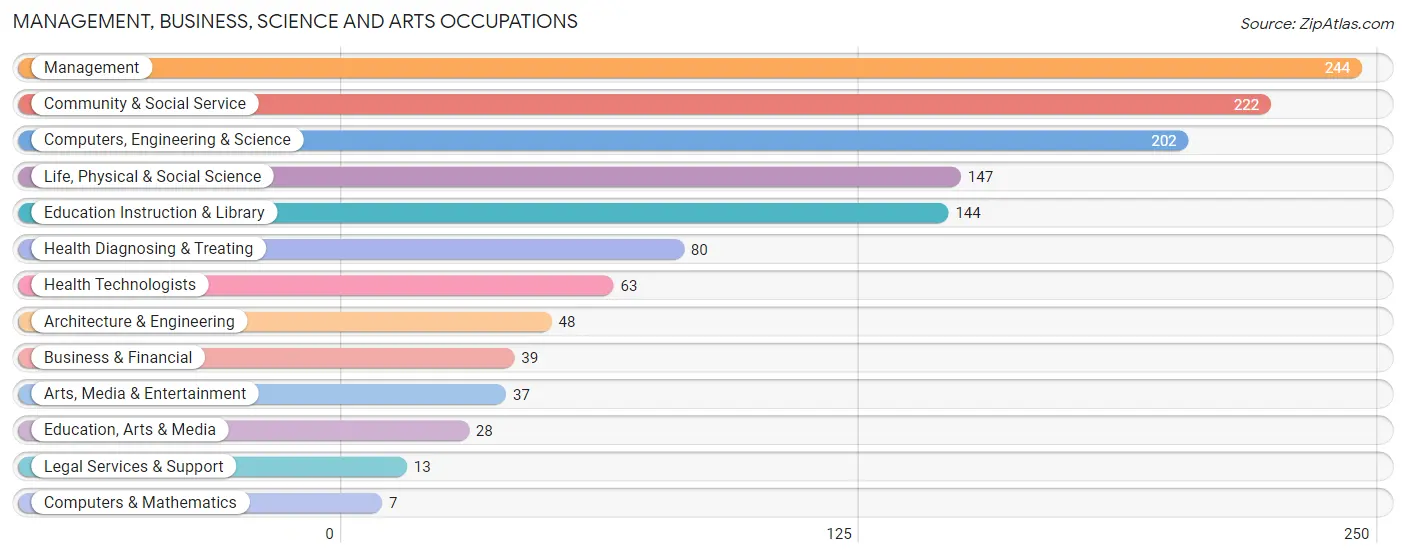
Management, Business, Science and Arts Occupations
The most common Management, Business, Science and Arts occupations in Falmouth are Management (244 | 16.1%), Community & Social Service (222 | 14.6%), Computers, Engineering & Science (202 | 13.3%), Life, Physical & Social Science (147 | 9.7%), and Education Instruction & Library (144 | 9.5%).
Management, Business, Science and Arts Occupations by Sex
Within the Management, Business, Science and Arts occupations in Falmouth, the most male-oriented occupations are Computers & Mathematics (100.0%), Architecture & Engineering (100.0%), and Business & Financial (69.2%), while the most female-oriented occupations are Education, Arts & Media (85.7%), Life, Physical & Social Science (83.7%), and Health Diagnosing & Treating (78.7%).
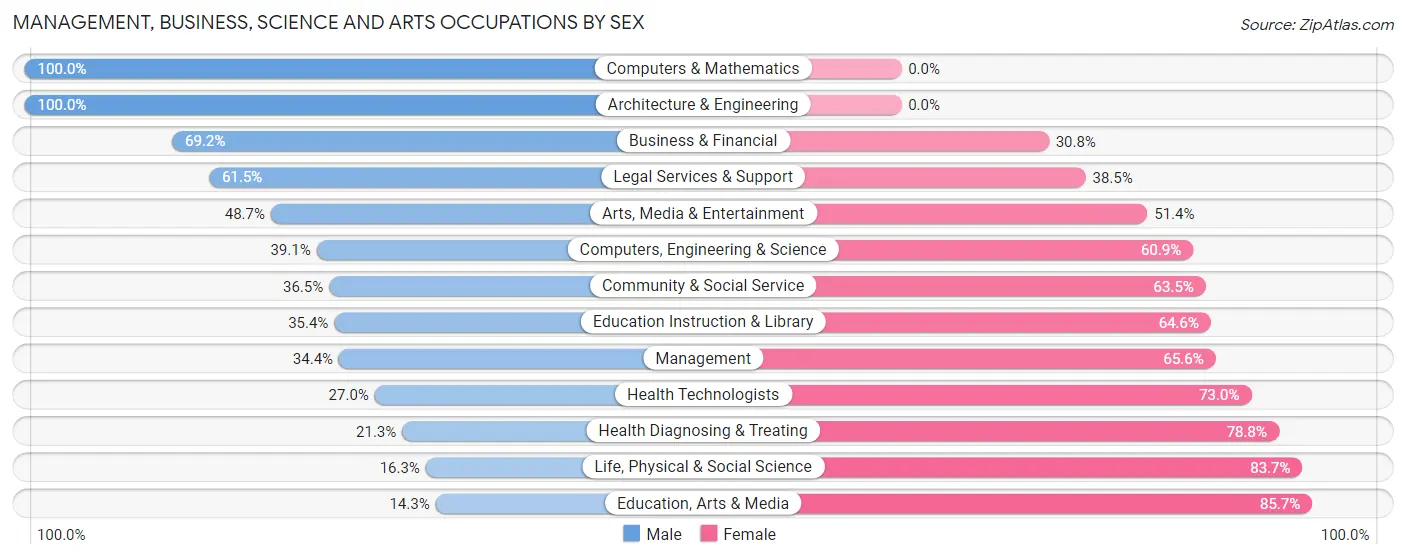
| Occupation | Male | Female |
| Management | 84 (34.4%) | 160 (65.6%) |
| Business & Financial | 27 (69.2%) | 12 (30.8%) |
| Computers, Engineering & Science | 79 (39.1%) | 123 (60.9%) |
| Computers & Mathematics | 7 (100.0%) | 0 (0.0%) |
| Architecture & Engineering | 48 (100.0%) | 0 (0.0%) |
| Life, Physical & Social Science | 24 (16.3%) | 123 (83.7%) |
| Community & Social Service | 81 (36.5%) | 141 (63.5%) |
| Education, Arts & Media | 4 (14.3%) | 24 (85.7%) |
| Legal Services & Support | 8 (61.5%) | 5 (38.5%) |
| Education Instruction & Library | 51 (35.4%) | 93 (64.6%) |
| Arts, Media & Entertainment | 18 (48.6%) | 19 (51.3%) |
| Health Diagnosing & Treating | 17 (21.2%) | 63 (78.7%) |
| Health Technologists | 17 (27.0%) | 46 (73.0%) |
| Total (Category) | 288 (36.6%) | 499 (63.4%) |
| Total (Overall) | 700 (46.1%) | 819 (53.9%) |
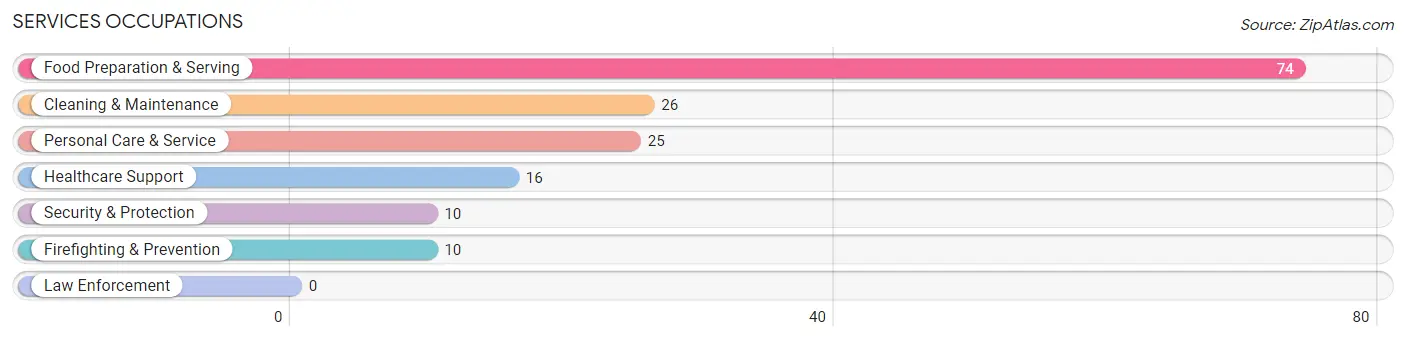
Services Occupations
The most common Services occupations in Falmouth are Food Preparation & Serving (74 | 4.9%), Cleaning & Maintenance (26 | 1.7%), Personal Care & Service (25 | 1.7%), Healthcare Support (16 | 1.1%), and Security & Protection (10 | 0.7%).
Services Occupations by Sex
Within the Services occupations in Falmouth, the most male-oriented occupations are Healthcare Support (100.0%), Cleaning & Maintenance (100.0%), and Food Preparation & Serving (20.3%), while the most female-oriented occupations are Security & Protection (100.0%), Firefighting & Prevention (100.0%), and Personal Care & Service (100.0%).
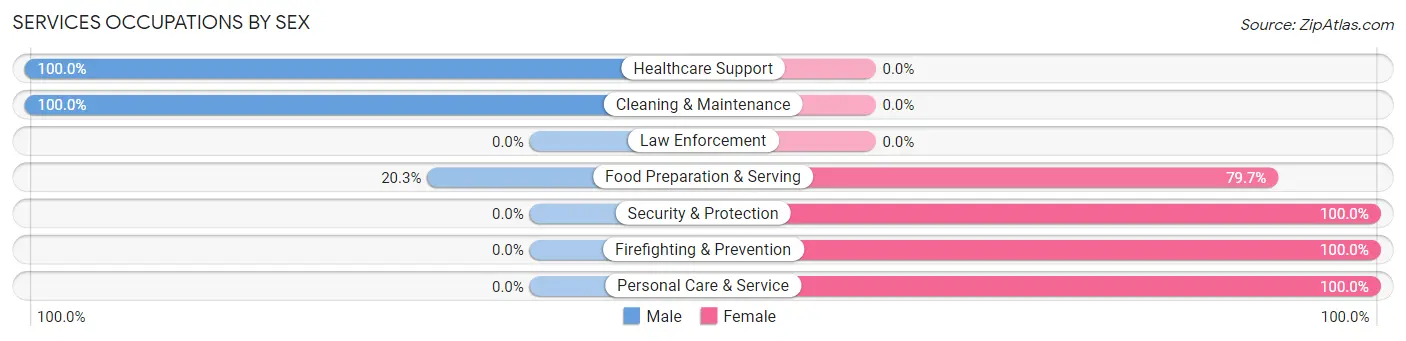
| Occupation | Male | Female |
| Healthcare Support | 16 (100.0%) | 0 (0.0%) |
| Security & Protection | 0 (0.0%) | 10 (100.0%) |
| Firefighting & Prevention | 0 (0.0%) | 10 (100.0%) |
| Law Enforcement | 0 (0.0%) | 0 (0.0%) |
| Food Preparation & Serving | 15 (20.3%) | 59 (79.7%) |
| Cleaning & Maintenance | 26 (100.0%) | 0 (0.0%) |
| Personal Care & Service | 0 (0.0%) | 25 (100.0%) |
| Total (Category) | 57 (37.8%) | 94 (62.3%) |
| Total (Overall) | 700 (46.1%) | 819 (53.9%) |
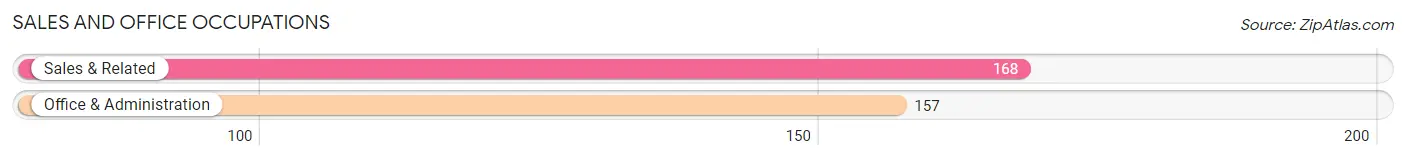
Sales and Office Occupations
The most common Sales and Office occupations in Falmouth are Sales & Related (168 | 11.1%), and Office & Administration (157 | 10.3%).
Sales and Office Occupations by Sex
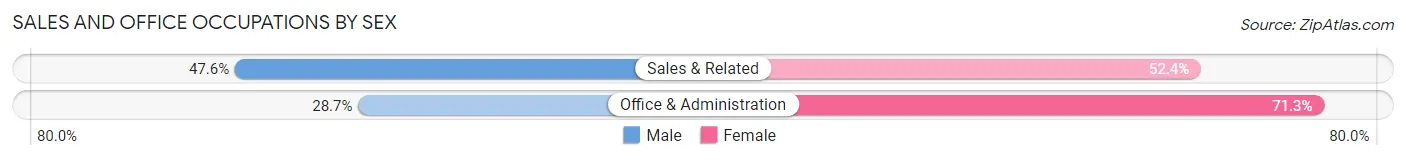
| Occupation | Male | Female |
| Sales & Related | 80 (47.6%) | 88 (52.4%) |
| Office & Administration | 45 (28.7%) | 112 (71.3%) |
| Total (Category) | 125 (38.5%) | 200 (61.5%) |
| Total (Overall) | 700 (46.1%) | 819 (53.9%) |
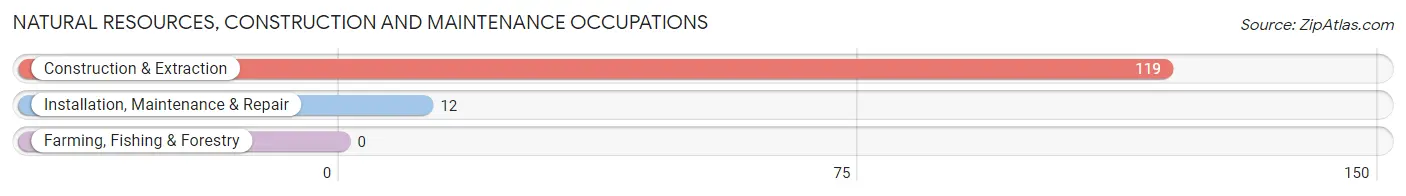
Natural Resources, Construction and Maintenance Occupations
The most common Natural Resources, Construction and Maintenance occupations in Falmouth are Construction & Extraction (119 | 7.8%), and Installation, Maintenance & Repair (12 | 0.8%).
Natural Resources, Construction and Maintenance Occupations by Sex
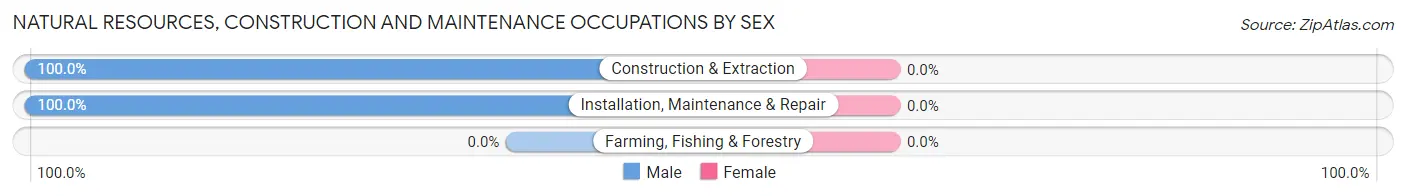
| Occupation | Male | Female |
| Farming, Fishing & Forestry | 0 (0.0%) | 0 (0.0%) |
| Construction & Extraction | 119 (100.0%) | 0 (0.0%) |
| Installation, Maintenance & Repair | 12 (100.0%) | 0 (0.0%) |
| Total (Category) | 131 (100.0%) | 0 (0.0%) |
| Total (Overall) | 700 (46.1%) | 819 (53.9%) |
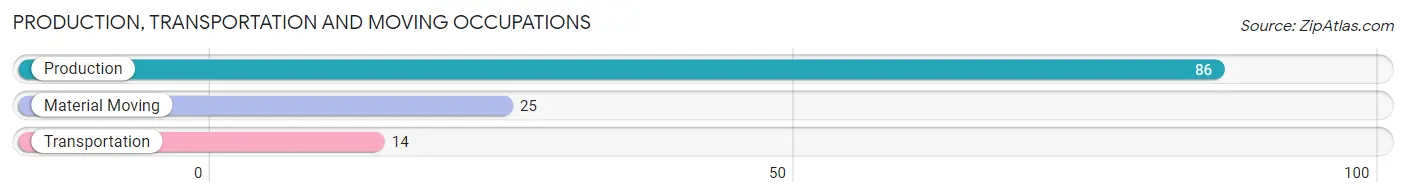
Production, Transportation and Moving Occupations
The most common Production, Transportation and Moving occupations in Falmouth are Production (86 | 5.7%), Material Moving (25 | 1.7%), and Transportation (14 | 0.9%).
Production, Transportation and Moving Occupations by Sex
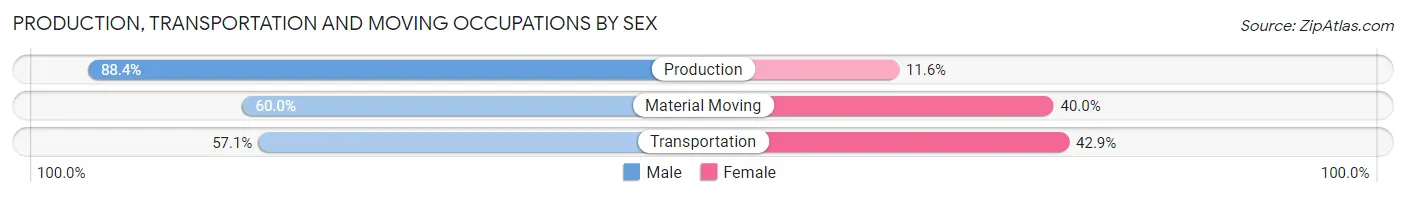
| Occupation | Male | Female |
| Production | 76 (88.4%) | 10 (11.6%) |
| Transportation | 8 (57.1%) | 6 (42.9%) |
| Material Moving | 15 (60.0%) | 10 (40.0%) |
| Total (Category) | 99 (79.2%) | 26 (20.8%) |
| Total (Overall) | 700 (46.1%) | 819 (53.9%) |
Employment Industries by Sex in Falmouth
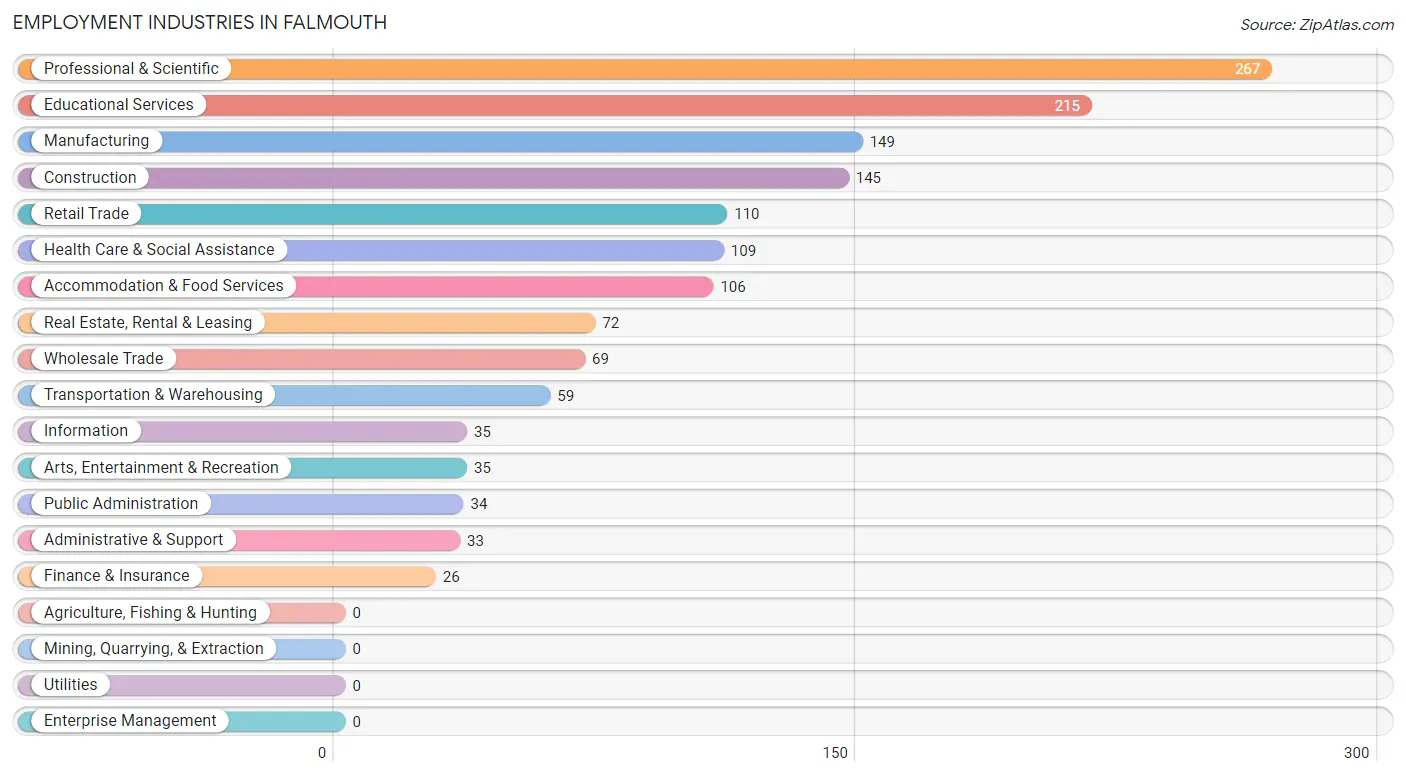
Employment Industries in Falmouth
The major employment industries in Falmouth include Professional & Scientific (267 | 17.6%), Educational Services (215 | 14.1%), Manufacturing (149 | 9.8%), Construction (145 | 9.6%), and Retail Trade (110 | 7.2%).
Employment Industries by Sex in Falmouth
The Falmouth industries that see more men than women are Transportation & Warehousing (89.8%), Arts, Entertainment & Recreation (82.9%), and Construction (82.1%), whereas the industries that tend to have a higher number of women are Public Administration (100.0%), Accommodation & Food Services (78.3%), and Information (77.1%).
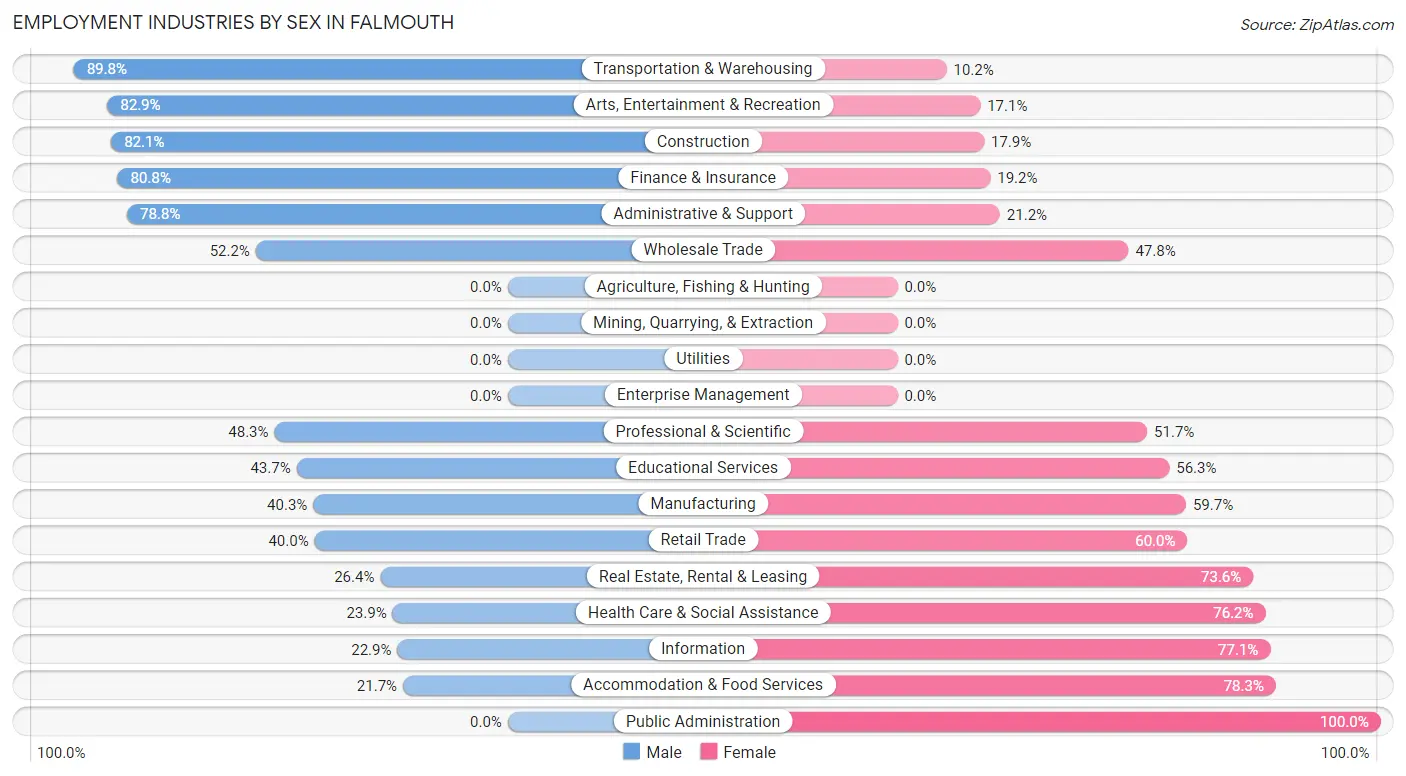
| Industry | Male | Female |
| Agriculture, Fishing & Hunting | 0 (0.0%) | 0 (0.0%) |
| Mining, Quarrying, & Extraction | 0 (0.0%) | 0 (0.0%) |
| Construction | 119 (82.1%) | 26 (17.9%) |
| Manufacturing | 60 (40.3%) | 89 (59.7%) |
| Wholesale Trade | 36 (52.2%) | 33 (47.8%) |
| Retail Trade | 44 (40.0%) | 66 (60.0%) |
| Transportation & Warehousing | 53 (89.8%) | 6 (10.2%) |
| Utilities | 0 (0.0%) | 0 (0.0%) |
| Information | 8 (22.9%) | 27 (77.1%) |
| Finance & Insurance | 21 (80.8%) | 5 (19.2%) |
| Real Estate, Rental & Leasing | 19 (26.4%) | 53 (73.6%) |
| Professional & Scientific | 129 (48.3%) | 138 (51.7%) |
| Enterprise Management | 0 (0.0%) | 0 (0.0%) |
| Administrative & Support | 26 (78.8%) | 7 (21.2%) |
| Educational Services | 94 (43.7%) | 121 (56.3%) |
| Health Care & Social Assistance | 26 (23.8%) | 83 (76.1%) |
| Arts, Entertainment & Recreation | 29 (82.9%) | 6 (17.1%) |
| Accommodation & Food Services | 23 (21.7%) | 83 (78.3%) |
| Public Administration | 0 (0.0%) | 34 (100.0%) |
| Total | 700 (46.1%) | 819 (53.9%) |
Education in Falmouth
School Enrollment in Falmouth
The most common levels of schooling among the 529 students in Falmouth are graduate / professional (169 | 32.0%), elementary school (126 | 23.8%), and college / undergraduate (77 | 14.6%).
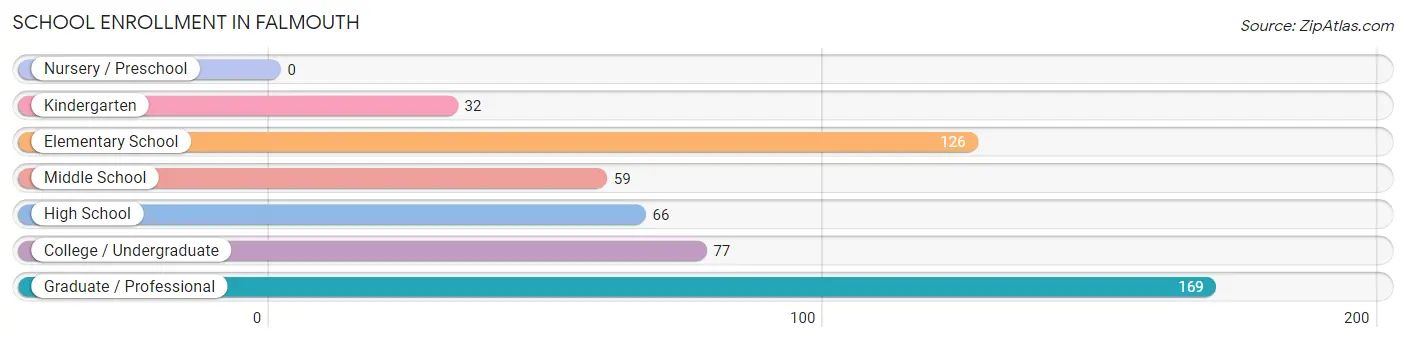
| School Level | # Students | % Students |
| Nursery / Preschool | 0 | 0.0% |
| Kindergarten | 32 | 6.0% |
| Elementary School | 126 | 23.8% |
| Middle School | 59 | 11.2% |
| High School | 66 | 12.5% |
| College / Undergraduate | 77 | 14.6% |
| Graduate / Professional | 169 | 32.0% |
| Total | 529 | 100.0% |
School Enrollment by Age by Funding Source in Falmouth
Out of a total of 529 students who are enrolled in schools in Falmouth, 127 (24.0%) attend a private institution, while the remaining 402 (76.0%) are enrolled in public schools. The age group of 20 to 24 year olds has the highest likelihood of being enrolled in private schools, with 65 (86.7% in the age bracket) enrolled. Conversely, the age group of 5 to 9 year old has the lowest likelihood of being enrolled in a private school, with 143 (100.0% in the age bracket) attending a public institution.
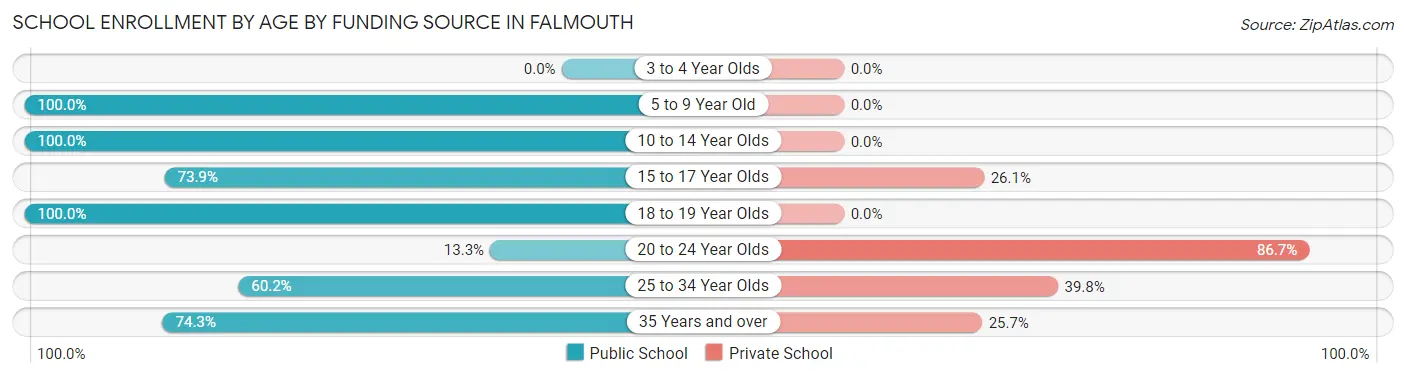
| Age Bracket | Public School | Private School |
| 3 to 4 Year Olds | 0 (0.0%) | 0 (0.0%) |
| 5 to 9 Year Old | 143 (100.0%) | 0 (0.0%) |
| 10 to 14 Year Olds | 86 (100.0%) | 0 (0.0%) |
| 15 to 17 Year Olds | 17 (73.9%) | 6 (26.1%) |
| 18 to 19 Year Olds | 49 (100.0%) | 0 (0.0%) |
| 20 to 24 Year Olds | 10 (13.3%) | 65 (86.7%) |
| 25 to 34 Year Olds | 71 (60.2%) | 47 (39.8%) |
| 35 Years and over | 26 (74.3%) | 9 (25.7%) |
| Total | 402 (76.0%) | 127 (24.0%) |
Educational Attainment by Field of Study in Falmouth
Physical & health sciences (276 | 15.6%), bio, nature & agricultural (212 | 12.0%), business (201 | 11.4%), education (191 | 10.8%), and literature & languages (159 | 9.0%) are the most common fields of study among 1,766 individuals in Falmouth who have obtained a bachelor's degree or higher.
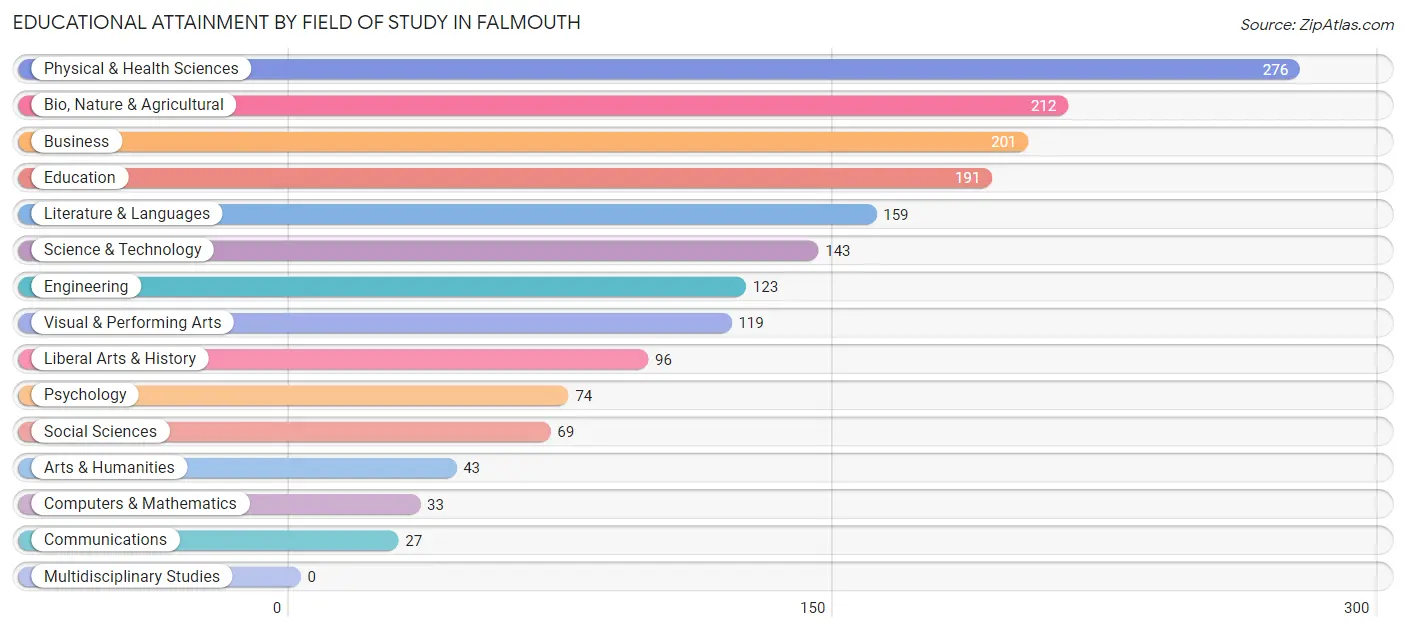
| Field of Study | # Graduates | % Graduates |
| Computers & Mathematics | 33 | 1.9% |
| Bio, Nature & Agricultural | 212 | 12.0% |
| Physical & Health Sciences | 276 | 15.6% |
| Psychology | 74 | 4.2% |
| Social Sciences | 69 | 3.9% |
| Engineering | 123 | 7.0% |
| Multidisciplinary Studies | 0 | 0.0% |
| Science & Technology | 143 | 8.1% |
| Business | 201 | 11.4% |
| Education | 191 | 10.8% |
| Literature & Languages | 159 | 9.0% |
| Liberal Arts & History | 96 | 5.4% |
| Visual & Performing Arts | 119 | 6.7% |
| Communications | 27 | 1.5% |
| Arts & Humanities | 43 | 2.4% |
| Total | 1,766 | 100.0% |
Transportation & Commute in Falmouth
Vehicle Availability by Sex in Falmouth
The most prevalent vehicle ownership categories in Falmouth are males with 2 vehicles (380, accounting for 53.4%) and females with 2 vehicles (375, making up 47.4%).
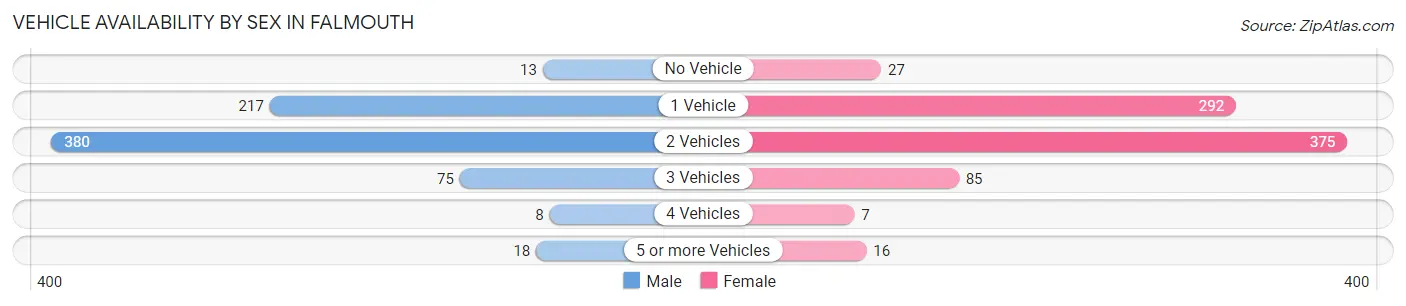
| Vehicles Available | Male | Female |
| No Vehicle | 13 (1.8%) | 27 (3.4%) |
| 1 Vehicle | 217 (30.5%) | 292 (36.4%) |
| 2 Vehicles | 380 (53.4%) | 375 (46.8%) |
| 3 Vehicles | 75 (10.5%) | 85 (10.6%) |
| 4 Vehicles | 8 (1.1%) | 7 (0.9%) |
| 5 or more Vehicles | 18 (2.5%) | 16 (2.0%) |
| Total | 711 (100.0%) | 802 (100.0%) |
Commute Time in Falmouth
The most frequently occuring commute durations in Falmouth are 5 to 9 minutes (416 commuters, 33.5%), 10 to 14 minutes (217 commuters, 17.5%), and 15 to 19 minutes (111 commuters, 8.9%).
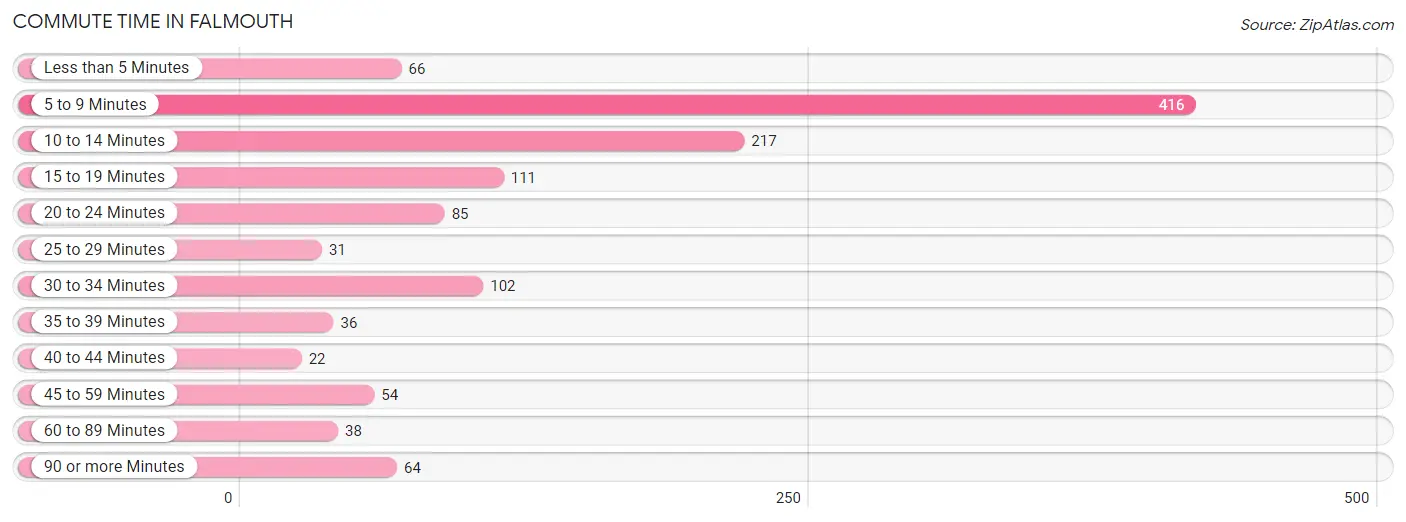
| Commute Time | # Commuters | % Commuters |
| Less than 5 Minutes | 66 | 5.3% |
| 5 to 9 Minutes | 416 | 33.5% |
| 10 to 14 Minutes | 217 | 17.5% |
| 15 to 19 Minutes | 111 | 8.9% |
| 20 to 24 Minutes | 85 | 6.8% |
| 25 to 29 Minutes | 31 | 2.5% |
| 30 to 34 Minutes | 102 | 8.2% |
| 35 to 39 Minutes | 36 | 2.9% |
| 40 to 44 Minutes | 22 | 1.8% |
| 45 to 59 Minutes | 54 | 4.3% |
| 60 to 89 Minutes | 38 | 3.1% |
| 90 or more Minutes | 64 | 5.1% |
Commute Time by Sex in Falmouth
The most common commute times in Falmouth are 10 to 14 minutes (179 commuters, 29.2%) for males and 5 to 9 minutes (297 commuters, 47.2%) for females.
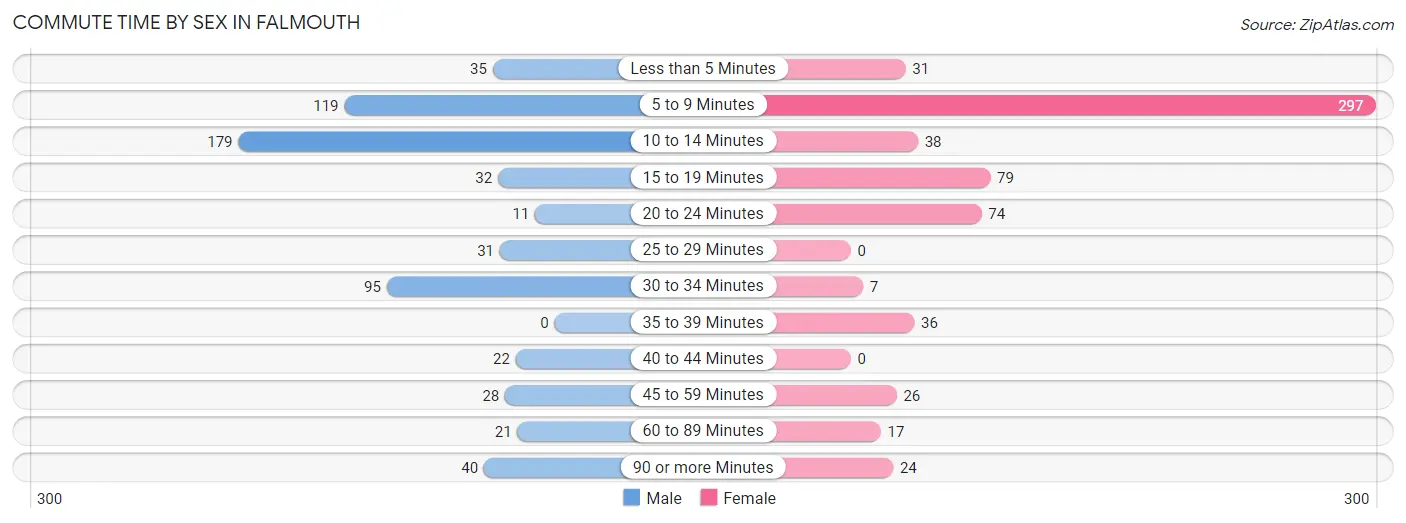
| Commute Time | Male | Female |
| Less than 5 Minutes | 35 (5.7%) | 31 (4.9%) |
| 5 to 9 Minutes | 119 (19.4%) | 297 (47.2%) |
| 10 to 14 Minutes | 179 (29.2%) | 38 (6.0%) |
| 15 to 19 Minutes | 32 (5.2%) | 79 (12.6%) |
| 20 to 24 Minutes | 11 (1.8%) | 74 (11.8%) |
| 25 to 29 Minutes | 31 (5.1%) | 0 (0.0%) |
| 30 to 34 Minutes | 95 (15.5%) | 7 (1.1%) |
| 35 to 39 Minutes | 0 (0.0%) | 36 (5.7%) |
| 40 to 44 Minutes | 22 (3.6%) | 0 (0.0%) |
| 45 to 59 Minutes | 28 (4.6%) | 26 (4.1%) |
| 60 to 89 Minutes | 21 (3.4%) | 17 (2.7%) |
| 90 or more Minutes | 40 (6.5%) | 24 (3.8%) |
Time of Departure to Work by Sex in Falmouth
The most frequent times of departure to work in Falmouth are 8:00 AM to 8:29 AM (132, 21.5%) for males and 7:30 AM to 7:59 AM (150, 23.8%) for females.
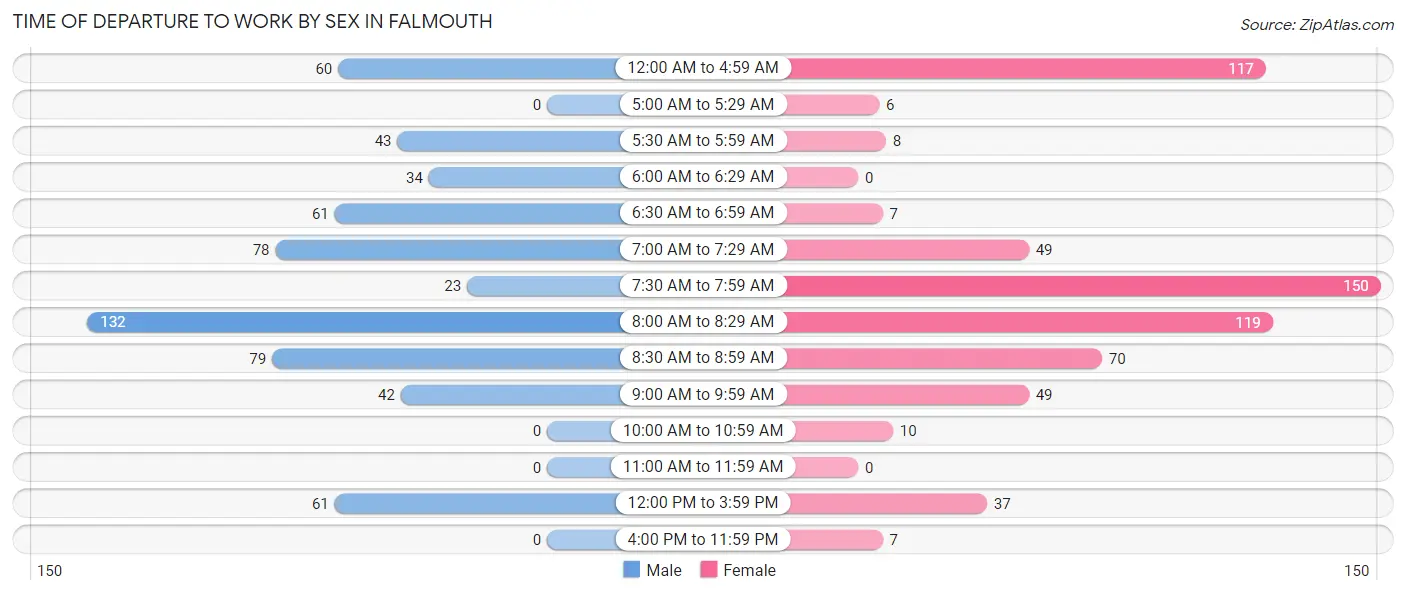
| Time of Departure | Male | Female |
| 12:00 AM to 4:59 AM | 60 (9.8%) | 117 (18.6%) |
| 5:00 AM to 5:29 AM | 0 (0.0%) | 6 (0.9%) |
| 5:30 AM to 5:59 AM | 43 (7.0%) | 8 (1.3%) |
| 6:00 AM to 6:29 AM | 34 (5.6%) | 0 (0.0%) |
| 6:30 AM to 6:59 AM | 61 (10.0%) | 7 (1.1%) |
| 7:00 AM to 7:29 AM | 78 (12.7%) | 49 (7.8%) |
| 7:30 AM to 7:59 AM | 23 (3.7%) | 150 (23.8%) |
| 8:00 AM to 8:29 AM | 132 (21.5%) | 119 (18.9%) |
| 8:30 AM to 8:59 AM | 79 (12.9%) | 70 (11.1%) |
| 9:00 AM to 9:59 AM | 42 (6.9%) | 49 (7.8%) |
| 10:00 AM to 10:59 AM | 0 (0.0%) | 10 (1.6%) |
| 11:00 AM to 11:59 AM | 0 (0.0%) | 0 (0.0%) |
| 12:00 PM to 3:59 PM | 61 (10.0%) | 37 (5.9%) |
| 4:00 PM to 11:59 PM | 0 (0.0%) | 7 (1.1%) |
| Total | 613 (100.0%) | 629 (100.0%) |
Housing Occupancy in Falmouth
Occupancy by Ownership in Falmouth
Of the total 2,070 dwellings in Falmouth, owner-occupied units account for 1,142 (55.2%), while renter-occupied units make up 928 (44.8%).
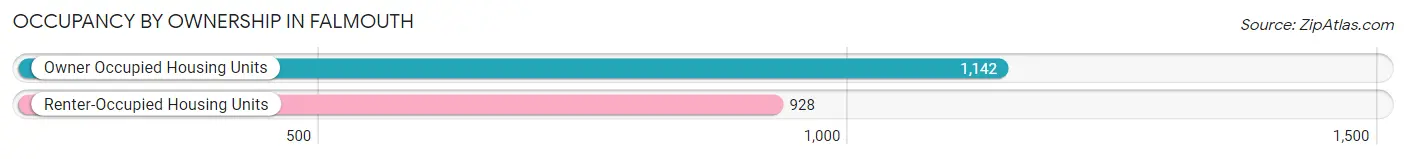
| Occupancy | # Housing Units | % Housing Units |
| Owner Occupied Housing Units | 1,142 | 55.2% |
| Renter-Occupied Housing Units | 928 | 44.8% |
| Total Occupied Housing Units | 2,070 | 100.0% |
Occupancy by Household Size in Falmouth
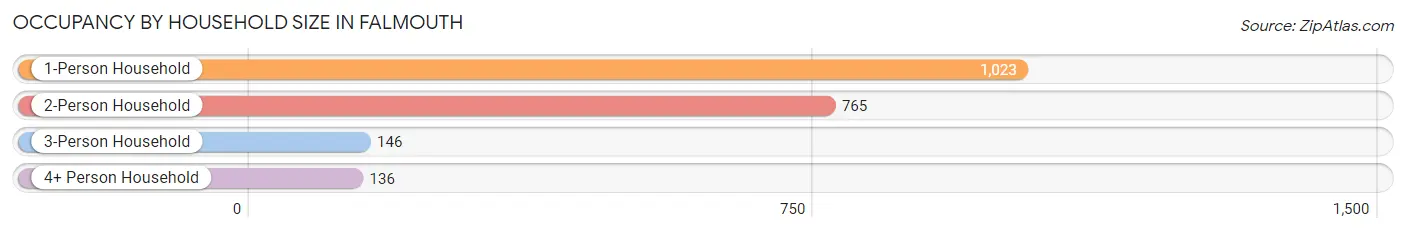
| Household Size | # Housing Units | % Housing Units |
| 1-Person Household | 1,023 | 49.4% |
| 2-Person Household | 765 | 37.0% |
| 3-Person Household | 146 | 7.0% |
| 4+ Person Household | 136 | 6.6% |
| Total Housing Units | 2,070 | 100.0% |
Occupancy by Ownership by Household Size in Falmouth
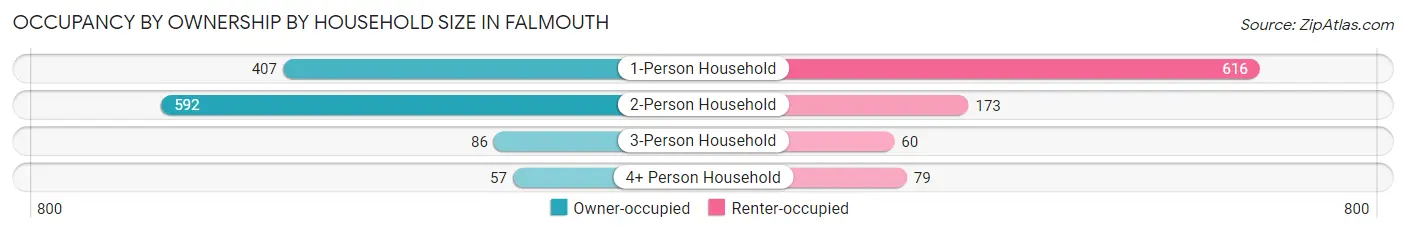
| Household Size | Owner-occupied | Renter-occupied |
| 1-Person Household | 407 (39.8%) | 616 (60.2%) |
| 2-Person Household | 592 (77.4%) | 173 (22.6%) |
| 3-Person Household | 86 (58.9%) | 60 (41.1%) |
| 4+ Person Household | 57 (41.9%) | 79 (58.1%) |
| Total Housing Units | 1,142 (55.2%) | 928 (44.8%) |
Occupancy by Educational Attainment in Falmouth
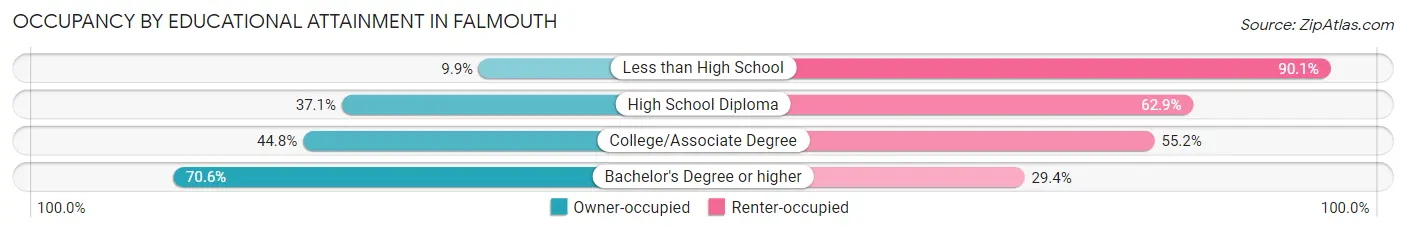
| Household Size | Owner-occupied | Renter-occupied |
| Less than High School | 13 (9.9%) | 118 (90.1%) |
| High School Diploma | 98 (37.1%) | 166 (62.9%) |
| College/Associate Degree | 263 (44.8%) | 324 (55.2%) |
| Bachelor's Degree or higher | 768 (70.6%) | 320 (29.4%) |
Occupancy by Age of Householder in Falmouth
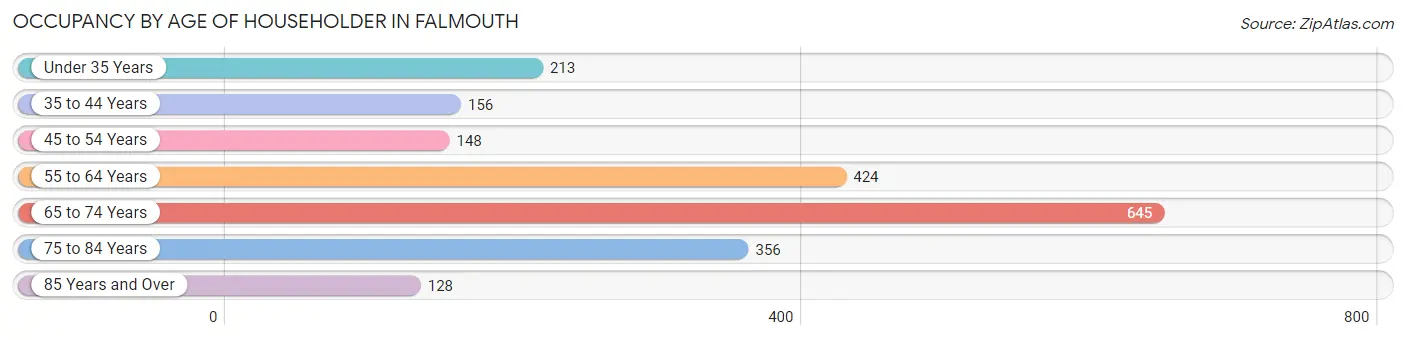
| Age Bracket | # Households | % Households |
| Under 35 Years | 213 | 10.3% |
| 35 to 44 Years | 156 | 7.5% |
| 45 to 54 Years | 148 | 7.1% |
| 55 to 64 Years | 424 | 20.5% |
| 65 to 74 Years | 645 | 31.2% |
| 75 to 84 Years | 356 | 17.2% |
| 85 Years and Over | 128 | 6.2% |
| Total | 2,070 | 100.0% |
Housing Finances in Falmouth
Median Income by Occupancy in Falmouth
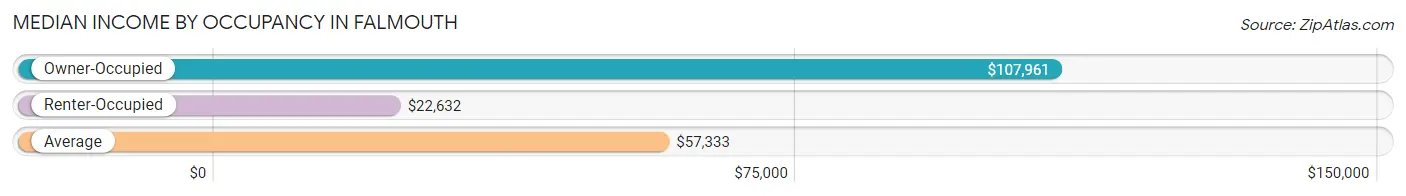
| Occupancy Type | # Households | Median Income |
| Owner-Occupied | 1,142 (55.2%) | $107,961 |
| Renter-Occupied | 928 (44.8%) | $22,632 |
| Average | 2,070 (100.0%) | $57,333 |
Occupancy by Householder Income Bracket in Falmouth
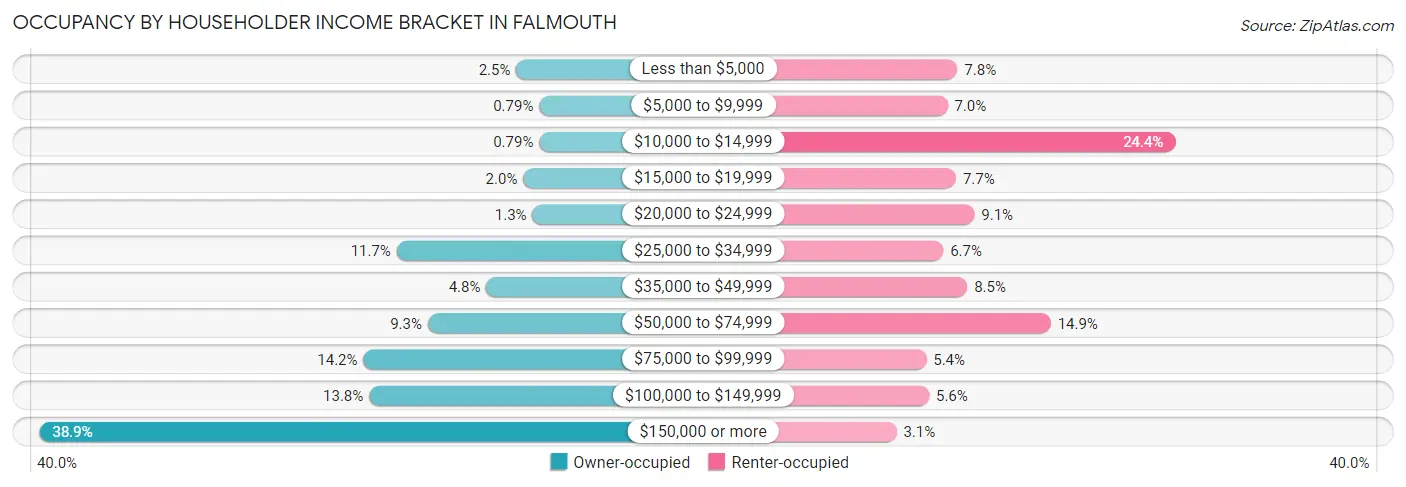
| Income Bracket | Owner-occupied | Renter-occupied |
| Less than $5,000 | 29 (2.5%) | 72 (7.8%) |
| $5,000 to $9,999 | 9 (0.8%) | 65 (7.0%) |
| $10,000 to $14,999 | 9 (0.8%) | 226 (24.3%) |
| $15,000 to $19,999 | 23 (2.0%) | 71 (7.6%) |
| $20,000 to $24,999 | 15 (1.3%) | 84 (9.0%) |
| $25,000 to $34,999 | 133 (11.7%) | 62 (6.7%) |
| $35,000 to $49,999 | 55 (4.8%) | 79 (8.5%) |
| $50,000 to $74,999 | 106 (9.3%) | 138 (14.9%) |
| $75,000 to $99,999 | 162 (14.2%) | 50 (5.4%) |
| $100,000 to $149,999 | 157 (13.8%) | 52 (5.6%) |
| $150,000 or more | 444 (38.9%) | 29 (3.1%) |
| Total | 1,142 (100.0%) | 928 (100.0%) |
Monthly Housing Cost Tiers in Falmouth
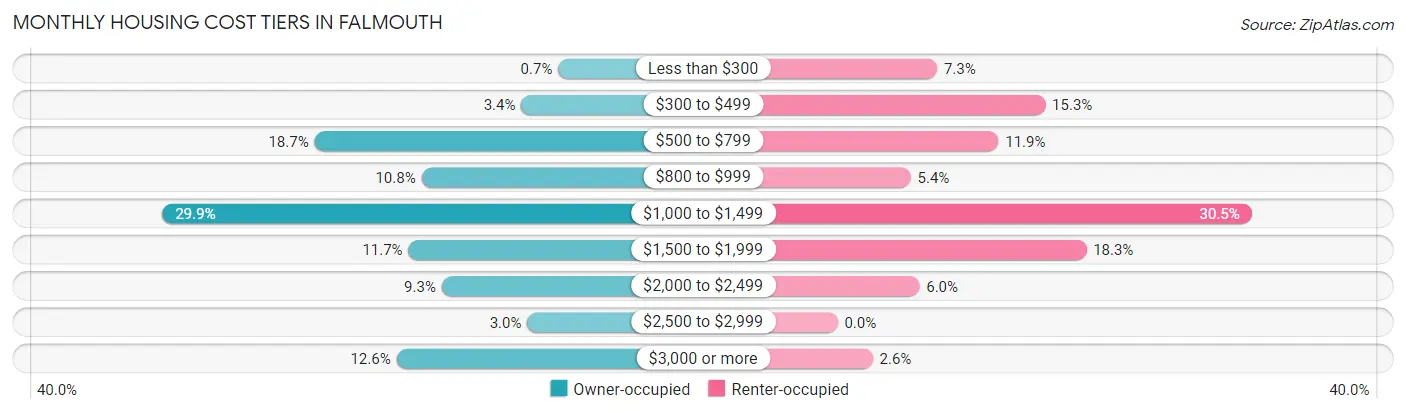
| Monthly Cost | Owner-occupied | Renter-occupied |
| Less than $300 | 8 (0.7%) | 68 (7.3%) |
| $300 to $499 | 39 (3.4%) | 142 (15.3%) |
| $500 to $799 | 213 (18.6%) | 110 (11.8%) |
| $800 to $999 | 123 (10.8%) | 50 (5.4%) |
| $1,000 to $1,499 | 341 (29.9%) | 283 (30.5%) |
| $1,500 to $1,999 | 134 (11.7%) | 170 (18.3%) |
| $2,000 to $2,499 | 106 (9.3%) | 56 (6.0%) |
| $2,500 to $2,999 | 34 (3.0%) | 0 (0.0%) |
| $3,000 or more | 144 (12.6%) | 24 (2.6%) |
| Total | 1,142 (100.0%) | 928 (100.0%) |
Physical Housing Characteristics in Falmouth
Housing Structures in Falmouth
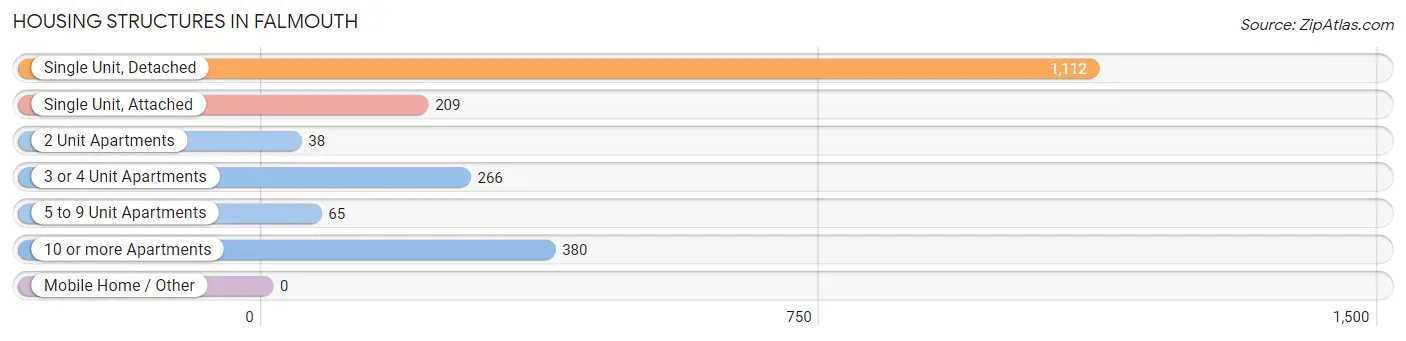
| Structure Type | # Housing Units | % Housing Units |
| Single Unit, Detached | 1,112 | 53.7% |
| Single Unit, Attached | 209 | 10.1% |
| 2 Unit Apartments | 38 | 1.8% |
| 3 or 4 Unit Apartments | 266 | 12.9% |
| 5 to 9 Unit Apartments | 65 | 3.1% |
| 10 or more Apartments | 380 | 18.4% |
| Mobile Home / Other | 0 | 0.0% |
| Total | 2,070 | 100.0% |
Housing Structures by Occupancy in Falmouth
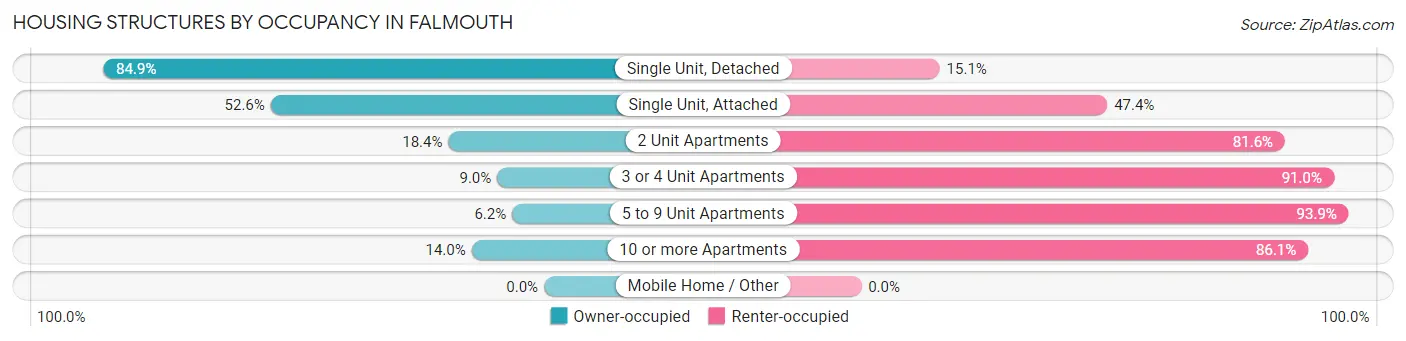
| Structure Type | Owner-occupied | Renter-occupied |
| Single Unit, Detached | 944 (84.9%) | 168 (15.1%) |
| Single Unit, Attached | 110 (52.6%) | 99 (47.4%) |
| 2 Unit Apartments | 7 (18.4%) | 31 (81.6%) |
| 3 or 4 Unit Apartments | 24 (9.0%) | 242 (91.0%) |
| 5 to 9 Unit Apartments | 4 (6.1%) | 61 (93.9%) |
| 10 or more Apartments | 53 (14.0%) | 327 (86.1%) |
| Mobile Home / Other | 0 (0.0%) | 0 (0.0%) |
| Total | 1,142 (55.2%) | 928 (44.8%) |
Housing Structures by Number of Rooms in Falmouth
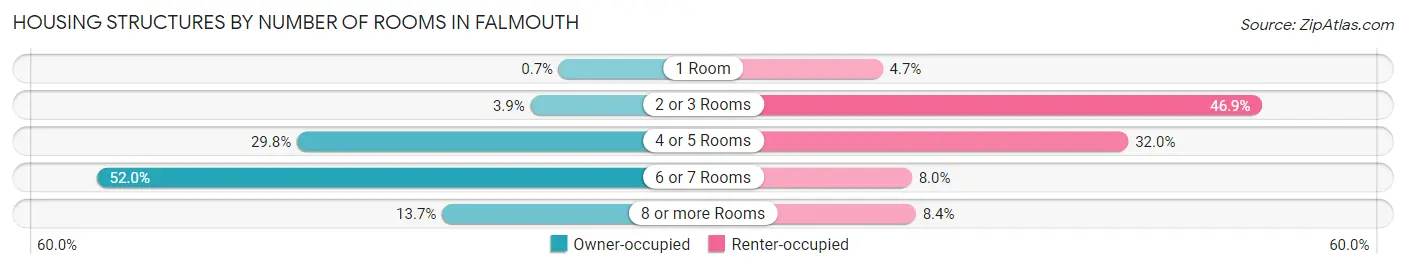
| Number of Rooms | Owner-occupied | Renter-occupied |
| 1 Room | 8 (0.7%) | 44 (4.7%) |
| 2 or 3 Rooms | 44 (3.8%) | 435 (46.9%) |
| 4 or 5 Rooms | 340 (29.8%) | 297 (32.0%) |
| 6 or 7 Rooms | 594 (52.0%) | 74 (8.0%) |
| 8 or more Rooms | 156 (13.7%) | 78 (8.4%) |
| Total | 1,142 (100.0%) | 928 (100.0%) |
Housing Structure by Heating Type in Falmouth
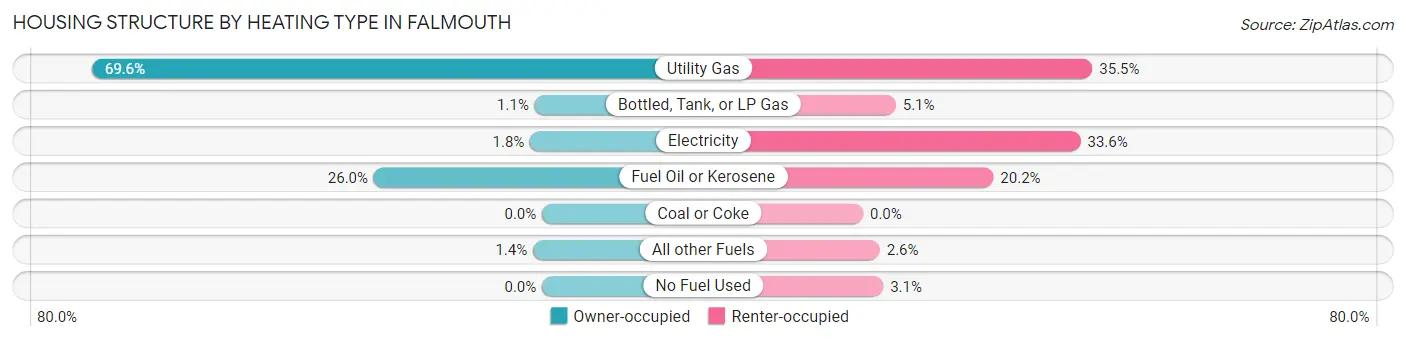
| Heating Type | Owner-occupied | Renter-occupied |
| Utility Gas | 795 (69.6%) | 329 (35.4%) |
| Bottled, Tank, or LP Gas | 13 (1.1%) | 47 (5.1%) |
| Electricity | 21 (1.8%) | 312 (33.6%) |
| Fuel Oil or Kerosene | 297 (26.0%) | 187 (20.2%) |
| Coal or Coke | 0 (0.0%) | 0 (0.0%) |
| All other Fuels | 16 (1.4%) | 24 (2.6%) |
| No Fuel Used | 0 (0.0%) | 29 (3.1%) |
| Total | 1,142 (100.0%) | 928 (100.0%) |
Household Vehicle Usage in Falmouth
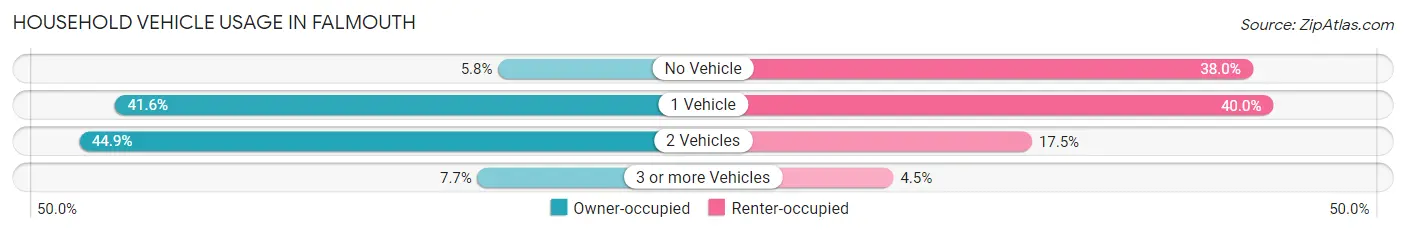
| Vehicles per Household | Owner-occupied | Renter-occupied |
| No Vehicle | 66 (5.8%) | 353 (38.0%) |
| 1 Vehicle | 475 (41.6%) | 371 (40.0%) |
| 2 Vehicles | 513 (44.9%) | 162 (17.5%) |
| 3 or more Vehicles | 88 (7.7%) | 42 (4.5%) |
| Total | 1,142 (100.0%) | 928 (100.0%) |
Real Estate & Mortgages in Falmouth
Real Estate and Mortgage Overview in Falmouth
| Characteristic | Without Mortgage | With Mortgage |
| Housing Units | 684 | 458 |
| Median Property Value | $742,900 | $631,600 |
| Median Household Income | $101,071 | $187 |
| Monthly Housing Costs | $894 | $144 |
| Real Estate Taxes | $4,643 | $0 |
Property Value by Mortgage Status in Falmouth
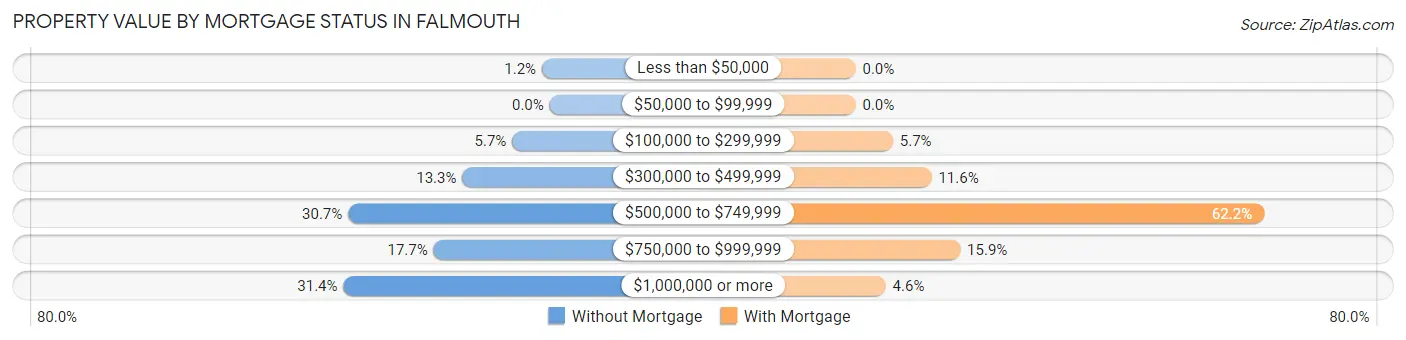
| Property Value | Without Mortgage | With Mortgage |
| Less than $50,000 | 8 (1.2%) | 0 (0.0%) |
| $50,000 to $99,999 | 0 (0.0%) | 0 (0.0%) |
| $100,000 to $299,999 | 39 (5.7%) | 26 (5.7%) |
| $300,000 to $499,999 | 91 (13.3%) | 53 (11.6%) |
| $500,000 to $749,999 | 210 (30.7%) | 285 (62.2%) |
| $750,000 to $999,999 | 121 (17.7%) | 73 (15.9%) |
| $1,000,000 or more | 215 (31.4%) | 21 (4.6%) |
| Total | 684 (100.0%) | 458 (100.0%) |
Household Income by Mortgage Status in Falmouth
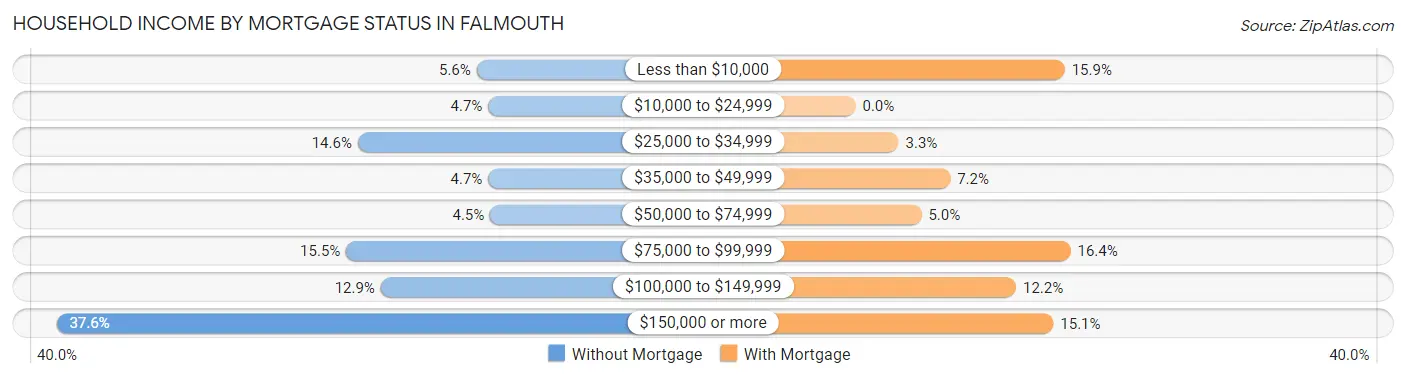
| Household Income | Without Mortgage | With Mortgage |
| Less than $10,000 | 38 (5.6%) | 73 (15.9%) |
| $10,000 to $24,999 | 32 (4.7%) | 0 (0.0%) |
| $25,000 to $34,999 | 100 (14.6%) | 15 (3.3%) |
| $35,000 to $49,999 | 32 (4.7%) | 33 (7.2%) |
| $50,000 to $74,999 | 31 (4.5%) | 23 (5.0%) |
| $75,000 to $99,999 | 106 (15.5%) | 75 (16.4%) |
| $100,000 to $149,999 | 88 (12.9%) | 56 (12.2%) |
| $150,000 or more | 257 (37.6%) | 69 (15.1%) |
| Total | 684 (100.0%) | 458 (100.0%) |
Property Value to Household Income Ratio in Falmouth
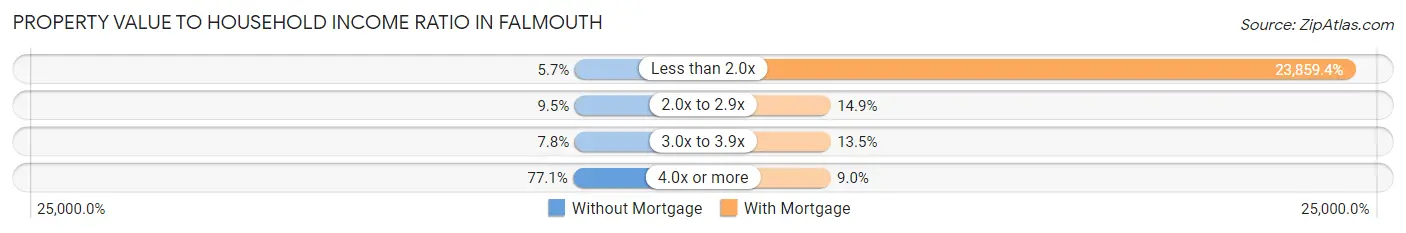
| Value-to-Income Ratio | Without Mortgage | With Mortgage |
| Less than 2.0x | 39 (5.7%) | 109,276 (23,859.4%) |
| 2.0x to 2.9x | 65 (9.5%) | 68 (14.8%) |
| 3.0x to 3.9x | 53 (7.7%) | 62 (13.5%) |
| 4.0x or more | 527 (77.0%) | 41 (8.9%) |
| Total | 684 (100.0%) | 458 (100.0%) |
Real Estate Taxes by Mortgage Status in Falmouth

| Property Taxes | Without Mortgage | With Mortgage |
| Less than $800 | 0 (0.0%) | 0 (0.0%) |
| $800 to $1,499 | 12 (1.8%) | 0 (0.0%) |
| $800 to $1,499 | 672 (98.3%) | 10 (2.2%) |
| Total | 684 (100.0%) | 458 (100.0%) |
Health & Disability in Falmouth
Health Insurance Coverage by Age in Falmouth
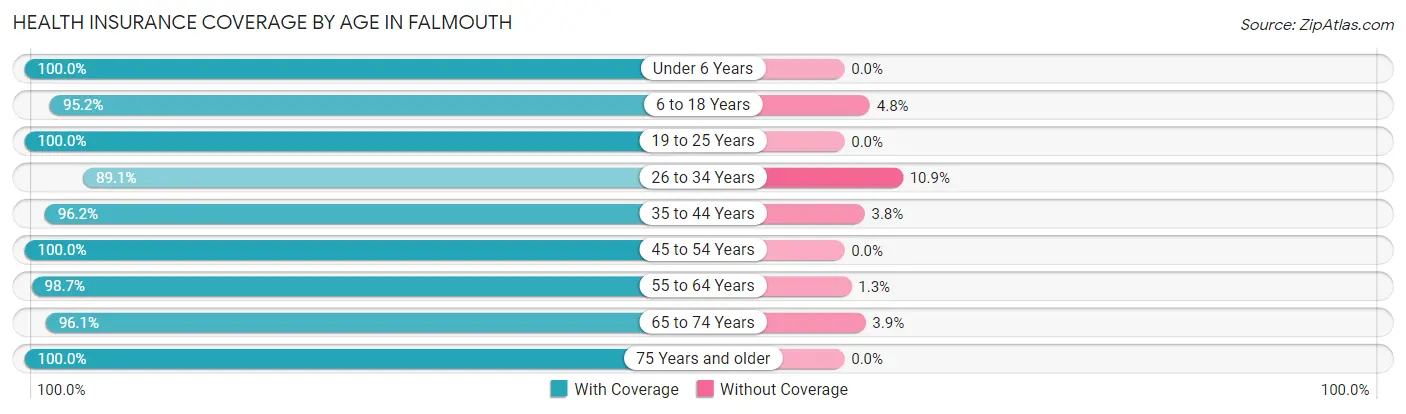
| Age Bracket | With Coverage | Without Coverage |
| Under 6 Years | 132 (100.0%) | 0 (0.0%) |
| 6 to 18 Years | 260 (95.2%) | 13 (4.8%) |
| 19 to 25 Years | 267 (100.0%) | 0 (0.0%) |
| 26 to 34 Years | 335 (89.1%) | 41 (10.9%) |
| 35 to 44 Years | 255 (96.2%) | 10 (3.8%) |
| 45 to 54 Years | 282 (100.0%) | 0 (0.0%) |
| 55 to 64 Years | 522 (98.7%) | 7 (1.3%) |
| 65 to 74 Years | 951 (96.1%) | 39 (3.9%) |
| 75 Years and older | 657 (100.0%) | 0 (0.0%) |
| Total | 3,661 (97.1%) | 110 (2.9%) |
Health Insurance Coverage by Citizenship Status in Falmouth
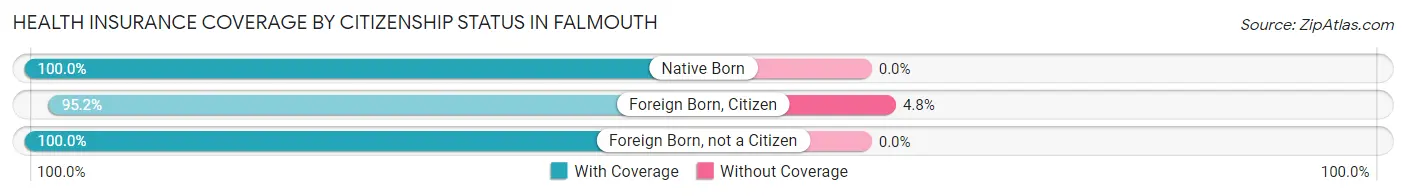
| Citizenship Status | With Coverage | Without Coverage |
| Native Born | 132 (100.0%) | 0 (0.0%) |
| Foreign Born, Citizen | 260 (95.2%) | 13 (4.8%) |
| Foreign Born, not a Citizen | 267 (100.0%) | 0 (0.0%) |
Health Insurance Coverage by Household Income in Falmouth
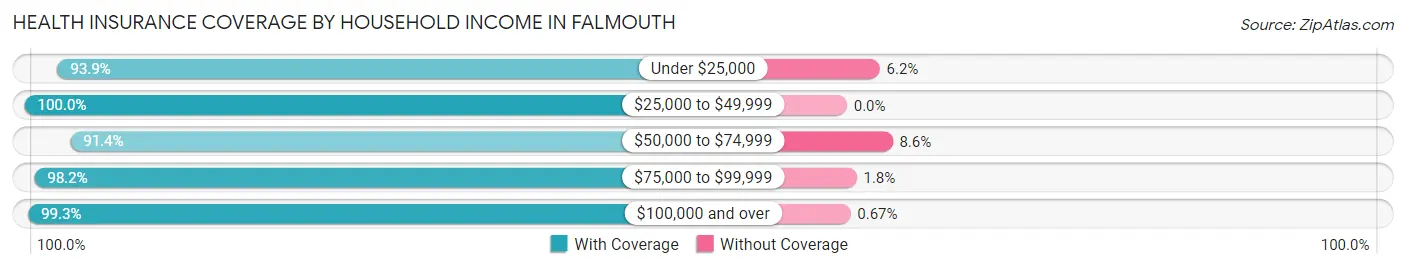
| Household Income | With Coverage | Without Coverage |
| Under $25,000 | 794 (93.9%) | 52 (6.1%) |
| $25,000 to $49,999 | 540 (100.0%) | 0 (0.0%) |
| $50,000 to $74,999 | 438 (91.4%) | 41 (8.6%) |
| $75,000 to $99,999 | 377 (98.2%) | 7 (1.8%) |
| $100,000 and over | 1,481 (99.3%) | 10 (0.7%) |
Public vs Private Health Insurance Coverage by Age in Falmouth
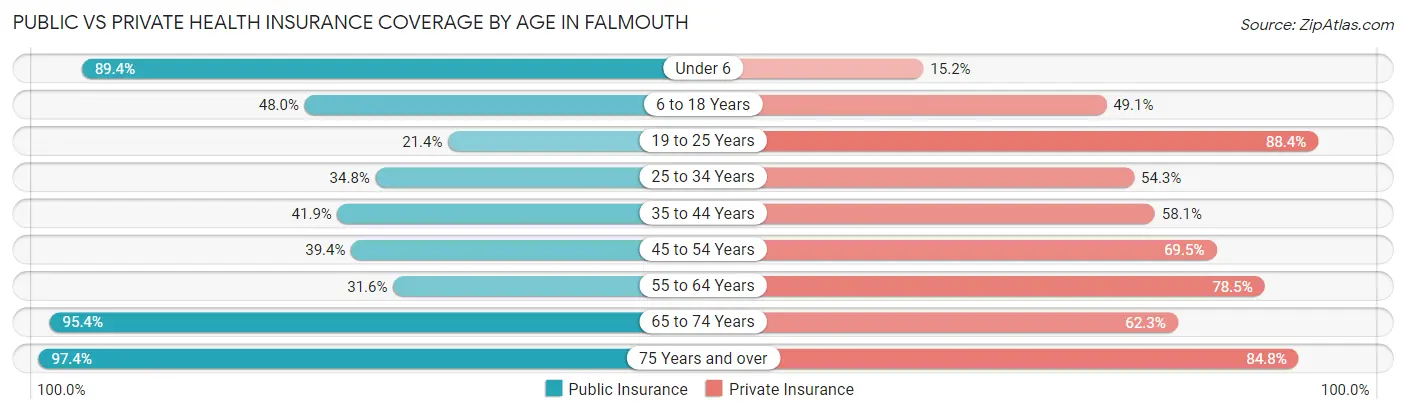
| Age Bracket | Public Insurance | Private Insurance |
| Under 6 | 118 (89.4%) | 20 (15.1%) |
| 6 to 18 Years | 131 (48.0%) | 134 (49.1%) |
| 19 to 25 Years | 57 (21.3%) | 236 (88.4%) |
| 25 to 34 Years | 131 (34.8%) | 204 (54.3%) |
| 35 to 44 Years | 111 (41.9%) | 154 (58.1%) |
| 45 to 54 Years | 111 (39.4%) | 196 (69.5%) |
| 55 to 64 Years | 167 (31.6%) | 415 (78.4%) |
| 65 to 74 Years | 944 (95.4%) | 617 (62.3%) |
| 75 Years and over | 640 (97.4%) | 557 (84.8%) |
| Total | 2,410 (63.9%) | 2,533 (67.2%) |
Disability Status by Sex by Age in Falmouth
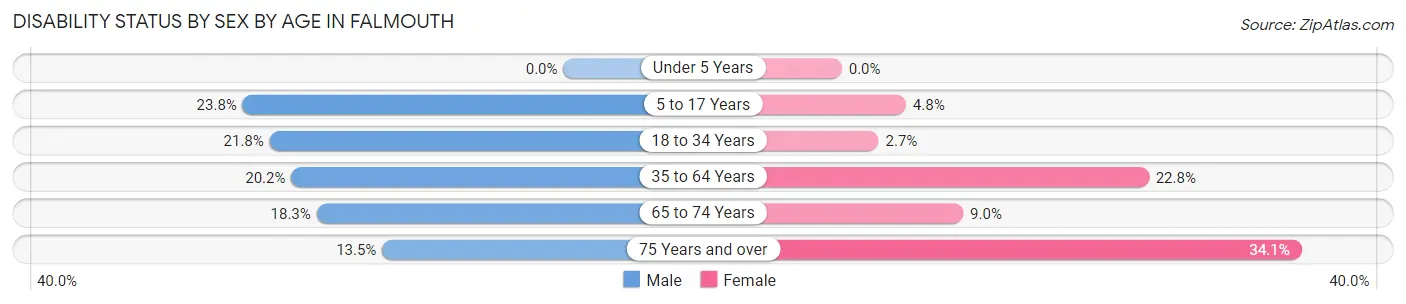
| Age Bracket | Male | Female |
| Under 5 Years | 0 (0.0%) | 0 (0.0%) |
| 5 to 17 Years | 35 (23.8%) | 5 (4.8%) |
| 18 to 34 Years | 65 (21.8%) | 10 (2.7%) |
| 35 to 64 Years | 80 (20.2%) | 155 (22.8%) |
| 65 to 74 Years | 96 (18.3%) | 42 (9.0%) |
| 75 Years and over | 32 (13.5%) | 143 (34.1%) |
Disability Class by Sex by Age in Falmouth
Disability Class: Hearing Difficulty
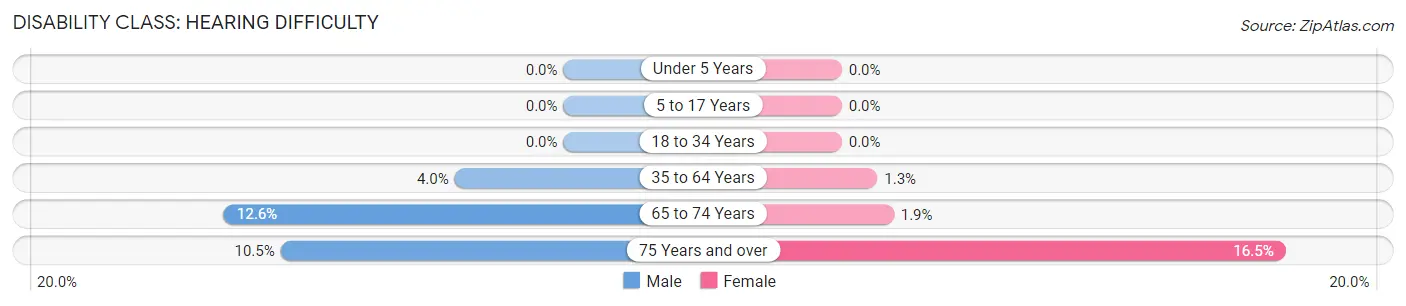
| Age Bracket | Male | Female |
| Under 5 Years | 0 (0.0%) | 0 (0.0%) |
| 5 to 17 Years | 0 (0.0%) | 0 (0.0%) |
| 18 to 34 Years | 0 (0.0%) | 0 (0.0%) |
| 35 to 64 Years | 16 (4.0%) | 9 (1.3%) |
| 65 to 74 Years | 66 (12.6%) | 9 (1.9%) |
| 75 Years and over | 25 (10.5%) | 69 (16.5%) |
Disability Class: Vision Difficulty
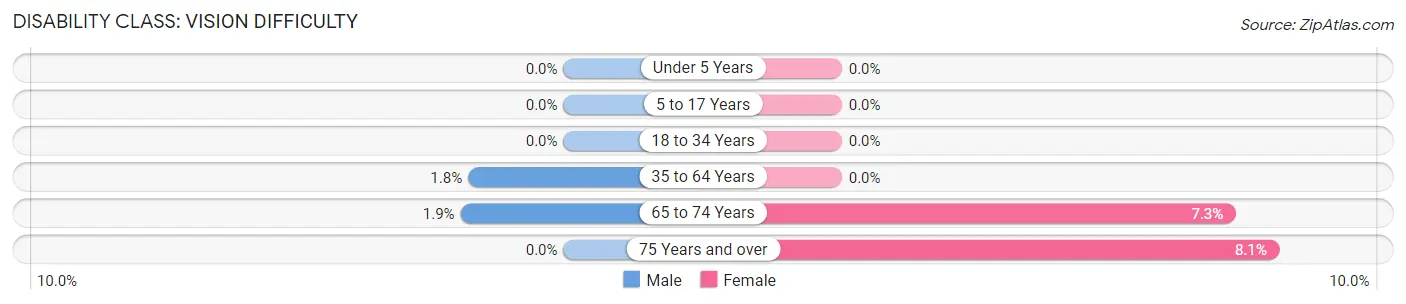
| Age Bracket | Male | Female |
| Under 5 Years | 0 (0.0%) | 0 (0.0%) |
| 5 to 17 Years | 0 (0.0%) | 0 (0.0%) |
| 18 to 34 Years | 0 (0.0%) | 0 (0.0%) |
| 35 to 64 Years | 7 (1.8%) | 0 (0.0%) |
| 65 to 74 Years | 10 (1.9%) | 34 (7.3%) |
| 75 Years and over | 0 (0.0%) | 34 (8.1%) |
Disability Class: Cognitive Difficulty
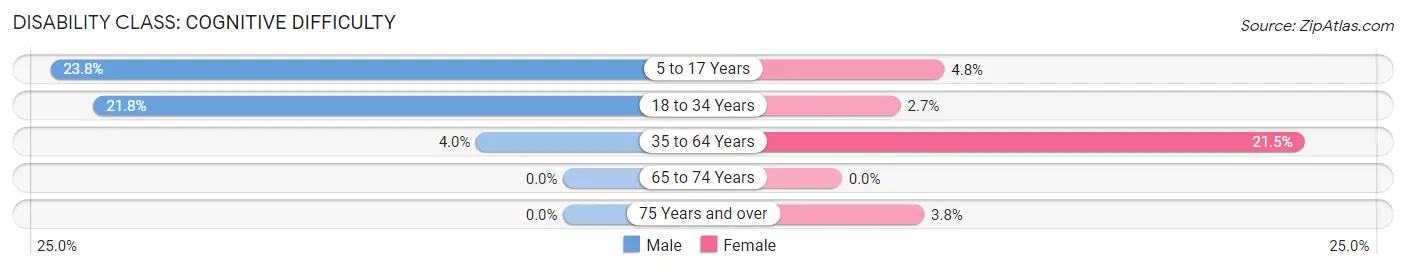
| Age Bracket | Male | Female |
| 5 to 17 Years | 35 (23.8%) | 5 (4.8%) |
| 18 to 34 Years | 65 (21.8%) | 10 (2.7%) |
| 35 to 64 Years | 16 (4.0%) | 146 (21.5%) |
| 65 to 74 Years | 0 (0.0%) | 0 (0.0%) |
| 75 Years and over | 0 (0.0%) | 16 (3.8%) |
Disability Class: Ambulatory Difficulty
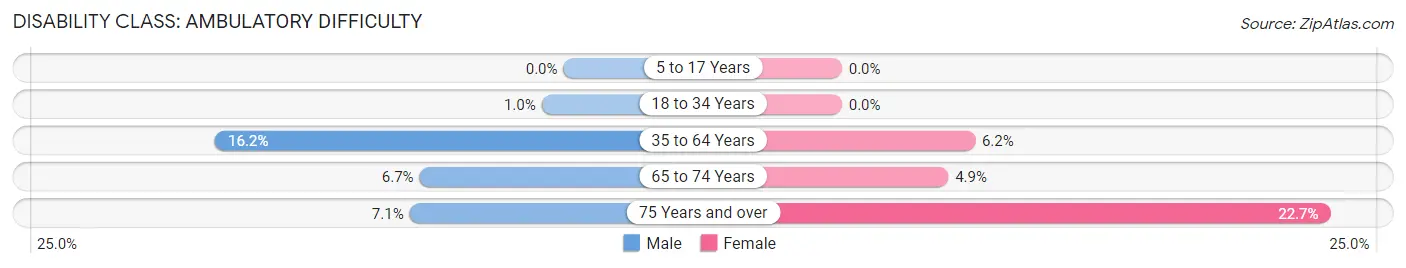
| Age Bracket | Male | Female |
| 5 to 17 Years | 0 (0.0%) | 0 (0.0%) |
| 18 to 34 Years | 3 (1.0%) | 0 (0.0%) |
| 35 to 64 Years | 64 (16.2%) | 42 (6.2%) |
| 65 to 74 Years | 35 (6.7%) | 23 (4.9%) |
| 75 Years and over | 17 (7.1%) | 95 (22.7%) |
Disability Class: Self-Care Difficulty
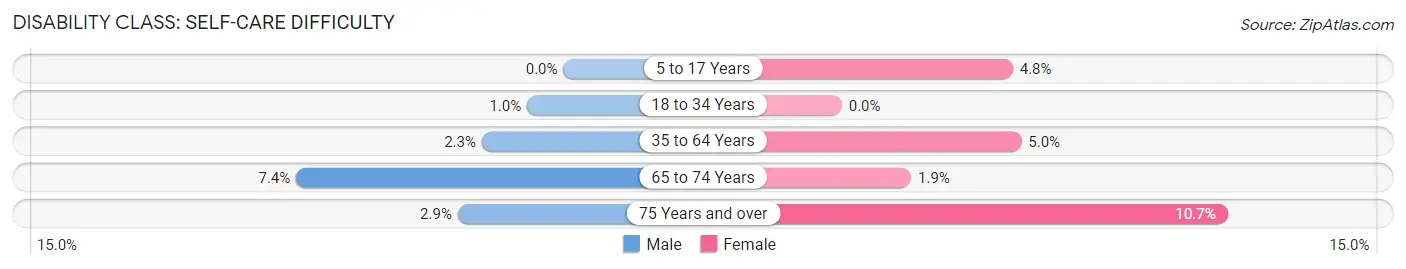
| Age Bracket | Male | Female |
| 5 to 17 Years | 0 (0.0%) | 5 (4.8%) |
| 18 to 34 Years | 3 (1.0%) | 0 (0.0%) |
| 35 to 64 Years | 9 (2.3%) | 34 (5.0%) |
| 65 to 74 Years | 39 (7.4%) | 9 (1.9%) |
| 75 Years and over | 7 (2.9%) | 45 (10.7%) |
Technology Access in Falmouth
Computing Device Access in Falmouth
| Device Type | # Households | % Households |
| Desktop or Laptop | 1,495 | 72.2% |
| Smartphone | 1,613 | 77.9% |
| Tablet | 1,217 | 58.8% |
| No Computing Device | 207 | 10.0% |
| Total | 2,070 | 100.0% |
Internet Access in Falmouth
| Internet Type | # Households | % Households |
| Dial-Up Internet | 0 | 0.0% |
| Broadband Home | 1,501 | 72.5% |
| Cellular Data Only | 272 | 13.1% |
| Satellite Internet | 78 | 3.8% |
| No Internet | 297 | 14.3% |
| Total | 2,070 | 100.0% |
Falmouth Summary
Falmouth, Massachusetts is a town located in Barnstable County on Cape Cod. It is bordered by the towns of Bourne, Mashpee, Sandwich, and Barnstable. The town has a population of 31,531 as of the 2010 census, making it the second most populous town on Cape Cod.
History
The area that is now Falmouth was first settled in 1660 by English colonists. The town was officially incorporated in 1686 and was named after Falmouth, Cornwall in England. The town was initially a fishing and farming community, but by the mid-19th century, it had become a popular summer resort destination. The town was home to several large hotels, including the Falmouth Hotel, which was built in 1875 and was the largest hotel on Cape Cod at the time.
Geography
Falmouth is located on the southwestern tip of Cape Cod. It is bordered by the towns of Bourne, Mashpee, Sandwich, and Barnstable. The town has a total area of 54.2 square miles, of which 48.2 square miles is land and 6.0 square miles is water. The town is home to several bodies of water, including Buzzards Bay, Vineyard Sound, and Nantucket Sound.
Economy
The economy of Falmouth is largely based on tourism. The town is home to several popular beaches, including Old Silver Beach, which is one of the most popular beaches on Cape Cod. The town is also home to several marinas, which attract visitors from all over the world. In addition, the town is home to several restaurants, shops, and other businesses that cater to tourists.
Demographics
As of the 2010 census, there were 31,531 people, 13,845 households, and 8,845 families residing in the town. The population density was 651.2 people per square mile. The racial makeup of the town was 94.2% White, 1.7% African American, 0.3% Native American, 1.2% Asian, 0.1% Pacific Islander, 1.2% from other races, and 1.4% from two or more races. Hispanic or Latino of any race were 3.2% of the population.
The median income for a household in the town was $60,945, and the median income for a family was $76,845. The per capita income for the town was $35,945. About 4.2% of families and 6.3% of the population were below the poverty line, including 8.2% of those under age 18 and 4.2% of those age 65 or over.
Common Questions
What is Per Capita Income in Falmouth?
Per Capita income in Falmouth is $55,259.
What is the Median Family Income in Falmouth?
Median Family Income in Falmouth is $110,000.
What is the Median Household income in Falmouth?
Median Household Income in Falmouth is $57,333.
What is Income or Wage Gap in Falmouth?
Income or Wage Gap in Falmouth is 5.2%.
Women in Falmouth earn 94.8 cents for every dollar earned by a man.
What is Inequality or Gini Index in Falmouth?
Inequality or Gini Index in Falmouth is 0.56.
What is the Total Population of Falmouth?
Total Population of Falmouth is 3,883.
What is the Total Male Population of Falmouth?
Total Male Population of Falmouth is 1,682.
What is the Total Female Population of Falmouth?
Total Female Population of Falmouth is 2,201.
What is the Ratio of Males per 100 Females in Falmouth?
There are 76.42 Males per 100 Females in Falmouth.
What is the Ratio of Females per 100 Males in Falmouth?
There are 130.86 Females per 100 Males in Falmouth.
What is the Median Population Age in Falmouth?
Median Population Age in Falmouth is 62.4 Years.
What is the Average Family Size in Falmouth
Average Family Size in Falmouth is 2.5 People.
What is the Average Household Size in Falmouth
Average Household Size in Falmouth is 1.8 People.
How Large is the Labor Force in Falmouth?
There are 1,599 People in the Labor Forcein in Falmouth.
What is the Percentage of People in the Labor Force in Falmouth?
45.4% of People are in the Labor Force in Falmouth.
What is the Unemployment Rate in Falmouth?
Unemployment Rate in Falmouth is 3.9%.