Big Island, VA Map & Demographics
Big Island Map
Big Island Overview
$25,584
PER CAPITA INCOME
$38,641
AVG FAMILY INCOME
$40,268
AVG HOUSEHOLD INCOME
0.26
INEQUALITY / GINI INDEX
181
TOTAL POPULATION
95
MALE POPULATION
86
FEMALE POPULATION
110.47
MALES / 100 FEMALES
90.53
FEMALES / 100 MALES
54.9
MEDIAN AGE
2.1
AVG FAMILY SIZE
1.6
AVG HOUSEHOLD SIZE
52
LABOR FORCE [ PEOPLE ]
31.1%
PERCENT IN LABOR FORCE
Big Island Zip Codes
Big Island Area Codes
Income in Big Island
Income Overview in Big Island
Per Capita Income in Big Island is $25,584, while median incomes of families and households are $38,641 and $40,268 respectively.
| Characteristic | Number | Measure |
| Per Capita Income | 181 | $25,584 |
| Median Family Income | 49 | $38,641 |
| Mean Family Income | 49 | $36,414 |
| Median Household Income | 113 | $40,268 |
| Mean Household Income | 113 | $41,815 |
| Income Deficit | 49 | $0 |
| Wage / Income Gap (%) | 181 | 0.00% |
| Wage / Income Gap ($) | 181 | 100.00¢ per $1 |
| Gini / Inequality Index | 181 | 0.26 |
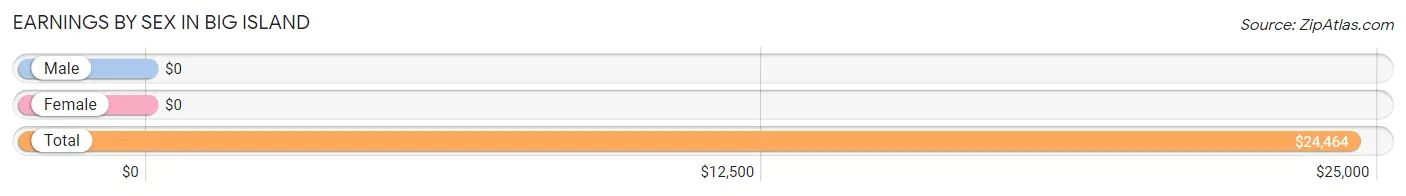
Earnings by Sex in Big Island
| Sex | Number | Average Earnings |
| Male | 31 (59.6%) | $0 |
| Female | 21 (40.4%) | $0 |
| Total | 52 (100.0%) | $24,464 |
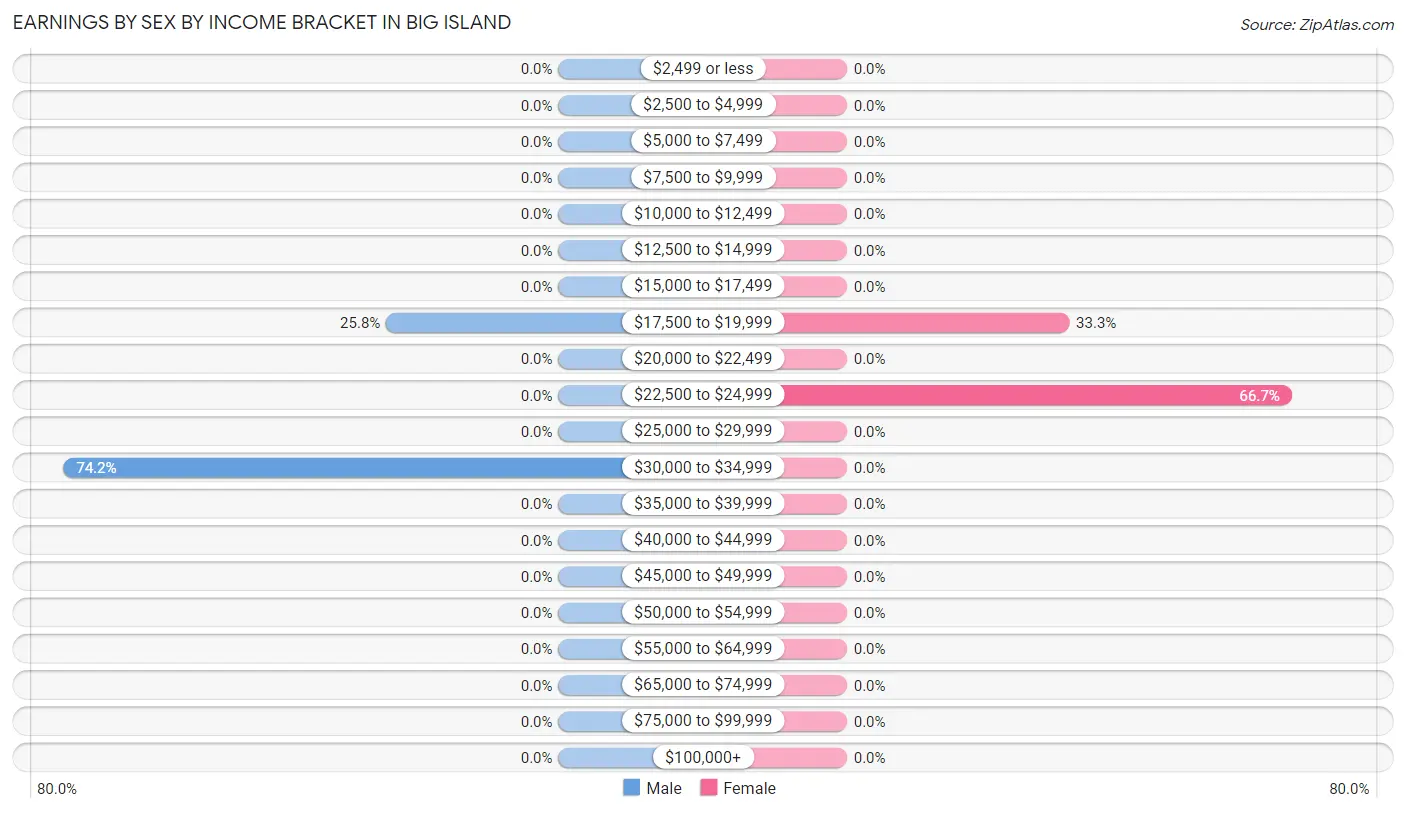
Earnings by Sex by Income Bracket in Big Island
The most common earnings brackets in Big Island are $30,000 to $34,999 for men (23 | 74.2%) and $22,500 to $24,999 for women (14 | 66.7%).
| Income | Male | Female |
| $2,499 or less | 0 (0.0%) | 0 (0.0%) |
| $2,500 to $4,999 | 0 (0.0%) | 0 (0.0%) |
| $5,000 to $7,499 | 0 (0.0%) | 0 (0.0%) |
| $7,500 to $9,999 | 0 (0.0%) | 0 (0.0%) |
| $10,000 to $12,499 | 0 (0.0%) | 0 (0.0%) |
| $12,500 to $14,999 | 0 (0.0%) | 0 (0.0%) |
| $15,000 to $17,499 | 0 (0.0%) | 0 (0.0%) |
| $17,500 to $19,999 | 8 (25.8%) | 7 (33.3%) |
| $20,000 to $22,499 | 0 (0.0%) | 0 (0.0%) |
| $22,500 to $24,999 | 0 (0.0%) | 14 (66.7%) |
| $25,000 to $29,999 | 0 (0.0%) | 0 (0.0%) |
| $30,000 to $34,999 | 23 (74.2%) | 0 (0.0%) |
| $35,000 to $39,999 | 0 (0.0%) | 0 (0.0%) |
| $40,000 to $44,999 | 0 (0.0%) | 0 (0.0%) |
| $45,000 to $49,999 | 0 (0.0%) | 0 (0.0%) |
| $50,000 to $54,999 | 0 (0.0%) | 0 (0.0%) |
| $55,000 to $64,999 | 0 (0.0%) | 0 (0.0%) |
| $65,000 to $74,999 | 0 (0.0%) | 0 (0.0%) |
| $75,000 to $99,999 | 0 (0.0%) | 0 (0.0%) |
| $100,000+ | 0 (0.0%) | 0 (0.0%) |
| Total | 31 (100.0%) | 21 (100.0%) |
Earnings by Sex by Educational Attainment in Big Island
| Educational Attainment | Male Income | Female Income |
| Less than High School | - | - |
| High School Diploma | - | - |
| College or Associate's Degree | - | - |
| Bachelor's Degree | - | - |
| Graduate Degree | - | - |
| Total | - | - |
Family Income in Big Island
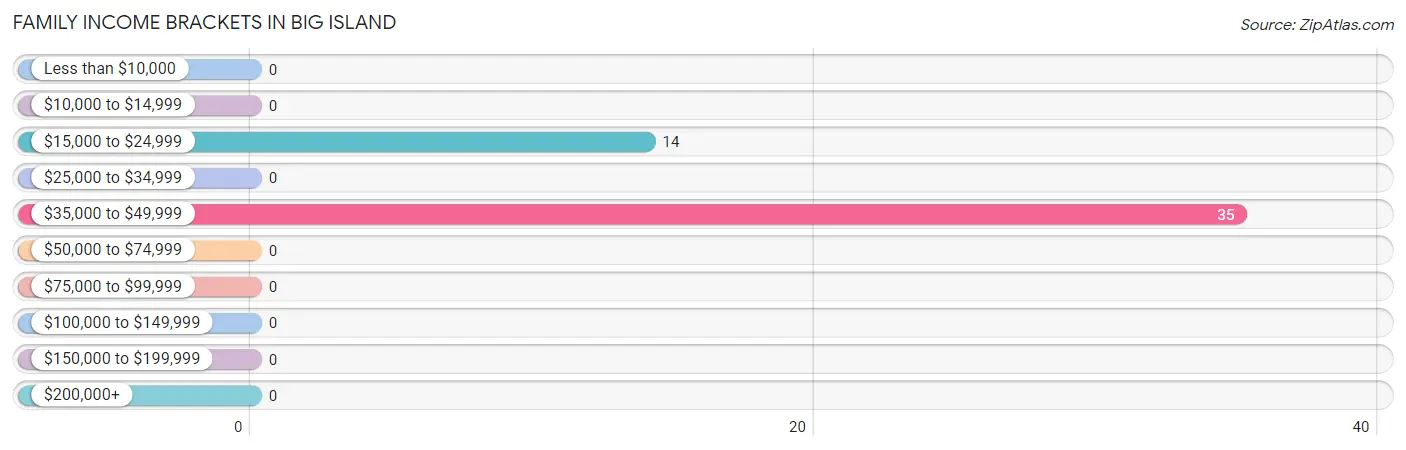
Family Income Brackets in Big Island
According to the Big Island family income data, there are 35 families falling into the $35,000 to $49,999 income range, which is the most common income bracket and makes up 71.4% of all families.
| Income Bracket | # Families | % Families |
| Less than $10,000 | 0 | 0.0% |
| $10,000 to $14,999 | 0 | 0.0% |
| $15,000 to $24,999 | 14 | 28.6% |
| $25,000 to $34,999 | 0 | 0.0% |
| $35,000 to $49,999 | 35 | 71.4% |
| $50,000 to $74,999 | 0 | 0.0% |
| $75,000 to $99,999 | 0 | 0.0% |
| $100,000 to $149,999 | 0 | 0.0% |
| $150,000 to $199,999 | 0 | 0.0% |
| $200,000+ | 0 | 0.0% |
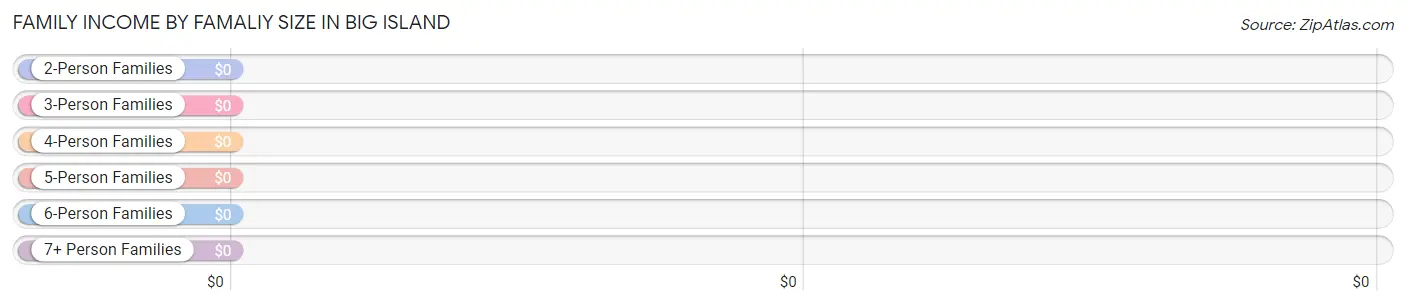
Family Income by Famaliy Size in Big Island
| Income Bracket | # Families | Median Income |
| 2-Person Families | 37 (75.5%) | $0 |
| 3-Person Families | 12 (24.5%) | $0 |
| 4-Person Families | 0 (0.0%) | $0 |
| 5-Person Families | 0 (0.0%) | $0 |
| 6-Person Families | 0 (0.0%) | $0 |
| 7+ Person Families | 0 (0.0%) | $0 |
| Total | 49 (100.0%) | $38,641 |
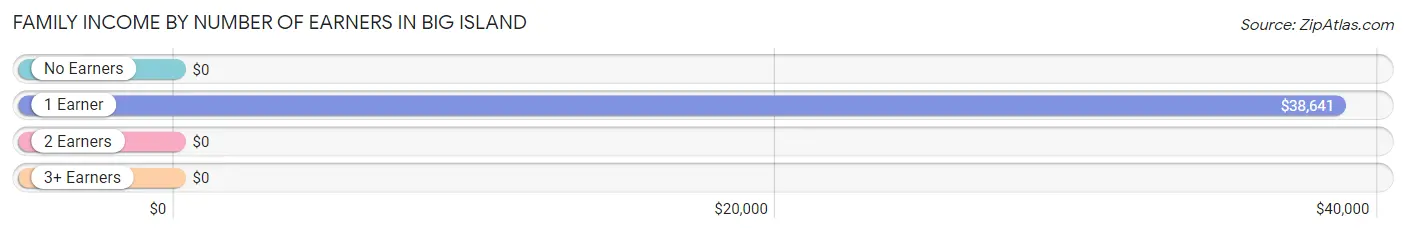
Family Income by Number of Earners in Big Island
| Number of Earners | # Families | Median Income |
| No Earners | 0 (0.0%) | $0 |
| 1 Earner | 49 (100.0%) | $38,641 |
| 2 Earners | 0 (0.0%) | $0 |
| 3+ Earners | 0 (0.0%) | $0 |
| Total | 49 (100.0%) | $38,641 |
Household Income in Big Island
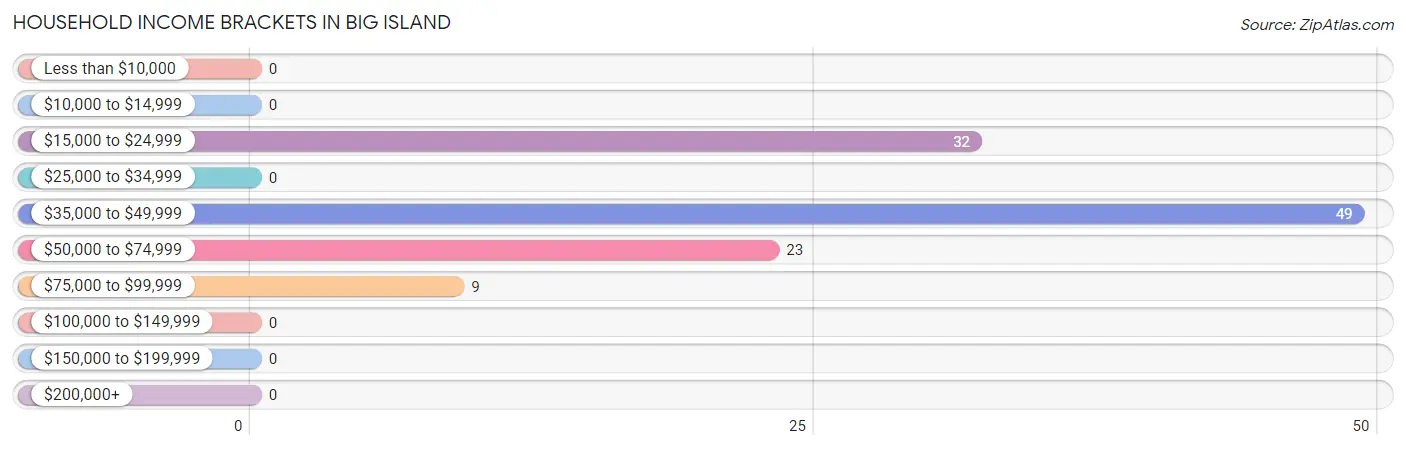
Household Income Brackets in Big Island
With 49 households falling in the category, the $35,000 to $49,999 income range is the most frequent in Big Island, accounting for 43.4% of all households.
| Income Bracket | # Households | % Households |
| Less than $10,000 | 0 | 0.0% |
| $10,000 to $14,999 | 0 | 0.0% |
| $15,000 to $24,999 | 32 | 28.3% |
| $25,000 to $34,999 | 0 | 0.0% |
| $35,000 to $49,999 | 49 | 43.4% |
| $50,000 to $74,999 | 23 | 20.4% |
| $75,000 to $99,999 | 9 | 8.0% |
| $100,000 to $149,999 | 0 | 0.0% |
| $150,000 to $199,999 | 0 | 0.0% |
| $200,000+ | 0 | 0.0% |
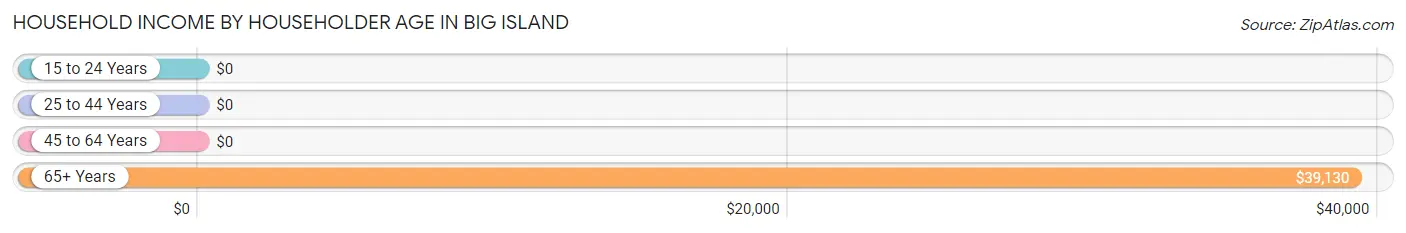
Household Income by Householder Age in Big Island
The median household income in Big Island is $40,268, with the highest median household income of $39,130 found in the 65+ years age bracket for the primary householder. A total of 80 households (70.8%) fall into this category.
| Income Bracket | # Households | Median Income |
| 15 to 24 Years | 0 (0.0%) | $0 |
| 25 to 44 Years | 14 (12.4%) | $0 |
| 45 to 64 Years | 19 (16.8%) | $0 |
| 65+ Years | 80 (70.8%) | $39,130 |
| Total | 113 (100.0%) | $40,268 |
Poverty in Big Island
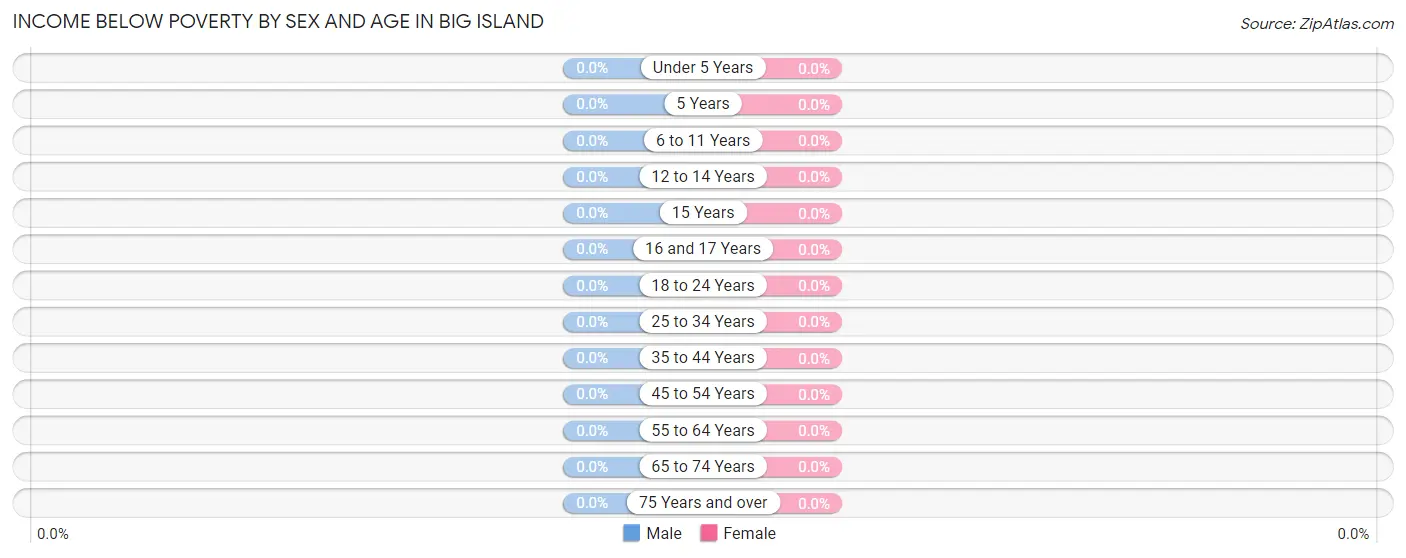
Income Below Poverty by Sex and Age in Big Island
| Age Bracket | Male | Female |
| Under 5 Years | 0 (0.0%) | 0 (0.0%) |
| 5 Years | 0 (0.0%) | 0 (0.0%) |
| 6 to 11 Years | 0 (0.0%) | 0 (0.0%) |
| 12 to 14 Years | 0 (0.0%) | 0 (0.0%) |
| 15 Years | 0 (0.0%) | 0 (0.0%) |
| 16 and 17 Years | 0 (0.0%) | 0 (0.0%) |
| 18 to 24 Years | 0 (0.0%) | 0 (0.0%) |
| 25 to 34 Years | 0 (0.0%) | 0 (0.0%) |
| 35 to 44 Years | 0 (0.0%) | 0 (0.0%) |
| 45 to 54 Years | 0 (0.0%) | 0 (0.0%) |
| 55 to 64 Years | 0 (0.0%) | 0 (0.0%) |
| 65 to 74 Years | 0 (0.0%) | 0 (0.0%) |
| 75 Years and over | 0 (0.0%) | 0 (0.0%) |
| Total | 0 (0.0%) | 0 (0.0%) |
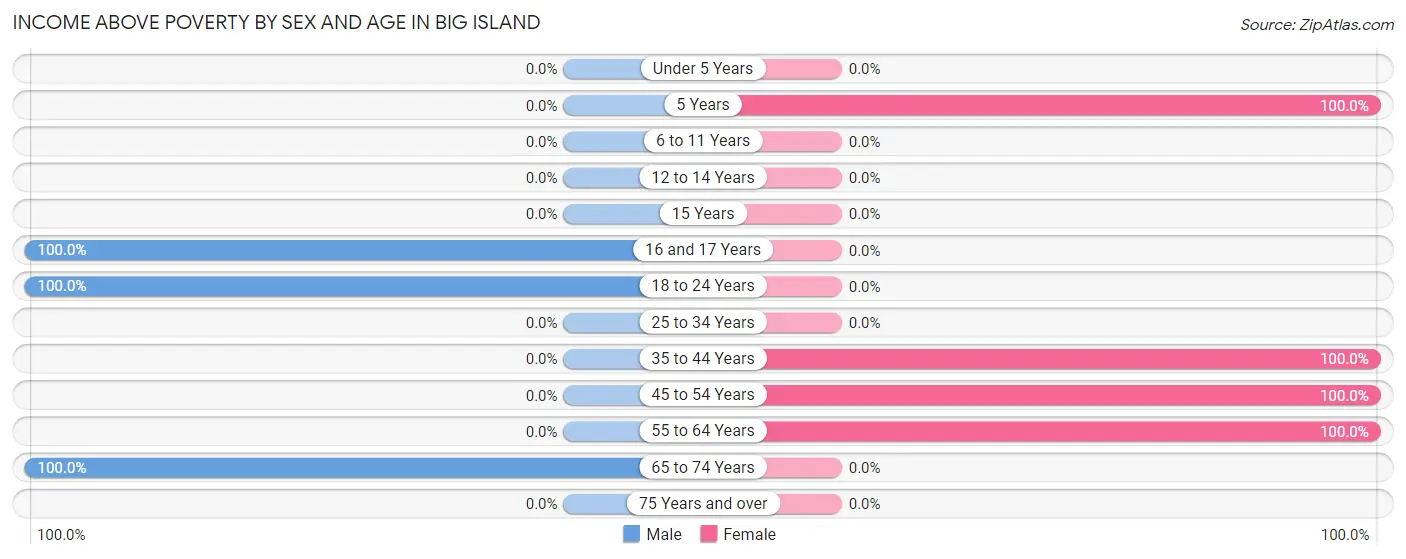
Income Above Poverty by Sex and Age in Big Island
According to the poverty statistics in Big Island, males aged 16 and 17 years and females aged 5 years are the age groups that are most secure financially, with 100.0% of males and 100.0% of females in these age groups living above the poverty line.
| Age Bracket | Male | Female |
| Under 5 Years | 0 (0.0%) | 0 (0.0%) |
| 5 Years | 0 (0.0%) | 14 (100.0%) |
| 6 to 11 Years | 0 (0.0%) | 0 (0.0%) |
| 12 to 14 Years | 0 (0.0%) | 0 (0.0%) |
| 15 Years | 0 (0.0%) | 0 (0.0%) |
| 16 and 17 Years | 7 (100.0%) | 0 (0.0%) |
| 18 to 24 Years | 8 (100.0%) | 0 (0.0%) |
| 25 to 34 Years | 0 (0.0%) | 0 (0.0%) |
| 35 to 44 Years | 0 (0.0%) | 29 (100.0%) |
| 45 to 54 Years | 0 (0.0%) | 36 (100.0%) |
| 55 to 64 Years | 0 (0.0%) | 7 (100.0%) |
| 65 to 74 Years | 80 (100.0%) | 0 (0.0%) |
| 75 Years and over | 0 (0.0%) | 0 (0.0%) |
| Total | 95 (100.0%) | 86 (100.0%) |
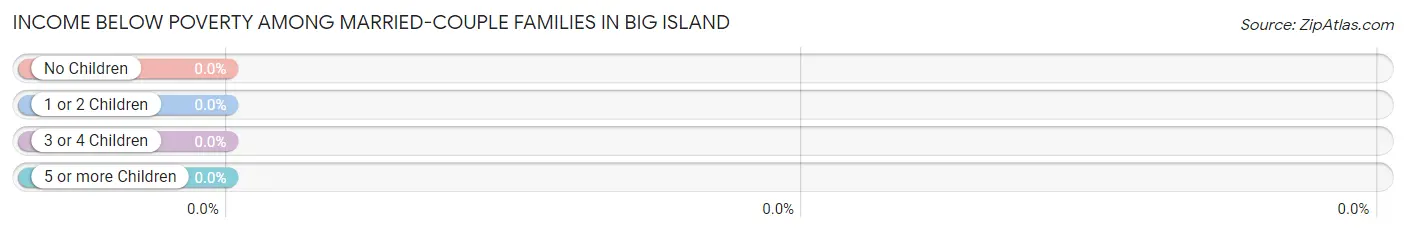
Income Below Poverty Among Married-Couple Families in Big Island
| Children | Above Poverty | Below Poverty |
| No Children | 23 (100.0%) | 0 (0.0%) |
| 1 or 2 Children | 0 (0.0%) | 0 (0.0%) |
| 3 or 4 Children | 0 (0.0%) | 0 (0.0%) |
| 5 or more Children | 0 (0.0%) | 0 (0.0%) |
| Total | 23 (100.0%) | 0 (0.0%) |
Income Below Poverty Among Single-Parent Households in Big Island
| Children | Single Father | Single Mother |
| No Children | 0 (0.0%) | 0 (0.0%) |
| 1 or 2 Children | 0 (0.0%) | 0 (0.0%) |
| 3 or 4 Children | 0 (0.0%) | 0 (0.0%) |
| 5 or more Children | 0 (0.0%) | 0 (0.0%) |
| Total | 0 (0.0%) | 0 (0.0%) |
Income Below Poverty Among Married-Couple vs Single-Parent Households in Big Island
| Children | Married-Couple Families | Single-Parent Households |
| No Children | 0 (0.0%) | 0 (0.0%) |
| 1 or 2 Children | 0 (0.0%) | 0 (0.0%) |
| 3 or 4 Children | 0 (0.0%) | 0 (0.0%) |
| 5 or more Children | 0 (0.0%) | 0 (0.0%) |
| Total | 0 (0.0%) | 0 (0.0%) |
Race in Big Island
The most populous races in Big Island are White / Caucasian (154 | 85.1%), and Black / African American (27 | 14.9%).
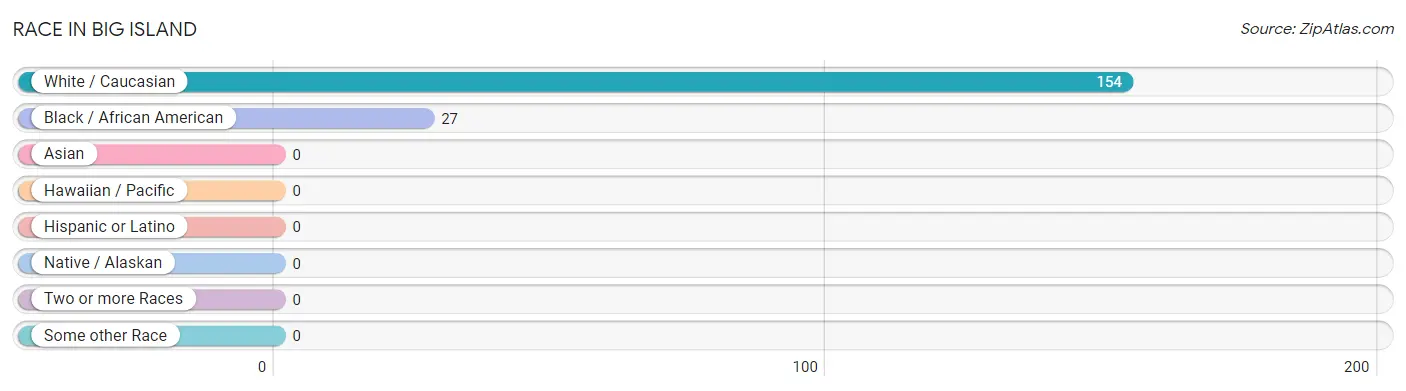
| Race | # Population | % Population |
| Asian | 0 | 0.0% |
| Black / African American | 27 | 14.9% |
| Hawaiian / Pacific | 0 | 0.0% |
| Hispanic or Latino | 0 | 0.0% |
| Native / Alaskan | 0 | 0.0% |
| White / Caucasian | 154 | 85.1% |
| Two or more Races | 0 | 0.0% |
| Some other Race | 0 | 0.0% |
| Total | 181 | 100.0% |
Ancestry in Big Island
The most populous ancestries reported in Big Island are American (25 | 13.8%), Brazilian (24 | 13.3%), German (23 | 12.7%), and Irish (23 | 12.7%), together accounting for 52.5% of all Big Island residents.
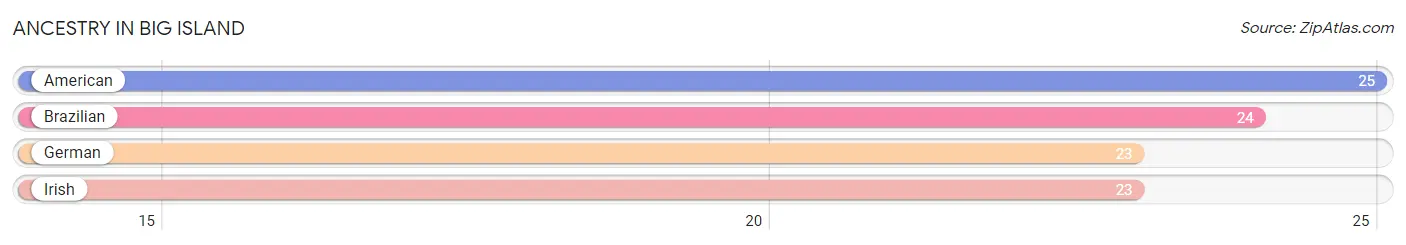
| Ancestry | # Population | % Population |
| American | 25 | 13.8% |
| Brazilian | 24 | 13.3% |
| German | 23 | 12.7% |
| Irish | 23 | 12.7% | View All 4 Rows |
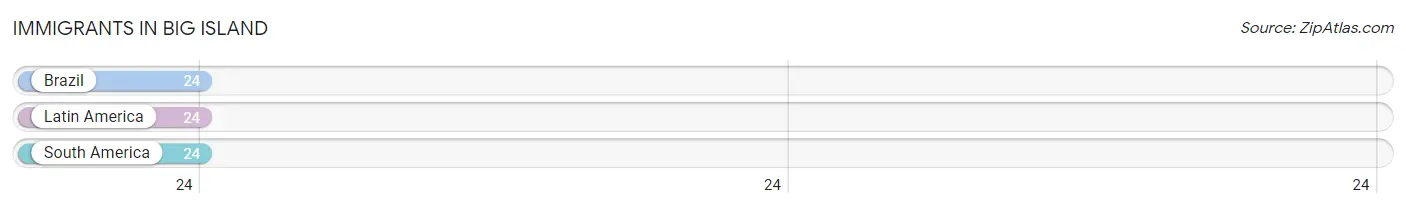
Immigrants in Big Island
The most numerous immigrant groups reported in Big Island came from Brazil (24 | 13.3%), Latin America (24 | 13.3%), and South America (24 | 13.3%), together accounting for 39.8% of all Big Island residents.
| Immigration Origin | # Population | % Population |
| Brazil | 24 | 13.3% |
| Latin America | 24 | 13.3% |
| South America | 24 | 13.3% | View All 3 Rows |
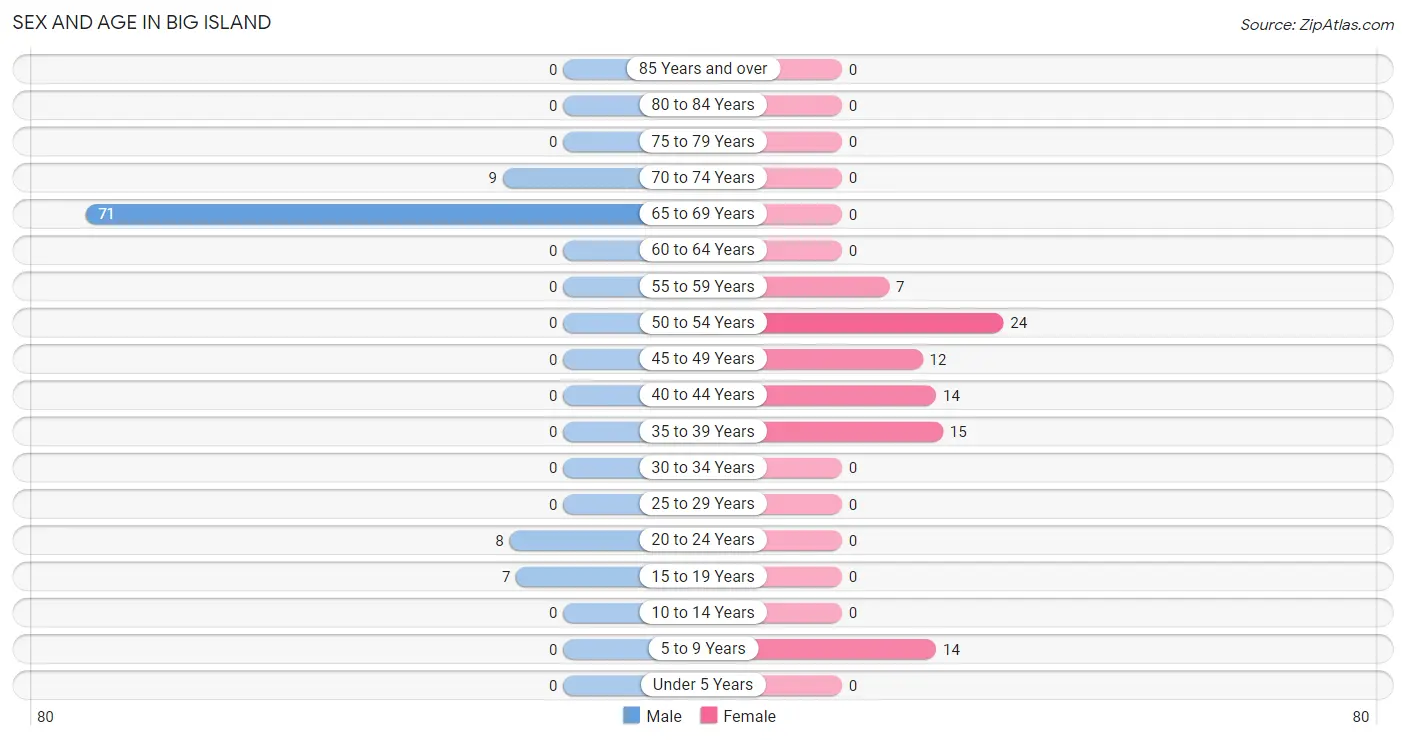
Sex and Age in Big Island
Sex and Age in Big Island
The most populous age groups in Big Island are 65 to 69 Years (71 | 74.7%) for men and 50 to 54 Years (24 | 27.9%) for women.
| Age Bracket | Male | Female |
| Under 5 Years | 0 (0.0%) | 0 (0.0%) |
| 5 to 9 Years | 0 (0.0%) | 14 (16.3%) |
| 10 to 14 Years | 0 (0.0%) | 0 (0.0%) |
| 15 to 19 Years | 7 (7.4%) | 0 (0.0%) |
| 20 to 24 Years | 8 (8.4%) | 0 (0.0%) |
| 25 to 29 Years | 0 (0.0%) | 0 (0.0%) |
| 30 to 34 Years | 0 (0.0%) | 0 (0.0%) |
| 35 to 39 Years | 0 (0.0%) | 15 (17.4%) |
| 40 to 44 Years | 0 (0.0%) | 14 (16.3%) |
| 45 to 49 Years | 0 (0.0%) | 12 (14.0%) |
| 50 to 54 Years | 0 (0.0%) | 24 (27.9%) |
| 55 to 59 Years | 0 (0.0%) | 7 (8.1%) |
| 60 to 64 Years | 0 (0.0%) | 0 (0.0%) |
| 65 to 69 Years | 71 (74.7%) | 0 (0.0%) |
| 70 to 74 Years | 9 (9.5%) | 0 (0.0%) |
| 75 to 79 Years | 0 (0.0%) | 0 (0.0%) |
| 80 to 84 Years | 0 (0.0%) | 0 (0.0%) |
| 85 Years and over | 0 (0.0%) | 0 (0.0%) |
| Total | 95 (100.0%) | 86 (100.0%) |
Families and Households in Big Island
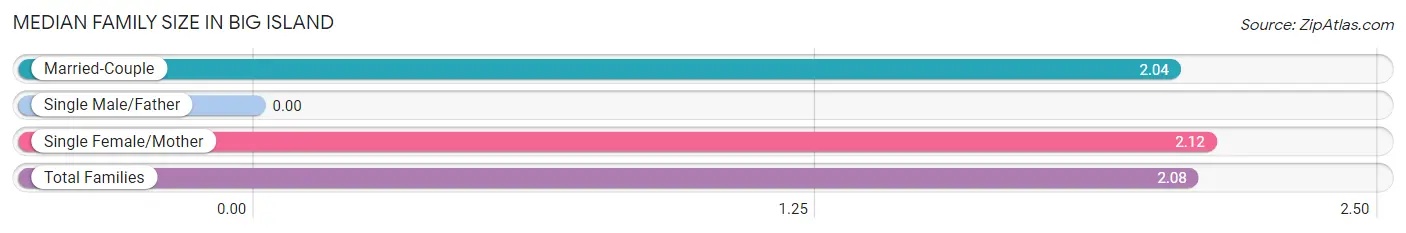
Median Family Size in Big Island
| Family Type | # Families | Family Size |
| Married-Couple | 23 (46.9%) | 2.04 |
| Single Male/Father | 0 (0.0%) | - |
| Single Female/Mother | 26 (53.1%) | 2.12 |
| Total Families | 49 (100.0%) | 2.08 |
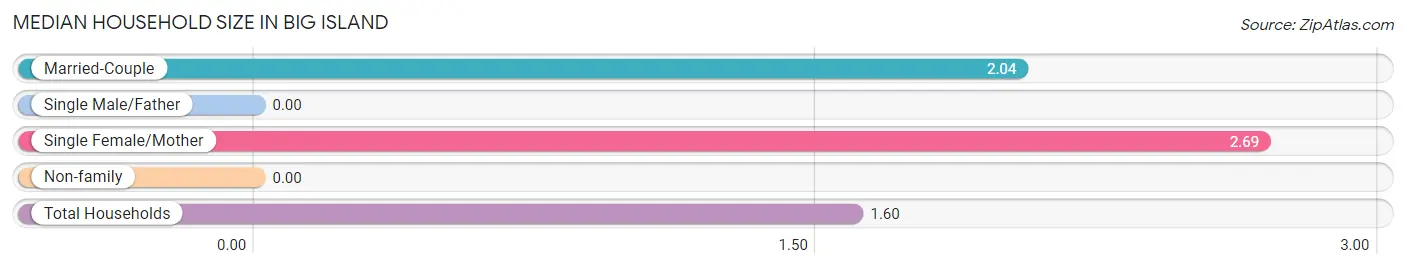
Median Household Size in Big Island
| Household Type | # Households | Household Size |
| Married-Couple | 23 (20.3%) | 2.04 |
| Single Male/Father | 0 (0.0%) | - |
| Single Female/Mother | 26 (23.0%) | 2.69 |
| Non-family | 64 (56.6%) | - |
| Total Households | 113 (100.0%) | 1.60 |
Household Size by Marriage Status in Big Island
Out of a total of 113 households in Big Island, 49 (43.4%) are family households, while 64 (56.6%) are nonfamily households. The most numerous type of family households are 3-person households, comprising 26, and the most common type of nonfamily households are 1-person households, comprising 64.
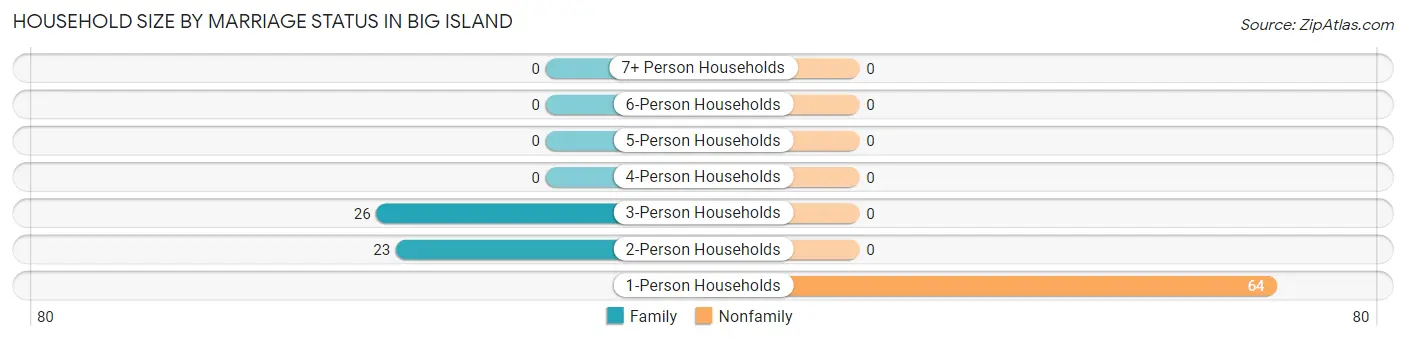
| Household Size | Family Households | Nonfamily Households |
| 1-Person Households | - | 64 (56.6%) |
| 2-Person Households | 23 (20.3%) | 0 (0.0%) |
| 3-Person Households | 26 (23.0%) | 0 (0.0%) |
| 4-Person Households | 0 (0.0%) | 0 (0.0%) |
| 5-Person Households | 0 (0.0%) | 0 (0.0%) |
| 6-Person Households | 0 (0.0%) | 0 (0.0%) |
| 7+ Person Households | 0 (0.0%) | 0 (0.0%) |
| Total | 49 (43.4%) | 64 (56.6%) |
Female Fertility in Big Island
Fertility by Age in Big Island
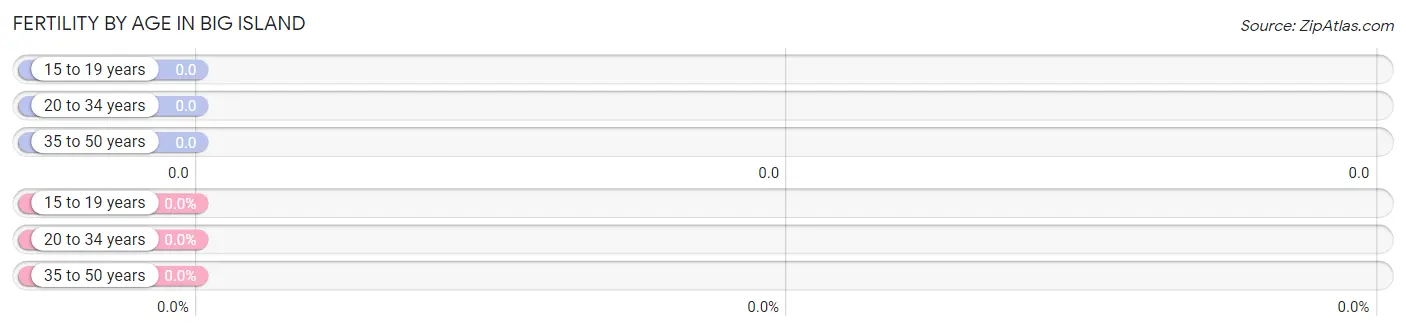
| Age Bracket | Women with Births | Births / 1,000 Women |
| 15 to 19 years | 0 (0.0%) | 0.0 |
| 20 to 34 years | 0 (0.0%) | 0.0 |
| 35 to 50 years | 0 (0.0%) | 0.0 |
| Total | 0 (0.0%) | 0.0 |
Fertility by Age by Marriage Status in Big Island
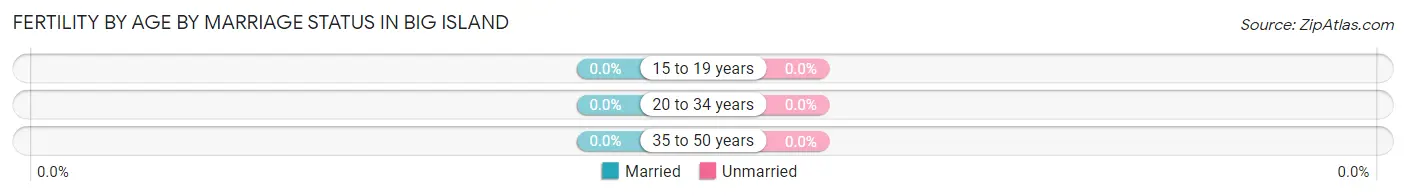
| Age Bracket | Married | Unmarried |
| 15 to 19 years | 0 (0.0%) | 0 (0.0%) |
| 20 to 34 years | 0 (0.0%) | 0 (0.0%) |
| 35 to 50 years | 0 (0.0%) | 0 (0.0%) |
| Total | 0 (0.0%) | 0 (0.0%) |
Fertility by Education in Big Island
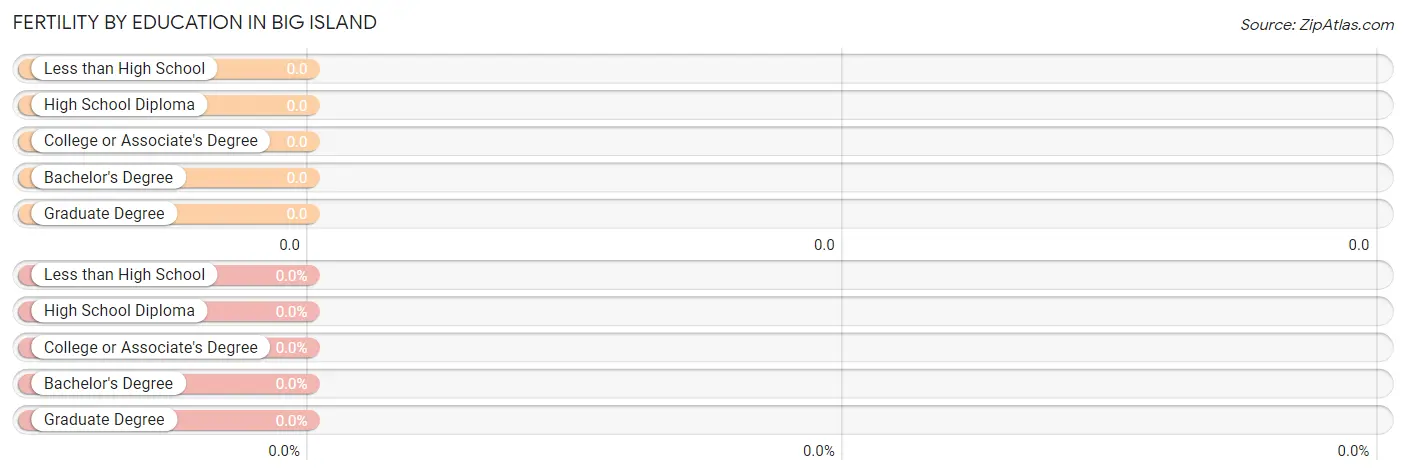
| Educational Attainment | Women with Births | Births / 1,000 Women |
| Less than High School | 0 (0.0%) | 0.0 |
| High School Diploma | 0 (0.0%) | 0.0 |
| College or Associate's Degree | 0 (0.0%) | 0.0 |
| Bachelor's Degree | 0 (0.0%) | 0.0 |
| Graduate Degree | 0 (0.0%) | 0.0 |
| Total | 0 (0.0%) | 0.0 |
Fertility by Education by Marriage Status in Big Island
| Educational Attainment | Married | Unmarried |
| Less than High School | 0 (0.0%) | 0 (0.0%) |
| High School Diploma | 0 (0.0%) | 0 (0.0%) |
| College or Associate's Degree | 0 (0.0%) | 0 (0.0%) |
| Bachelor's Degree | 0 (0.0%) | 0 (0.0%) |
| Graduate Degree | 0 (0.0%) | 0 (0.0%) |
| Total | 0 (0.0%) | 0 (0.0%) |
Employment Characteristics in Big Island
Employment by Class of Employer in Big Island
Among the 38 employed individuals in Big Island, self-employed (incorporated) (23 | 60.5%), and private company employees (15 | 39.5%) make up the most common classes of employment.
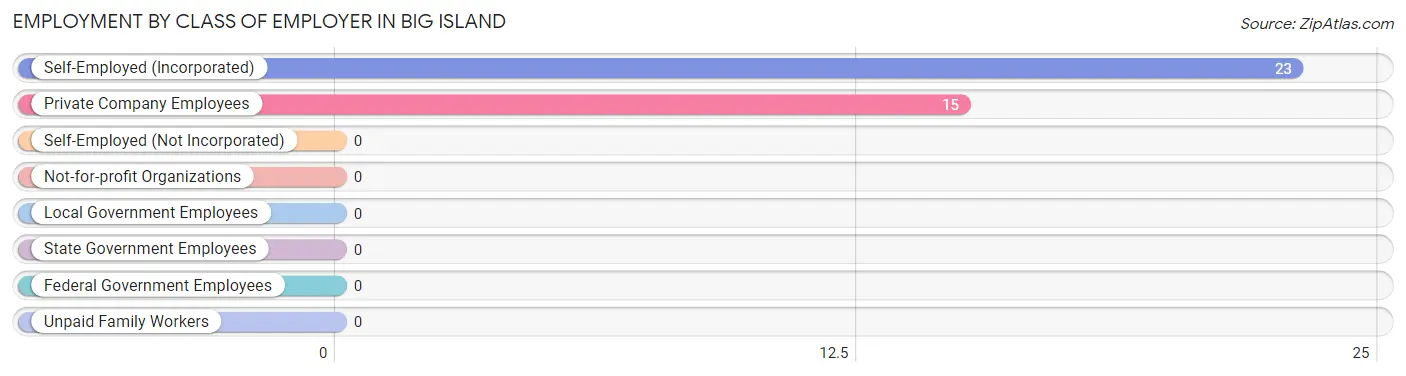
| Employer Class | # Employees | % Employees |
| Private Company Employees | 15 | 39.5% |
| Self-Employed (Incorporated) | 23 | 60.5% |
| Self-Employed (Not Incorporated) | 0 | 0.0% |
| Not-for-profit Organizations | 0 | 0.0% |
| Local Government Employees | 0 | 0.0% |
| State Government Employees | 0 | 0.0% |
| Federal Government Employees | 0 | 0.0% |
| Unpaid Family Workers | 0 | 0.0% |
| Total | 38 | 100.0% |
Employment Status by Age in Big Island
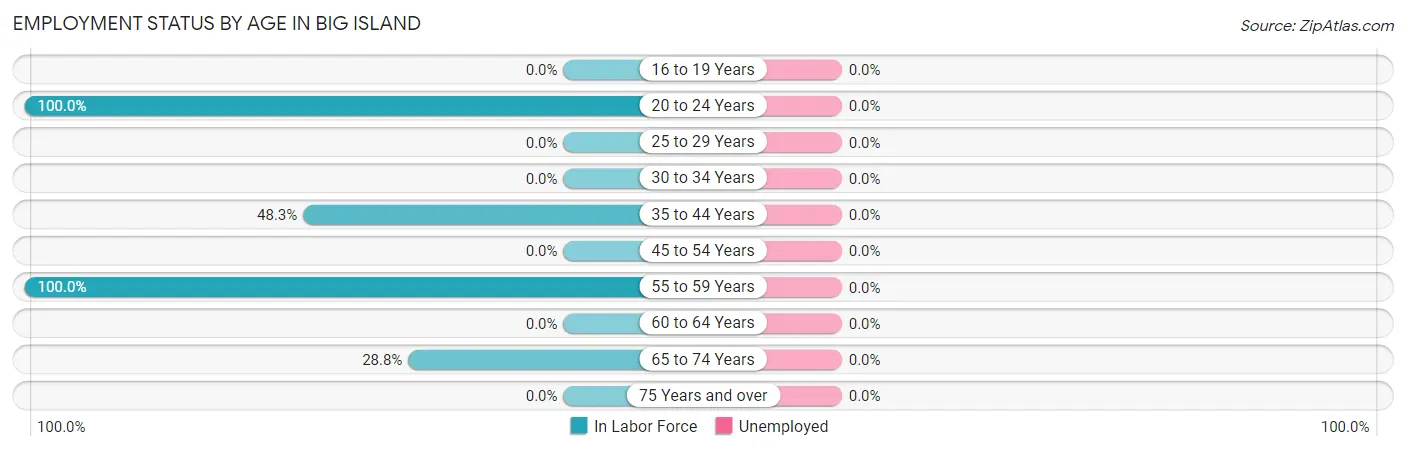
| Age Bracket | In Labor Force | Unemployed |
| 16 to 19 Years | 0 (0.0%) | 0 (0.0%) |
| 20 to 24 Years | 8 (100.0%) | 0 (0.0%) |
| 25 to 29 Years | 0 (0.0%) | 0 (0.0%) |
| 30 to 34 Years | 0 (0.0%) | 0 (0.0%) |
| 35 to 44 Years | 14 (48.3%) | 0 (0.0%) |
| 45 to 54 Years | 0 (0.0%) | 0 (0.0%) |
| 55 to 59 Years | 7 (100.0%) | 0 (0.0%) |
| 60 to 64 Years | 0 (0.0%) | 0 (0.0%) |
| 65 to 74 Years | 23 (28.8%) | 0 (0.0%) |
| 75 Years and over | 0 (0.0%) | 0 (0.0%) |
| Total | 52 (31.1%) | 0 (0.0%) |
Employment Status by Educational Attainment in Big Island
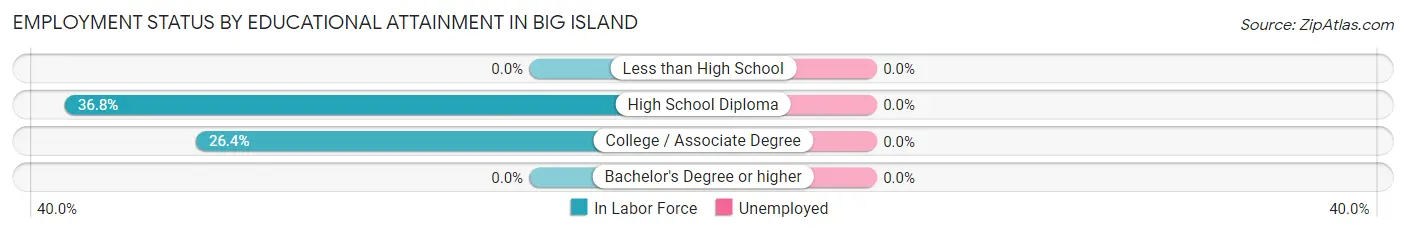
| Educational Attainment | In Labor Force | Unemployed |
| Less than High School | 0 (0.0%) | 0 (0.0%) |
| High School Diploma | 7 (36.8%) | 0 (0.0%) |
| College / Associate Degree | 14 (26.4%) | 0 (0.0%) |
| Bachelor's Degree or higher | 0 (0.0%) | 0 (0.0%) |
| Total | 21 (29.2%) | 0 (0.0%) |
Employment Occupations by Sex in Big Island
Management, Business, Science and Arts Occupations
The most common Management, Business, Science and Arts occupations in Big Island are , and Business & Financial (14 | 26.9%).
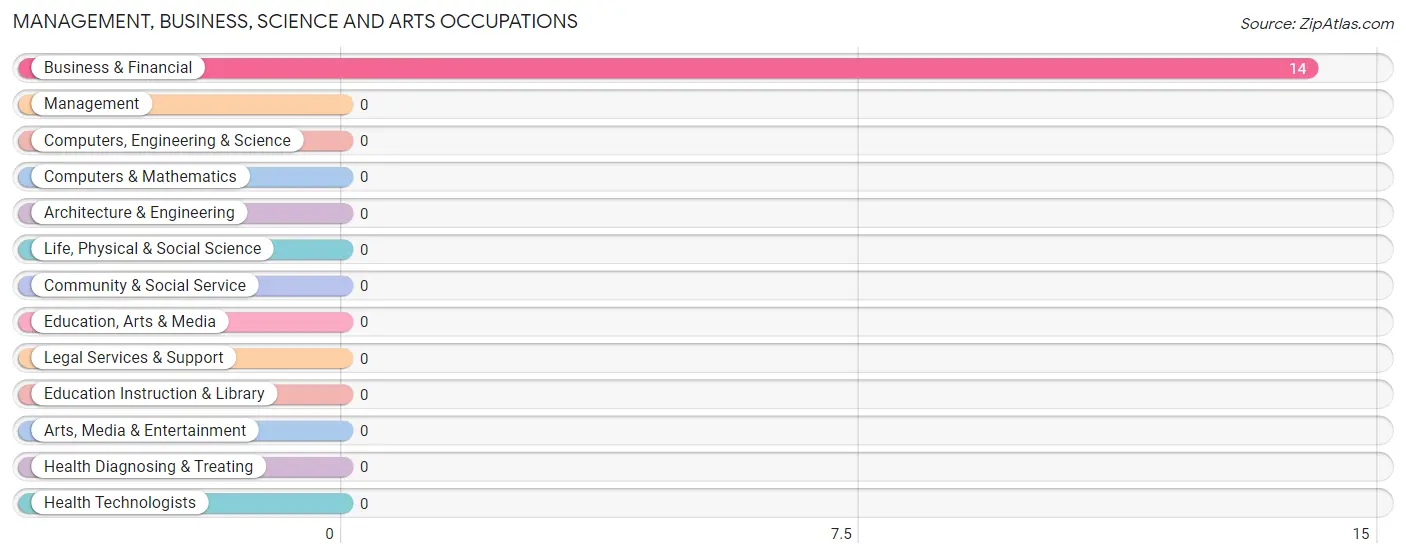
Management, Business, Science and Arts Occupations by Sex
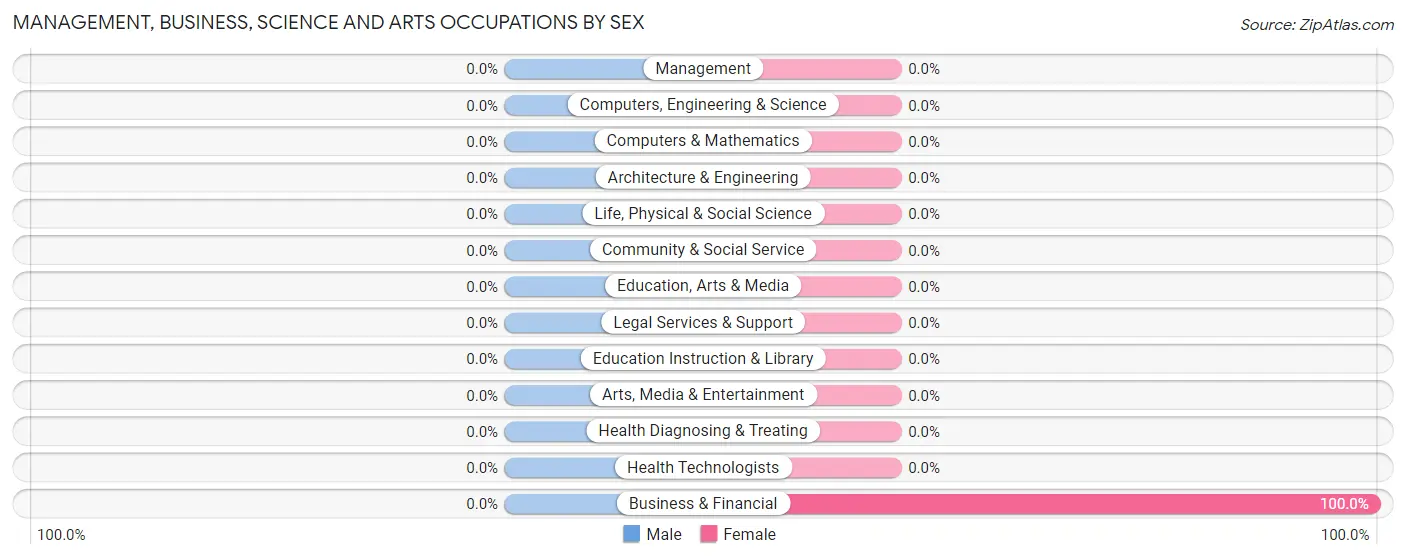
| Occupation | Male | Female |
| Management | 0 (0.0%) | 0 (0.0%) |
| Business & Financial | 0 (0.0%) | 14 (100.0%) |
| Computers, Engineering & Science | 0 (0.0%) | 0 (0.0%) |
| Computers & Mathematics | 0 (0.0%) | 0 (0.0%) |
| Architecture & Engineering | 0 (0.0%) | 0 (0.0%) |
| Life, Physical & Social Science | 0 (0.0%) | 0 (0.0%) |
| Community & Social Service | 0 (0.0%) | 0 (0.0%) |
| Education, Arts & Media | 0 (0.0%) | 0 (0.0%) |
| Legal Services & Support | 0 (0.0%) | 0 (0.0%) |
| Education Instruction & Library | 0 (0.0%) | 0 (0.0%) |
| Arts, Media & Entertainment | 0 (0.0%) | 0 (0.0%) |
| Health Diagnosing & Treating | 0 (0.0%) | 0 (0.0%) |
| Health Technologists | 0 (0.0%) | 0 (0.0%) |
| Total (Category) | 0 (0.0%) | 14 (100.0%) |
| Total (Overall) | 31 (59.6%) | 21 (40.4%) |
Services Occupations
The most common Services occupations in Big Island are , and Food Preparation & Serving (7 | 13.5%).
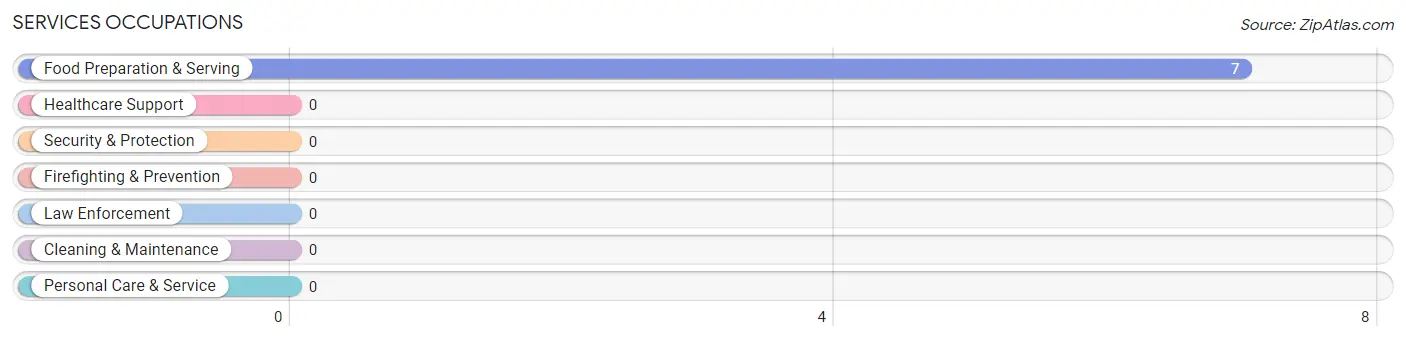
Services Occupations by Sex
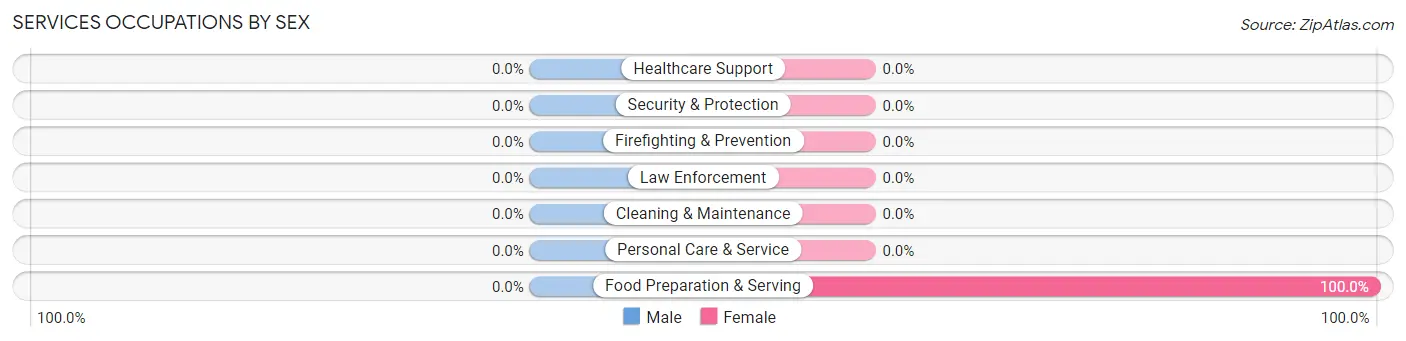
| Occupation | Male | Female |
| Healthcare Support | 0 (0.0%) | 0 (0.0%) |
| Security & Protection | 0 (0.0%) | 0 (0.0%) |
| Firefighting & Prevention | 0 (0.0%) | 0 (0.0%) |
| Law Enforcement | 0 (0.0%) | 0 (0.0%) |
| Food Preparation & Serving | 0 (0.0%) | 7 (100.0%) |
| Cleaning & Maintenance | 0 (0.0%) | 0 (0.0%) |
| Personal Care & Service | 0 (0.0%) | 0 (0.0%) |
| Total (Category) | 0 (0.0%) | 7 (100.0%) |
| Total (Overall) | 31 (59.6%) | 21 (40.4%) |
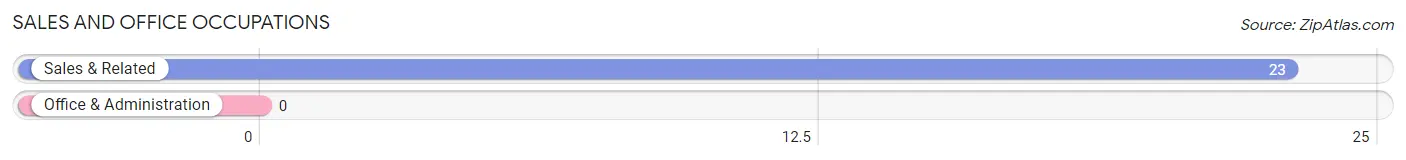
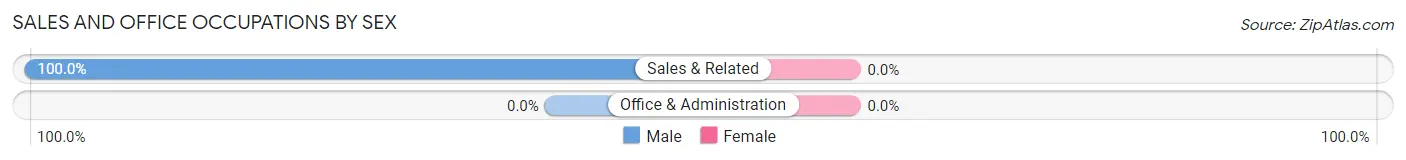
Sales and Office Occupations
The most common Sales and Office occupations in Big Island are , and Sales & Related (23 | 44.2%).
Sales and Office Occupations by Sex
| Occupation | Male | Female |
| Sales & Related | 23 (100.0%) | 0 (0.0%) |
| Office & Administration | 0 (0.0%) | 0 (0.0%) |
| Total (Category) | 23 (100.0%) | 0 (0.0%) |
| Total (Overall) | 31 (59.6%) | 21 (40.4%) |
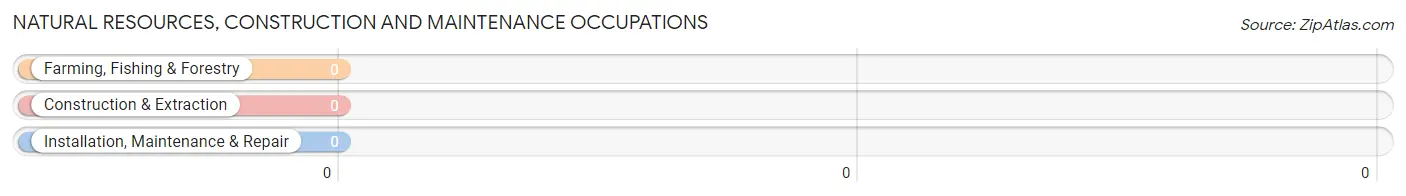
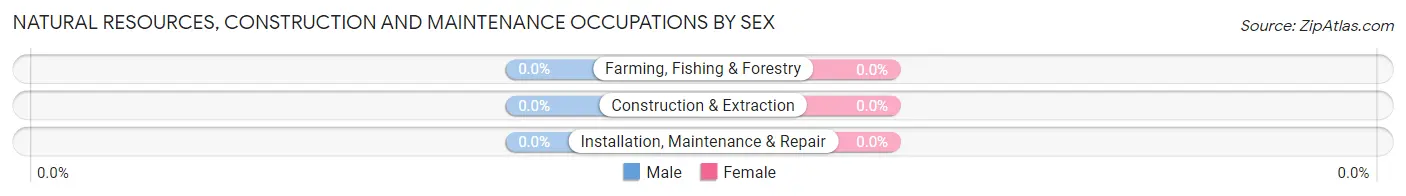
Natural Resources, Construction and Maintenance Occupations
Natural Resources, Construction and Maintenance Occupations by Sex
| Occupation | Male | Female |
| Farming, Fishing & Forestry | 0 (0.0%) | 0 (0.0%) |
| Construction & Extraction | 0 (0.0%) | 0 (0.0%) |
| Installation, Maintenance & Repair | 0 (0.0%) | 0 (0.0%) |
| Total (Category) | 0 (0.0%) | 0 (0.0%) |
| Total (Overall) | 31 (59.6%) | 21 (40.4%) |
Production, Transportation and Moving Occupations
The most common Production, Transportation and Moving occupations in Big Island are , and Material Moving (8 | 15.4%).
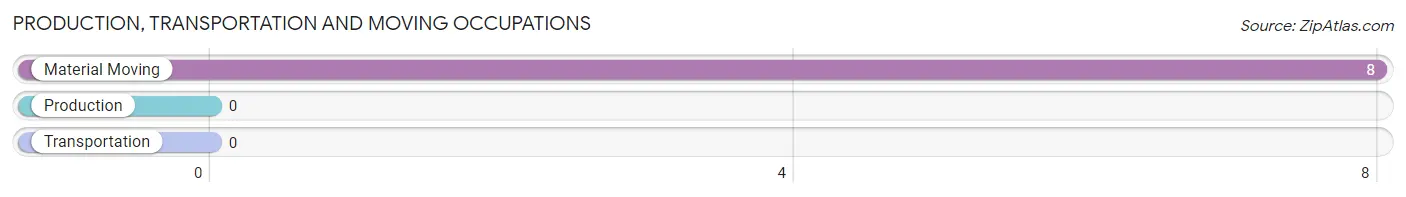
Production, Transportation and Moving Occupations by Sex
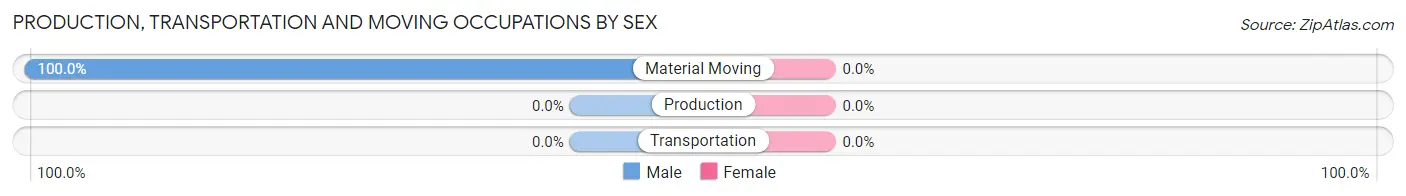
| Occupation | Male | Female |
| Production | 0 (0.0%) | 0 (0.0%) |
| Transportation | 0 (0.0%) | 0 (0.0%) |
| Material Moving | 8 (100.0%) | 0 (0.0%) |
| Total (Category) | 8 (100.0%) | 0 (0.0%) |
| Total (Overall) | 31 (59.6%) | 21 (40.4%) |
Employment Industries by Sex in Big Island
Employment Industries in Big Island
The major employment industries in Big Island include Retail Trade (38 | 73.1%), and Public Administration (14 | 26.9%).
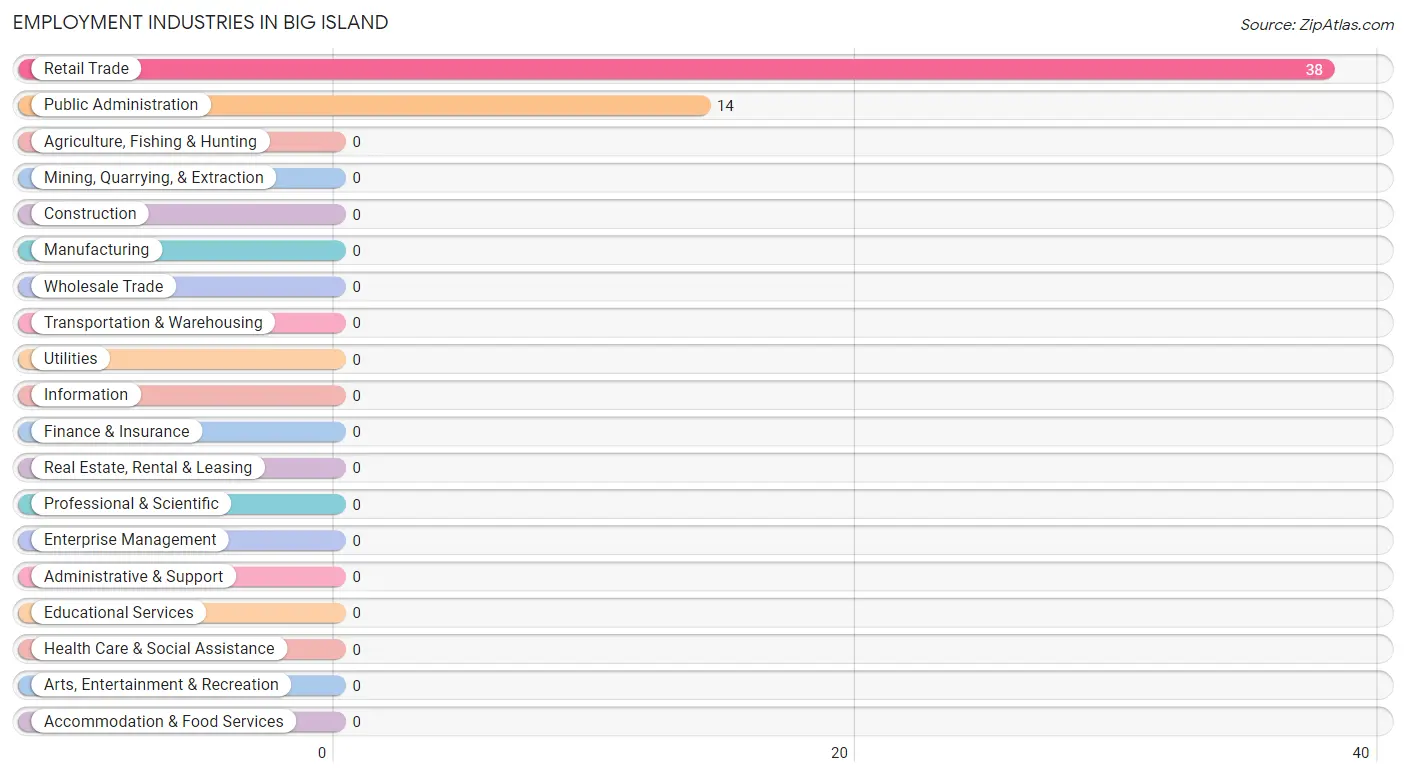
Employment Industries by Sex in Big Island
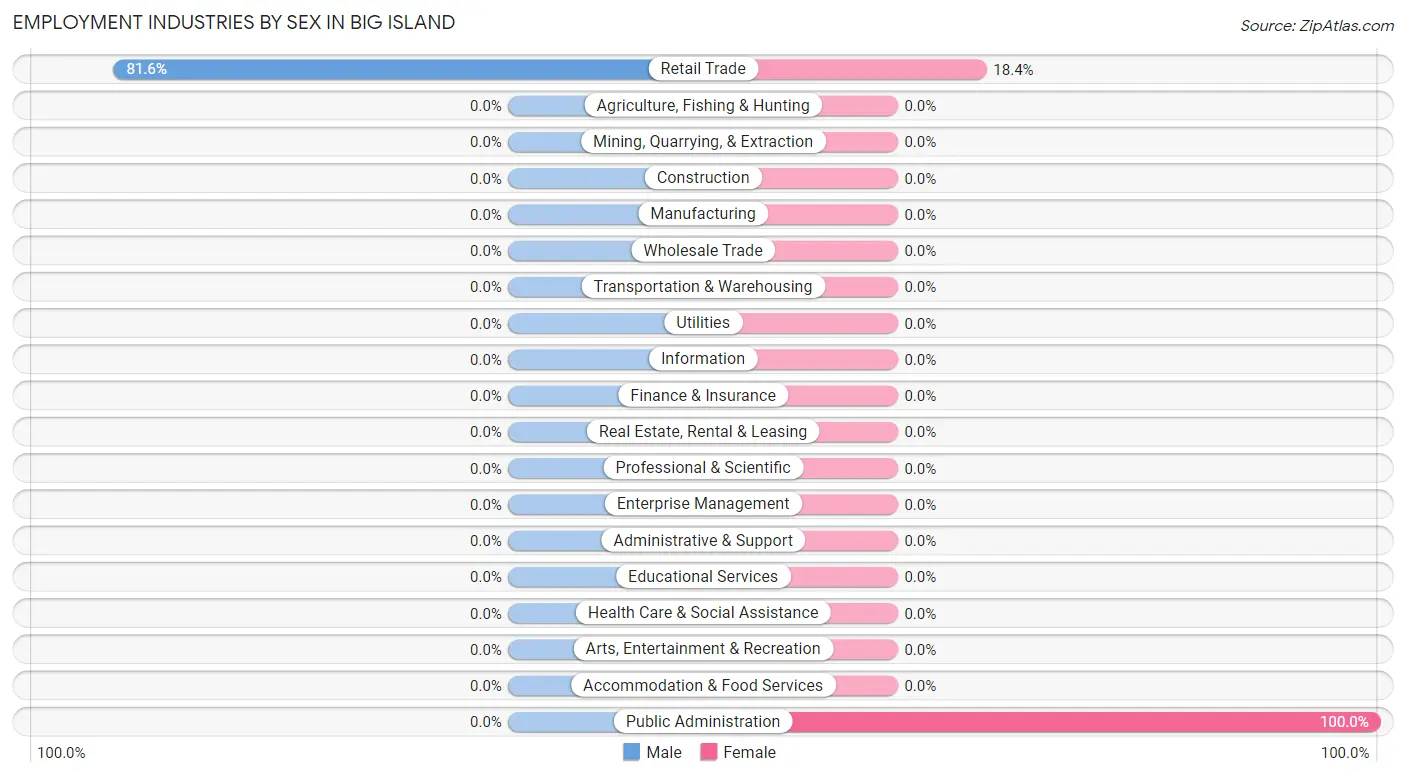
| Industry | Male | Female |
| Agriculture, Fishing & Hunting | 0 (0.0%) | 0 (0.0%) |
| Mining, Quarrying, & Extraction | 0 (0.0%) | 0 (0.0%) |
| Construction | 0 (0.0%) | 0 (0.0%) |
| Manufacturing | 0 (0.0%) | 0 (0.0%) |
| Wholesale Trade | 0 (0.0%) | 0 (0.0%) |
| Retail Trade | 31 (81.6%) | 7 (18.4%) |
| Transportation & Warehousing | 0 (0.0%) | 0 (0.0%) |
| Utilities | 0 (0.0%) | 0 (0.0%) |
| Information | 0 (0.0%) | 0 (0.0%) |
| Finance & Insurance | 0 (0.0%) | 0 (0.0%) |
| Real Estate, Rental & Leasing | 0 (0.0%) | 0 (0.0%) |
| Professional & Scientific | 0 (0.0%) | 0 (0.0%) |
| Enterprise Management | 0 (0.0%) | 0 (0.0%) |
| Administrative & Support | 0 (0.0%) | 0 (0.0%) |
| Educational Services | 0 (0.0%) | 0 (0.0%) |
| Health Care & Social Assistance | 0 (0.0%) | 0 (0.0%) |
| Arts, Entertainment & Recreation | 0 (0.0%) | 0 (0.0%) |
| Accommodation & Food Services | 0 (0.0%) | 0 (0.0%) |
| Public Administration | 0 (0.0%) | 14 (100.0%) |
| Total | 31 (59.6%) | 21 (40.4%) |
Education in Big Island
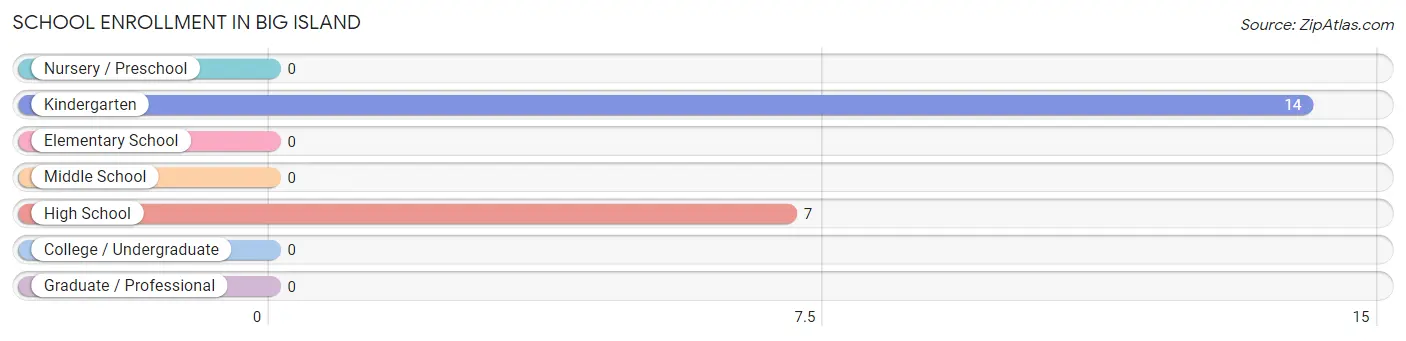
School Enrollment in Big Island
The most common levels of schooling among the 21 students in Big Island are kindergarten (14 | 66.7%), and high school (7 | 33.3%).
| School Level | # Students | % Students |
| Nursery / Preschool | 0 | 0.0% |
| Kindergarten | 14 | 66.7% |
| Elementary School | 0 | 0.0% |
| Middle School | 0 | 0.0% |
| High School | 7 | 33.3% |
| College / Undergraduate | 0 | 0.0% |
| Graduate / Professional | 0 | 0.0% |
| Total | 21 | 100.0% |
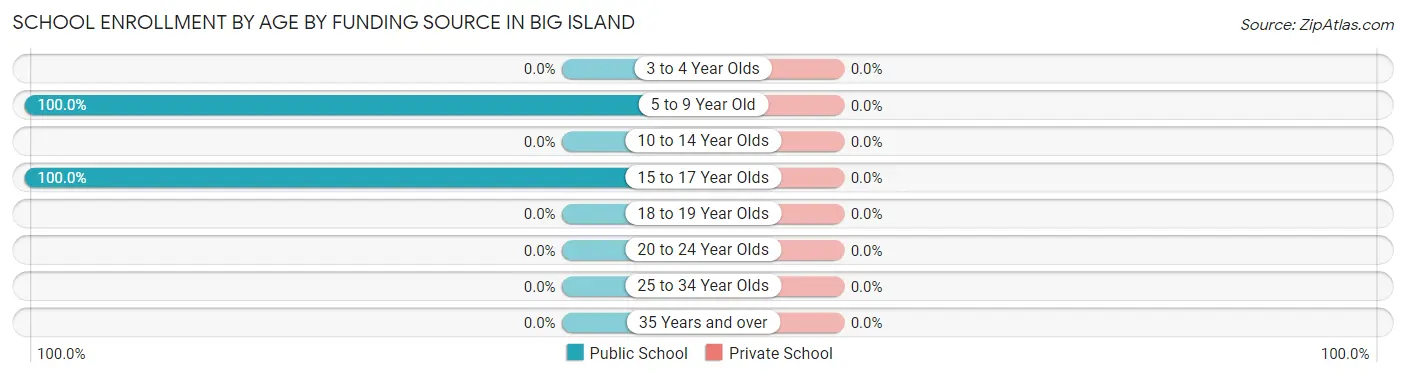
School Enrollment by Age by Funding Source in Big Island
| Age Bracket | Public School | Private School |
| 3 to 4 Year Olds | 0 (0.0%) | 0 (0.0%) |
| 5 to 9 Year Old | 14 (100.0%) | 0 (0.0%) |
| 10 to 14 Year Olds | 0 (0.0%) | 0 (0.0%) |
| 15 to 17 Year Olds | 7 (100.0%) | 0 (0.0%) |
| 18 to 19 Year Olds | 0 (0.0%) | 0 (0.0%) |
| 20 to 24 Year Olds | 0 (0.0%) | 0 (0.0%) |
| 25 to 34 Year Olds | 0 (0.0%) | 0 (0.0%) |
| 35 Years and over | 0 (0.0%) | 0 (0.0%) |
| Total | 21 (100.0%) | 0 (0.0%) |
Educational Attainment by Field of Study in Big Island
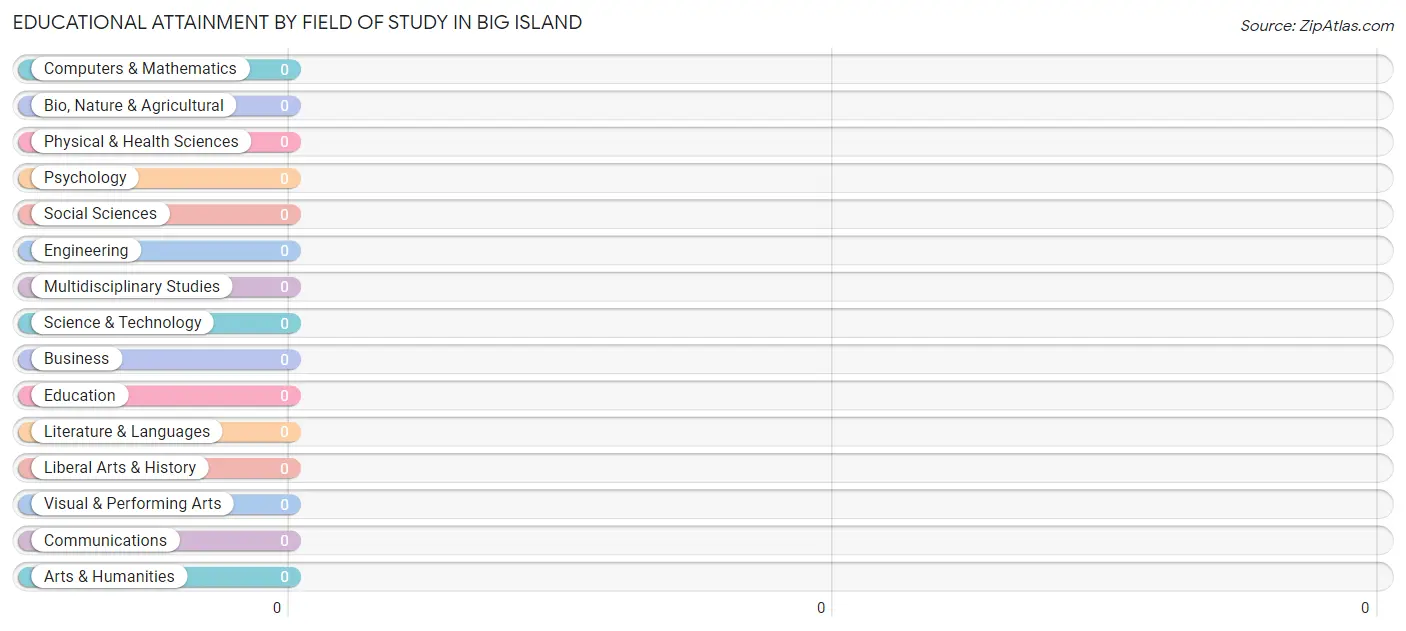
| Field of Study | # Graduates | % Graduates |
| Computers & Mathematics | 0 | 0.0% |
| Bio, Nature & Agricultural | 0 | 0.0% |
| Physical & Health Sciences | 0 | 0.0% |
| Psychology | 0 | 0.0% |
| Social Sciences | 0 | 0.0% |
| Engineering | 0 | 0.0% |
| Multidisciplinary Studies | 0 | 0.0% |
| Science & Technology | 0 | 0.0% |
| Business | 0 | 0.0% |
| Education | 0 | 0.0% |
| Literature & Languages | 0 | 0.0% |
| Liberal Arts & History | 0 | 0.0% |
| Visual & Performing Arts | 0 | 0.0% |
| Communications | 0 | 0.0% |
| Arts & Humanities | 0 | 0.0% |
| Total | 0 | 0.0% |
Transportation & Commute in Big Island
Vehicle Availability by Sex in Big Island
The most prevalent vehicle ownership categories in Big Island are males with 2 vehicles (23, accounting for 74.2%) and females with 2 vehicles (0, making up 328.6%).
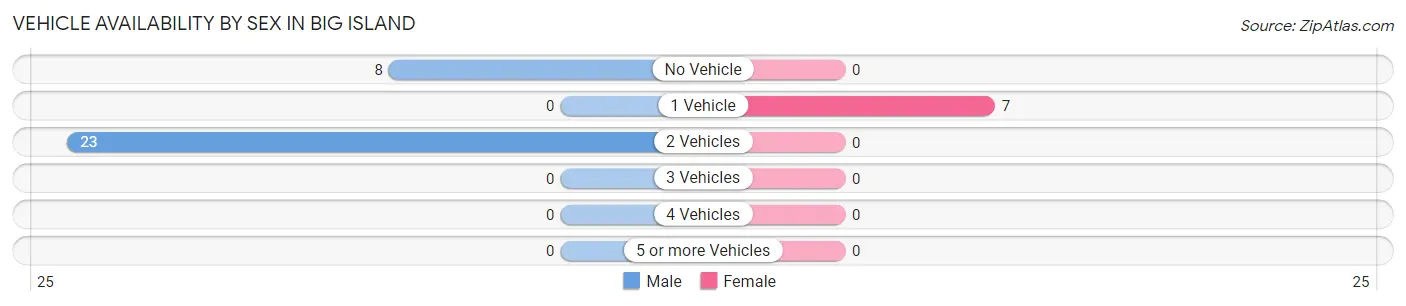
| Vehicles Available | Male | Female |
| No Vehicle | 8 (25.8%) | 0 (0.0%) |
| 1 Vehicle | 0 (0.0%) | 7 (100.0%) |
| 2 Vehicles | 23 (74.2%) | 0 (0.0%) |
| 3 Vehicles | 0 (0.0%) | 0 (0.0%) |
| 4 Vehicles | 0 (0.0%) | 0 (0.0%) |
| 5 or more Vehicles | 0 (0.0%) | 0 (0.0%) |
| Total | 31 (100.0%) | 7 (100.0%) |
Commute Time in Big Island
The most frequently occuring commute durations in Big Island are 20 to 24 minutes (23 commuters, 60.5%), 25 to 29 minutes (8 commuters, 21.0%), and 10 to 14 minutes (7 commuters, 18.4%).
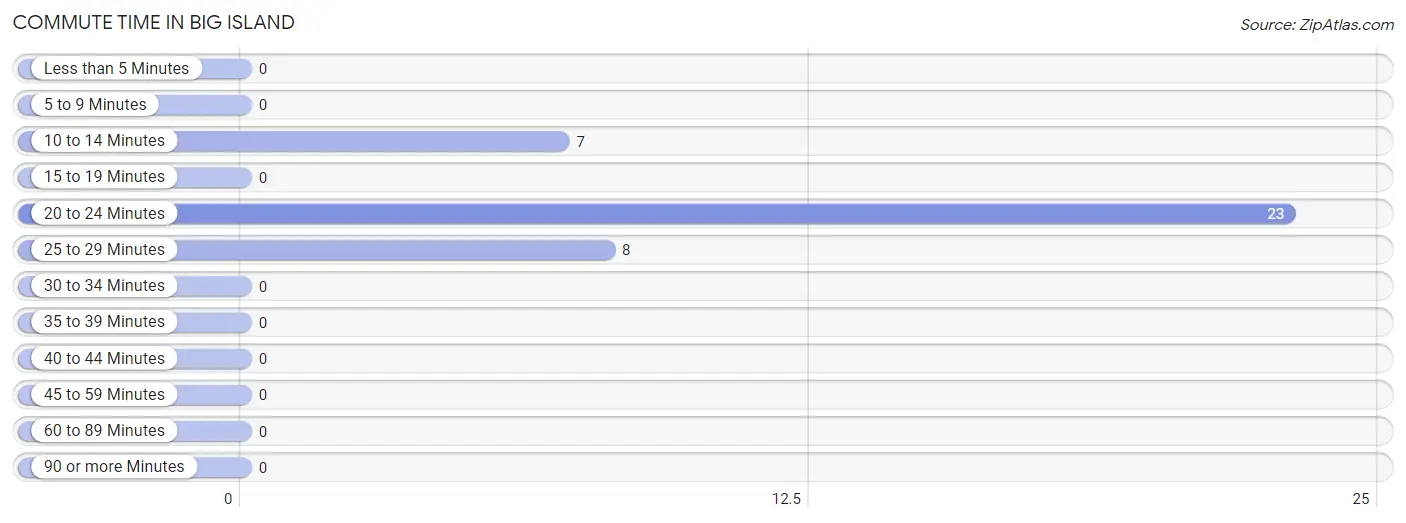
| Commute Time | # Commuters | % Commuters |
| Less than 5 Minutes | 0 | 0.0% |
| 5 to 9 Minutes | 0 | 0.0% |
| 10 to 14 Minutes | 7 | 18.4% |
| 15 to 19 Minutes | 0 | 0.0% |
| 20 to 24 Minutes | 23 | 60.5% |
| 25 to 29 Minutes | 8 | 21.0% |
| 30 to 34 Minutes | 0 | 0.0% |
| 35 to 39 Minutes | 0 | 0.0% |
| 40 to 44 Minutes | 0 | 0.0% |
| 45 to 59 Minutes | 0 | 0.0% |
| 60 to 89 Minutes | 0 | 0.0% |
| 90 or more Minutes | 0 | 0.0% |
Commute Time by Sex in Big Island
The most common commute times in Big Island are 20 to 24 minutes (23 commuters, 74.2%) for males and 10 to 14 minutes (7 commuters, 100.0%) for females.
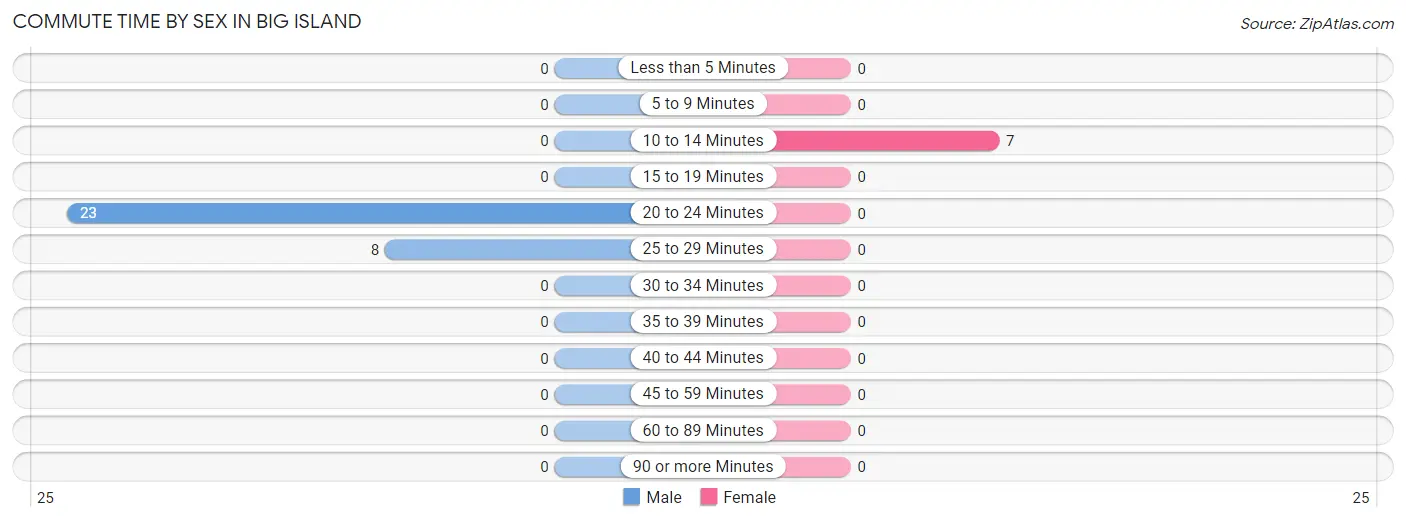
| Commute Time | Male | Female |
| Less than 5 Minutes | 0 (0.0%) | 0 (0.0%) |
| 5 to 9 Minutes | 0 (0.0%) | 0 (0.0%) |
| 10 to 14 Minutes | 0 (0.0%) | 7 (100.0%) |
| 15 to 19 Minutes | 0 (0.0%) | 0 (0.0%) |
| 20 to 24 Minutes | 23 (74.2%) | 0 (0.0%) |
| 25 to 29 Minutes | 8 (25.8%) | 0 (0.0%) |
| 30 to 34 Minutes | 0 (0.0%) | 0 (0.0%) |
| 35 to 39 Minutes | 0 (0.0%) | 0 (0.0%) |
| 40 to 44 Minutes | 0 (0.0%) | 0 (0.0%) |
| 45 to 59 Minutes | 0 (0.0%) | 0 (0.0%) |
| 60 to 89 Minutes | 0 (0.0%) | 0 (0.0%) |
| 90 or more Minutes | 0 (0.0%) | 0 (0.0%) |
Time of Departure to Work by Sex in Big Island
The most frequent times of departure to work in Big Island are 12:00 AM to 4:59 AM (23, 74.2%) for males and 12:00 PM to 3:59 PM (7, 100.0%) for females.
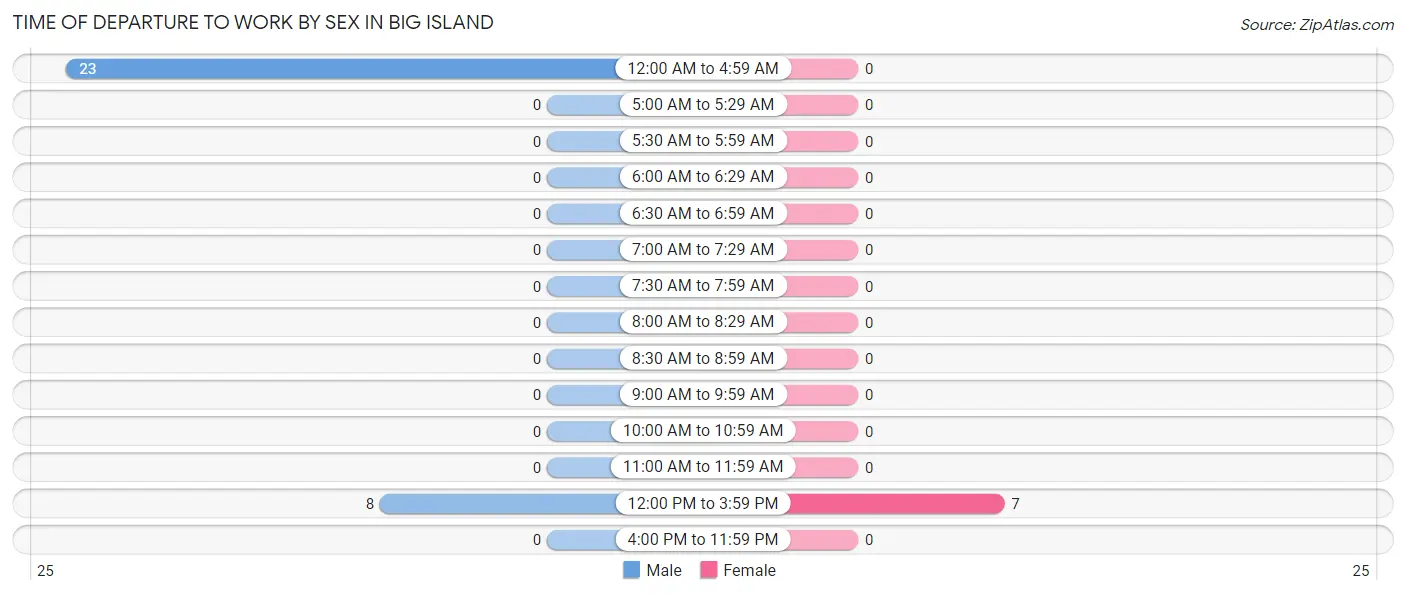
| Time of Departure | Male | Female |
| 12:00 AM to 4:59 AM | 23 (74.2%) | 0 (0.0%) |
| 5:00 AM to 5:29 AM | 0 (0.0%) | 0 (0.0%) |
| 5:30 AM to 5:59 AM | 0 (0.0%) | 0 (0.0%) |
| 6:00 AM to 6:29 AM | 0 (0.0%) | 0 (0.0%) |
| 6:30 AM to 6:59 AM | 0 (0.0%) | 0 (0.0%) |
| 7:00 AM to 7:29 AM | 0 (0.0%) | 0 (0.0%) |
| 7:30 AM to 7:59 AM | 0 (0.0%) | 0 (0.0%) |
| 8:00 AM to 8:29 AM | 0 (0.0%) | 0 (0.0%) |
| 8:30 AM to 8:59 AM | 0 (0.0%) | 0 (0.0%) |
| 9:00 AM to 9:59 AM | 0 (0.0%) | 0 (0.0%) |
| 10:00 AM to 10:59 AM | 0 (0.0%) | 0 (0.0%) |
| 11:00 AM to 11:59 AM | 0 (0.0%) | 0 (0.0%) |
| 12:00 PM to 3:59 PM | 8 (25.8%) | 7 (100.0%) |
| 4:00 PM to 11:59 PM | 0 (0.0%) | 0 (0.0%) |
| Total | 31 (100.0%) | 7 (100.0%) |
Housing Occupancy in Big Island
Occupancy by Ownership in Big Island
Of the total 113 dwellings in Big Island, owner-occupied units account for 62 (54.9%), while renter-occupied units make up 51 (45.1%).
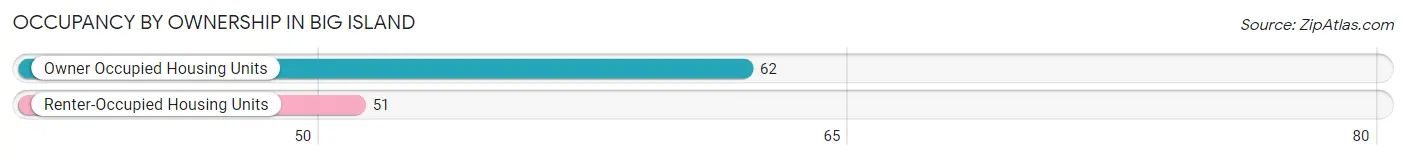
| Occupancy | # Housing Units | % Housing Units |
| Owner Occupied Housing Units | 62 | 54.9% |
| Renter-Occupied Housing Units | 51 | 45.1% |
| Total Occupied Housing Units | 113 | 100.0% |
Occupancy by Household Size in Big Island
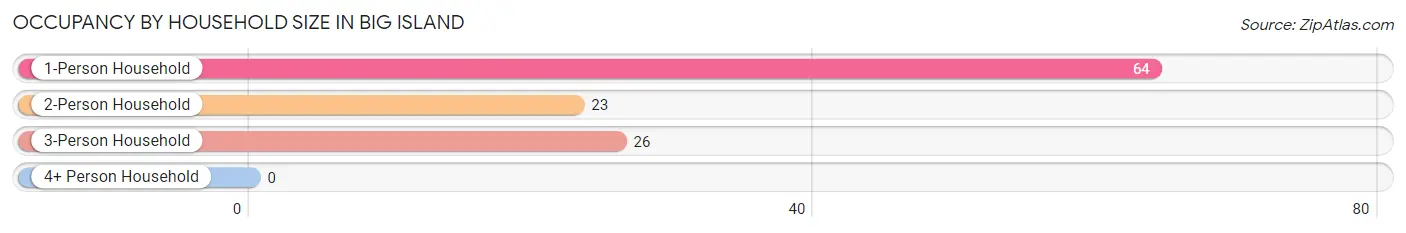
| Household Size | # Housing Units | % Housing Units |
| 1-Person Household | 64 | 56.6% |
| 2-Person Household | 23 | 20.3% |
| 3-Person Household | 26 | 23.0% |
| 4+ Person Household | 0 | 0.0% |
| Total Housing Units | 113 | 100.0% |
Occupancy by Ownership by Household Size in Big Island
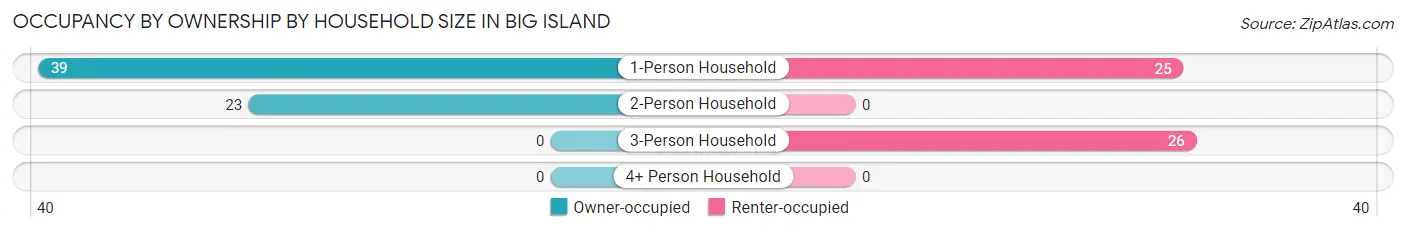
| Household Size | Owner-occupied | Renter-occupied |
| 1-Person Household | 39 (60.9%) | 25 (39.1%) |
| 2-Person Household | 23 (100.0%) | 0 (0.0%) |
| 3-Person Household | 0 (0.0%) | 26 (100.0%) |
| 4+ Person Household | 0 (0.0%) | 0 (0.0%) |
| Total Housing Units | 62 (54.9%) | 51 (45.1%) |
Occupancy by Educational Attainment in Big Island
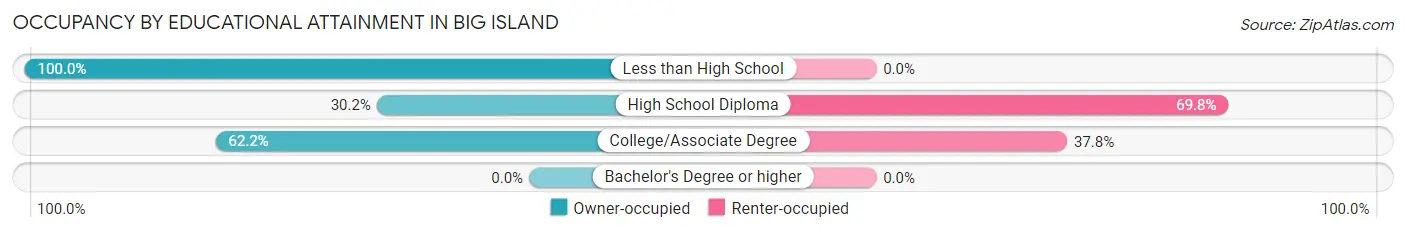
| Household Size | Owner-occupied | Renter-occupied |
| Less than High School | 23 (100.0%) | 0 (0.0%) |
| High School Diploma | 16 (30.2%) | 37 (69.8%) |
| College/Associate Degree | 23 (62.2%) | 14 (37.8%) |
| Bachelor's Degree or higher | 0 (0.0%) | 0 (0.0%) |
Occupancy by Age of Householder in Big Island
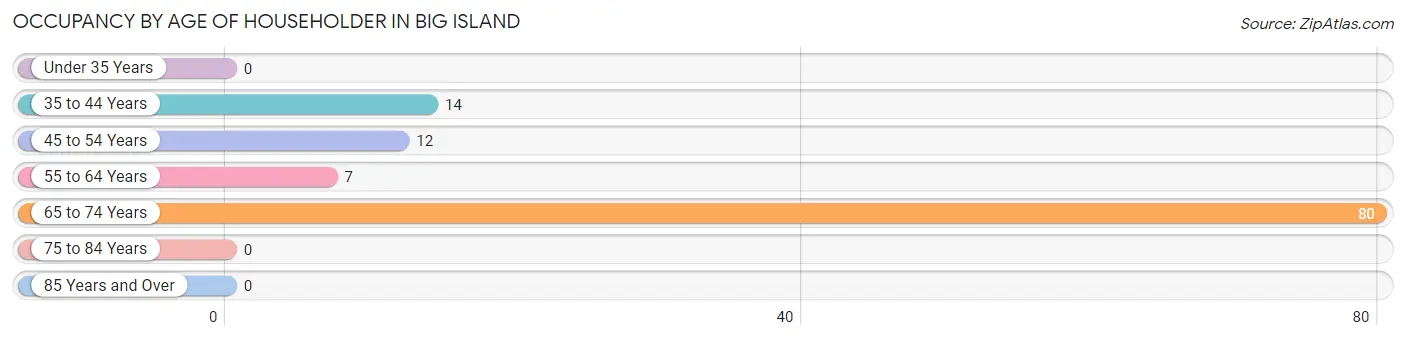
| Age Bracket | # Households | % Households |
| Under 35 Years | 0 | 0.0% |
| 35 to 44 Years | 14 | 12.4% |
| 45 to 54 Years | 12 | 10.6% |
| 55 to 64 Years | 7 | 6.2% |
| 65 to 74 Years | 80 | 70.8% |
| 75 to 84 Years | 0 | 0.0% |
| 85 Years and Over | 0 | 0.0% |
| Total | 113 | 100.0% |
Housing Finances in Big Island
Median Income by Occupancy in Big Island
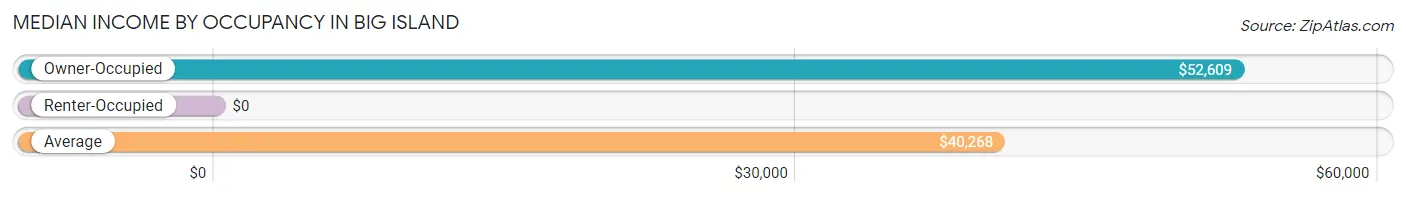
| Occupancy Type | # Households | Median Income |
| Owner-Occupied | 62 (54.9%) | $52,609 |
| Renter-Occupied | 51 (45.1%) | $0 |
| Average | 113 (100.0%) | $40,268 |
Occupancy by Householder Income Bracket in Big Island
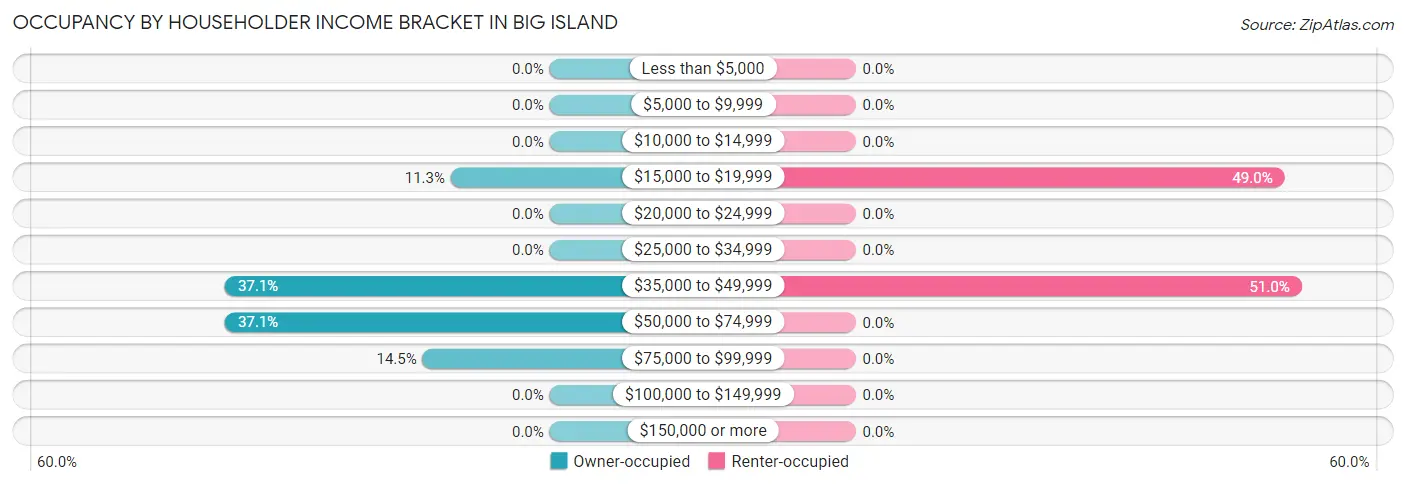
| Income Bracket | Owner-occupied | Renter-occupied |
| Less than $5,000 | 0 (0.0%) | 0 (0.0%) |
| $5,000 to $9,999 | 0 (0.0%) | 0 (0.0%) |
| $10,000 to $14,999 | 0 (0.0%) | 0 (0.0%) |
| $15,000 to $19,999 | 7 (11.3%) | 25 (49.0%) |
| $20,000 to $24,999 | 0 (0.0%) | 0 (0.0%) |
| $25,000 to $34,999 | 0 (0.0%) | 0 (0.0%) |
| $35,000 to $49,999 | 23 (37.1%) | 26 (51.0%) |
| $50,000 to $74,999 | 23 (37.1%) | 0 (0.0%) |
| $75,000 to $99,999 | 9 (14.5%) | 0 (0.0%) |
| $100,000 to $149,999 | 0 (0.0%) | 0 (0.0%) |
| $150,000 or more | 0 (0.0%) | 0 (0.0%) |
| Total | 62 (100.0%) | 51 (100.0%) |
Monthly Housing Cost Tiers in Big Island
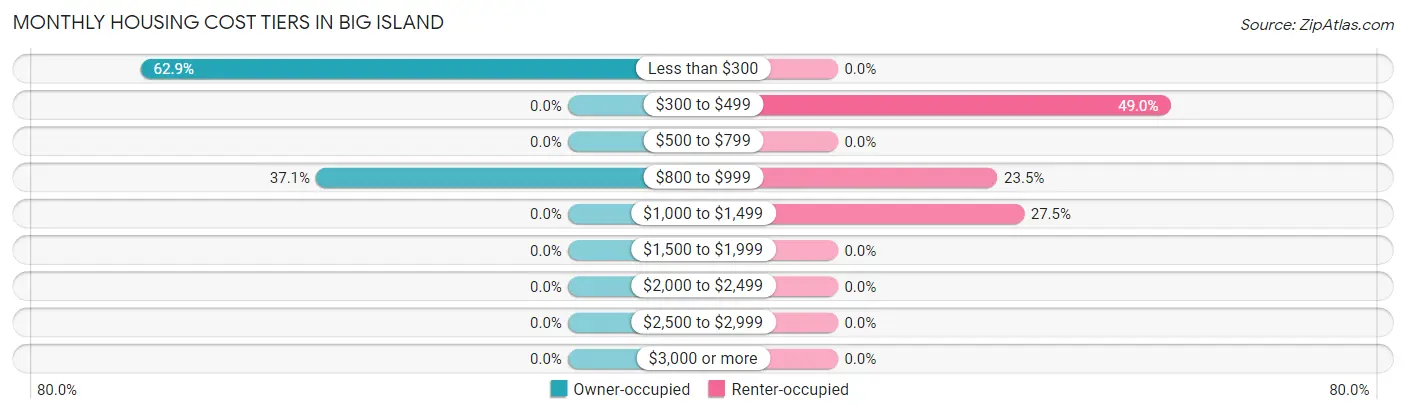
| Monthly Cost | Owner-occupied | Renter-occupied |
| Less than $300 | 39 (62.9%) | 0 (0.0%) |
| $300 to $499 | 0 (0.0%) | 25 (49.0%) |
| $500 to $799 | 0 (0.0%) | 0 (0.0%) |
| $800 to $999 | 23 (37.1%) | 12 (23.5%) |
| $1,000 to $1,499 | 0 (0.0%) | 14 (27.5%) |
| $1,500 to $1,999 | 0 (0.0%) | 0 (0.0%) |
| $2,000 to $2,499 | 0 (0.0%) | 0 (0.0%) |
| $2,500 to $2,999 | 0 (0.0%) | 0 (0.0%) |
| $3,000 or more | 0 (0.0%) | 0 (0.0%) |
| Total | 62 (100.0%) | 51 (100.0%) |
Physical Housing Characteristics in Big Island
Housing Structures in Big Island
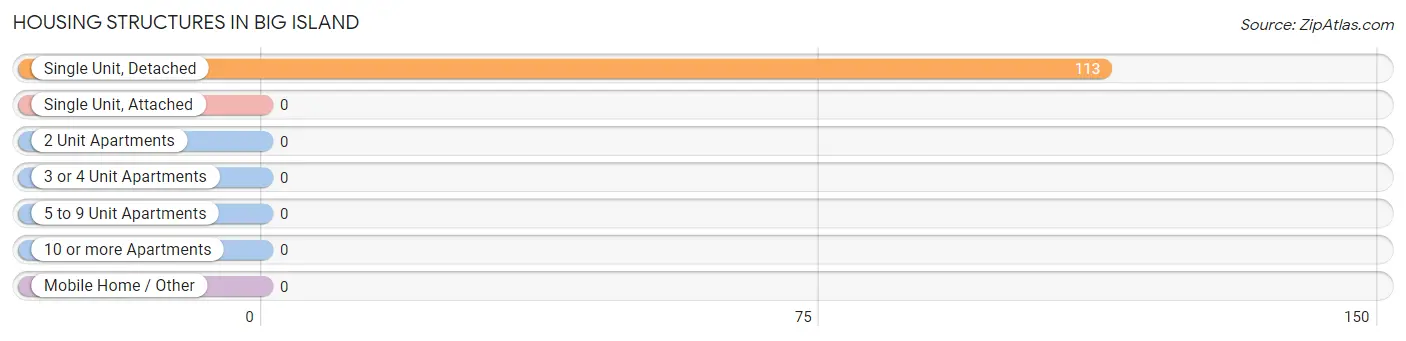
| Structure Type | # Housing Units | % Housing Units |
| Single Unit, Detached | 113 | 100.0% |
| Single Unit, Attached | 0 | 0.0% |
| 2 Unit Apartments | 0 | 0.0% |
| 3 or 4 Unit Apartments | 0 | 0.0% |
| 5 to 9 Unit Apartments | 0 | 0.0% |
| 10 or more Apartments | 0 | 0.0% |
| Mobile Home / Other | 0 | 0.0% |
| Total | 113 | 100.0% |
Housing Structures by Occupancy in Big Island
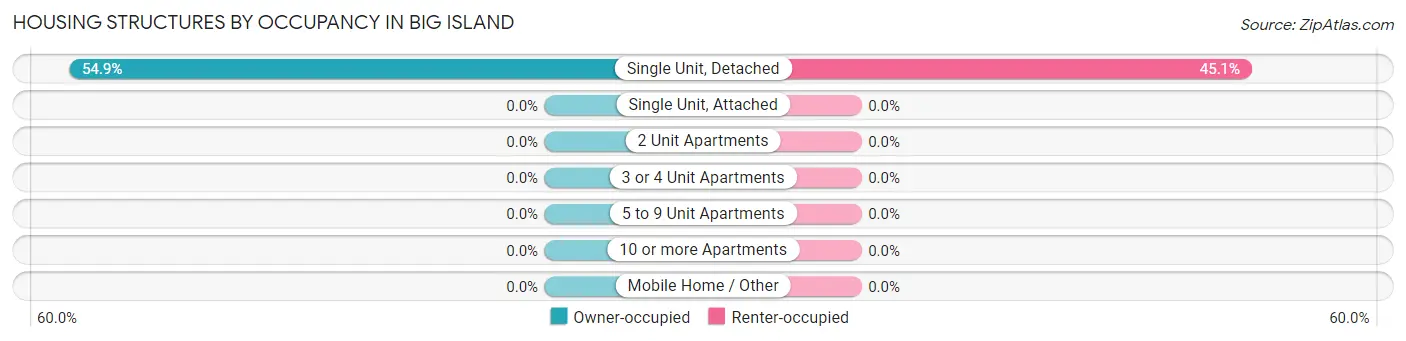
| Structure Type | Owner-occupied | Renter-occupied |
| Single Unit, Detached | 62 (54.9%) | 51 (45.1%) |
| Single Unit, Attached | 0 (0.0%) | 0 (0.0%) |
| 2 Unit Apartments | 0 (0.0%) | 0 (0.0%) |
| 3 or 4 Unit Apartments | 0 (0.0%) | 0 (0.0%) |
| 5 to 9 Unit Apartments | 0 (0.0%) | 0 (0.0%) |
| 10 or more Apartments | 0 (0.0%) | 0 (0.0%) |
| Mobile Home / Other | 0 (0.0%) | 0 (0.0%) |
| Total | 62 (54.9%) | 51 (45.1%) |
Housing Structures by Number of Rooms in Big Island
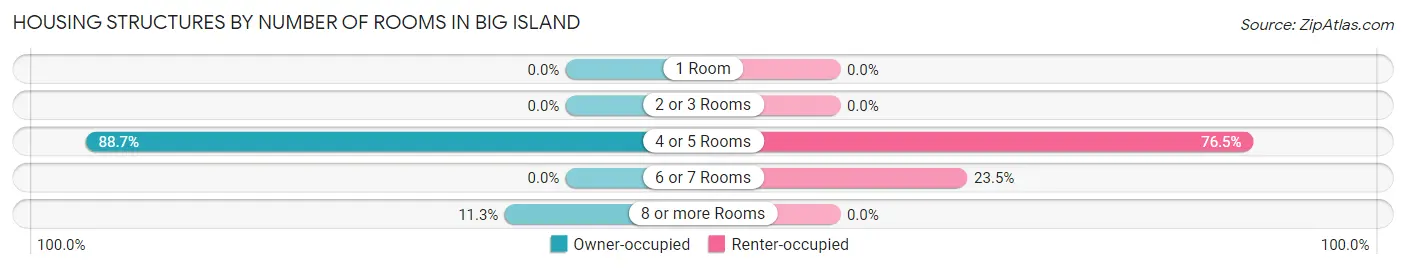
| Number of Rooms | Owner-occupied | Renter-occupied |
| 1 Room | 0 (0.0%) | 0 (0.0%) |
| 2 or 3 Rooms | 0 (0.0%) | 0 (0.0%) |
| 4 or 5 Rooms | 55 (88.7%) | 39 (76.5%) |
| 6 or 7 Rooms | 0 (0.0%) | 12 (23.5%) |
| 8 or more Rooms | 7 (11.3%) | 0 (0.0%) |
| Total | 62 (100.0%) | 51 (100.0%) |
Housing Structure by Heating Type in Big Island
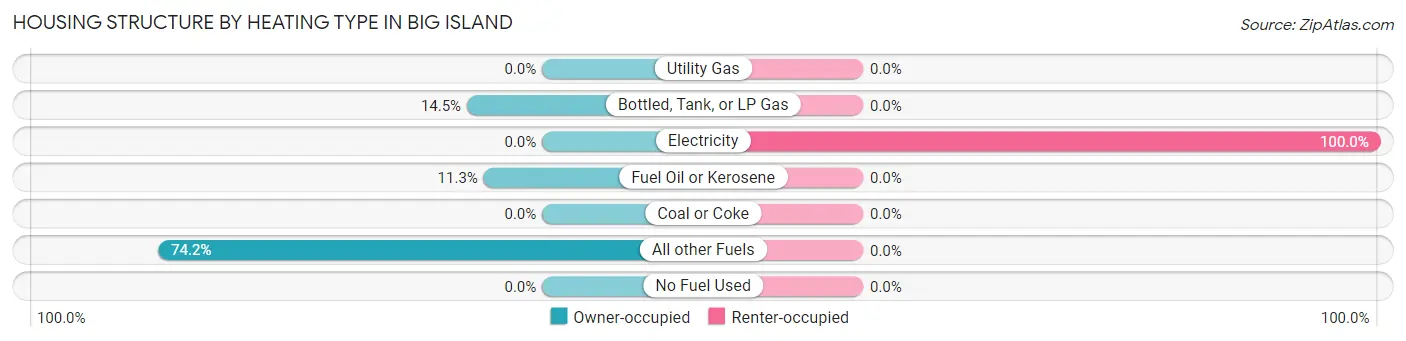
| Heating Type | Owner-occupied | Renter-occupied |
| Utility Gas | 0 (0.0%) | 0 (0.0%) |
| Bottled, Tank, or LP Gas | 9 (14.5%) | 0 (0.0%) |
| Electricity | 0 (0.0%) | 51 (100.0%) |
| Fuel Oil or Kerosene | 7 (11.3%) | 0 (0.0%) |
| Coal or Coke | 0 (0.0%) | 0 (0.0%) |
| All other Fuels | 46 (74.2%) | 0 (0.0%) |
| No Fuel Used | 0 (0.0%) | 0 (0.0%) |
| Total | 62 (100.0%) | 51 (100.0%) |
Household Vehicle Usage in Big Island
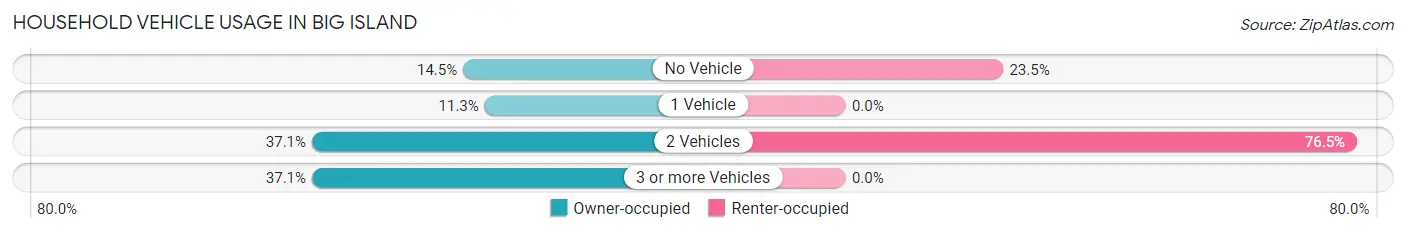
| Vehicles per Household | Owner-occupied | Renter-occupied |
| No Vehicle | 9 (14.5%) | 12 (23.5%) |
| 1 Vehicle | 7 (11.3%) | 0 (0.0%) |
| 2 Vehicles | 23 (37.1%) | 39 (76.5%) |
| 3 or more Vehicles | 23 (37.1%) | 0 (0.0%) |
| Total | 62 (100.0%) | 51 (100.0%) |
Real Estate & Mortgages in Big Island
Real Estate and Mortgage Overview in Big Island
| Characteristic | Without Mortgage | With Mortgage |
| Housing Units | 39 | 23 |
| Median Property Value | - | - |
| Median Household Income | $53,859 | $0 |
| Monthly Housing Costs | $230 | $0 |
| Real Estate Taxes | $509 | $0 |
Property Value by Mortgage Status in Big Island
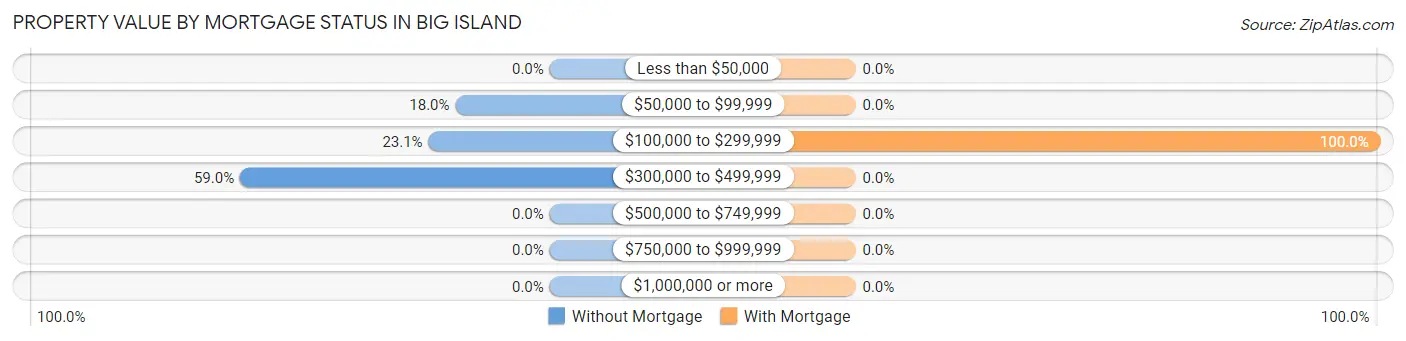
| Property Value | Without Mortgage | With Mortgage |
| Less than $50,000 | 0 (0.0%) | 0 (0.0%) |
| $50,000 to $99,999 | 7 (17.9%) | 0 (0.0%) |
| $100,000 to $299,999 | 9 (23.1%) | 23 (100.0%) |
| $300,000 to $499,999 | 23 (59.0%) | 0 (0.0%) |
| $500,000 to $749,999 | 0 (0.0%) | 0 (0.0%) |
| $750,000 to $999,999 | 0 (0.0%) | 0 (0.0%) |
| $1,000,000 or more | 0 (0.0%) | 0 (0.0%) |
| Total | 39 (100.0%) | 23 (100.0%) |
Household Income by Mortgage Status in Big Island
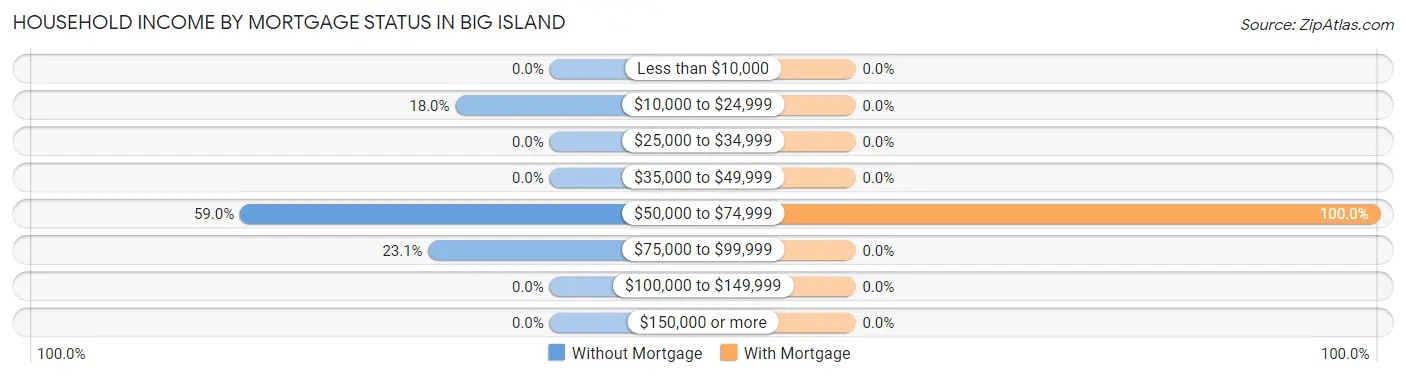
| Household Income | Without Mortgage | With Mortgage |
| Less than $10,000 | 0 (0.0%) | 0 (0.0%) |
| $10,000 to $24,999 | 7 (17.9%) | 0 (0.0%) |
| $25,000 to $34,999 | 0 (0.0%) | 0 (0.0%) |
| $35,000 to $49,999 | 0 (0.0%) | 0 (0.0%) |
| $50,000 to $74,999 | 23 (59.0%) | 23 (100.0%) |
| $75,000 to $99,999 | 9 (23.1%) | 0 (0.0%) |
| $100,000 to $149,999 | 0 (0.0%) | 0 (0.0%) |
| $150,000 or more | 0 (0.0%) | 0 (0.0%) |
| Total | 39 (100.0%) | 23 (100.0%) |
Property Value to Household Income Ratio in Big Island
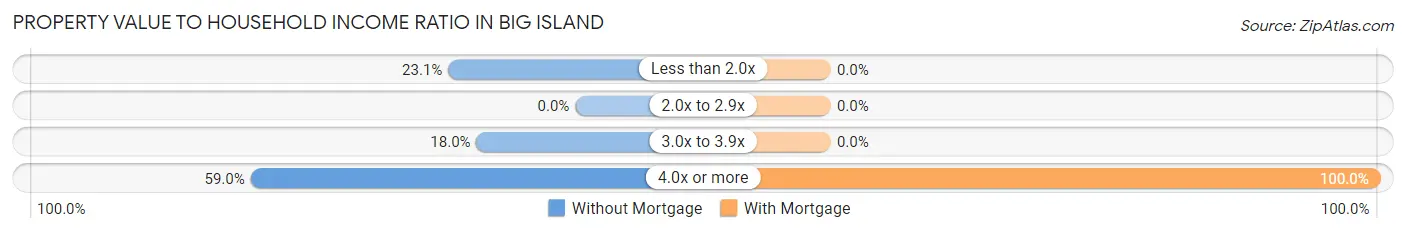
| Value-to-Income Ratio | Without Mortgage | With Mortgage |
| Less than 2.0x | 9 (23.1%) | 0 (0.0%) |
| 2.0x to 2.9x | 0 (0.0%) | 0 (0.0%) |
| 3.0x to 3.9x | 7 (17.9%) | 0 (0.0%) |
| 4.0x or more | 23 (59.0%) | 23 (100.0%) |
| Total | 39 (100.0%) | 23 (100.0%) |
Real Estate Taxes by Mortgage Status in Big Island
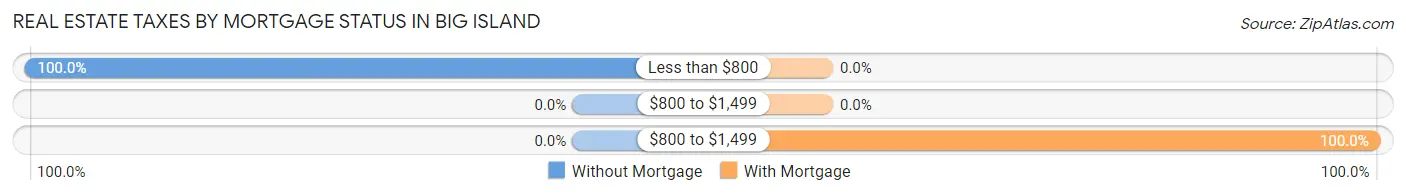
| Property Taxes | Without Mortgage | With Mortgage |
| Less than $800 | 39 (100.0%) | 0 (0.0%) |
| $800 to $1,499 | 0 (0.0%) | 0 (0.0%) |
| $800 to $1,499 | 0 (0.0%) | 23 (100.0%) |
| Total | 39 (100.0%) | 23 (100.0%) |
Health & Disability in Big Island
Health Insurance Coverage by Age in Big Island
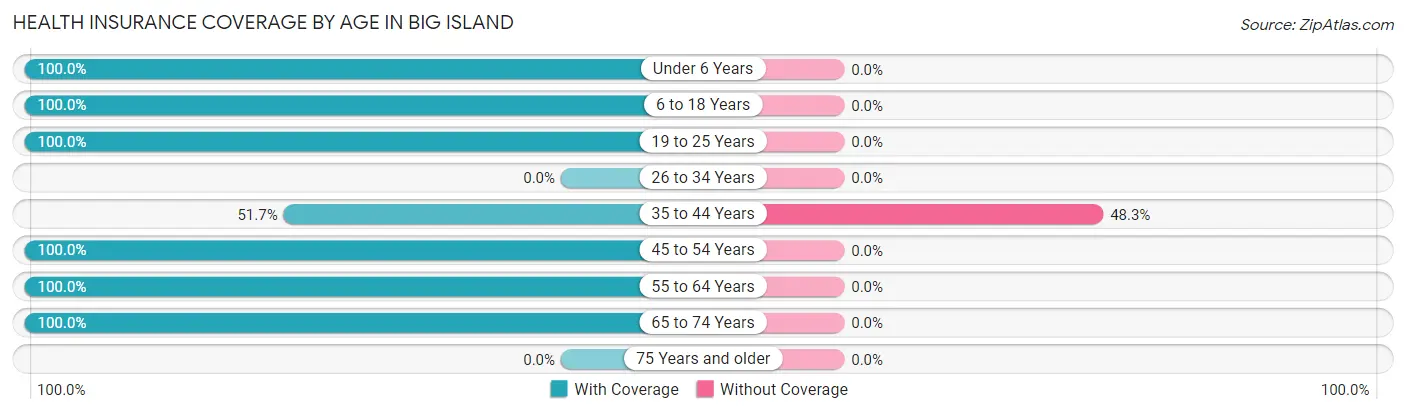
| Age Bracket | With Coverage | Without Coverage |
| Under 6 Years | 14 (100.0%) | 0 (0.0%) |
| 6 to 18 Years | 7 (100.0%) | 0 (0.0%) |
| 19 to 25 Years | 8 (100.0%) | 0 (0.0%) |
| 26 to 34 Years | 0 (0.0%) | 0 (0.0%) |
| 35 to 44 Years | 15 (51.7%) | 14 (48.3%) |
| 45 to 54 Years | 36 (100.0%) | 0 (0.0%) |
| 55 to 64 Years | 7 (100.0%) | 0 (0.0%) |
| 65 to 74 Years | 80 (100.0%) | 0 (0.0%) |
| 75 Years and older | 0 (0.0%) | 0 (0.0%) |
| Total | 167 (92.3%) | 14 (7.7%) |
Health Insurance Coverage by Citizenship Status in Big Island
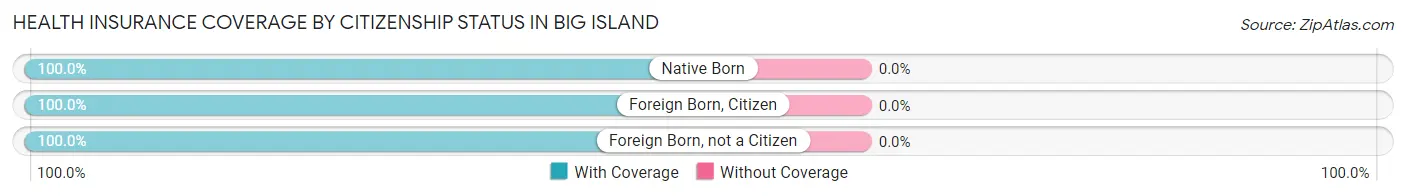
| Citizenship Status | With Coverage | Without Coverage |
| Native Born | 14 (100.0%) | 0 (0.0%) |
| Foreign Born, Citizen | 7 (100.0%) | 0 (0.0%) |
| Foreign Born, not a Citizen | 8 (100.0%) | 0 (0.0%) |
Health Insurance Coverage by Household Income in Big Island
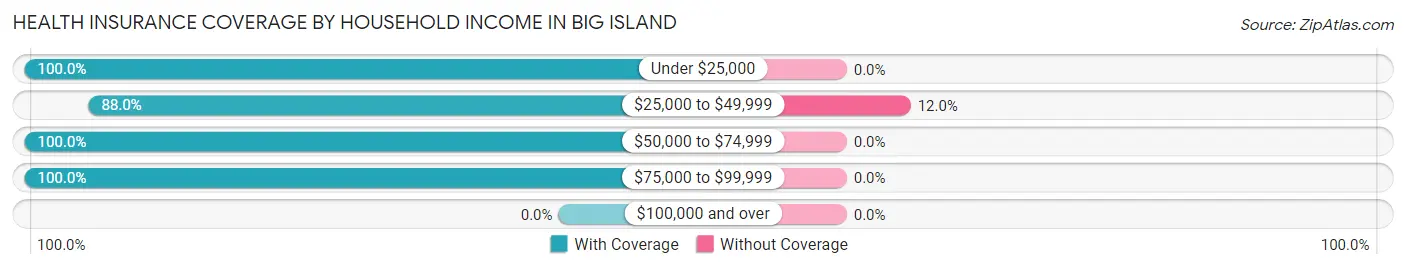
| Household Income | With Coverage | Without Coverage |
| Under $25,000 | 32 (100.0%) | 0 (0.0%) |
| $25,000 to $49,999 | 103 (88.0%) | 14 (12.0%) |
| $50,000 to $74,999 | 23 (100.0%) | 0 (0.0%) |
| $75,000 to $99,999 | 9 (100.0%) | 0 (0.0%) |
| $100,000 and over | 0 (0.0%) | 0 (0.0%) |
Public vs Private Health Insurance Coverage by Age in Big Island
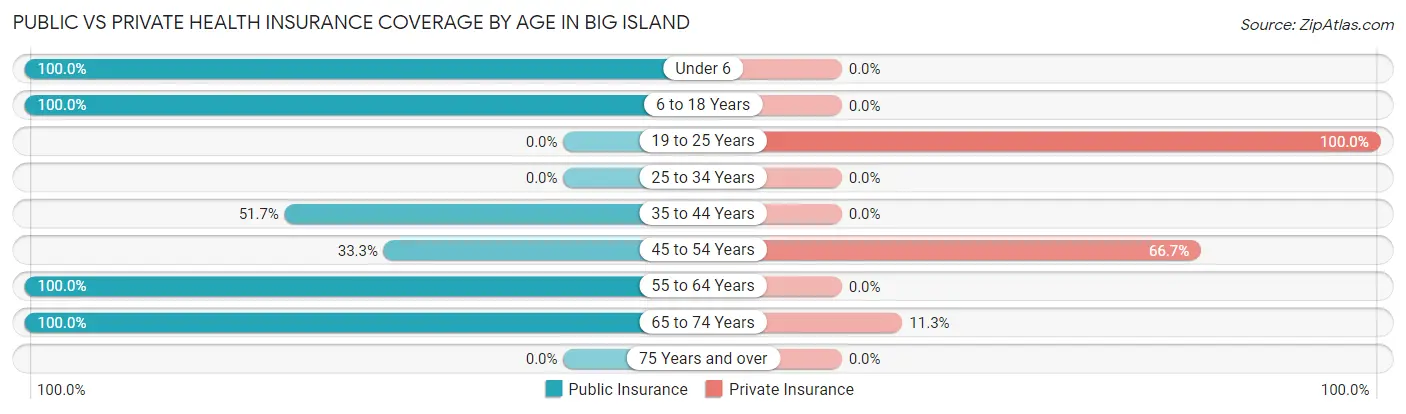
| Age Bracket | Public Insurance | Private Insurance |
| Under 6 | 14 (100.0%) | 0 (0.0%) |
| 6 to 18 Years | 7 (100.0%) | 0 (0.0%) |
| 19 to 25 Years | 0 (0.0%) | 8 (100.0%) |
| 25 to 34 Years | 0 (0.0%) | 0 (0.0%) |
| 35 to 44 Years | 15 (51.7%) | 0 (0.0%) |
| 45 to 54 Years | 12 (33.3%) | 24 (66.7%) |
| 55 to 64 Years | 7 (100.0%) | 0 (0.0%) |
| 65 to 74 Years | 80 (100.0%) | 9 (11.3%) |
| 75 Years and over | 0 (0.0%) | 0 (0.0%) |
| Total | 135 (74.6%) | 41 (22.7%) |
Disability Status by Sex by Age in Big Island
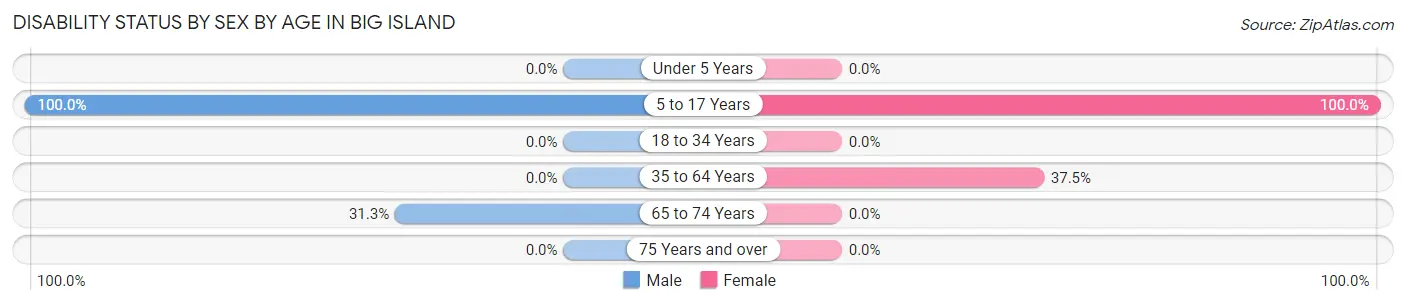
| Age Bracket | Male | Female |
| Under 5 Years | 0 (0.0%) | 0 (0.0%) |
| 5 to 17 Years | 7 (100.0%) | 14 (100.0%) |
| 18 to 34 Years | 0 (0.0%) | 0 (0.0%) |
| 35 to 64 Years | 0 (0.0%) | 27 (37.5%) |
| 65 to 74 Years | 25 (31.2%) | 0 (0.0%) |
| 75 Years and over | 0 (0.0%) | 0 (0.0%) |
Disability Class by Sex by Age in Big Island
Disability Class: Hearing Difficulty
| Age Bracket | Male | Female |
| Under 5 Years | 0 (0.0%) | 0 (0.0%) |
| 5 to 17 Years | 0 (0.0%) | 0 (0.0%) |
| 18 to 34 Years | 0 (0.0%) | 0 (0.0%) |
| 35 to 64 Years | 0 (0.0%) | 0 (0.0%) |
| 65 to 74 Years | 0 (0.0%) | 0 (0.0%) |
| 75 Years and over | 0 (0.0%) | 0 (0.0%) |
Disability Class: Vision Difficulty
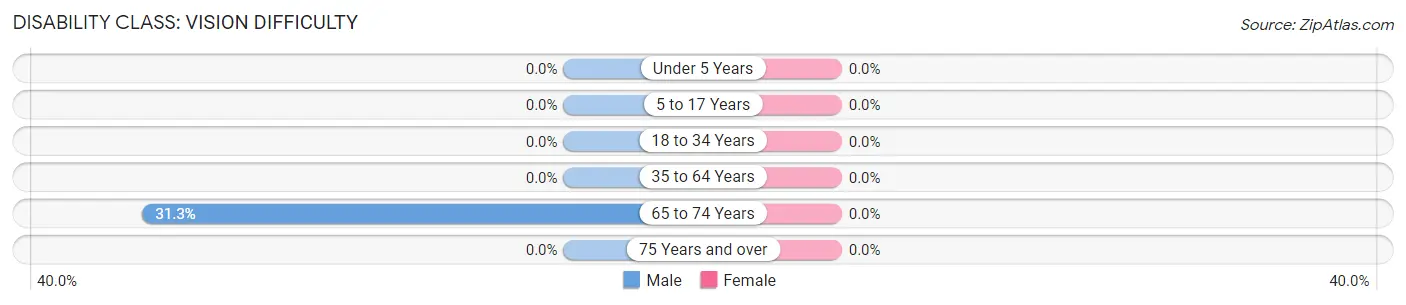
| Age Bracket | Male | Female |
| Under 5 Years | 0 (0.0%) | 0 (0.0%) |
| 5 to 17 Years | 0 (0.0%) | 0 (0.0%) |
| 18 to 34 Years | 0 (0.0%) | 0 (0.0%) |
| 35 to 64 Years | 0 (0.0%) | 0 (0.0%) |
| 65 to 74 Years | 25 (31.2%) | 0 (0.0%) |
| 75 Years and over | 0 (0.0%) | 0 (0.0%) |
Disability Class: Cognitive Difficulty
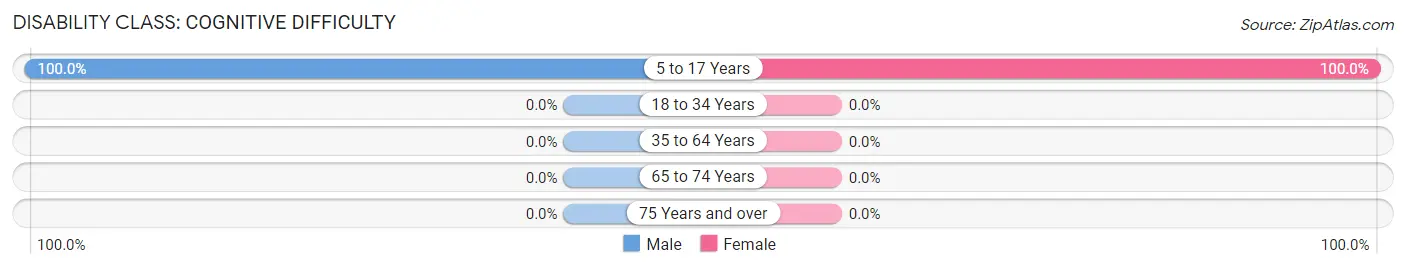
| Age Bracket | Male | Female |
| 5 to 17 Years | 7 (100.0%) | 14 (100.0%) |
| 18 to 34 Years | 0 (0.0%) | 0 (0.0%) |
| 35 to 64 Years | 0 (0.0%) | 0 (0.0%) |
| 65 to 74 Years | 0 (0.0%) | 0 (0.0%) |
| 75 Years and over | 0 (0.0%) | 0 (0.0%) |
Disability Class: Ambulatory Difficulty
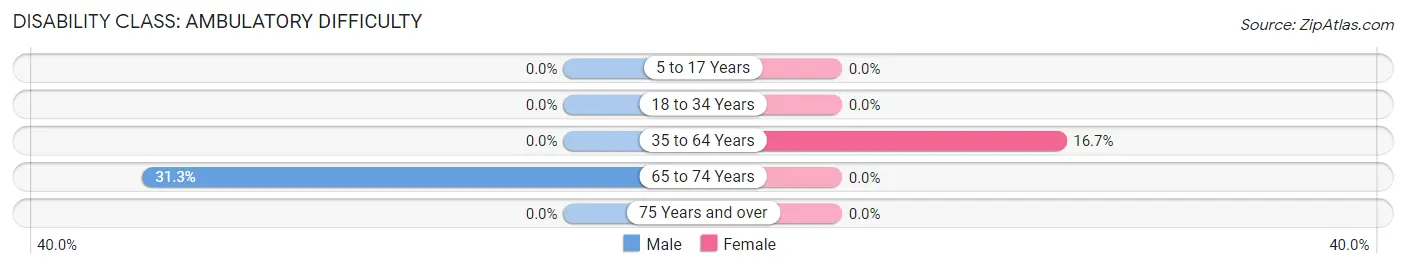
| Age Bracket | Male | Female |
| 5 to 17 Years | 0 (0.0%) | 0 (0.0%) |
| 18 to 34 Years | 0 (0.0%) | 0 (0.0%) |
| 35 to 64 Years | 0 (0.0%) | 12 (16.7%) |
| 65 to 74 Years | 25 (31.2%) | 0 (0.0%) |
| 75 Years and over | 0 (0.0%) | 0 (0.0%) |
Disability Class: Self-Care Difficulty
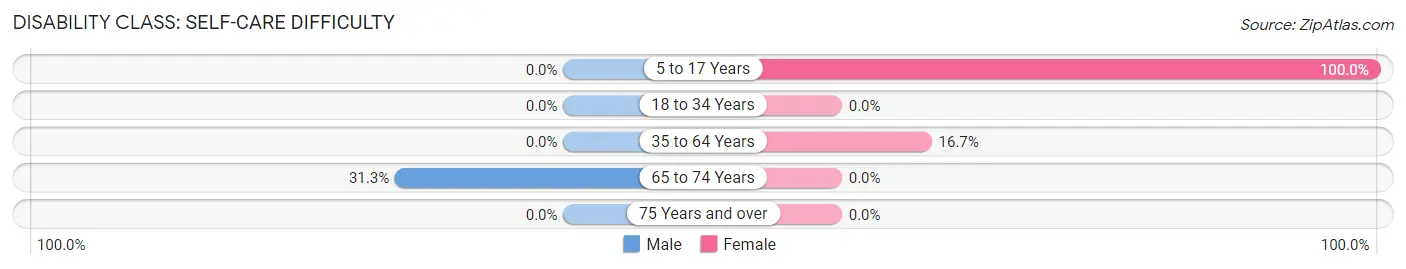
| Age Bracket | Male | Female |
| 5 to 17 Years | 0 (0.0%) | 14 (100.0%) |
| 18 to 34 Years | 0 (0.0%) | 0 (0.0%) |
| 35 to 64 Years | 0 (0.0%) | 12 (16.7%) |
| 65 to 74 Years | 25 (31.2%) | 0 (0.0%) |
| 75 Years and over | 0 (0.0%) | 0 (0.0%) |
Technology Access in Big Island
Computing Device Access in Big Island
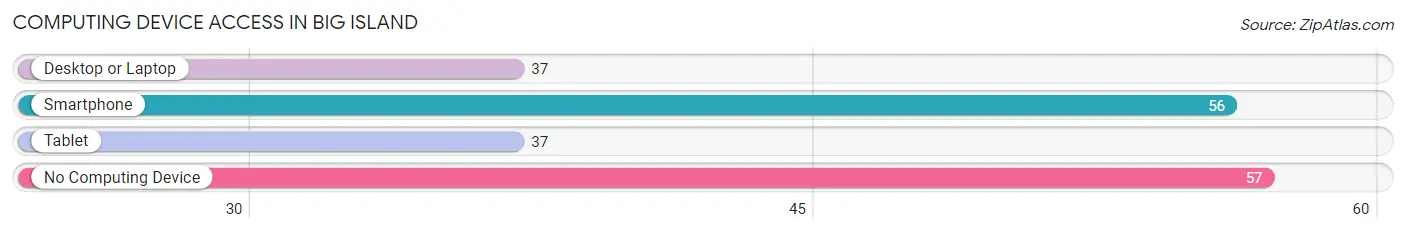
| Device Type | # Households | % Households |
| Desktop or Laptop | 37 | 32.7% |
| Smartphone | 56 | 49.6% |
| Tablet | 37 | 32.7% |
| No Computing Device | 57 | 50.4% |
| Total | 113 | 100.0% |
Internet Access in Big Island
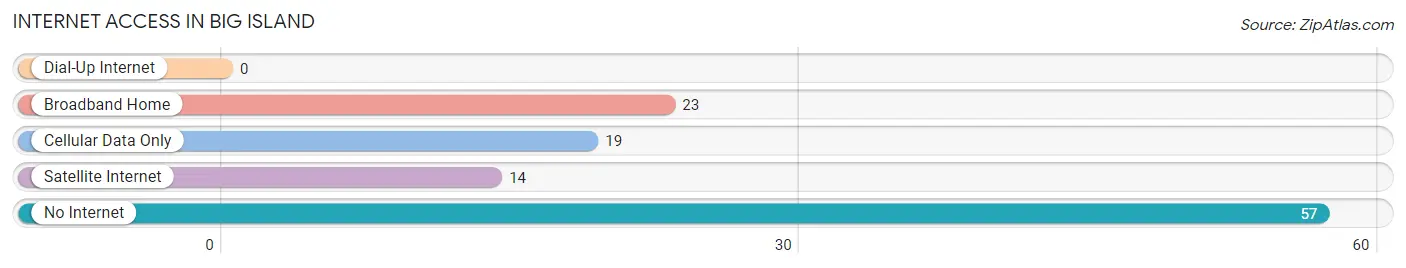
| Internet Type | # Households | % Households |
| Dial-Up Internet | 0 | 0.0% |
| Broadband Home | 23 | 20.3% |
| Cellular Data Only | 19 | 16.8% |
| Satellite Internet | 14 | 12.4% |
| No Internet | 57 | 50.4% |
| Total | 113 | 100.0% |
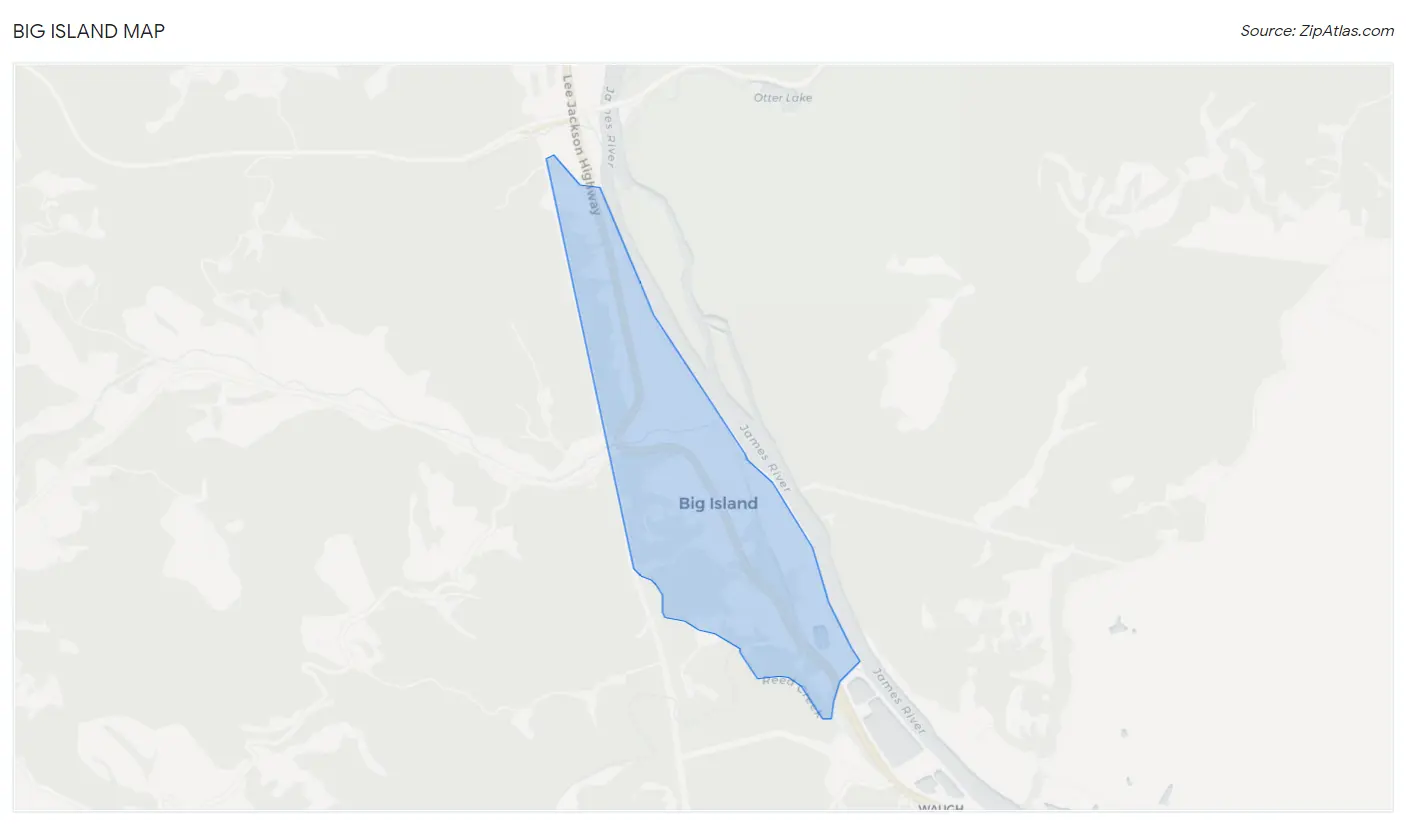
Big Island Summary
The Big Island of Virginia is a small unincorporated community located in Bedford County, Virginia. It is situated on the banks of the James River, and is home to a population of approximately 1,000 people. The town is known for its rich history, beautiful scenery, and unique culture.
History
The Big Island of Virginia was first settled in the late 1700s by a group of German immigrants. The settlers were attracted to the area due to its fertile soil and abundant natural resources. The town was originally known as “Big Island” due to its large size compared to the other islands in the James River. The town was officially incorporated in 1820, and the name was changed to “Big Island of Virginia” in 1821.
The town quickly grew in size and importance, and by the mid-1800s it was a thriving community. The town was home to a variety of businesses, including a sawmill, gristmill, and a general store. The town also had a post office, a school, and a church.
The town was an important stop on the James River and Kanawha Canal, which connected the James River to the Ohio River. The canal was used to transport goods and people between the two rivers, and the town was a popular stop for travelers.
The town was also an important stop on the Underground Railroad, which was used to help slaves escape to freedom. The town was home to several prominent abolitionists, including William Lloyd Garrison and Harriet Tubman.
Geography
The Big Island of Virginia is located in Bedford County, Virginia. It is situated on the banks of the James River, and is surrounded by the Blue Ridge Mountains. The town is located approximately 25 miles west of Lynchburg, and is accessible by both US Route 460 and State Route 122.
The town is situated in a rural area, and is surrounded by rolling hills and farmland. The town is home to several parks and recreational areas, including the Big Island Wildlife Management Area and the Big Island State Park.
Economy
The economy of the Big Island of Virginia is largely based on agriculture and tourism. The town is home to several farms, which produce a variety of crops, including corn, soybeans, and hay. The town is also home to several wineries, which produce a variety of wines.
The town is also a popular tourist destination, and is home to several attractions, including the Big Island State Park, the Big Island Wildlife Management Area, and the Big Island Museum. The town is also home to several restaurants, shops, and other businesses.
Demographics
The population of the Big Island of Virginia is approximately 1,000 people. The town is predominantly white, with a small African American population. The median household income is approximately $45,000, and the median home value is approximately $150,000. The town is served by the Bedford County Public Schools system.
Common Questions
What is Per Capita Income in Big Island?
Per Capita income in Big Island is $25,584.
What is the Median Family Income in Big Island?
Median Family Income in Big Island is $38,641.
What is the Median Household income in Big Island?
Median Household Income in Big Island is $40,268.
What is Inequality or Gini Index in Big Island?
Inequality or Gini Index in Big Island is 0.26.
What is the Total Population of Big Island?
Total Population of Big Island is 181.
What is the Total Male Population of Big Island?
Total Male Population of Big Island is 95.
What is the Total Female Population of Big Island?
Total Female Population of Big Island is 86.
What is the Ratio of Males per 100 Females in Big Island?
There are 110.47 Males per 100 Females in Big Island.
What is the Ratio of Females per 100 Males in Big Island?
There are 90.53 Females per 100 Males in Big Island.
What is the Median Population Age in Big Island?
Median Population Age in Big Island is 54.9 Years.
What is the Average Family Size in Big Island
Average Family Size in Big Island is 2.1 People.
What is the Average Household Size in Big Island
Average Household Size in Big Island is 1.6 People.
How Large is the Labor Force in Big Island?
There are 52 People in the Labor Forcein in Big Island.
What is the Percentage of People in the Labor Force in Big Island?
31.1% of People are in the Labor Force in Big Island.