Avon, UT Map & Demographics
Avon Map
Avon Overview
$35,148
PER CAPITA INCOME
$82,383
AVG FAMILY INCOME
$82,188
AVG HOUSEHOLD INCOME
62.2%
WAGE / INCOME GAP [ % ]
37.8¢/ $1
WAGE / INCOME GAP [ $ ]
0.38
INEQUALITY / GINI INDEX
539
TOTAL POPULATION
255
MALE POPULATION
284
FEMALE POPULATION
89.79
MALES / 100 FEMALES
111.37
FEMALES / 100 MALES
32.4
MEDIAN AGE
4.0
AVG FAMILY SIZE
3.9
AVG HOUSEHOLD SIZE
226
LABOR FORCE [ PEOPLE ]
52.2%
PERCENT IN LABOR FORCE
Income in Avon
Income Overview in Avon
Per Capita Income in Avon is $35,148, while median incomes of families and households are $82,383 and $82,188 respectively.
| Characteristic | Number | Measure |
| Per Capita Income | 539 | $35,148 |
| Median Family Income | 133 | $82,383 |
| Mean Family Income | 133 | $131,421 |
| Median Household Income | 138 | $82,188 |
| Mean Household Income | 138 | $127,775 |
| Income Deficit | 133 | $0 |
| Wage / Income Gap (%) | 539 | 62.18% |
| Wage / Income Gap ($) | 539 | 37.82¢ per $1 |
| Gini / Inequality Index | 539 | 0.38 |
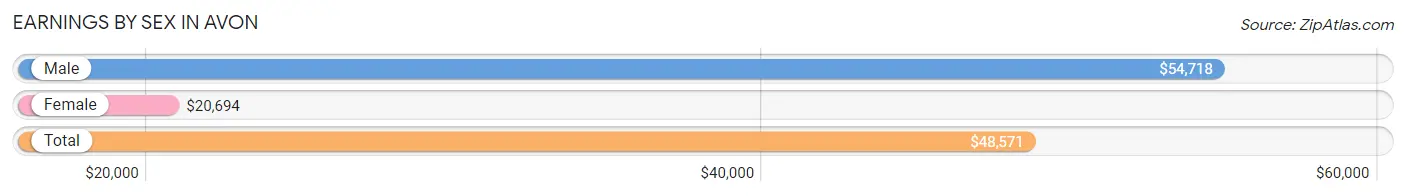
Earnings by Sex in Avon
Average Earnings in Avon are $48,571, $54,718 for men and $20,694 for women, a difference of 62.2%.
| Sex | Number | Average Earnings |
| Male | 137 (56.1%) | $54,718 |
| Female | 107 (43.9%) | $20,694 |
| Total | 244 (100.0%) | $48,571 |
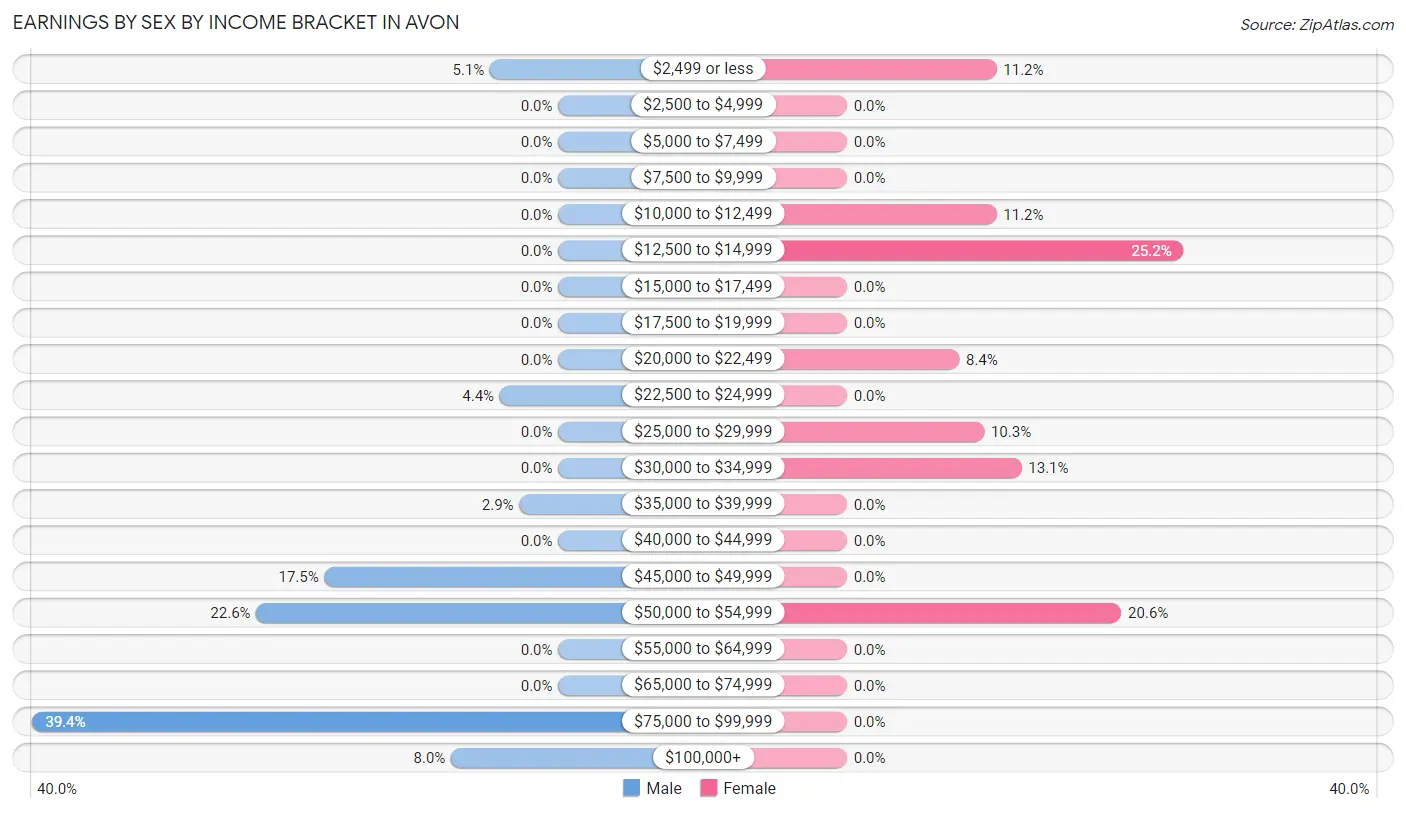
Earnings by Sex by Income Bracket in Avon
The most common earnings brackets in Avon are $75,000 to $99,999 for men (54 | 39.4%) and $12,500 to $14,999 for women (27 | 25.2%).
| Income | Male | Female |
| $2,499 or less | 7 (5.1%) | 12 (11.2%) |
| $2,500 to $4,999 | 0 (0.0%) | 0 (0.0%) |
| $5,000 to $7,499 | 0 (0.0%) | 0 (0.0%) |
| $7,500 to $9,999 | 0 (0.0%) | 0 (0.0%) |
| $10,000 to $12,499 | 0 (0.0%) | 12 (11.2%) |
| $12,500 to $14,999 | 0 (0.0%) | 27 (25.2%) |
| $15,000 to $17,499 | 0 (0.0%) | 0 (0.0%) |
| $17,500 to $19,999 | 0 (0.0%) | 0 (0.0%) |
| $20,000 to $22,499 | 0 (0.0%) | 9 (8.4%) |
| $22,500 to $24,999 | 6 (4.4%) | 0 (0.0%) |
| $25,000 to $29,999 | 0 (0.0%) | 11 (10.3%) |
| $30,000 to $34,999 | 0 (0.0%) | 14 (13.1%) |
| $35,000 to $39,999 | 4 (2.9%) | 0 (0.0%) |
| $40,000 to $44,999 | 0 (0.0%) | 0 (0.0%) |
| $45,000 to $49,999 | 24 (17.5%) | 0 (0.0%) |
| $50,000 to $54,999 | 31 (22.6%) | 22 (20.6%) |
| $55,000 to $64,999 | 0 (0.0%) | 0 (0.0%) |
| $65,000 to $74,999 | 0 (0.0%) | 0 (0.0%) |
| $75,000 to $99,999 | 54 (39.4%) | 0 (0.0%) |
| $100,000+ | 11 (8.0%) | 0 (0.0%) |
| Total | 137 (100.0%) | 107 (100.0%) |
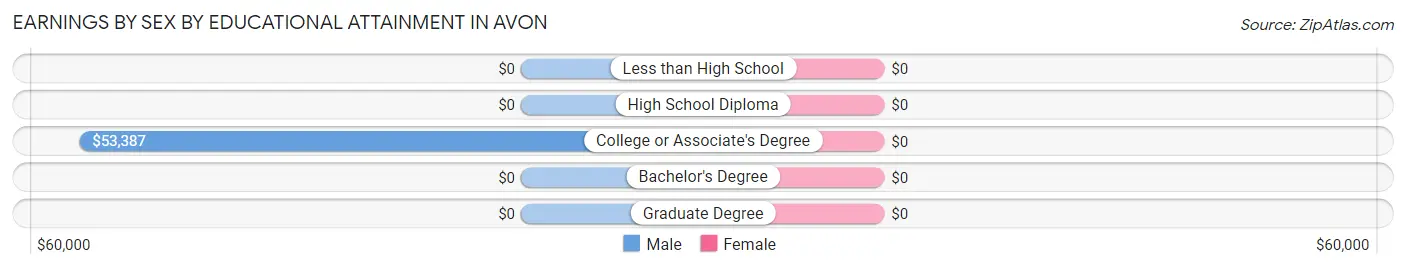
Earnings by Sex by Educational Attainment in Avon
| Educational Attainment | Male Income | Female Income |
| Less than High School | - | - |
| High School Diploma | - | - |
| College or Associate's Degree | $53,387 | $0 |
| Bachelor's Degree | - | - |
| Graduate Degree | - | - |
| Total | $65,000 | $28,542 |
Family Income in Avon
Family Income Brackets in Avon
According to the Avon family income data, there are 43 families falling into the $75,000 to $99,999 income range, which is the most common income bracket and makes up 32.3% of all families.
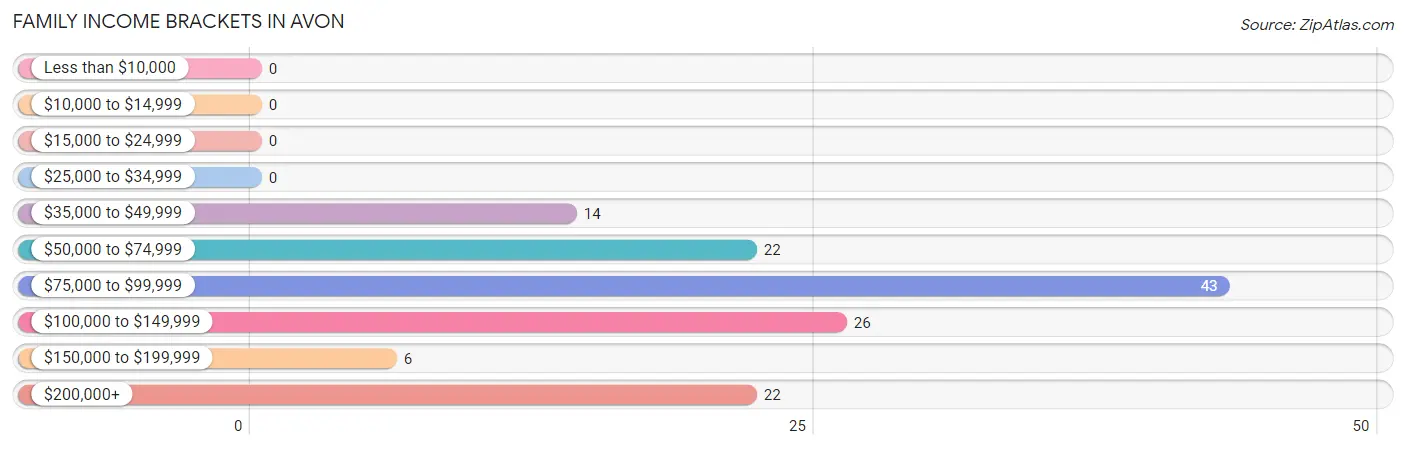
| Income Bracket | # Families | % Families |
| Less than $10,000 | 0 | 0.0% |
| $10,000 to $14,999 | 0 | 0.0% |
| $15,000 to $24,999 | 0 | 0.0% |
| $25,000 to $34,999 | 0 | 0.0% |
| $35,000 to $49,999 | 14 | 10.5% |
| $50,000 to $74,999 | 22 | 16.5% |
| $75,000 to $99,999 | 43 | 32.3% |
| $100,000 to $149,999 | 26 | 19.5% |
| $150,000 to $199,999 | 6 | 4.5% |
| $200,000+ | 22 | 16.5% |
Family Income by Famaliy Size in Avon
4-person families (33 | 24.8%) account for the highest median family income in Avon with $97,159 per family, while 2-person families (42 | 31.6%) have the highest median income of $37,250 per family member.
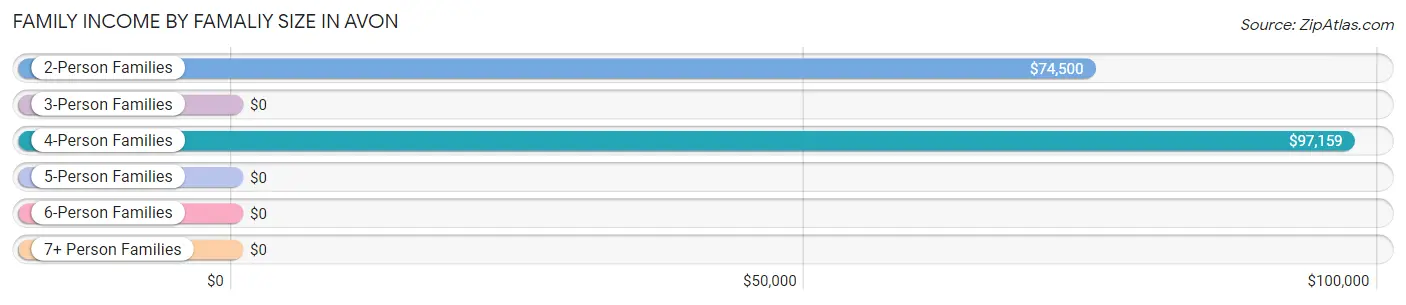
| Income Bracket | # Families | Median Income |
| 2-Person Families | 42 (31.6%) | $74,500 |
| 3-Person Families | 0 (0.0%) | $0 |
| 4-Person Families | 33 (24.8%) | $97,159 |
| 5-Person Families | 51 (38.4%) | $0 |
| 6-Person Families | 7 (5.3%) | $0 |
| 7+ Person Families | 0 (0.0%) | $0 |
| Total | 133 (100.0%) | $82,383 |
Family Income by Number of Earners in Avon
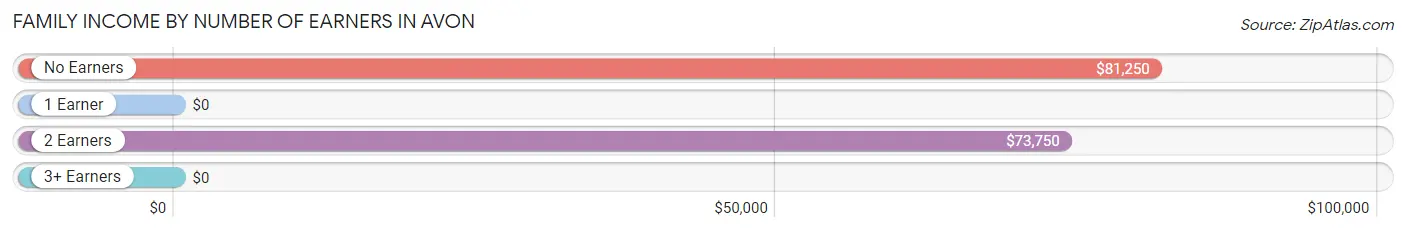
| Number of Earners | # Families | Median Income |
| No Earners | 37 (27.8%) | $81,250 |
| 1 Earner | 29 (21.8%) | $0 |
| 2 Earners | 19 (14.3%) | $73,750 |
| 3+ Earners | 48 (36.1%) | $0 |
| Total | 133 (100.0%) | $82,383 |
Household Income in Avon
Household Income Brackets in Avon
With 43 households falling in the category, the $75,000 to $99,999 income range is the most frequent in Avon, accounting for 31.2% of all households.
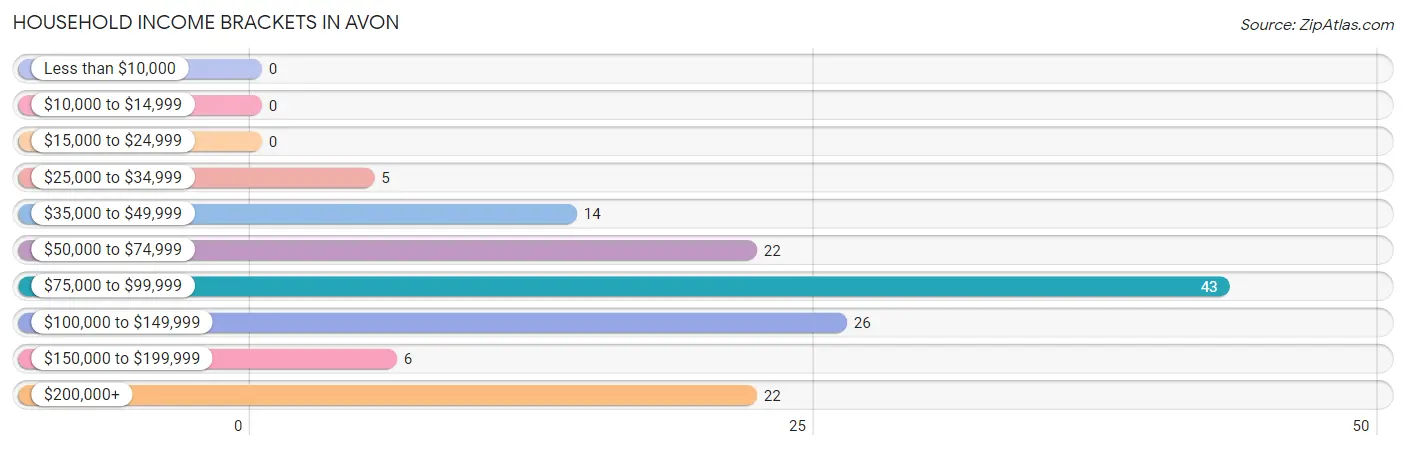
| Income Bracket | # Households | % Households |
| Less than $10,000 | 0 | 0.0% |
| $10,000 to $14,999 | 0 | 0.0% |
| $15,000 to $24,999 | 0 | 0.0% |
| $25,000 to $34,999 | 5 | 3.6% |
| $35,000 to $49,999 | 14 | 10.1% |
| $50,000 to $74,999 | 22 | 15.9% |
| $75,000 to $99,999 | 43 | 31.2% |
| $100,000 to $149,999 | 26 | 18.8% |
| $150,000 to $199,999 | 6 | 4.3% |
| $200,000+ | 22 | 15.9% |
Household Income by Householder Age in Avon
The median household income in Avon is $82,188, with the highest median household income of $81,422 found in the 25 to 44 years age bracket for the primary householder. A total of 47 households (34.1%) fall into this category.
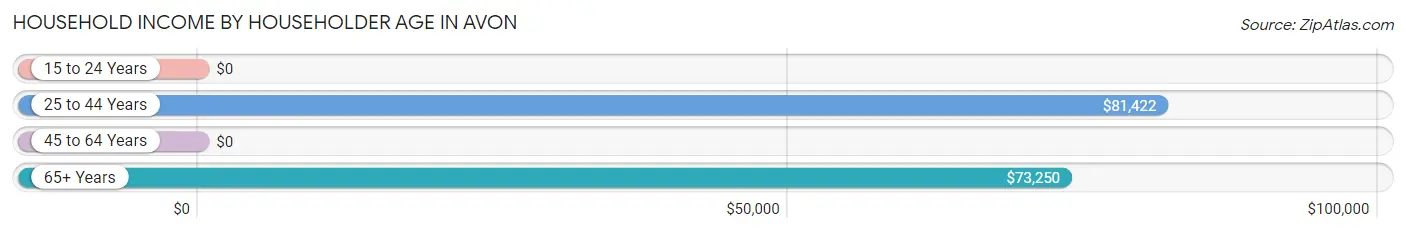
| Income Bracket | # Households | Median Income |
| 15 to 24 Years | 0 (0.0%) | $0 |
| 25 to 44 Years | 47 (34.1%) | $81,422 |
| 45 to 64 Years | 44 (31.9%) | $0 |
| 65+ Years | 47 (34.1%) | $73,250 |
| Total | 138 (100.0%) | $82,188 |
Poverty in Avon
Income Below Poverty by Sex and Age in Avon
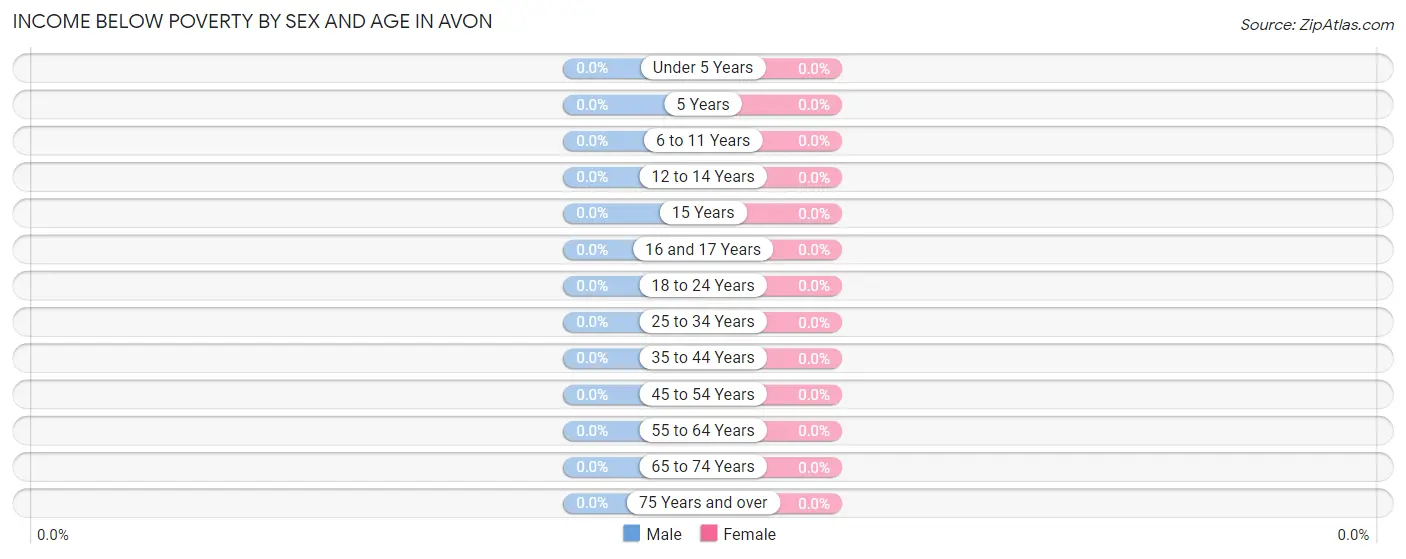
| Age Bracket | Male | Female |
| Under 5 Years | 0 (0.0%) | 0 (0.0%) |
| 5 Years | 0 (0.0%) | 0 (0.0%) |
| 6 to 11 Years | 0 (0.0%) | 0 (0.0%) |
| 12 to 14 Years | 0 (0.0%) | 0 (0.0%) |
| 15 Years | 0 (0.0%) | 0 (0.0%) |
| 16 and 17 Years | 0 (0.0%) | 0 (0.0%) |
| 18 to 24 Years | 0 (0.0%) | 0 (0.0%) |
| 25 to 34 Years | 0 (0.0%) | 0 (0.0%) |
| 35 to 44 Years | 0 (0.0%) | 0 (0.0%) |
| 45 to 54 Years | 0 (0.0%) | 0 (0.0%) |
| 55 to 64 Years | 0 (0.0%) | 0 (0.0%) |
| 65 to 74 Years | 0 (0.0%) | 0 (0.0%) |
| 75 Years and over | 0 (0.0%) | 0 (0.0%) |
| Total | 0 (0.0%) | 0 (0.0%) |
Income Above Poverty by Sex and Age in Avon
According to the poverty statistics in Avon, males aged under 5 years and females aged under 5 years are the age groups that are most secure financially, with 100.0% of males and 100.0% of females in these age groups living above the poverty line.
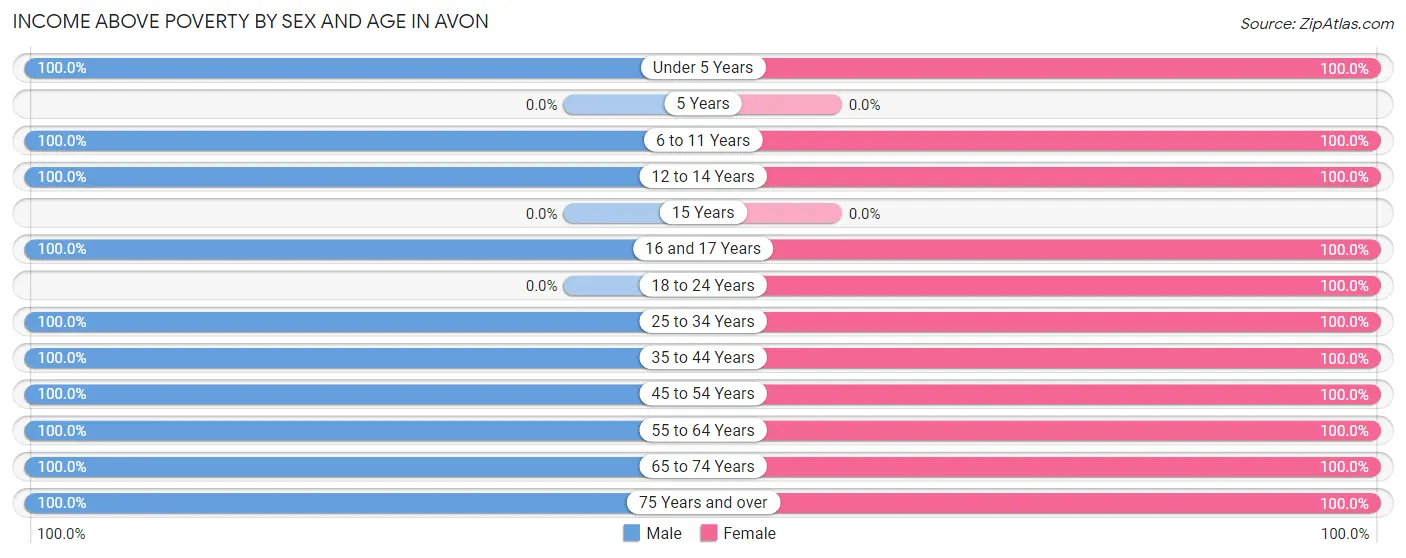
| Age Bracket | Male | Female |
| Under 5 Years | 33 (100.0%) | 7 (100.0%) |
| 5 Years | 0 (0.0%) | 0 (0.0%) |
| 6 to 11 Years | 24 (100.0%) | 7 (100.0%) |
| 12 to 14 Years | 14 (100.0%) | 21 (100.0%) |
| 15 Years | 0 (0.0%) | 0 (0.0%) |
| 16 and 17 Years | 15 (100.0%) | 35 (100.0%) |
| 18 to 24 Years | 0 (0.0%) | 48 (100.0%) |
| 25 to 34 Years | 32 (100.0%) | 38 (100.0%) |
| 35 to 44 Years | 18 (100.0%) | 43 (100.0%) |
| 45 to 54 Years | 33 (100.0%) | 11 (100.0%) |
| 55 to 64 Years | 34 (100.0%) | 31 (100.0%) |
| 65 to 74 Years | 25 (100.0%) | 34 (100.0%) |
| 75 Years and over | 27 (100.0%) | 9 (100.0%) |
| Total | 255 (100.0%) | 284 (100.0%) |
Income Below Poverty Among Married-Couple Families in Avon
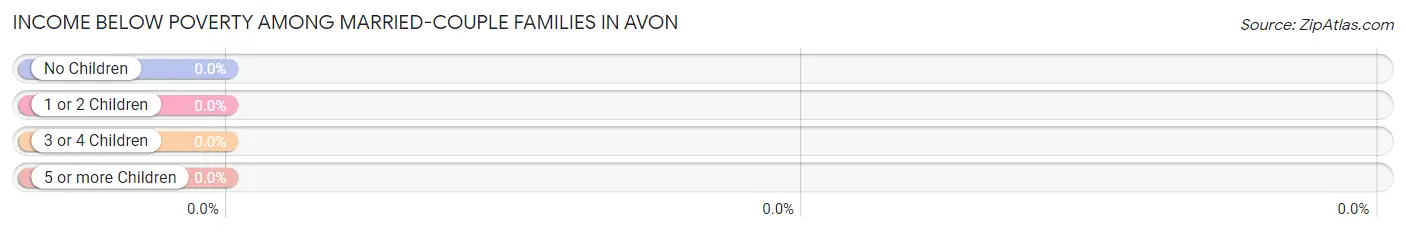
| Children | Above Poverty | Below Poverty |
| No Children | 57 (100.0%) | 0 (0.0%) |
| 1 or 2 Children | 62 (100.0%) | 0 (0.0%) |
| 3 or 4 Children | 14 (100.0%) | 0 (0.0%) |
| 5 or more Children | 0 (0.0%) | 0 (0.0%) |
| Total | 133 (100.0%) | 0 (0.0%) |
Income Below Poverty Among Single-Parent Households in Avon
| Children | Single Father | Single Mother |
| No Children | 0 (0.0%) | 0 (0.0%) |
| 1 or 2 Children | 0 (0.0%) | 0 (0.0%) |
| 3 or 4 Children | 0 (0.0%) | 0 (0.0%) |
| 5 or more Children | 0 (0.0%) | 0 (0.0%) |
| Total | 0 (0.0%) | 0 (0.0%) |
Income Below Poverty Among Married-Couple vs Single-Parent Households in Avon
| Children | Married-Couple Families | Single-Parent Households |
| No Children | 0 (0.0%) | 0 (0.0%) |
| 1 or 2 Children | 0 (0.0%) | 0 (0.0%) |
| 3 or 4 Children | 0 (0.0%) | 0 (0.0%) |
| 5 or more Children | 0 (0.0%) | 0 (0.0%) |
| Total | 0 (0.0%) | 0 (0.0%) |
Race in Avon
The most populous races in Avon are , and White / Caucasian (539 | 100.0%).
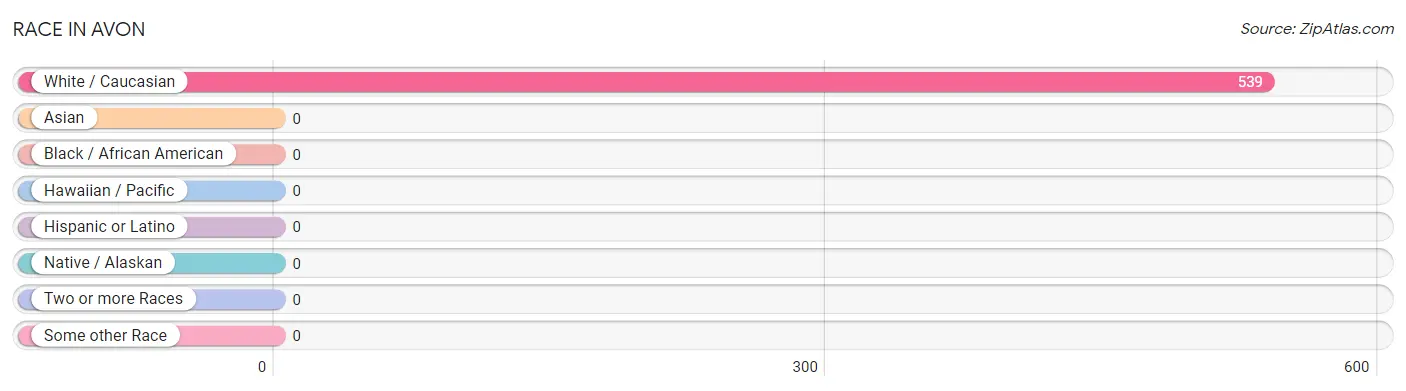
| Race | # Population | % Population |
| Asian | 0 | 0.0% |
| Black / African American | 0 | 0.0% |
| Hawaiian / Pacific | 0 | 0.0% |
| Hispanic or Latino | 0 | 0.0% |
| Native / Alaskan | 0 | 0.0% |
| White / Caucasian | 539 | 100.0% |
| Two or more Races | 0 | 0.0% |
| Some other Race | 0 | 0.0% |
| Total | 539 | 100.0% |
Ancestry in Avon
The most populous ancestries reported in Avon are English (181 | 33.6%), Irish (93 | 17.2%), Norwegian (89 | 16.5%), Swedish (39 | 7.2%), and American (16 | 3.0%), together accounting for 77.5% of all Avon residents.
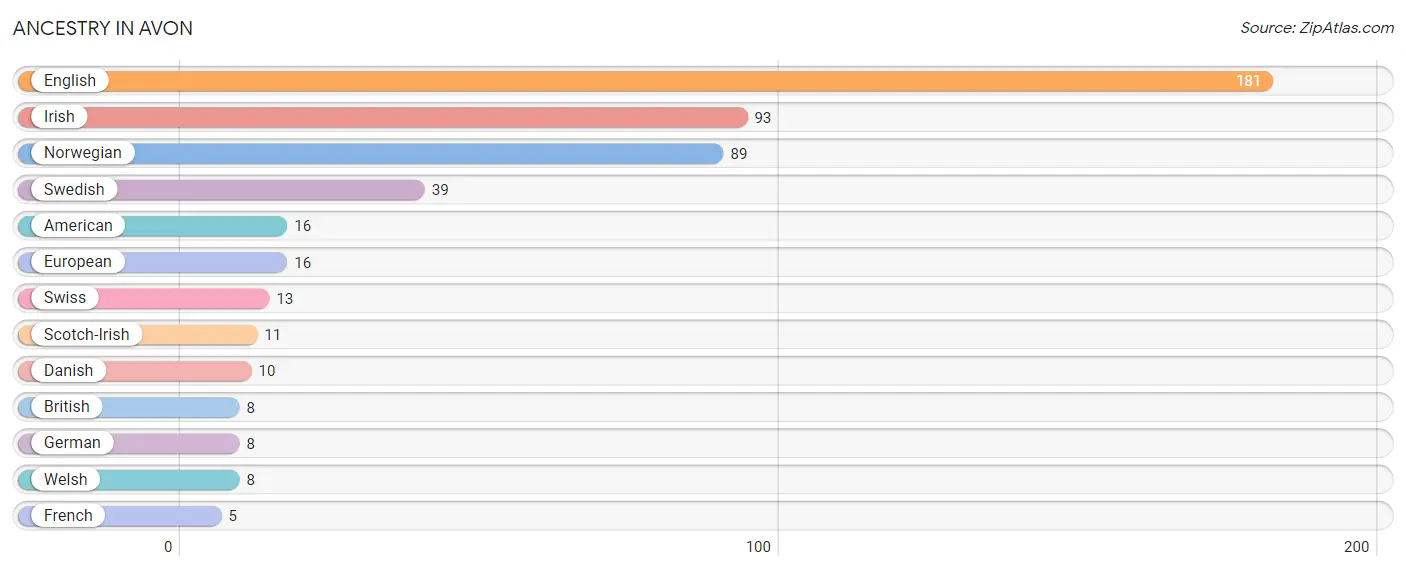
| Ancestry | # Population | % Population |
| American | 16 | 3.0% |
| British | 8 | 1.5% |
| Danish | 10 | 1.9% |
| English | 181 | 33.6% |
| European | 16 | 3.0% |
| French | 5 | 0.9% |
| German | 8 | 1.5% |
| Irish | 93 | 17.2% |
| Norwegian | 89 | 16.5% |
| Scotch-Irish | 11 | 2.0% |
| Swedish | 39 | 7.2% |
| Swiss | 13 | 2.4% |
| Welsh | 8 | 1.5% | View All 13 Rows |
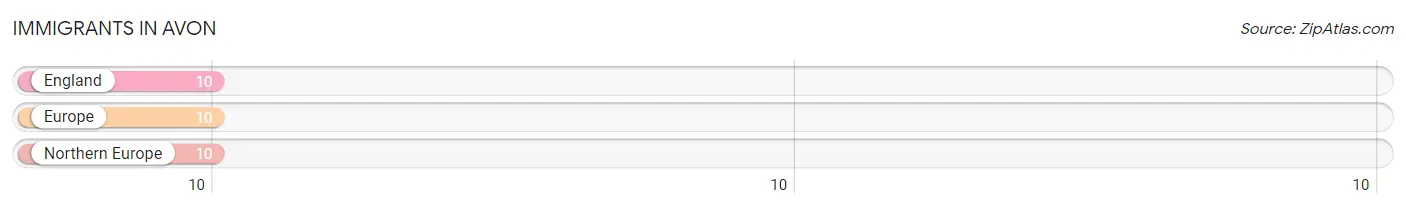
Immigrants in Avon
The most numerous immigrant groups reported in Avon came from England (10 | 1.9%), Europe (10 | 1.9%), and Northern Europe (10 | 1.9%), together accounting for 5.6% of all Avon residents.
| Immigration Origin | # Population | % Population |
| England | 10 | 1.9% |
| Europe | 10 | 1.9% |
| Northern Europe | 10 | 1.9% | View All 3 Rows |
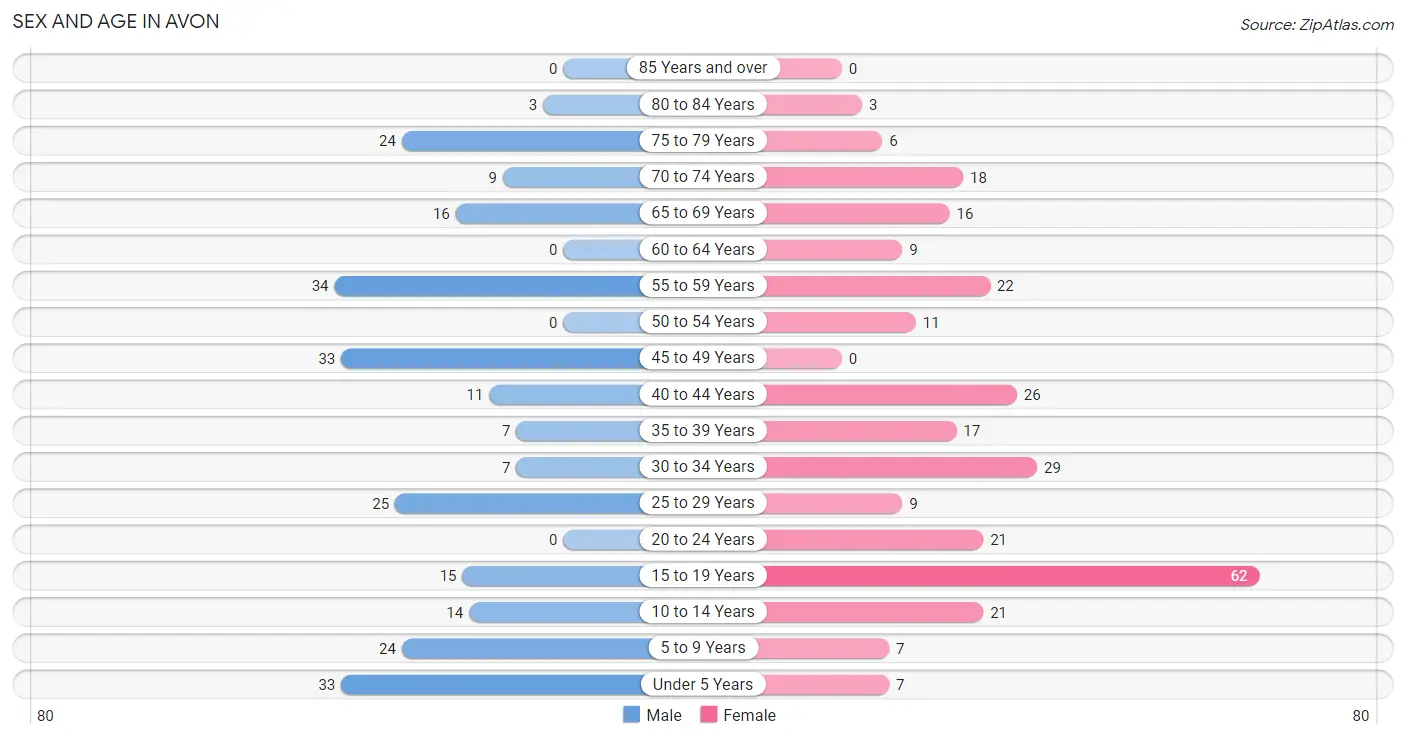
Sex and Age in Avon
Sex and Age in Avon
The most populous age groups in Avon are 55 to 59 Years (34 | 13.3%) for men and 15 to 19 Years (62 | 21.8%) for women.
| Age Bracket | Male | Female |
| Under 5 Years | 33 (12.9%) | 7 (2.5%) |
| 5 to 9 Years | 24 (9.4%) | 7 (2.5%) |
| 10 to 14 Years | 14 (5.5%) | 21 (7.4%) |
| 15 to 19 Years | 15 (5.9%) | 62 (21.8%) |
| 20 to 24 Years | 0 (0.0%) | 21 (7.4%) |
| 25 to 29 Years | 25 (9.8%) | 9 (3.2%) |
| 30 to 34 Years | 7 (2.8%) | 29 (10.2%) |
| 35 to 39 Years | 7 (2.8%) | 17 (6.0%) |
| 40 to 44 Years | 11 (4.3%) | 26 (9.1%) |
| 45 to 49 Years | 33 (12.9%) | 0 (0.0%) |
| 50 to 54 Years | 0 (0.0%) | 11 (3.9%) |
| 55 to 59 Years | 34 (13.3%) | 22 (7.7%) |
| 60 to 64 Years | 0 (0.0%) | 9 (3.2%) |
| 65 to 69 Years | 16 (6.3%) | 16 (5.6%) |
| 70 to 74 Years | 9 (3.5%) | 18 (6.3%) |
| 75 to 79 Years | 24 (9.4%) | 6 (2.1%) |
| 80 to 84 Years | 3 (1.2%) | 3 (1.1%) |
| 85 Years and over | 0 (0.0%) | 0 (0.0%) |
| Total | 255 (100.0%) | 284 (100.0%) |
Families and Households in Avon
Median Family Size in Avon
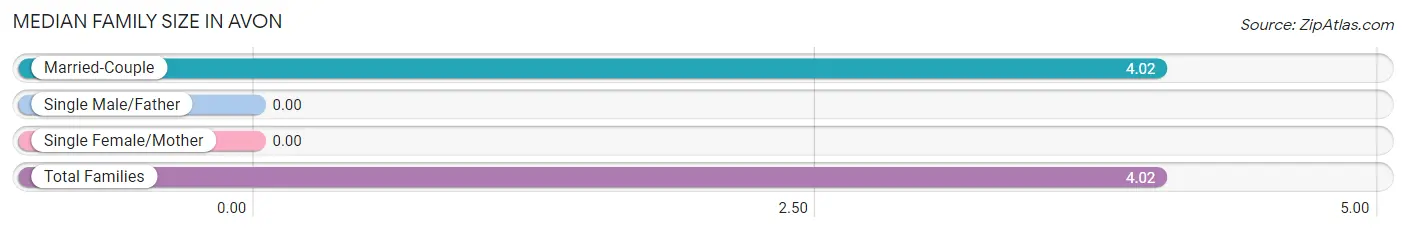
| Family Type | # Families | Family Size |
| Married-Couple | 133 (100.0%) | 4.02 |
| Single Male/Father | 0 (0.0%) | - |
| Single Female/Mother | 0 (0.0%) | - |
| Total Families | 133 (100.0%) | 4.02 |
Median Household Size in Avon
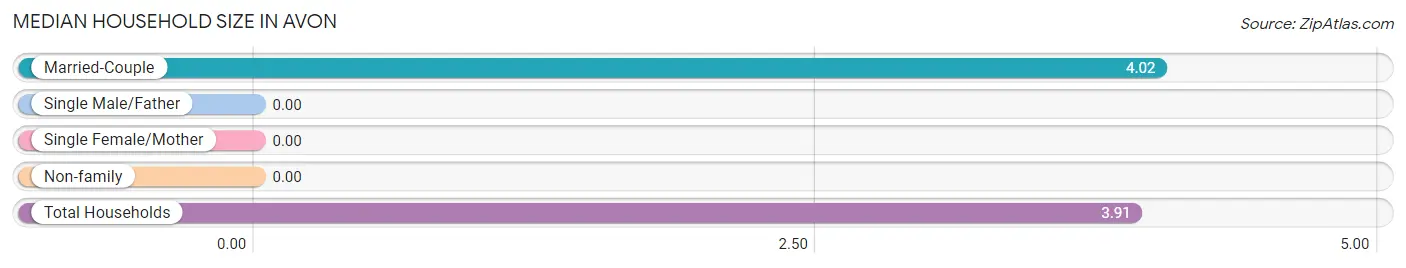
| Household Type | # Households | Household Size |
| Married-Couple | 133 (96.4%) | 4.02 |
| Single Male/Father | 0 (0.0%) | - |
| Single Female/Mother | 0 (0.0%) | - |
| Non-family | 5 (3.6%) | - |
| Total Households | 138 (100.0%) | 3.91 |
Household Size by Marriage Status in Avon
Out of a total of 138 households in Avon, 133 (96.4%) are family households, while 5 (3.6%) are nonfamily households. The most numerous type of family households are 5-person households, comprising 51, and the most common type of nonfamily households are 1-person households, comprising 5.
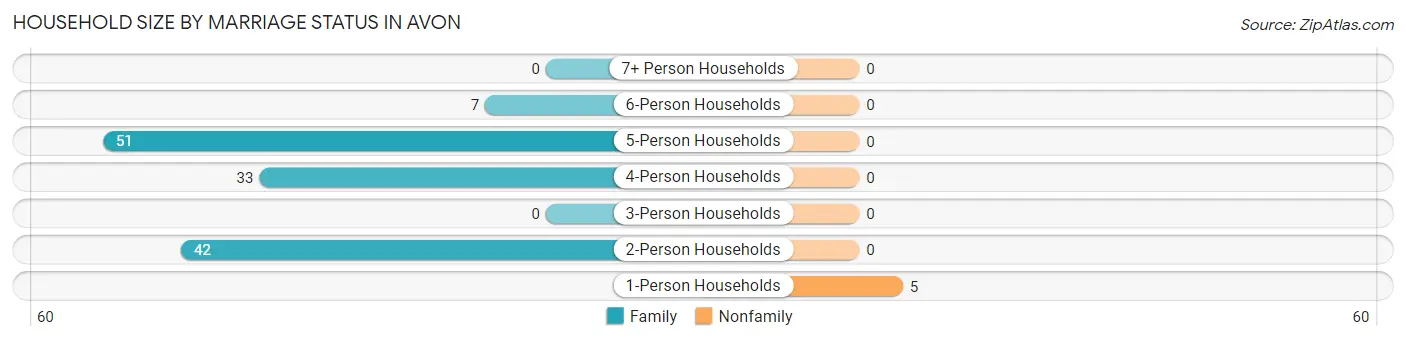
| Household Size | Family Households | Nonfamily Households |
| 1-Person Households | - | 5 (3.6%) |
| 2-Person Households | 42 (30.4%) | 0 (0.0%) |
| 3-Person Households | 0 (0.0%) | 0 (0.0%) |
| 4-Person Households | 33 (23.9%) | 0 (0.0%) |
| 5-Person Households | 51 (37.0%) | 0 (0.0%) |
| 6-Person Households | 7 (5.1%) | 0 (0.0%) |
| 7+ Person Households | 0 (0.0%) | 0 (0.0%) |
| Total | 133 (96.4%) | 5 (3.6%) |
Female Fertility in Avon
Fertility by Age in Avon
| Age Bracket | Women with Births | Births / 1,000 Women |
| 15 to 19 years | 0 (0.0%) | 0.0 |
| 20 to 34 years | 0 (0.0%) | 0.0 |
| 35 to 50 years | 0 (0.0%) | 0.0 |
| Total | 0 (0.0%) | 0.0 |
Fertility by Age by Marriage Status in Avon
| Age Bracket | Married | Unmarried |
| 15 to 19 years | 0 (0.0%) | 0 (0.0%) |
| 20 to 34 years | 0 (0.0%) | 0 (0.0%) |
| 35 to 50 years | 0 (0.0%) | 0 (0.0%) |
| Total | 0 (0.0%) | 0 (0.0%) |
Fertility by Education in Avon
| Educational Attainment | Women with Births | Births / 1,000 Women |
| Less than High School | 0 (0.0%) | 0.0 |
| High School Diploma | 0 (0.0%) | 0.0 |
| College or Associate's Degree | 0 (0.0%) | 0.0 |
| Bachelor's Degree | 0 (0.0%) | 0.0 |
| Graduate Degree | 0 (0.0%) | 0.0 |
| Total | 0 (0.0%) | 0.0 |
Fertility by Education by Marriage Status in Avon
| Educational Attainment | Married | Unmarried |
| Less than High School | 0 (0.0%) | 0 (0.0%) |
| High School Diploma | 0 (0.0%) | 0 (0.0%) |
| College or Associate's Degree | 0 (0.0%) | 0 (0.0%) |
| Bachelor's Degree | 0 (0.0%) | 0 (0.0%) |
| Graduate Degree | 0 (0.0%) | 0 (0.0%) |
| Total | 0 (0.0%) | 0 (0.0%) |
Employment Characteristics in Avon
Employment by Class of Employer in Avon
Among the 226 employed individuals in Avon, private company employees (102 | 45.1%), self-employed (incorporated) (73 | 32.3%), and local government employees (32 | 14.2%) make up the most common classes of employment.
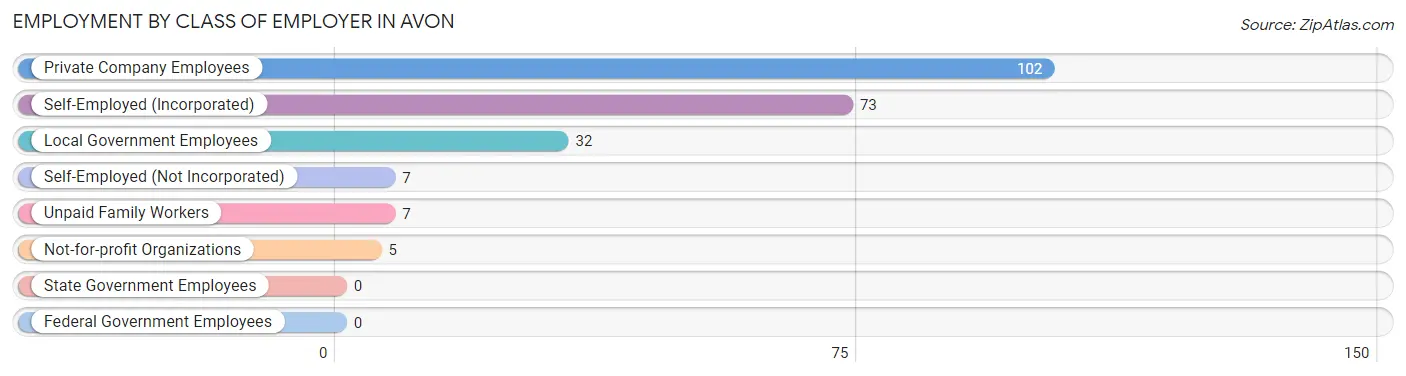
| Employer Class | # Employees | % Employees |
| Private Company Employees | 102 | 45.1% |
| Self-Employed (Incorporated) | 73 | 32.3% |
| Self-Employed (Not Incorporated) | 7 | 3.1% |
| Not-for-profit Organizations | 5 | 2.2% |
| Local Government Employees | 32 | 14.2% |
| State Government Employees | 0 | 0.0% |
| Federal Government Employees | 0 | 0.0% |
| Unpaid Family Workers | 7 | 3.1% |
| Total | 226 | 100.0% |
Employment Status by Age in Avon
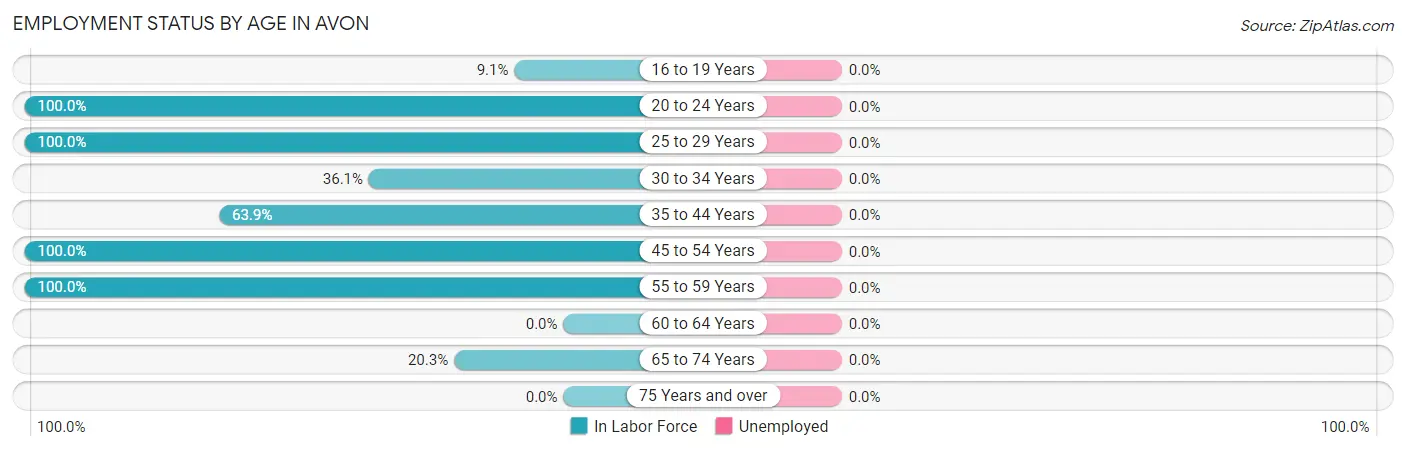
| Age Bracket | In Labor Force | Unemployed |
| 16 to 19 Years | 7 (9.1%) | 0 (0.0%) |
| 20 to 24 Years | 21 (100.0%) | 0 (0.0%) |
| 25 to 29 Years | 34 (100.0%) | 0 (0.0%) |
| 30 to 34 Years | 13 (36.1%) | 0 (0.0%) |
| 35 to 44 Years | 39 (63.9%) | 0 (0.0%) |
| 45 to 54 Years | 44 (100.0%) | 0 (0.0%) |
| 55 to 59 Years | 56 (100.0%) | 0 (0.0%) |
| 60 to 64 Years | 0 (0.0%) | 0 (0.0%) |
| 65 to 74 Years | 12 (20.3%) | 0 (0.0%) |
| 75 Years and over | 0 (0.0%) | 0 (0.0%) |
| Total | 226 (52.2%) | 0 (0.0%) |
Employment Status by Educational Attainment in Avon
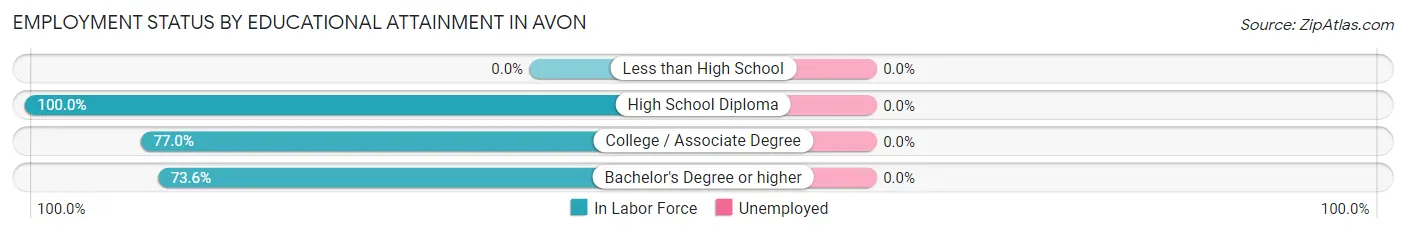
| Educational Attainment | In Labor Force | Unemployed |
| Less than High School | 0 (0.0%) | 0 (0.0%) |
| High School Diploma | 18 (100.0%) | 0 (0.0%) |
| College / Associate Degree | 104 (77.0%) | 0 (0.0%) |
| Bachelor's Degree or higher | 64 (73.6%) | 0 (0.0%) |
| Total | 186 (77.5%) | 0 (0.0%) |
Employment Occupations by Sex in Avon
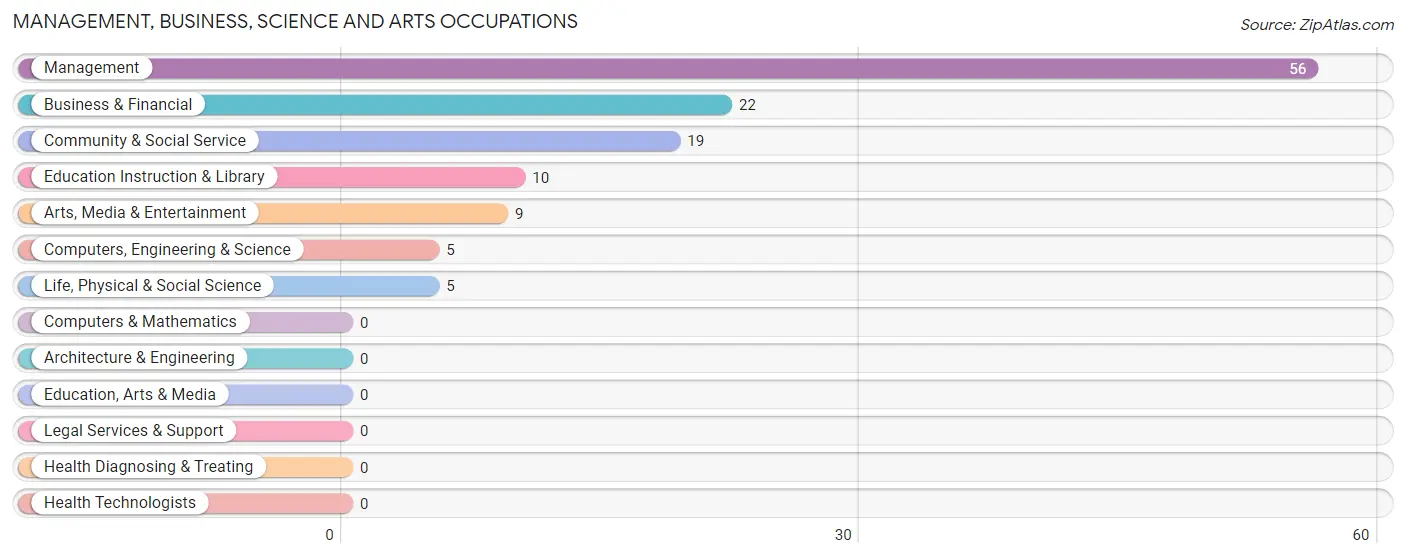
Management, Business, Science and Arts Occupations
The most common Management, Business, Science and Arts occupations in Avon are Management (56 | 24.8%), Business & Financial (22 | 9.7%), Community & Social Service (19 | 8.4%), Education Instruction & Library (10 | 4.4%), and Arts, Media & Entertainment (9 | 4.0%).
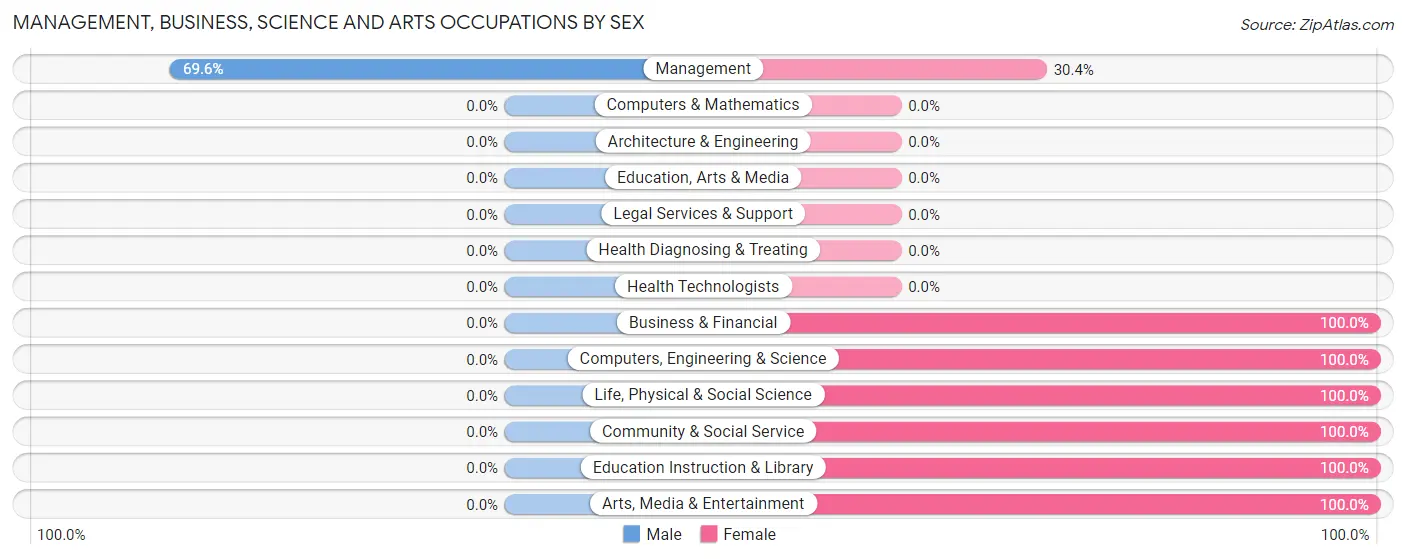
Management, Business, Science and Arts Occupations by Sex
| Occupation | Male | Female |
| Management | 39 (69.6%) | 17 (30.4%) |
| Business & Financial | 0 (0.0%) | 22 (100.0%) |
| Computers, Engineering & Science | 0 (0.0%) | 5 (100.0%) |
| Computers & Mathematics | 0 (0.0%) | 0 (0.0%) |
| Architecture & Engineering | 0 (0.0%) | 0 (0.0%) |
| Life, Physical & Social Science | 0 (0.0%) | 5 (100.0%) |
| Community & Social Service | 0 (0.0%) | 19 (100.0%) |
| Education, Arts & Media | 0 (0.0%) | 0 (0.0%) |
| Legal Services & Support | 0 (0.0%) | 0 (0.0%) |
| Education Instruction & Library | 0 (0.0%) | 10 (100.0%) |
| Arts, Media & Entertainment | 0 (0.0%) | 9 (100.0%) |
| Health Diagnosing & Treating | 0 (0.0%) | 0 (0.0%) |
| Health Technologists | 0 (0.0%) | 0 (0.0%) |
| Total (Category) | 39 (38.2%) | 63 (61.8%) |
| Total (Overall) | 124 (54.9%) | 102 (45.1%) |
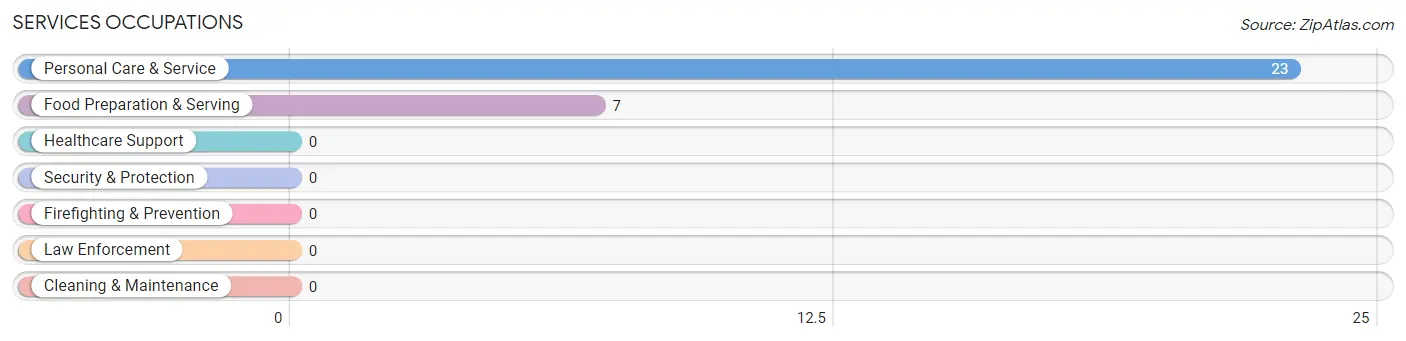
Services Occupations
The most common Services occupations in Avon are Personal Care & Service (23 | 10.2%), and Food Preparation & Serving (7 | 3.1%).
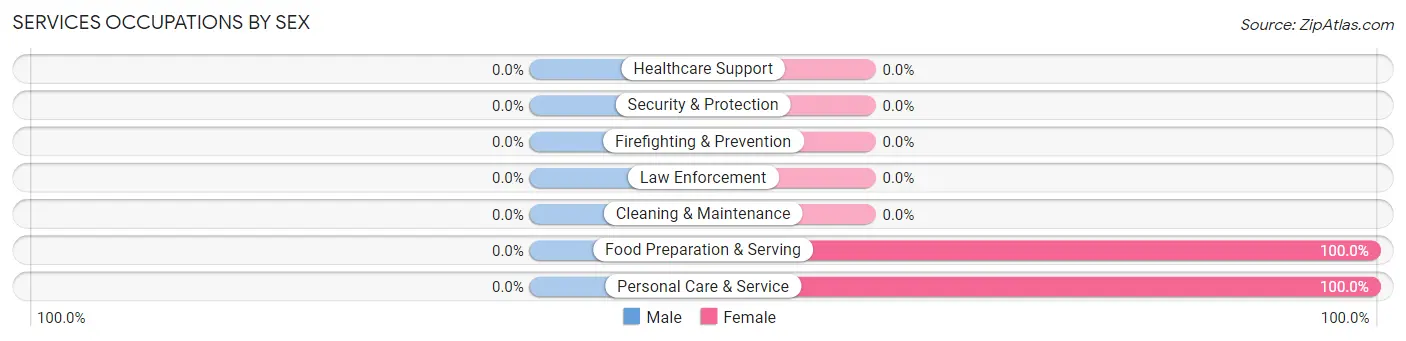
Services Occupations by Sex
| Occupation | Male | Female |
| Healthcare Support | 0 (0.0%) | 0 (0.0%) |
| Security & Protection | 0 (0.0%) | 0 (0.0%) |
| Firefighting & Prevention | 0 (0.0%) | 0 (0.0%) |
| Law Enforcement | 0 (0.0%) | 0 (0.0%) |
| Food Preparation & Serving | 0 (0.0%) | 7 (100.0%) |
| Cleaning & Maintenance | 0 (0.0%) | 0 (0.0%) |
| Personal Care & Service | 0 (0.0%) | 23 (100.0%) |
| Total (Category) | 0 (0.0%) | 30 (100.0%) |
| Total (Overall) | 124 (54.9%) | 102 (45.1%) |
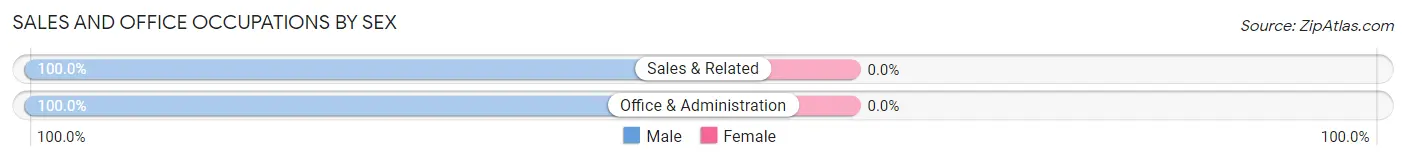
Sales and Office Occupations
The most common Sales and Office occupations in Avon are Office & Administration (24 | 10.6%), and Sales & Related (11 | 4.9%).
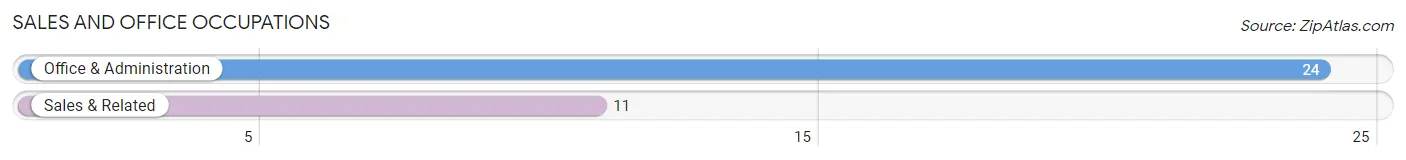
Sales and Office Occupations by Sex
| Occupation | Male | Female |
| Sales & Related | 11 (100.0%) | 0 (0.0%) |
| Office & Administration | 24 (100.0%) | 0 (0.0%) |
| Total (Category) | 35 (100.0%) | 0 (0.0%) |
| Total (Overall) | 124 (54.9%) | 102 (45.1%) |
Natural Resources, Construction and Maintenance Occupations
The most common Natural Resources, Construction and Maintenance occupations in Avon are , and Farming, Fishing & Forestry (7 | 3.1%).
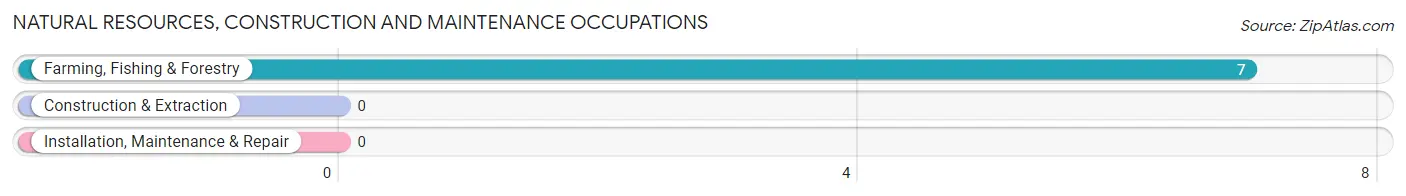
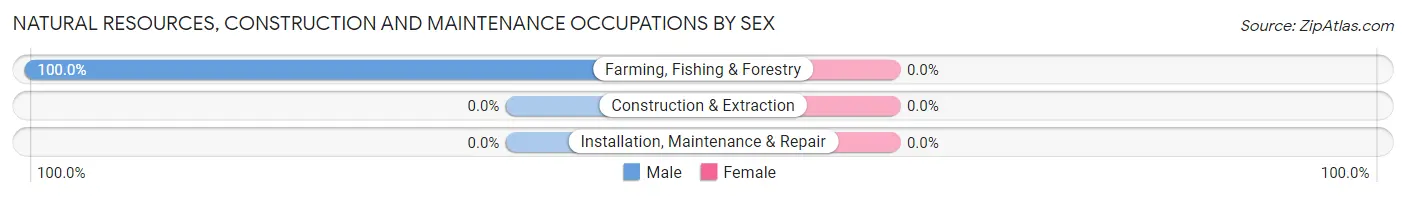
Natural Resources, Construction and Maintenance Occupations by Sex
| Occupation | Male | Female |
| Farming, Fishing & Forestry | 7 (100.0%) | 0 (0.0%) |
| Construction & Extraction | 0 (0.0%) | 0 (0.0%) |
| Installation, Maintenance & Repair | 0 (0.0%) | 0 (0.0%) |
| Total (Category) | 7 (100.0%) | 0 (0.0%) |
| Total (Overall) | 124 (54.9%) | 102 (45.1%) |
Production, Transportation and Moving Occupations
The most common Production, Transportation and Moving occupations in Avon are Production (48 | 21.2%), and Material Moving (4 | 1.8%).
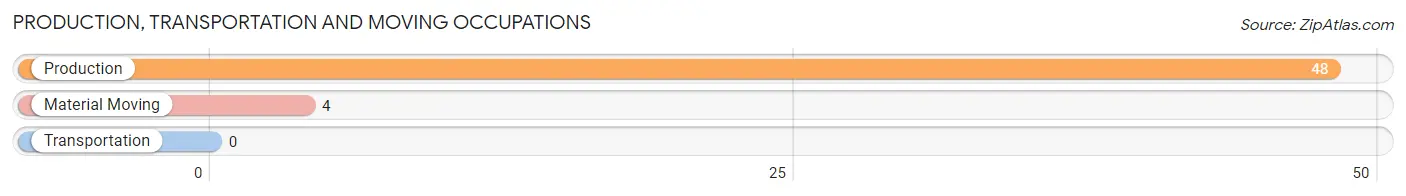
Production, Transportation and Moving Occupations by Sex
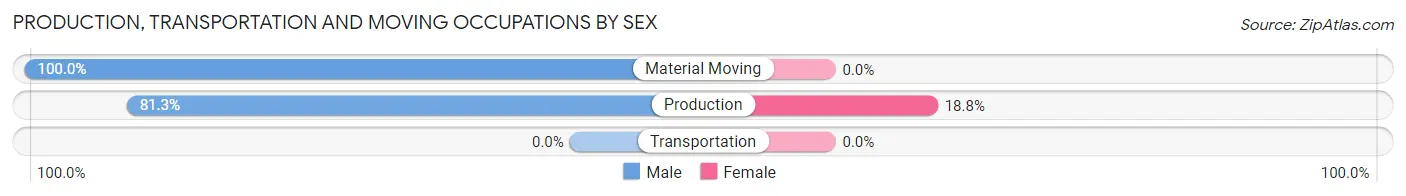
| Occupation | Male | Female |
| Production | 39 (81.2%) | 9 (18.8%) |
| Transportation | 0 (0.0%) | 0 (0.0%) |
| Material Moving | 4 (100.0%) | 0 (0.0%) |
| Total (Category) | 43 (82.7%) | 9 (17.3%) |
| Total (Overall) | 124 (54.9%) | 102 (45.1%) |
Employment Industries by Sex in Avon
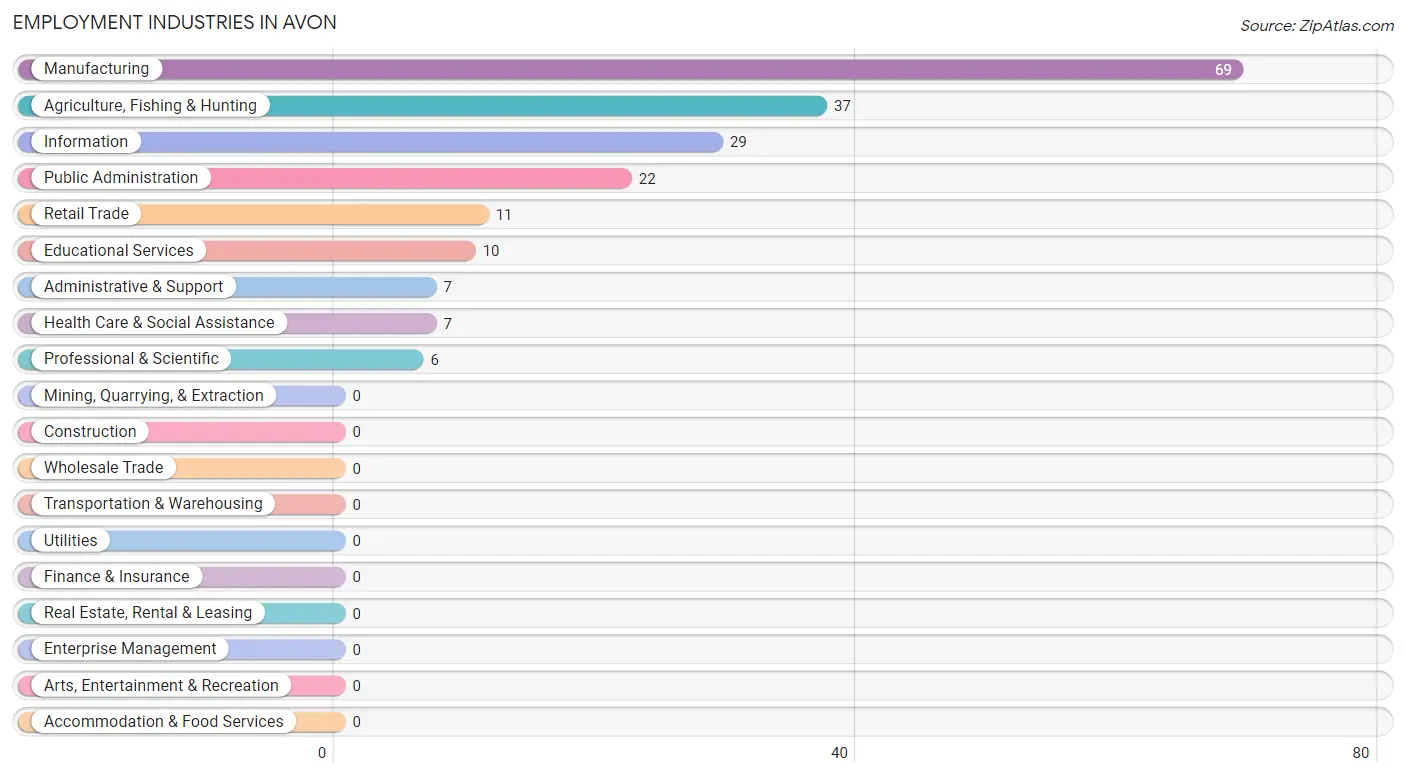
Employment Industries in Avon
The major employment industries in Avon include Manufacturing (69 | 30.5%), Agriculture, Fishing & Hunting (37 | 16.4%), Information (29 | 12.8%), Public Administration (22 | 9.7%), and Retail Trade (11 | 4.9%).
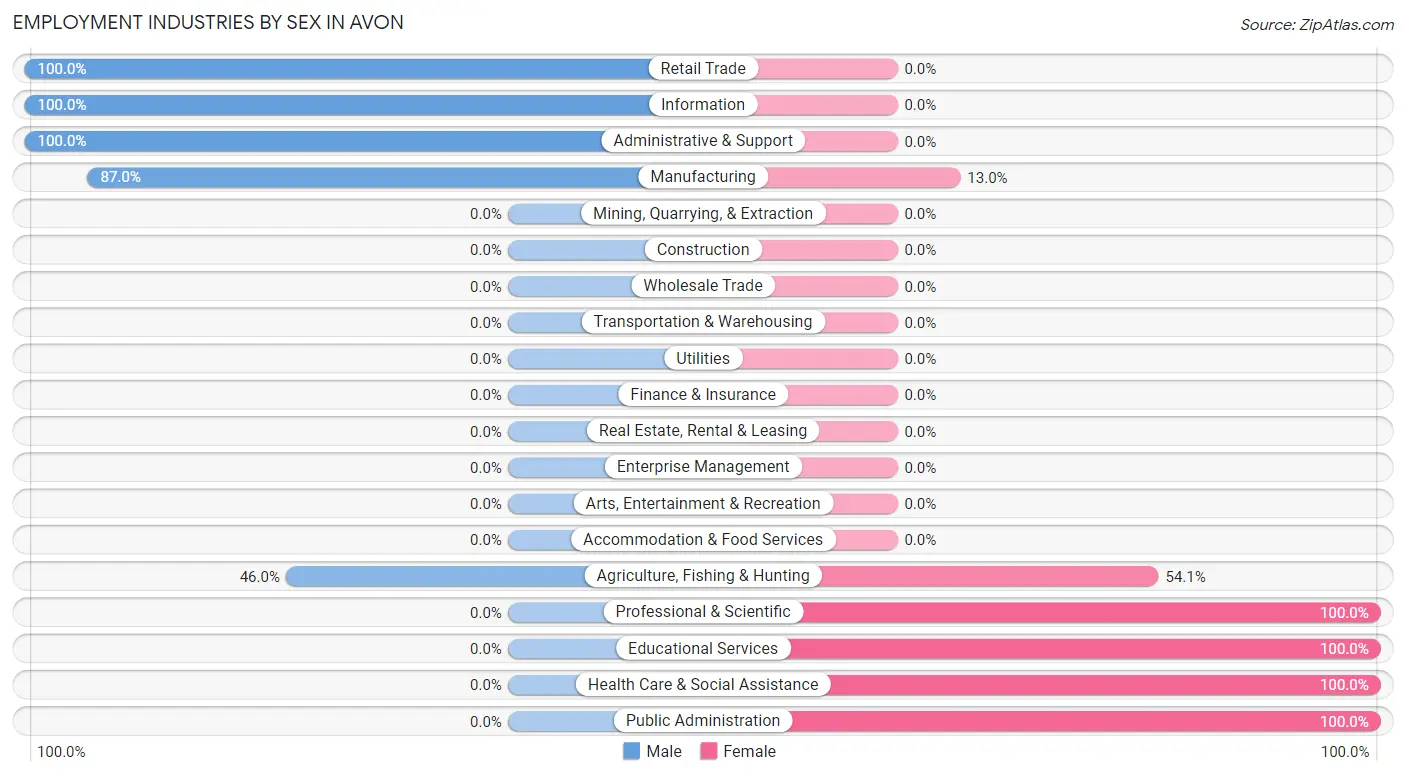
Employment Industries by Sex in Avon
The Avon industries that see more men than women are Retail Trade (100.0%), Information (100.0%), and Administrative & Support (100.0%), whereas the industries that tend to have a higher number of women are Professional & Scientific (100.0%), Educational Services (100.0%), and Health Care & Social Assistance (100.0%).
| Industry | Male | Female |
| Agriculture, Fishing & Hunting | 17 (46.0%) | 20 (54.0%) |
| Mining, Quarrying, & Extraction | 0 (0.0%) | 0 (0.0%) |
| Construction | 0 (0.0%) | 0 (0.0%) |
| Manufacturing | 60 (87.0%) | 9 (13.0%) |
| Wholesale Trade | 0 (0.0%) | 0 (0.0%) |
| Retail Trade | 11 (100.0%) | 0 (0.0%) |
| Transportation & Warehousing | 0 (0.0%) | 0 (0.0%) |
| Utilities | 0 (0.0%) | 0 (0.0%) |
| Information | 29 (100.0%) | 0 (0.0%) |
| Finance & Insurance | 0 (0.0%) | 0 (0.0%) |
| Real Estate, Rental & Leasing | 0 (0.0%) | 0 (0.0%) |
| Professional & Scientific | 0 (0.0%) | 6 (100.0%) |
| Enterprise Management | 0 (0.0%) | 0 (0.0%) |
| Administrative & Support | 7 (100.0%) | 0 (0.0%) |
| Educational Services | 0 (0.0%) | 10 (100.0%) |
| Health Care & Social Assistance | 0 (0.0%) | 7 (100.0%) |
| Arts, Entertainment & Recreation | 0 (0.0%) | 0 (0.0%) |
| Accommodation & Food Services | 0 (0.0%) | 0 (0.0%) |
| Public Administration | 0 (0.0%) | 22 (100.0%) |
| Total | 124 (54.9%) | 102 (45.1%) |
Education in Avon
School Enrollment in Avon
The most common levels of schooling among the 158 students in Avon are high school (57 | 36.1%), middle school (42 | 26.6%), and graduate / professional (25 | 15.8%).
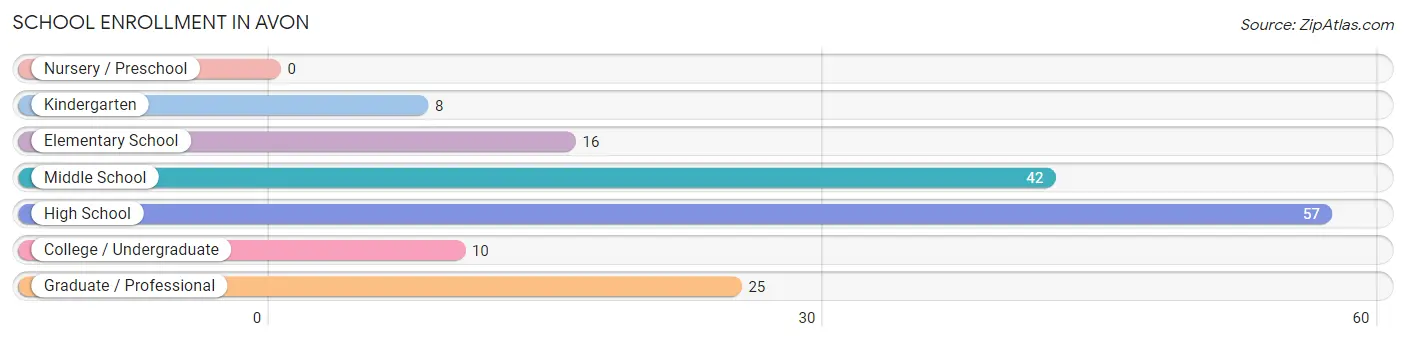
| School Level | # Students | % Students |
| Nursery / Preschool | 0 | 0.0% |
| Kindergarten | 8 | 5.1% |
| Elementary School | 16 | 10.1% |
| Middle School | 42 | 26.6% |
| High School | 57 | 36.1% |
| College / Undergraduate | 10 | 6.3% |
| Graduate / Professional | 25 | 15.8% |
| Total | 158 | 100.0% |
School Enrollment by Age by Funding Source in Avon
Out of a total of 158 students who are enrolled in schools in Avon, 38 (24.1%) attend a private institution, while the remaining 120 (75.9%) are enrolled in public schools. The age group of 35 years and over has the highest likelihood of being enrolled in private schools, with 10 (100.0% in the age bracket) enrolled. Conversely, the age group of 15 to 17 year olds has the lowest likelihood of being enrolled in a private school, with 50 (100.0% in the age bracket) attending a public institution.
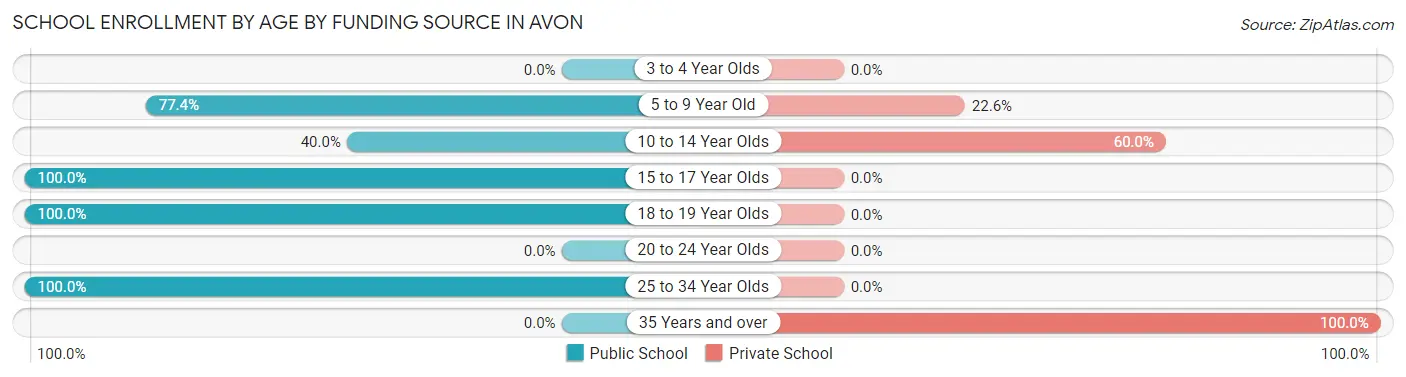
| Age Bracket | Public School | Private School |
| 3 to 4 Year Olds | 0 (0.0%) | 0 (0.0%) |
| 5 to 9 Year Old | 24 (77.4%) | 7 (22.6%) |
| 10 to 14 Year Olds | 14 (40.0%) | 21 (60.0%) |
| 15 to 17 Year Olds | 50 (100.0%) | 0 (0.0%) |
| 18 to 19 Year Olds | 7 (100.0%) | 0 (0.0%) |
| 20 to 24 Year Olds | 0 (0.0%) | 0 (0.0%) |
| 25 to 34 Year Olds | 25 (100.0%) | 0 (0.0%) |
| 35 Years and over | 0 (0.0%) | 10 (100.0%) |
| Total | 120 (75.9%) | 38 (24.1%) |
Educational Attainment by Field of Study in Avon
Business (54 | 34.4%), computers & mathematics (29 | 18.5%), education (24 | 15.3%), multidisciplinary studies (23 | 14.6%), and bio, nature & agricultural (11 | 7.0%) are the most common fields of study among 157 individuals in Avon who have obtained a bachelor's degree or higher.
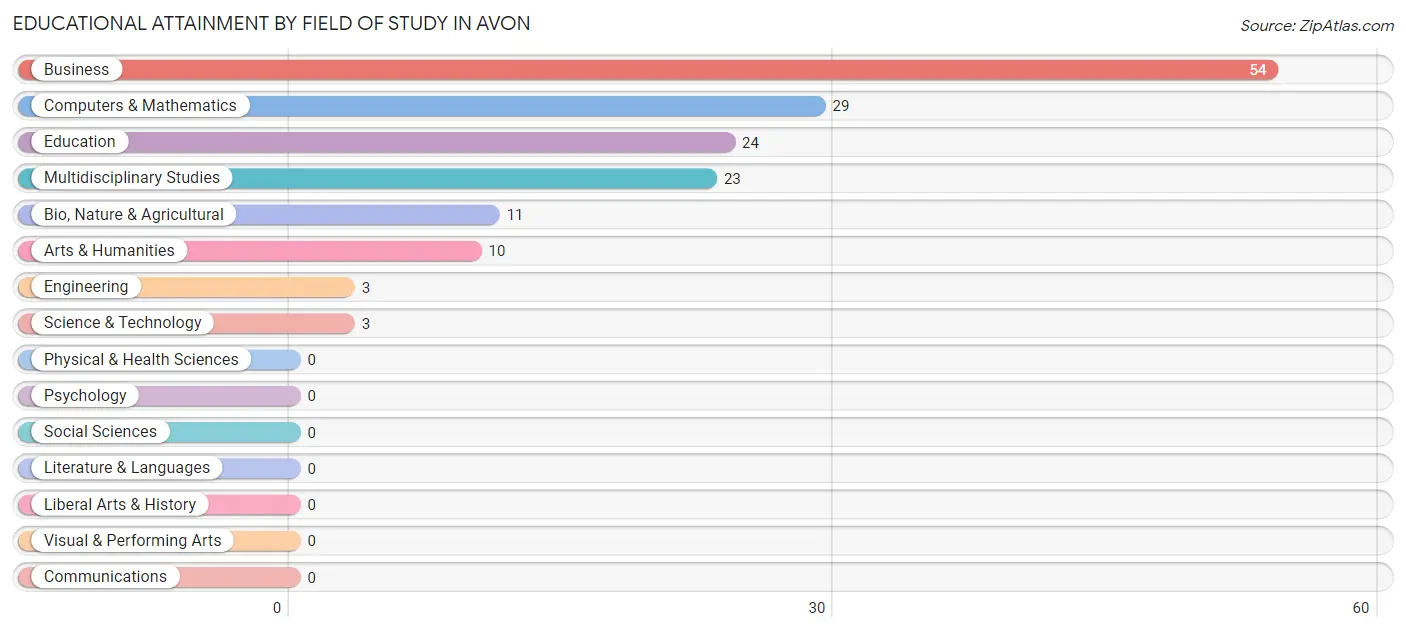
| Field of Study | # Graduates | % Graduates |
| Computers & Mathematics | 29 | 18.5% |
| Bio, Nature & Agricultural | 11 | 7.0% |
| Physical & Health Sciences | 0 | 0.0% |
| Psychology | 0 | 0.0% |
| Social Sciences | 0 | 0.0% |
| Engineering | 3 | 1.9% |
| Multidisciplinary Studies | 23 | 14.6% |
| Science & Technology | 3 | 1.9% |
| Business | 54 | 34.4% |
| Education | 24 | 15.3% |
| Literature & Languages | 0 | 0.0% |
| Liberal Arts & History | 0 | 0.0% |
| Visual & Performing Arts | 0 | 0.0% |
| Communications | 0 | 0.0% |
| Arts & Humanities | 10 | 6.4% |
| Total | 157 | 100.0% |
Transportation & Commute in Avon
Vehicle Availability by Sex in Avon
The most prevalent vehicle ownership categories in Avon are males with 5 or more vehicles (74, accounting for 59.7%) and females with 5 or more vehicles (84, making up 72.6%).
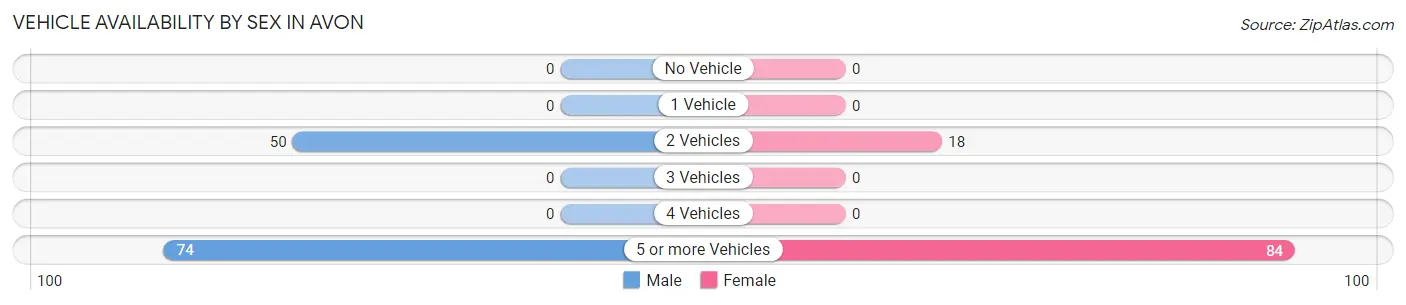
| Vehicles Available | Male | Female |
| No Vehicle | 0 (0.0%) | 0 (0.0%) |
| 1 Vehicle | 0 (0.0%) | 0 (0.0%) |
| 2 Vehicles | 50 (40.3%) | 18 (17.6%) |
| 3 Vehicles | 0 (0.0%) | 0 (0.0%) |
| 4 Vehicles | 0 (0.0%) | 0 (0.0%) |
| 5 or more Vehicles | 74 (59.7%) | 84 (82.4%) |
| Total | 124 (100.0%) | 102 (100.0%) |
Commute Time in Avon
The most frequently occuring commute durations in Avon are 20 to 24 minutes (61 commuters, 34.7%), 30 to 34 minutes (34 commuters, 19.3%), and 25 to 29 minutes (27 commuters, 15.3%).
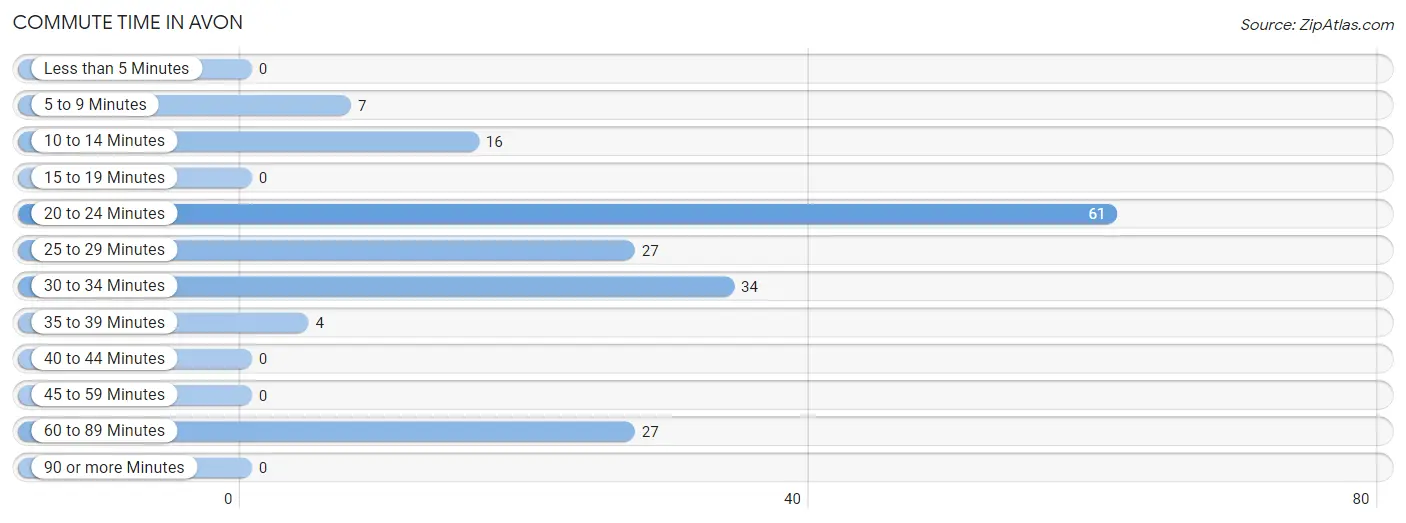
| Commute Time | # Commuters | % Commuters |
| Less than 5 Minutes | 0 | 0.0% |
| 5 to 9 Minutes | 7 | 4.0% |
| 10 to 14 Minutes | 16 | 9.1% |
| 15 to 19 Minutes | 0 | 0.0% |
| 20 to 24 Minutes | 61 | 34.7% |
| 25 to 29 Minutes | 27 | 15.3% |
| 30 to 34 Minutes | 34 | 19.3% |
| 35 to 39 Minutes | 4 | 2.3% |
| 40 to 44 Minutes | 0 | 0.0% |
| 45 to 59 Minutes | 0 | 0.0% |
| 60 to 89 Minutes | 27 | 15.3% |
| 90 or more Minutes | 0 | 0.0% |
Commute Time by Sex in Avon
The most common commute times in Avon are 20 to 24 minutes (56 commuters, 65.9%) for males and 25 to 29 minutes (27 commuters, 29.7%) for females.

| Commute Time | Male | Female |
| Less than 5 Minutes | 0 (0.0%) | 0 (0.0%) |
| 5 to 9 Minutes | 7 (8.2%) | 0 (0.0%) |
| 10 to 14 Minutes | 0 (0.0%) | 16 (17.6%) |
| 15 to 19 Minutes | 0 (0.0%) | 0 (0.0%) |
| 20 to 24 Minutes | 56 (65.9%) | 5 (5.5%) |
| 25 to 29 Minutes | 0 (0.0%) | 27 (29.7%) |
| 30 to 34 Minutes | 7 (8.2%) | 27 (29.7%) |
| 35 to 39 Minutes | 4 (4.7%) | 0 (0.0%) |
| 40 to 44 Minutes | 0 (0.0%) | 0 (0.0%) |
| 45 to 59 Minutes | 0 (0.0%) | 0 (0.0%) |
| 60 to 89 Minutes | 11 (12.9%) | 16 (17.6%) |
| 90 or more Minutes | 0 (0.0%) | 0 (0.0%) |
Time of Departure to Work by Sex in Avon
The most frequent times of departure to work in Avon are 6:00 AM to 6:29 AM (49, 57.7%) for males and 7:30 AM to 7:59 AM (22, 24.2%) for females.
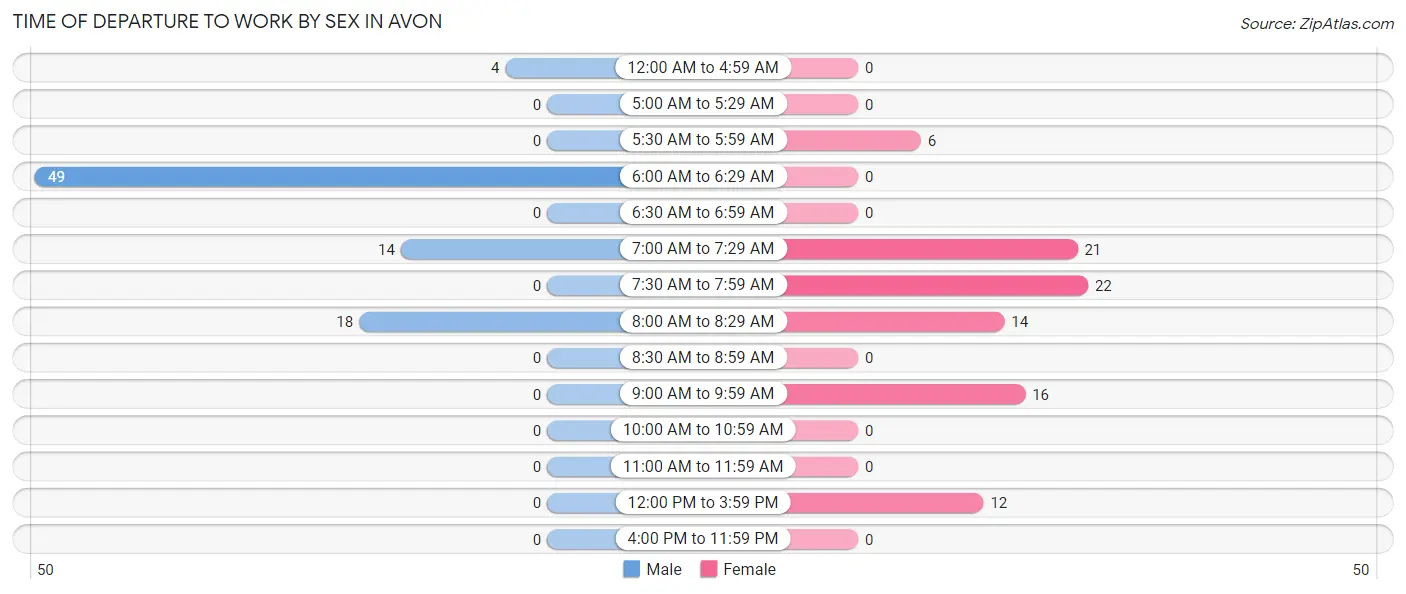
| Time of Departure | Male | Female |
| 12:00 AM to 4:59 AM | 4 (4.7%) | 0 (0.0%) |
| 5:00 AM to 5:29 AM | 0 (0.0%) | 0 (0.0%) |
| 5:30 AM to 5:59 AM | 0 (0.0%) | 6 (6.6%) |
| 6:00 AM to 6:29 AM | 49 (57.7%) | 0 (0.0%) |
| 6:30 AM to 6:59 AM | 0 (0.0%) | 0 (0.0%) |
| 7:00 AM to 7:29 AM | 14 (16.5%) | 21 (23.1%) |
| 7:30 AM to 7:59 AM | 0 (0.0%) | 22 (24.2%) |
| 8:00 AM to 8:29 AM | 18 (21.2%) | 14 (15.4%) |
| 8:30 AM to 8:59 AM | 0 (0.0%) | 0 (0.0%) |
| 9:00 AM to 9:59 AM | 0 (0.0%) | 16 (17.6%) |
| 10:00 AM to 10:59 AM | 0 (0.0%) | 0 (0.0%) |
| 11:00 AM to 11:59 AM | 0 (0.0%) | 0 (0.0%) |
| 12:00 PM to 3:59 PM | 0 (0.0%) | 12 (13.2%) |
| 4:00 PM to 11:59 PM | 0 (0.0%) | 0 (0.0%) |
| Total | 85 (100.0%) | 91 (100.0%) |
Housing Occupancy in Avon
Occupancy by Ownership in Avon
Of the total 138 dwellings in Avon, owner-occupied units account for 138 (100.0%), while renter-occupied units make up 0 (0.0%).
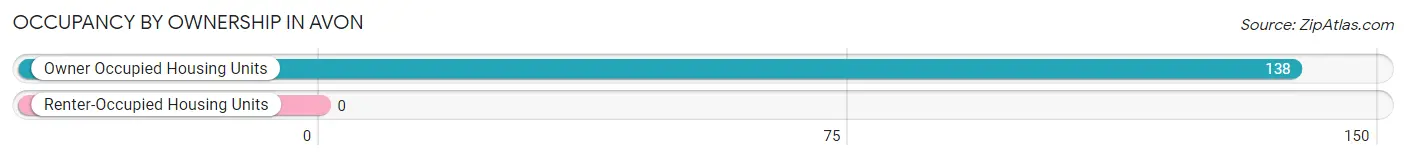
| Occupancy | # Housing Units | % Housing Units |
| Owner Occupied Housing Units | 138 | 100.0% |
| Renter-Occupied Housing Units | 0 | 0.0% |
| Total Occupied Housing Units | 138 | 100.0% |
Occupancy by Household Size in Avon
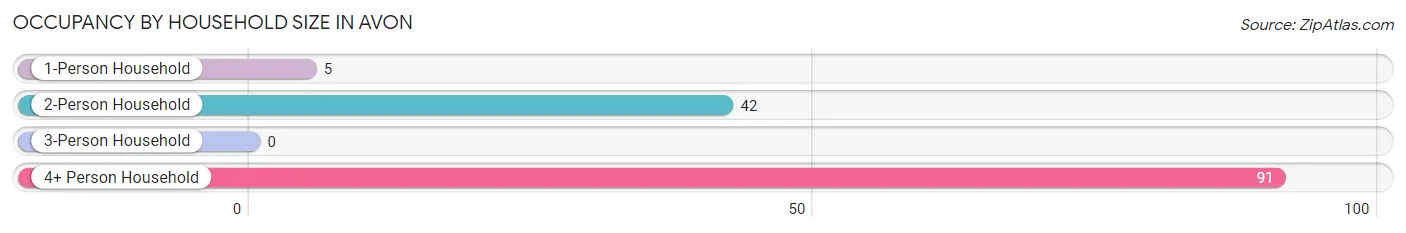
| Household Size | # Housing Units | % Housing Units |
| 1-Person Household | 5 | 3.6% |
| 2-Person Household | 42 | 30.4% |
| 3-Person Household | 0 | 0.0% |
| 4+ Person Household | 91 | 65.9% |
| Total Housing Units | 138 | 100.0% |
Occupancy by Ownership by Household Size in Avon
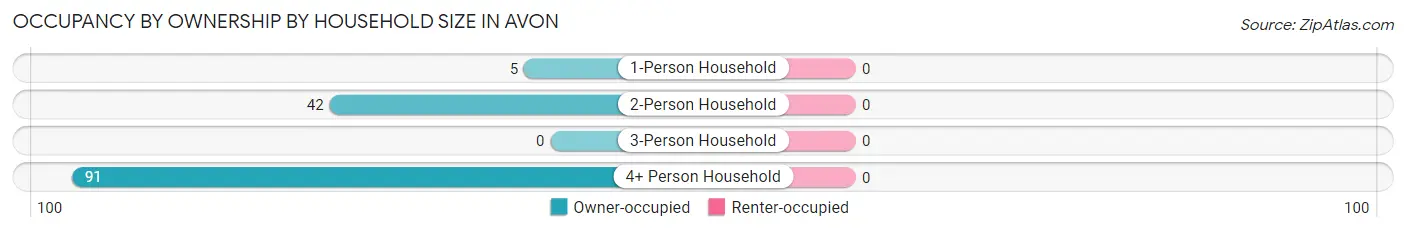
| Household Size | Owner-occupied | Renter-occupied |
| 1-Person Household | 5 (100.0%) | 0 (0.0%) |
| 2-Person Household | 42 (100.0%) | 0 (0.0%) |
| 3-Person Household | 0 (0.0%) | 0 (0.0%) |
| 4+ Person Household | 91 (100.0%) | 0 (0.0%) |
| Total Housing Units | 138 (100.0%) | 0 (0.0%) |
Occupancy by Educational Attainment in Avon
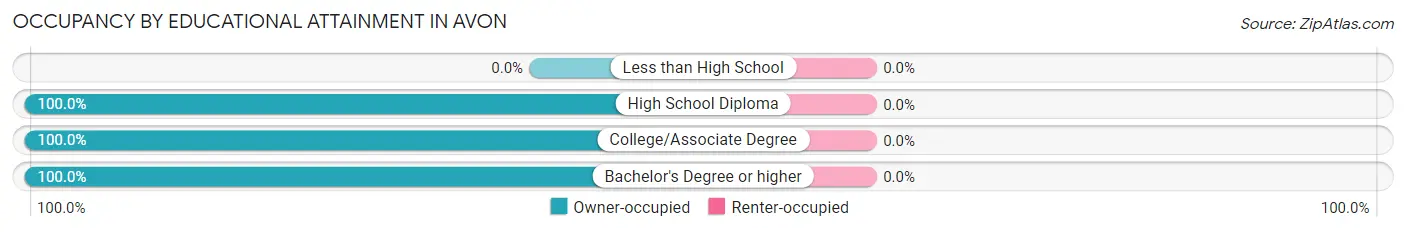
| Household Size | Owner-occupied | Renter-occupied |
| Less than High School | 0 (0.0%) | 0 (0.0%) |
| High School Diploma | 4 (100.0%) | 0 (0.0%) |
| College/Associate Degree | 109 (100.0%) | 0 (0.0%) |
| Bachelor's Degree or higher | 25 (100.0%) | 0 (0.0%) |
Occupancy by Age of Householder in Avon
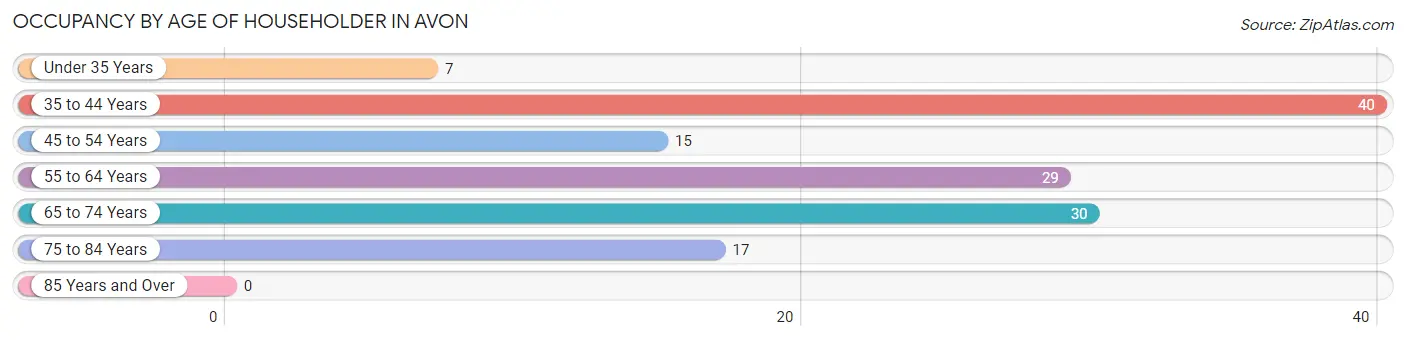
| Age Bracket | # Households | % Households |
| Under 35 Years | 7 | 5.1% |
| 35 to 44 Years | 40 | 29.0% |
| 45 to 54 Years | 15 | 10.9% |
| 55 to 64 Years | 29 | 21.0% |
| 65 to 74 Years | 30 | 21.7% |
| 75 to 84 Years | 17 | 12.3% |
| 85 Years and Over | 0 | 0.0% |
| Total | 138 | 100.0% |
Housing Finances in Avon
Median Income by Occupancy in Avon
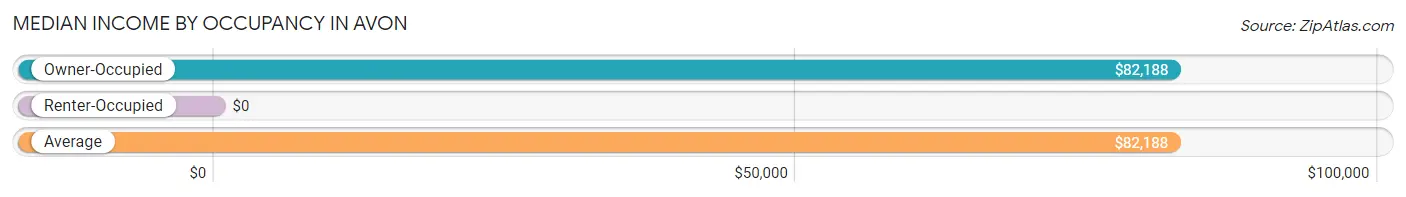
| Occupancy Type | # Households | Median Income |
| Owner-Occupied | 138 (100.0%) | $82,188 |
| Renter-Occupied | 0 (0.0%) | $0 |
| Average | 138 (100.0%) | $82,188 |
Occupancy by Householder Income Bracket in Avon
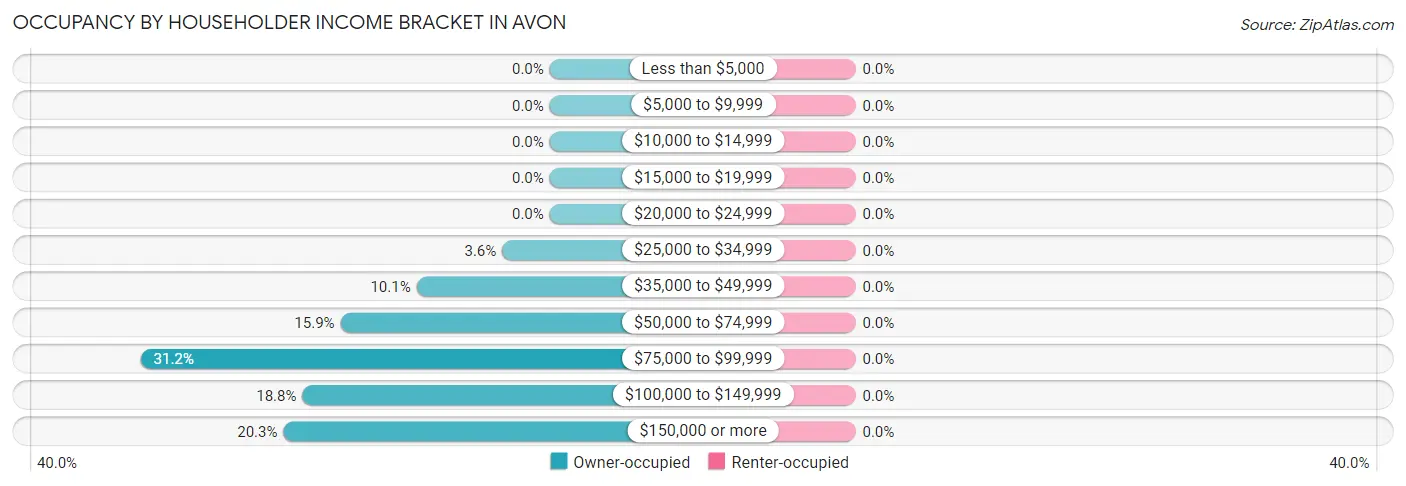
| Income Bracket | Owner-occupied | Renter-occupied |
| Less than $5,000 | 0 (0.0%) | 0 (0.0%) |
| $5,000 to $9,999 | 0 (0.0%) | 0 (0.0%) |
| $10,000 to $14,999 | 0 (0.0%) | 0 (0.0%) |
| $15,000 to $19,999 | 0 (0.0%) | 0 (0.0%) |
| $20,000 to $24,999 | 0 (0.0%) | 0 (0.0%) |
| $25,000 to $34,999 | 5 (3.6%) | 0 (0.0%) |
| $35,000 to $49,999 | 14 (10.1%) | 0 (0.0%) |
| $50,000 to $74,999 | 22 (15.9%) | 0 (0.0%) |
| $75,000 to $99,999 | 43 (31.2%) | 0 (0.0%) |
| $100,000 to $149,999 | 26 (18.8%) | 0 (0.0%) |
| $150,000 or more | 28 (20.3%) | 0 (0.0%) |
| Total | 138 (100.0%) | 0 (0.0%) |
Monthly Housing Cost Tiers in Avon
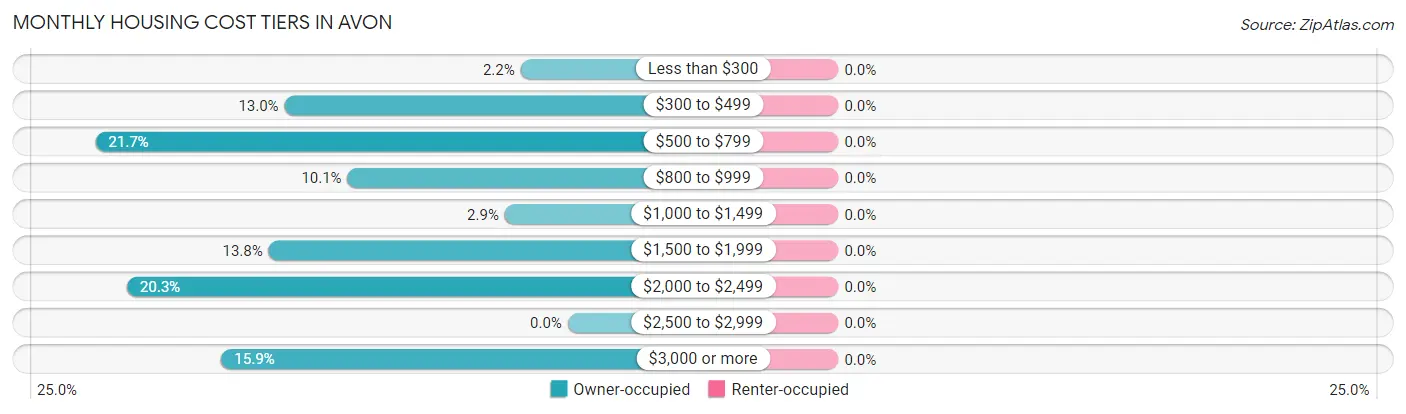
| Monthly Cost | Owner-occupied | Renter-occupied |
| Less than $300 | 3 (2.2%) | 0 (0.0%) |
| $300 to $499 | 18 (13.0%) | 0 (0.0%) |
| $500 to $799 | 30 (21.7%) | 0 (0.0%) |
| $800 to $999 | 14 (10.1%) | 0 (0.0%) |
| $1,000 to $1,499 | 4 (2.9%) | 0 (0.0%) |
| $1,500 to $1,999 | 19 (13.8%) | 0 (0.0%) |
| $2,000 to $2,499 | 28 (20.3%) | 0 (0.0%) |
| $2,500 to $2,999 | 0 (0.0%) | 0 (0.0%) |
| $3,000 or more | 22 (15.9%) | 0 (0.0%) |
| Total | 138 (100.0%) | 0 (0.0%) |
Physical Housing Characteristics in Avon
Housing Structures in Avon
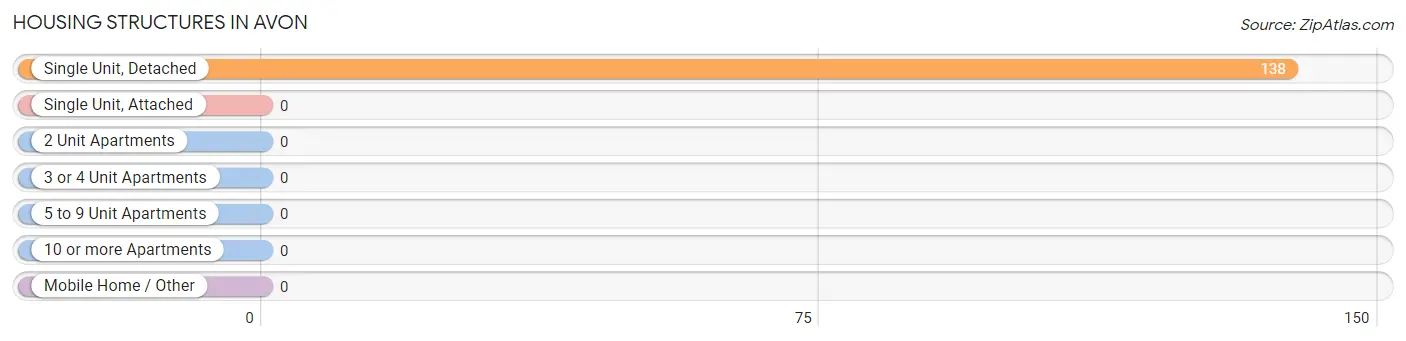
| Structure Type | # Housing Units | % Housing Units |
| Single Unit, Detached | 138 | 100.0% |
| Single Unit, Attached | 0 | 0.0% |
| 2 Unit Apartments | 0 | 0.0% |
| 3 or 4 Unit Apartments | 0 | 0.0% |
| 5 to 9 Unit Apartments | 0 | 0.0% |
| 10 or more Apartments | 0 | 0.0% |
| Mobile Home / Other | 0 | 0.0% |
| Total | 138 | 100.0% |
Housing Structures by Occupancy in Avon
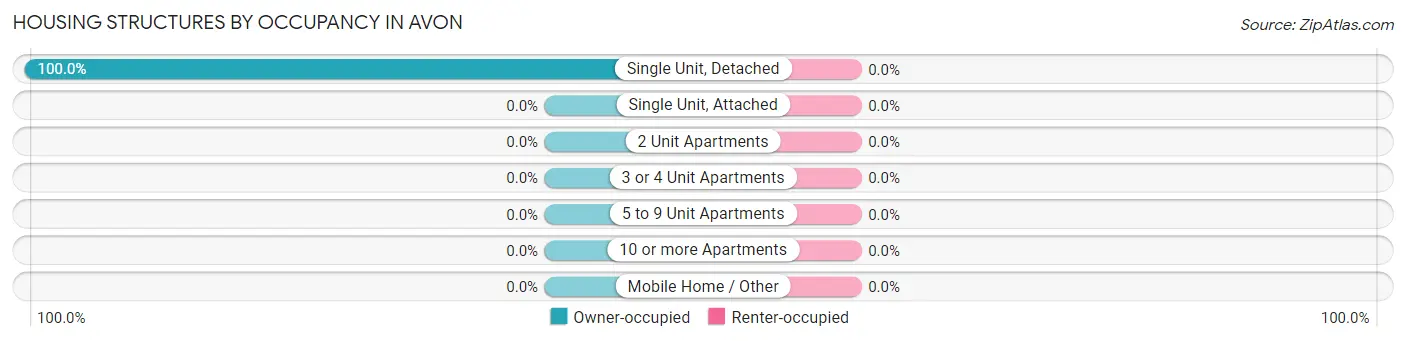
| Structure Type | Owner-occupied | Renter-occupied |
| Single Unit, Detached | 138 (100.0%) | 0 (0.0%) |
| Single Unit, Attached | 0 (0.0%) | 0 (0.0%) |
| 2 Unit Apartments | 0 (0.0%) | 0 (0.0%) |
| 3 or 4 Unit Apartments | 0 (0.0%) | 0 (0.0%) |
| 5 to 9 Unit Apartments | 0 (0.0%) | 0 (0.0%) |
| 10 or more Apartments | 0 (0.0%) | 0 (0.0%) |
| Mobile Home / Other | 0 (0.0%) | 0 (0.0%) |
| Total | 138 (100.0%) | 0 (0.0%) |
Housing Structures by Number of Rooms in Avon
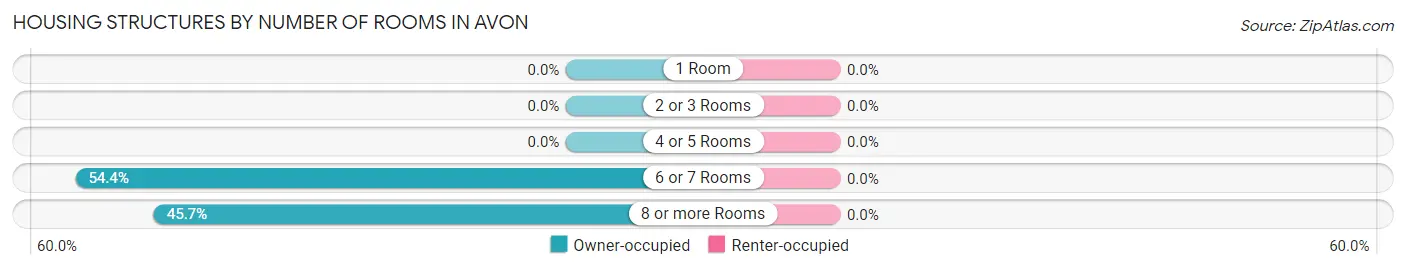
| Number of Rooms | Owner-occupied | Renter-occupied |
| 1 Room | 0 (0.0%) | 0 (0.0%) |
| 2 or 3 Rooms | 0 (0.0%) | 0 (0.0%) |
| 4 or 5 Rooms | 0 (0.0%) | 0 (0.0%) |
| 6 or 7 Rooms | 75 (54.3%) | 0 (0.0%) |
| 8 or more Rooms | 63 (45.7%) | 0 (0.0%) |
| Total | 138 (100.0%) | 0 (0.0%) |
Housing Structure by Heating Type in Avon
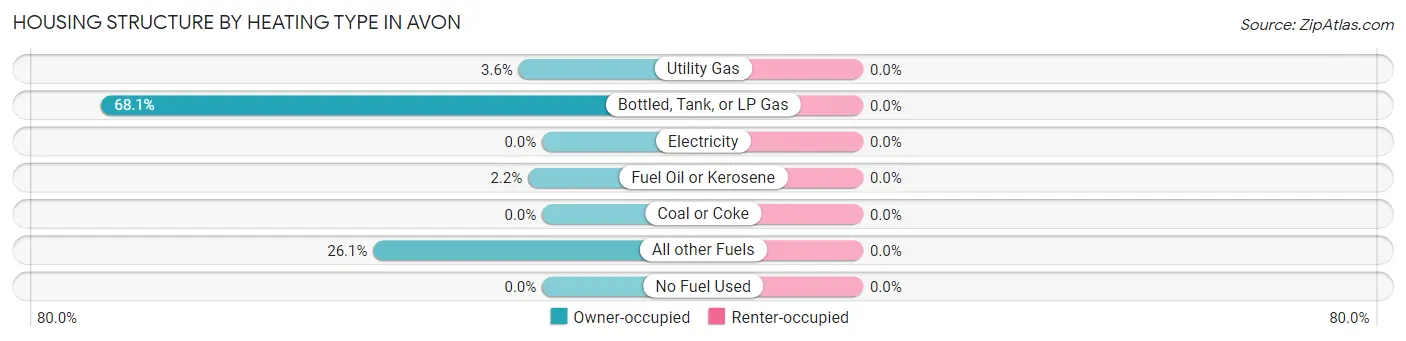
| Heating Type | Owner-occupied | Renter-occupied |
| Utility Gas | 5 (3.6%) | 0 (0.0%) |
| Bottled, Tank, or LP Gas | 94 (68.1%) | 0 (0.0%) |
| Electricity | 0 (0.0%) | 0 (0.0%) |
| Fuel Oil or Kerosene | 3 (2.2%) | 0 (0.0%) |
| Coal or Coke | 0 (0.0%) | 0 (0.0%) |
| All other Fuels | 36 (26.1%) | 0 (0.0%) |
| No Fuel Used | 0 (0.0%) | 0 (0.0%) |
| Total | 138 (100.0%) | 0 (0.0%) |
Household Vehicle Usage in Avon
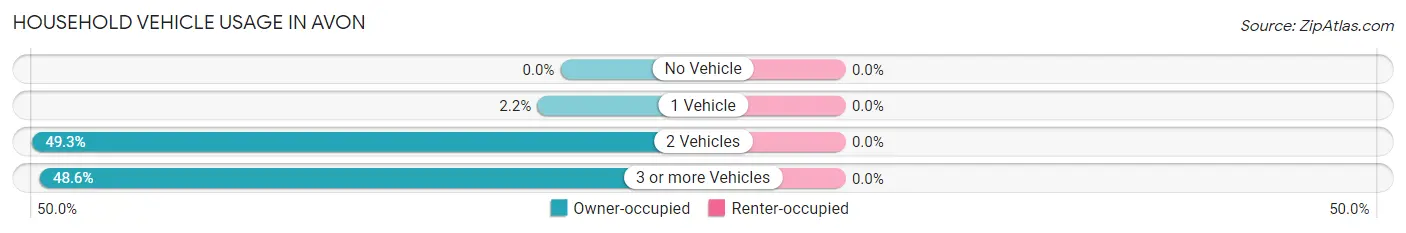
| Vehicles per Household | Owner-occupied | Renter-occupied |
| No Vehicle | 0 (0.0%) | 0 (0.0%) |
| 1 Vehicle | 3 (2.2%) | 0 (0.0%) |
| 2 Vehicles | 68 (49.3%) | 0 (0.0%) |
| 3 or more Vehicles | 67 (48.5%) | 0 (0.0%) |
| Total | 138 (100.0%) | 0 (0.0%) |
Real Estate & Mortgages in Avon
Real Estate and Mortgage Overview in Avon
| Characteristic | Without Mortgage | With Mortgage |
| Housing Units | 35 | 103 |
| Median Property Value | $403,300 | $486,400 |
| Median Household Income | $72,321 | $22 |
| Monthly Housing Costs | $473 | $22 |
| Real Estate Taxes | - | - |
Property Value by Mortgage Status in Avon
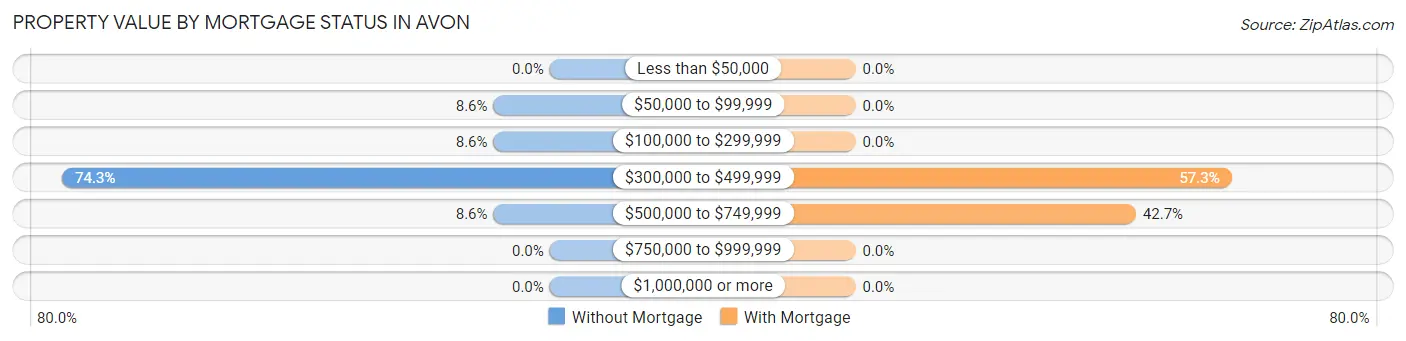
| Property Value | Without Mortgage | With Mortgage |
| Less than $50,000 | 0 (0.0%) | 0 (0.0%) |
| $50,000 to $99,999 | 3 (8.6%) | 0 (0.0%) |
| $100,000 to $299,999 | 3 (8.6%) | 0 (0.0%) |
| $300,000 to $499,999 | 26 (74.3%) | 59 (57.3%) |
| $500,000 to $749,999 | 3 (8.6%) | 44 (42.7%) |
| $750,000 to $999,999 | 0 (0.0%) | 0 (0.0%) |
| $1,000,000 or more | 0 (0.0%) | 0 (0.0%) |
| Total | 35 (100.0%) | 103 (100.0%) |
Household Income by Mortgage Status in Avon
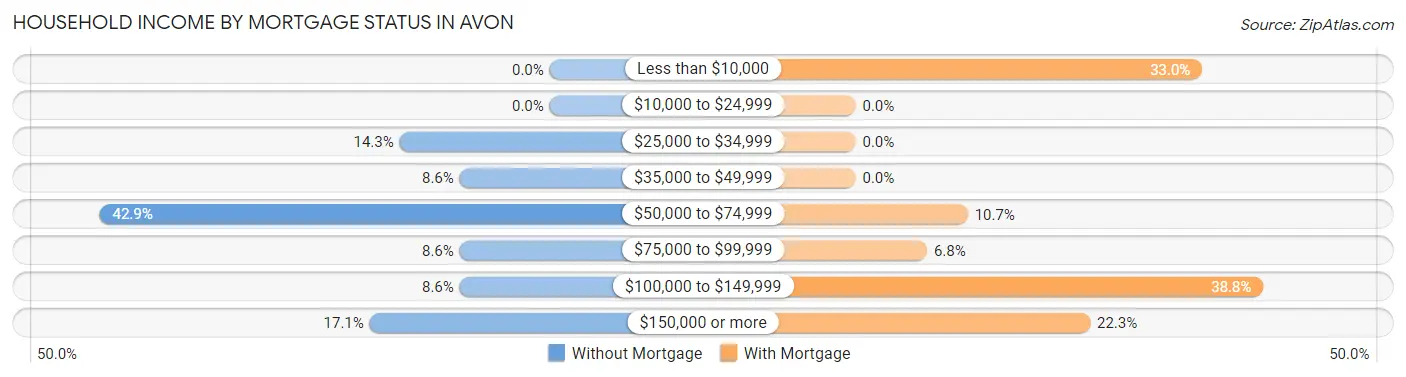
| Household Income | Without Mortgage | With Mortgage |
| Less than $10,000 | 0 (0.0%) | 34 (33.0%) |
| $10,000 to $24,999 | 0 (0.0%) | 0 (0.0%) |
| $25,000 to $34,999 | 5 (14.3%) | 0 (0.0%) |
| $35,000 to $49,999 | 3 (8.6%) | 0 (0.0%) |
| $50,000 to $74,999 | 15 (42.9%) | 11 (10.7%) |
| $75,000 to $99,999 | 3 (8.6%) | 7 (6.8%) |
| $100,000 to $149,999 | 3 (8.6%) | 40 (38.8%) |
| $150,000 or more | 6 (17.1%) | 23 (22.3%) |
| Total | 35 (100.0%) | 103 (100.0%) |
Property Value to Household Income Ratio in Avon
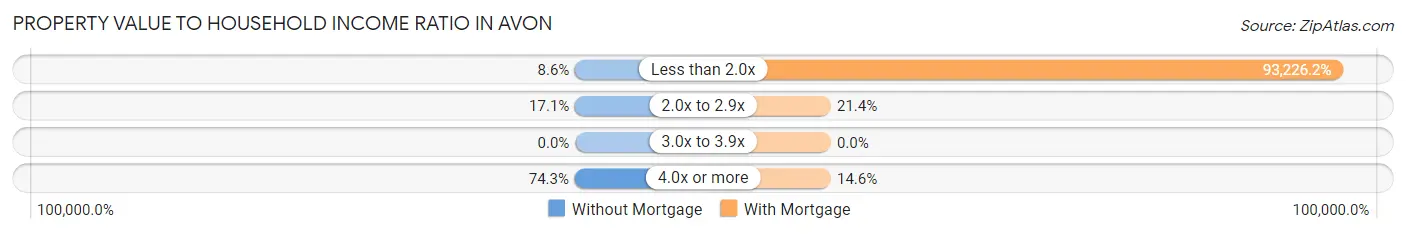
| Value-to-Income Ratio | Without Mortgage | With Mortgage |
| Less than 2.0x | 3 (8.6%) | 96,023 (93,226.2%) |
| 2.0x to 2.9x | 6 (17.1%) | 22 (21.4%) |
| 3.0x to 3.9x | 0 (0.0%) | 0 (0.0%) |
| 4.0x or more | 26 (74.3%) | 15 (14.6%) |
| Total | 35 (100.0%) | 103 (100.0%) |
Real Estate Taxes by Mortgage Status in Avon
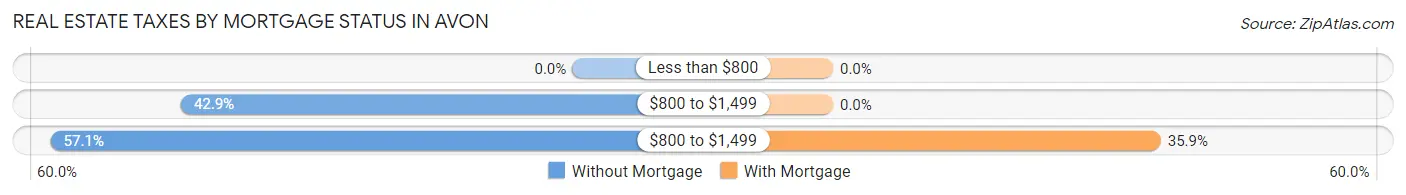
| Property Taxes | Without Mortgage | With Mortgage |
| Less than $800 | 0 (0.0%) | 0 (0.0%) |
| $800 to $1,499 | 15 (42.9%) | 0 (0.0%) |
| $800 to $1,499 | 20 (57.1%) | 37 (35.9%) |
| Total | 35 (100.0%) | 103 (100.0%) |
Health & Disability in Avon
Health Insurance Coverage by Age in Avon
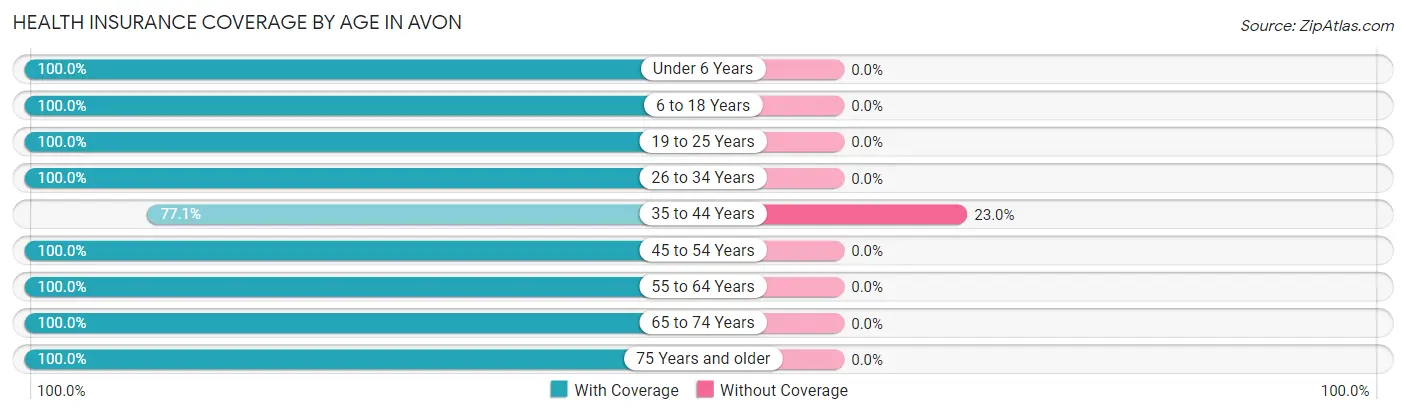
| Age Bracket | With Coverage | Without Coverage |
| Under 6 Years | 40 (100.0%) | 0 (0.0%) |
| 6 to 18 Years | 123 (100.0%) | 0 (0.0%) |
| 19 to 25 Years | 41 (100.0%) | 0 (0.0%) |
| 26 to 34 Years | 70 (100.0%) | 0 (0.0%) |
| 35 to 44 Years | 47 (77.0%) | 14 (23.0%) |
| 45 to 54 Years | 44 (100.0%) | 0 (0.0%) |
| 55 to 64 Years | 65 (100.0%) | 0 (0.0%) |
| 65 to 74 Years | 59 (100.0%) | 0 (0.0%) |
| 75 Years and older | 36 (100.0%) | 0 (0.0%) |
| Total | 525 (97.4%) | 14 (2.6%) |
Health Insurance Coverage by Citizenship Status in Avon
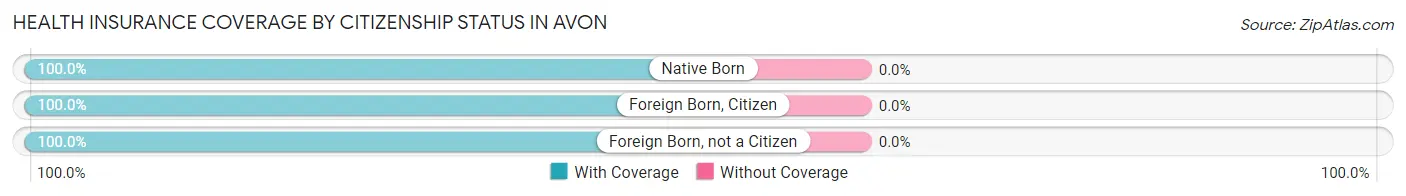
| Citizenship Status | With Coverage | Without Coverage |
| Native Born | 40 (100.0%) | 0 (0.0%) |
| Foreign Born, Citizen | 123 (100.0%) | 0 (0.0%) |
| Foreign Born, not a Citizen | 41 (100.0%) | 0 (0.0%) |
Health Insurance Coverage by Household Income in Avon
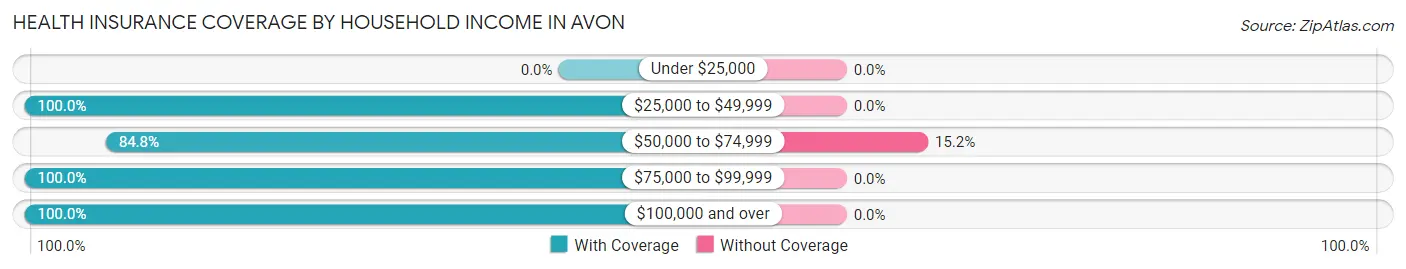
| Household Income | With Coverage | Without Coverage |
| Under $25,000 | 0 (0.0%) | 0 (0.0%) |
| $25,000 to $49,999 | 31 (100.0%) | 0 (0.0%) |
| $50,000 to $74,999 | 78 (84.8%) | 14 (15.2%) |
| $75,000 to $99,999 | 206 (100.0%) | 0 (0.0%) |
| $100,000 and over | 210 (100.0%) | 0 (0.0%) |
Public vs Private Health Insurance Coverage by Age in Avon
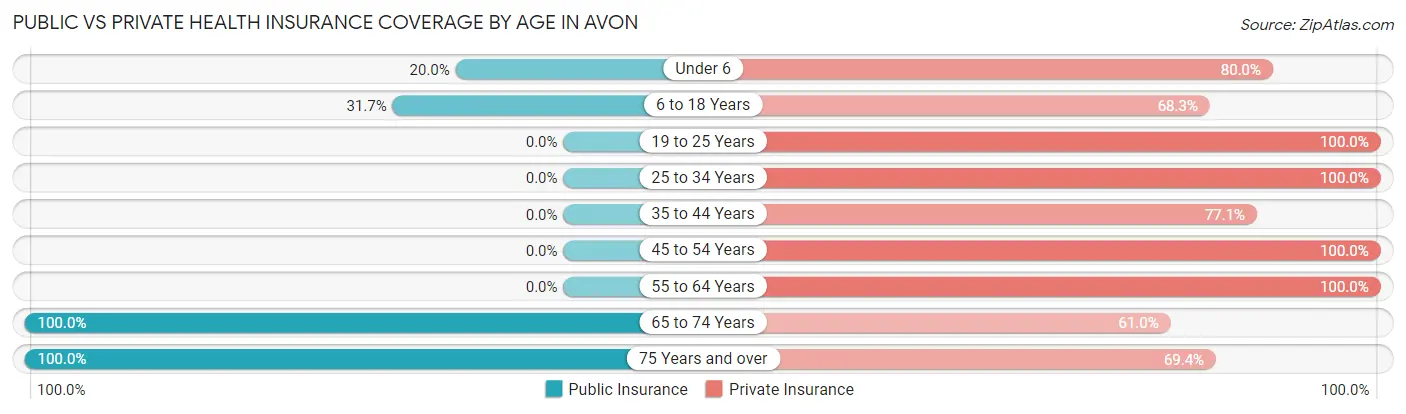
| Age Bracket | Public Insurance | Private Insurance |
| Under 6 | 8 (20.0%) | 32 (80.0%) |
| 6 to 18 Years | 39 (31.7%) | 84 (68.3%) |
| 19 to 25 Years | 0 (0.0%) | 41 (100.0%) |
| 25 to 34 Years | 0 (0.0%) | 70 (100.0%) |
| 35 to 44 Years | 0 (0.0%) | 47 (77.0%) |
| 45 to 54 Years | 0 (0.0%) | 44 (100.0%) |
| 55 to 64 Years | 0 (0.0%) | 65 (100.0%) |
| 65 to 74 Years | 59 (100.0%) | 36 (61.0%) |
| 75 Years and over | 36 (100.0%) | 25 (69.4%) |
| Total | 142 (26.4%) | 444 (82.4%) |
Disability Status by Sex by Age in Avon
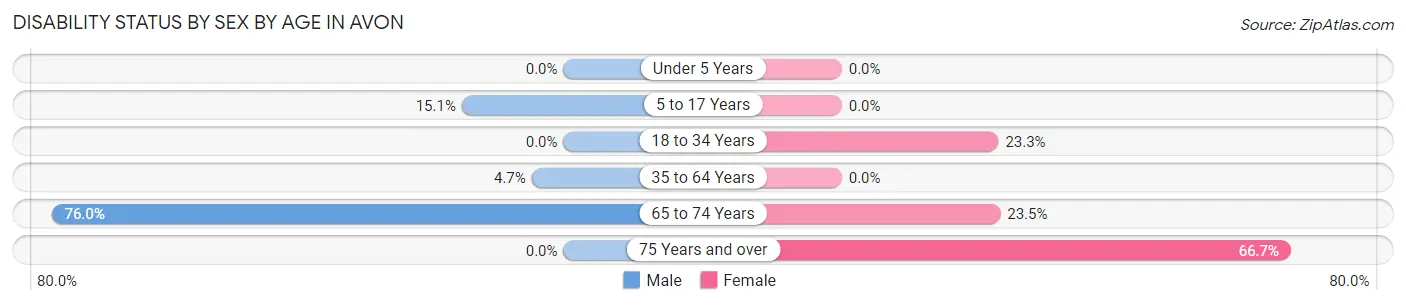
| Age Bracket | Male | Female |
| Under 5 Years | 0 (0.0%) | 0 (0.0%) |
| 5 to 17 Years | 8 (15.1%) | 0 (0.0%) |
| 18 to 34 Years | 0 (0.0%) | 20 (23.3%) |
| 35 to 64 Years | 4 (4.7%) | 0 (0.0%) |
| 65 to 74 Years | 19 (76.0%) | 8 (23.5%) |
| 75 Years and over | 0 (0.0%) | 6 (66.7%) |
Disability Class by Sex by Age in Avon
Disability Class: Hearing Difficulty
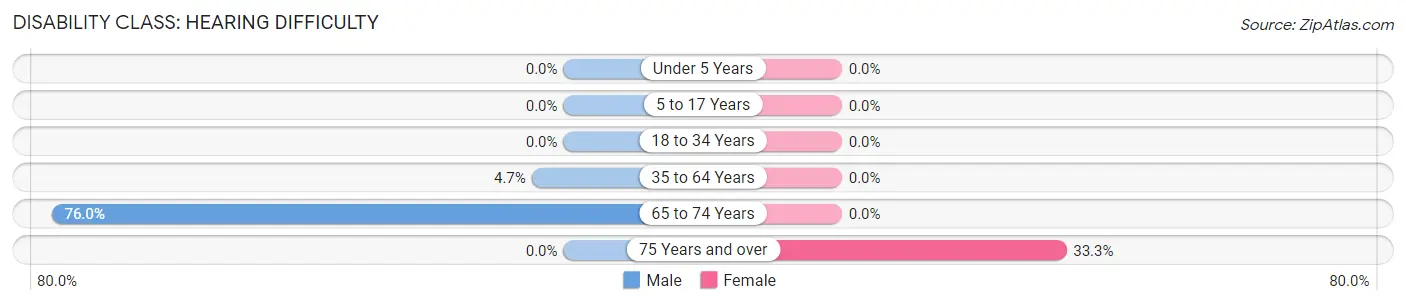
| Age Bracket | Male | Female |
| Under 5 Years | 0 (0.0%) | 0 (0.0%) |
| 5 to 17 Years | 0 (0.0%) | 0 (0.0%) |
| 18 to 34 Years | 0 (0.0%) | 0 (0.0%) |
| 35 to 64 Years | 4 (4.7%) | 0 (0.0%) |
| 65 to 74 Years | 19 (76.0%) | 0 (0.0%) |
| 75 Years and over | 0 (0.0%) | 3 (33.3%) |
Disability Class: Vision Difficulty
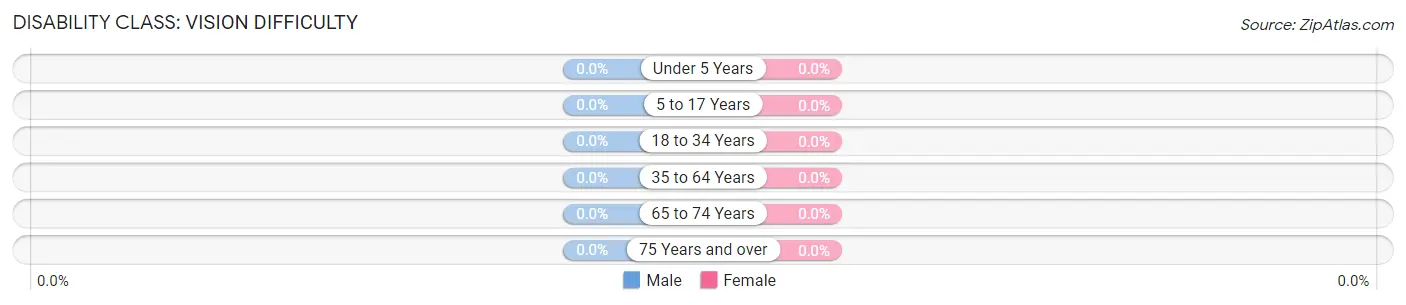
| Age Bracket | Male | Female |
| Under 5 Years | 0 (0.0%) | 0 (0.0%) |
| 5 to 17 Years | 0 (0.0%) | 0 (0.0%) |
| 18 to 34 Years | 0 (0.0%) | 0 (0.0%) |
| 35 to 64 Years | 0 (0.0%) | 0 (0.0%) |
| 65 to 74 Years | 0 (0.0%) | 0 (0.0%) |
| 75 Years and over | 0 (0.0%) | 0 (0.0%) |
Disability Class: Cognitive Difficulty
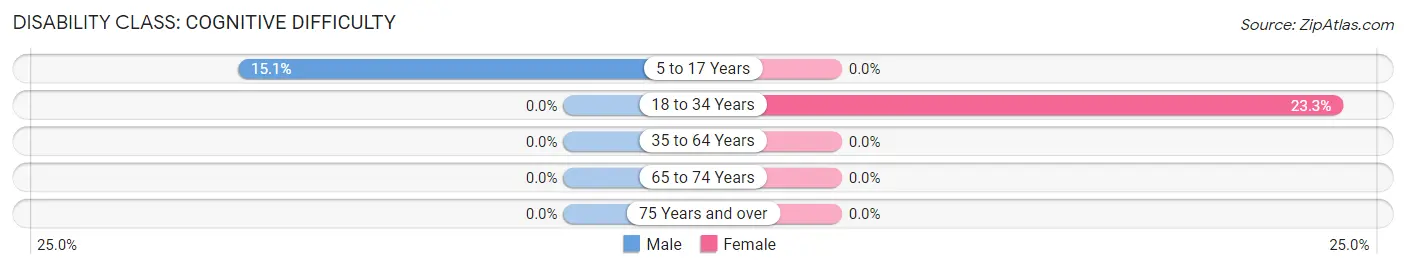
| Age Bracket | Male | Female |
| 5 to 17 Years | 8 (15.1%) | 0 (0.0%) |
| 18 to 34 Years | 0 (0.0%) | 20 (23.3%) |
| 35 to 64 Years | 0 (0.0%) | 0 (0.0%) |
| 65 to 74 Years | 0 (0.0%) | 0 (0.0%) |
| 75 Years and over | 0 (0.0%) | 0 (0.0%) |
Disability Class: Ambulatory Difficulty
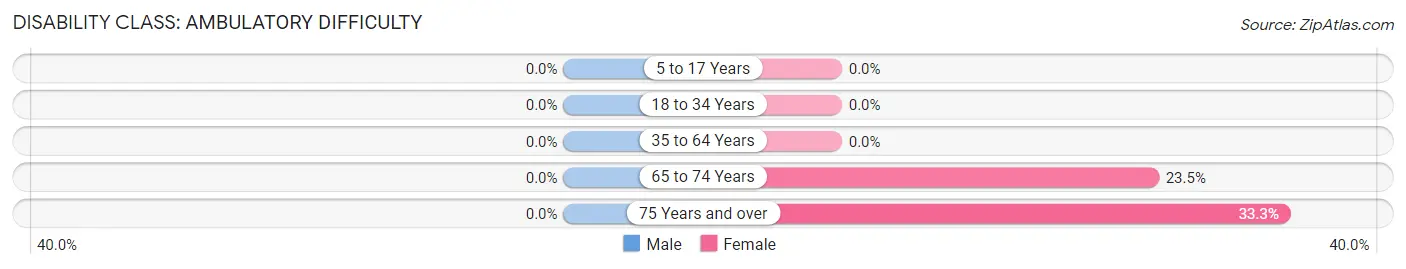
| Age Bracket | Male | Female |
| 5 to 17 Years | 0 (0.0%) | 0 (0.0%) |
| 18 to 34 Years | 0 (0.0%) | 0 (0.0%) |
| 35 to 64 Years | 0 (0.0%) | 0 (0.0%) |
| 65 to 74 Years | 0 (0.0%) | 8 (23.5%) |
| 75 Years and over | 0 (0.0%) | 3 (33.3%) |
Disability Class: Self-Care Difficulty
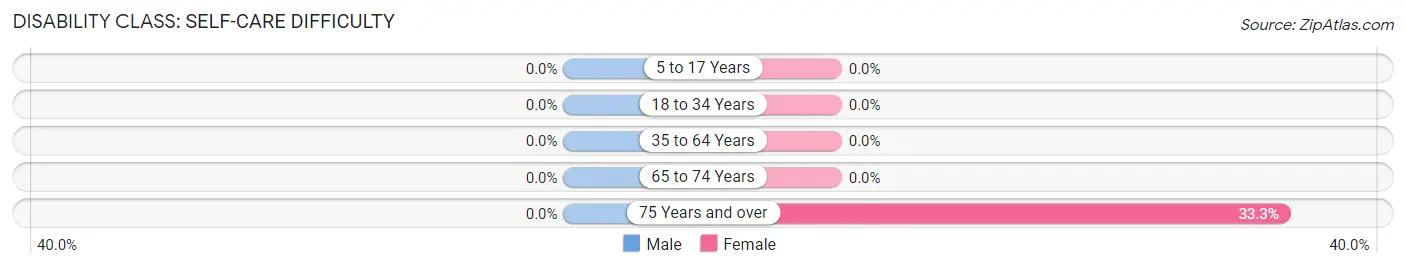
| Age Bracket | Male | Female |
| 5 to 17 Years | 0 (0.0%) | 0 (0.0%) |
| 18 to 34 Years | 0 (0.0%) | 0 (0.0%) |
| 35 to 64 Years | 0 (0.0%) | 0 (0.0%) |
| 65 to 74 Years | 0 (0.0%) | 0 (0.0%) |
| 75 Years and over | 0 (0.0%) | 3 (33.3%) |
Technology Access in Avon
Computing Device Access in Avon
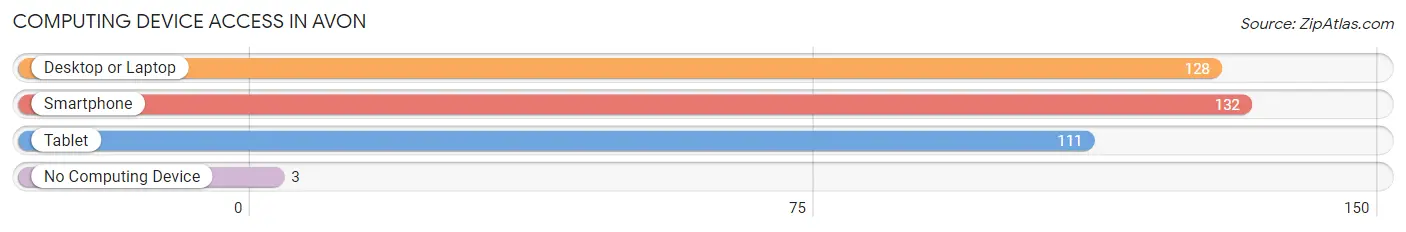
| Device Type | # Households | % Households |
| Desktop or Laptop | 128 | 92.7% |
| Smartphone | 132 | 95.7% |
| Tablet | 111 | 80.4% |
| No Computing Device | 3 | 2.2% |
| Total | 138 | 100.0% |
Internet Access in Avon
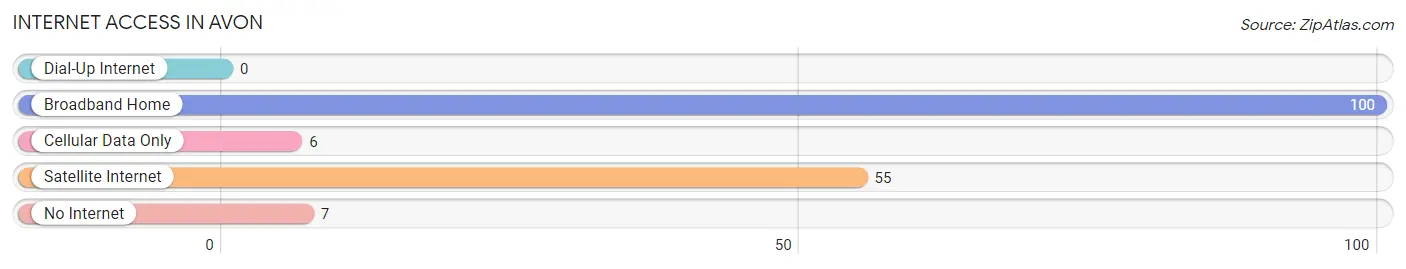
| Internet Type | # Households | % Households |
| Dial-Up Internet | 0 | 0.0% |
| Broadband Home | 100 | 72.5% |
| Cellular Data Only | 6 | 4.3% |
| Satellite Internet | 55 | 39.9% |
| No Internet | 7 | 5.1% |
| Total | 138 | 100.0% |
Avon Summary
Avon, Utah is a small town located in the Wasatch Mountains of Utah. It is situated in the northern part of the state, about 25 miles east of Salt Lake City. The town was founded in 1877 and has a population of approximately 1,500 people.
Avon is located in the Wasatch Mountains, which are part of the Rocky Mountains. The town is situated at an elevation of 5,400 feet and is surrounded by mountains, forests, and rivers. The climate in Avon is semi-arid, with hot summers and cold winters. The average annual temperature is around 50 degrees Fahrenheit.
The economy of Avon is largely based on tourism. The town is home to several ski resorts, including Park City Mountain Resort, Deer Valley Resort, and Snowbird Ski Resort. These resorts attract visitors from all over the world, and provide jobs for many of the town's residents. In addition to skiing, Avon is also home to several other outdoor activities, such as hiking, camping, and fishing.
Avon is also home to several businesses, including restaurants, retail stores, and other services. The town is also home to a number of small manufacturing companies, which produce a variety of products, including furniture, clothing, and electronics.
The demographics of Avon are largely white, with a small percentage of African Americans, Hispanics, and Native Americans. The median household income in Avon is around $50,000, and the median home value is around $200,000. The town has a low unemployment rate, and the majority of the population is employed in the tourism and service industries.
Avon is a small town with a rich history and a vibrant economy. It is home to a variety of outdoor activities, businesses, and services, and is a popular destination for tourists from all over the world. The town is also home to a diverse population, with a variety of ethnic backgrounds and incomes. Avon is a great place to live, work, and play, and is a great example of a small town with a big heart.
Common Questions
What is Per Capita Income in Avon?
Per Capita income in Avon is $35,148.
What is the Median Family Income in Avon?
Median Family Income in Avon is $82,383.
What is the Median Household income in Avon?
Median Household Income in Avon is $82,188.
What is Income or Wage Gap in Avon?
Income or Wage Gap in Avon is 62.2%.
Women in Avon earn 37.8 cents for every dollar earned by a man.
What is Inequality or Gini Index in Avon?
Inequality or Gini Index in Avon is 0.38.
What is the Total Population of Avon?
Total Population of Avon is 539.
What is the Total Male Population of Avon?
Total Male Population of Avon is 255.
What is the Total Female Population of Avon?
Total Female Population of Avon is 284.
What is the Ratio of Males per 100 Females in Avon?
There are 89.79 Males per 100 Females in Avon.
What is the Ratio of Females per 100 Males in Avon?
There are 111.37 Females per 100 Males in Avon.
What is the Median Population Age in Avon?
Median Population Age in Avon is 32.4 Years.
What is the Average Family Size in Avon
Average Family Size in Avon is 4.0 People.
What is the Average Household Size in Avon
Average Household Size in Avon is 3.9 People.
How Large is the Labor Force in Avon?
There are 226 People in the Labor Forcein in Avon.
What is the Percentage of People in the Labor Force in Avon?
52.2% of People are in the Labor Force in Avon.