Zip Codes with the Highest Percentage of Families with Income Above $100,000 in Utah
RELATED REPORTS & OPTIONS
Family Income | $100k+
Utah
Compare Zip Codes
Map of Zip Codes with the Highest Percentage of Families with Income Above $100,000 in Utah
40.0%
100.0%
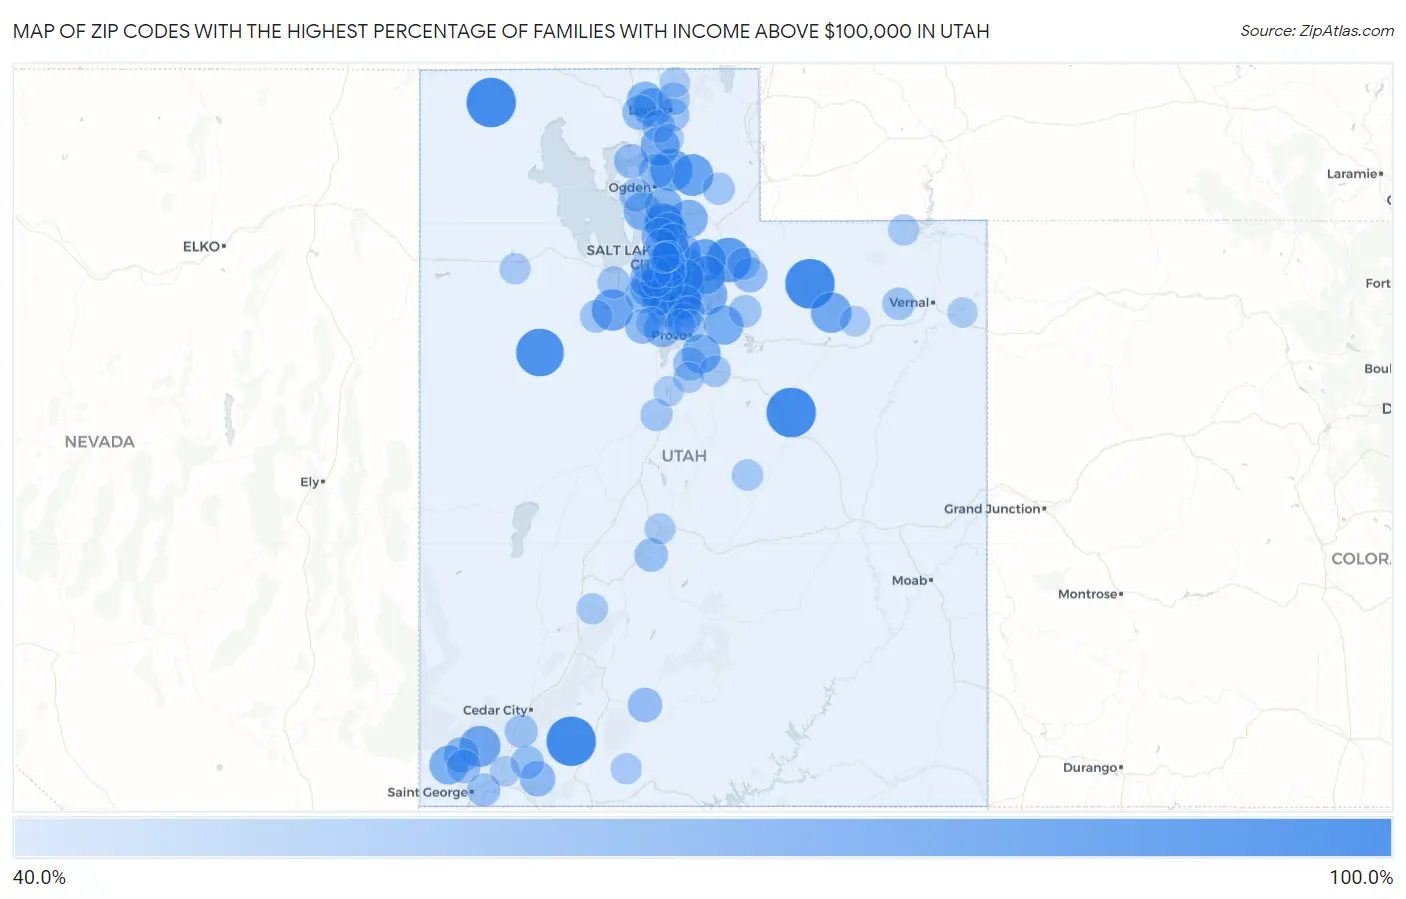
Zip Codes with the Highest Percentage of Families with Income Above $100,000 in Utah
| Zip Code | Families with Income > $100k | vs State | vs National | |
| 1. | 84031 | 100.0% | 50.0% (+50.0)#1 | 46.1% (+53.9)#63 |
| 2. | 84329 | 100.0% | 50.0% (+50.0)#2 | 46.1% (+53.9)#89 |
| 3. | 84529 | 100.0% | 50.0% (+50.0)#3 | 46.1% (+53.9)#145 |
| 4. | 84762 | 100.0% | 50.0% (+50.0)#4 | 46.1% (+53.9)#150 |
| 5. | 84022 | 95.1% | 50.0% (+45.1)#5 | 46.1% (+49.0)#289 |
| 6. | 84061 | 86.5% | 50.0% (+36.5)#6 | 46.1% (+40.4)#503 |
| 7. | 84310 | 79.8% | 50.0% (+29.8)#7 | 46.1% (+33.7)#1,050 |
| 8. | 84098 | 78.8% | 50.0% (+28.8)#8 | 46.1% (+32.7)#1,162 |
| 9. | 84317 | 78.6% | 50.0% (+28.6)#9 | 46.1% (+32.5)#1,194 |
| 10. | 84071 | 77.6% | 50.0% (+27.6)#10 | 46.1% (+31.5)#1,328 |
| 11. | 84781 | 76.7% | 50.0% (+26.7)#11 | 46.1% (+30.6)#1,463 |
| 12. | 84092 | 76.1% | 50.0% (+26.1)#12 | 46.1% (+30.0)#1,545 |
| 13. | 84051 | 75.4% | 50.0% (+25.4)#13 | 46.1% (+29.3)#1,651 |
| 14. | 84095 | 74.0% | 50.0% (+24.0)#14 | 46.1% (+27.9)#1,876 |
| 15. | 84109 | 73.2% | 50.0% (+23.2)#15 | 46.1% (+27.1)#2,005 |
| 16. | 84049 | 73.0% | 50.0% (+23.0)#16 | 46.1% (+26.9)#2,046 |
| 17. | 84004 | 72.8% | 50.0% (+22.8)#17 | 46.1% (+26.7)#2,078 |
| 18. | 84324 | 72.3% | 50.0% (+22.3)#18 | 46.1% (+26.2)#2,180 |
| 19. | 84082 | 72.0% | 50.0% (+22.0)#19 | 46.1% (+25.9)#2,227 |
| 20. | 84664 | 71.2% | 50.0% (+21.2)#20 | 46.1% (+25.1)#2,366 |
| 21. | 84093 | 71.0% | 50.0% (+21.0)#21 | 46.1% (+24.9)#2,405 |
| 22. | 84733 | 70.7% | 50.0% (+20.7)#22 | 46.1% (+24.6)#2,473 |
| 23. | 84325 | 70.2% | 50.0% (+20.2)#23 | 46.1% (+24.1)#2,564 |
| 24. | 84025 | 69.6% | 50.0% (+19.6)#24 | 46.1% (+23.5)#2,688 |
| 25. | 84037 | 69.5% | 50.0% (+19.5)#25 | 46.1% (+23.4)#2,710 |
| 26. | 84020 | 69.2% | 50.0% (+19.2)#26 | 46.1% (+23.1)#2,767 |
| 27. | 84060 | 69.2% | 50.0% (+19.2)#27 | 46.1% (+23.1)#2,781 |
| 28. | 84050 | 68.4% | 50.0% (+18.4)#28 | 46.1% (+22.3)#2,943 |
| 29. | 84075 | 67.9% | 50.0% (+17.9)#29 | 46.1% (+21.8)#3,031 |
| 30. | 84009 | 66.9% | 50.0% (+16.9)#30 | 46.1% (+20.8)#3,260 |
| 31. | 84040 | 66.7% | 50.0% (+16.7)#31 | 46.1% (+20.6)#3,298 |
| 32. | 84124 | 66.6% | 50.0% (+16.6)#32 | 46.1% (+20.5)#3,340 |
| 33. | 84108 | 66.3% | 50.0% (+16.3)#33 | 46.1% (+20.2)#3,414 |
| 34. | 84014 | 66.3% | 50.0% (+16.3)#34 | 46.1% (+20.2)#3,416 |
| 35. | 84103 | 66.2% | 50.0% (+16.2)#35 | 46.1% (+20.1)#3,440 |
| 36. | 84087 | 65.6% | 50.0% (+15.6)#36 | 46.1% (+19.5)#3,580 |
| 37. | 84045 | 65.4% | 50.0% (+15.4)#37 | 46.1% (+19.3)#3,628 |
| 38. | 84121 | 65.2% | 50.0% (+15.2)#38 | 46.1% (+19.1)#3,692 |
| 39. | 84043 | 64.8% | 50.0% (+14.8)#39 | 46.1% (+18.7)#3,785 |
| 40. | 84306 | 64.6% | 50.0% (+14.6)#40 | 46.1% (+18.5)#3,860 |
| 41. | 84065 | 64.2% | 50.0% (+14.2)#41 | 46.1% (+18.1)#3,939 |
| 42. | 84096 | 63.1% | 50.0% (+13.1)#42 | 46.1% (+17.0)#4,246 |
| 43. | 84081 | 62.5% | 50.0% (+12.5)#43 | 46.1% (+16.4)#4,405 |
| 44. | 84767 | 61.6% | 50.0% (+11.6)#44 | 46.1% (+15.5)#4,686 |
| 45. | 84782 | 61.6% | 50.0% (+11.6)#45 | 46.1% (+15.5)#4,687 |
| 46. | 84105 | 61.1% | 50.0% (+11.1)#46 | 46.1% (+15.0)#4,815 |
| 47. | 84309 | 60.5% | 50.0% (+10.5)#47 | 46.1% (+14.4)#5,011 |
| 48. | 84013 | 60.1% | 50.0% (+10.1)#48 | 46.1% (+14.0)#5,110 |
| 49. | 84414 | 59.7% | 50.0% (+9.70)#49 | 46.1% (+13.6)#5,219 |
| 50. | 84036 | 59.7% | 50.0% (+9.70)#50 | 46.1% (+13.6)#5,230 |
| 51. | 84003 | 59.1% | 50.0% (+9.10)#51 | 46.1% (+13.0)#5,407 |
| 52. | 84340 | 59.1% | 50.0% (+9.10)#52 | 46.1% (+13.0)#5,424 |
| 53. | 84764 | 58.8% | 50.0% (+8.80)#53 | 46.1% (+12.7)#5,531 |
| 54. | 84106 | 58.1% | 50.0% (+8.10)#54 | 46.1% (+12.0)#5,726 |
| 55. | 84783 | 57.2% | 50.0% (+7.20)#55 | 46.1% (+11.1)#6,048 |
| 56. | 84653 | 56.6% | 50.0% (+6.60)#56 | 46.1% (+10.5)#6,228 |
| 57. | 84730 | 56.5% | 50.0% (+6.50)#57 | 46.1% (+10.4)#6,269 |
| 58. | 84042 | 56.4% | 50.0% (+6.40)#58 | 46.1% (+10.3)#6,282 |
| 59. | 84315 | 56.3% | 50.0% (+6.30)#59 | 46.1% (+10.2)#6,322 |
| 60. | 84780 | 55.7% | 50.0% (+5.70)#60 | 46.1% (+9.60)#6,543 |
| 61. | 84332 | 55.6% | 50.0% (+5.60)#61 | 46.1% (+9.50)#6,598 |
| 62. | 84779 | 55.6% | 50.0% (+5.60)#62 | 46.1% (+9.50)#6,611 |
| 63. | 84742 | 55.4% | 50.0% (+5.40)#63 | 46.1% (+9.30)#6,680 |
| 64. | 84010 | 55.0% | 50.0% (+5.00)#64 | 46.1% (+8.90)#6,790 |
| 65. | 84339 | 54.9% | 50.0% (+4.90)#65 | 46.1% (+8.80)#6,848 |
| 66. | 84069 | 54.1% | 50.0% (+4.10)#66 | 46.1% (+8.00)#7,146 |
| 67. | 84032 | 53.9% | 50.0% (+3.90)#67 | 46.1% (+7.80)#7,187 |
| 68. | 84062 | 53.8% | 50.0% (+3.80)#68 | 46.1% (+7.70)#7,228 |
| 69. | 84074 | 53.7% | 50.0% (+3.70)#69 | 46.1% (+7.60)#7,263 |
| 70. | 84076 | 53.7% | 50.0% (+3.70)#70 | 46.1% (+7.60)#7,292 |
| 71. | 84318 | 53.5% | 50.0% (+3.50)#71 | 46.1% (+7.40)#7,368 |
| 72. | 84055 | 53.4% | 50.0% (+3.40)#72 | 46.1% (+7.30)#7,404 |
| 73. | 84128 | 53.1% | 50.0% (+3.10)#73 | 46.1% (+7.00)#7,487 |
| 74. | 84097 | 53.1% | 50.0% (+3.10)#74 | 46.1% (+7.00)#7,498 |
| 75. | 84018 | 53.0% | 50.0% (+3.00)#75 | 46.1% (+6.90)#7,572 |
| 76. | 84054 | 52.9% | 50.0% (+2.90)#76 | 46.1% (+6.80)#7,582 |
| 77. | 84094 | 52.8% | 50.0% (+2.80)#77 | 46.1% (+6.70)#7,616 |
| 78. | 84648 | 52.8% | 50.0% (+2.80)#78 | 46.1% (+6.70)#7,626 |
| 79. | 84660 | 51.4% | 50.0% (+1.40)#79 | 46.1% (+5.30)#8,227 |
| 80. | 84088 | 51.1% | 50.0% (+1.10)#80 | 46.1% (+5.00)#8,358 |
| 81. | 84101 | 50.9% | 50.0% (+0.900)#81 | 46.1% (+4.80)#8,458 |
| 82. | 84117 | 50.6% | 50.0% (+0.600)#82 | 46.1% (+4.50)#8,565 |
| 83. | 84537 | 50.6% | 50.0% (+0.600)#83 | 46.1% (+4.50)#8,590 |
| 84. | 84005 | 50.2% | 50.0% (+0.200)#84 | 46.1% (+4.10)#8,715 |
| 85. | 84059 | 50.2% | 50.0% (+0.200)#85 | 46.1% (+4.10)#8,733 |
| 86. | 84046 | 50.0% | 50.0% (=0.000)#86 | 46.1% (+3.90)#8,838 |
| 87. | 84741 | 49.8% | 50.0% (-0.200)#87 | 46.1% (+3.70)#8,949 |
| 88. | 84713 | 49.8% | 50.0% (-0.200)#88 | 46.1% (+3.70)#8,953 |
| 89. | 84029 | 49.7% | 50.0% (-0.300)#89 | 46.1% (+3.60)#8,982 |
| 90. | 84129 | 49.6% | 50.0% (-0.400)#90 | 46.1% (+3.50)#9,014 |
| 91. | 84651 | 49.6% | 50.0% (-0.400)#91 | 46.1% (+3.50)#9,017 |
| 92. | 84102 | 49.3% | 50.0% (-0.700)#92 | 46.1% (+3.20)#9,152 |
| 93. | 84620 | 49.3% | 50.0% (-0.700)#93 | 46.1% (+3.20)#9,177 |
| 94. | 84007 | 48.6% | 50.0% (-1.40)#94 | 46.1% (+2.50)#9,490 |
| 95. | 84774 | 48.2% | 50.0% (-1.80)#95 | 46.1% (+2.10)#9,664 |
| 96. | 84111 | 47.8% | 50.0% (-2.20)#96 | 46.1% (+1.70)#9,860 |
| 97. | 84333 | 47.8% | 50.0% (-2.20)#97 | 46.1% (+1.70)#9,873 |
| 98. | 84645 | 47.8% | 50.0% (-2.20)#98 | 46.1% (+1.70)#9,875 |
| 99. | 84328 | 47.8% | 50.0% (-2.20)#99 | 46.1% (+1.70)#9,878 |
| 100. | 84035 | 47.6% | 50.0% (-2.40)#100 | 46.1% (+1.50)#10,003 |
Common Questions
What are the Top 10 Zip Codes with the Highest Percentage of Families with Income Above $100,000 in Utah?
Top 10 Zip Codes with the Highest Percentage of Families with Income Above $100,000 in Utah are:
What zip code has the Highest Percentage of Families with Income Above $100,000 in Utah?
84031 has the Highest Percentage of Families with Income Above $100,000 in Utah with 100.0%.
What is the Percentage of Families with Income Above $100,000 in the State of Utah?
Percentage of Families with Income Above $100,000 in Utah is 50.0%.
What is the Percentage of Families with Income Above $100,000 in the United States?
Percentage of Families with Income Above $100,000 in the United States is 46.1%.