Zip Codes with the Highest Percentage of Population Employed in Legal Services & Support in Utah
RELATED REPORTS & OPTIONS
Legal Services & Support
Utah
Compare Zip Codes
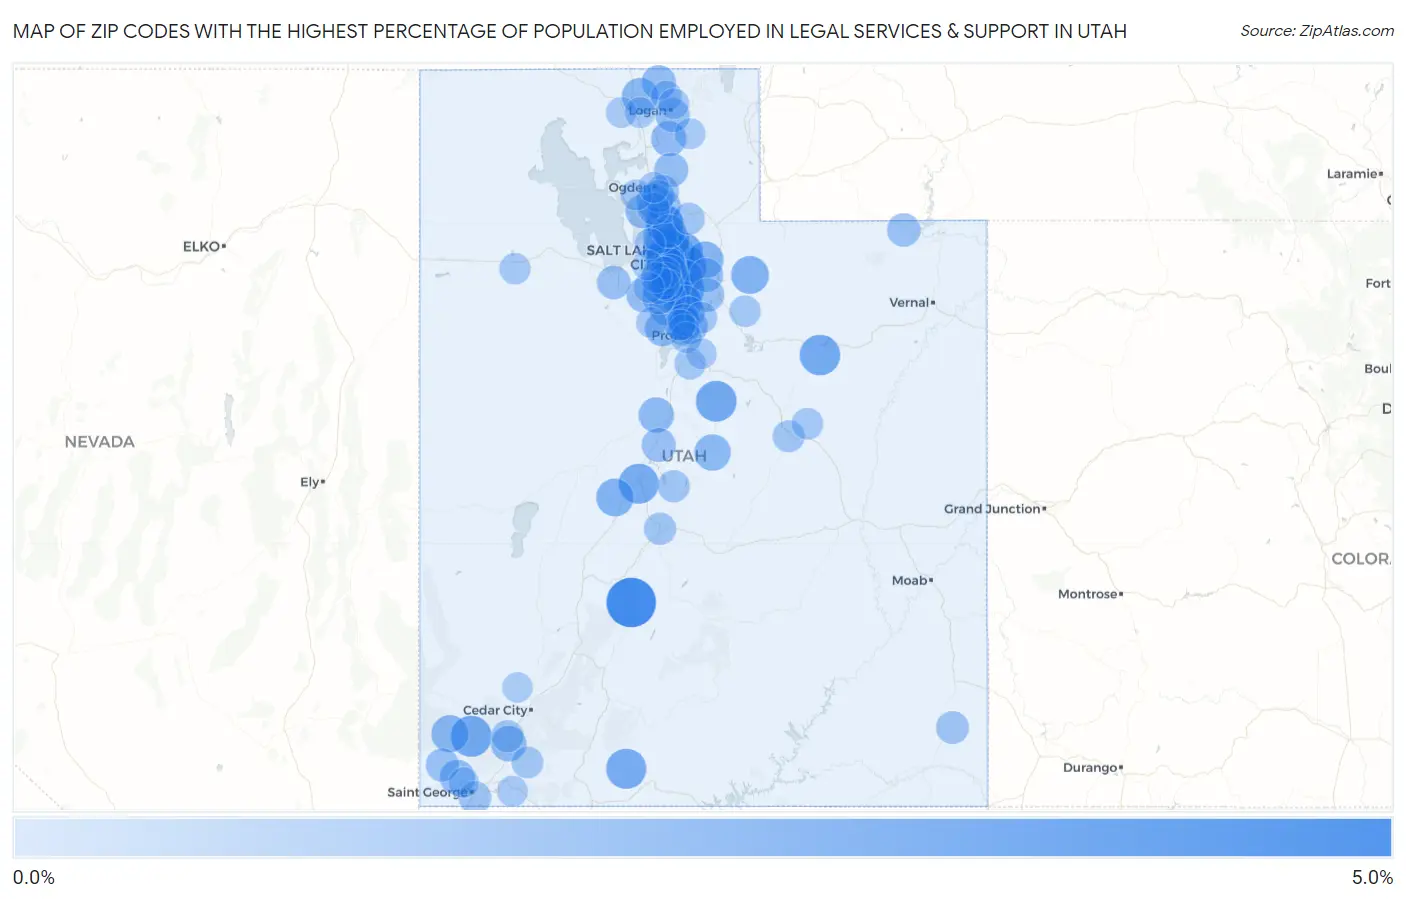
Map of Zip Codes with the Highest Percentage of Population Employed in Legal Services & Support in Utah
0.0%
5.0%
Zip Codes with the Highest Percentage of Population Employed in Legal Services & Support in Utah
| Zip Code | % Employed | vs State | vs National | |
| 1. | 84750 | 4.6% | 0.86%(+3.71)#1 | 1.2%(+3.38)#872 |
| 2. | 84113 | 4.1% | 0.86%(+3.25)#2 | 1.2%(+2.93)#1,071 |
| 3. | 84109 | 3.0% | 0.86%(+2.11)#3 | 1.2%(+1.78)#1,889 |
| 4. | 84124 | 2.7% | 0.86%(+1.83)#4 | 1.2%(+1.51)#2,222 |
| 5. | 84722 | 2.7% | 0.86%(+1.83)#5 | 1.2%(+1.50)#2,227 |
| 6. | 84629 | 2.6% | 0.86%(+1.79)#6 | 1.2%(+1.46)#2,279 |
| 7. | 84092 | 2.6% | 0.86%(+1.77)#7 | 1.2%(+1.44)#2,307 |
| 8. | 84108 | 2.6% | 0.86%(+1.75)#8 | 1.2%(+1.42)#2,344 |
| 9. | 84021 | 2.6% | 0.86%(+1.74)#9 | 1.2%(+1.42)#2,357 |
| 10. | 84741 | 2.5% | 0.86%(+1.66)#10 | 1.2%(+1.33)#2,491 |
| 11. | 84656 | 2.5% | 0.86%(+1.63)#11 | 1.2%(+1.30)#2,532 |
| 12. | 84102 | 2.5% | 0.86%(+1.61)#12 | 1.2%(+1.29)#2,569 |
| 13. | 84111 | 2.2% | 0.86%(+1.35)#13 | 1.2%(+1.02)#3,038 |
| 14. | 84093 | 2.1% | 0.86%(+1.20)#14 | 1.2%(+0.868)#3,332 |
| 15. | 84036 | 2.0% | 0.86%(+1.17)#15 | 1.2%(+0.837)#3,415 |
| 16. | 84103 | 2.0% | 0.86%(+1.15)#16 | 1.2%(+0.824)#3,461 |
| 17. | 84636 | 2.0% | 0.86%(+1.13)#17 | 1.2%(+0.800)#3,530 |
| 18. | 84037 | 2.0% | 0.86%(+1.12)#18 | 1.2%(+0.788)#3,551 |
| 19. | 84725 | 1.9% | 0.86%(+1.03)#19 | 1.2%(+0.703)#3,762 |
| 20. | 84025 | 1.9% | 0.86%(+1.02)#20 | 1.2%(+0.692)#3,787 |
| 21. | 84098 | 1.9% | 0.86%(+1.00)#21 | 1.2%(+0.676)#3,842 |
| 22. | 84004 | 1.8% | 0.86%(+0.916)#22 | 1.2%(+0.588)#4,077 |
| 23. | 84311 | 1.7% | 0.86%(+0.880)#23 | 1.2%(+0.552)#4,186 |
| 24. | 84662 | 1.7% | 0.86%(+0.866)#24 | 1.2%(+0.538)#4,246 |
| 25. | 84757 | 1.5% | 0.86%(+0.685)#25 | 1.2%(+0.357)#4,884 |
| 26. | 84121 | 1.5% | 0.86%(+0.682)#26 | 1.2%(+0.354)#4,894 |
| 27. | 84648 | 1.5% | 0.86%(+0.649)#27 | 1.2%(+0.321)#5,031 |
| 28. | 84054 | 1.5% | 0.86%(+0.633)#28 | 1.2%(+0.305)#5,093 |
| 29. | 84097 | 1.5% | 0.86%(+0.630)#29 | 1.2%(+0.302)#5,102 |
| 30. | 84328 | 1.5% | 0.86%(+0.625)#30 | 1.2%(+0.297)#5,122 |
| 31. | 84738 | 1.5% | 0.86%(+0.612)#31 | 1.2%(+0.284)#5,182 |
| 32. | 84045 | 1.5% | 0.86%(+0.599)#32 | 1.2%(+0.271)#5,234 |
| 33. | 84056 | 1.4% | 0.86%(+0.545)#33 | 1.2%(+0.217)#5,472 |
| 34. | 84338 | 1.3% | 0.86%(+0.478)#34 | 1.2%(+0.150)#5,771 |
| 35. | 84010 | 1.3% | 0.86%(+0.475)#35 | 1.2%(+0.147)#5,783 |
| 36. | 84096 | 1.3% | 0.86%(+0.471)#36 | 1.2%(+0.143)#5,804 |
| 37. | 84003 | 1.3% | 0.86%(+0.468)#37 | 1.2%(+0.140)#5,816 |
| 38. | 84105 | 1.3% | 0.86%(+0.451)#38 | 1.2%(+0.122)#5,908 |
| 39. | 84101 | 1.3% | 0.86%(+0.425)#39 | 1.2%(+0.097)#6,037 |
| 40. | 84106 | 1.3% | 0.86%(+0.419)#40 | 1.2%(+0.091)#6,070 |
| 41. | 84332 | 1.3% | 0.86%(+0.418)#41 | 1.2%(+0.089)#6,085 |
| 42. | 84310 | 1.3% | 0.86%(+0.405)#42 | 1.2%(+0.077)#6,148 |
| 43. | 84087 | 1.3% | 0.86%(+0.401)#43 | 1.2%(+0.073)#6,165 |
| 44. | 84123 | 1.2% | 0.86%(+0.391)#44 | 1.2%(+0.063)#6,230 |
| 45. | 84040 | 1.2% | 0.86%(+0.384)#45 | 1.2%(+0.056)#6,267 |
| 46. | 84043 | 1.2% | 0.86%(+0.358)#46 | 1.2%(+0.030)#6,405 |
| 47. | 84075 | 1.2% | 0.86%(+0.349)#47 | 1.2%(+0.021)#6,457 |
| 48. | 84639 | 1.2% | 0.86%(+0.342)#48 | 1.2%(+0.014)#6,513 |
| 49. | 84060 | 1.2% | 0.86%(+0.340)#49 | 1.2%(+0.012)#6,523 |
| 50. | 84020 | 1.2% | 0.86%(+0.333)#50 | 1.2%(+0.004)#6,579 |
| 51. | 84014 | 1.2% | 0.86%(+0.313)#51 | 1.2%(-0.015)#6,714 |
| 52. | 84117 | 1.2% | 0.86%(+0.297)#52 | 1.2%(-0.031)#6,805 |
| 53. | 84074 | 1.1% | 0.86%(+0.265)#53 | 1.2%(-0.063)#7,015 |
| 54. | 84065 | 1.1% | 0.86%(+0.259)#54 | 1.2%(-0.069)#7,056 |
| 55. | 84049 | 1.1% | 0.86%(+0.253)#55 | 1.2%(-0.075)#7,107 |
| 56. | 84046 | 1.1% | 0.86%(+0.231)#56 | 1.2%(-0.097)#7,260 |
| 57. | 84765 | 1.1% | 0.86%(+0.219)#57 | 1.2%(-0.109)#7,343 |
| 58. | 84047 | 1.0% | 0.86%(+0.169)#58 | 1.2%(-0.159)#7,658 |
| 59. | 84095 | 0.97% | 0.86%(+0.112)#59 | 1.2%(-0.217)#8,060 |
| 60. | 84403 | 0.96% | 0.86%(+0.106)#60 | 1.2%(-0.222)#8,115 |
| 61. | 84511 | 0.96% | 0.86%(+0.101)#61 | 1.2%(-0.227)#8,147 |
| 62. | 84057 | 0.93% | 0.86%(+0.075)#62 | 1.2%(-0.253)#8,343 |
| 63. | 84790 | 0.91% | 0.86%(+0.054)#63 | 1.2%(-0.274)#8,512 |
| 64. | 84062 | 0.90% | 0.86%(+0.044)#64 | 1.2%(-0.284)#8,600 |
| 65. | 84094 | 0.88% | 0.86%(+0.027)#65 | 1.2%(-0.301)#8,760 |
| 66. | 84405 | 0.85% | 0.86%(-0.003)#66 | 1.2%(-0.331)#8,989 |
| 67. | 84620 | 0.85% | 0.86%(-0.005)#67 | 1.2%(-0.333)#9,012 |
| 68. | 84634 | 0.84% | 0.86%(-0.020)#68 | 1.2%(-0.348)#9,139 |
| 69. | 84041 | 0.83% | 0.86%(-0.023)#69 | 1.2%(-0.351)#9,167 |
| 70. | 84720 | 0.81% | 0.86%(-0.046)#70 | 1.2%(-0.374)#9,359 |
| 71. | 84050 | 0.79% | 0.86%(-0.064)#71 | 1.2%(-0.392)#9,528 |
| 72. | 84501 | 0.78% | 0.86%(-0.071)#72 | 1.2%(-0.399)#9,601 |
| 73. | 84107 | 0.75% | 0.86%(-0.104)#73 | 1.2%(-0.432)#9,906 |
| 74. | 84042 | 0.74% | 0.86%(-0.117)#74 | 1.2%(-0.445)#10,017 |
| 75. | 84779 | 0.72% | 0.86%(-0.131)#75 | 1.2%(-0.459)#10,157 |
| 76. | 84604 | 0.72% | 0.86%(-0.141)#76 | 1.2%(-0.469)#10,261 |
| 77. | 84058 | 0.72% | 0.86%(-0.141)#77 | 1.2%(-0.469)#10,264 |
| 78. | 84542 | 0.71% | 0.86%(-0.145)#78 | 1.2%(-0.473)#10,306 |
| 79. | 84653 | 0.68% | 0.86%(-0.178)#79 | 1.2%(-0.506)#10,633 |
| 80. | 84032 | 0.67% | 0.86%(-0.182)#80 | 1.2%(-0.510)#10,684 |
| 81. | 84070 | 0.67% | 0.86%(-0.189)#81 | 1.2%(-0.517)#10,756 |
| 82. | 84029 | 0.63% | 0.86%(-0.223)#82 | 1.2%(-0.552)#11,105 |
| 83. | 84601 | 0.63% | 0.86%(-0.231)#83 | 1.2%(-0.559)#11,193 |
| 84. | 84059 | 0.62% | 0.86%(-0.236)#84 | 1.2%(-0.564)#11,253 |
| 85. | 84335 | 0.61% | 0.86%(-0.250)#85 | 1.2%(-0.578)#11,398 |
| 86. | 84315 | 0.58% | 0.86%(-0.272)#86 | 1.2%(-0.600)#11,638 |
| 87. | 84401 | 0.55% | 0.86%(-0.310)#87 | 1.2%(-0.638)#12,104 |
| 88. | 84319 | 0.54% | 0.86%(-0.311)#88 | 1.2%(-0.639)#12,112 |
| 89. | 84737 | 0.54% | 0.86%(-0.314)#89 | 1.2%(-0.642)#12,144 |
| 90. | 84084 | 0.53% | 0.86%(-0.324)#90 | 1.2%(-0.652)#12,240 |
| 91. | 84009 | 0.53% | 0.86%(-0.324)#91 | 1.2%(-0.653)#12,252 |
| 92. | 84341 | 0.52% | 0.86%(-0.331)#92 | 1.2%(-0.659)#12,318 |
| 93. | 84116 | 0.52% | 0.86%(-0.336)#93 | 1.2%(-0.664)#12,379 |
| 94. | 84337 | 0.52% | 0.86%(-0.337)#94 | 1.2%(-0.665)#12,388 |
| 95. | 84309 | 0.52% | 0.86%(-0.340)#95 | 1.2%(-0.668)#12,425 |
| 96. | 84128 | 0.51% | 0.86%(-0.341)#96 | 1.2%(-0.669)#12,435 |
| 97. | 84664 | 0.50% | 0.86%(-0.354)#97 | 1.2%(-0.682)#12,610 |
| 98. | 84005 | 0.50% | 0.86%(-0.360)#98 | 1.2%(-0.688)#12,691 |
| 99. | 84770 | 0.45% | 0.86%(-0.410)#99 | 1.2%(-0.738)#13,294 |
| 100. | 84721 | 0.44% | 0.86%(-0.411)#100 | 1.2%(-0.739)#13,305 |
Common Questions
What are the Top 10 Zip Codes with the Highest Percentage of Population Employed in Legal Services & Support in Utah?
Top 10 Zip Codes with the Highest Percentage of Population Employed in Legal Services & Support in Utah are:
What zip code has the Highest Percentage of Population Employed in Legal Services & Support in Utah?
84750 has the Highest Percentage of Population Employed in Legal Services & Support in Utah with 4.6%.
What is the Percentage of Population Employed in Legal Services & Support in the State of Utah?
Percentage of Population Employed in Legal Services & Support in Utah is 0.86%.
What is the Percentage of Population Employed in Legal Services & Support in the United States?
Percentage of Population Employed in Legal Services & Support in the United States is 1.2%.