Zip Codes with the Highest Percentage of Population Employed in Legal Services & Support in Cedar City, UT
RELATED REPORTS & OPTIONS
Legal Services & Support
Cedar City
Compare Zip Codes
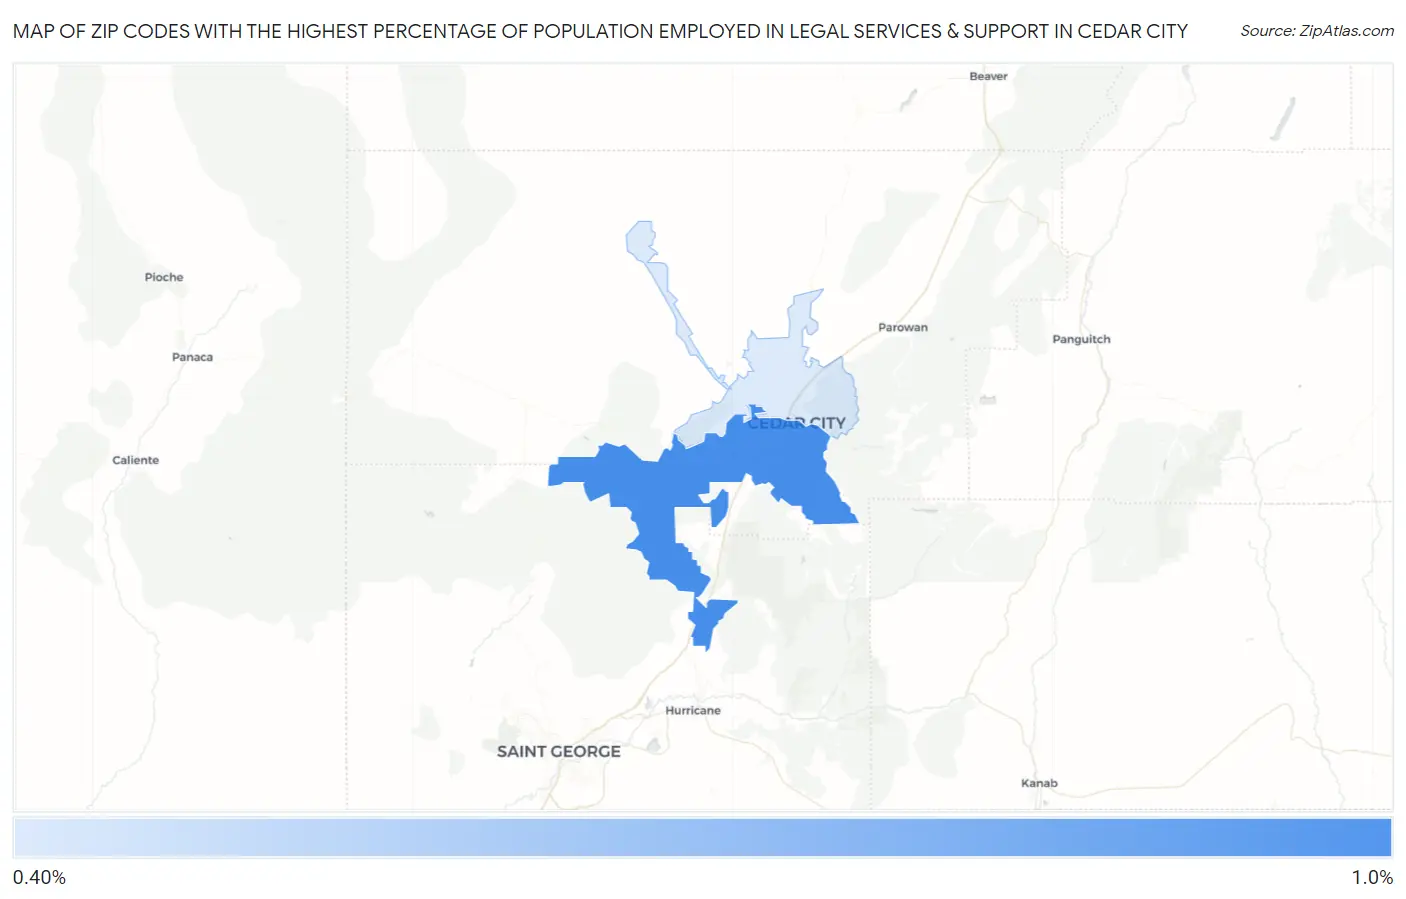
Map of Zip Codes with the Highest Percentage of Population Employed in Legal Services & Support in Cedar City
0.44%
0.81%
Zip Codes with the Highest Percentage of Population Employed in Legal Services & Support in Cedar City, UT
| Zip Code | % Employed | vs State | vs National | |
| 1. | 84720 | 0.81% | 0.86%(-0.046)#70 | 1.2%(-0.374)#9,359 |
| 2. | 84721 | 0.44% | 0.86%(-0.411)#100 | 1.2%(-0.739)#13,305 |
1
Common Questions
What are the Top Zip Codes with the Highest Percentage of Population Employed in Legal Services & Support in Cedar City, UT?
Top Zip Codes with the Highest Percentage of Population Employed in Legal Services & Support in Cedar City, UT are:
What zip code has the Highest Percentage of Population Employed in Legal Services & Support in Cedar City, UT?
84720 has the Highest Percentage of Population Employed in Legal Services & Support in Cedar City, UT with 0.81%.
What is the Percentage of Population Employed in Legal Services & Support in Cedar City, UT?
Percentage of Population Employed in Legal Services & Support in Cedar City is 0.65%.
What is the Percentage of Population Employed in Legal Services & Support in Utah?
Percentage of Population Employed in Legal Services & Support in Utah is 0.86%.
What is the Percentage of Population Employed in Legal Services & Support in the United States?
Percentage of Population Employed in Legal Services & Support in the United States is 1.2%.